1. Introduction
With the vigorous growth of network and information technology represented by the Internet, human society has entered a new and complex era of networks. Information mining in complex networks is important in theoretical research and offers great application and socioeconomic values [
1,
2,
3,
4]. For example, if users can unearth important nodes or edges in the spread network of a virus, then they can curb the spread of the virus in a short time by isolating or cutting off the important nodes or edges in the virus network at the beginning of the virus spread and thereby eliminate unnecessary economic losses [
5]. Efficient information mining in complex networks has naturally become a key topic that continues to attract the attention of many scholars.
The existing studies on complex network information mining are generally ranked on the basis of the importance of all nodes and edges in the network [
6,
7,
8,
9,
10]. However, determining which nodes are the most important in the network relative to one or one group of specific nodes presents an issue. This problem reminds us about the practical significance of mining relatively important information in networks, especially very large-scale ones.
The relative importance of nodes refers to the importance of nodes relative to known important nodes. It is also called proximity or similarity [
11]. According to the key idea of relative importance, information mining in a complex network can be described as a process in which the importance of a node in a network relative to a known important node is quantified and the importance of a node relative to a known important node set is calculated to identify the relatively important nodes in the network.
The central idea of relative importance can be widely used in many fields. For example, potential criminals can be found using known criminal data in the field of criminal networks, and terrorists in hiding can be captured on the basis of known terrorist data [
12,
13]. In the bionetwork field, people susceptible to diseases can be identified for timely treatment and isolation on the basis of relevant information on populations infected with known infectious diseases. Unknown pathogenic genes may be determined according to known pathogenic gene information in protein networks [
14]. In the field of power grids, on the premise that the information on important power generation units or circuit breakers is known, finding relatively important power generation units, circuit breakers, etc. is prioritized for protection, in order to effectively avoid large-area power outages caused by successive faults. Mining relatively important nodes in complex networks obviously offers great research significance and application value [
15].
The node distance distribution in a complex network quantifies many types of topological information in the network, including the degree of nodes, average degree of the network, diameter of the network, closeness centrality of nodes, and average path length of the network [
16]. Therefore, the study on the relative importance of nodes in a network based on node distance distribution in the network will contribute to the accurate mining of relatively important nodes in networks. In the current study, the distance distribution of all nodes in a network is calculated. On the basis of known important node information, the differences in distance distribution between known important nodes and target nodes are measured from three dimensions, namely, direction, distance, and distribution. A relatively important node mining method based on distance distribution and multi-index fusion (DDMF) is proposed.
The DDMF method involves two main steps: First, the distance distribution of all nodes (including known important nodes and target nodes) is calculated on the basis of the shortest distance between nodes in the network. Then, the calculated results are converted into vector form. Second, multi-index fusion is made for cosine similarity, Euclidean distance, and relative entropy. The weights corresponding to different indexes are calculated using the entropy weight method to obtain the relative importance scores of the nodes. The nodes with high scores are regarded as a relatively important nodes in the network.
Our key contribution is in proposing a novel method based on network topology to find relatively important nodes in the network. The DDMF method not only fills the gap of relatively important node algorithms in the scientific field of complex network theory, but also provides a new idea for community detection and link prediction. Since the network in real life exists in different kinds of fields, we also conduct some experiments on different types of real network datasets to verify whether the method has practical application value in real life. Experiments demonstrate that DDMF method outperforms other relatively important node mining algorithms in terms of precision and applicability.
The remainder of this paper is organized as follows. In
Section 2, works related to the proposed method are given.
Section 3 deals with detailed descriptions of the proposed algorithm. The experimental results and analysis are presented in
Section 4. Finally, we summarize in
Section 5.
2. Related Work
At present, many researchers in the field of complex networks focus on the mining of important nodes in networks; that is, ranking the importance of all nodes in a network as a whole. Existing research has primarily aimed to develop an identification algorithm for influential nodes. Inspired by the heuristic scheme, Wang et al. [
17] proposed the price-performance-ratio PPRank method, selecting nodes in a given range and aiming to improve the performance of the diffusion. Yang et al. [
18] proposed a method of ranking node importance based on multi-criteria decision-making (MCDM). The weight of each criterion is calculated by an entropy weighting method, which overcomes the impact of the subjective factor. Li et al. [
19] proposed a method of calculating the importance degree of urban rail transit network nodes based on h-index, which considers the topology, passenger volume, and passenger flow correlation of the urban rail network. Luo et al. [
20] proposed a relationship matrix resolving model to identify vital nodes based on community (IVNC), as an attempt to identify influential nodes in OSNs.
However, the study on node mining based on relative importance remains limited. The earliest study on relative importance in networks is that on a personalized variant HITS algorithm [
21]. Haveliwala [
22] and Jennifier et al. [
23] later proposed their own variant PageRank algorithms, which consider the relative importance of nodes in a network. Alzaabi et al. [
24] defined the universal framework of mining algorithms for relatively important nodes and proposed that the relative importance of nodes in a network relates to one node set or one group of specified node sets. Wang et al. [
25] proposed a path probabilistic summation method, which defines the importance of any node relative to the nearest neighbor node as the probability of jumping from the node to the nearest neighbor node in the random walk process. Rodriguez et al. [
26] proposed a cluster particle propagation method, which is used to evaluate the relative importance of nodes. Magalingam et al. [
27] used shortest distance as a measurement indicator of relative importance. Langohr et al. [
28] used the reciprocal of the
P norm of the shortest distance as a measurement indicator of relative importance. In addition, some researchers have considered mining deep network information by using network embedded learning methods [
29,
30,
31,
32,
33,
34,
35]. For example, some classical network-embedded learning algorithms have been used to mine relatively important nodes in networks.
Although some algorithms have been employed to mine relatively important nodes in networks, they suffer from problems that require immediate resolution, such as low accuracy and narrow use range. Therefore, novel and efficient methods for mining relatively important nodes need to be developed.
In the study of complex networks, the most classic and most widely used relative importance calculation indicators include the Ksmar index [
11], PPR index [
21], and Katz index [
36]. Zhao et al. [
37] proposed a relatively important node mining algorithm based on neighbor layer diffuse (NLD) in 2021, which is the latest relatively important node algorithm. In
Section 4, we empirically compare our method with these methods using various real world networks.
3. Relative Importance Measure Based on Distance Distribution and Multi-index Fusion
To fully measure the impact of network structure information on the relative importance of nodes, this study proposes a relatively important node mining method based on distance distribution and multi-index fusion, i.e., the DDMF method. In this section, we first introduce the problem definition in complex networks and use a specific example to explain what is the distance distribution. Then three indicators of cosine similarity, Euclidean distance, and relative entropy are described in detail. Finally, we discuss how to calculate the relative importance score of a node based on multi-index fusion.
3.1. Problem Definition
Under normal conditions, a complex network can be represented by . Here, refers to the node in the network and refers to the edge of the network . The network comprises nodes. Among them, nodes can be divided into important node set and unimportant node set . The important node set has nodes, while the unimportant node set has nodes. The important node set includes known important node set and unknown important node set . The unimportant node set and unknown important node set constitute target node set , i.e., .
The key to finding the relatively important nodes in the target node set is to first calculate the importance of a node in the target node set relative to a known important node, and then calculate the importance of a node relative to all nodes in the known important node set .
The main contents of this work include the following: For the information of known important node set , the importance of any node in the target node set relative to the node in the known important node set is analyzed and calculated. The expectation is to find relatively important nodes in the target node set . The final results are analyzed and evaluated on the basis of three evaluation indicators, namely, precision, recall, and area under the curve (AUC).
3.2. Distance Distribution
Distance distribution in complex networks is usually represented by the shortest path distribution between nodes. The node distance distribution in the network mainly considers the number of nodes with different shortest path lengths to the current node; thus, it can intuitively obtain the shortest path information of nodes in the network and reflect many important topological information in the network [
38].
The distance distribution of each node
in the complex network can be represented as
; the calculation formula of
is
where
represents the shortest path length with a value in the range of
.
refers to the diameter of the network
, and its value is the maximum distance between any two nodes in the network
.
represents the number of nodes with
of the shortest path length to node
in the network
;
represents the number of nodes in the network
.
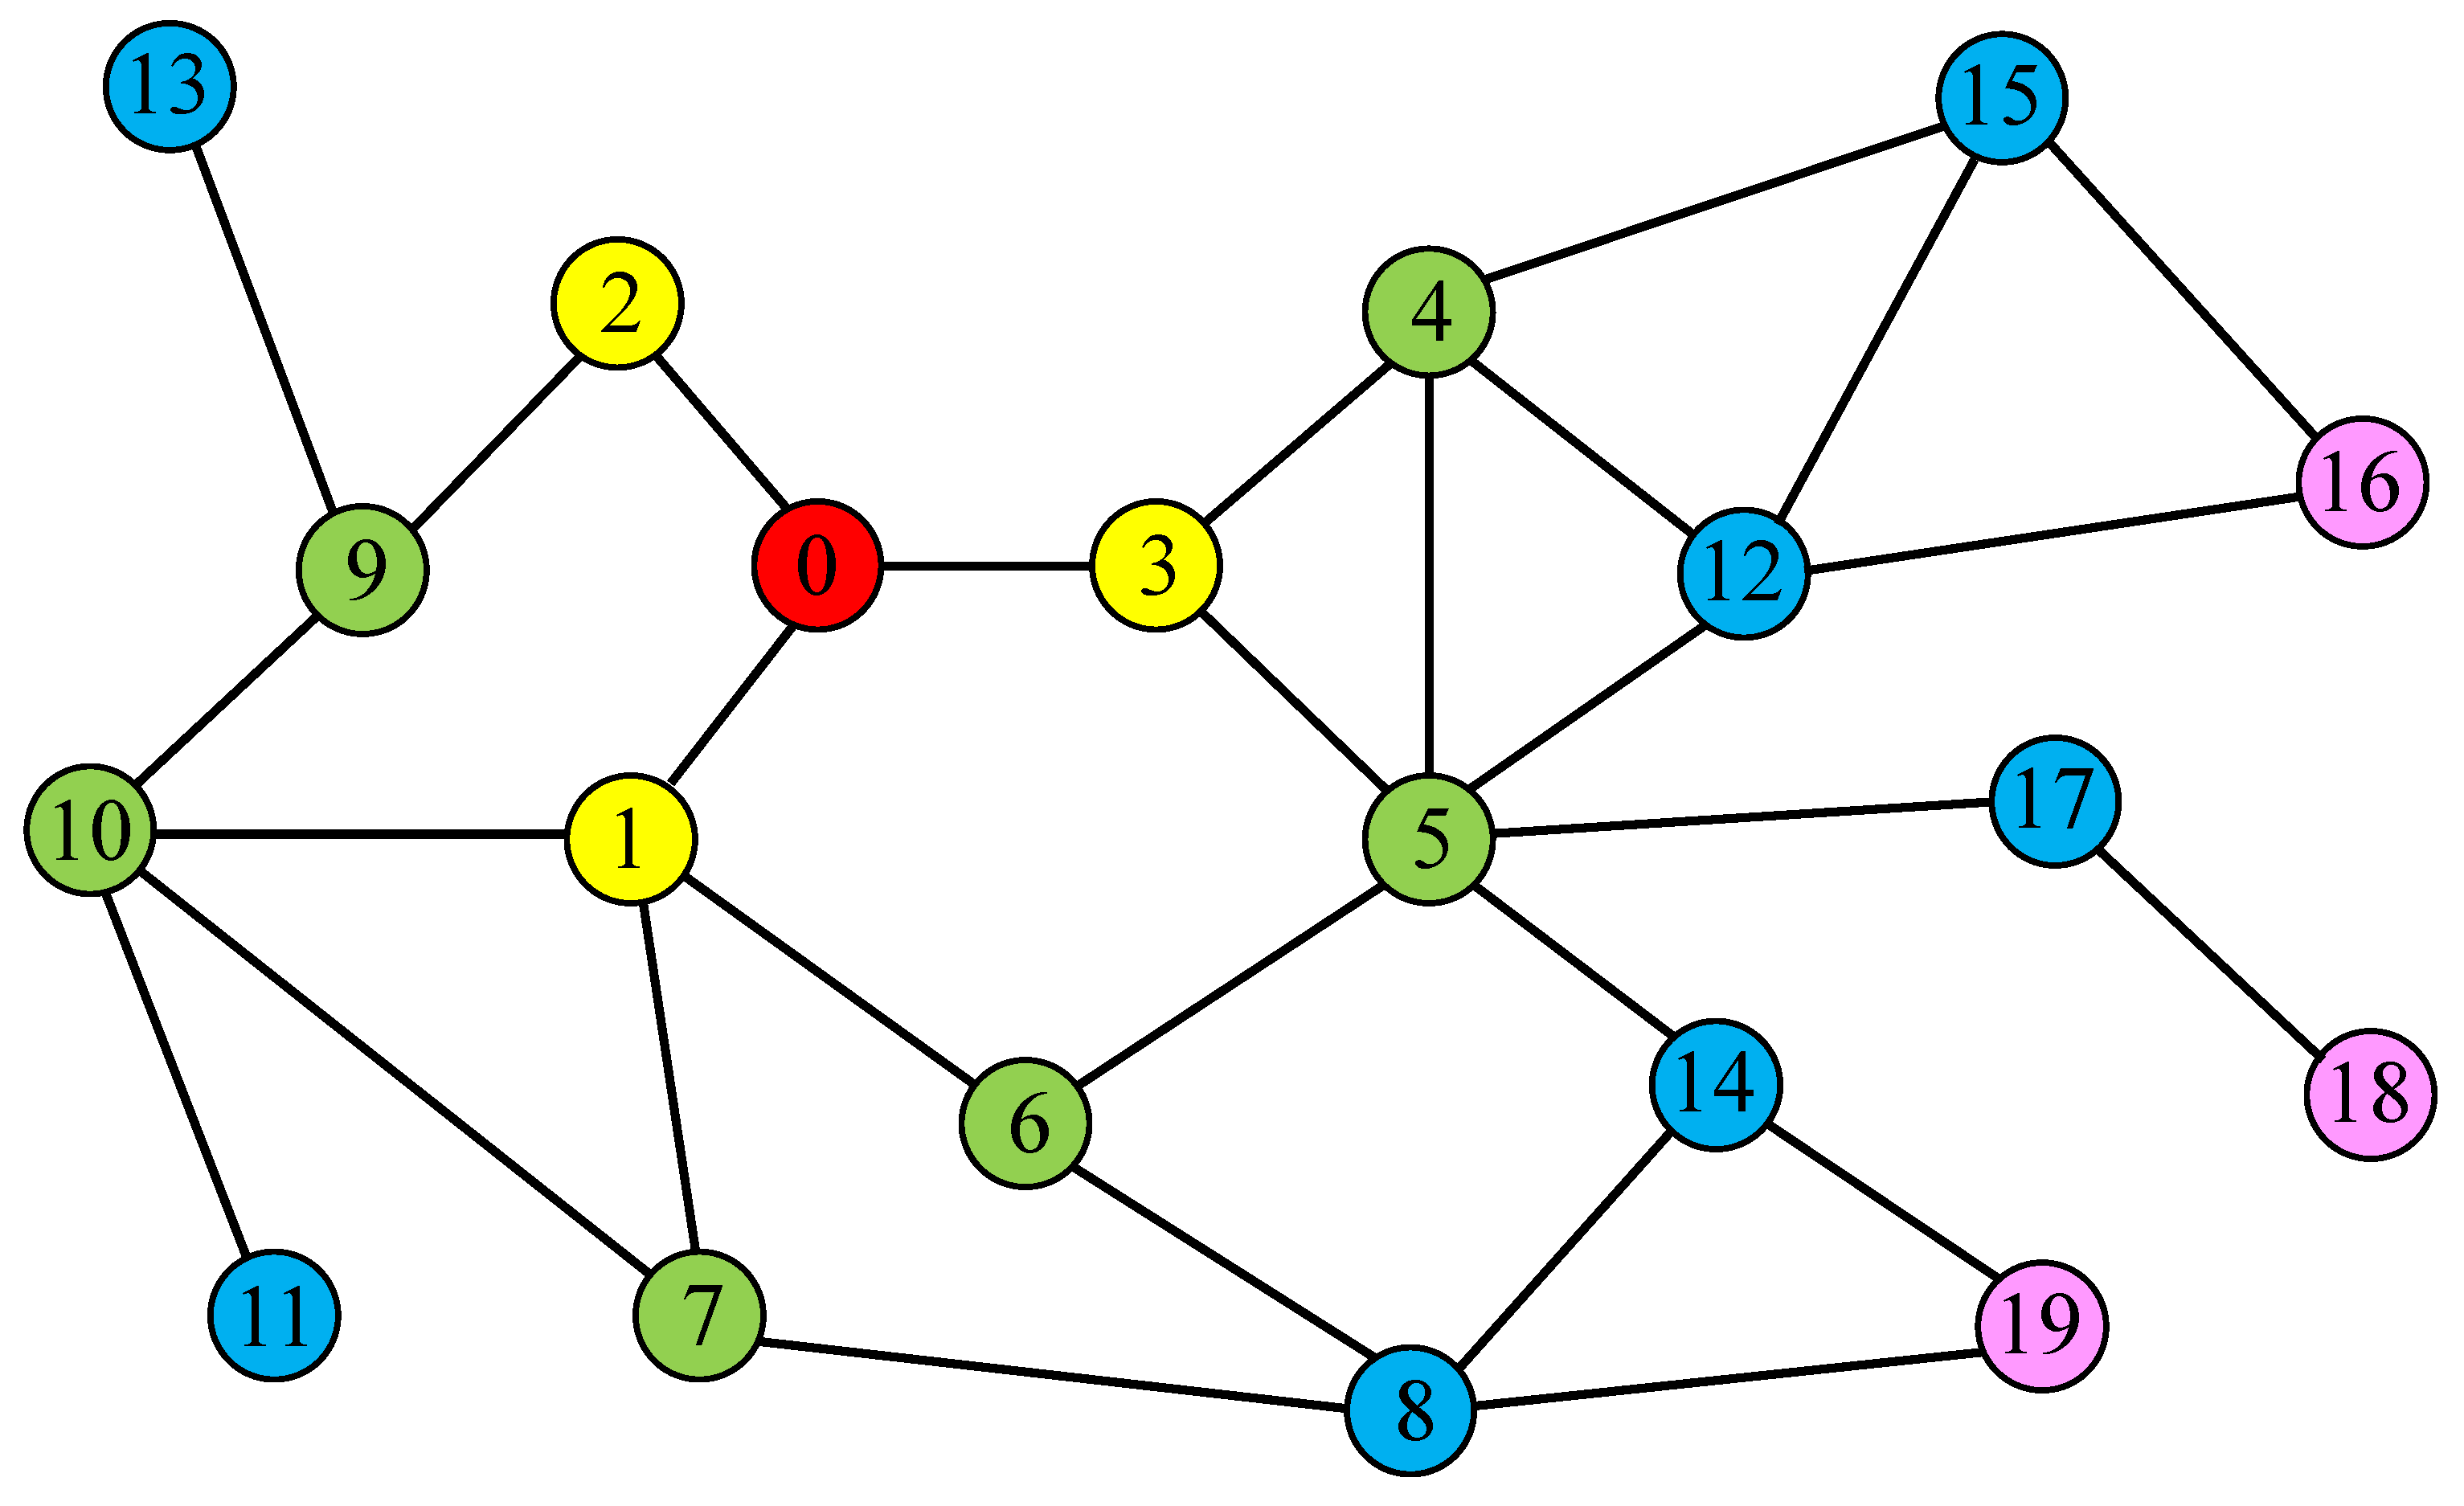
Take a network
as an example. The detailed calculation process of node distance distribution in
is introduced as follows. In
Figure 1, the red nodes are the nodes in the current study while the yellow, light green, blue, and pink nodes represent the nodes that can be reached by taking one, two, three, and four steps consecutively, starting from the nodes studied currently.
The number of nodes in the sample network is 20, and the diameter is 7. The distance distribution dimension mainly depends on the diameter of the network. Its value range is from 0 to , with a total of cases. Therefore, the distance distribution dimension of each node in is 8. Provided that node 0 is used as the starting research node, the set of nodes that can be reached by node 0 in turn can be obtained by calculating the shortest path length between this node and other nodes in , that is, according to Formula (1) and obtained through the above analysis, the distance distribution of node 0 can be obtained as: .
Similarly, the distance distribution of any node in the sample network can be obtained. For a network with nodes, if the distance distribution of nodes is known , then much important topology information in the network can be obtained on the basis of the distance distribution of nodes. For example, the degree of any node in , the average degree of , the average path length of , and the closeness centrality corresponding to node .
For the network with nodes, a distance distribution matrix is established on the basis of the distance distribution information of all nodes in ; refers to the total number of nodes in the network .
- (1)
Degree ki of node vi
- (2)
Average degree of network G
- (3)
Average path length APL of network G
- (4)
Closeness centrality CCi of node vi
The analysis indicates that the distance distribution of nodes contains abundant network topology information. Therefore, taking the distance distribution of each node in the network as the main subject investigated and converting it into vector form, the difference in the distance distribution between nodes in the known important node set and the target node set is analyzed to find the relatively important nodes in the network .
3.3. Introduction to Indicators
Cosine similarity is a measurement method for the difference between two individuals and involves calculating the cosine value of the angle between two vectors in the vector space, mainly focusing on the measurement of the difference between two individuals from the dimension of direction. The basic idea is to covert the individual’s index data into the vector space and then measure the difference between individuals by comparing the cosine values of the angle in the inner product space between different individual vectors [
39].
In a
M-dimensional space, assuming that
and
are
M-dimensional vectors, namely
,
, then the cosine similarity
can be expressed as:
where the value range of
is [–1, 1], that is,
.
In this work, the distance distribution of nodes in the network is converted into vector form; that is, in the network
with
nodes, the vectors of distance distribution of any node
and node
can be expressed as
and
, respectively. Then, the formula for the cosine similarity between nodes can be represented as:
Normalization is performed for the cosine similarity between nodes based on Equation (8), and is obtained. Among them, .
Euclidean distance, also called Euclidean metric, originates from the distance formula between two points in Euclidean geometry [
40]. It is mainly used to measure the real distance between two points in
M-dimension space; that is, focusing on the numerical difference between individuals.
In a
M-dimensional space, assuming that
and
are
M-dimensional vectors, namely
,
, then the Euclidean distance
can be expressed as:
Similarly, the distance distribution of nodes in the network
is first converted into vector form. Then, the Euclidean distance between any node
and node
can be represented as
:
Normalization is performed for Euclidean distance between node and node based on Equation (10), and is obtained. Among them, .
From information theory, relative entropy, also called KL divergence or information divergence, is generally used to measure the difference between two probability distributions [
41]. In this work, the difference in the distance distribution between different nodes in the network is calculated from the dimension of distribution to effectively find relatively important nodes in the network.
For the network
with
nodes, the distance distributions of node
and node
are
and
, respectively. Then, relative entropy can be defined as the difference in the distance distribution between the two nodes. The formula is as follows:
If relative entropy is small, then the difference in the distance distribution between node and node is small. The denominator of the logarithmic function cannot be 0. Therefore, in or , the values of are uniformly set to 0.
In addition, relative entropy is an asymmetric measure. Therefore, this study symmetrically converts the relative entropy between node distance distributions. The specific formula is as follows:
The relative entropy in asymmetric form is converted into symmetric form in Equation (12). On the basis of Equation (13), normalization processing is implemented for the relative entropy in symmetric form, then is obtained. Among them, .
This study aims to find relatively important nodes in the network by calculating the relative entropy of the distance distribution of nodes in the known important node set and target node set . If the relative entropy is small, then the difference in the distance distribution between different nodes is small. That is, the nodes with a smaller relative entropy in the target node set compared to the known important node set are more likely to be relatively important nodes in the network .
3.4. Relative Importance Score Based on Multi-index Fusion
To fully integrate the advantages of cosine similarity, Euclidean distance, and relative entropy in the direction, distance, and distribution dimensions, this study performs the multi-index fusion of cosine similarity, Euclidean distance, and relative entropy and calculates the weights of the different indexes by using the entropy weight method [
42] to maximize the advantages of the different indexes. The entropy weight method is an objective weighting method that is widely used and often depends on the discreteness of data. It mainly weighs different indexes according to the amount of information of different evaluation indexes.
Cosine similarity, Euclidean distance, and relative entropy are mainly considered in this work. Thus, weight allocation becomes necessary. A relative importance score matrix,
, is defined herein.
where
,
and
represent the arithmetic mean of cosine similarity, Euclidean distance and relative entropy between the
node in the target node set
and all nodes in the known important node set
respectively.
refers to the number of nodes in the target node set
,
refers to the number of nodes in the known important node set
, and
refers to the number of indexes,
.
Based on the relative importance score matrix, the entropy corresponding to cosine similarity, Euclidean distance, and relative entropy can be further calculated. The formulas are as follows:
where
represents the entropy of the index in the
column and
represents the proportion of the index in the
column of the
node in the target node set
in this column of indexes.
After the entropies of different indexes are obtained, the weight coefficient
of each index can be further calculated. The weights corresponding to different indicators determine the relative importance scores of the target nodes in the network. The specific formula is:
where
refers to information entropy redundancy. At the same time,
should meet the restrictive conditions of
,
.
Therefore, the relative importance score of
node in the target node set
can be expressed as:
Finally, the relative importance scores of all nodes in the target node set are sorted in descending order, and the nodes with high scores can be regarded as relatively important nodes.
The calculation of the relative importance scores of the nodes in a network by using the DDMF method consists of the following steps:
First, on the basis of the information of the shortest distance between nodes in the network , the distance distribution vectors of all nodes in the network are calculated, along with all the nodes of the known important node set and target node set .
Second, the differences in the distance distribution of the nodes between the known important node set and the target node set are determined. The cosine similarity, Euclidean distance, and relative entropy of the distance distribution of the two node sets are then calculated and normalized.
Finally, multi-index fusion is made for cosine similarity, Euclidean distance, and relative entropy, and the weights corresponding to different indexes are calculated using the entropy weight method. The relative importance scores of all the nodes in the target node set are further obtained. The nodes with high scores are regarded as relatively important nodes.
4. Experimental Results and Analysis
The data of four real networks are used to analyze and verify the accuracy of the DDMF method. The Node2vec algorithm [
43] is a network-embedded learning algorithm that cannot be directly used to calculate the relative importance scores of nodes. Therefore, the NMF index is obtained on the basis of the improvement of the Node2vec algorithm. The basic idea of the NMF index is as follows: first, the Node2vec algorithm is adopted to generate the embedded vector of the network. Second, the multi-index fusion is made for the obtained vectors so as to calculate the relative importance scores of the nodes. The multi-index fusion method of the NMF index is consistent with proposed DDMF method.
The comparative algorithms included the Ksmar index, PPR index, Katz index, NLD algorithm, and NMF index obtained on the basis of the Node2vec algorithm improvement.
4.1. Datasets
Experimental analysis is performed for the selected algorithms by using four classical real network datasets. The selected datasets are of different sizes and come from different network fields as much as possible, including virus networks, gene networks, and protein networks. The weight and direction of each network linking edge are ignored in this experiment.
(1) The international aviation network where the SARS virus spread [
44] comprises 224 nodes and 2247 edges. The nodes represent the countries where flights arrived while the edges represent the routes between two countries. The important node set of the network is defined as the countries where the SARS virus spread at the early stage.
(2) The Genepath human gene signaling network [
45] comprises 6306 nodes and 57,340 edges. Nodes represent genes while edges represent the relationship between nodes. The important node set of the network is defined as the Alzheimer’s disease gene.
(3) The mouse protein interaction network [
46] comprises 1187 nodes and 1557 edges. Nodes represent mouse proteins while edges represent the interaction between proteins. The important node set of the network is defined as mouse protein kinase.
(4) The yeast protein network [
47] comprises 5093 nodes and 24,743 edges. The nodes represent proteins while edges represent the relationship between proteins. The important node set of the network is defined as the important protein of the yeast network.
The basic topology characteristics of the four real networks used in this work are shown in
Table 1.
Here, refers to the number of nodes in the network, refers to the number of edges in the network, refers to the number of important nodes in the network, refers to the average degree of the network, and refers to the average clustering coefficient of the network.
4.2. Evaluation Indexes
Precision, recall, and AUC are the three evaluation indexes used to quantify the relatively important nodes obtained by several algorithms in this work.
Precision is mainly used to measure whether the
nodes in the results by the algorithm are predicted correctly. It is specifically defined as the proportion of correct predictions in
nodes among the predicted results. The formula is defined as:
where
refers to the frequency at which the
nodes predicted by the algorithm occurred in the unknown important node set
.
Recall is mainly used to measure how many of the
nodes predicted by the algorithm are correctly predicted. It is specifically defined as the proportion of the number of unknown important nodes
found in the
nodes in the prediction results relative to all nodes in the unknown important node set
. The formula is defined as:
AUC is mainly used to measure the precision of the algorithm as a whole. The formula is defined as:
The specific calculation process for AUC is as follows: one node is selected from the unknown important node set , and another is selected from the unimportant node set in each experiment, and the relative importance scores of the two nodes are compared. If the two nodes receive the same score, then the score is recorded as 0.5 point; if the relative importance score of the node selected from the unknown important node set is greater than that from the unimportant node set , then the score is recorded as 1 point. represents the number of all node combinations from the two sets and . After independent experiments, the final AUC value is the sum of the scores of experiments. Among them, the frequencies of getting 0.5 point and 1 point are and , respectively.
4.3. Experimental Analysis
The core goal of this work is to find relatively important nodes from the target node set . Therefore, the major subjects investigated from the four real networks selected, that is, all nodes of target node set , need to be determined. From the important node set , 10%, 20%, 30%, 40%, 50%, 60%, 70%, 80%, and 90% of the nodes are selected and used as known important nodes. The experiment in this paper treats the proportion of nodes equally; that is, the number of experiments corresponding to different proportion of nodes is the same. Different algorithms are used to find the relatively important nodes in the network. At the same time, precision, recall, and AUC values corresponding to different algorithms are calculated, and their values obtained from the experiments are averaged. Finally, the proposed DDMF method is used and compared with other comparative algorithms in terms of the three evaluation indexes.
The parameters of five other comparative algorithms are adjusted to be close to the optimal ones in the four networks. The specific values are as follows:
is taken from the Ksmar indexes,
is taken from the PPR indexes, and
is taken from the Katz indexes. In the NMF algorithm, random walk length
is valued as 10, embedded vector length
is set to 128, and hyperparameters
. In the NLD algorithm, the selection method of known important nodes
is the same as that of the DDMF method. The experimental results of the three evaluation indexes are shown in
Figure 2 and
Figure 3 and
Table 2.
In this study, different proportions of nodes are selected from the important node set
as the known important nodes
. The precision, recall, and AUC values are calculated by six relatively important node mining algorithms on the basis of experiments. The average value of 50 times in the experimental results is used as the final experimental result.
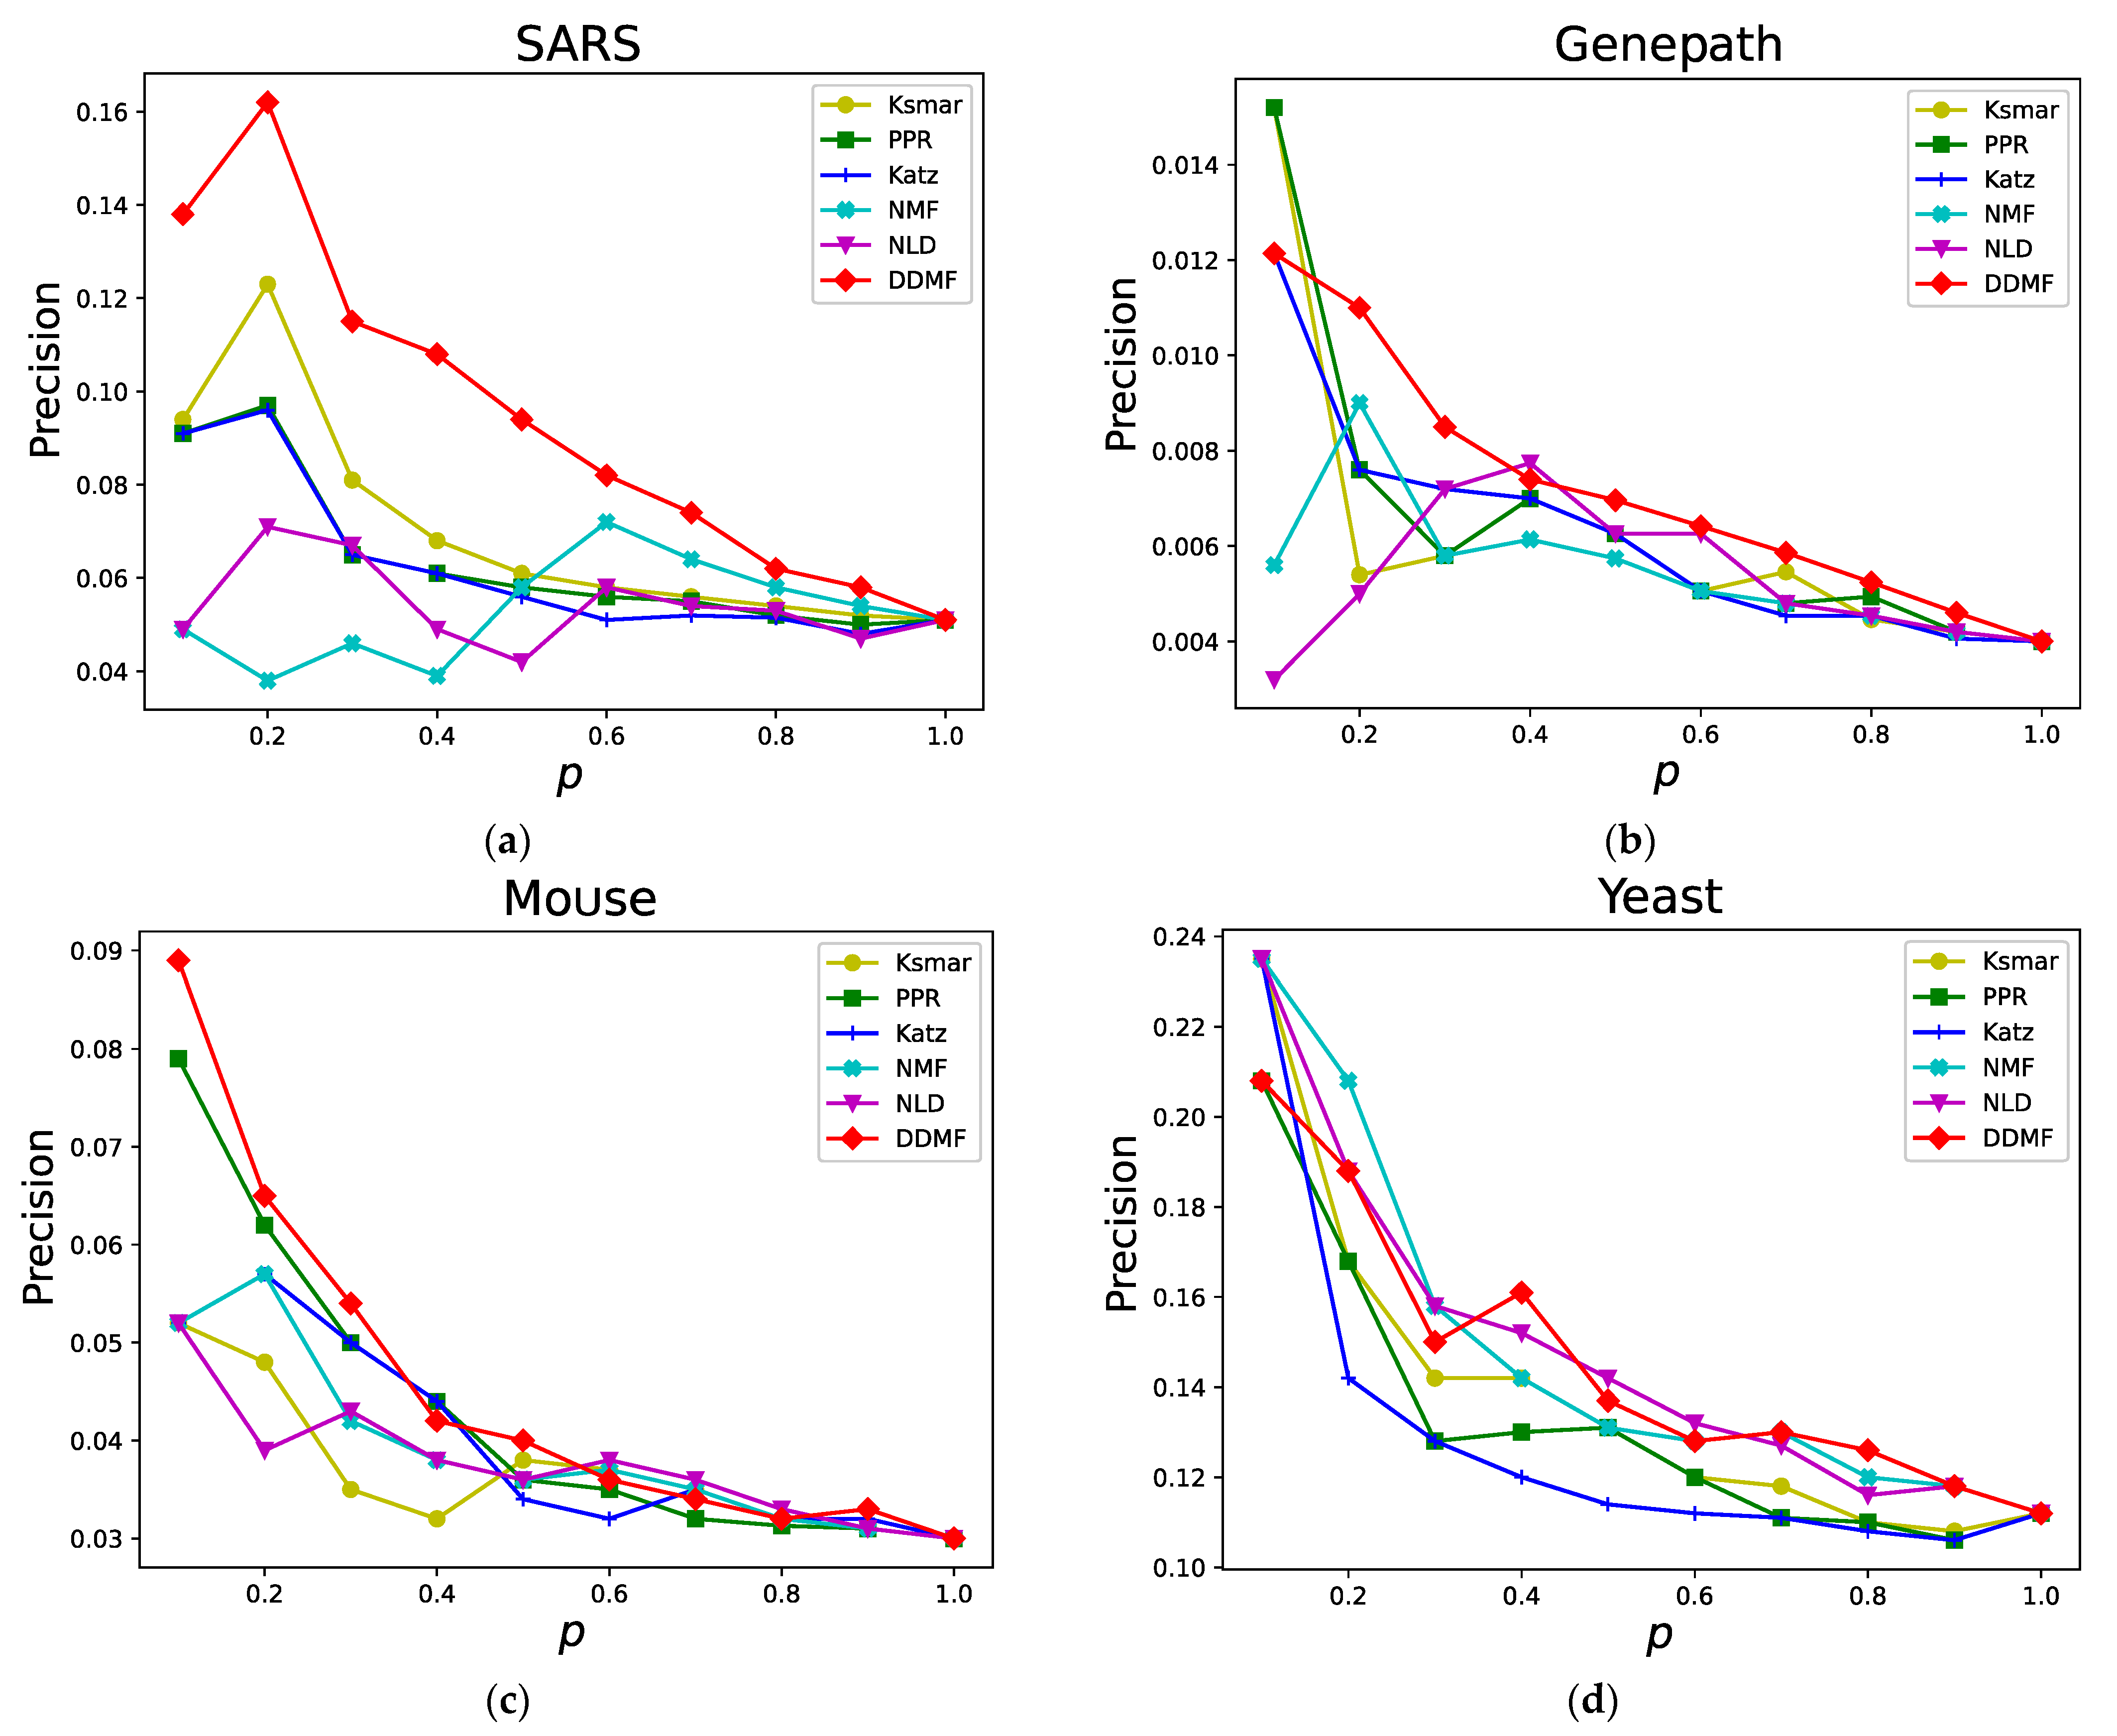
Figure 2 shows the precision values of six relative importance node mining methods in the four networks. The
axis represents the proportion of nodes in the target node set
while the
axis represents the precision of different node proportions.
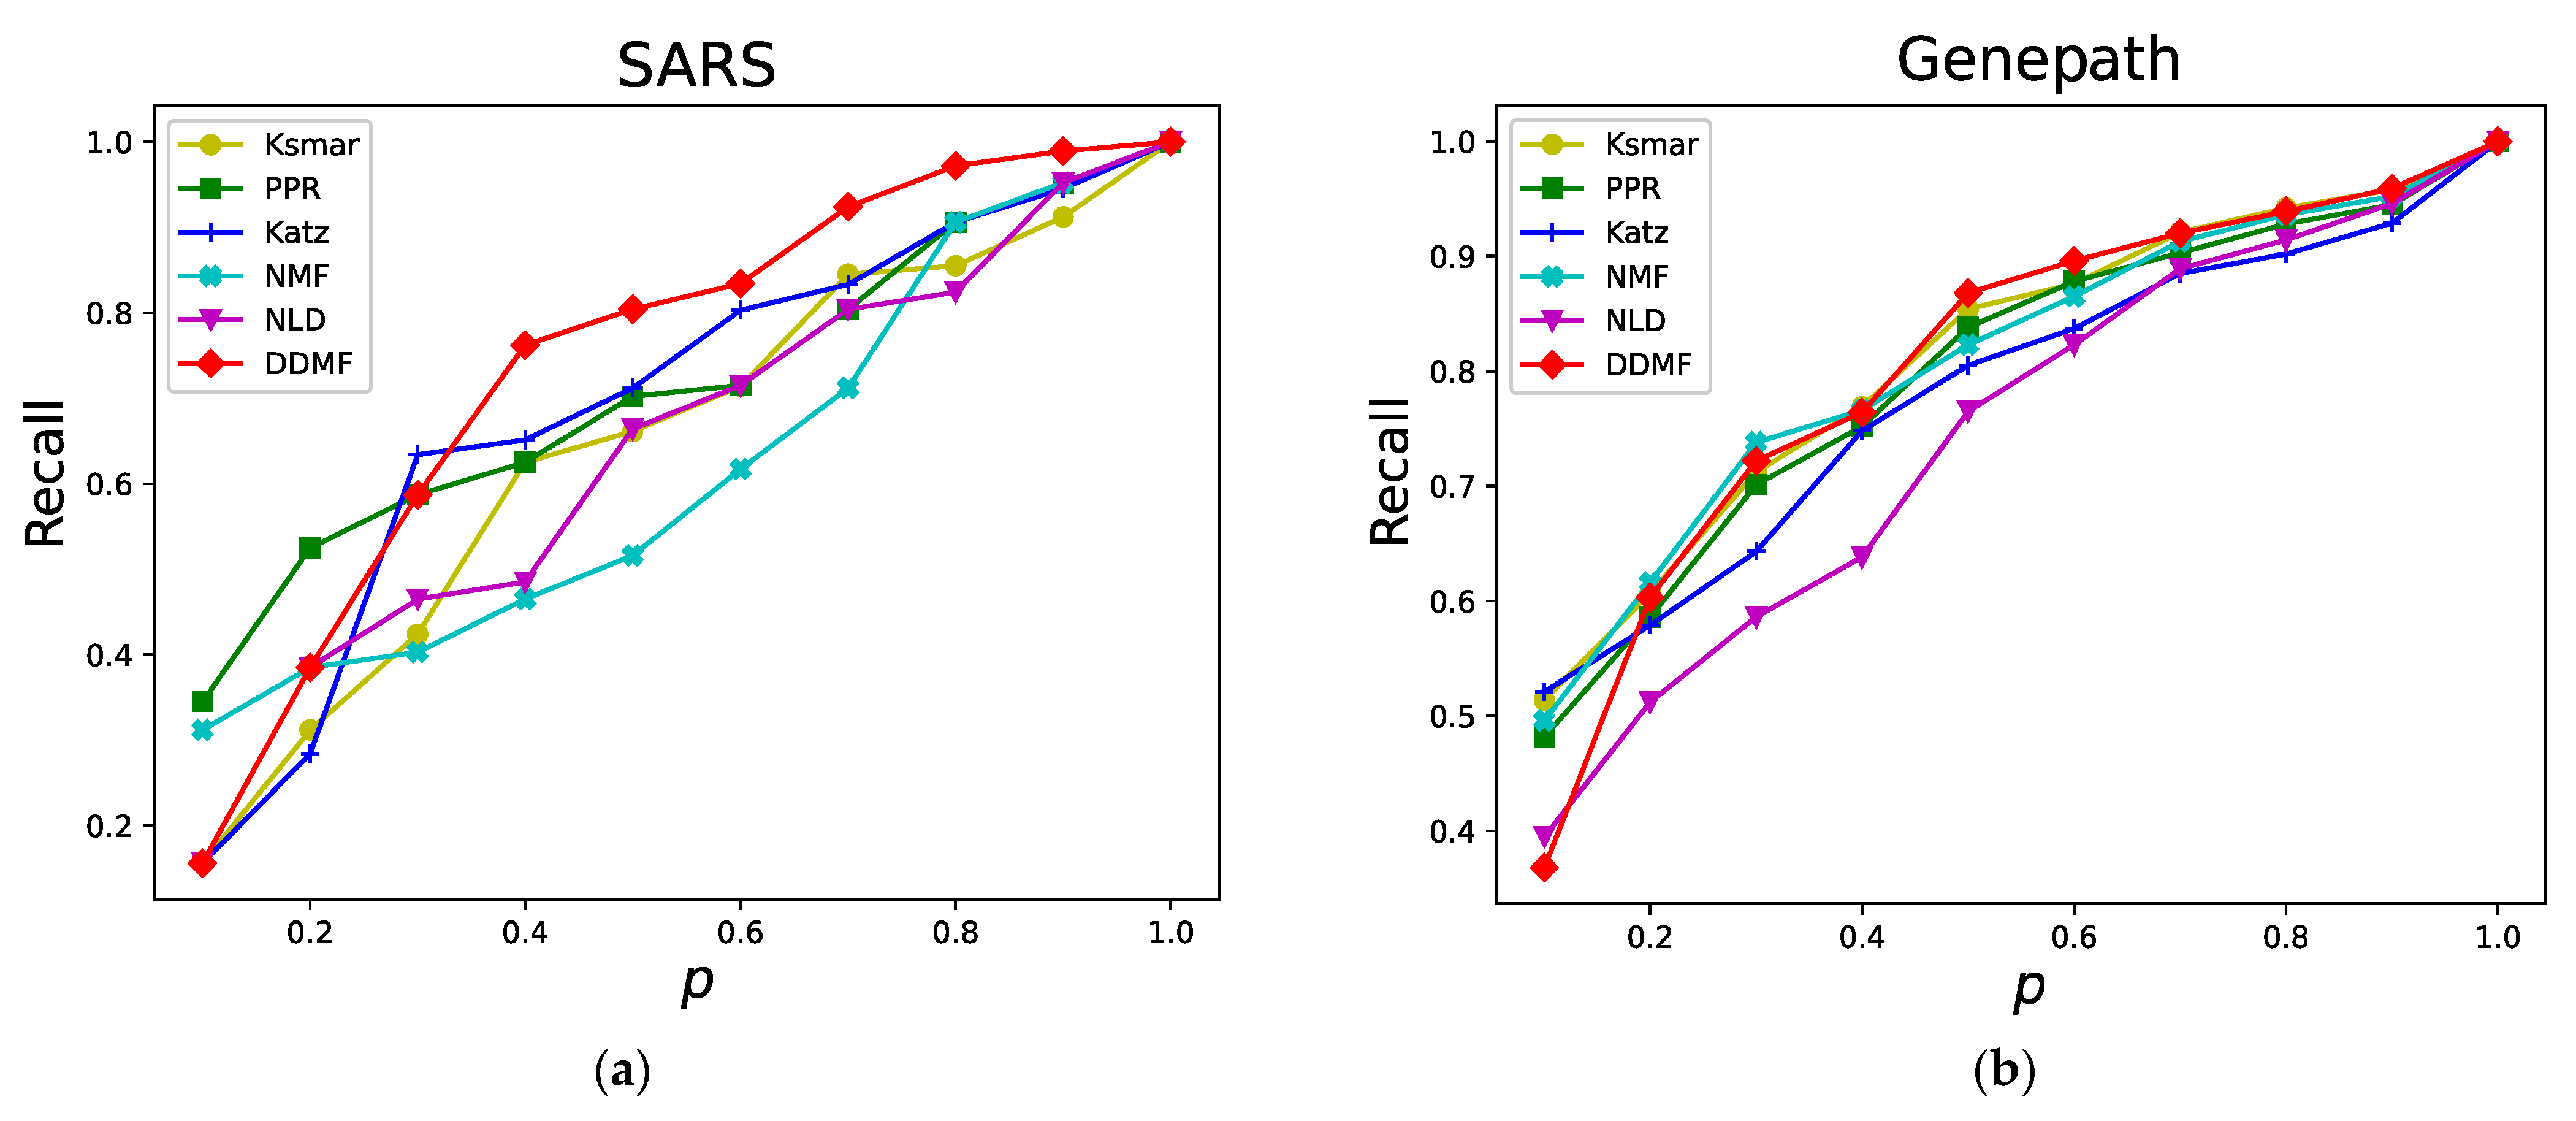
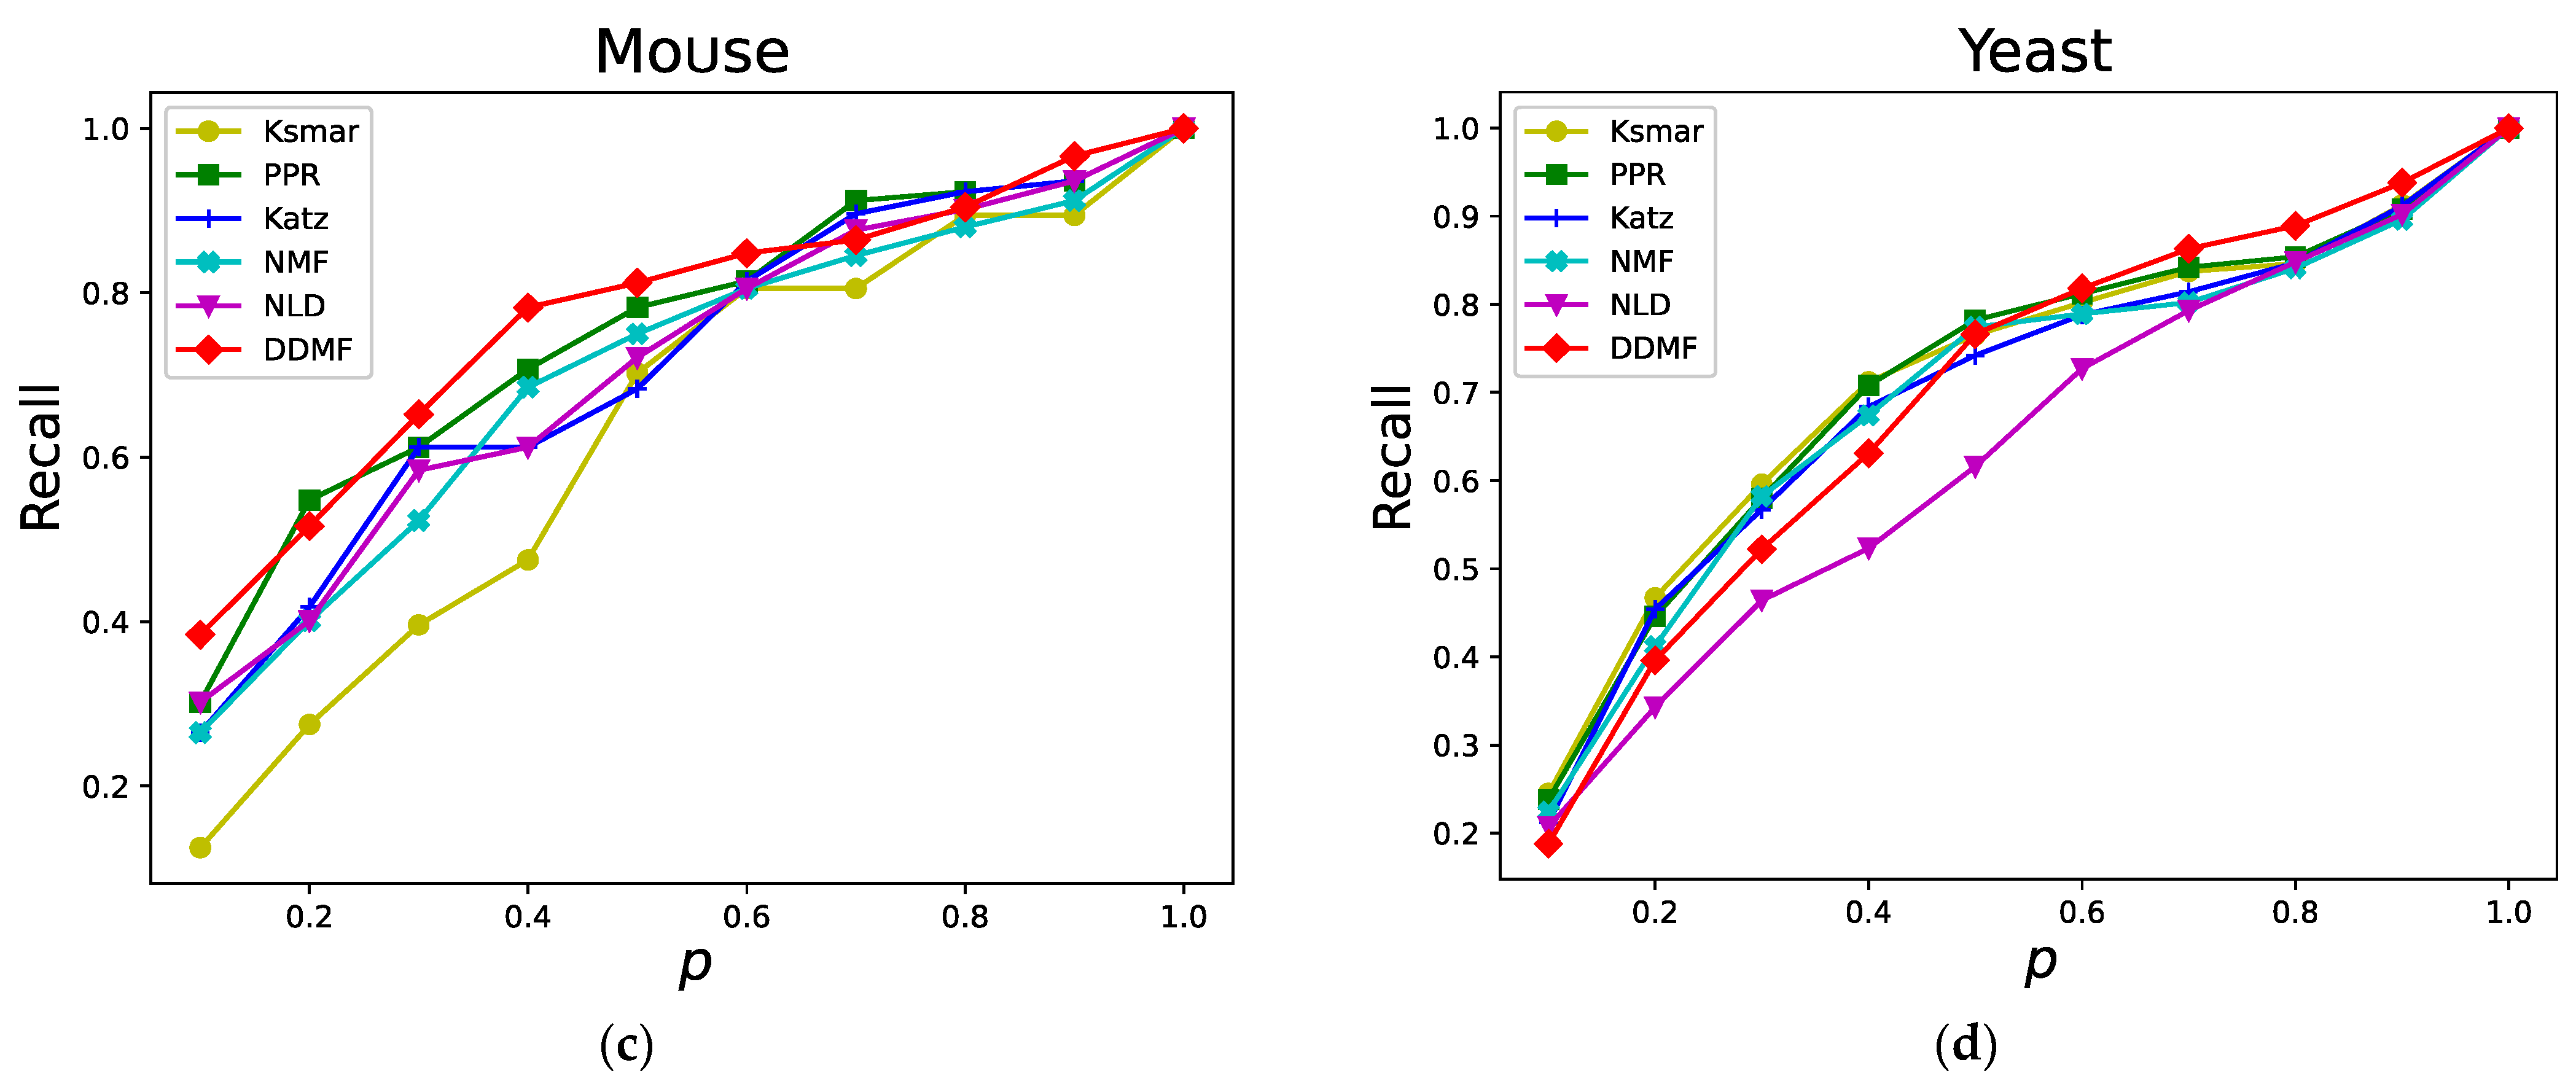
Figure 3 shows the recall rates of the six relative importance node mining algorithms in the four networks. The
axis represents the proportion of nodes in the target node set
while the
axis represents the recall rates of different node proportions.
Table 2 shows the AUC values obtained by the six relative importance node mining algorithms in the four networks.
The experimental results show that with the increase in the number of nodes in the target node set T, the precision of the algorithm decreases gradually while the recall rate increases gradually. In order to better simulate the actual situation of different real-world networks and to reduce accidental error, the important nodes of different batches are selected in different proportions from the important node set. Then the relatively important nodes corresponding to the important nodes of these different batches are calculated and mined. By calculating the arithmetic average of the relatively important nodes of different batches, the final relatively important nodes are obtained. In terms of precision, the proposed DDMF method is obviously better than the other five comparative algorithms in the SARS and Genepath networks, and all of them perform well in the mouse and yeast networks. In terms of recall, the DDMF method performs well in the SARS and mouse networks. Specifically, its recall, under multiple node proportions, is better than those of the comparative algorithms. The DDMF method ranks second for the Genepath and yeast networks. In terms of the AUC, the DDMF method outperforms the others in the SARS, Genepath, and mouse networks and ranks second in the yeast network. In sum, the proposed DDMF method performs well in terms of all the evaluation indexes in the SARS, Genepath, and mouse networks and comes in second place in the yeast network. Specifically, the proportion of the important nodes in the yeast network is relatively large. Therefore, some errors may occur in calculating the distance distribution of important nodes.
In general, the proposed DDMF method achieves excellent performance in real and complex network datasets, especially in terms of the evaluation of precision and AUC. It is obviously better than several comparative algorithms. At the same time, the selected datasets come from different fields. The results indicate that the DDMF method is characterized by high precision and wide applicability in mining relatively important nodes in networks.


