
Experimental Studies of Scale Effect on the Shear Strength of Coarse-Grained Soil


Abstract
:1. Introduction
2. Materials and Methods
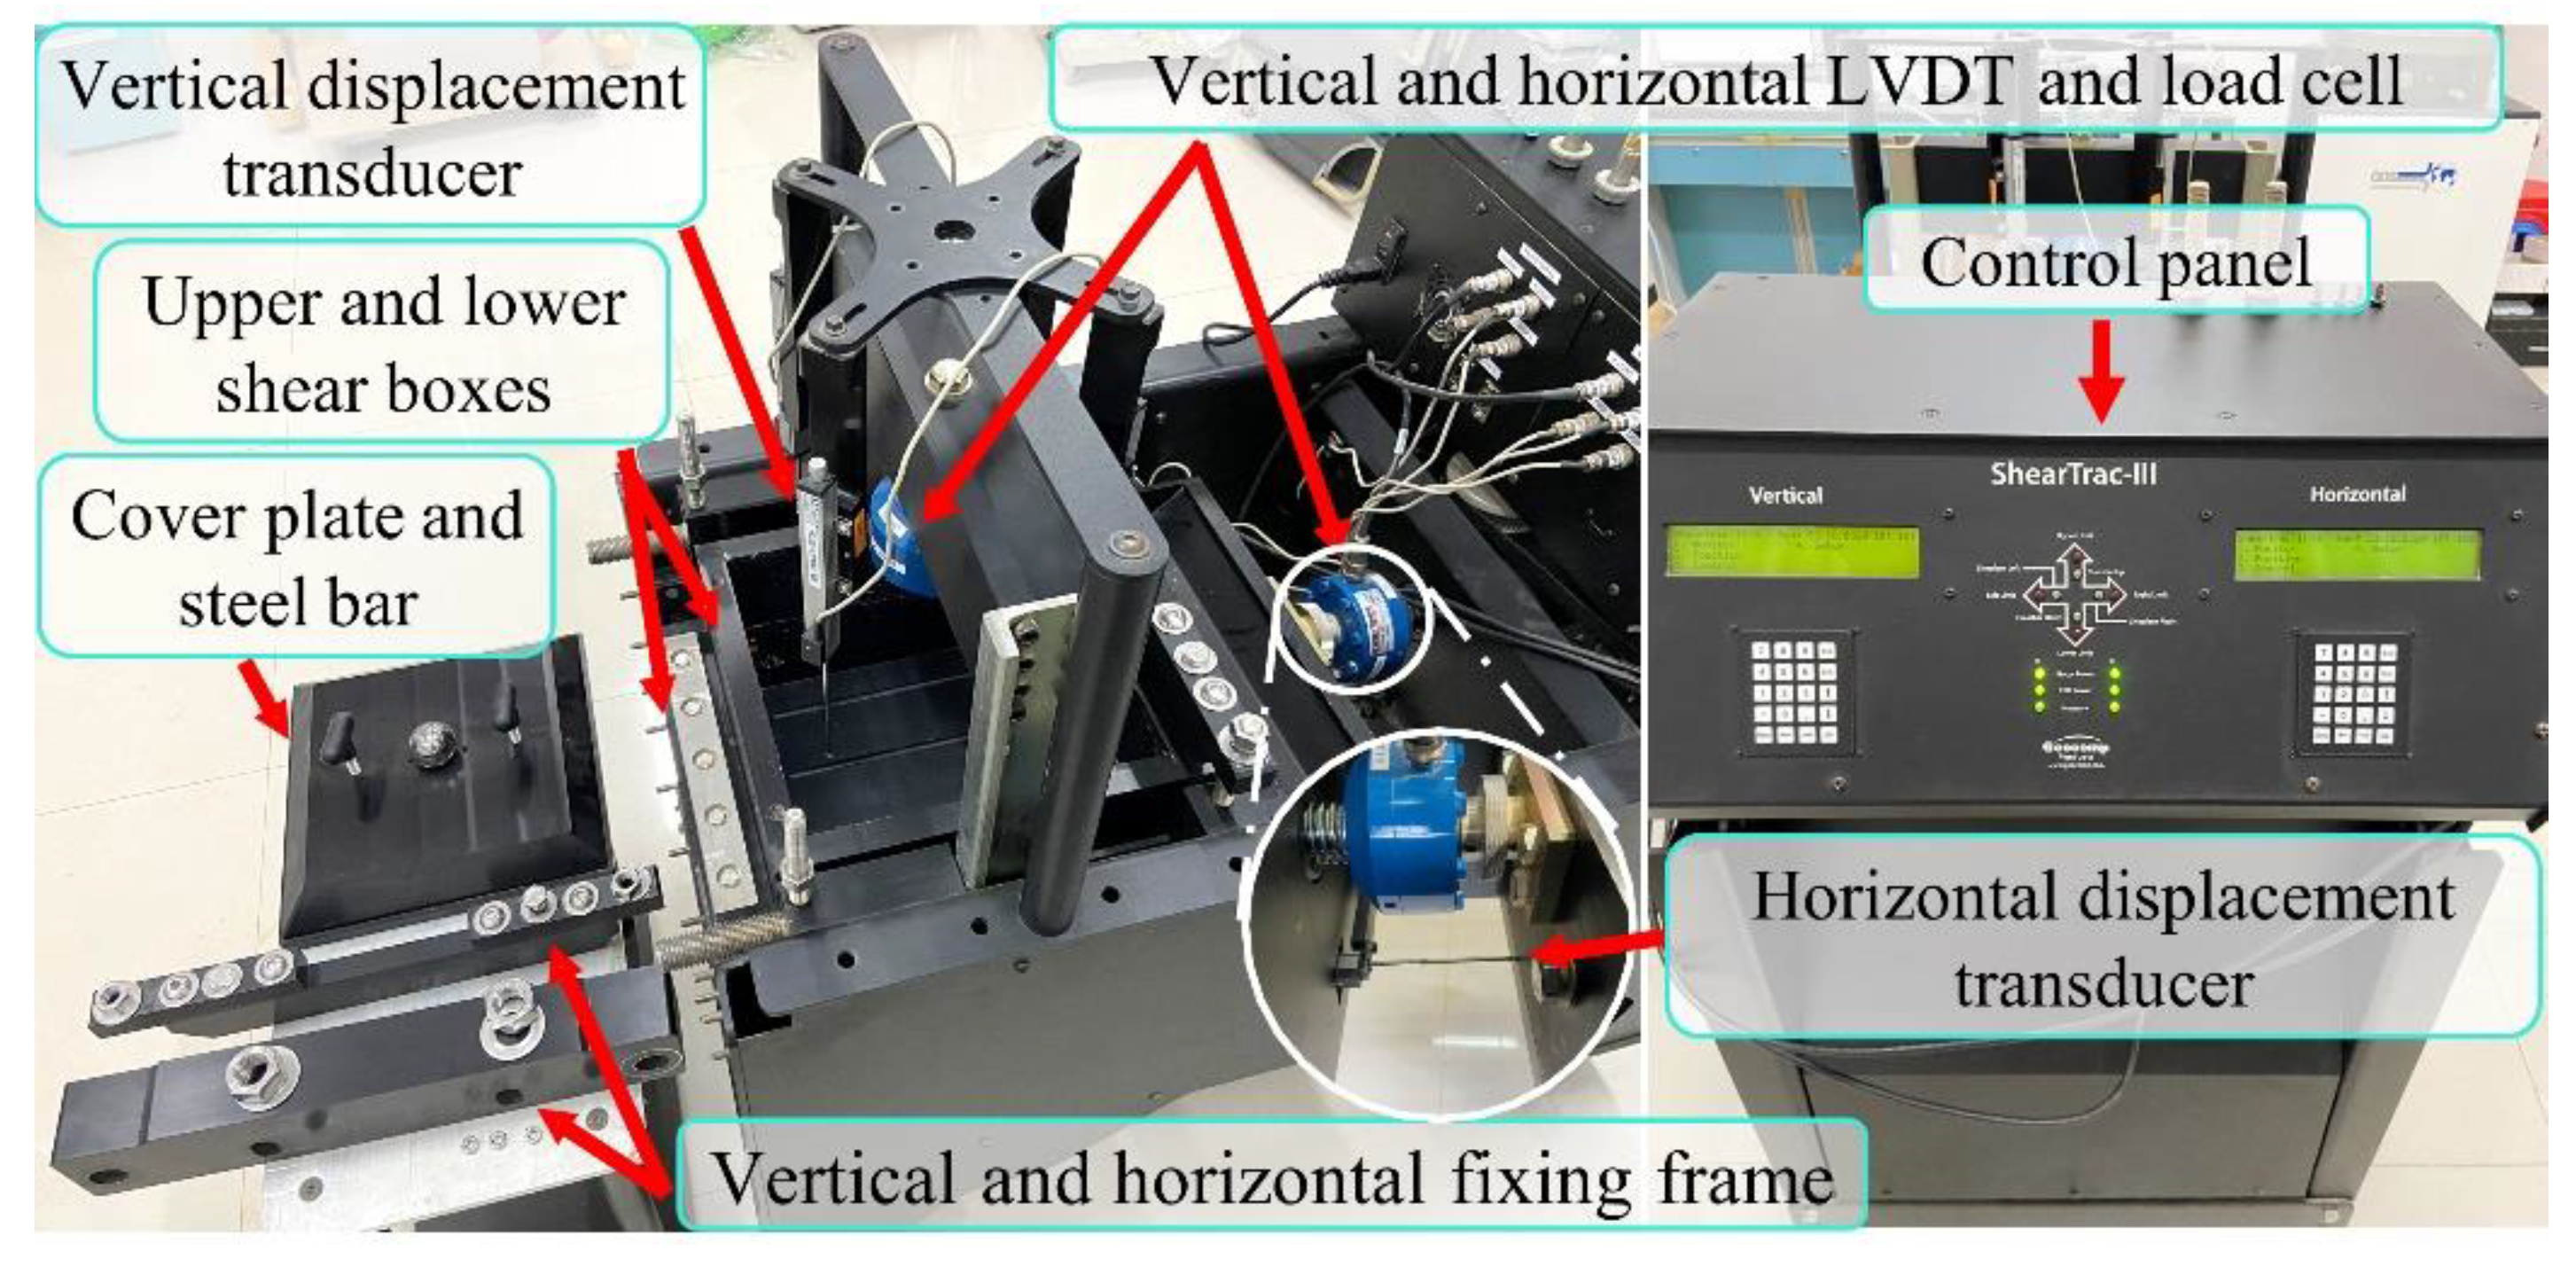
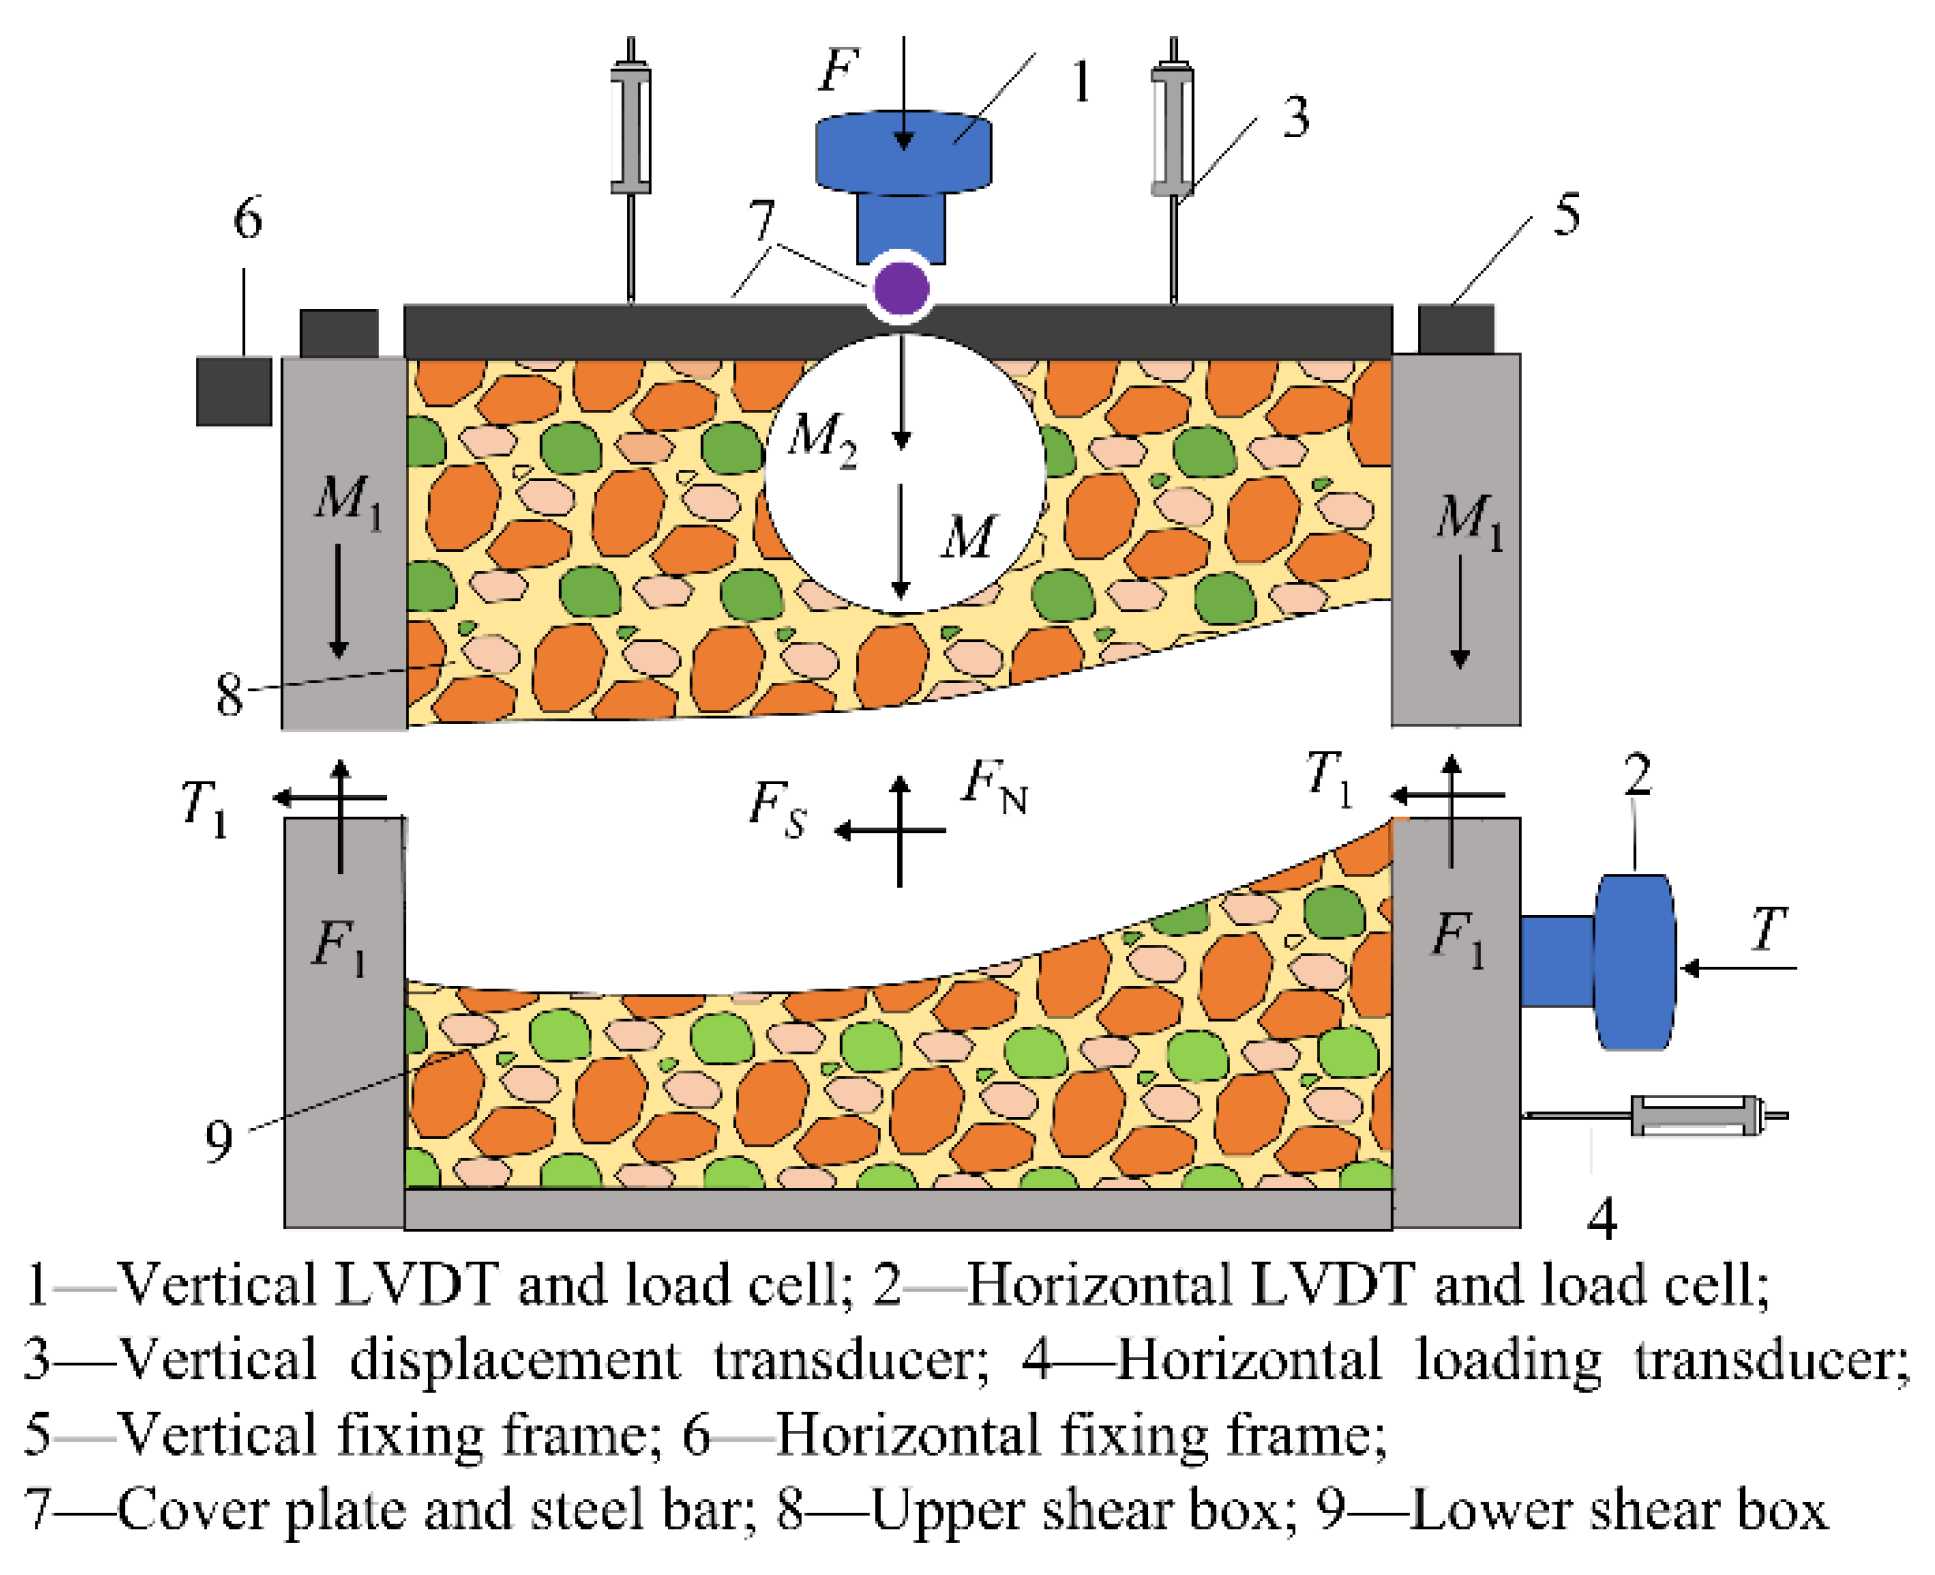
2.1. Test Apparatus
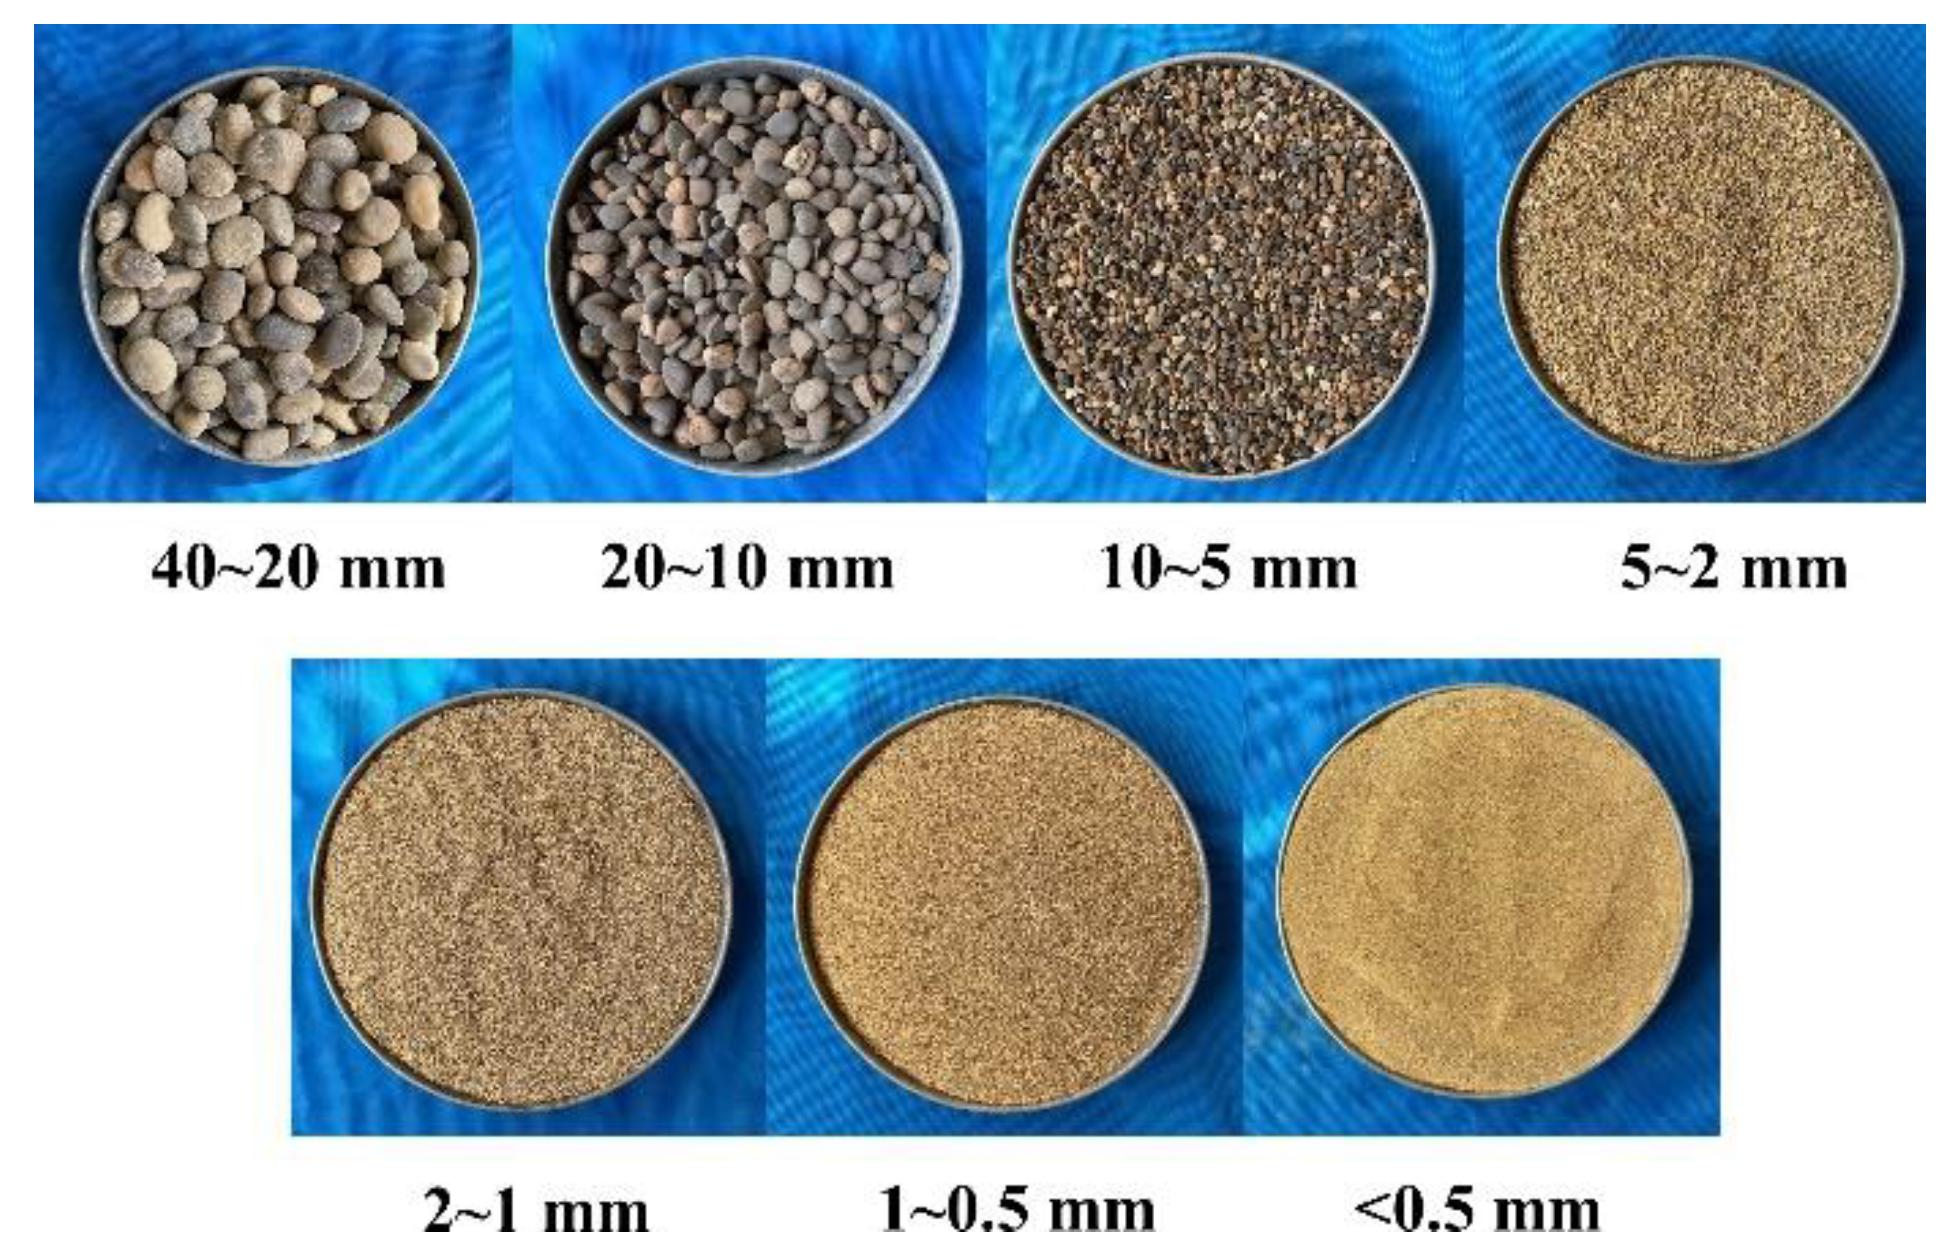
2.2. Soil Samples
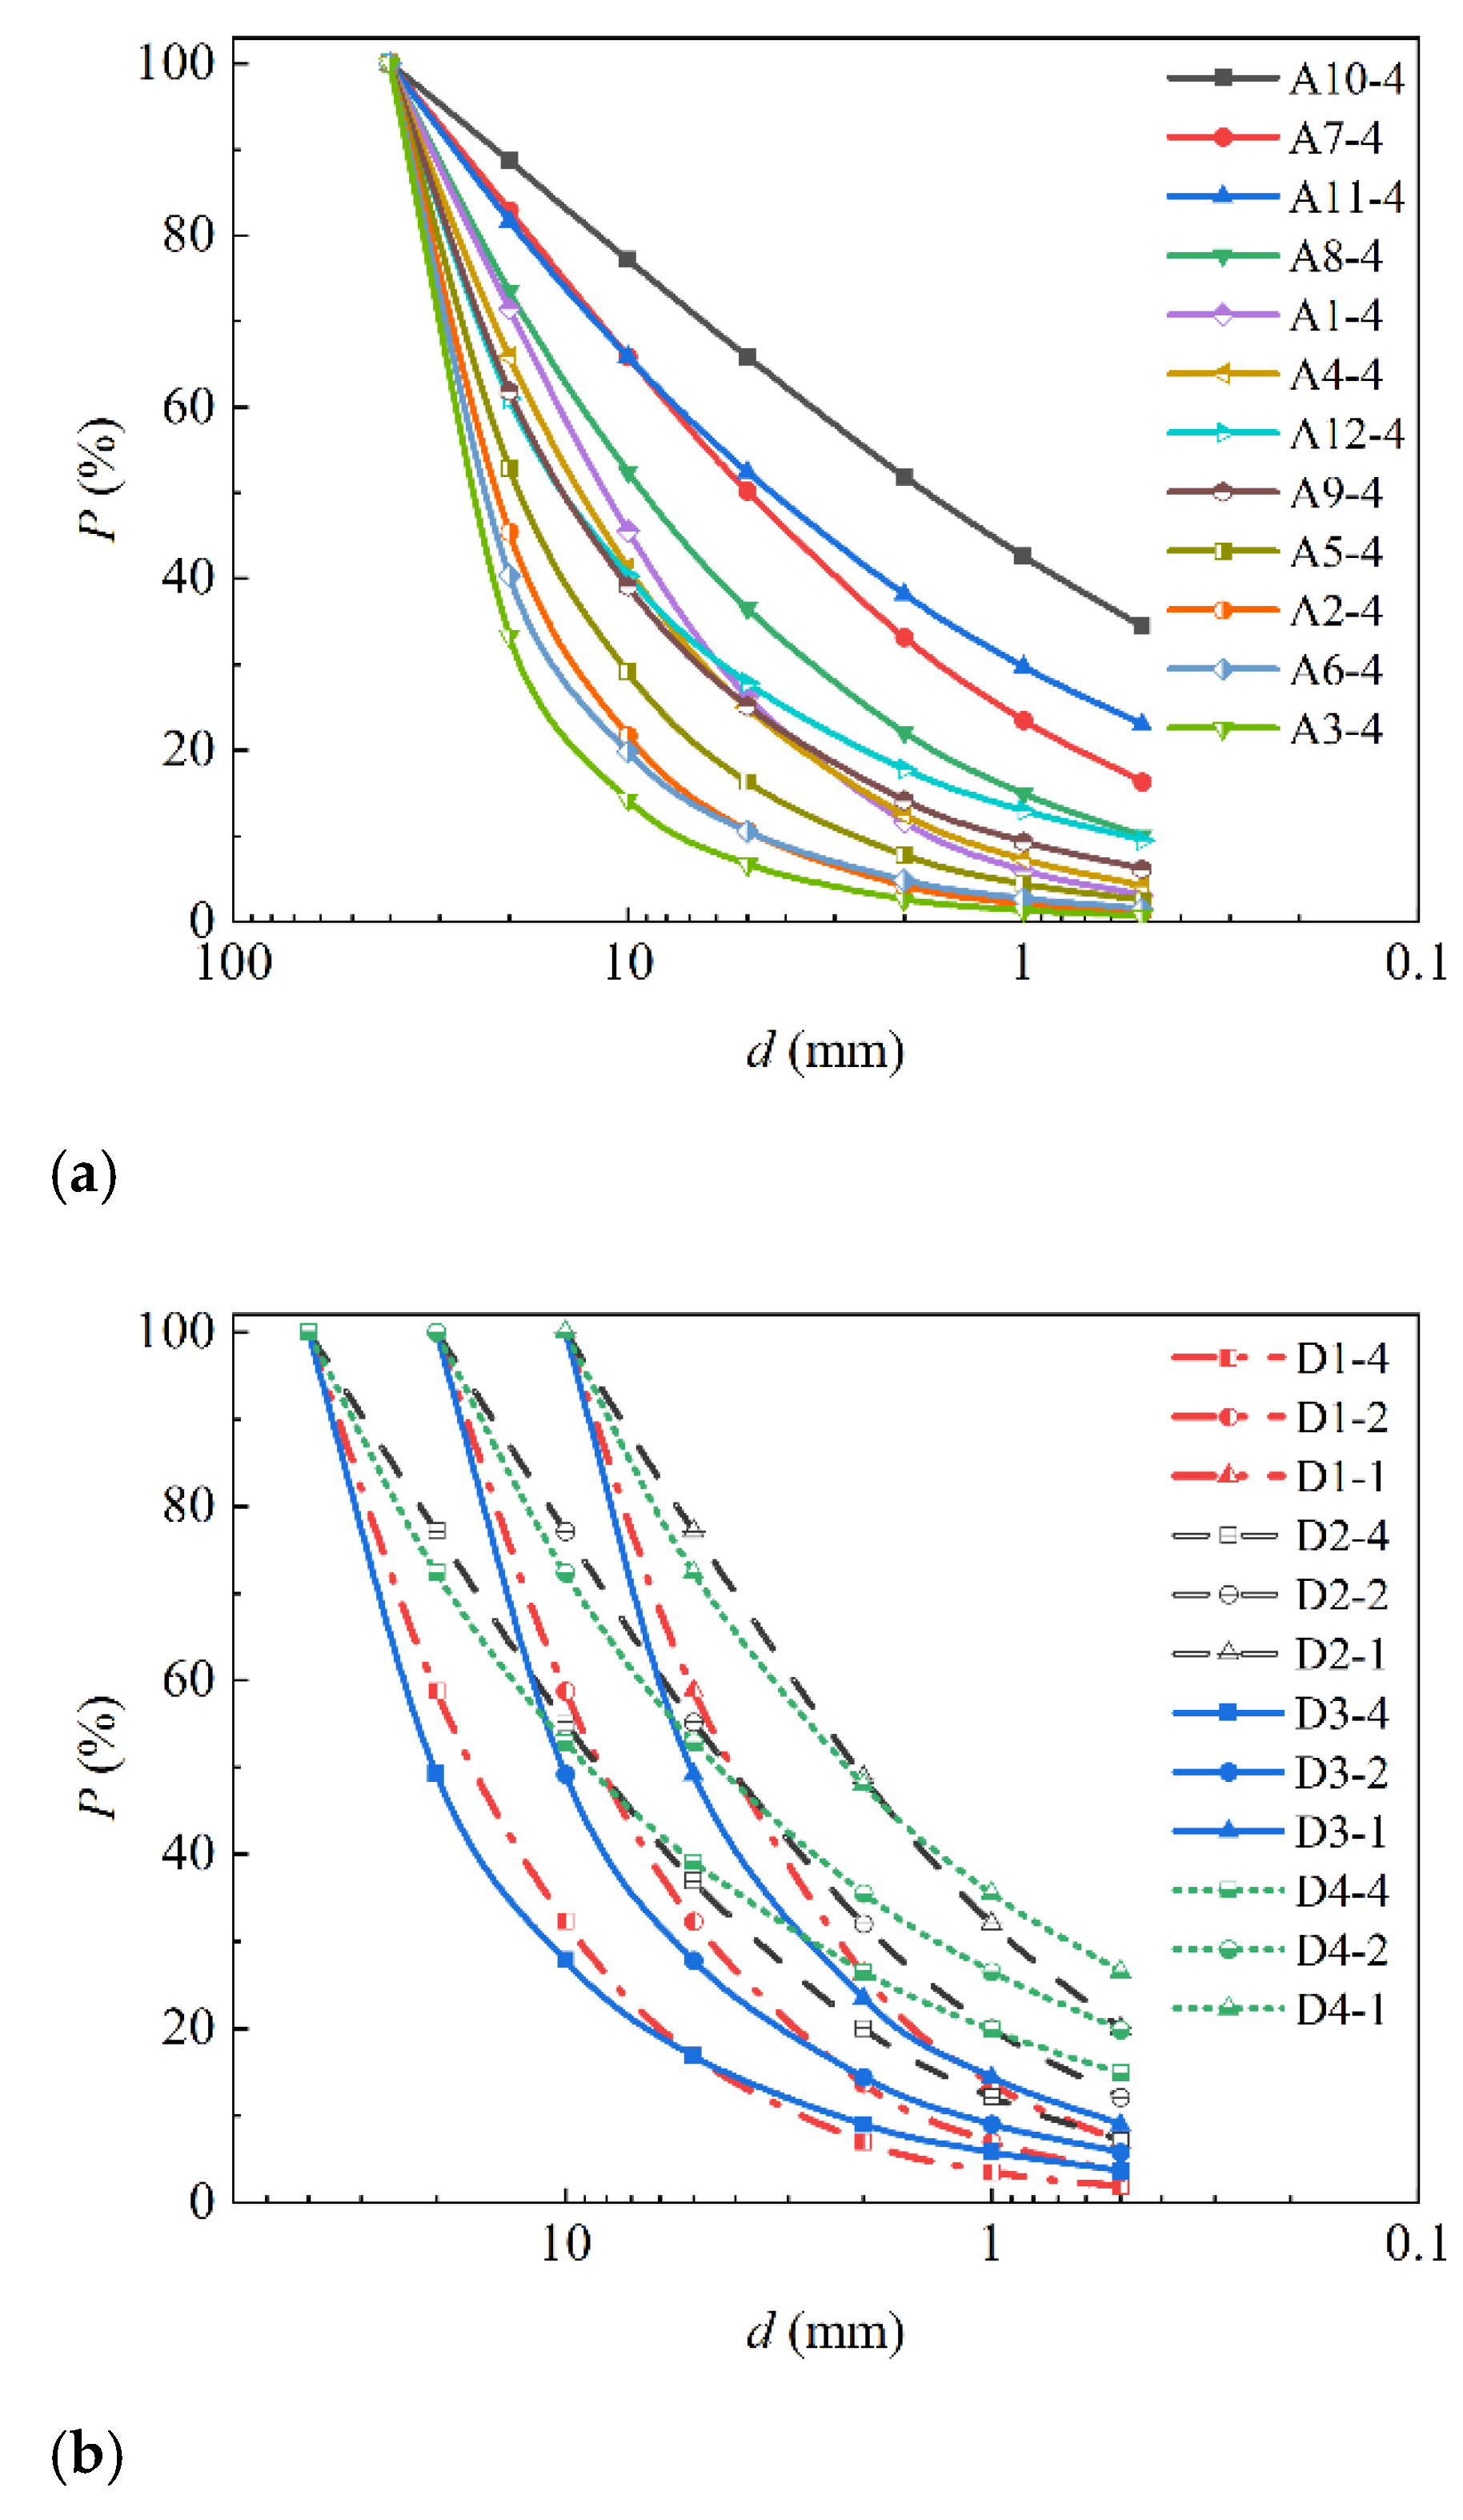
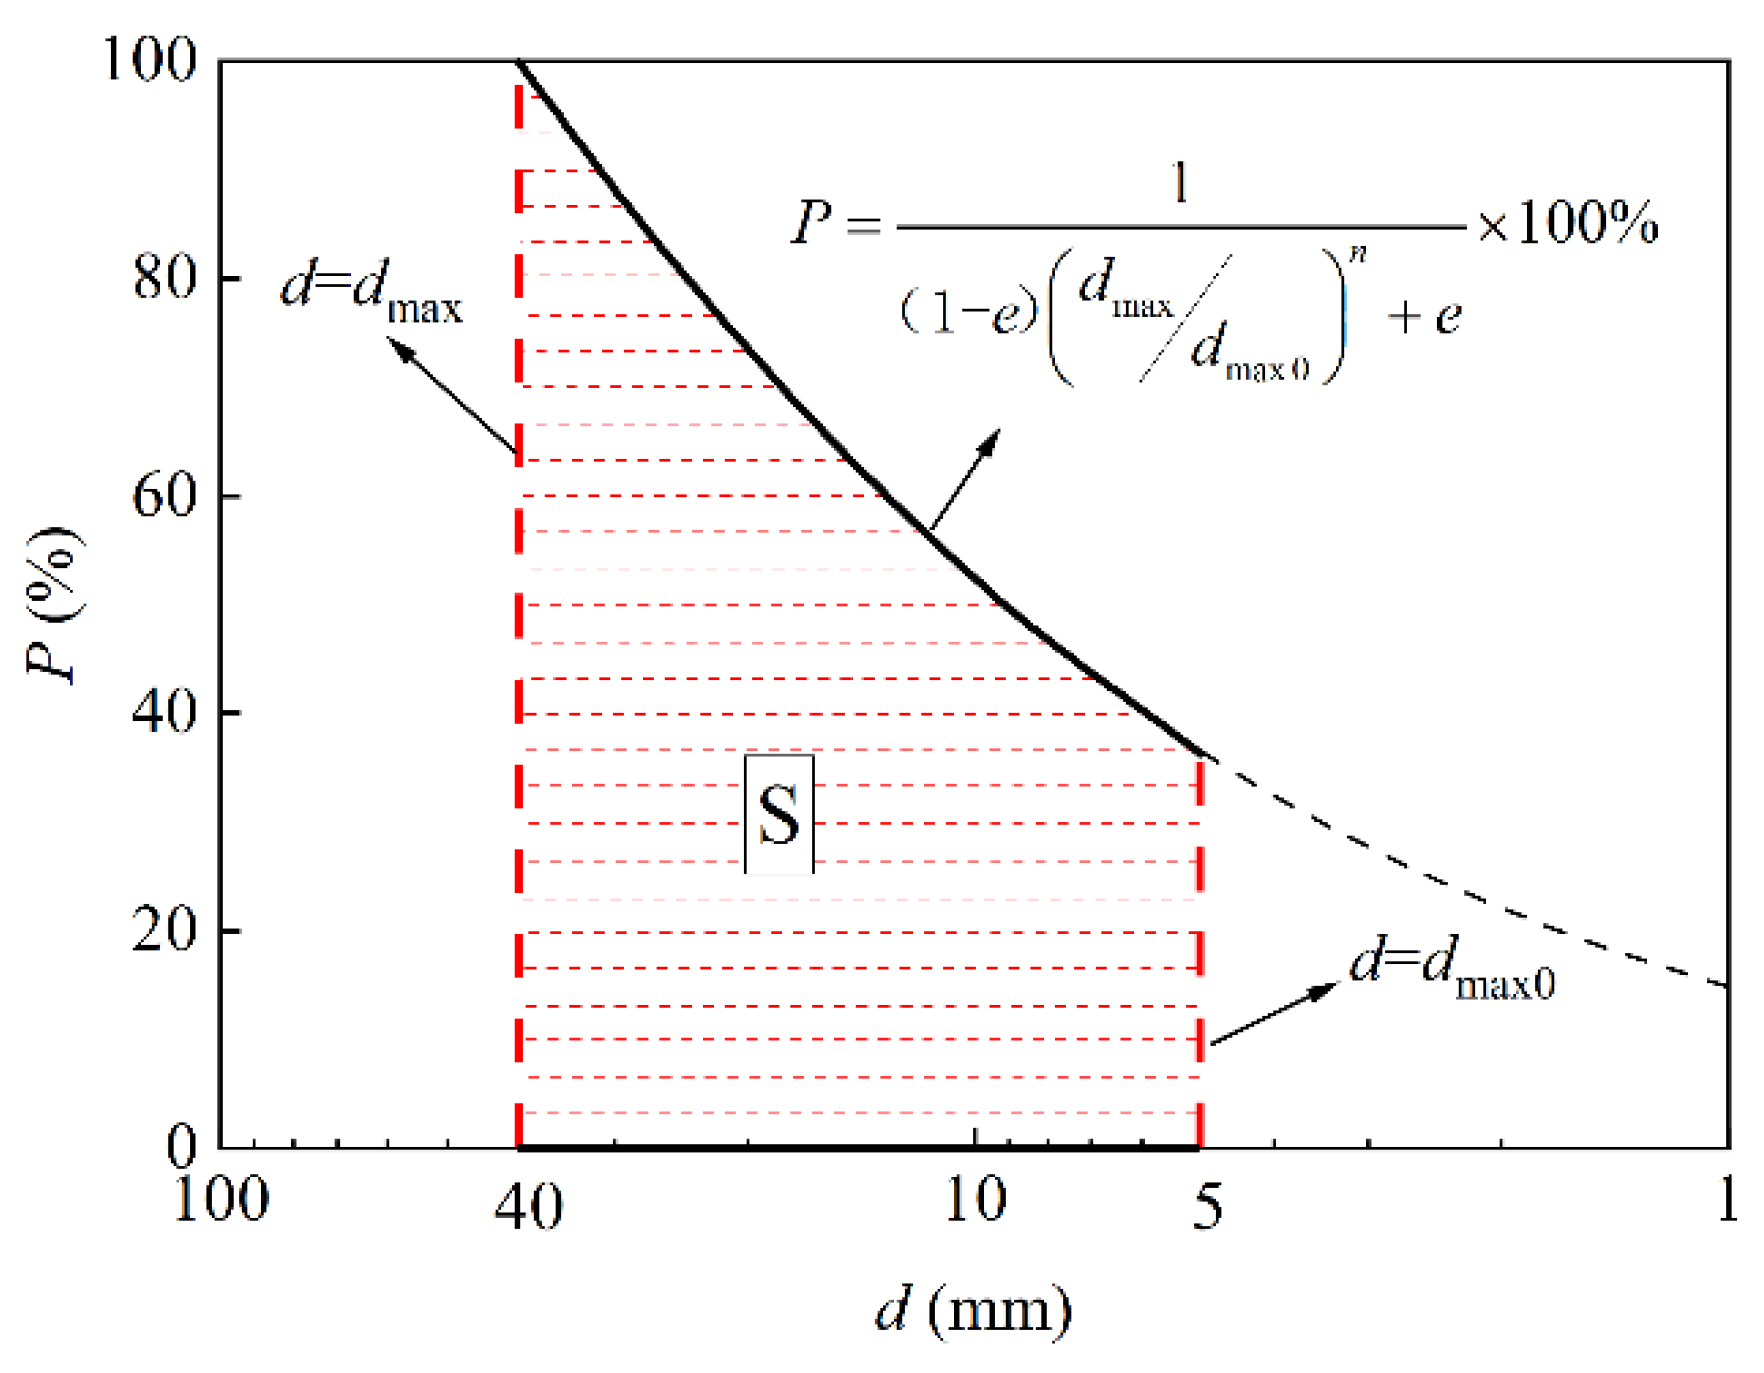
2.3. Research Method of Scale Effect
3. Results
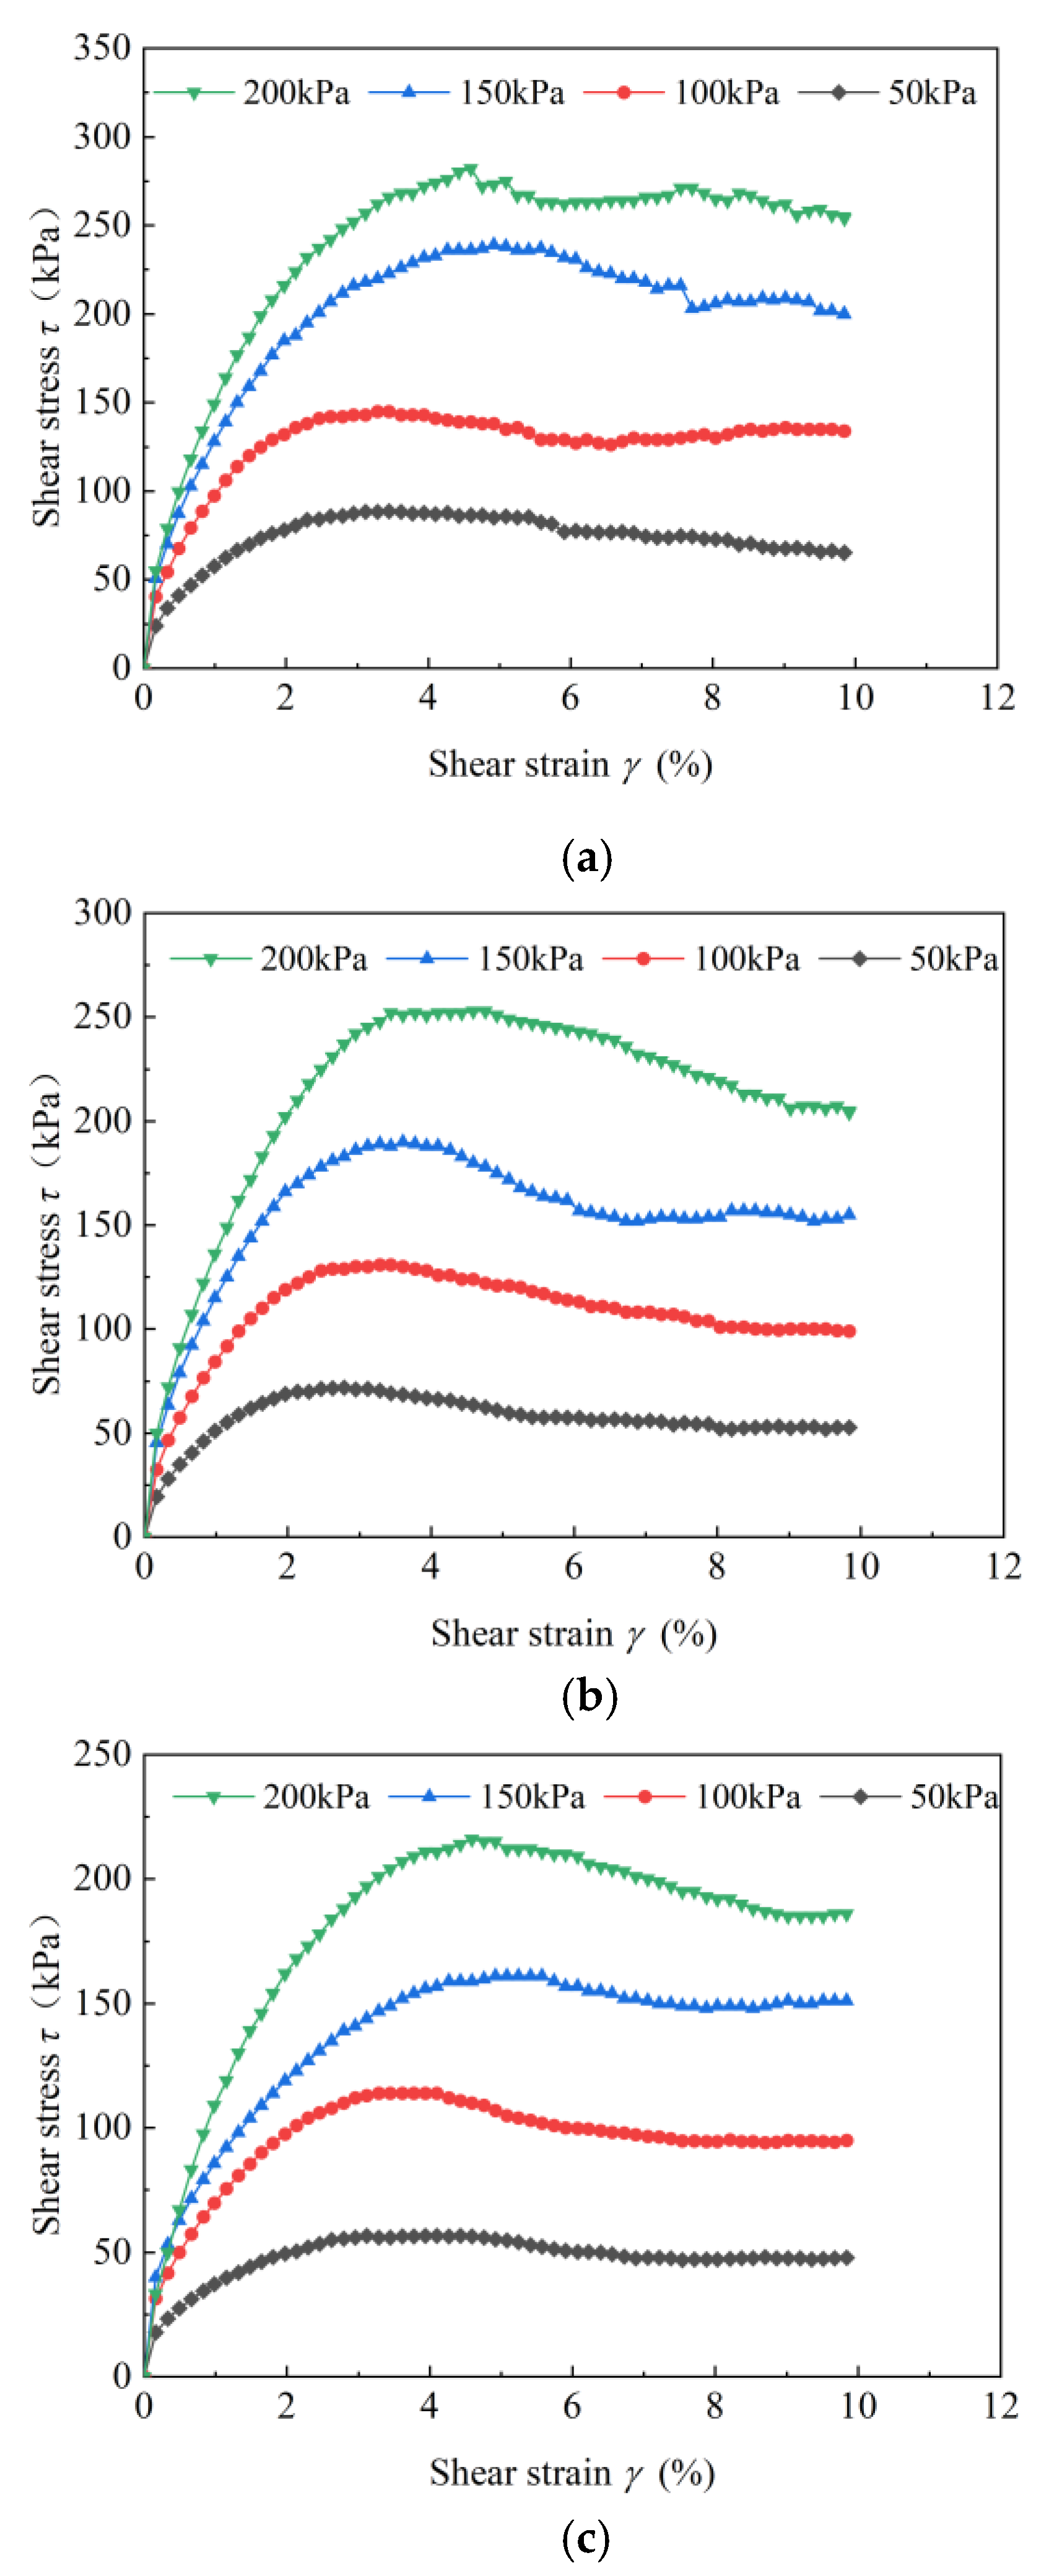
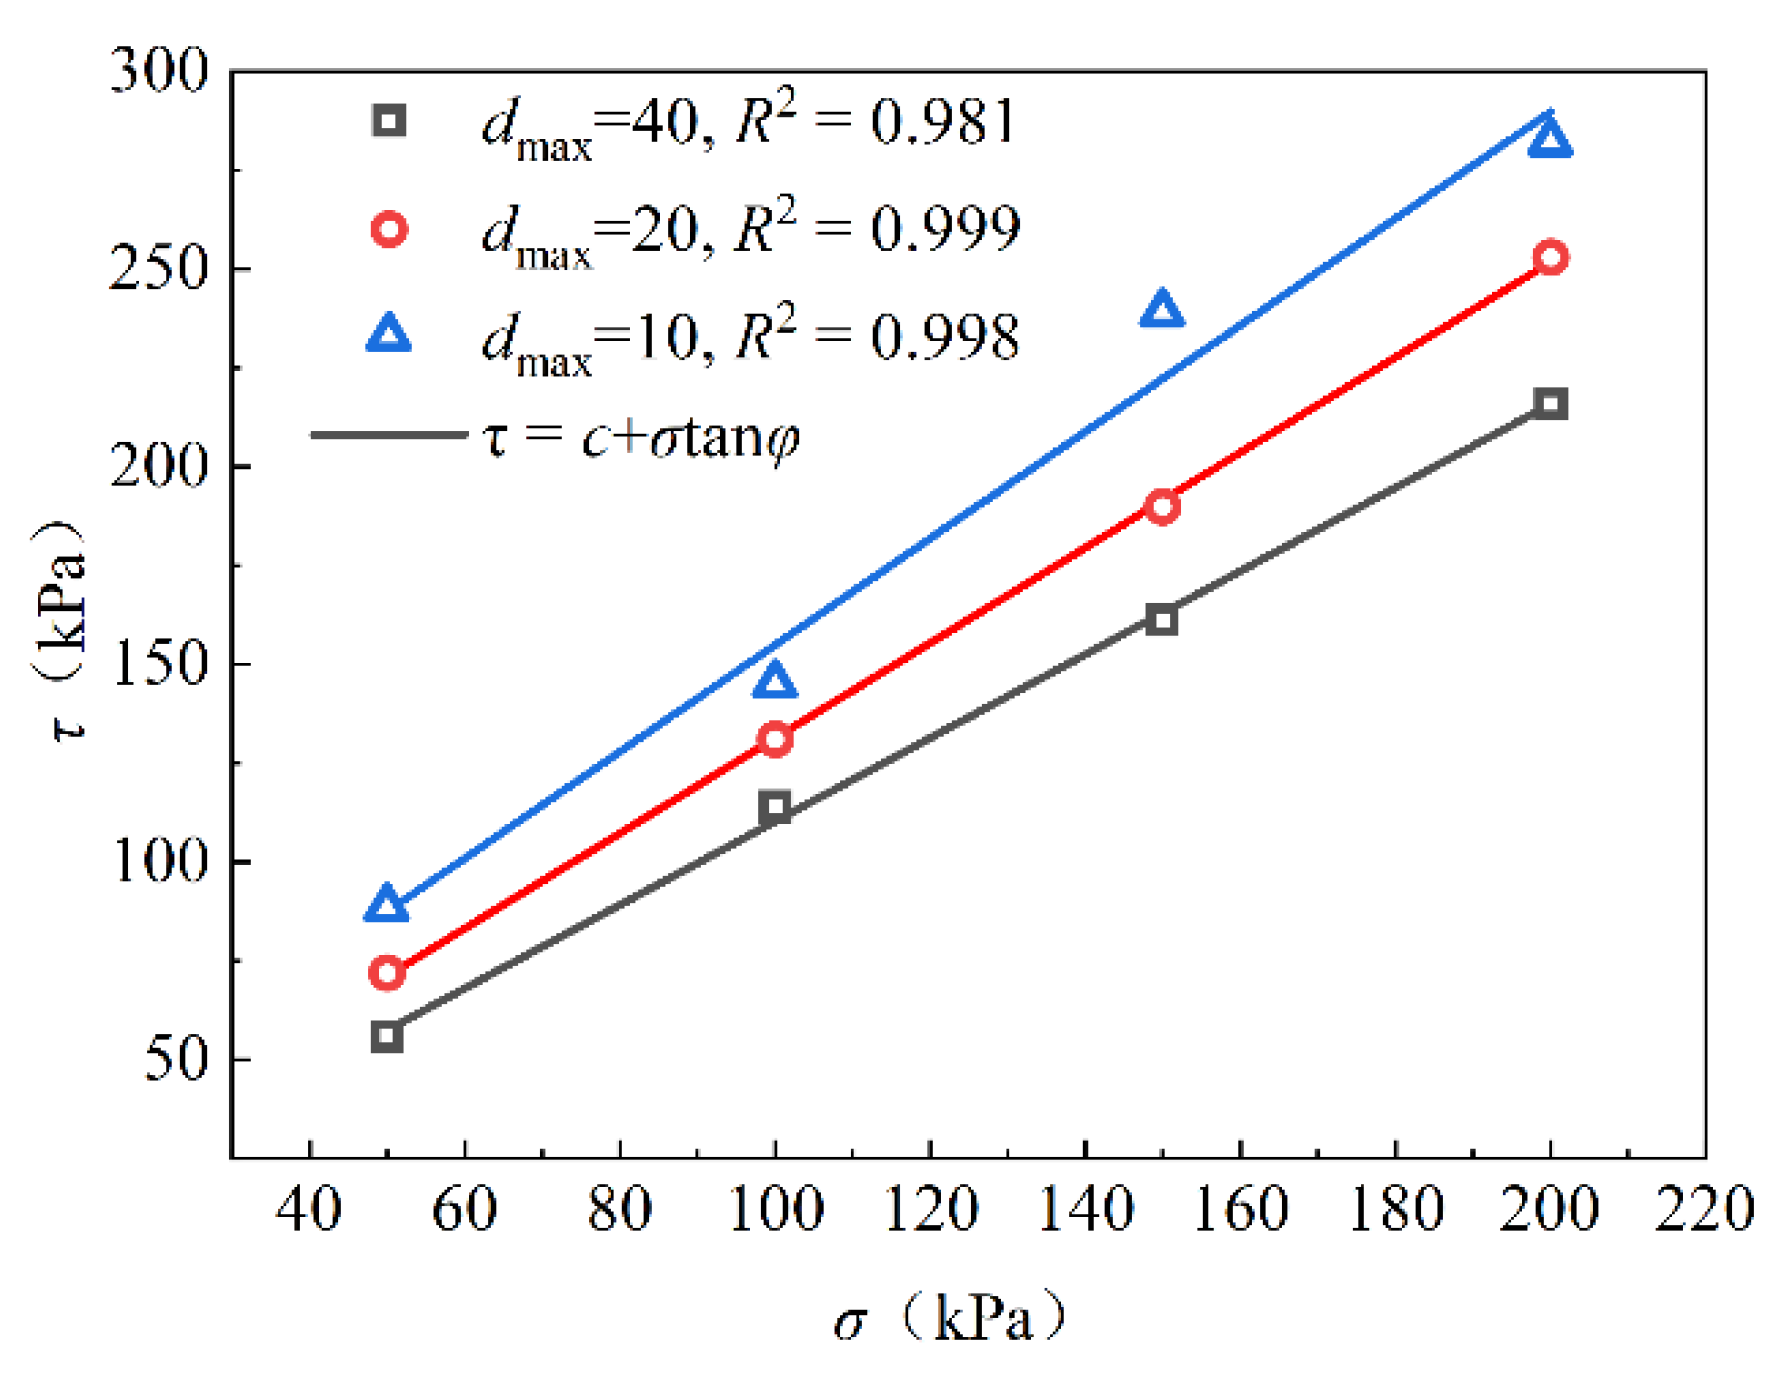
3.1. Relationship between Shear Strength Index and Maximum Particle Size
3.2. Relationship of Shear Strength Index and Grading Area
3.3. Derivation of Empirical Equation of Shear Strength of Coarse-Grained Soil
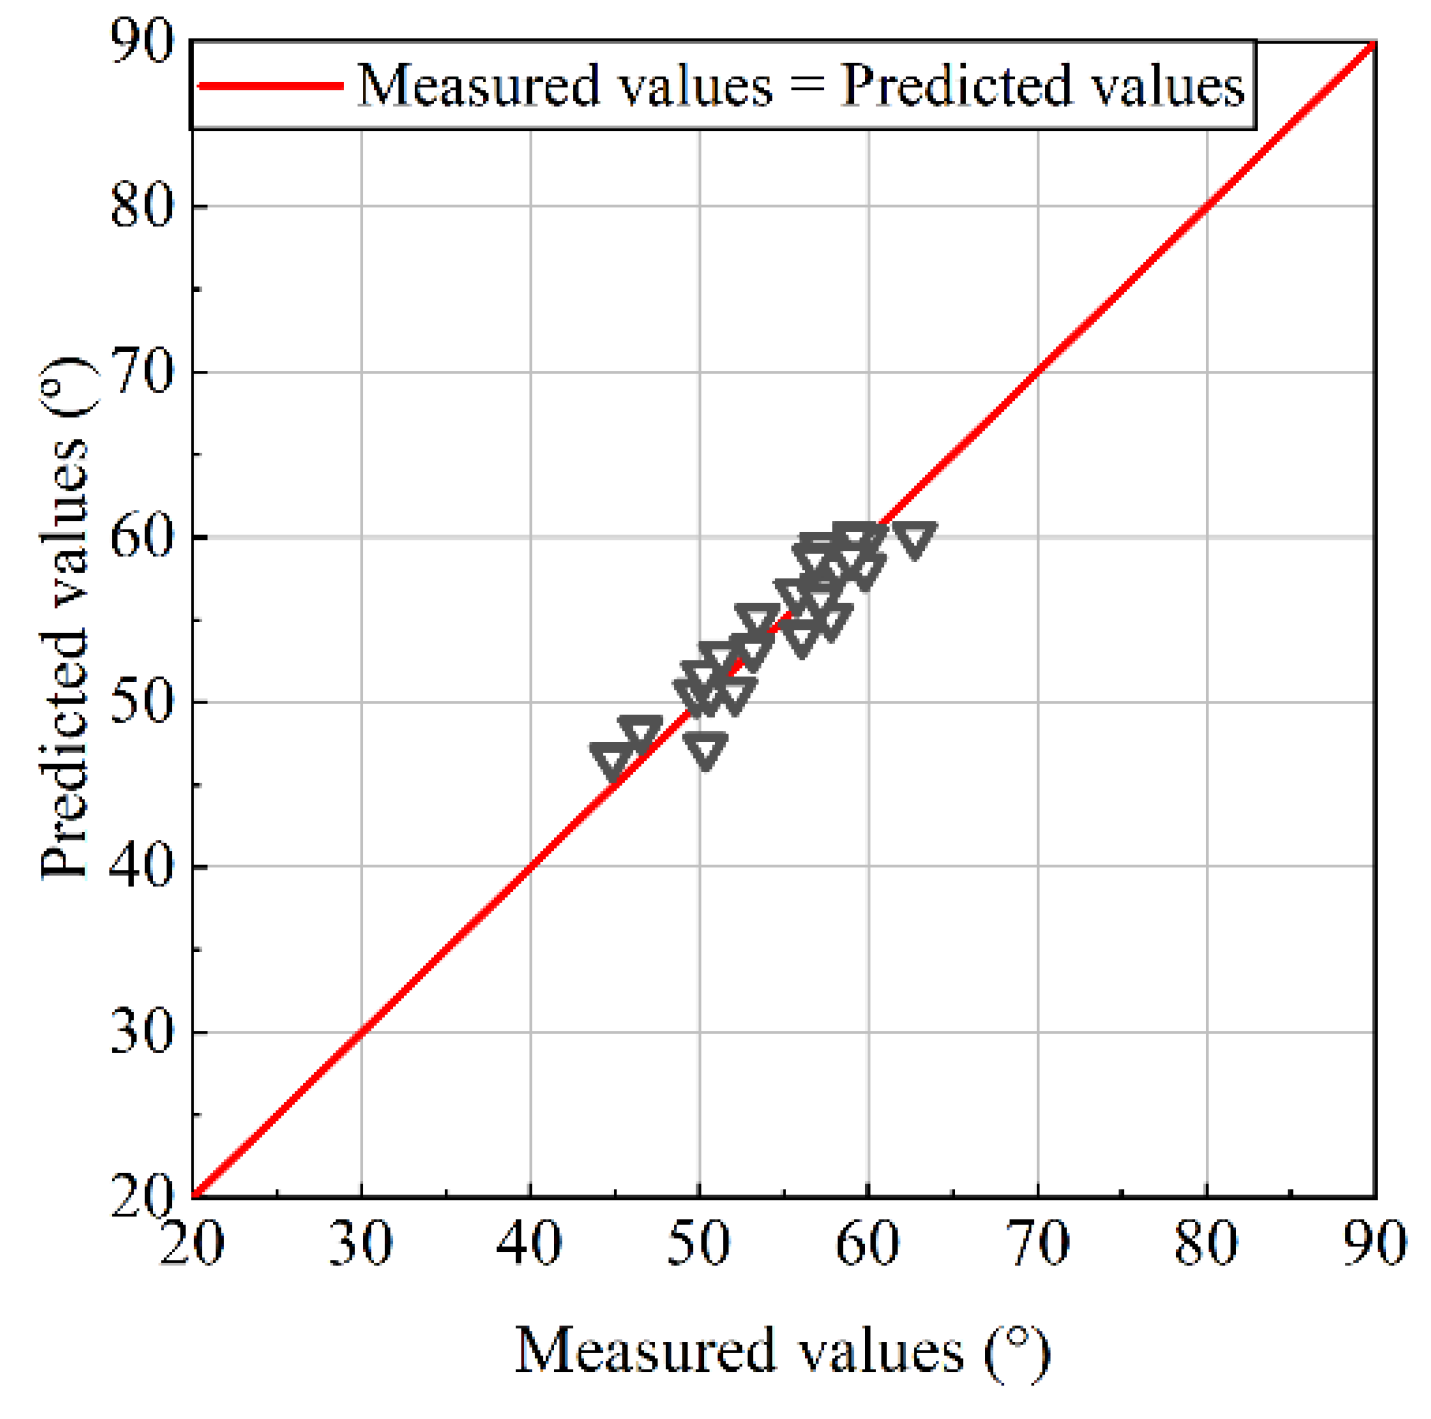
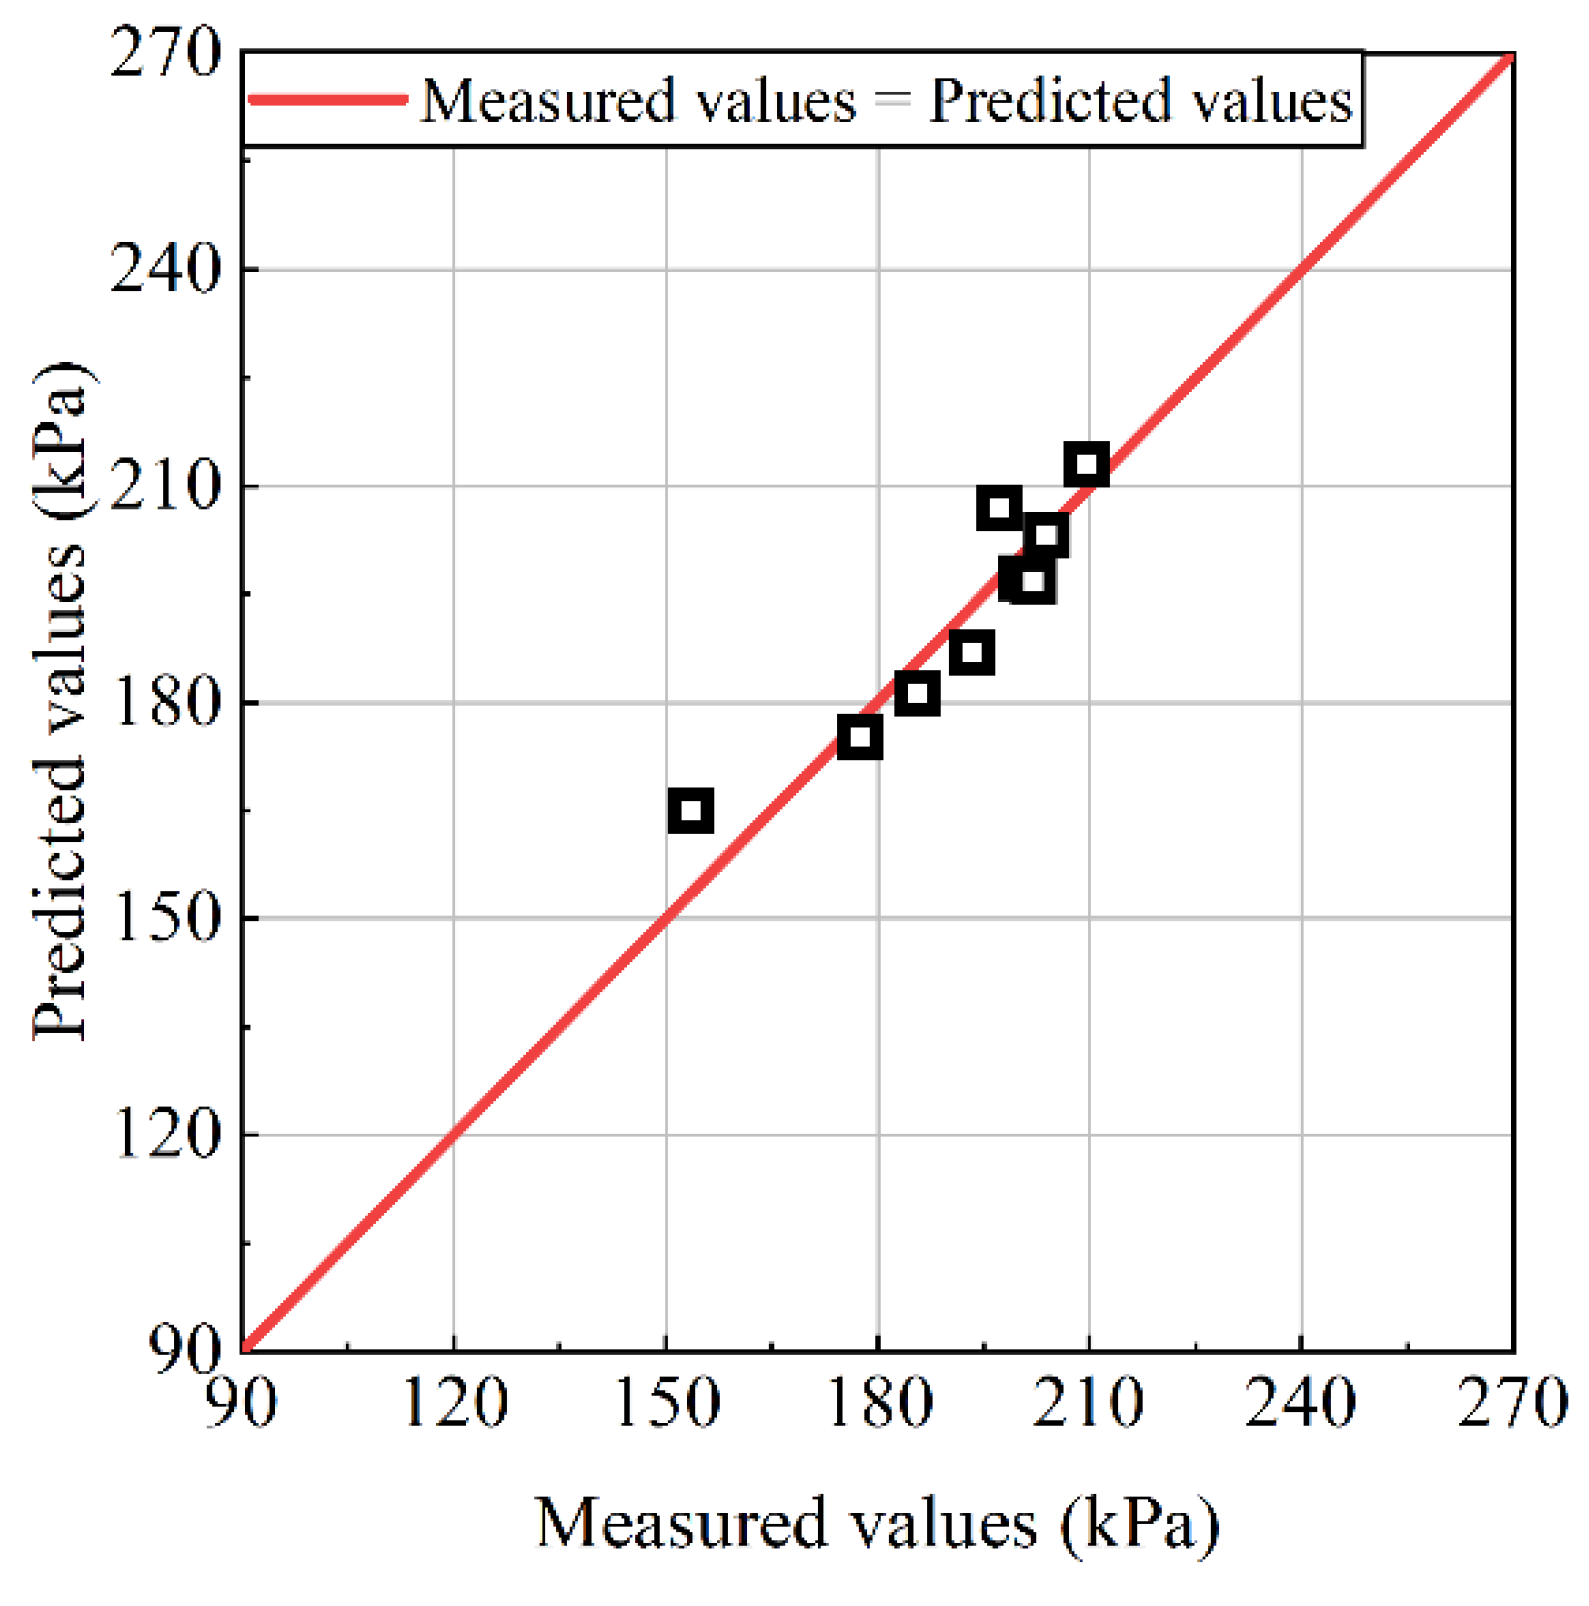
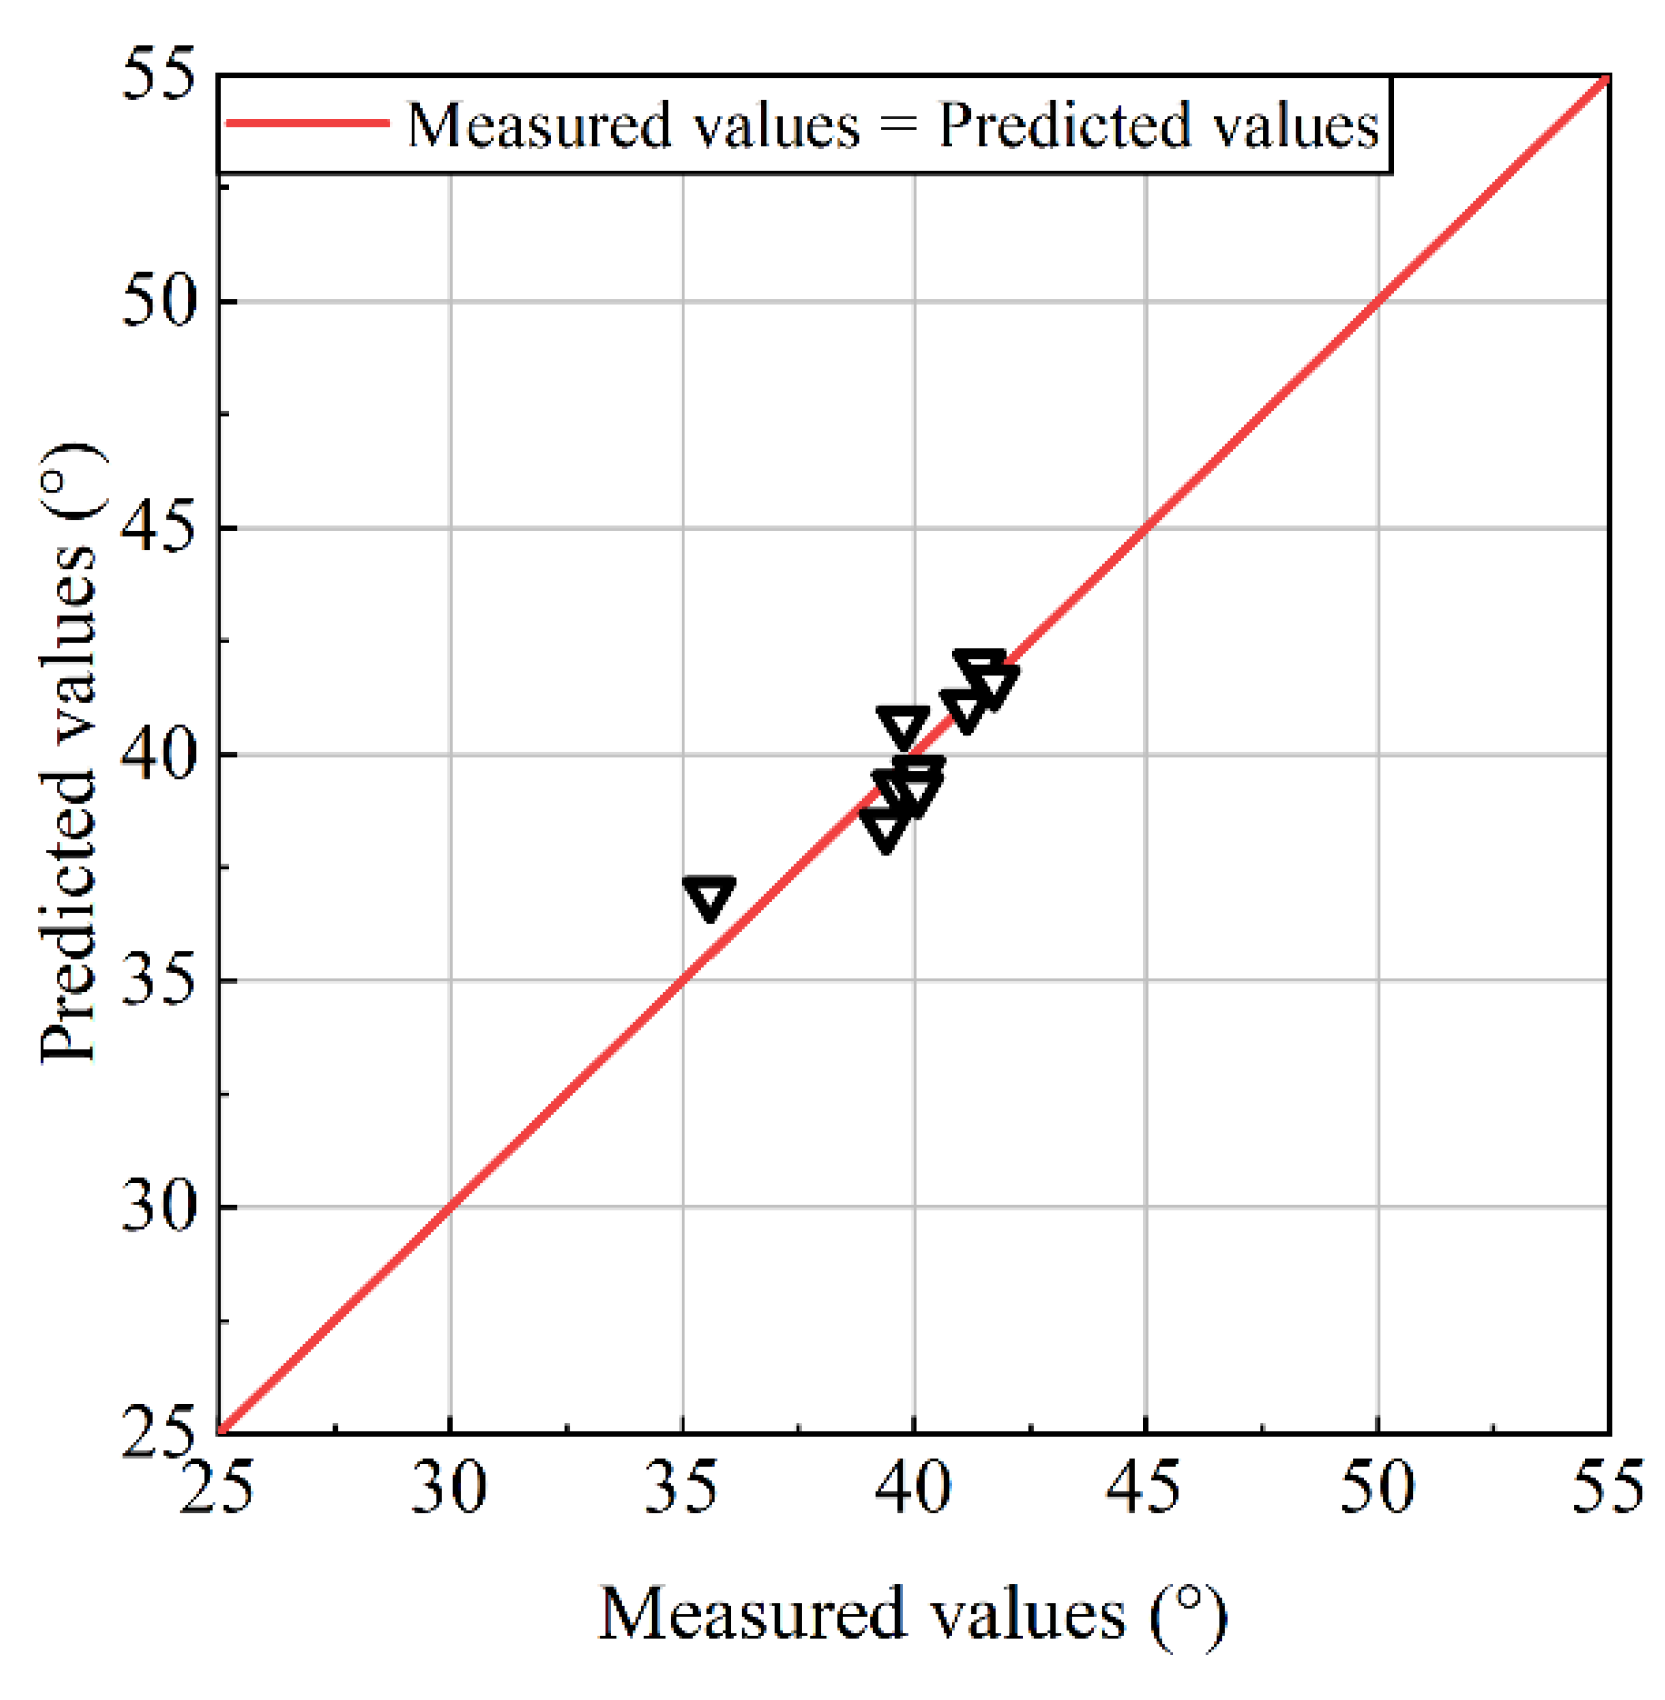
3.4. Verification of Empirical Equation of the Shear Strength of Coarse-Grained Soil
4. Conclusions
- (1)
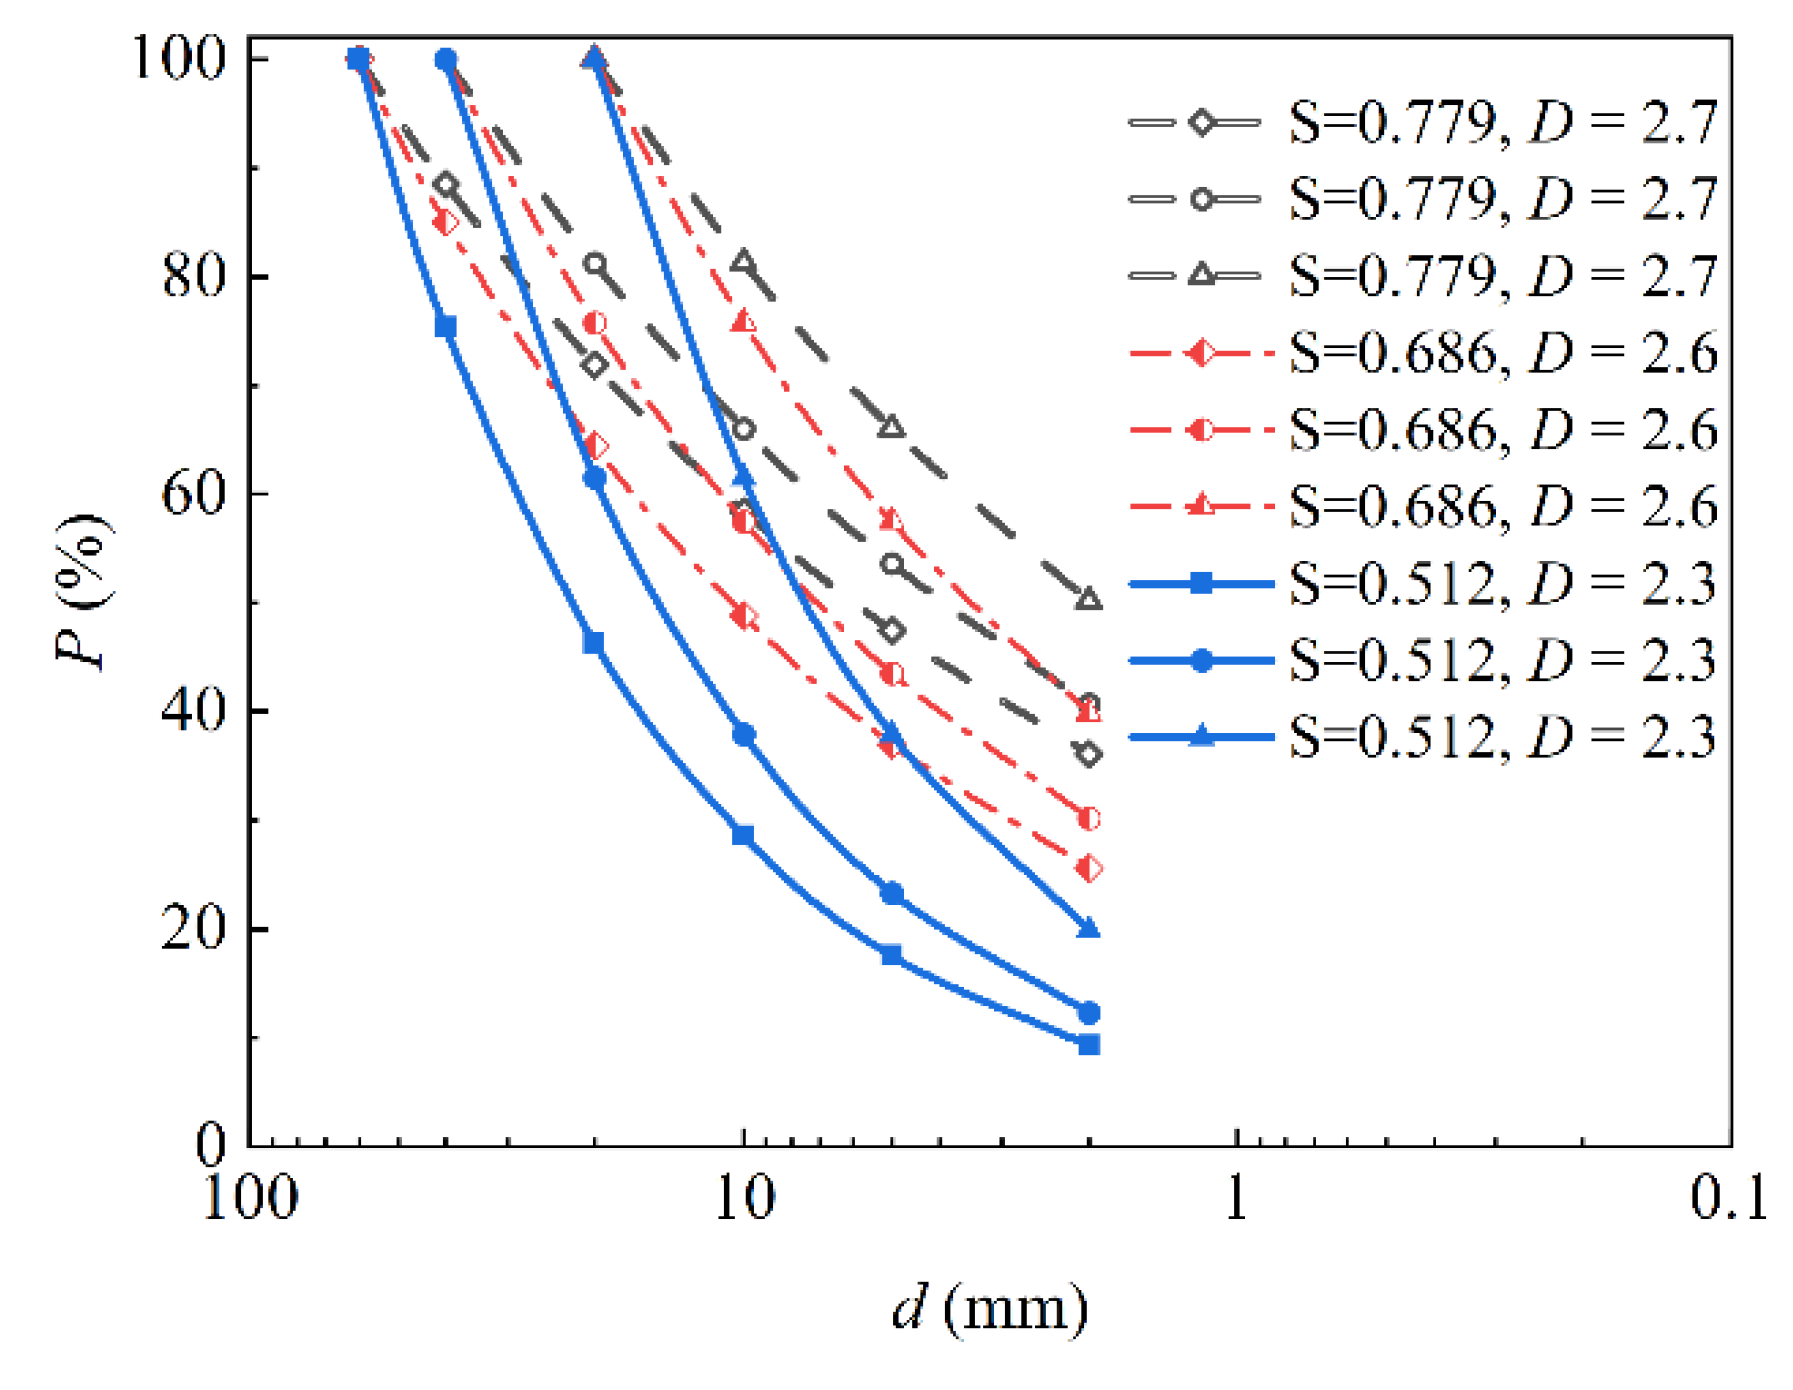
- Based on the continuous grading equation of soil, combined with the similar grading method, the purpose of quantitatively and comprehensively studying the scale-induced effect on the shear strength of CGS under consideration of the maximum particle size and gradation structure can be achieved;
- (2)
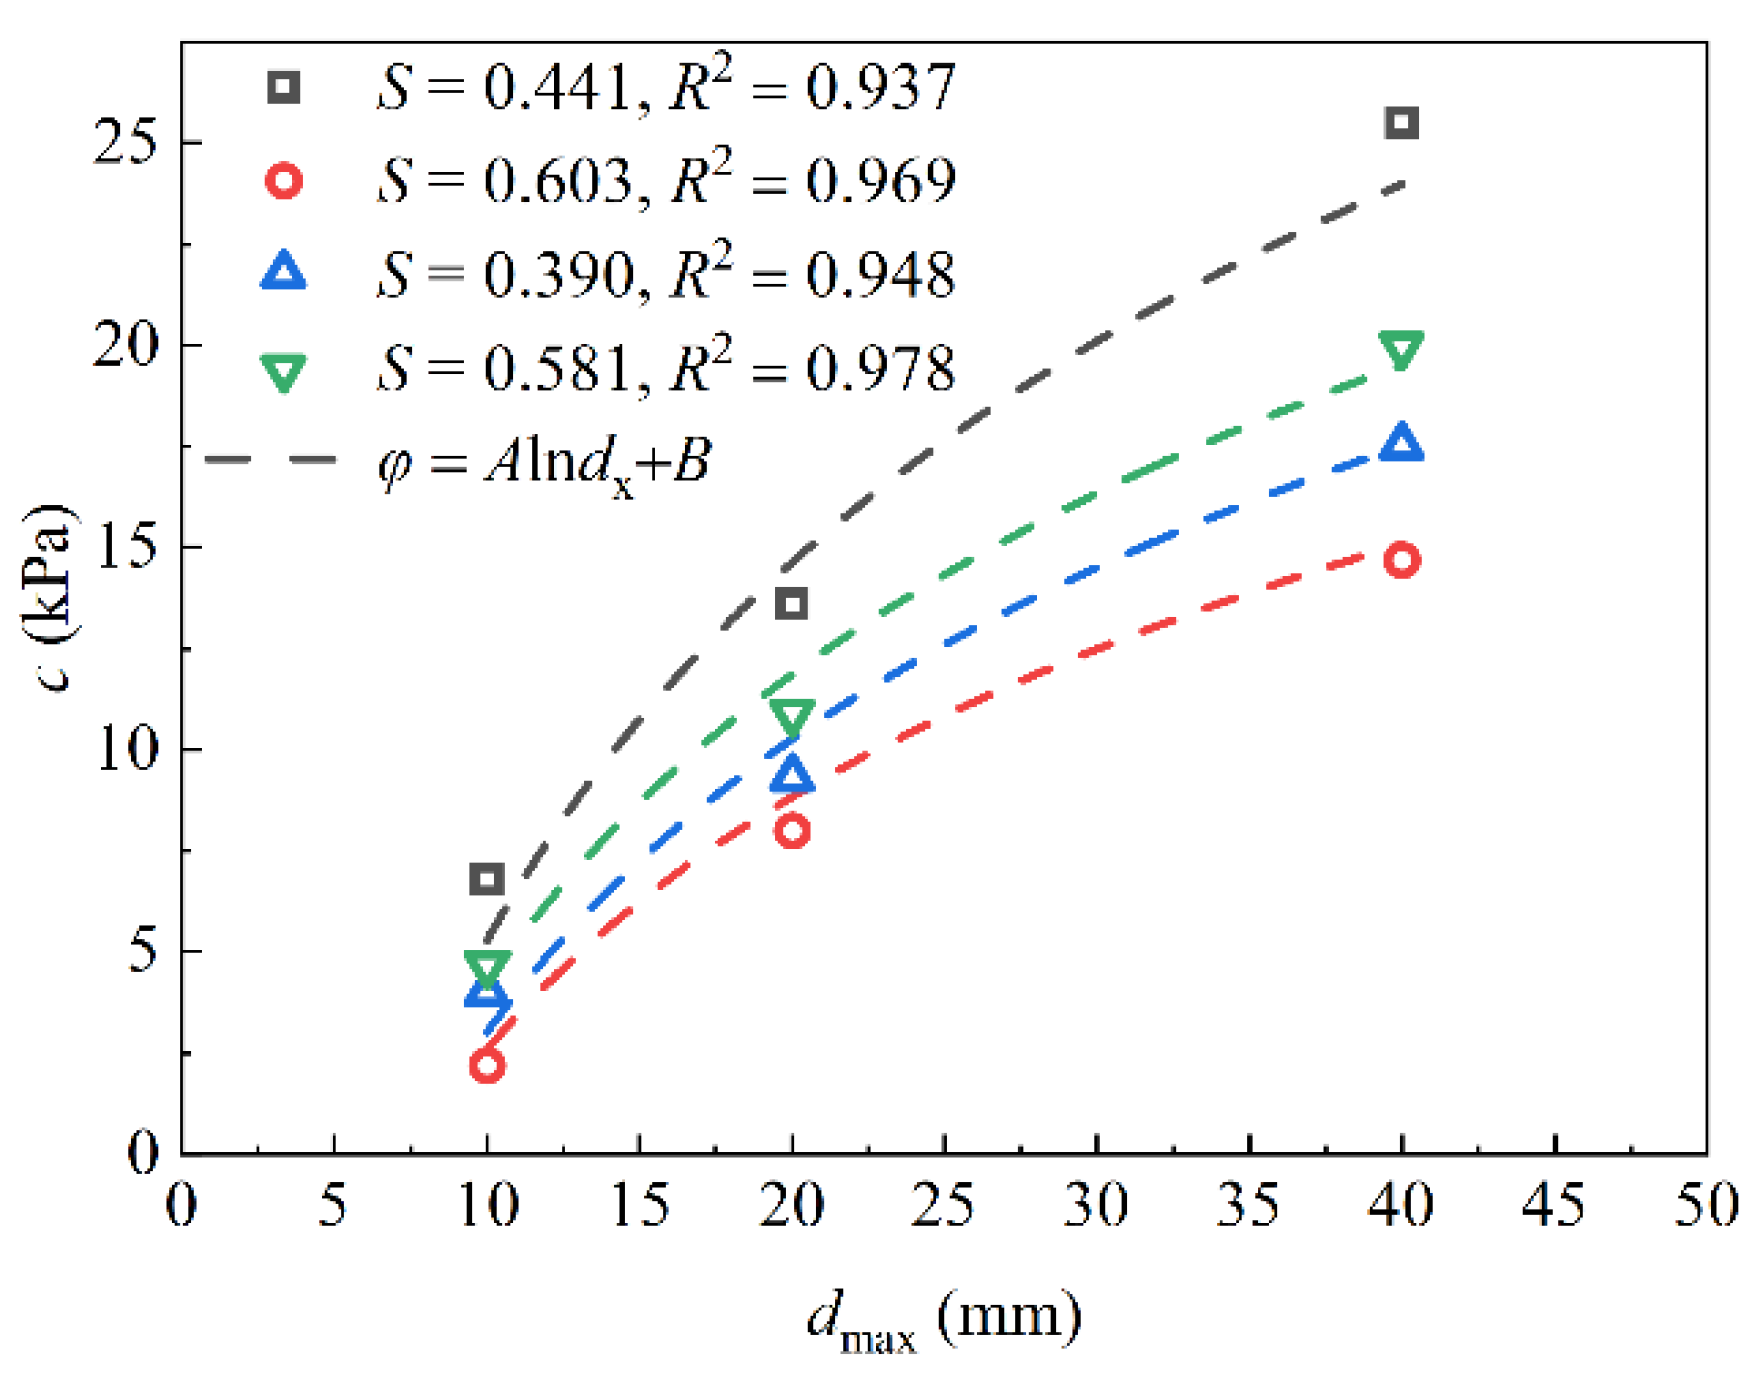
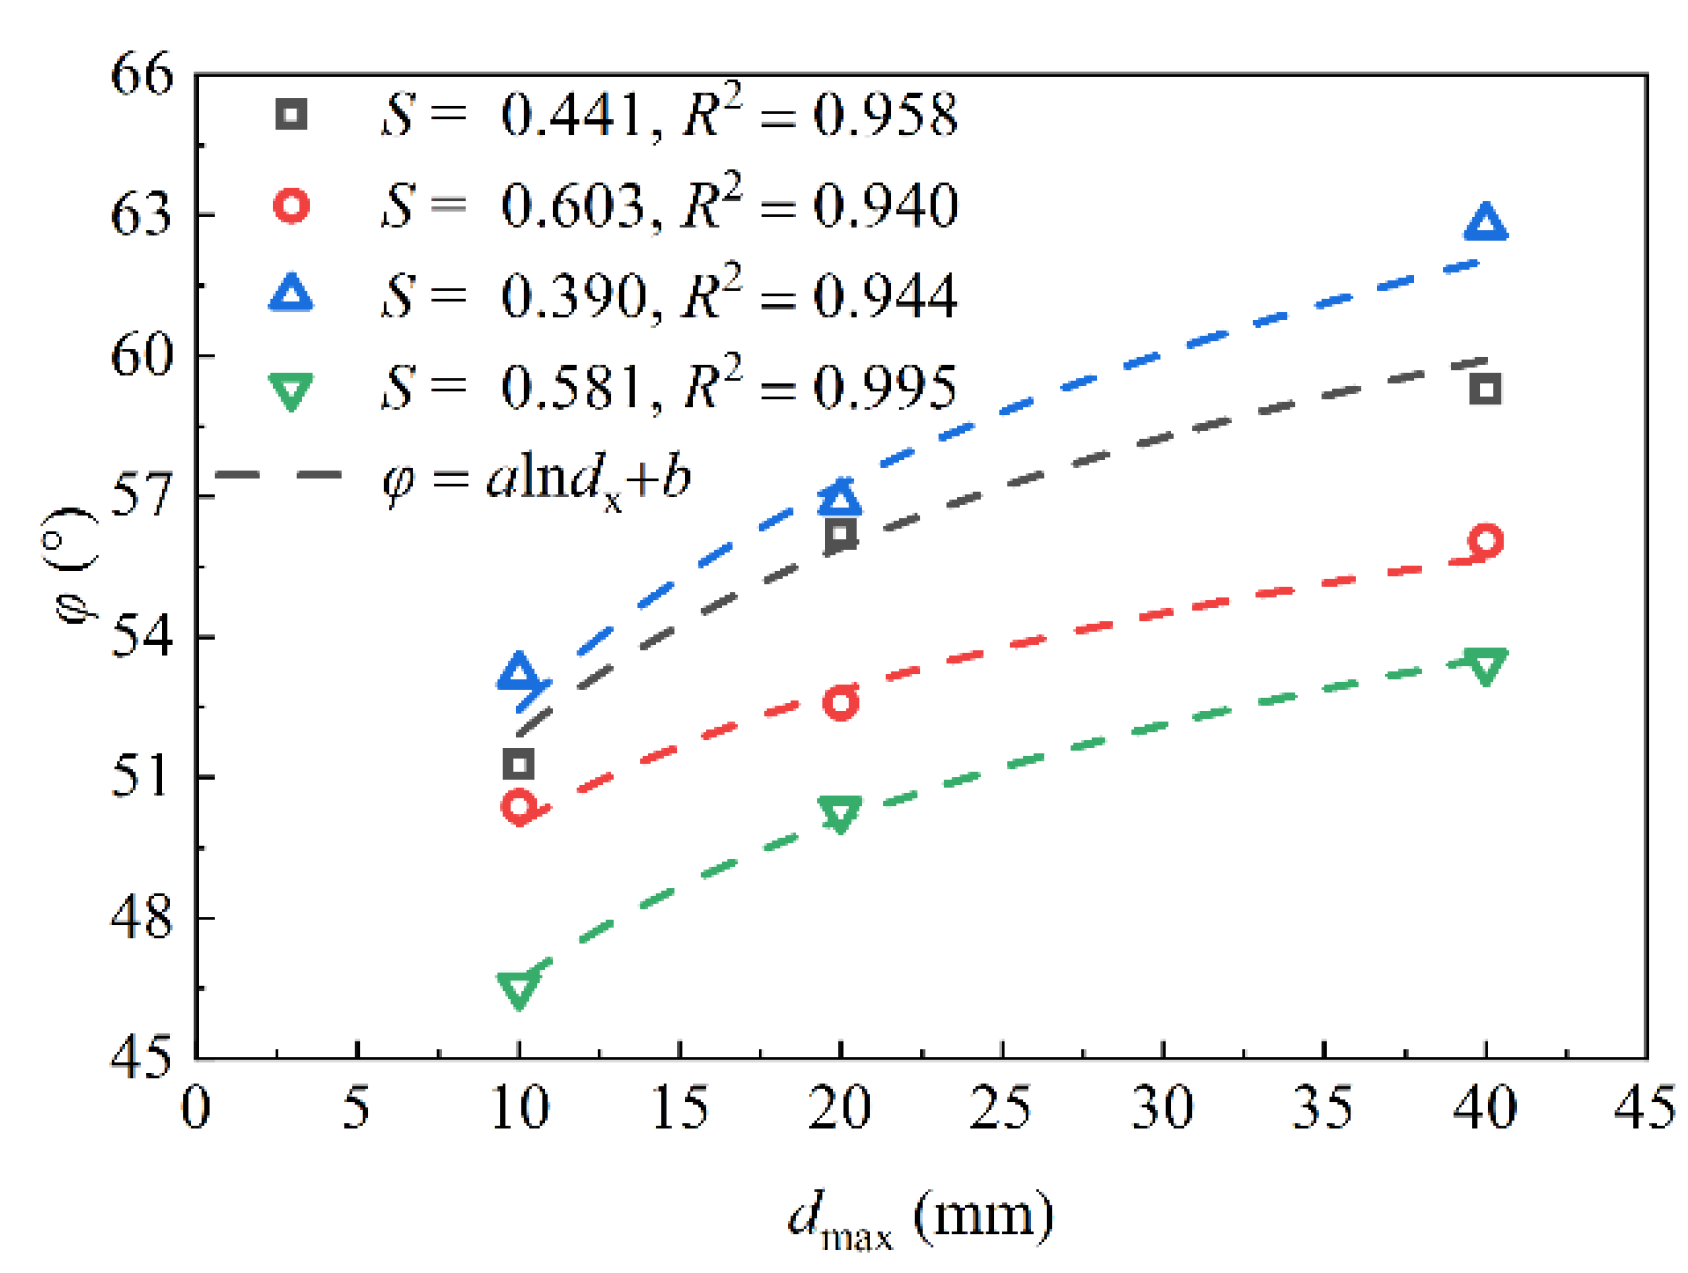
- When the grading area is fixed such that the gradation structure is unchanged, the cohesion c and internal friction angle φ gradually increase with increases in the maximum particle size dmax; furthermore, c and φ are logarithmic functions of dmax;
- (3)
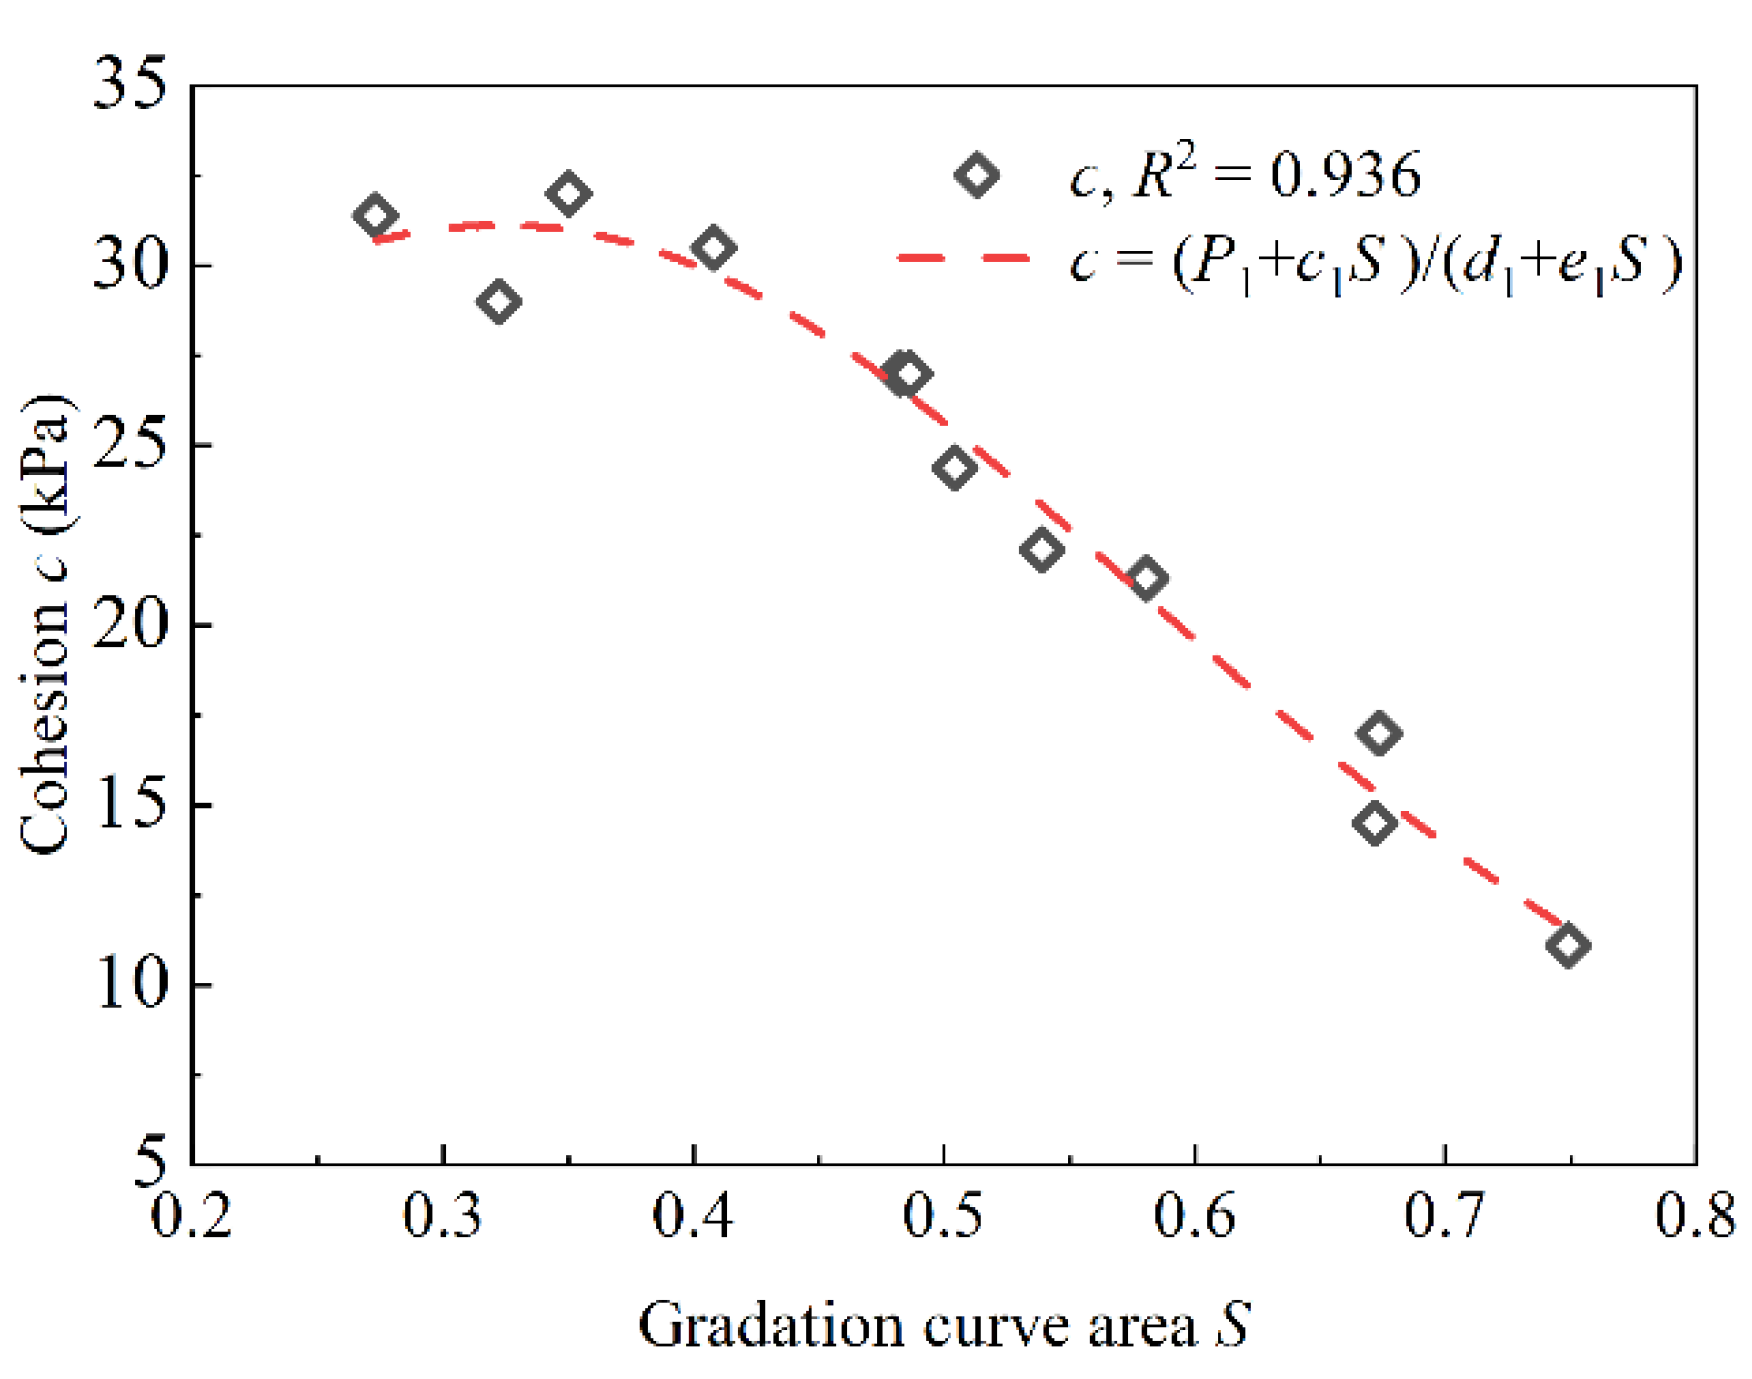
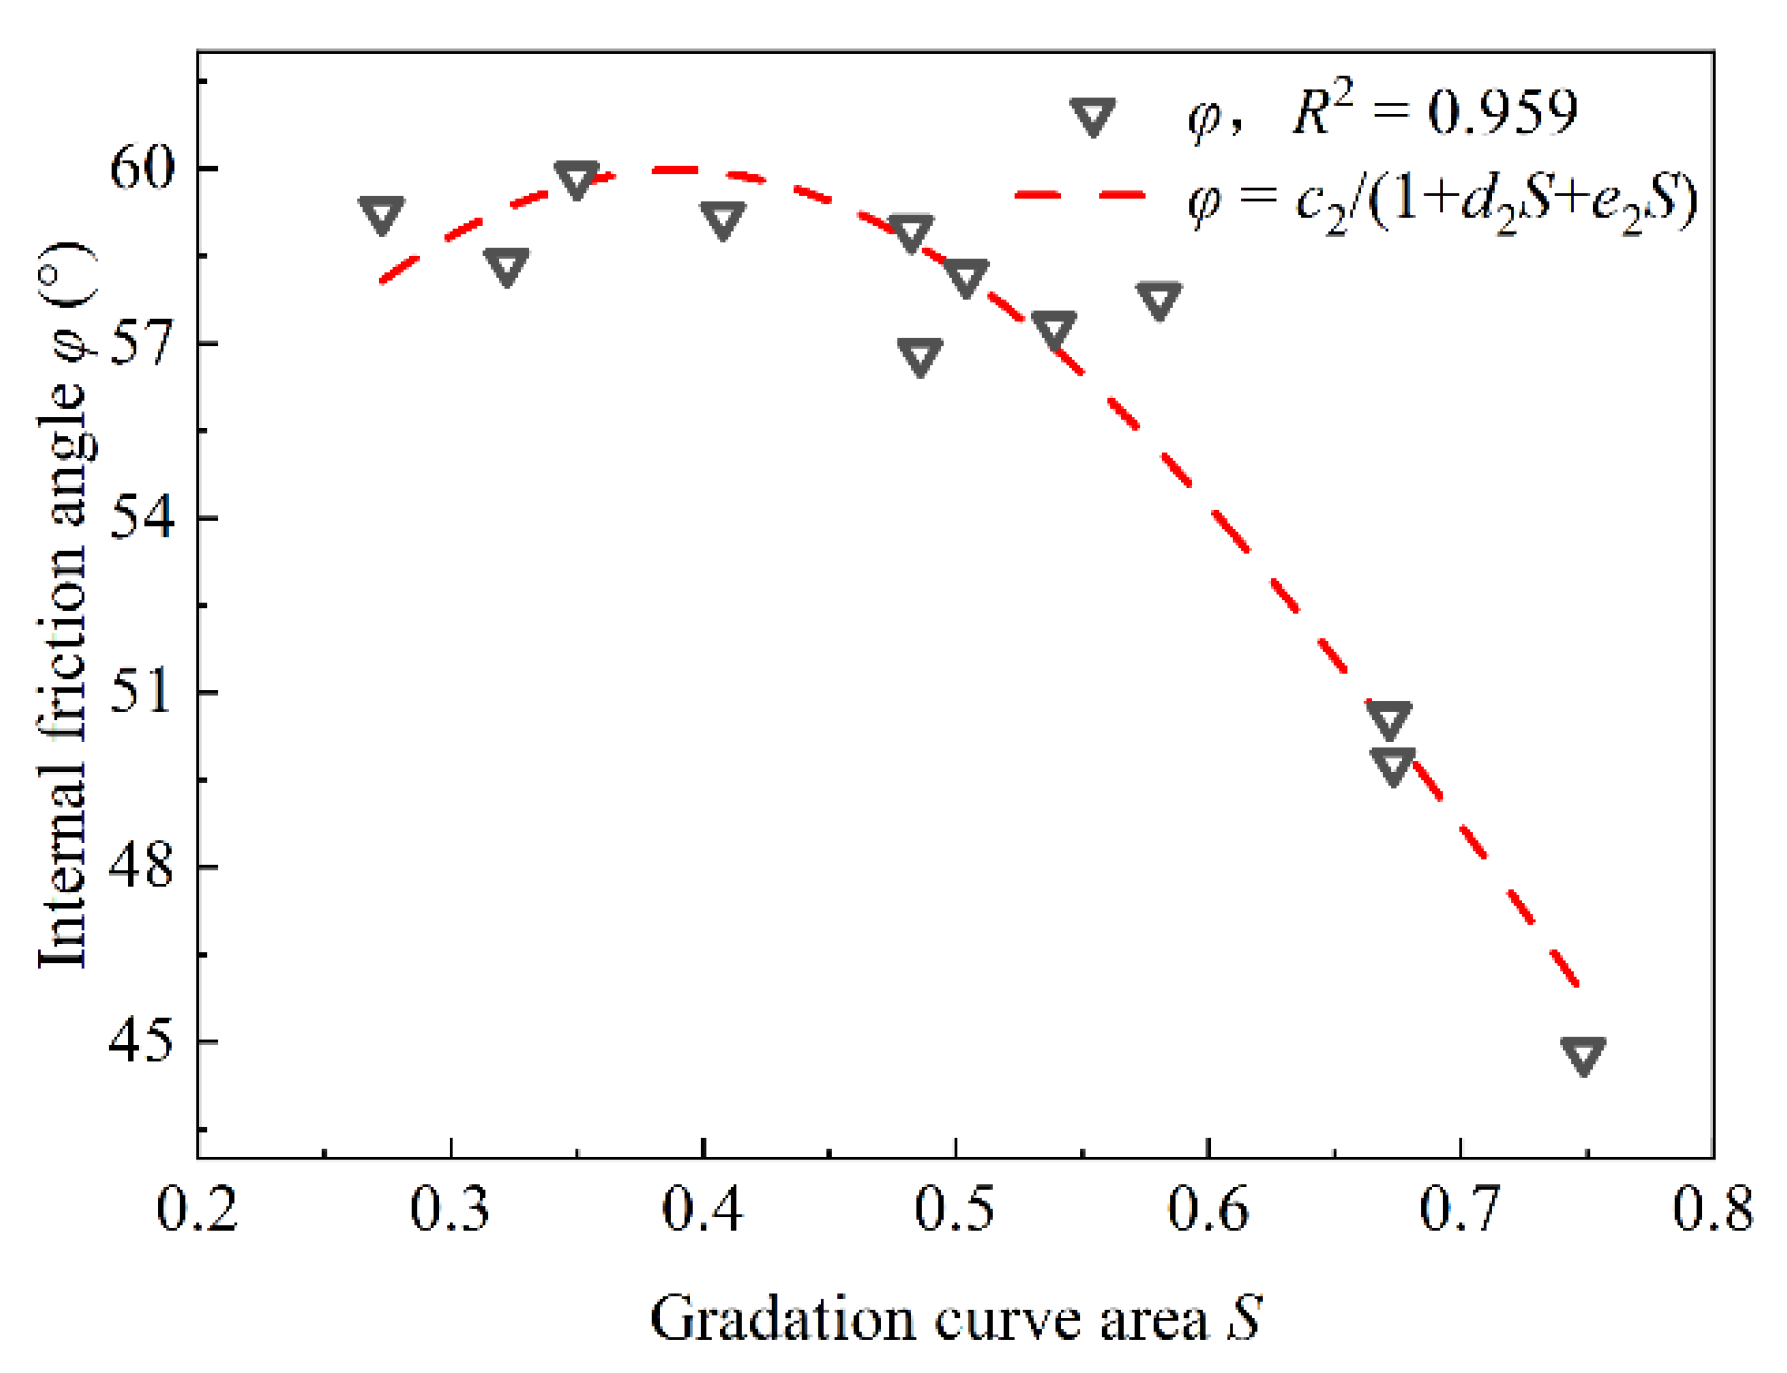
- If the maximum particle size dmax is constant, the cohesion and internal friction angle increase rapidly with the reduction of grading area S and decrease slightly after reaching a certain level. The relationships between c, φ, and grading area S are established;
- (4)
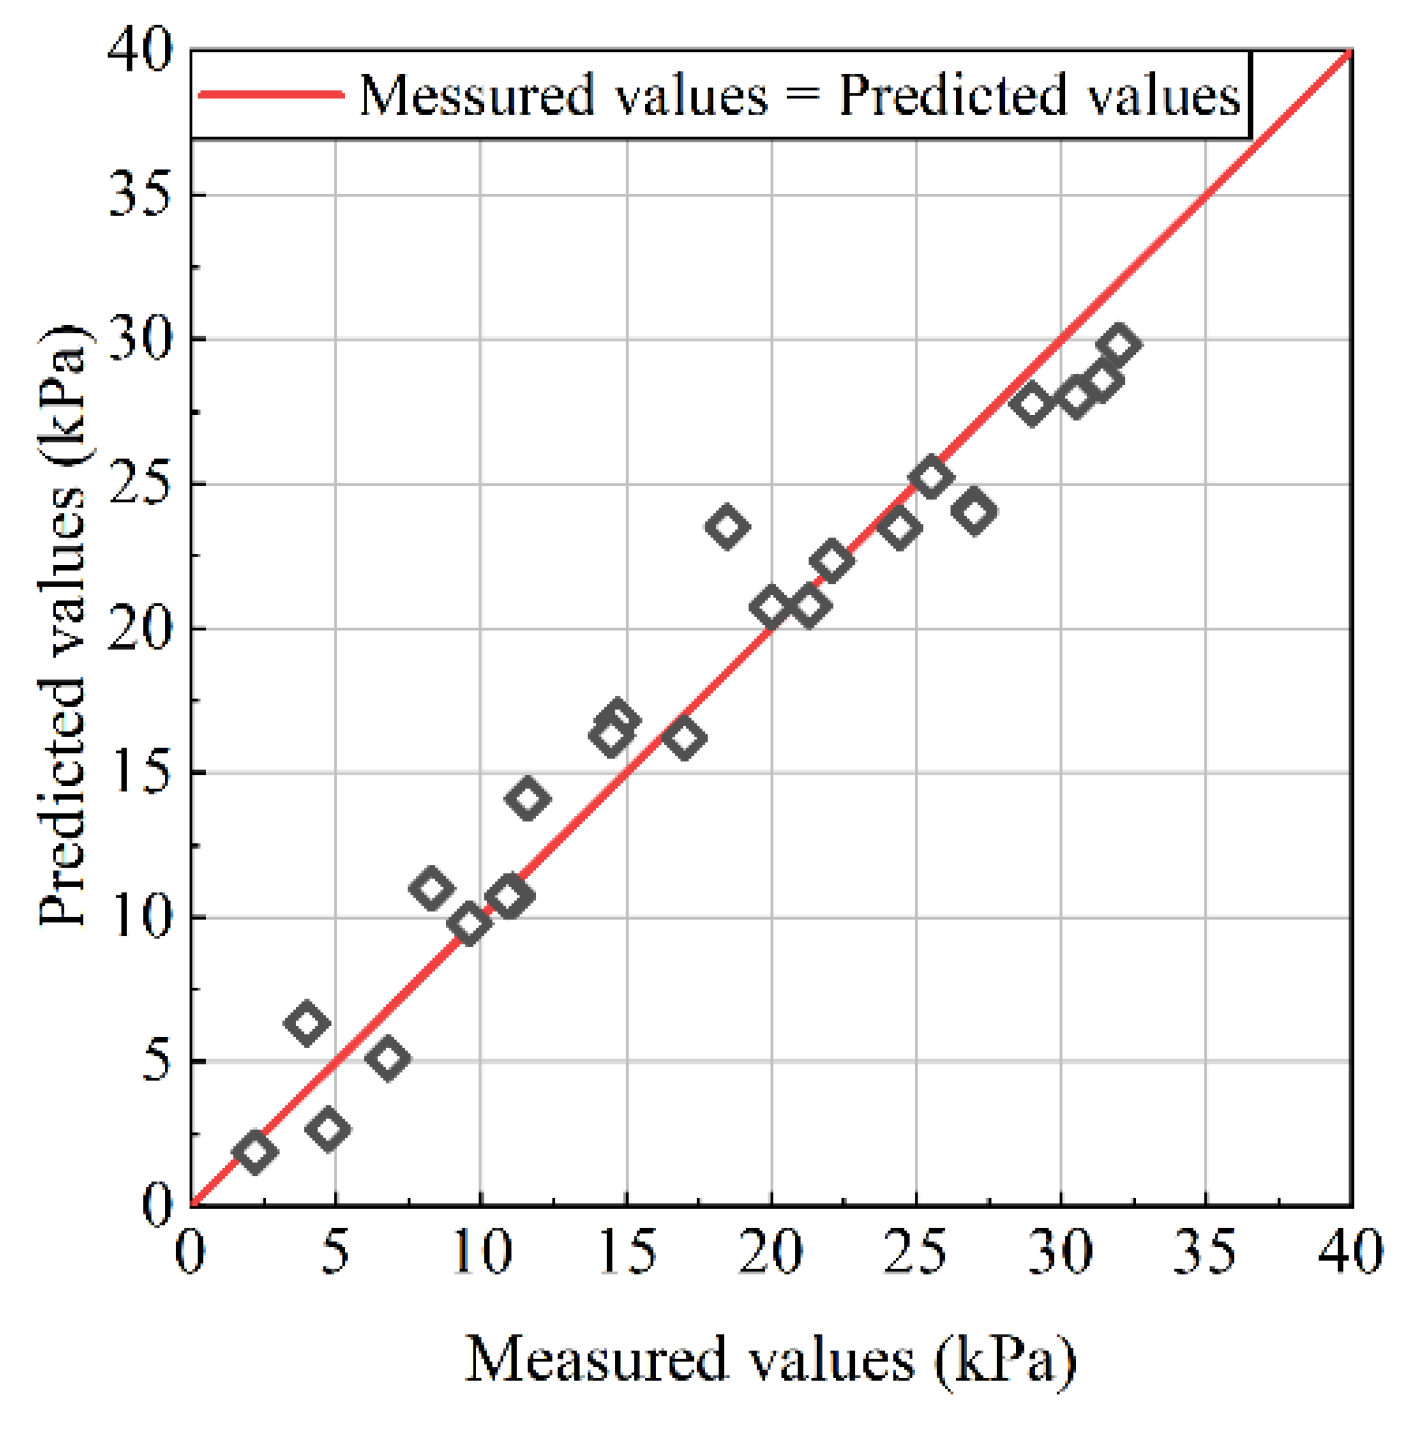
- A new prediction model of the shear strength of CGS considering the influence of the maximum particle size dmax and the gradation structure is established. The reliability of the model to predict the shear strength of arbitrarily graded CGS is verified through test data in the relevant literature, and the applicability of the model to different types of CGS is also explored.
Author Contributions
Funding
Institutional Review Board Statement
Informed Consent Statement
Data Availability Statement
Acknowledgments
Conflicts of Interest
References
- Cooke, J.B.; Barry, J. Progress in Rockfill Dams. J. Geotech. Eng. 1984, 110, 1381–1414. [Google Scholar] [CrossRef]
- GT/T50123-2019. Standard for Soil Test Method (China); China Planning Press: Beijing, China, 2019. [Google Scholar]
- Zhou, W.; Ma, G.; Liu, J.; Chang, X.; Li, S.; Xu, K. Review of macro- and mesoscopic analysis on rockfill materials in high dams. Sci. Sin. Technol. 2018, 48, 1068–1080. [Google Scholar] [CrossRef]
- Wei, K.M.; Zhu, S.; Yu, X.H. Influence of the scale effect on the mechanical parameters of coarse-grained soils. Iran. J. Sci. Technol. Trans. Civ. Eng. 2014, 38, 75–84. [Google Scholar]
- Springman, S.M.; Jommi, C.; Teysseire, P. Instabilities on moraine slopes induced by loss of suction: A case history. Géotechnique 2003, 53, 3–10. [Google Scholar] [CrossRef]
- Chang, W.-J.; Phantachang, T. Effects of gravel content on shear resistance of gravelly soils. Eng. Geol. 2016, 207, 78–90. [Google Scholar] [CrossRef]
- Marsal, R.J. Large Scale Testing of Rockfill Materials. J. Soil Mech. Found. Div. 1967, 93, 27–43. [Google Scholar] [CrossRef]
- Marschi, N.D.; Chan, C.K.; Seed, H.B. Evaluation of Properties of Rockfill Materials. J. Soil Mech. Found. Div. 1972, 98, 95–114. [Google Scholar] [CrossRef]
- Varadarajan, A.; Sharma, K.G.; Venkatachalam, K.; Gupta, A.K. Testing and Modeling Two Rockfill Materials. J. Geotech. Geoenviron. Eng. 2003, 129, 206–218. [Google Scholar] [CrossRef]
- Gupta, A.K. Effect of particle size and confining pressure on breakage and strength parameters of rockfill materials. Electron. J. Geotech. Eng. 2016, 8, 378–388. [Google Scholar]
- Li, N.H.; Mi, T.; Mi, Z.K. Strength and deformation properties of transition zone material of Xiaolangdi dam and scale effect. Water Resour. Pow. 2001, 2, 39–42. [Google Scholar]
- Kim, D.; Ha, S. Effects of Particle Size on the Shear Behavior of Coarse Grained Soils Reinforced with Geogrid. Materials 2014, 7, 963–979. [Google Scholar] [CrossRef] [PubMed] [Green Version]
- Lee, D.M. The Angles of Friction of Granular Fills; University of Cambridge: Cambridge, UK, 1992; pp. 24–36. [Google Scholar]
- Suits, L.D.; Sheahan, T.C.; Hu, W.; Dano, C.; Hicher, P.-Y.; Le Touzo, J.-Y.; Derkx, F.; Merliot, E. Effect of Sample Size on the Behavior of Granular Materials. Geotech. Test. J. 2011, 34, 186–197. [Google Scholar] [CrossRef]
- Xu, D.-S.; Tang, J.-Y.; Zou, Y.; Rui, R.; Liu, H.-B. Macro and micro investigation of gravel content on simple shear behavior of sand-gravel mixture. Constr. Build. Mater. 2019, 221, 730–744. [Google Scholar] [CrossRef]
- Wei, H.Z.; Wang, N.; Hu, M.J.; Zhao, H.Y.; Xu, X.Y. Strength behavior of gravelly soil with different coarse-grained contents in Jiangjiagou Ravine. Rock Soil Mech. 2008, 1, 48–51. [Google Scholar]
- Simoni, A.; Houlsby, G. The Direct Shear Strength and Dilatancy of Sand–gravel Mixtures. Geotech. Geol. Eng. 2006, 24, 523–549. [Google Scholar] [CrossRef]
- Li, Z.; Xing, Y.C. Effects of dry density and percent fines on shearing strength of sandy cobble and broken stone. Rock Soil Mech. 2006, 27, 2255–2260. [Google Scholar]
- Bernhardt, M.L.; Biscontin, G.; O’Sullivan, C. Experimental validation study of 3D direct simple shear DEM simulations. Soils Found. 2016, 56, 336–347. [Google Scholar] [CrossRef]
- Cui, L.; Cao, W.; Sheng, Q.; Xie, M.; Yang, T.; Xiao, P. Analysis of Layered Geogrids–Sand–Clay Reinforced Structures under Triaxial Compression by Discrete Element Method. Appl. Sci. 2021, 11, 9952. [Google Scholar] [CrossRef]
- Cundall, P.A.; Strack, O.D.L. A discrete numerical model for granular assemblies. Géotechnique 1979, 29, 47–65. [Google Scholar] [CrossRef]
- Frossard, E.; Hu, W.; Dano, C.; Hicher, P.Y. Rockfill shear strength evaluation: A rational method based on size effects. Géotechnique 2012, 62, 415–427. [Google Scholar] [CrossRef] [Green Version]
- Zhou, W.; Ma, G.; Chang, X.; Zhou, C. Influence of Particle Shape on Behavior of Rockfill Using a Three-Dimensional Deformable DEM. J. Eng. Mech. 2013, 139, 1868–1873. [Google Scholar] [CrossRef]
- Sitharam, T.G.; Nimbkar, M.S. Micromechanical Modelling of Granular Materials: Effect of Particle Size and Gradation. Geotech. Geol. Eng. 2000, 18, 91–117. [Google Scholar] [CrossRef]
- Guo, W.-L.; Zhu, J.-G.; Chen, S.-S.; Yu, T. Applications of a gradation equation in coarse-grained soils. Proc. Inst. Civ. Eng.—Geotech. Eng. 2019, 172, 453–462. [Google Scholar] [CrossRef]
- Wu, E.-L.; Zhu, J.-G.; Chen, G.; Wang, L. Experimental study of effect of gradation on compaction properties of rockfill materials. Bull. Int. Assoc. Eng. Geol. 2020, 79, 2863–2869. [Google Scholar] [CrossRef]
- Zhu, J.-G.; Guo, W.-L.; Wen, Y.-F.; Yin, J.-H.; Zhou, C. New Gradation Equation and Applicability for Particle-Size Distributions of Various Soils. Int. J. Géoméch. 2018, 18, 04017155. [Google Scholar] [CrossRef]
- Wu, E.-L.; Zhu, J.-G.; Chen, G.; Bao, M.-D.; Guo, W.-L. Gradation equation of coarse-grained soil and its applicability. J. Cent. South Univ. 2020, 27, 911–919. [Google Scholar] [CrossRef]
- Wu, L.Q.; Ye, F.; Li, W.Q. Experimental study on scale effect of mechanical properties of rockfill materials. Chin. J. Geotech. Eng. 2020, 42, 141–145. [Google Scholar]


| No. | dmax/mm | n | e | S |
|---|---|---|---|---|
| A1-4 | 40 | 1.0 | 0.6 | 0.539 |
| A2-4 | 40 | 1.0 | −0.2 | 0.350 |
| A3-4 | 40 | 1.0 | −1.0 | 0.273 |
| A4-4 | 40 | 0.8 | 0.3 | 0.504 |
| A5-4 | 40 | 0.8 | −0.2 | 0.408 |
| A6-4 | 40 | 0.8 | −1.0 | 0.322 |
| A7-4 | 40 | 0.6 | 0.6 | 0.673 |
| A8-4 | 40 | 0.6 | 0.3 | 0.581 |
| A9-4 | 40 | 0.6 | −0.2 | 0.482 |
| A10-4 | 40 | 0.4 | 0.6 | 0.749 |
| A11-4 | 40 | 0.4 | 0.3 | 0.672 |
| A12-4 | 40 | 0.4 | −1.0 | 0.486 |
| D1-4 | 40 | 1.0 | 0.3 | 0.441 |
| D1-2 | 20 | 1.0 | 0.3 | 0.441 |
| D1-1 | 10 | 1.0 | 0.3 | 0.441 |
| D2-4 | 40 | 0.8 | 0.6 | 0.603 |
| D2-2 | 20 | 0.8 | 0.6 | 0.603 |
| D2-1 | 10 | 0.8 | 0.6 | 0.603 |
| D3-4 | 40 | 0.6 | −1.0 | 0.390 |
| D3-2 | 20 | 0.6 | −1.0 | 0.390 |
| D3-1 | 10 | 0.6 | −1.0 | 0.390 |
| D4-4 | 40 | 0.4 | −0.2 | 0.581 |
| D4-2 | 20 | 0.4 | −0.2 | 0.581 |
| D4-1 | 10 | 0.4 | −0.2 | 0.581 |
| No. | ρmin/(g·cm3) | ρmin/(g·cm3) | Dr | ρ0/(g·cm3) |
|---|---|---|---|---|
| A1-4 | 1.905 | 2.163 | 0.8 | 2.106 |
| A2-4 | 1.815 | 1.994 | 0.8 | 1.955 |
| A3-4 | 1.750 | 1.959 | 0.8 | 1.913 |
| A4-4 | 1.878 | 2.122 | 0.8 | 2.068 |
| A5-4 | 1.838 | 2.049 | 0.8 | 2.003 |
| A6-4 | 1.782 | 1.961 | 0.8 | 1.922 |
| A7-4 | 1.877 | 2.171 | 0.8 | 2.105 |
| A8-4 | 1.909 | 2.197 | 0.8 | 2.133 |
| A9-4 | 1.894 | 2.127 | 0.8 | 2.076 |
| A10-4 | 1.846 | 2.139 | 0.8 | 2.073 |
| A11-4 | 1.899 | 2.199 | 0.8 | 2.132 |
| A12-4 | 1.897 | 2.149 | 0.8 | 2.093 |
| D1-4 | 1.833 | 2.106 | 0.8 | 2.045 |
| D1-2 | 1.774 | 2.051 | 0.8 | 1.989 |
| D1-1 | 1.641 | 1.962 | 0.8 | 1.888 |
| D2-4 | 2.086 | 2.426 | 0.8 | 2.349 |
| D2-2 | 1.908 | 2.252 | 0.8 | 2.174 |
| D2-1 | 1.741 | 2.115 | 0.8 | 2.028 |
| D3-4 | 1.906 | 2.155 | 0.8 | 2.100 |
| D3-2 | 1.830 | 2.104 | 0.8 | 2.043 |
| D3-1 | 1.664 | 2.002 | 0.8 | 1.924 |
| D4-4 | 1.973 | 2.302 | 0.8 | 2.228 |
| D4-2 | 1.842 | 2.199 | 0.8 | 2.117 |
| D4-1 | 1.688 | 2.028 | 0.8 | 1.949 |
| Fitting Parameters of Cohesion | Fitting Parameters of Internal Friction Angle | ||||||||
|---|---|---|---|---|---|---|---|---|---|
| a1 | b1/(kPa) | c1 | d1 | R2 | a2 | b2/(kPa·(°)−1) | c2/(kPa·(°)−1) | d2 | R2 |
| 14.506 | −6.11 | 0.572 | −0.518 | 0.865 | 4.937 | 26.991 | −1.830 | 2.352 | 0.893 |
| In Situ Dimension | Maximum Particle Size dmax | n | e | S | Cohesion/kPa [29] | Internal Friction Angle/(°) [29] |
|---|---|---|---|---|---|---|
| D = 2.3 | 60 | 0.7 | 0.003 | 0.512 | 185.808 | 39.68 |
| 40 | 0.7 | 0.003 | 0.512 | 177.727 | 39.4 | |
| 20 | 0.7 | 0.003 | 0.512 | 153.650 | 35.58 | |
| D = 2.6 | 60 | 0.4 | 0.02 | 0.686 | 204.094 | 41.41 |
| 40 | 0.4 | 0.02 | 0.686 | 200.382 | 41.14 | |
| 20 | 0.4 | 0.02 | 0.686 | 193.541 | 40.1 | |
| D = 2.7 | 60 | 0.3 | 0.09 | 0.779 | 209.852 | 41.72 |
| 40 | 0.3 | 0.09 | 0.779 | 197.401 | 39.78 | |
| 20 | 0.3 | 0.09 | 0.779 | 202.085 | 40.07 |
| Fitting Parameters of Cohesion | Fitting Parameters of Internal Friction Angle | ||||||||
|---|---|---|---|---|---|---|---|---|---|
| a1/(kPa·lnmm−1) | b1/(kPa) | c1 | d1 | R2 | a2/((°)·lnmm−1) | b2/(kPa·(°)−1) | c/(kPa·(°)−1) | d2 | R2 |
| 14.778 | 1412.21 | 3.656 | 4.583 | 0.867 | 2.148 | 15.357 | −1.520 | 1.075 | 0.893 |
Publisher’s Note: MDPI stays neutral with regard to jurisdictional claims in published maps and institutional affiliations. |
© 2022 by the authors. Licensee MDPI, Basel, Switzerland. This article is an open access article distributed under the terms and conditions of the Creative Commons Attribution (CC BY) license (https://creativecommons.org/licenses/by/4.0/).
Share and Cite
Li, S.; Wang, T.; Wang, H.; Jiang, M.; Zhu, J. Experimental Studies of Scale Effect on the Shear Strength of Coarse-Grained Soil. Appl. Sci. 2022, 12, 447. https://doi.org/10.3390/app12010447
Li S, Wang T, Wang H, Jiang M, Zhu J. Experimental Studies of Scale Effect on the Shear Strength of Coarse-Grained Soil. Applied Sciences. 2022; 12(1):447. https://doi.org/10.3390/app12010447
Chicago/Turabian StyleLi, Shuya, Tiancheng Wang, Hao Wang, Mingjie Jiang, and Jungao Zhu. 2022. "Experimental Studies of Scale Effect on the Shear Strength of Coarse-Grained Soil" Applied Sciences 12, no. 1: 447. https://doi.org/10.3390/app12010447