1. Introduction
The increase in the urban population, the escalating demand for high-rise buildings, and railway construction projects used to resolve transportation problems have led to an increase in the various types of construction works adjacent to the existing tracks of serviced railway lines. In particular, the tunnel excavation work conducted under the serviced railway lines in the downtown area is a key process directly related to the safety of all the phases of the railway construction project management. Therefore, in the case of adjacent excavation under the in-service railway structure, it is imperative to secure the stability and normal operation of the railway infrastructure. In addition, because the relative displacement of the railway infrastructure may occur due to adjacent underground excavations, the analysis of track irregularities is necessary.
A previous study by Chung et al. [
1] investigated an evaluation method of the track deformation in the ballasted tracks on serviced railway lines with respect to adjacent excavation and assessed the impact of the irregularities in the track of the serviced railway line with respect to the excavation adjacent to the railway infrastructure. Choi [
2] performed a qualitative analysis on the dynamic behavior of the ballasted tracks and presented a dynamic model for the analysis of the Wheel-Rail-interaction-force analysis. The analysis demonstrated that the Wheel-Rail interaction force can be significantly changed due to track irregularities, and the results of experiments and a numerical analysis showed that the train speed was the main parameter. Hwang analyzed the effects of track irregularities on the dynamic wheel load of concrete tracks by applying the track irregularities measured in the section with track support stiffness changes in which a considerable vertical profile displacement occurred in the concrete tracks [
3]. Choi et al. conducted a study to analyze ground subsidence according to the tunnel passage in a geologically vulnerable zone [
4]. The analysis investigated the ground subsidence and deformation in the existing urban railway infrastructure due to the weakened ground conditions from the adjacent tunnel excavation. The results showed that deformation in the vertical direction was dominant in the case of the railway infrastructure in the geologically vulnerable section. Lee, Choi et al., and Cho investigated the improvement method of an automated measurement and evaluation system, deformation of serviced railway line track, deformation of tunnel structure, and deformation of subway structure according to the adjacent excavation [
5,
6,
7]. Knothe analyzed the definition of track irregularities and the effects of track irregularities on rolling stock-track interactions [
8]. Wang et al. proposed a disturbance rejection through a controller-optimization method for disturbances induced by track irregularities that are caused by track deformation and installation errors on a maglev line [
9]. Urda et al. quantified the irregularities of the railroad track using an automatic recording vehicle and confirmed that the values measured by the automatic recording vehicle and the values measured by the manual-measuring method agreed closely [
10]. Ramos et al. compared the short- and long-term behaviors based on laboratory experiments and numerical analysis in order to verify the performance of ballasted and concrete tracks subjected to periodic loads [
11]. As a result, the numerical-analysis and the experimental outcomes were consistent. Munoz et al. developed a Kalman-filtering-based methodology to monitor the lateral track irregularities [
12]. The Kalman-filter-based strategy showed high accuracy and robustness when a systematic parametric analysis was performed based on a highly simplified linear bogie model and was able to capture the most relevant dynamic behavior.
This study aims to evaluate the impact of track irregularities on ballasted tracks on serviced railway lines due to adjacent excavations. The automatically measured data using the railbed-settlement-monitoring sensor (RM sensor), the track-irregularity data measured using a track-geometry-measurement system (Track master), and the precise three-dimensional (3D) numerical-analysis results were compared in order to analyze the effects of track irregularities on the ballasted tracks on in-service railway lines.
2. Numerical Analysis
2.1. Overview
In this study, a numerical analysis based on a 3D continuum was performed to evaluate the stability of railway structures following adjacent excavation under subway and high-speed railway lines. The GTS NX of MIDAS, the finite-element-analysis software for geotechnical analysis, was used for the numerical analyses [
13].
In order to examine the effects on railway track structures according to the phase of the tunnel excavation work being performed in close proximity to existing subway lines, high-speed railway lines and railway structures, a damage assessment of railway structures, an analysis of track irregularities, a structural analysis and a tunnel-stability analysis were conducted [
5,
14].
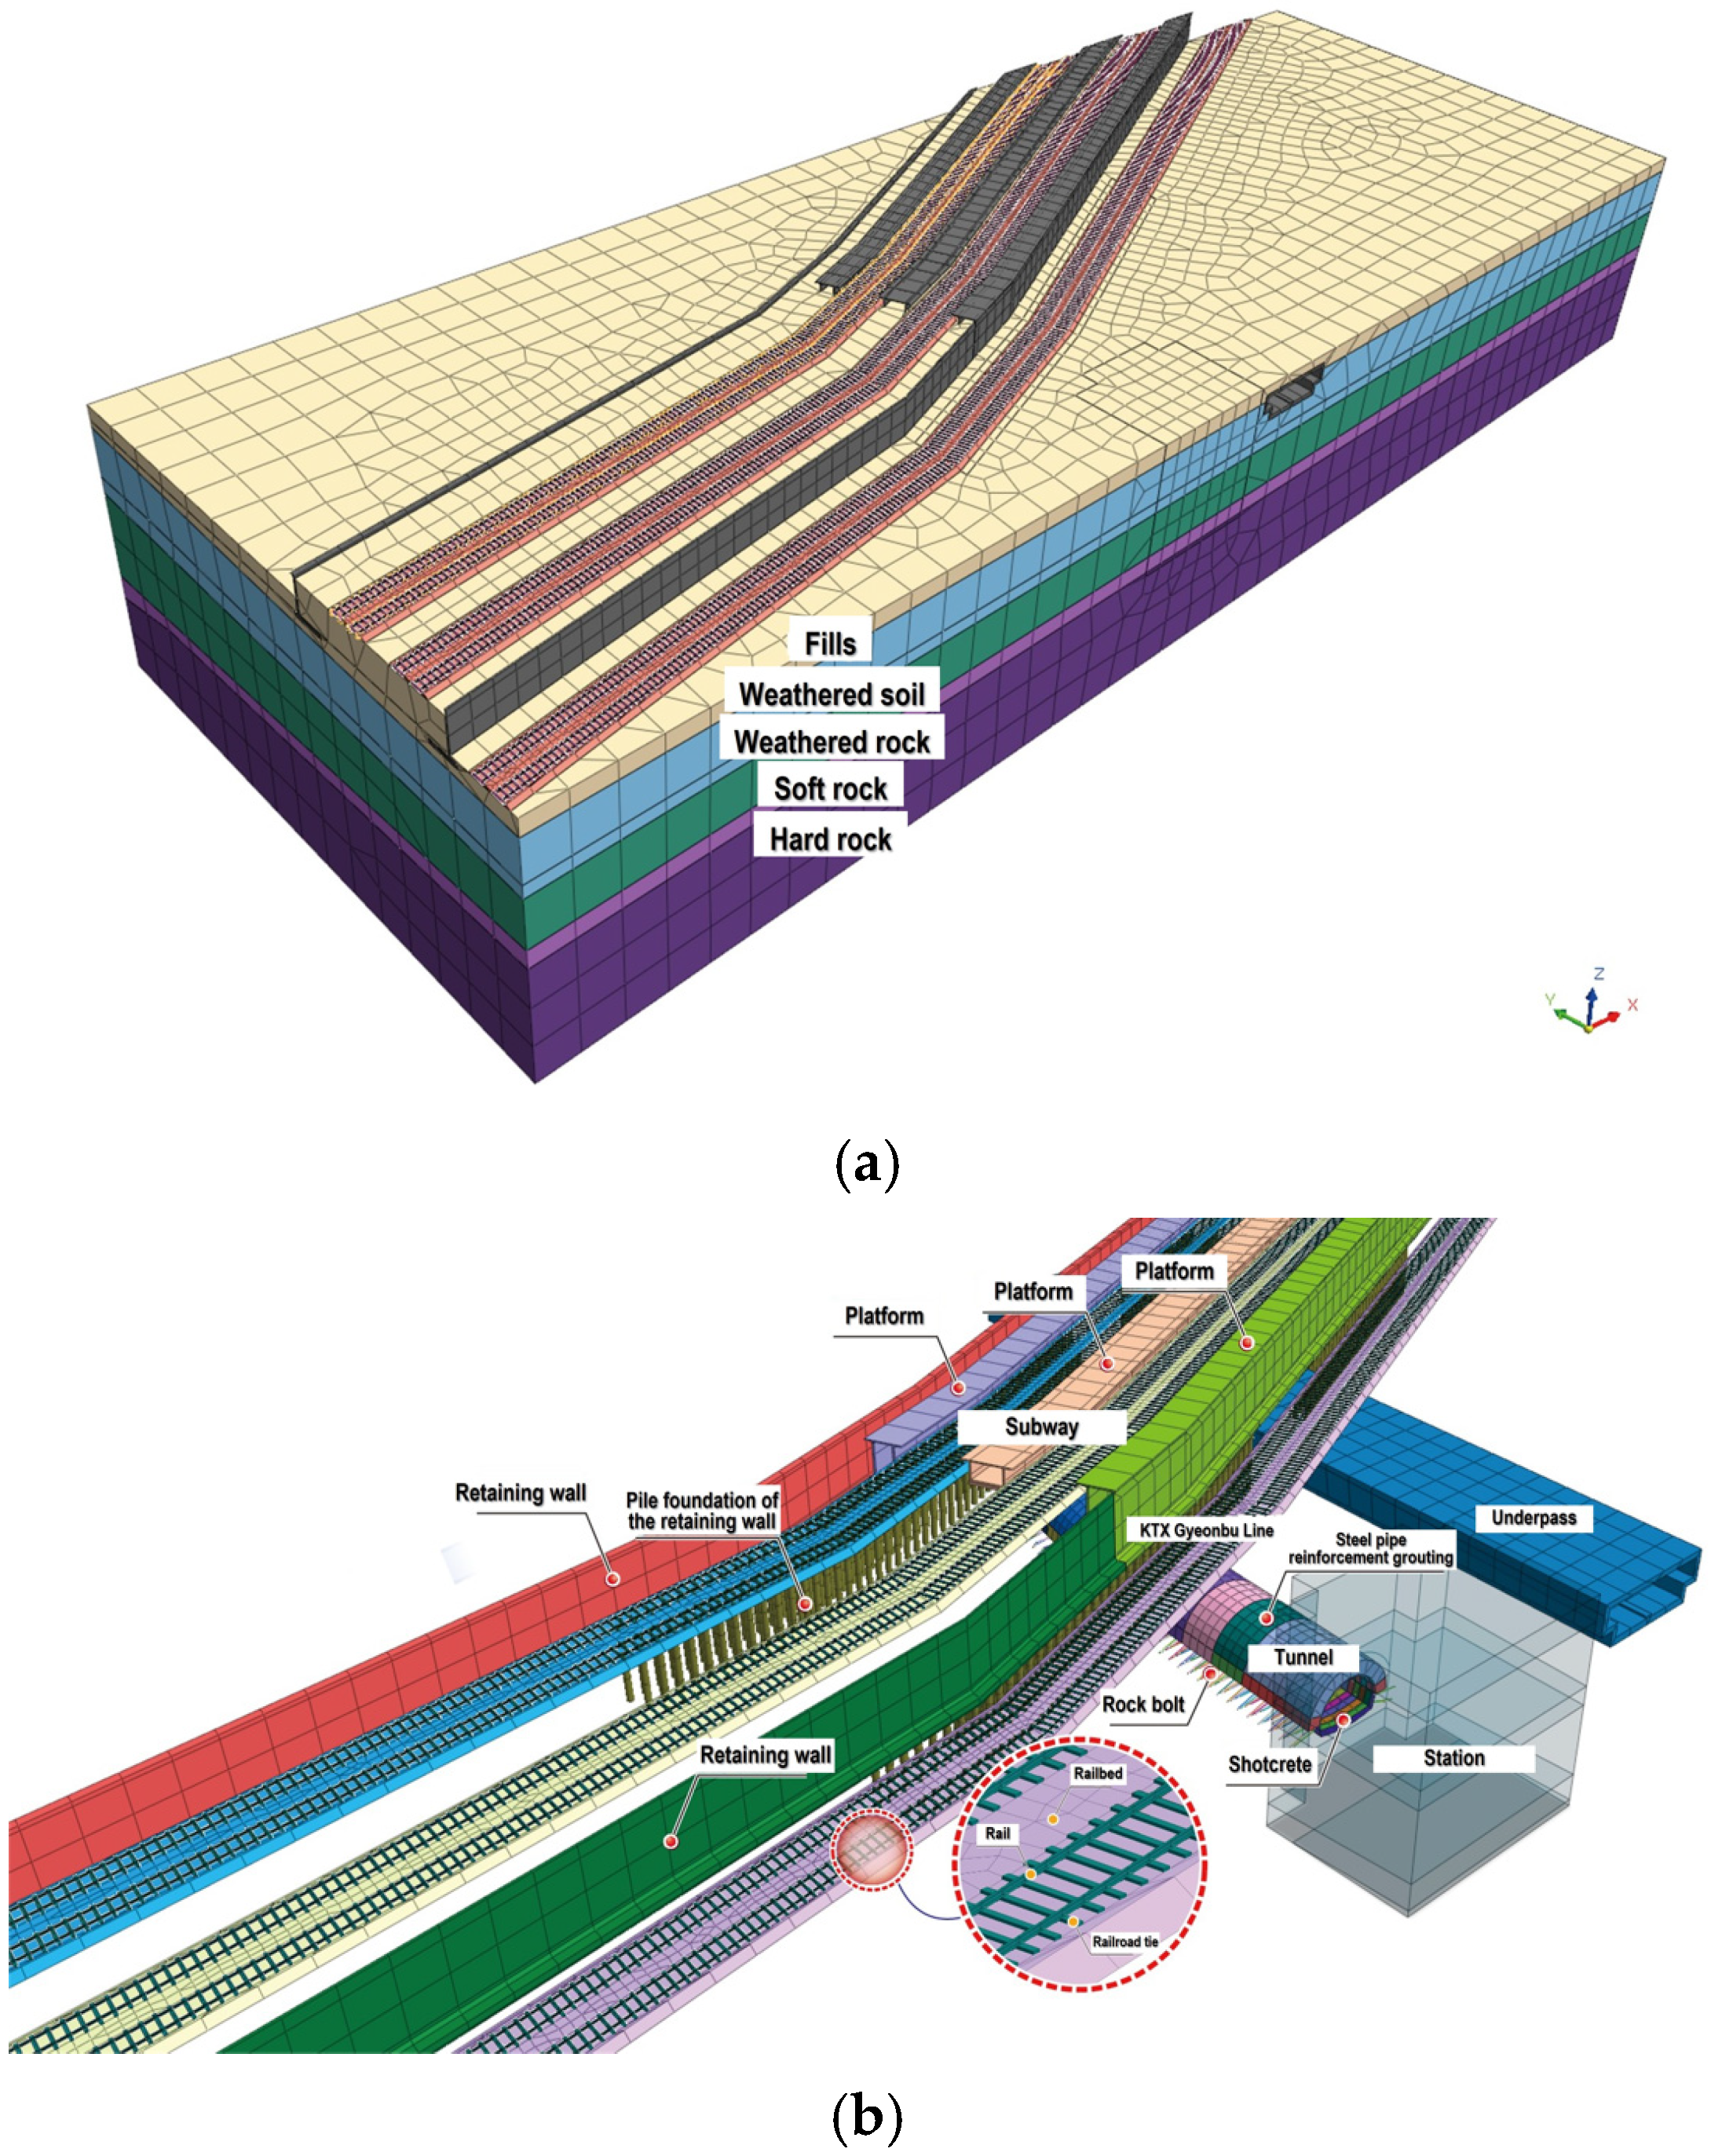
The adjacent excavation section was located at a distance of 24.66 m from the subway line and 17.89 m from the high-speed railway line. Specifically, the distance to the pile foundation of the retaining wall was 6.75 m, and the distance to the pile foundation of the platform was 5.60 m, which were very close to the site. In addition, the ground conditions where subway lines and underpass structures had been installed at locations at which the soil section and the ground conditions of the adjacent excavation section were the weathered rock section. Regarding the boundary conditions, the horizontal and vertical displacements of both lower edges were constrained, while the horizontal displacement of the lower boundary surface was unconstrained, and the vertical displacement was constrained. In addition, for the left and right boundary surfaces, the horizontal displacement was constrained and the vertical displacement was unconstrained.
In the numerical analysis, the analyzed area should have a sufficient range in order to minimize the range of influences induced by the excavation stage. The lateral analysis range is the same as those on the left and right parts of the tunnel, and it is affected by the initial stress state (lateral pressure coefficient) of the ground.
Kulhawy suggested that the range of the analysis was decreased by more than three times the tunnel diameter in order to eliminate any effects attributed to the boundary conditions on the numerical-analysis results of the tunnels [
15].
The numerical-analysis area used had at least four times the diameter of the tunnel (from the bottom part to the lower part of the tunnel). The tunnel side used had a length which was more than four times the tunnel diameter from the side of the tunnel. The upper part of the tunnel was modeled up to the ground surface. The coefficient of lateral earth pressure (K
o) of the soil section was applied at 0.5 considering the ground survey data, and the K
o of the rock section was applied at 1.0.
Figure 1 shows a schematic of the 3D numerical modeling.
The railroad tie and the rail share nodes that were used to implement one-body behavior, and the nodes of the railroad tie and the ballast were composed of tension and compression springs. Compression springs (200 kN/mm) were applied to the compressive behavior from the load of the rolling stock (200 kN/mm), and for the settlement of the subgrade structure under the ballasts, tension springs (20 kN/mm), which are relatively soft, were applied. Even if the upper subgrade structure undergoes settlement, the spring, which functions as a ballast, is extended. Thus, in the modeling, the settlement of the rail was not as large as the settlement of the upper subgrade [
1].
2.2. Analysis of Track Irregularities in Railway Structure
The unmatched deviations in the track geometry on the rail-running surface due to the track deformation from the cyclic loading of the rolling stock are referred to as track irregularities. The types of track irregularities are generally classified in vertical profiles, alignments, twists, cross levels, and gauges.
Table 1 lists the maintenance criteria of track irregularities for high-speed railways in South Korea. For urban railways, the maintenance criteria of track irregularities are set differently for each speed range, but in the case of high-speed railways, there is no classification based on speed.
In the case of ballasted tracks on serviced railway lines, track irregularities may occur during public service of the railway line even before the onset of the adjacent excavations. Whether the speed is 90 km/h or 120 km/h may show a significant difference in terms of the effects of the variation in the load of the rolling stock, depending on the size of the track irregularities.
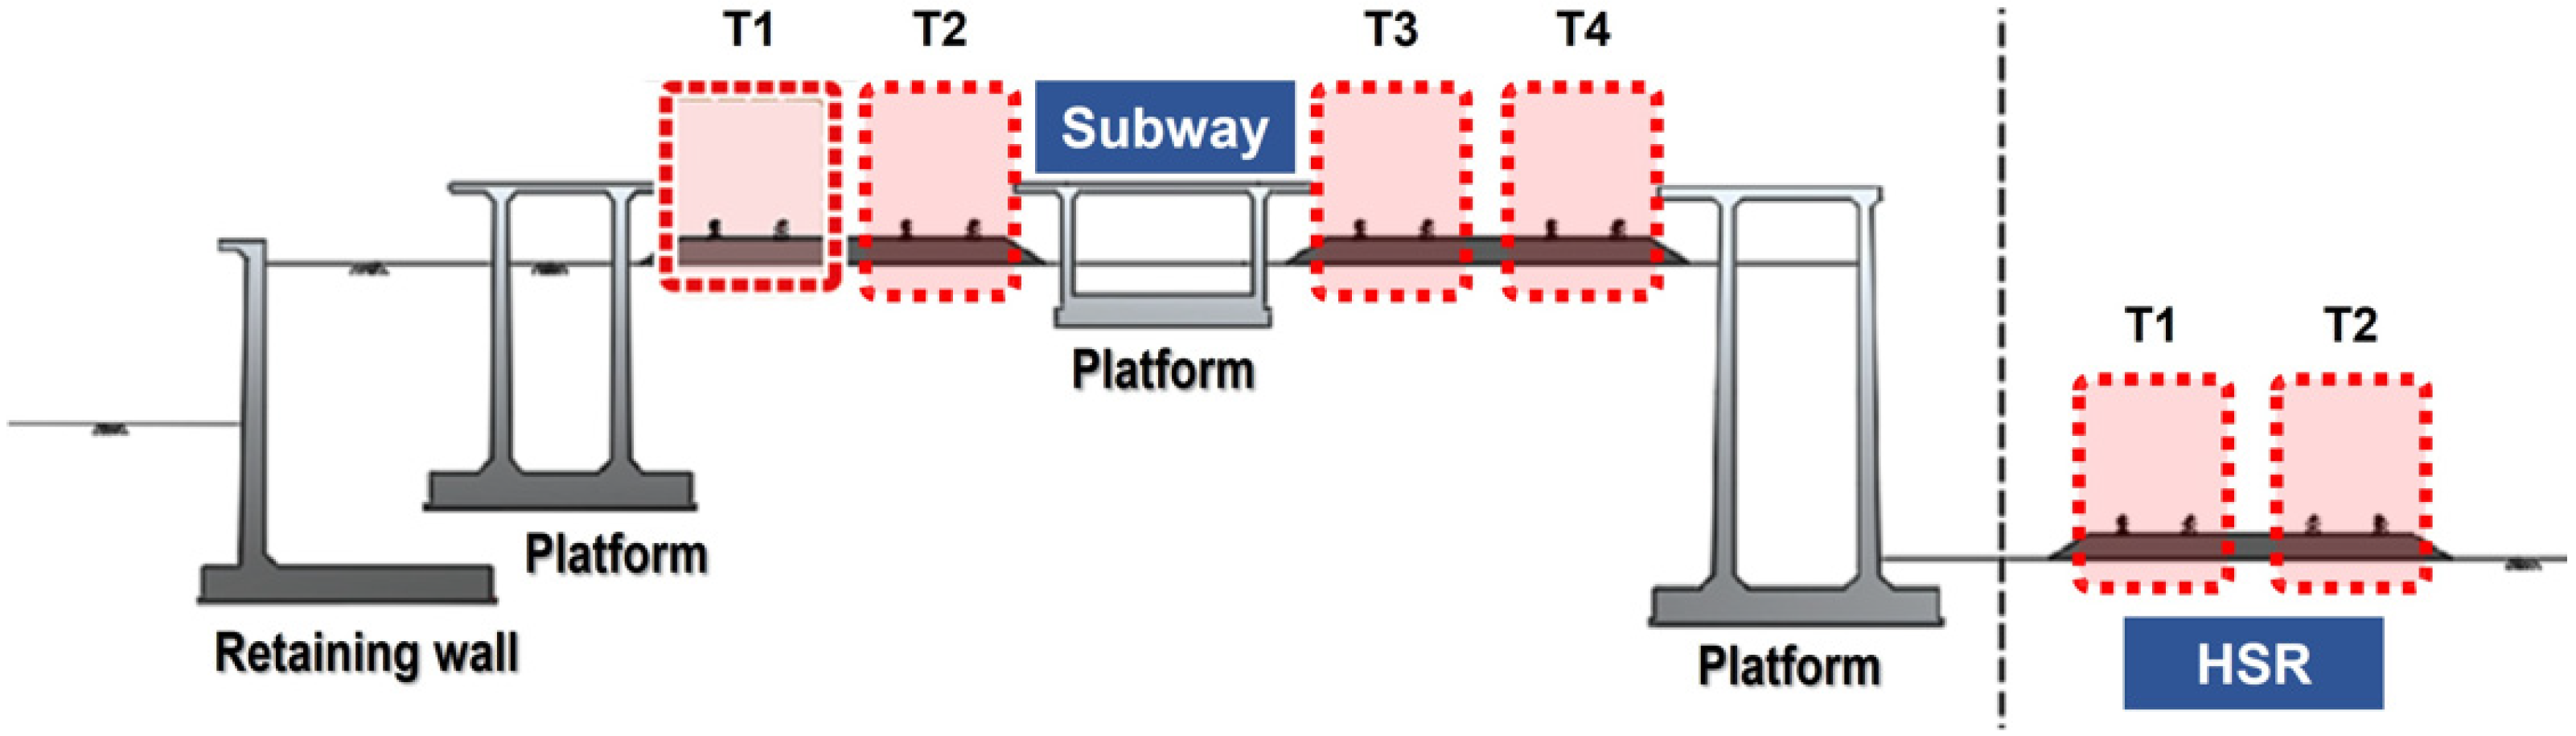
In this study, the effects of track irregularities in the subway line and high-speed railway line were evaluated based on vertical and horizontal displacements of the rails. The locations of evaluation for the subway line and the high-speed railway line are indicated in
Figure 2.
The vertical profile, alignment, cross level, and gauge in the serviced railway line tracks of high-speed railway lines were analyzed according to the adjacent excavation.
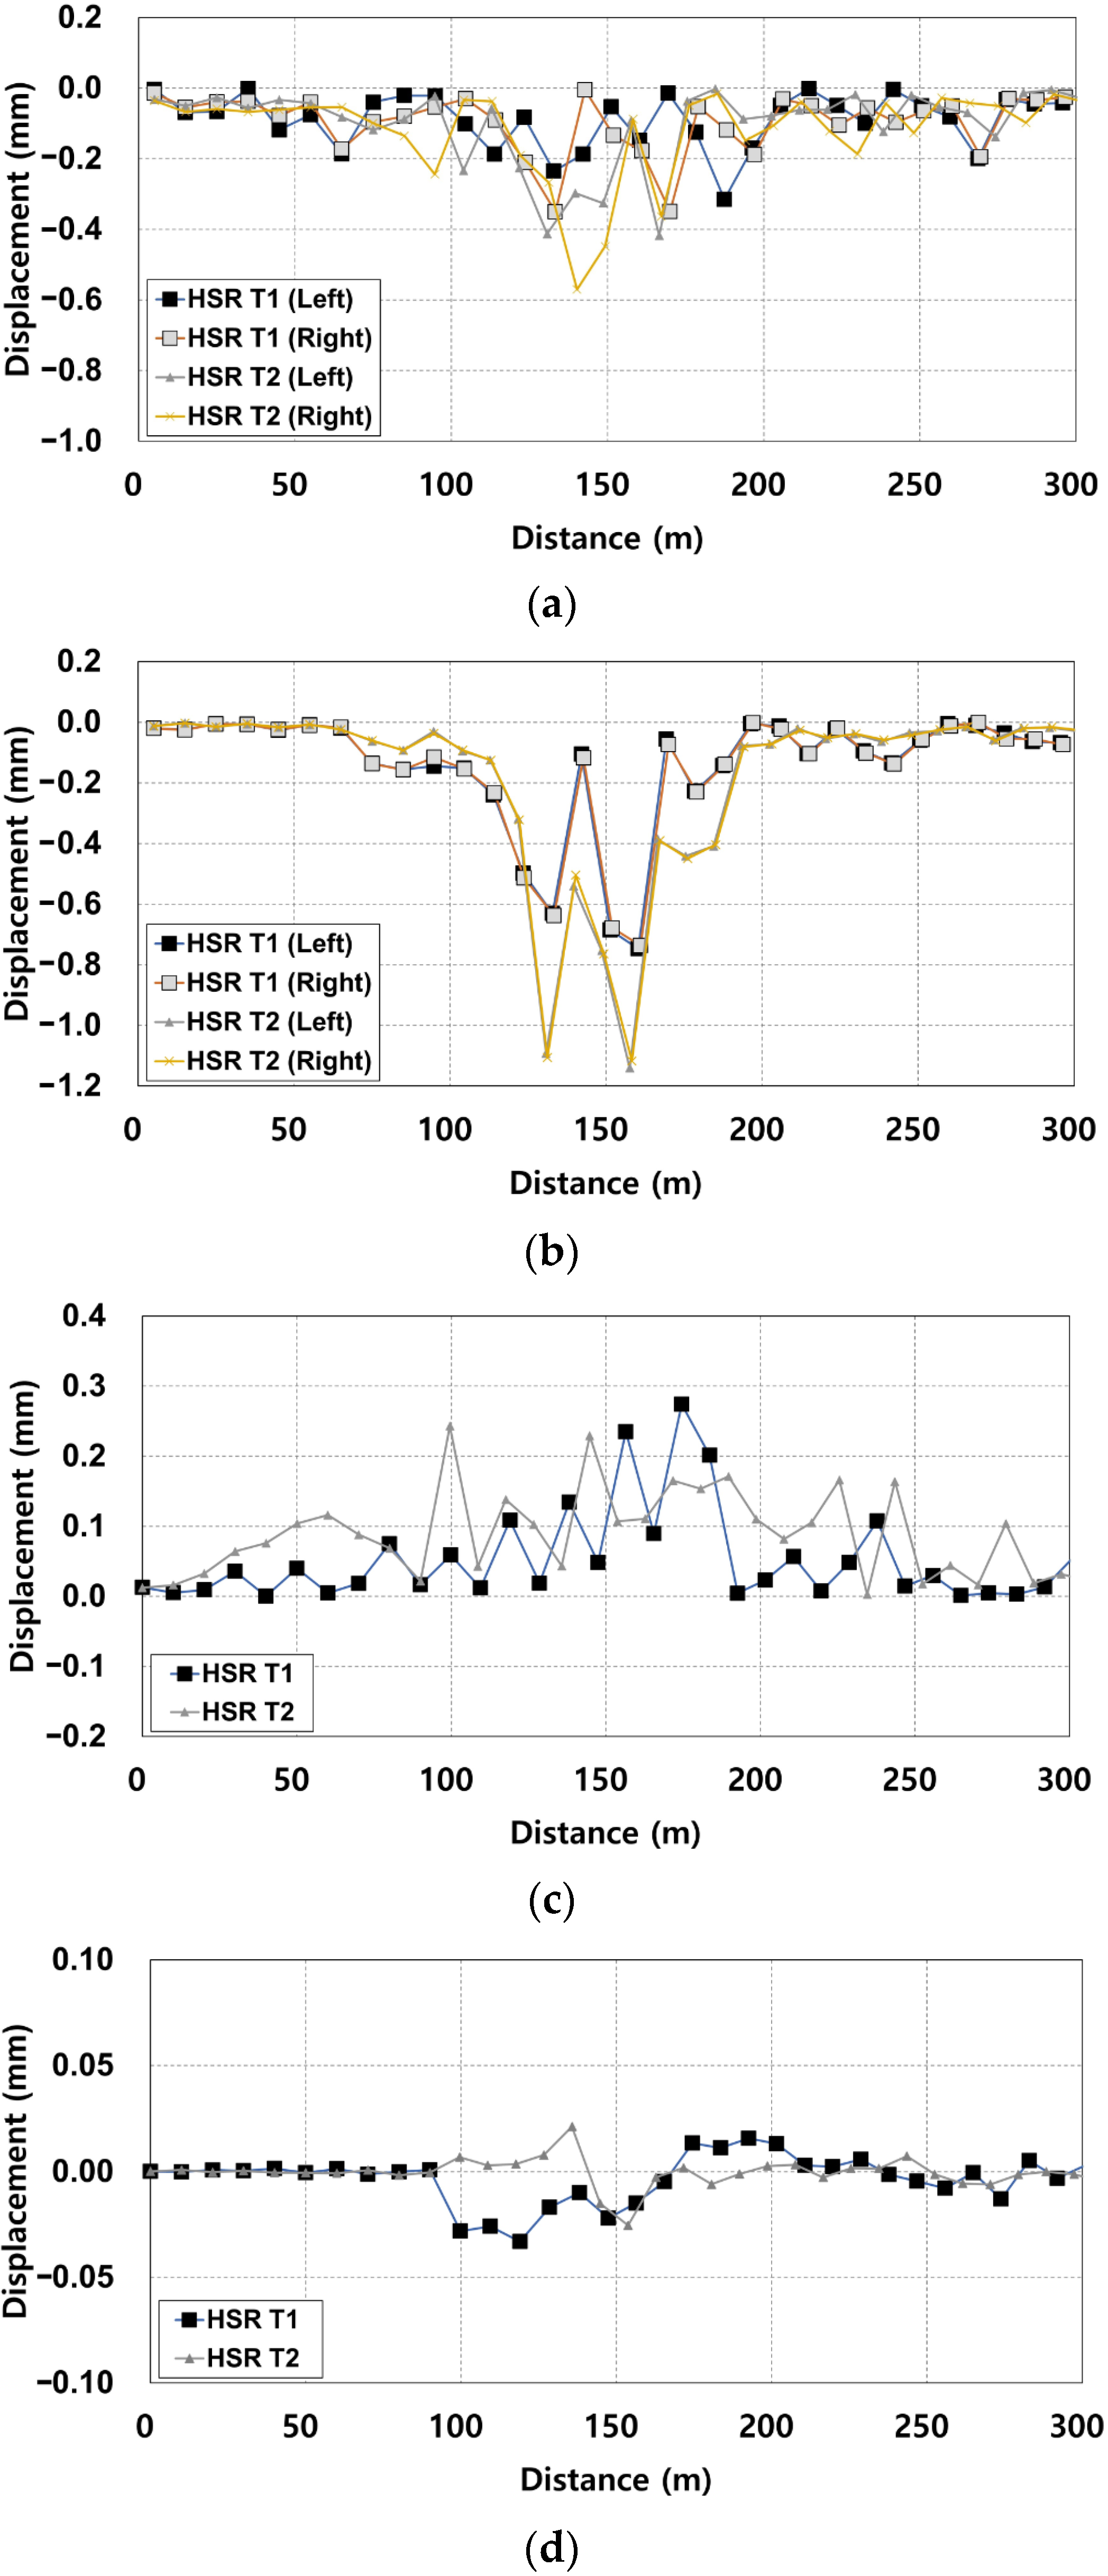
As a result of the analysis of track irregularities in the high-speed railway lines shown in
Figure 3a, the maximum vertical profile of the HSR T1 track ranged from 0.32–0.35 mm in the case of a vertical profile (based on 10 m), and the maximum vertical profile of the HSR T2 track ranged from 0.42 to 0.57 mm.
As shown in
Figure 3b, in the case of the alignment (based on 10 m), the maximum alignment of the HSR T1 track ranged from 0.74–0.75 mm, and the maximum alignment of the HSR T2 track ranged from 1.12–1.14 mm.
As shown in
Figure 3c, in the case of the cross level, the maximum cross level of the HSR T1 track was approximately 0.27 mm, and the maximum cross level of the HSR T2 track was approximately 0.24 mm. As shown in
Figure 3d, in the case of the gauge, the maximum gauge of the HSR T1 track was approximately 0.033 mm and the maximum gauge of the HSR T2 track was approximately 0.025 mm.
For the comprehensive analysis of track irregularities of subway lines and high-speed railway lines according to adjacent excavation, the numerical-analysis results and maintenance criteria of track irregularities were compared. The analysis showed that the vertical profile, alignment, cross level, and gauge exhibited sufficient stability with respect to the adjacent excavation.
3. Field Measurements
3.1. Overview
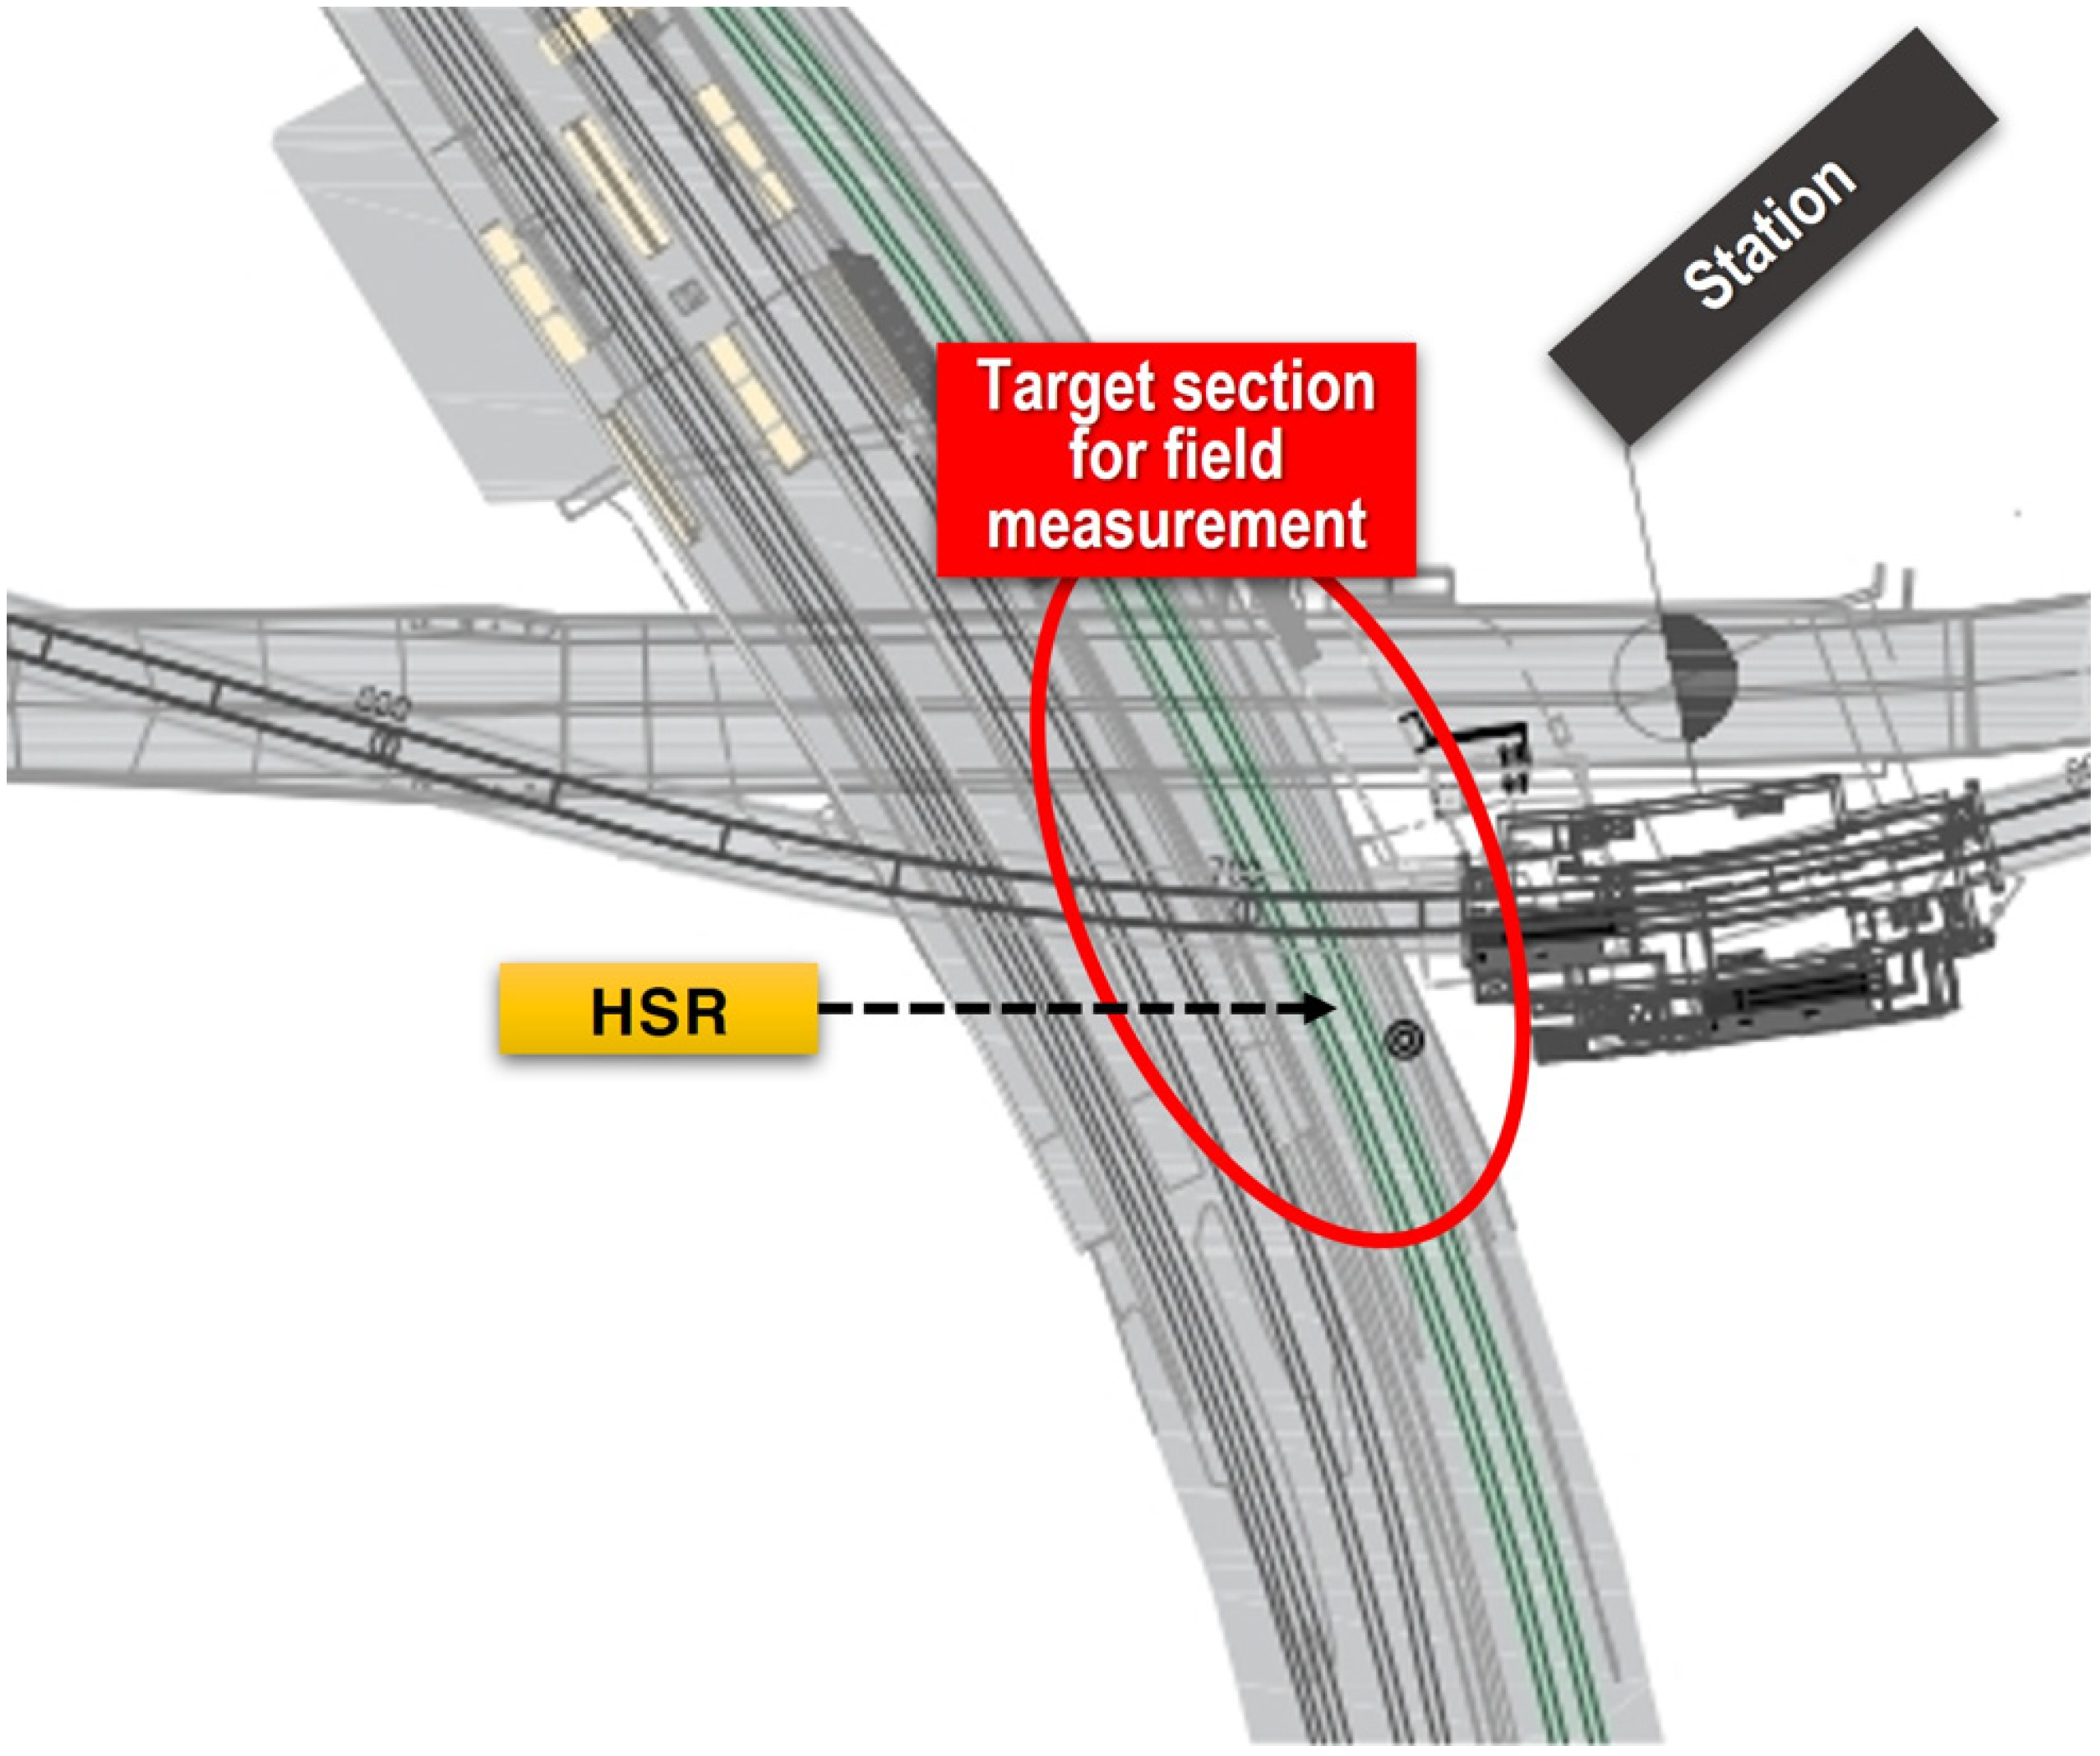
The field measurement in this study was conducted on the site where the excavation work had been planned adjacent to the structure of the serviced subway line and the high-speed railway line. In the field measurements, the target section was measured with a track-geometry-measurement system (Track master) and a railbed-settlement-monitoring sensor (RM sensor), and the evaluation of the Wheel-Rail dynamic responses was performed based on the measured data. The schematic of the target section for field measurement is shown in
Figure 4.
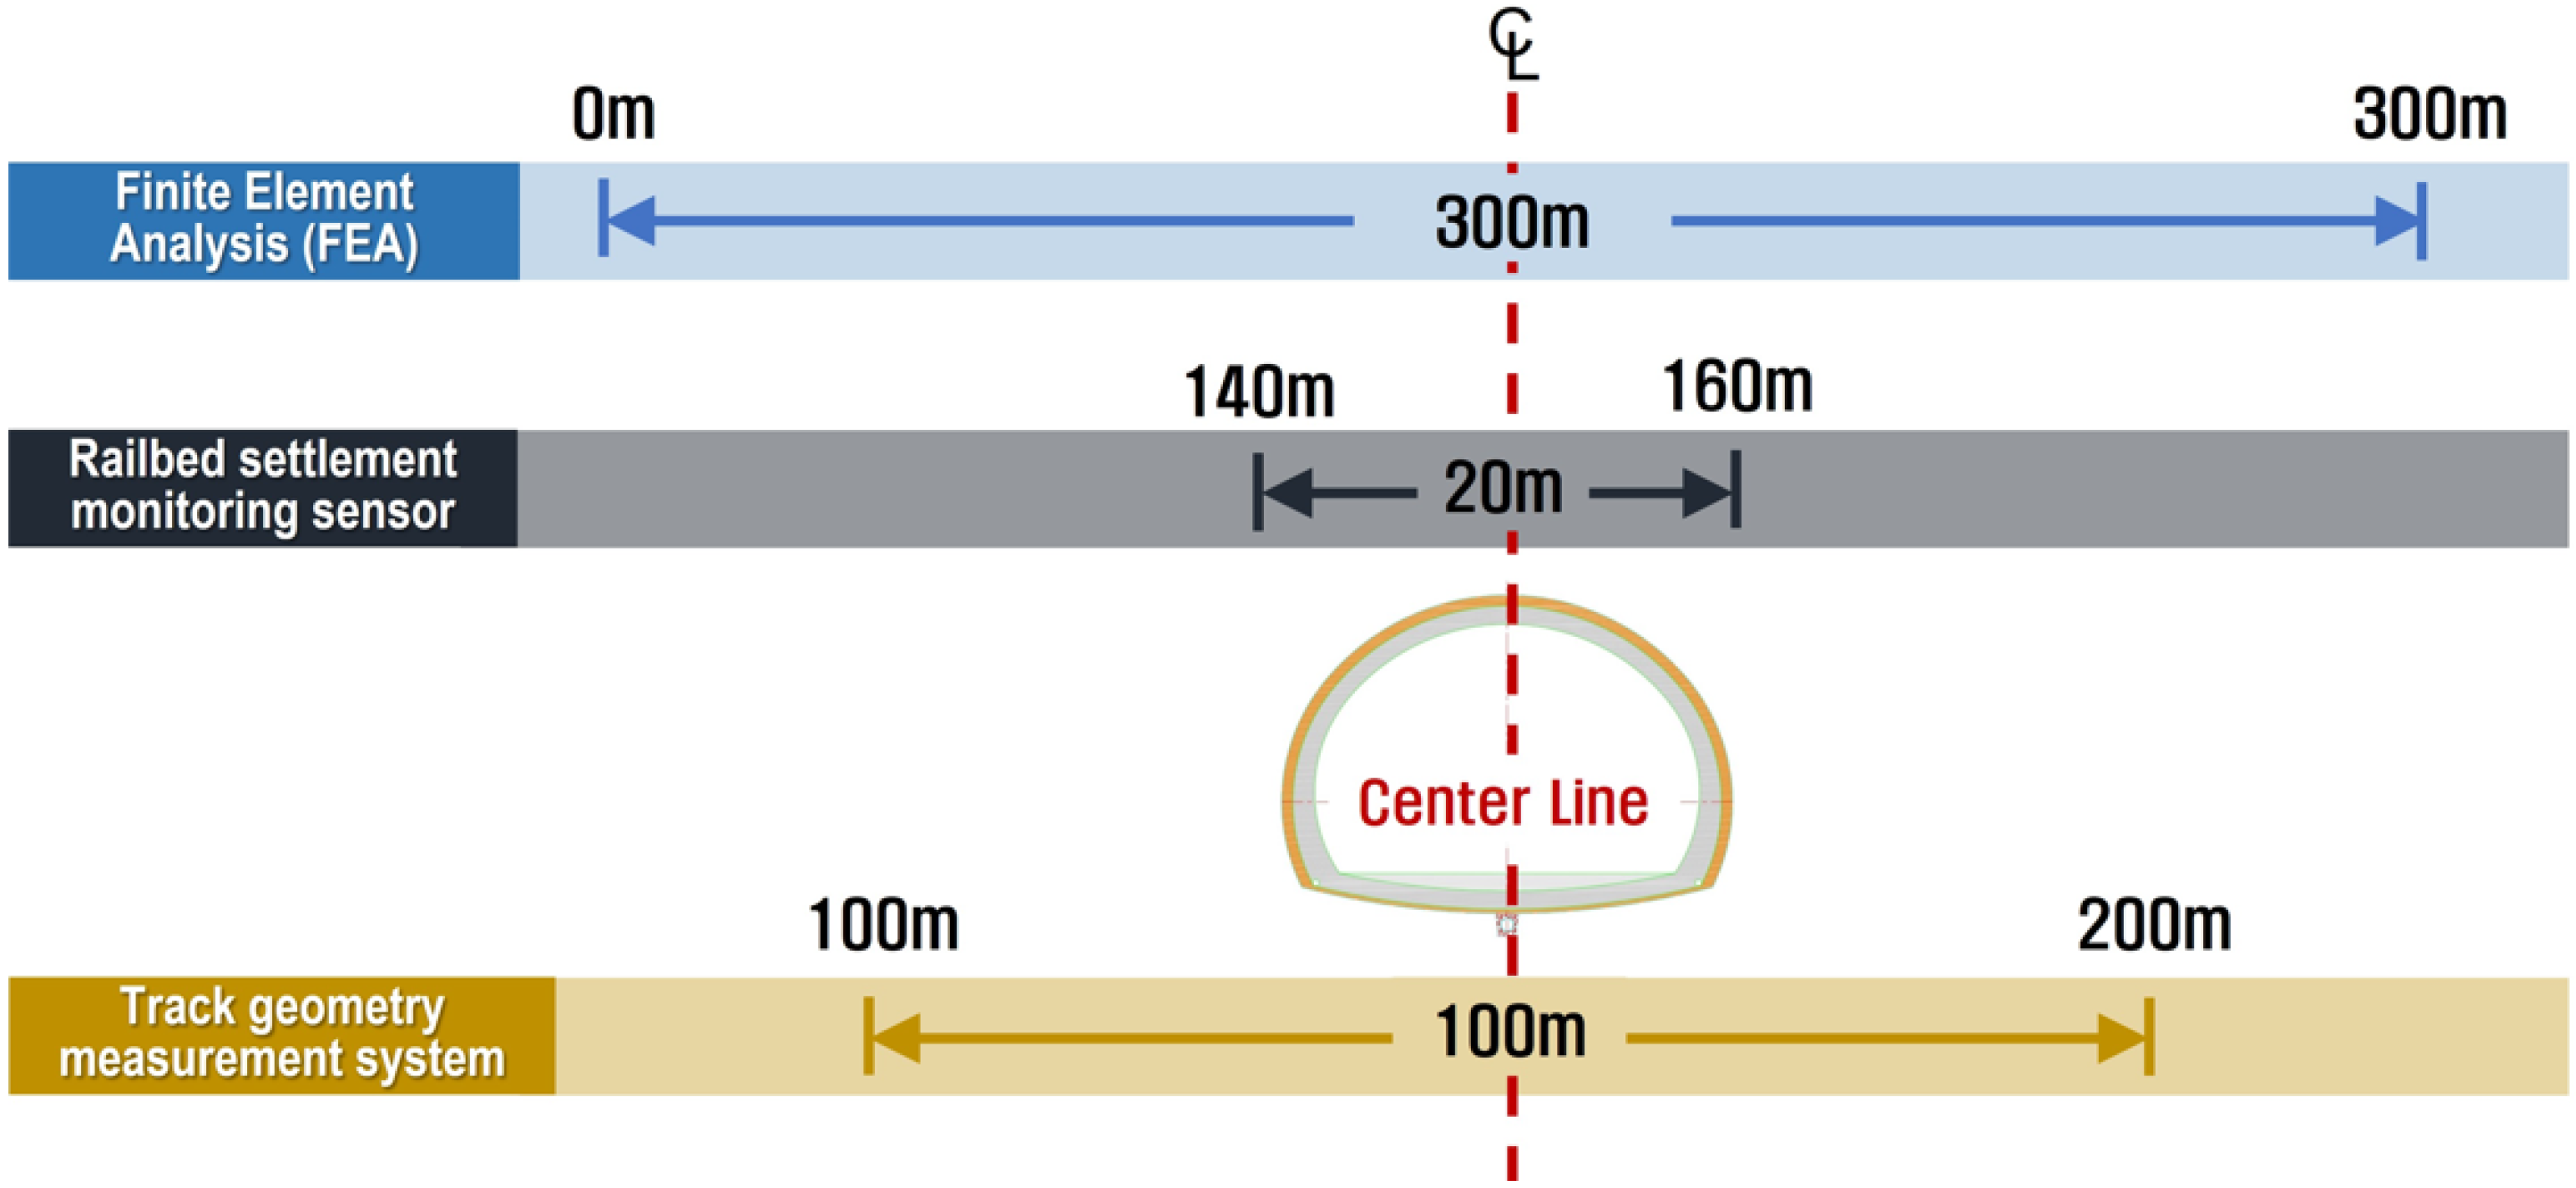
As shown in
Figure 5, the positions of the target section used for field measurements and the section used for numerical analyses are indicated for comparison purposes. The displacement of the track settlement in the subway-line track structures owing to the adjacent excavation was measured, and the status of the track settlement deformation due to the excavation was investigated. The automated measurement was performed with the railbed-settlement-monitoring sensor (RM sensor) every 12 h.
3.1.1. Measurement of Track Settlement
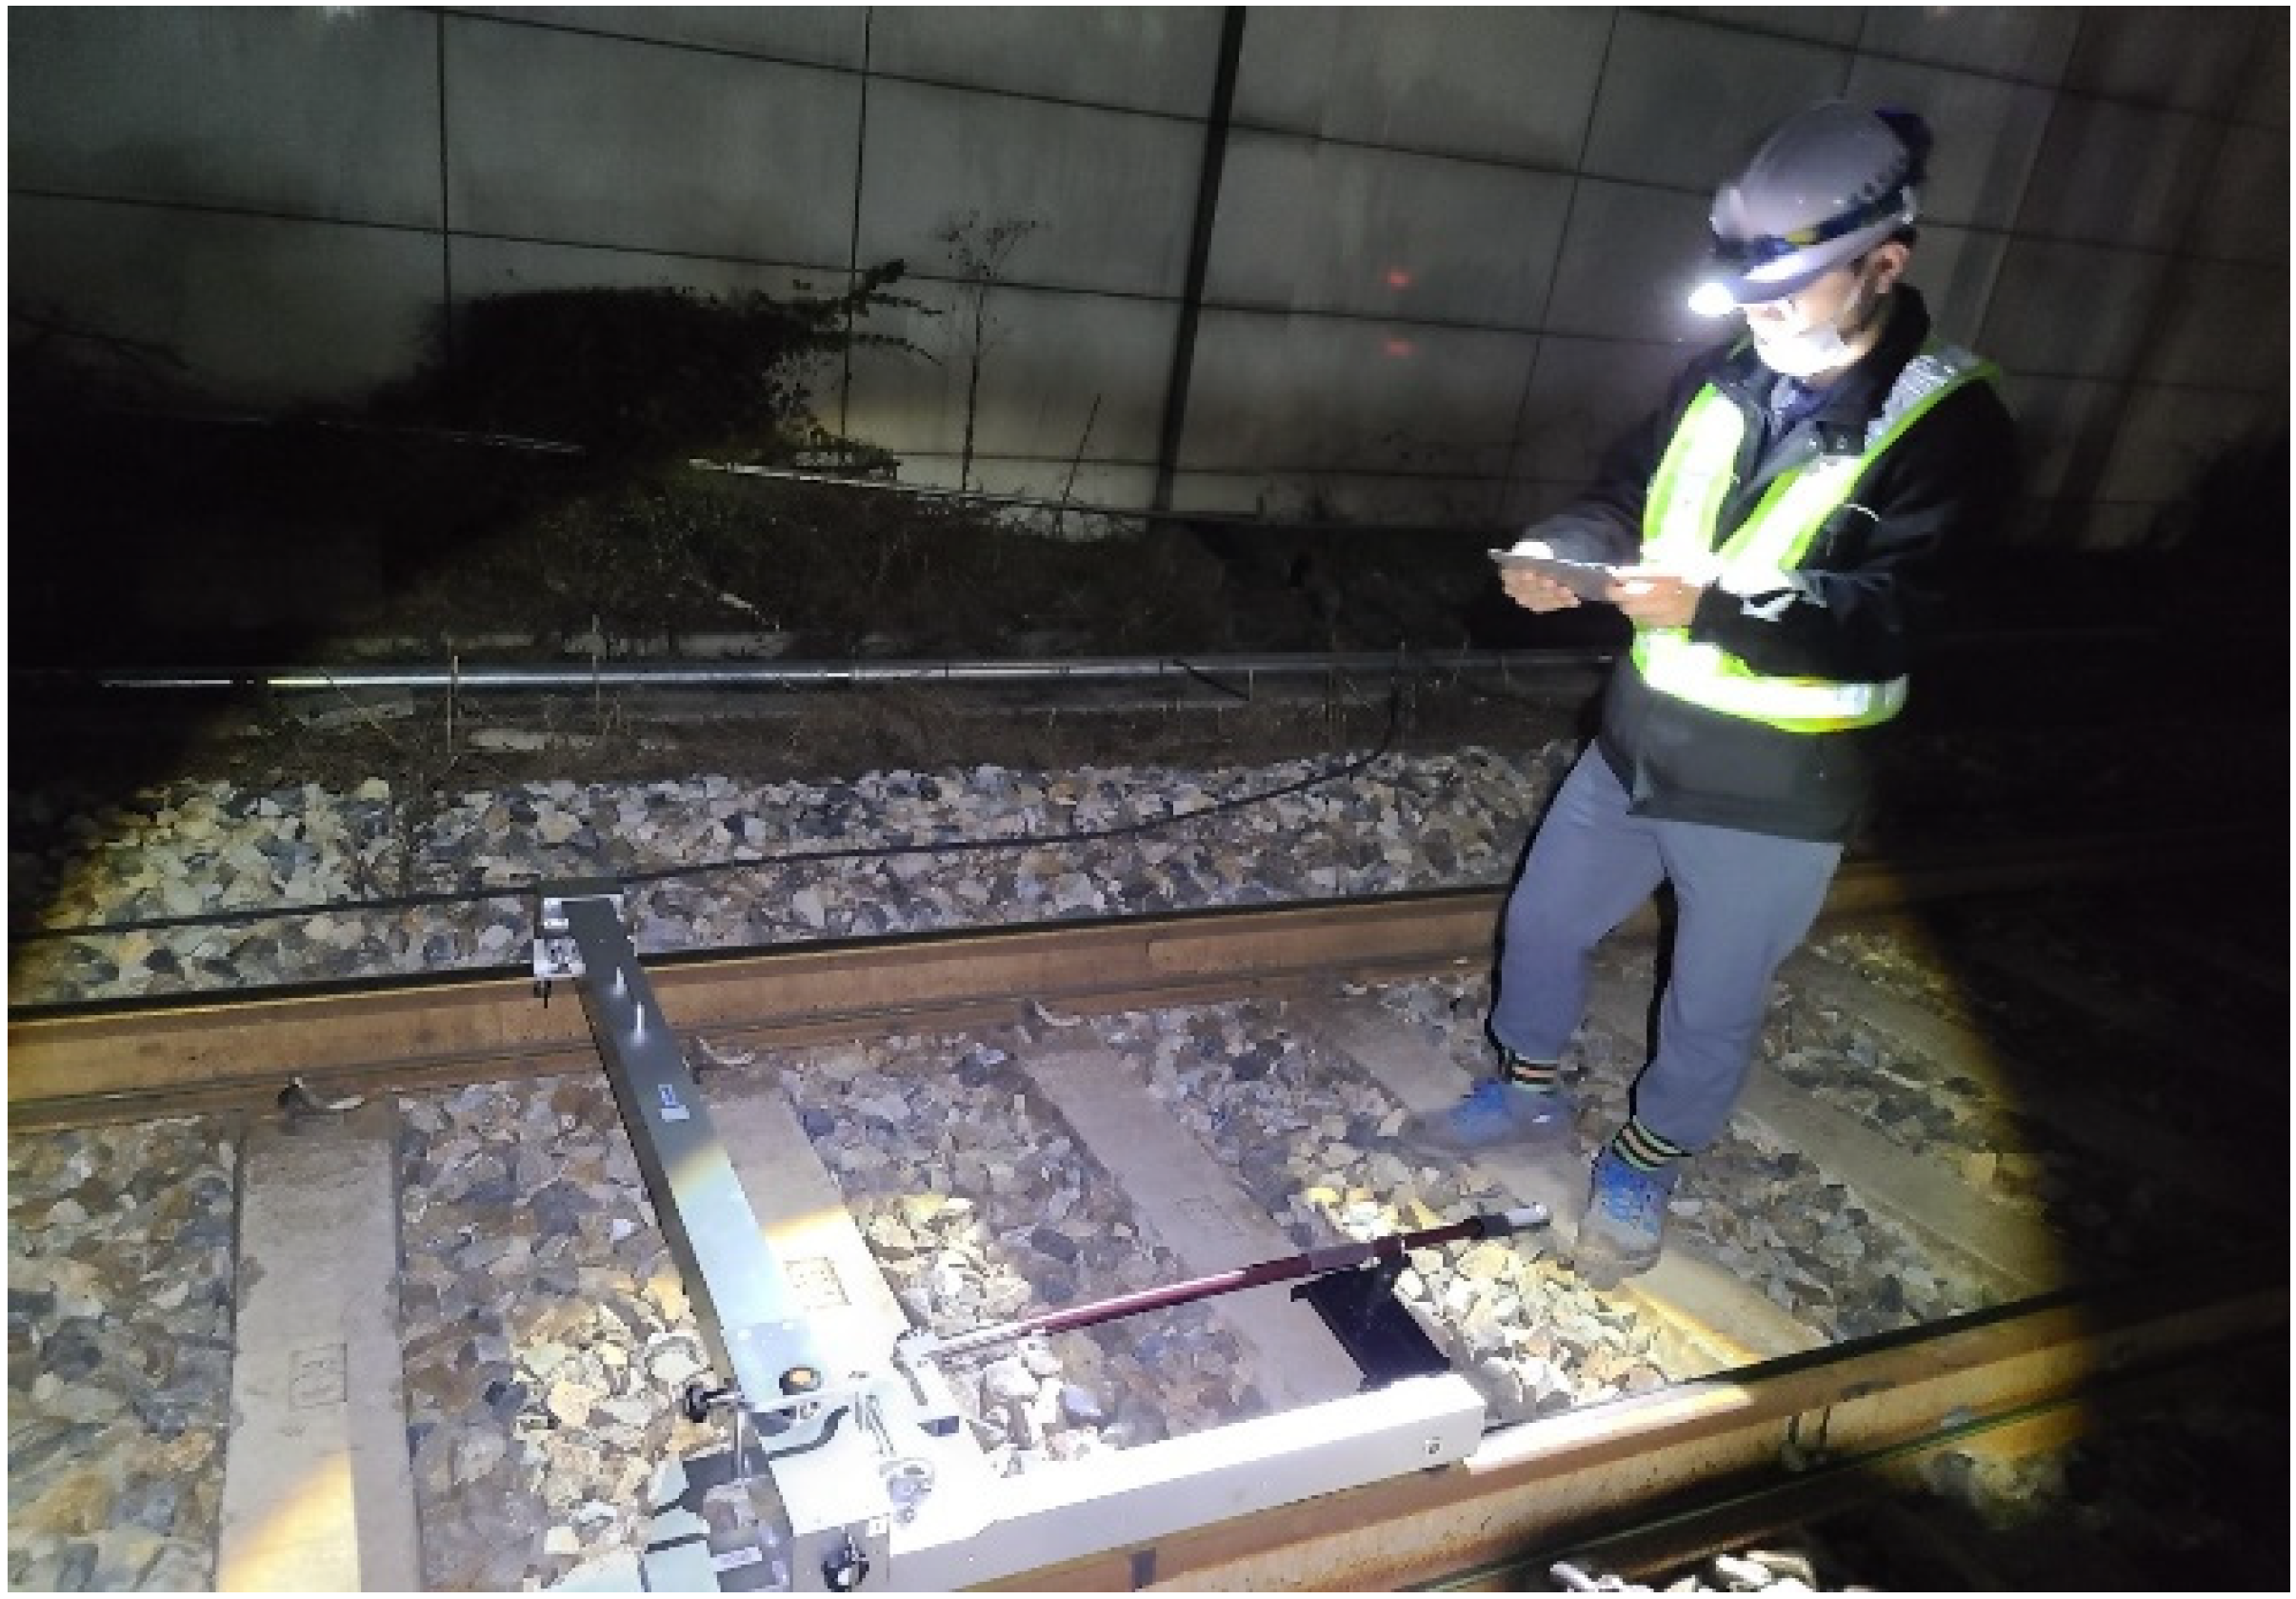
For measurements of track irregularities, Track master (LR-S100), one of the track-geometry-measurement systems, was used. Track-irregularity measurements using the Track master allowed for the direct measurement of the deformation in the rail in direct contact with the wheel. This method presents the most accurate assessment of track displacement with respect to the adjacent excavation. As shown in
Figure 6, the track irregularities were measured using the Track master over a total length of 100 m, and the measurements were conducted on the left and right rails of the HSR T1 and HSR T2 sections.
In the case of excavations adjacent to serviced railway lines, it is a common practice to install railbed-settlement-monitoring sensors (RM sensors) to ensure the structural safety of the railway infrastructure and the security of the stable operation of the rolling stock with respect to adjacent works based on track deformation measurements [
5,
16].
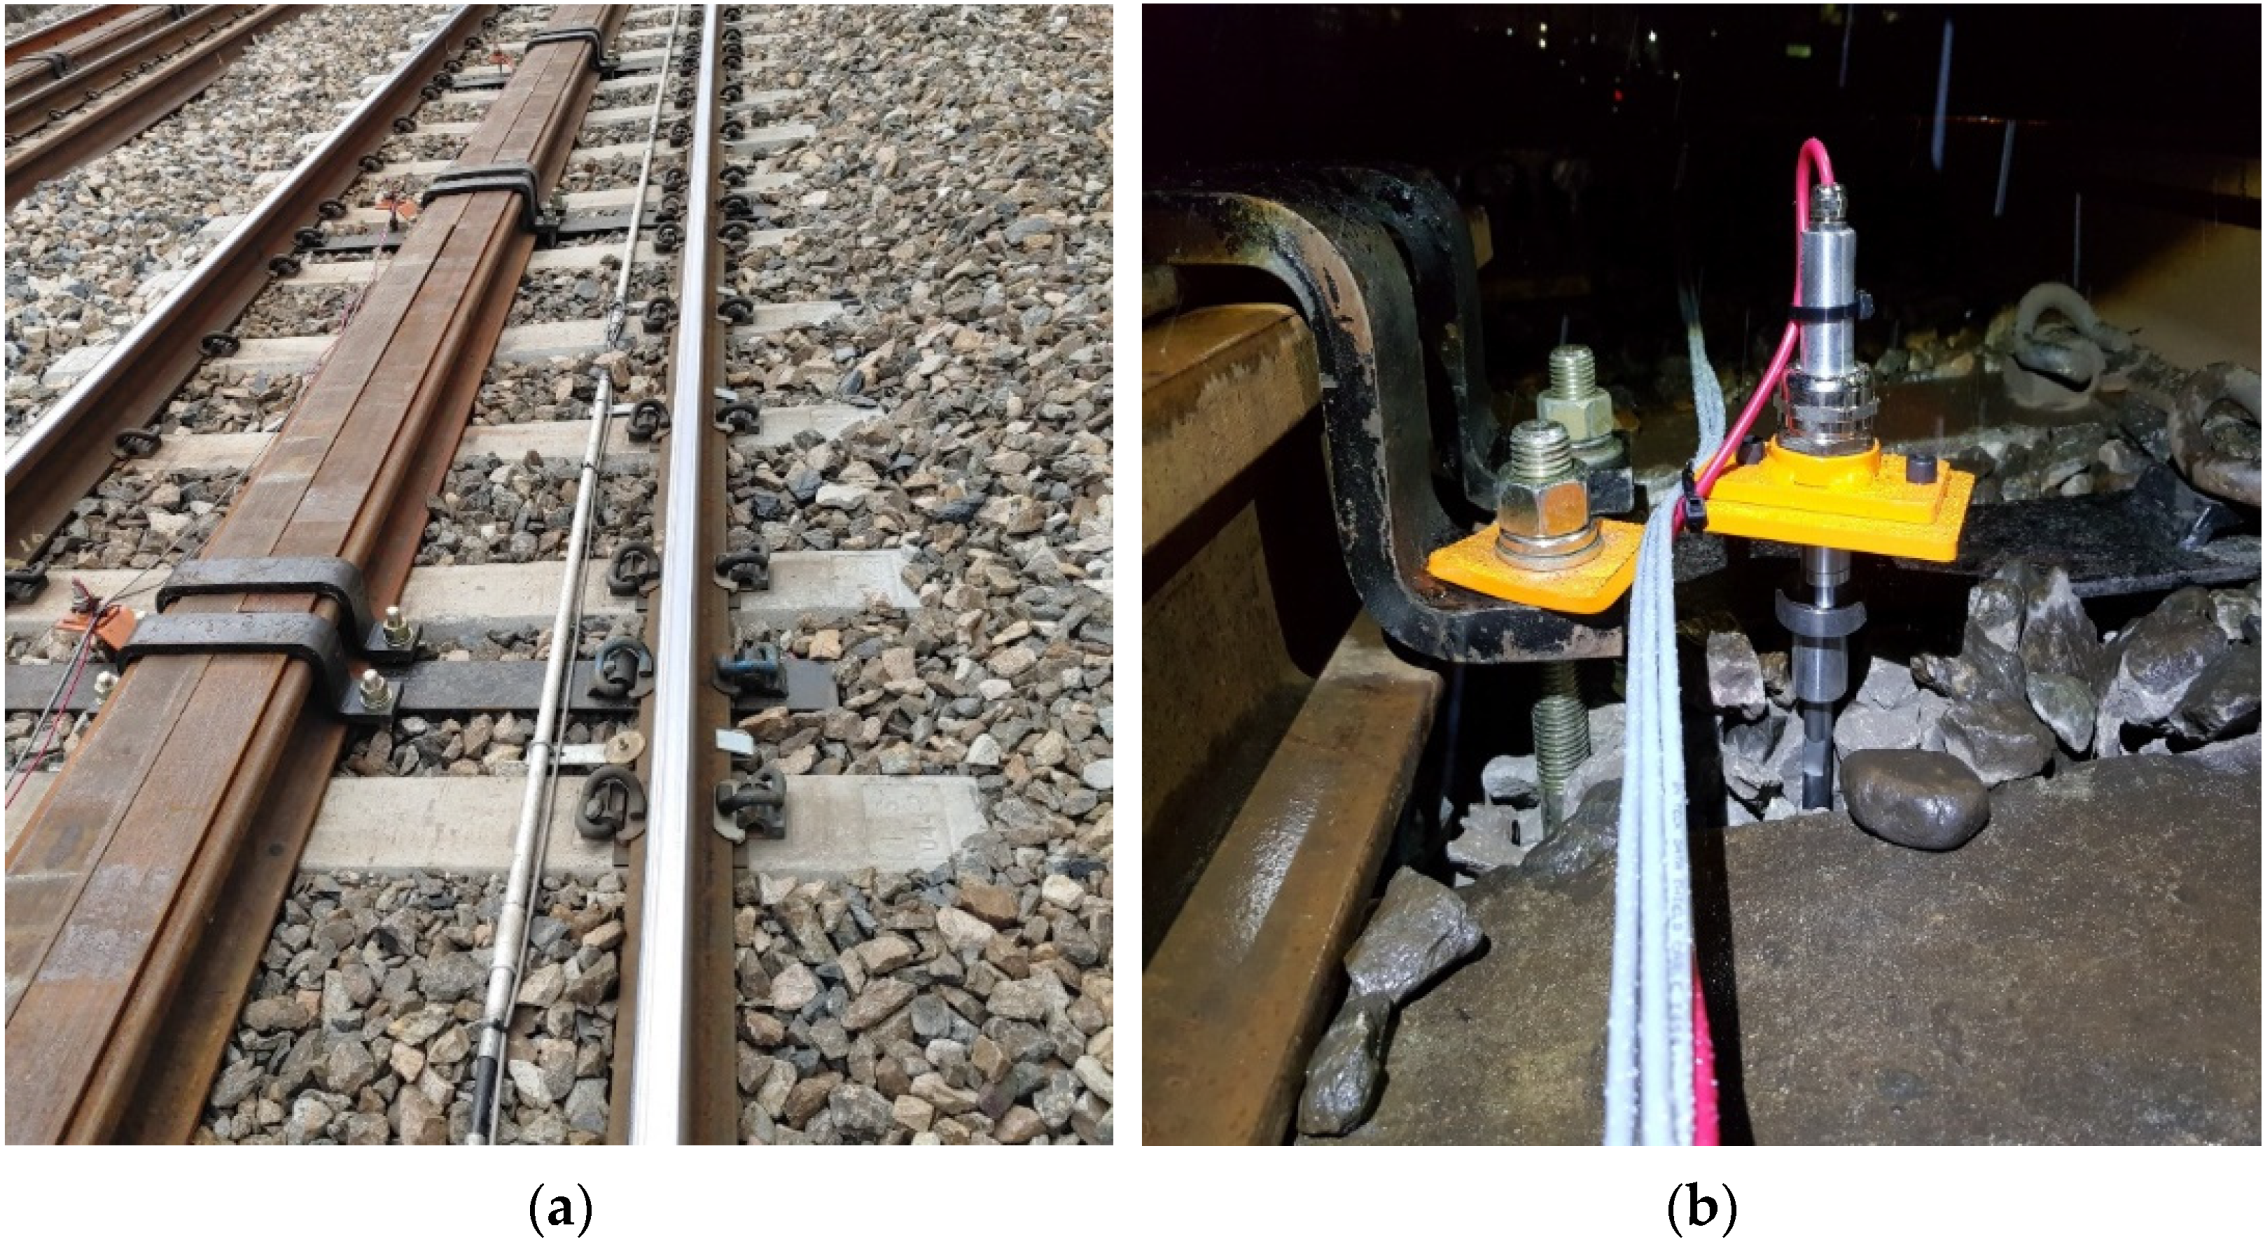
As shown in
Figure 7a, the RM sensor installed on the ballasted track supported the track panel at locations in which the rail and the railroad tie were bound with the reinforcing beams formed by the rail on the top of the railroad tie at the center of the track gauge, thus preventing the track panel from deflecting and measuring the level of settlement of the track panel. As shown in
Figure 7b, the main components of the RM sensor include the rail beam—composed of multiple lightweight rails (37 kg/m)—and a settlement pin with a built-in RM sensor that can measure the settlement of the line. The settlement pin was inserted and fixed in the upper subgrade layer under the ballasts to measure the relative displacement between the railroad tie and the subgrade. Therefore, it was easy to measure the settlement of the track caused by the deformation of the roadbed owing to adjacent excavations.
3.1.2. Field Measurements of Ballasted Track on Serviced Railway Line
The target section of this study is the ballasted track on a serviced railway line, and the dynamic behavior of the ballasted track is different for each railway line owing to the uncertainty of the material performance of the ballasts. Therefore, as the target section of this study is a serviced railway line, the possibilities of track irregularities and changes in the ballast state during the service of the line cannot be ruled out. Thus, the measurement of track geometry on the track under construction work is limited in terms of the reliability and accuracy of the measurements.
The purpose of the measurement of the dynamic responses of the track in this study is to obtain the dynamic wheel load for comparison with the results of Wheel-Rail-interaction-force analysis through the dynamic modeling of the ballasted track. To analyze the effects of track irregularities on the dynamic wheel load, other parameters should be excluded. Therefore, to verify the adequacy of the dynamic wheel load according to the track irregularities derived from the Wheel-Rail-interaction-force analysis, representative dynamic responses obtained from a track free of irregularities and ballast degradation are required.
In this study, the dynamic wheel load was measured in the newly constructed ballasted track within the service period (less than one year) after the construction of the track without irregularities, and the representative value of the dynamic wheel load of the ballasted track was calculated according to the train speed.
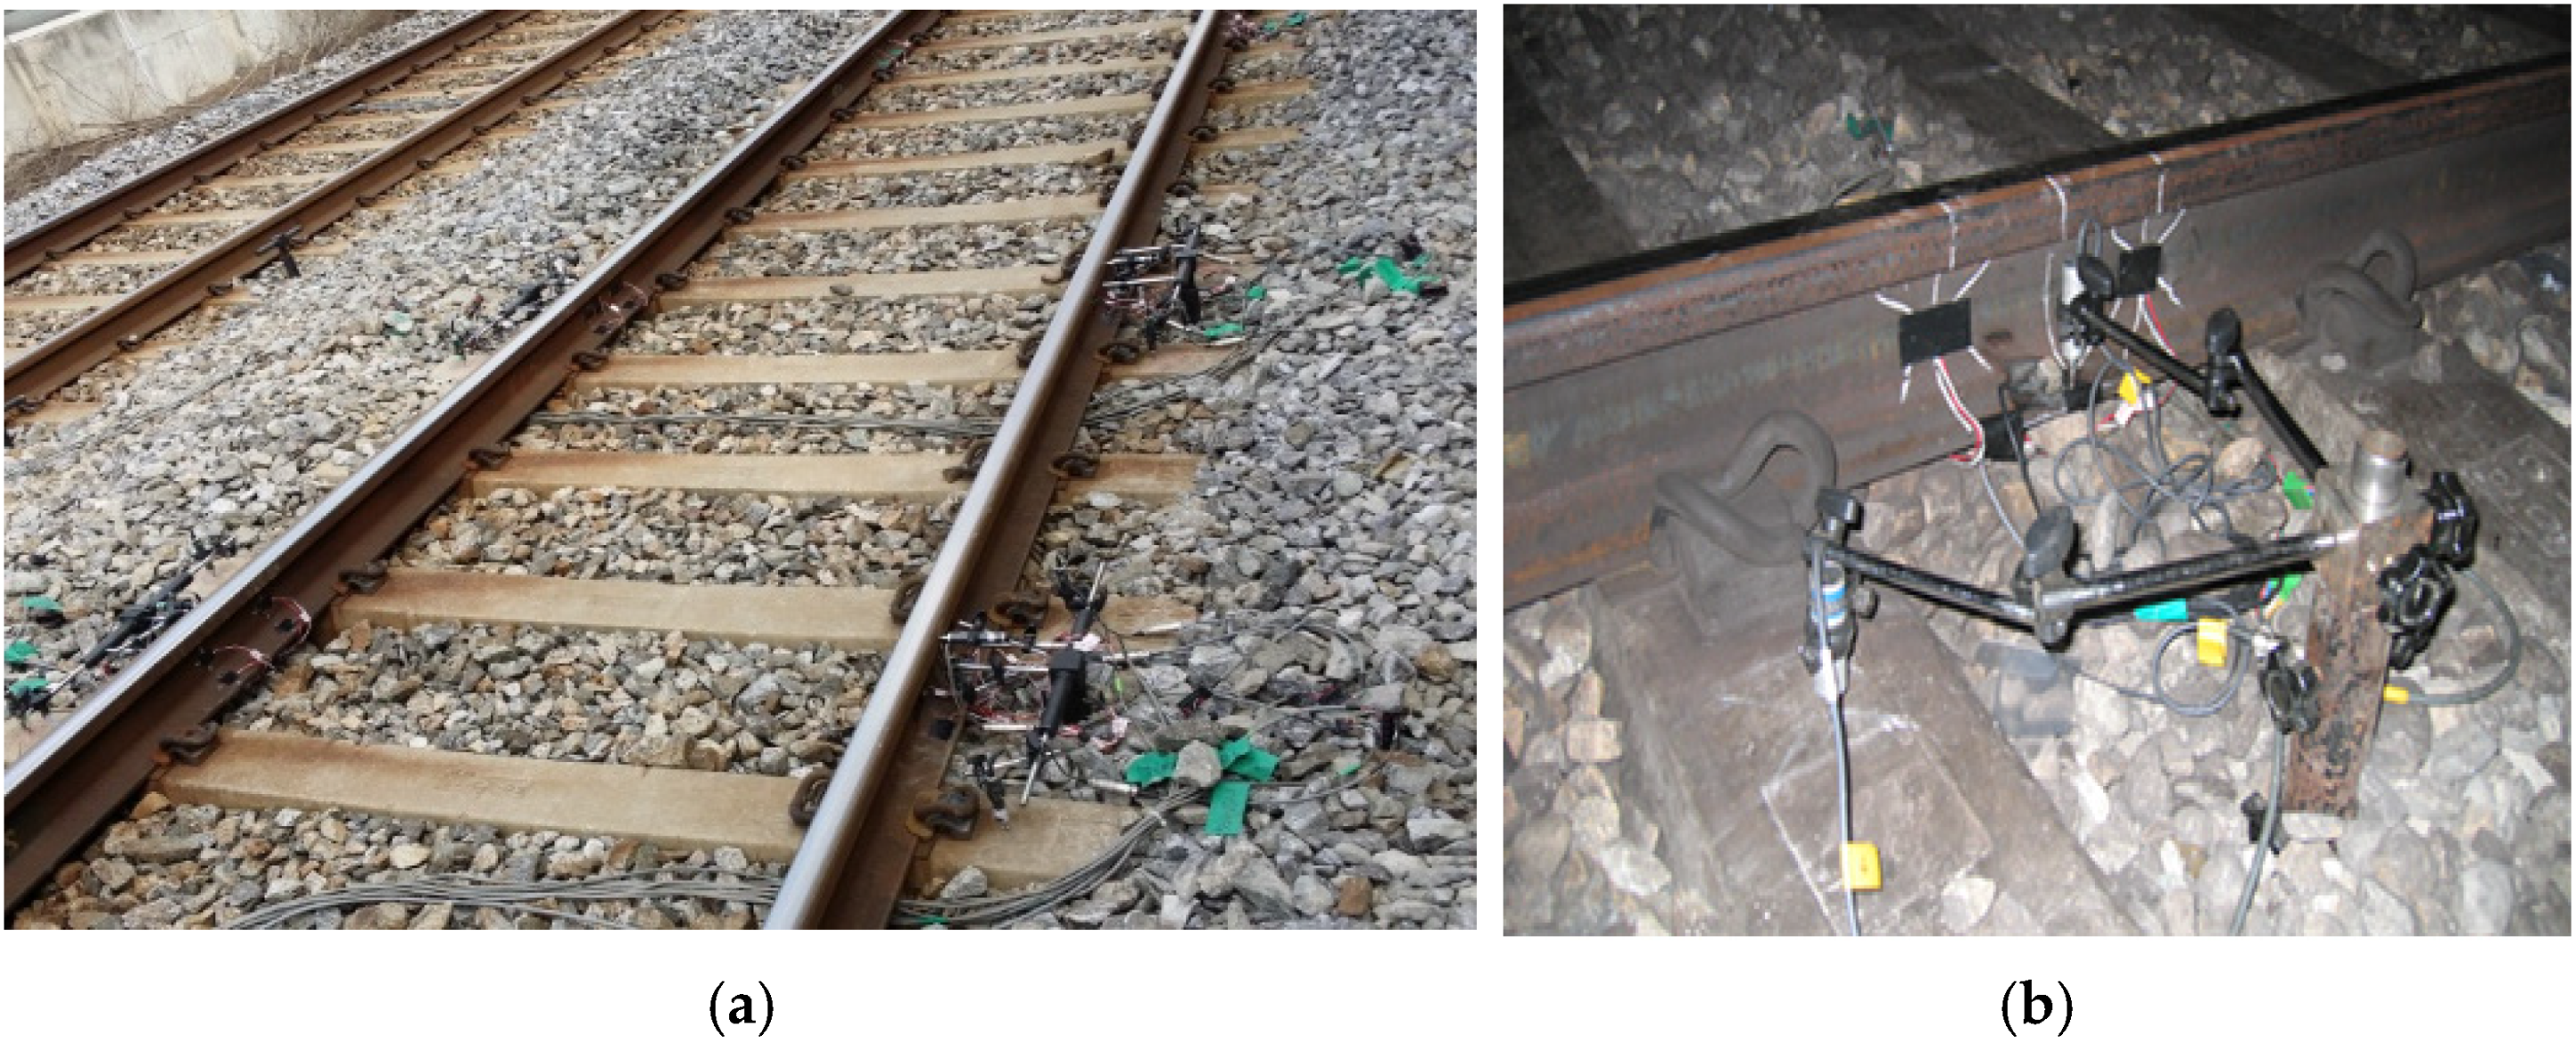
As shown in
Figure 8, the target track for field measurements was a double ballasted track on the high-speed railway line, the track shape was a straight line with a welded rail section of 60 kg/m. For dynamic-wheel-load measurements, a total of four measurement points were set at 2 m intervals. For the installation of the wheel-load sensor, a wheel-load gauge wired in eight directions was attached at an angle of 45° from the neutral axis of the inner and outer rail web, respectively, at a distance of 100 mm from the center, between railroad ties [
2].
Most of the dynamic responses that occurred on the track by the running load of the rolling stock were high-frequency signals. Additionally, in the case of the wheel-load gauge attached to the rail, the measurement data included the effect of the current which flowed through the rail. Therefore, to prevent distortion and loss of the measurement data signals and to remove the signals of the noise components, a sufficient sampling rate (1.2 kHz) was set. For noise components, low-pass and high-pass filters were used in the fast Fourier Transform (FFT) analysis to increase the reliability of the data [
2].
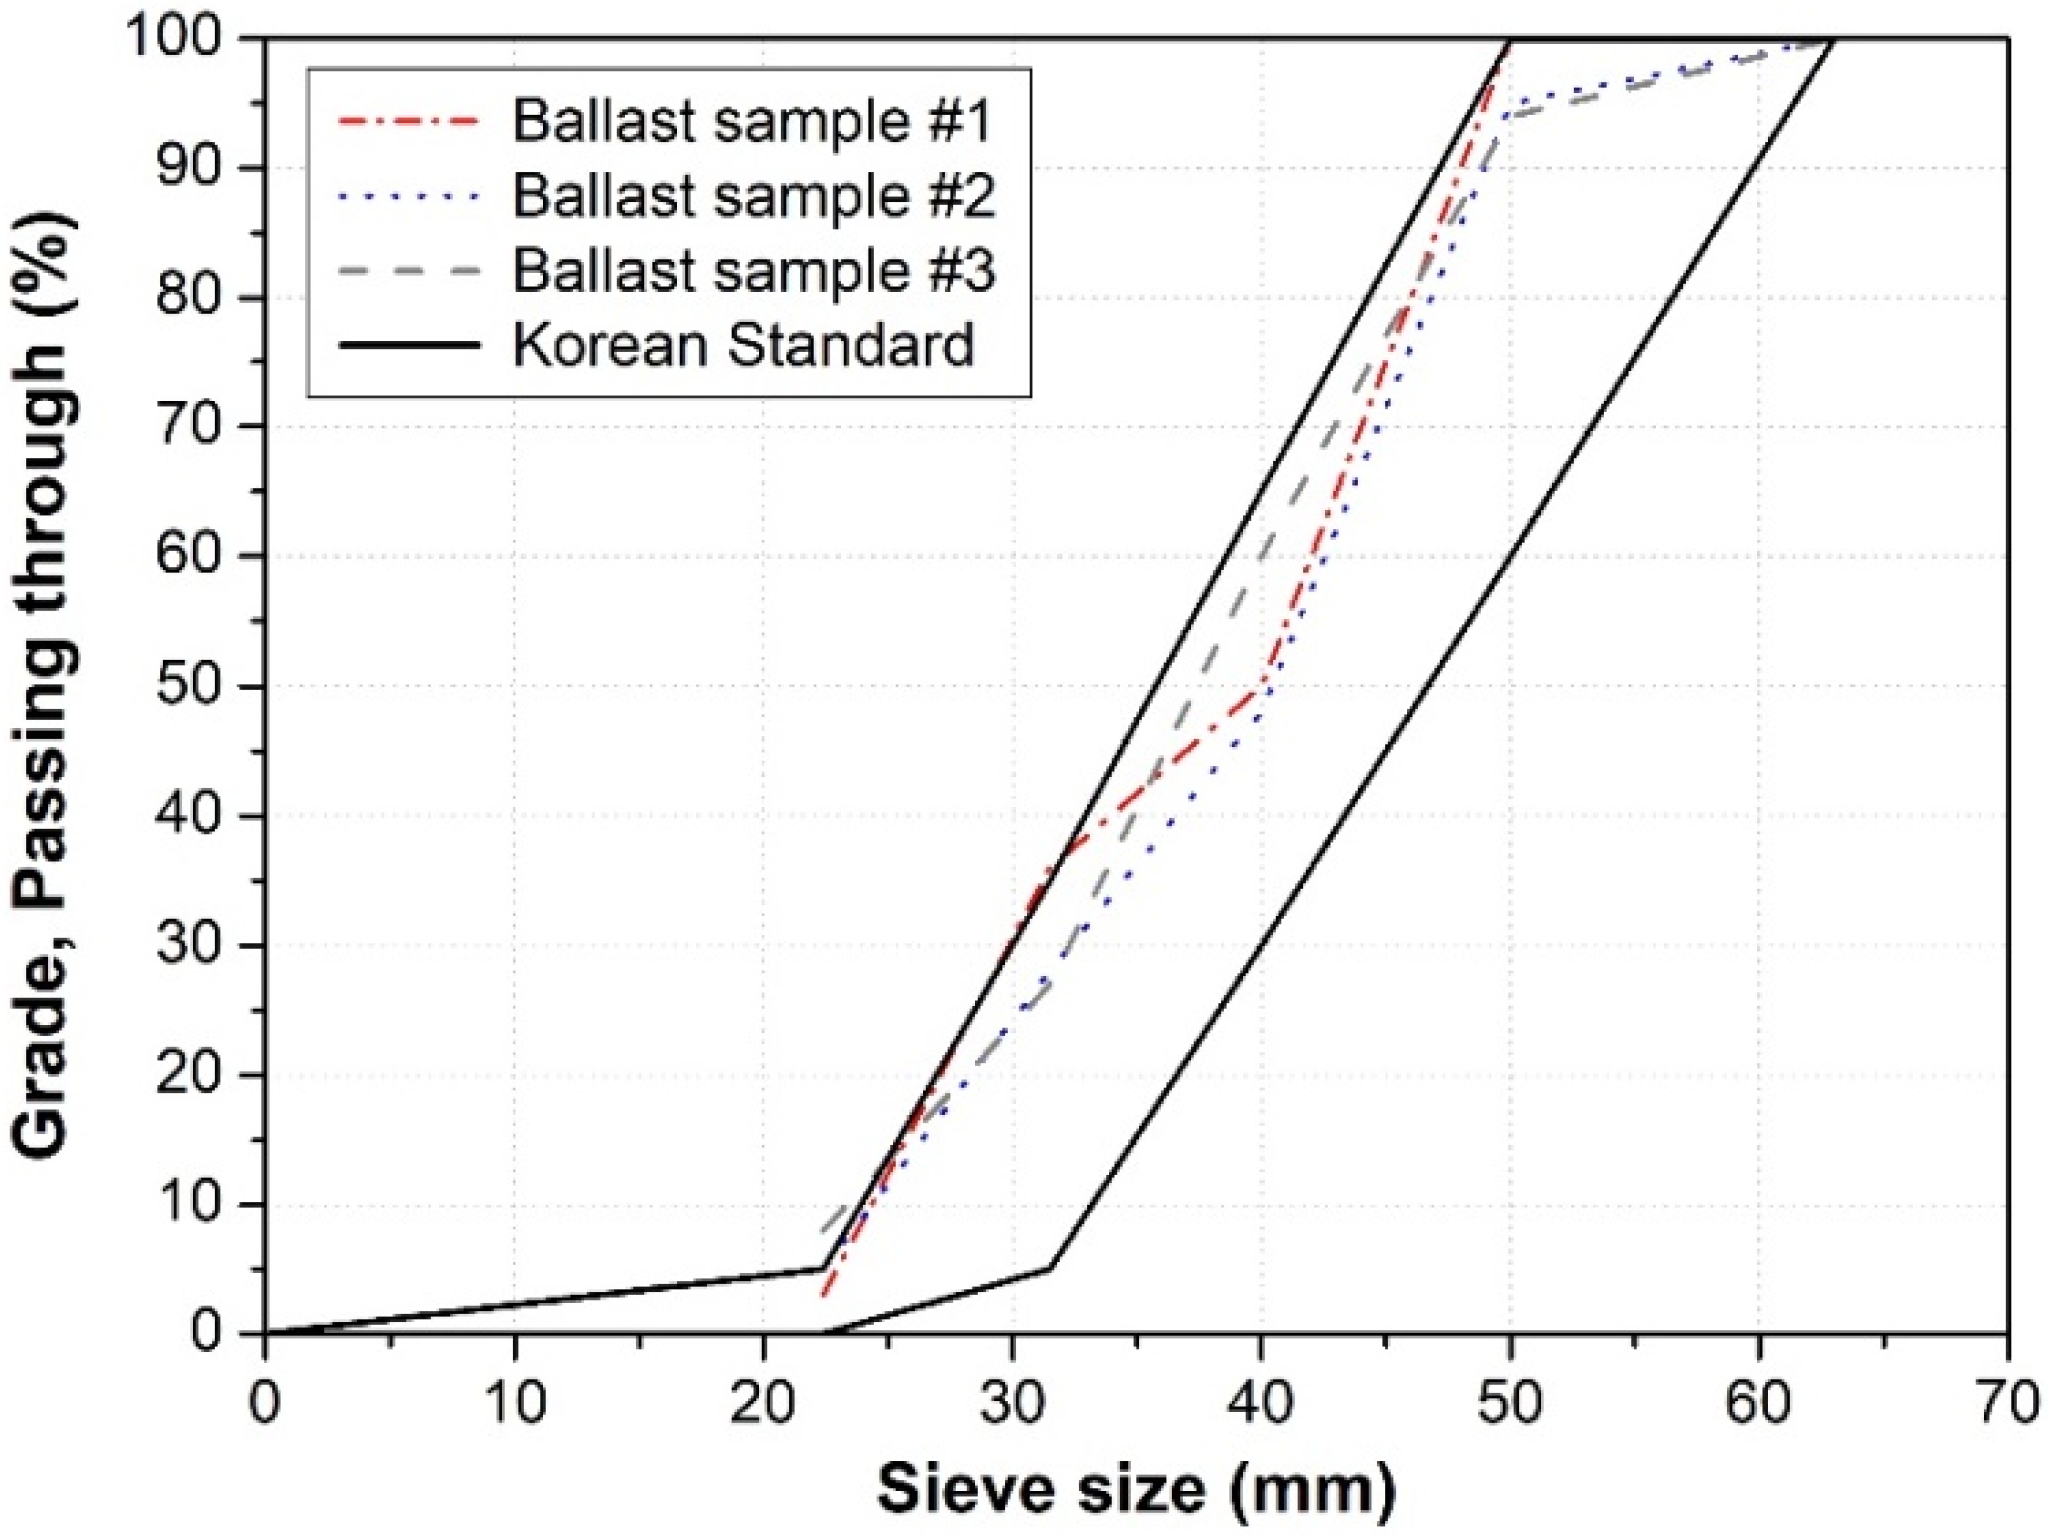
Figure 9 shows the results of the ballast particle-size test that was used to evaluate the state of the ballasted track after the track field measurements.
The key track component that directly affected the track-support performance and the dynamic behavior of the ballasted track was the ballast. In the spring structure arranged in series that composed the ballasted track, the ballast with the softest spring stiffness had a dominant effect on the dynamic responses of the ballasted track. Therefore, to obtain dynamic responses in a ballasted track without irregularities, it is important to evaluate the state of the ballast. In the particle-size test of the ballast, which is generally used to evaluate its degradation state, the state of the ballast was determined to be acceptable if the particle size of the sample was included within the standard particle-size distribution curve. In this study, the ballast particle-size test was performed by collecting three sets of ballast samples from the target section. As a result of the particle-size test, all of the ballast samples collected from the track field-measurement section were found to satisfy the standard particle-size distribution curve, as shown in
Figure 9, thus indicating that the ballast state in the target section was acceptable.
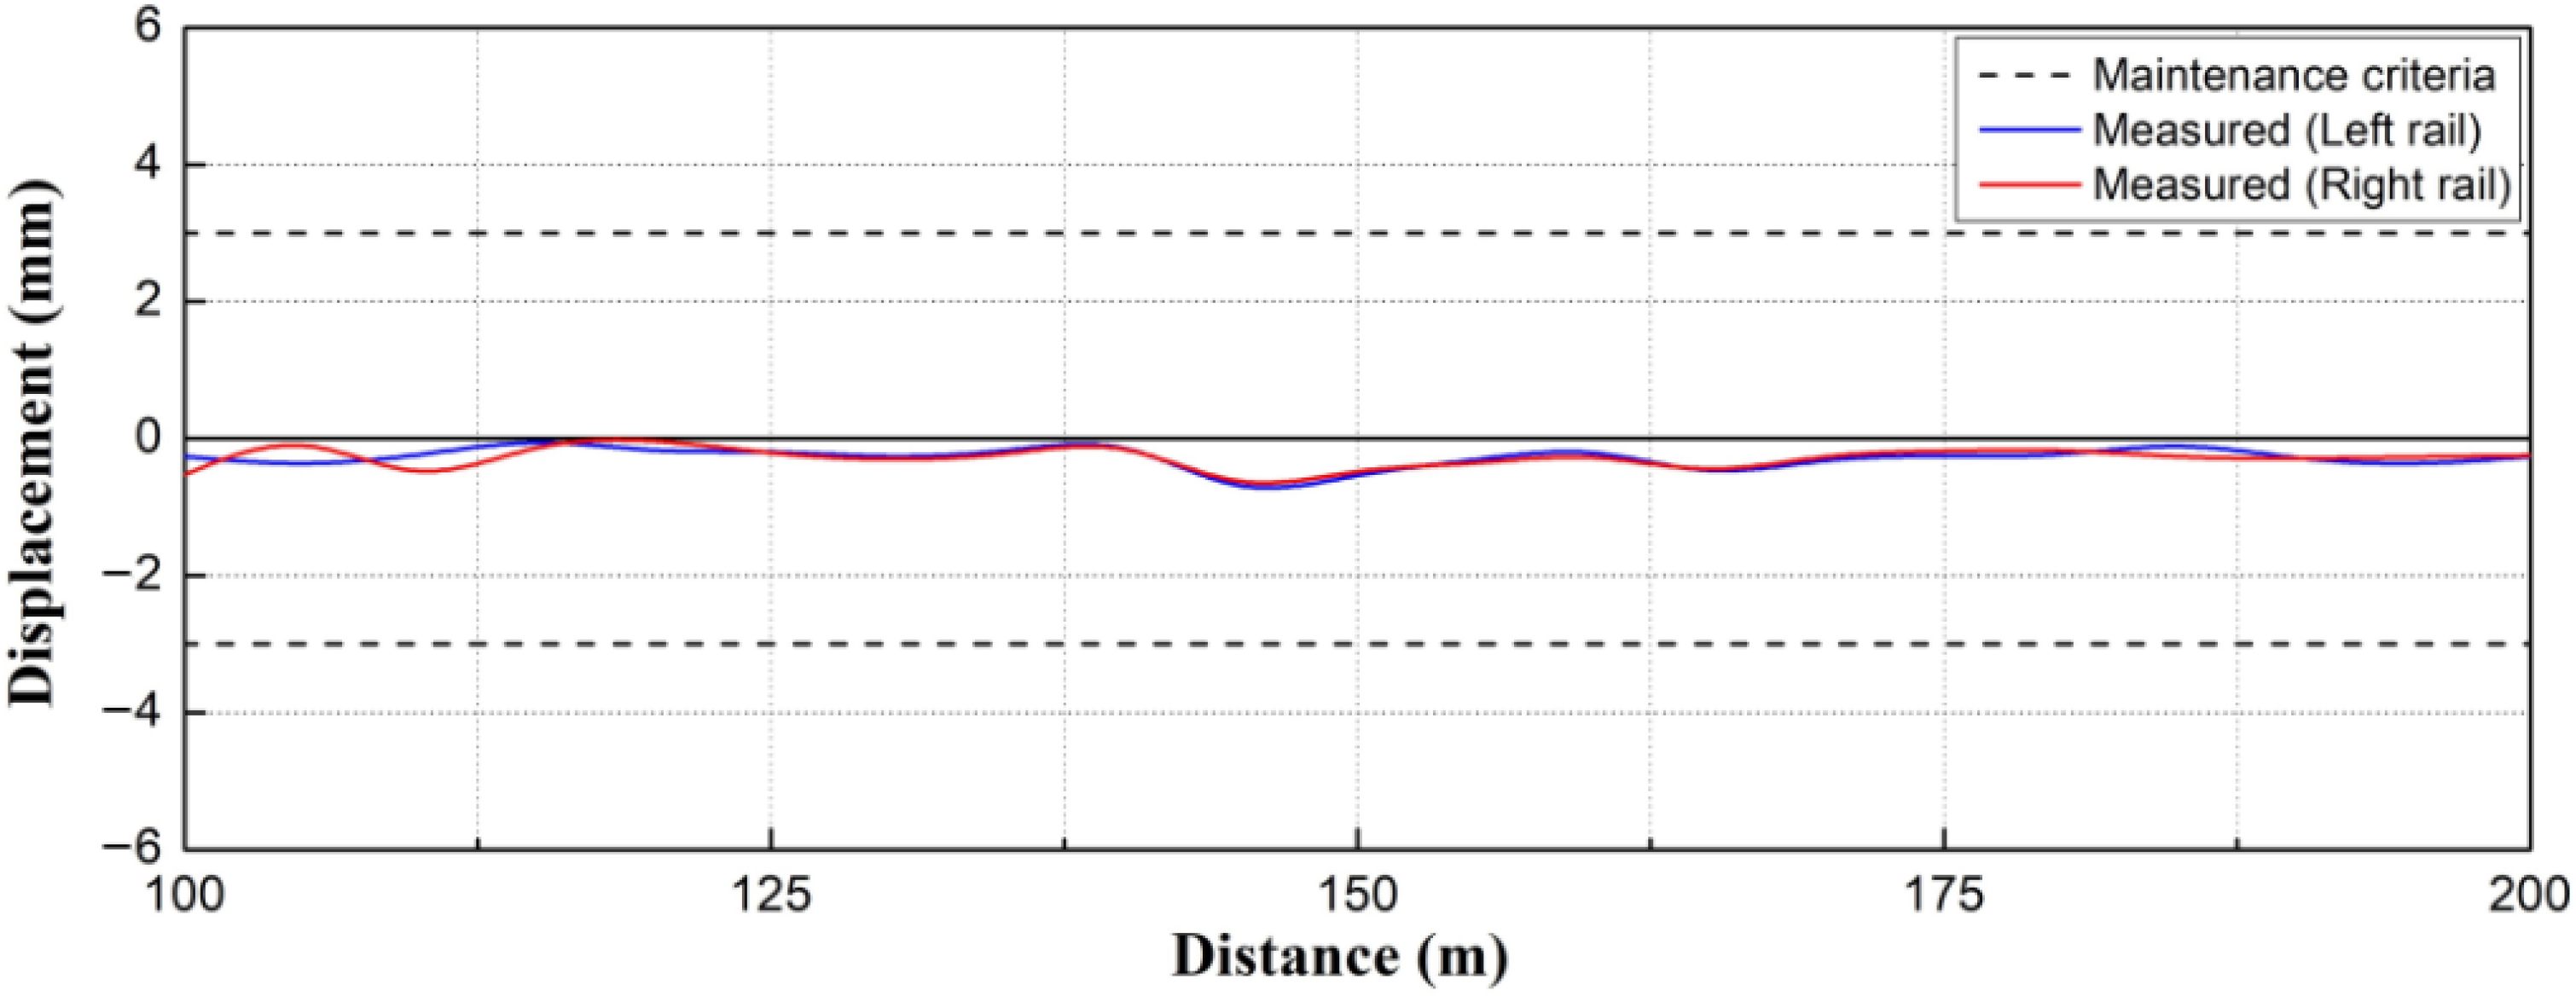
As a result of the track irregularities measurement, it was confirmed that the target track had relatively good track quality with almost no vertical profiles, as shown in
Figure 10.
3.2. Field-Measurement Results
3.2.1. Track-Geometry-Measurement System
In this study, track irregularities were measured using a Track master. The targets of the track-irregularity measurements included the vertical profile, alignment, cross level, gauge, and twist. Relevant measurement results are presented in
Figure 11.
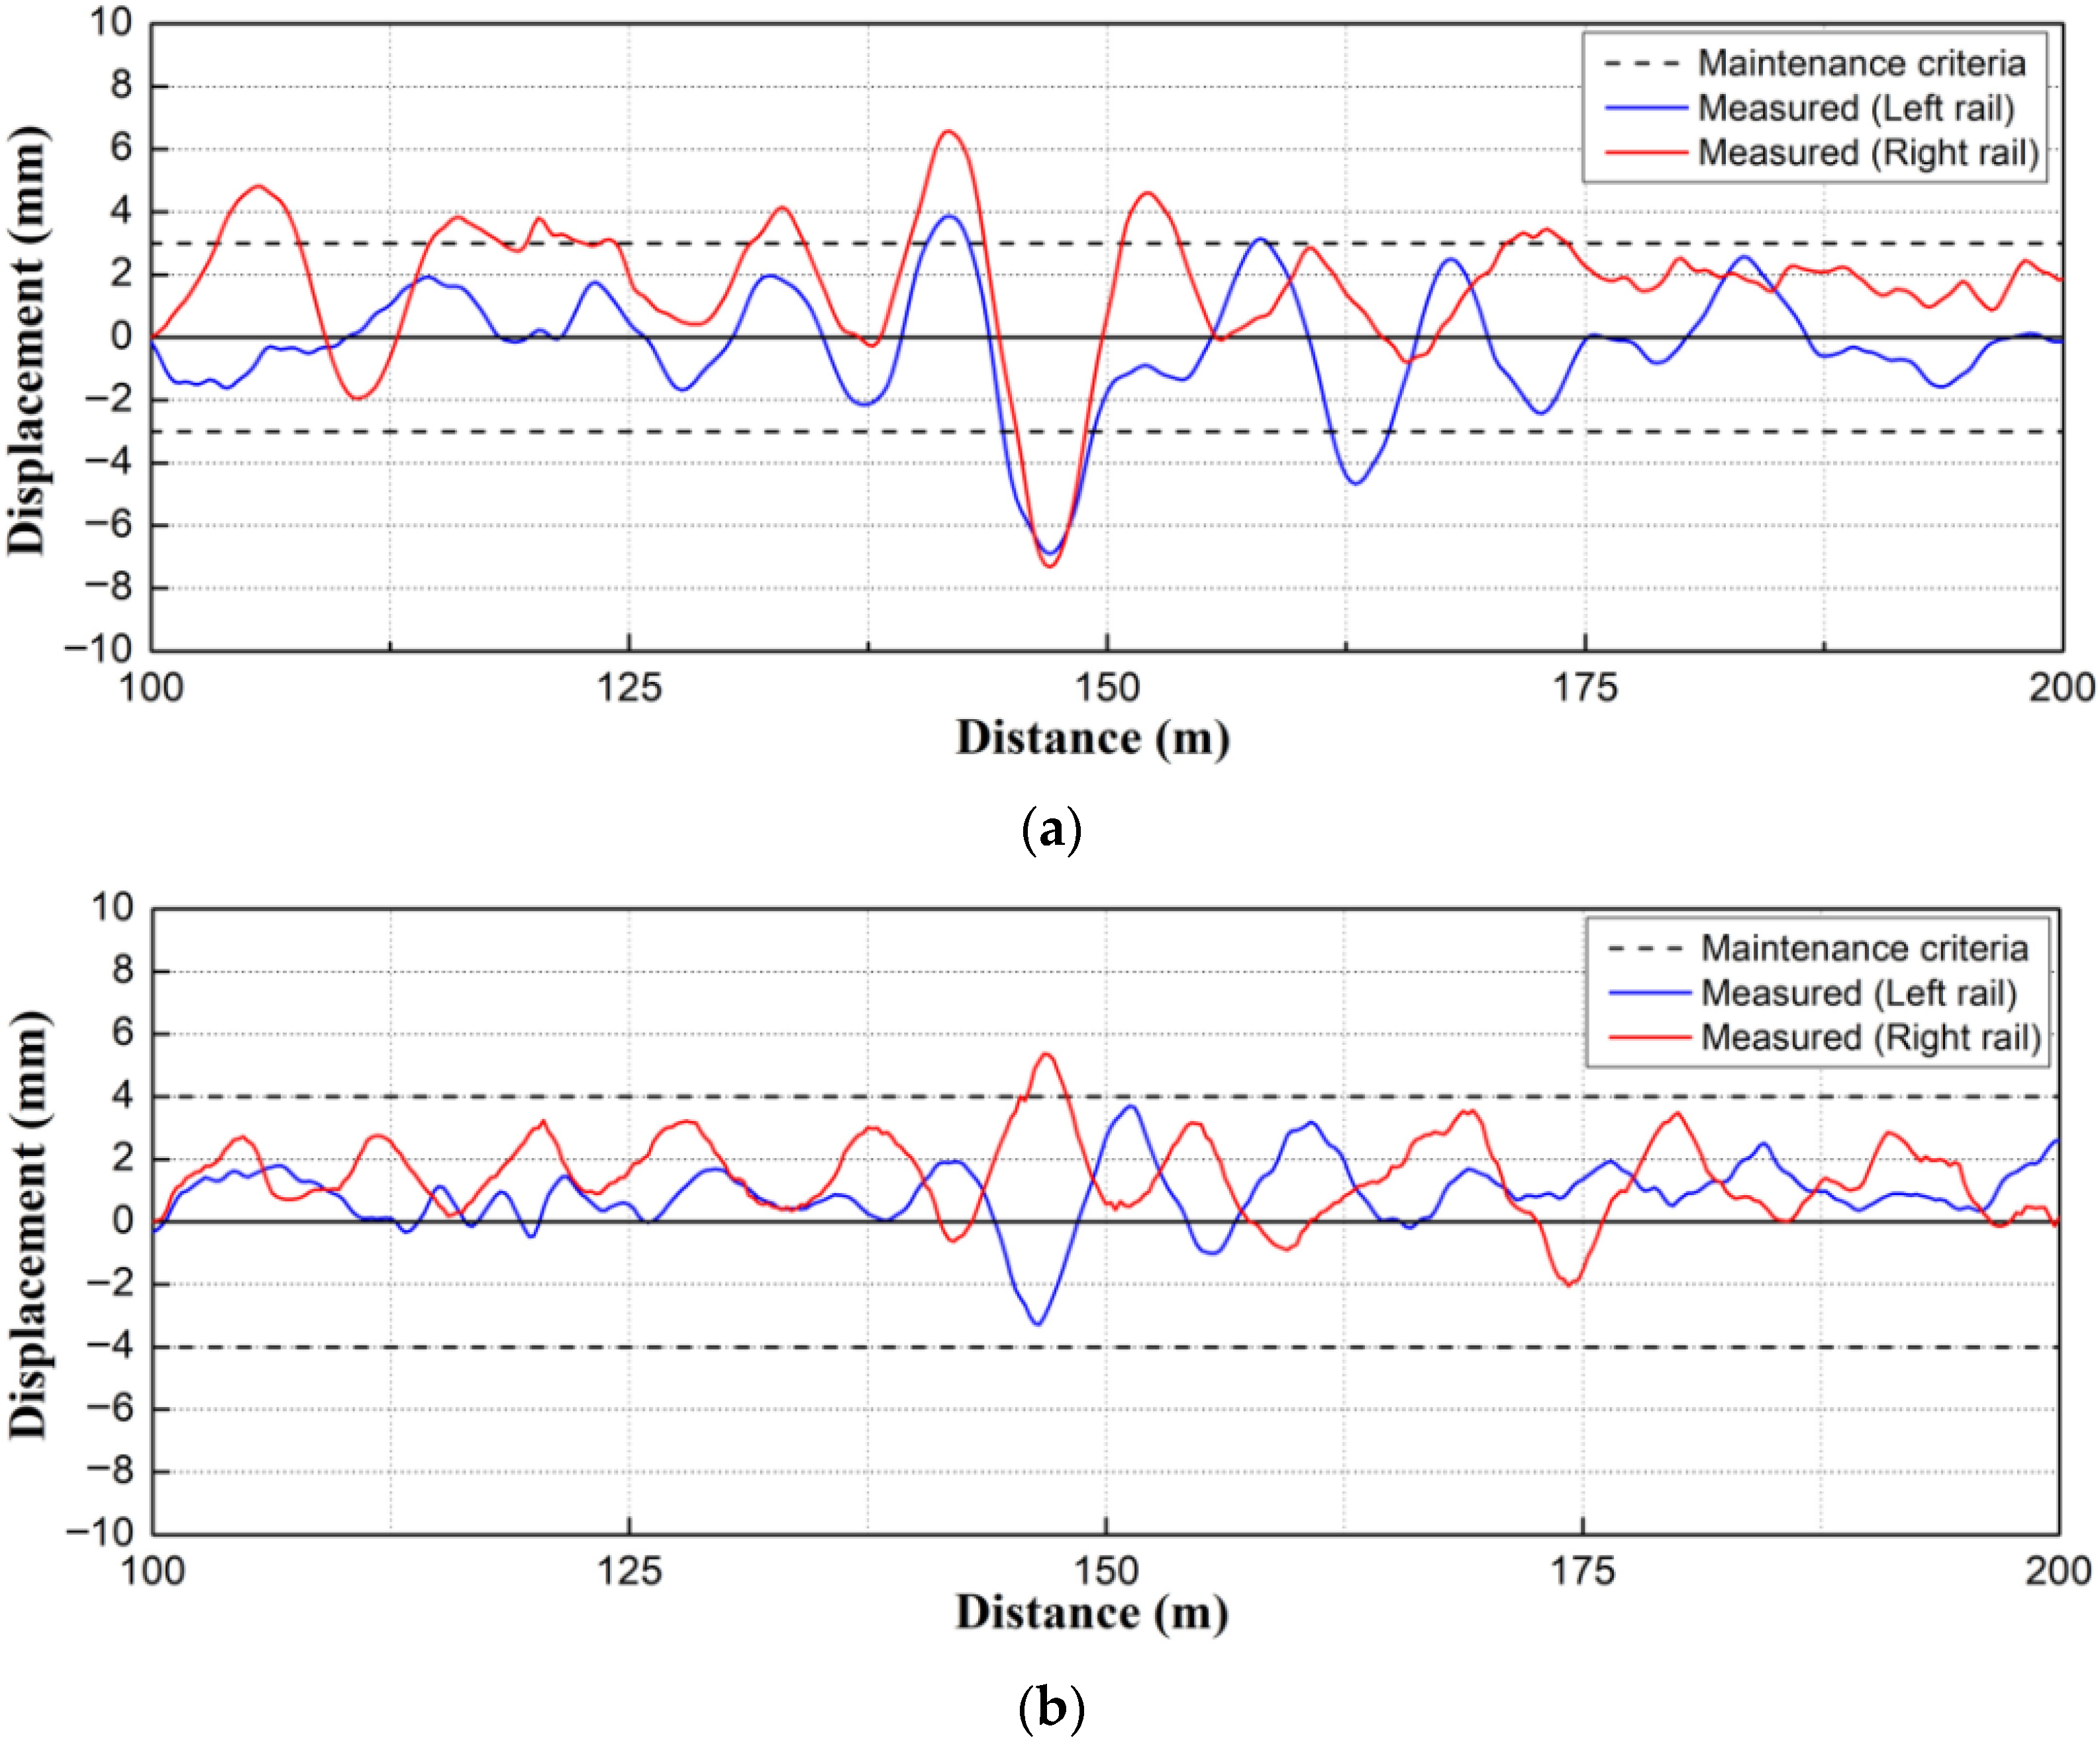
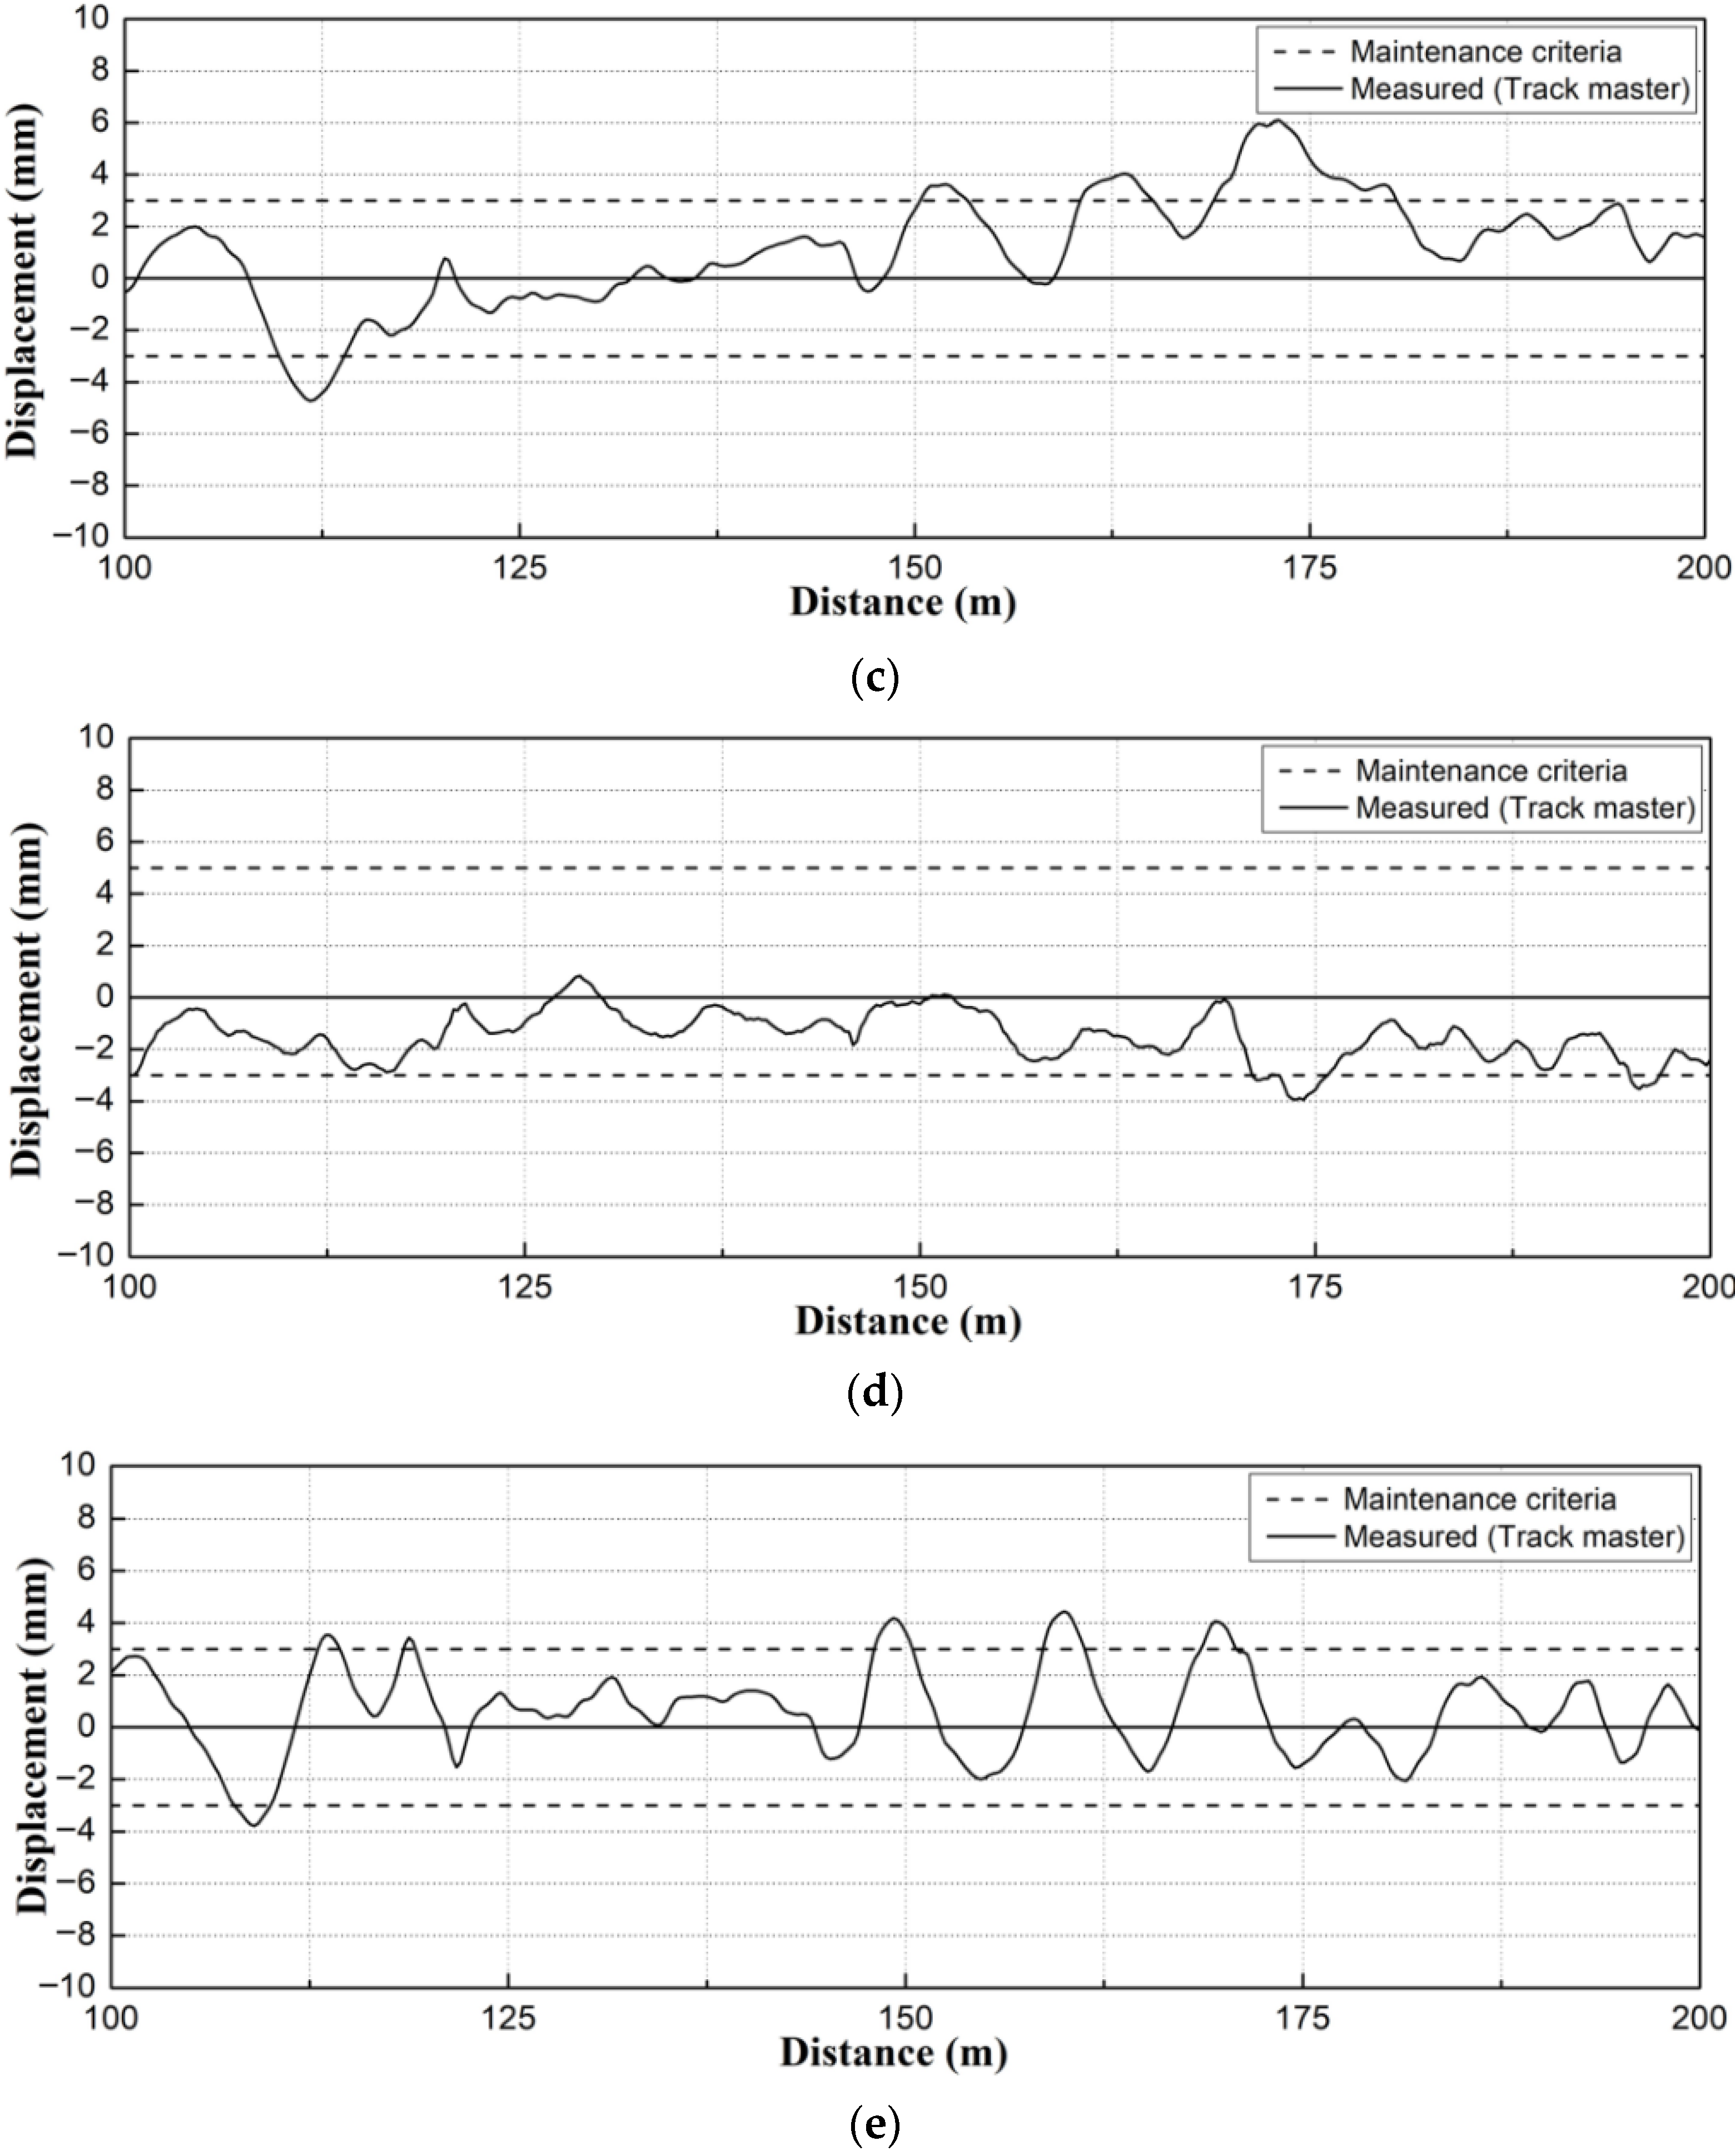
As shown in
Figure 11a, the measurements of the track irregularities of the HSR T1 track in the target section yielded maximum vertical profiles for the left and right rails of ~6.93 mm and ~7.41 mm, respectively. These exceeded the maintenance criteria by values in the range of 4–4.5 mm. In addition, it was found that the vertical profile was larger in the right compared with the left rail, and the right rail of the HSR T1 track was more vulnerable to the vertical profile due to the adjacent excavations.
As a result of the alignment analysis, as shown in
Figure 11b, the maximum alignments of the left and right rails were ~3.87 mm and ~5.04 mm, respectively, which exceeded the maintenance criteria by 1–2 mm. Additionally, a larger alignment occurred on the right rail compared with the left rail, and the right rail of the HSR T1 track was more vulnerable to alignment owing to the adjacent excavations.
Regarding the cross level, the maximum cross level was ~5.16 mm, as shown in
Figure 11c. This outcome exceeded the maintenance criteria by ~2 mm. The cross level caused by adjacent excavation was analyzed to be ~1.72 times greater than the maintenance criteria value.
As shown in
Figure 11d, the maximum gauge was ~4.36 mm and exceeded the maintenance criteria value by ~2 mm. Additionally, the gauge caused by adjacent excavations was analyzed to be ~2.18 times larger than the maintenance criteria value.
Regarding the twist, its maximum value was ~4.62 mm, which exceeded the maintenance criteria by ~1.5 mm, as shown in
Figure 11e. The result confirmed that the gauge caused by the adjacent excavation was ~1.54 times larger than the maintenance criteria value.
As a result of the track-irregularity analysis with the use of the Track master, the track irregularities in the vertical direction were predominantly large at the tunnel construction section located at the center of the measurement section, and the range of the influence of the track irregularities was ~20 m around the tunnel construction site.
In particular, a clear trend of increase in the vertical profile was observed around the center of the measurement section at ~150 m, which was the center of the tunnel construction, and the cross level, which represents the height difference between the left and right rails, was the largest at the position which was 25 m or more away from the center.
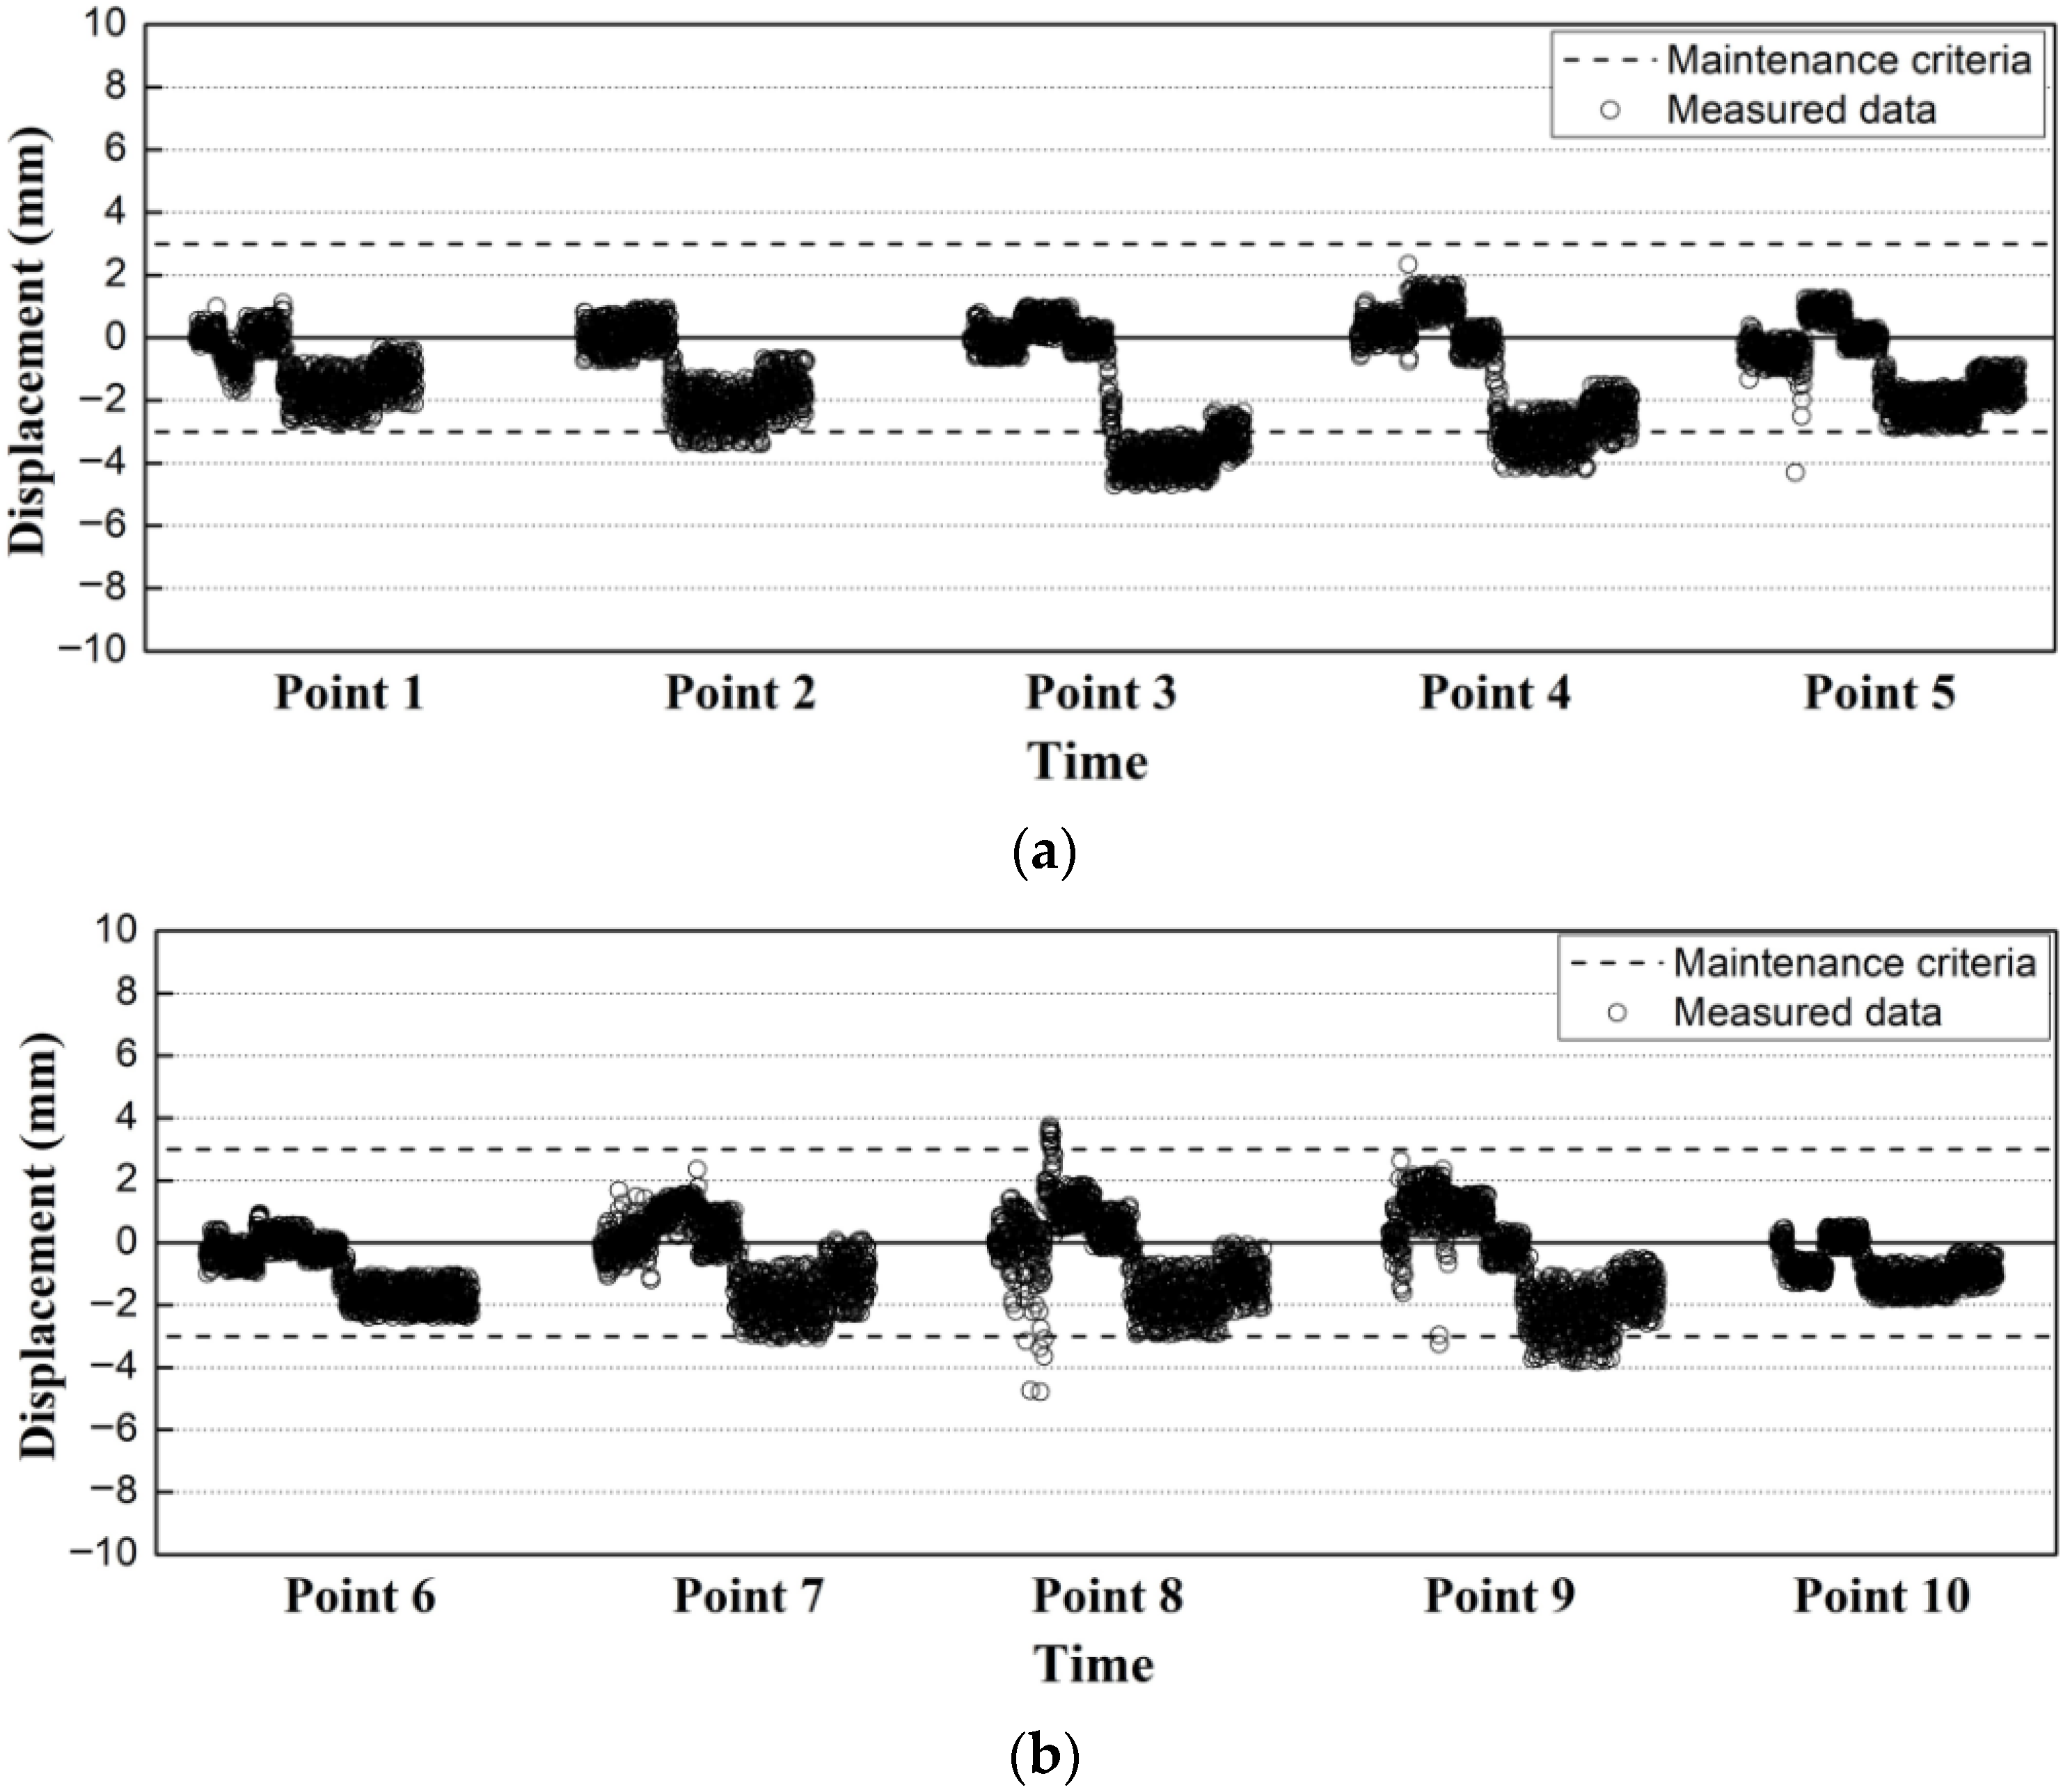
3.2.2. Track Settlement Measurement System
The track settlement was measured in the HSR T1 and HSR T2 sections, and the measurement was conducted over a total of 20 m (10 each at 2 m) in each section.
Figure 12 shows the measured results of the sections HSR T1 and HSR T2 [
17].
To examine the characteristics of the settlement behavior of the tracks due to tunnel excavation, an RM sensor was installed, and initial values were set before the onset of the tunnel excavation work. All of the data were collected during the tunnel excavation process.
In the case of the HSR T1 section, the maximum displacement was measured to be ~5 mm, and the points 3, 4, and 9 showed a large displacement difference.
Conversely, there was no significant displacement at the center of the tunnel excavation, which corresponds to points 5 and 6, thus indicating that the tunnel excavation had an effect on the ends of the measurement section.
The results show that drastic settlement behavior occurred in the early stage of tunnel excavation, and the settlement during the process of tunnel excavation was mostly maintained at a constant level. In addition, it was confirmed that the settlement was gradually restored to its initial value at the stage near the completion of the tunnel excavation.
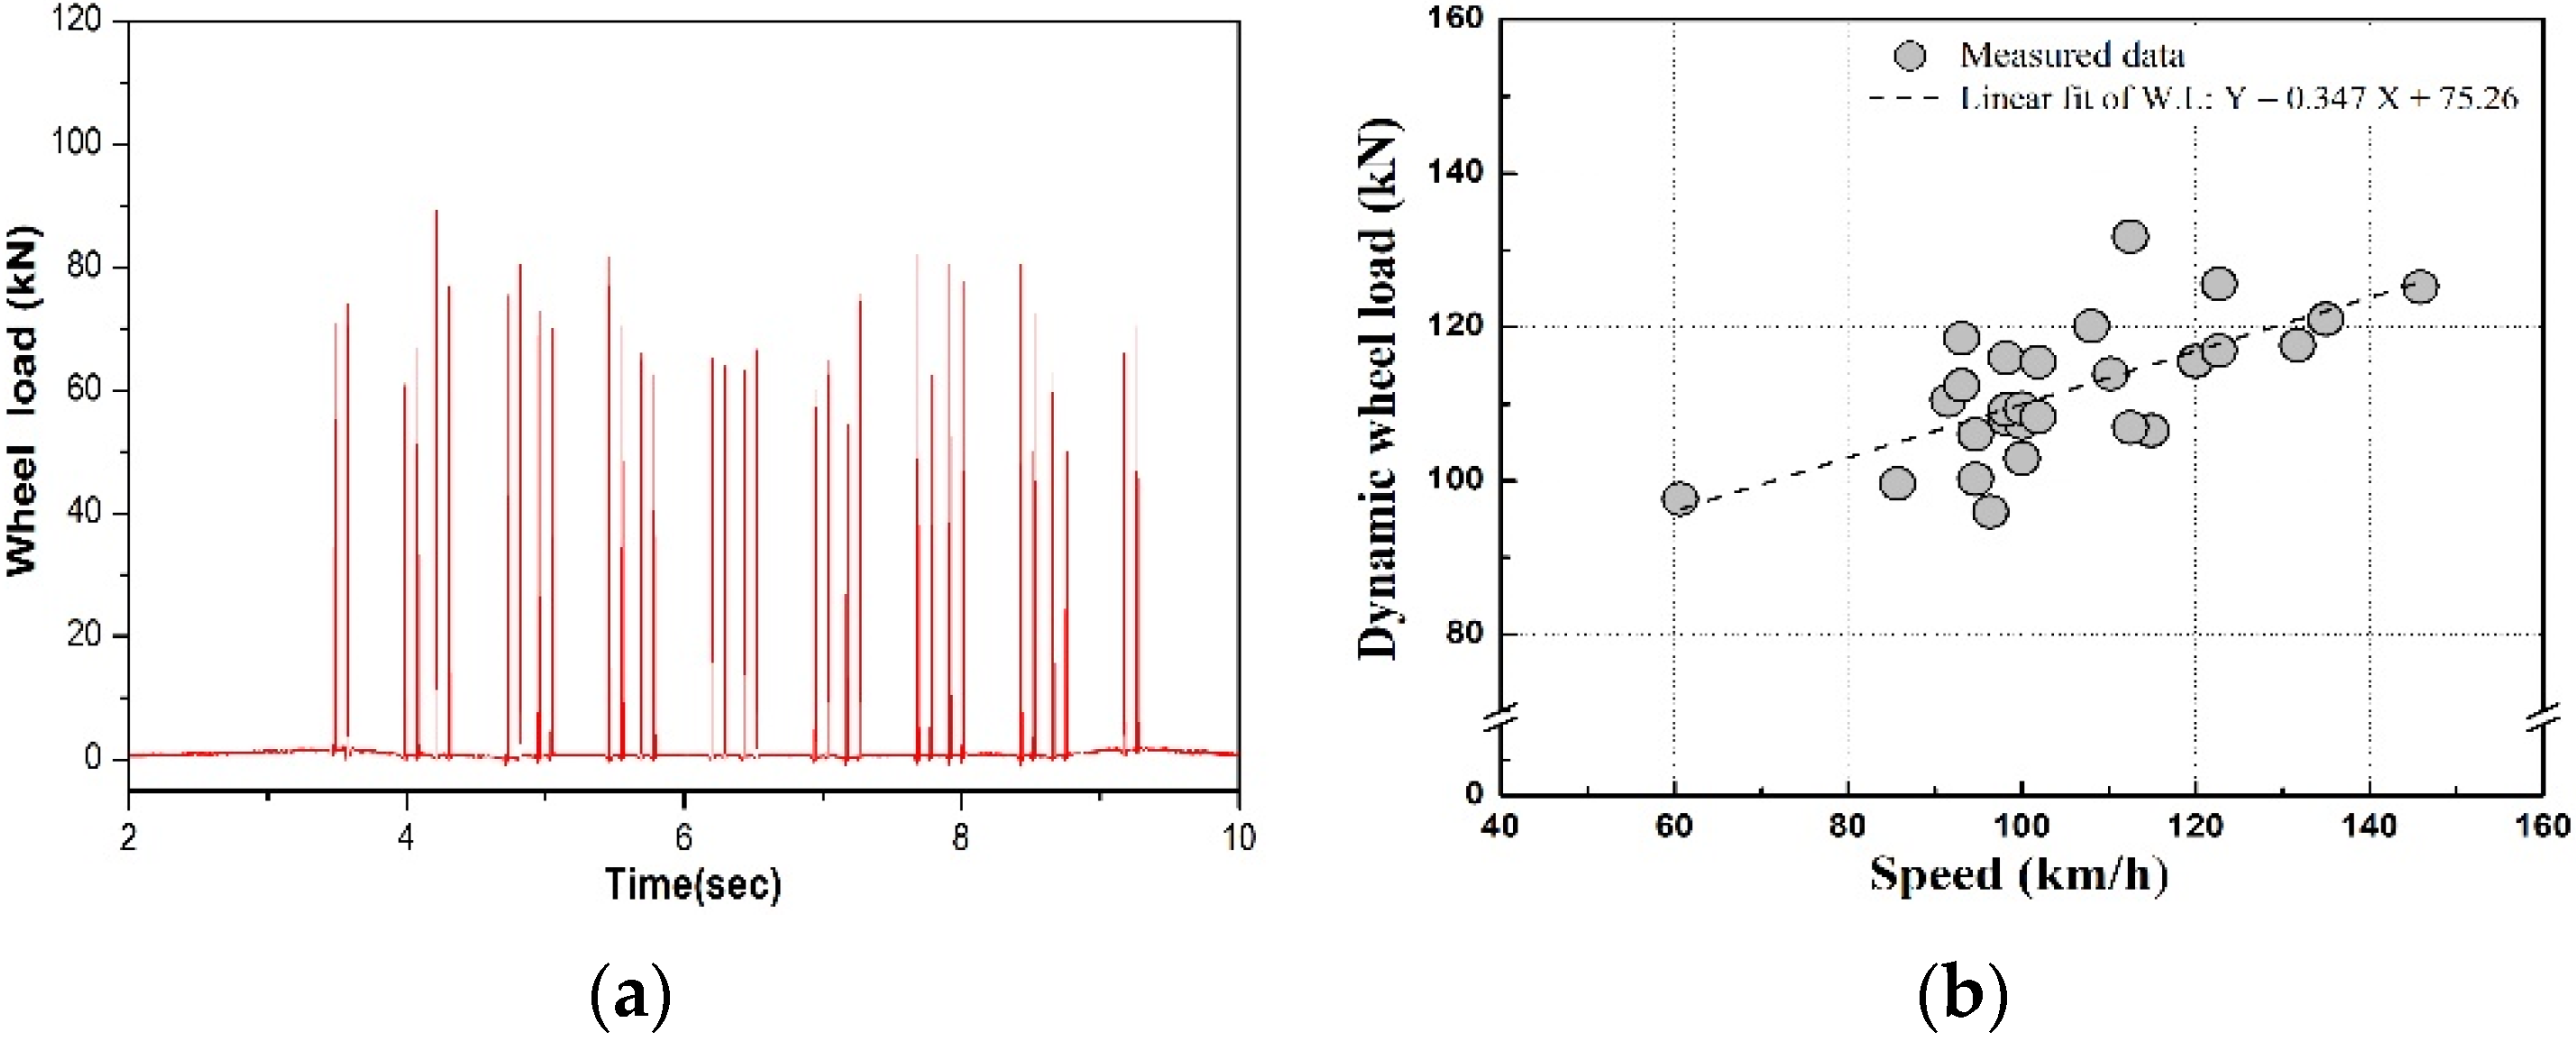
3.3. Dynamic-Wheel-Load Measurement
The levels of the dynamic responses of the track were analyzed as the train passed along the ballasted track. As a result of measuring the dynamic wheel load for each passed-train speed, the dynamic wheel load increased significantly at 115 km/h.
Figure 13 shows examples of the measured waveforms of the wheel load, vertical rail displacement, and vertical railroad tie displacement obtained from the field measurements [
17].
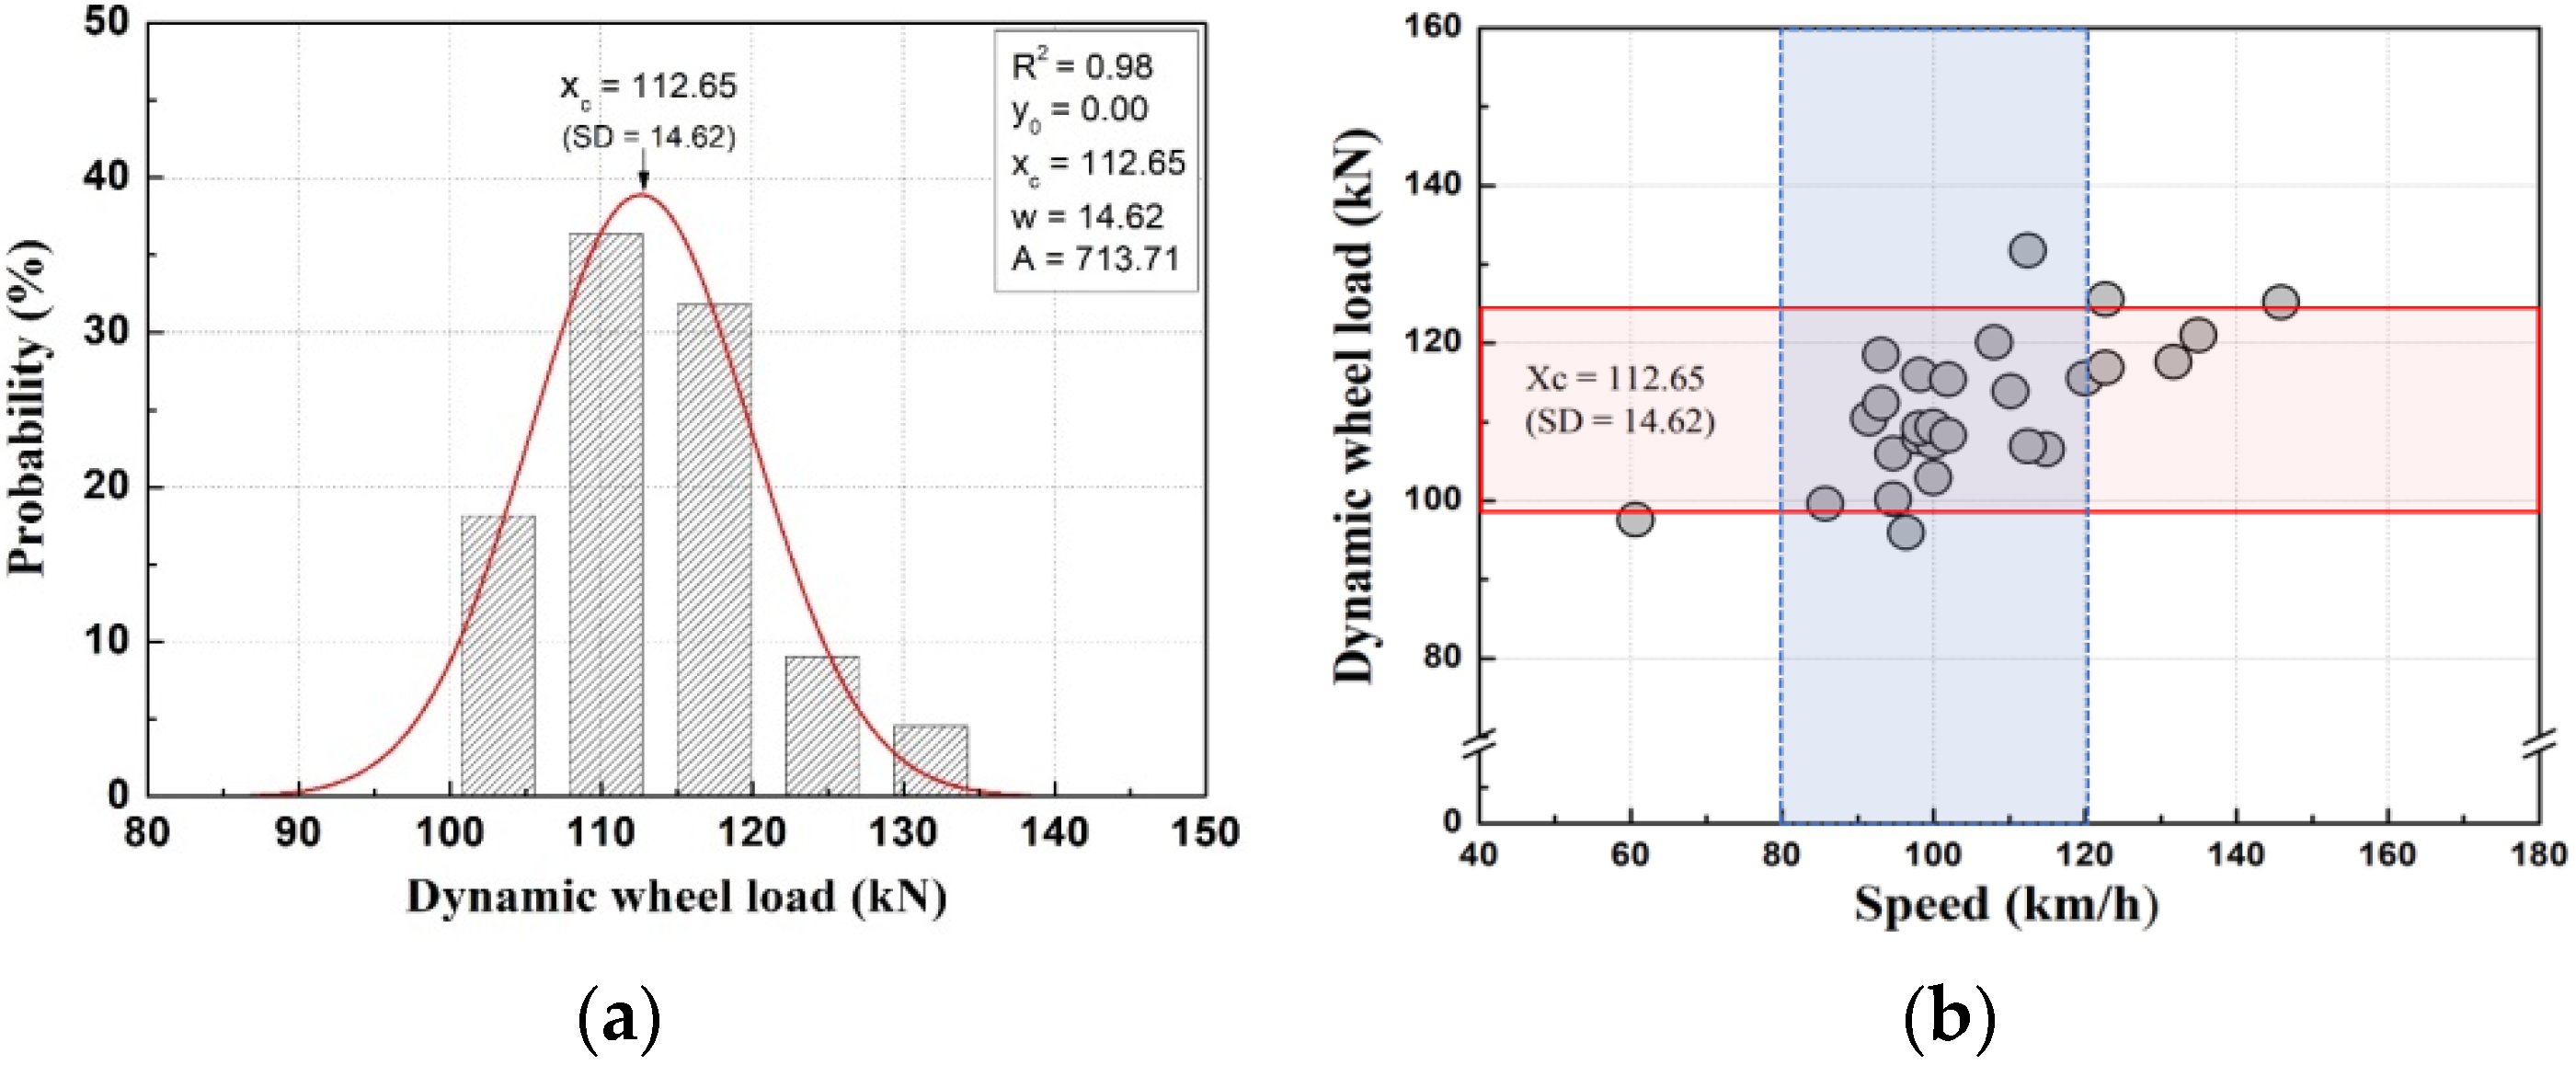
As shown in
Figure 14 [
17], to calculate the representative value of the dynamic wheel load of the ballasted track, the train speed was set to 80–120 km/h in consideration of the average train-operating-speed range of the target section of this study, and the dynamic-wheel-load data for the corresponding speed range was used and applied to a Gaussian probability-density-function analysis.
As a result of the Gaussian probability-density-function analysis based on the dynamic-wheel-load measurement outcomes according to the train-speed change that was measured on the ballasted track on a serviced railway line (which did not contain any track irregularities), the dynamic wheel load which corresponded to the train-speed range of 80–120 km/h was 112.65 ± 14.62 kN, and the range of the total wheel load was analyzed to be in the range of 98–127 kN. The correlation coefficient (R2) of the probability density function was 0.98, which verified the appropriateness of the probability density function for the measured data.
In addition, the standard deviation was analyzed to be within ~10% of the probability mean value, thus indicating a good data spread. This is because the dynamic-wheel-load values were measured on a ballasted track which did not contain any track irregularities.
4. Analysis and Discussion
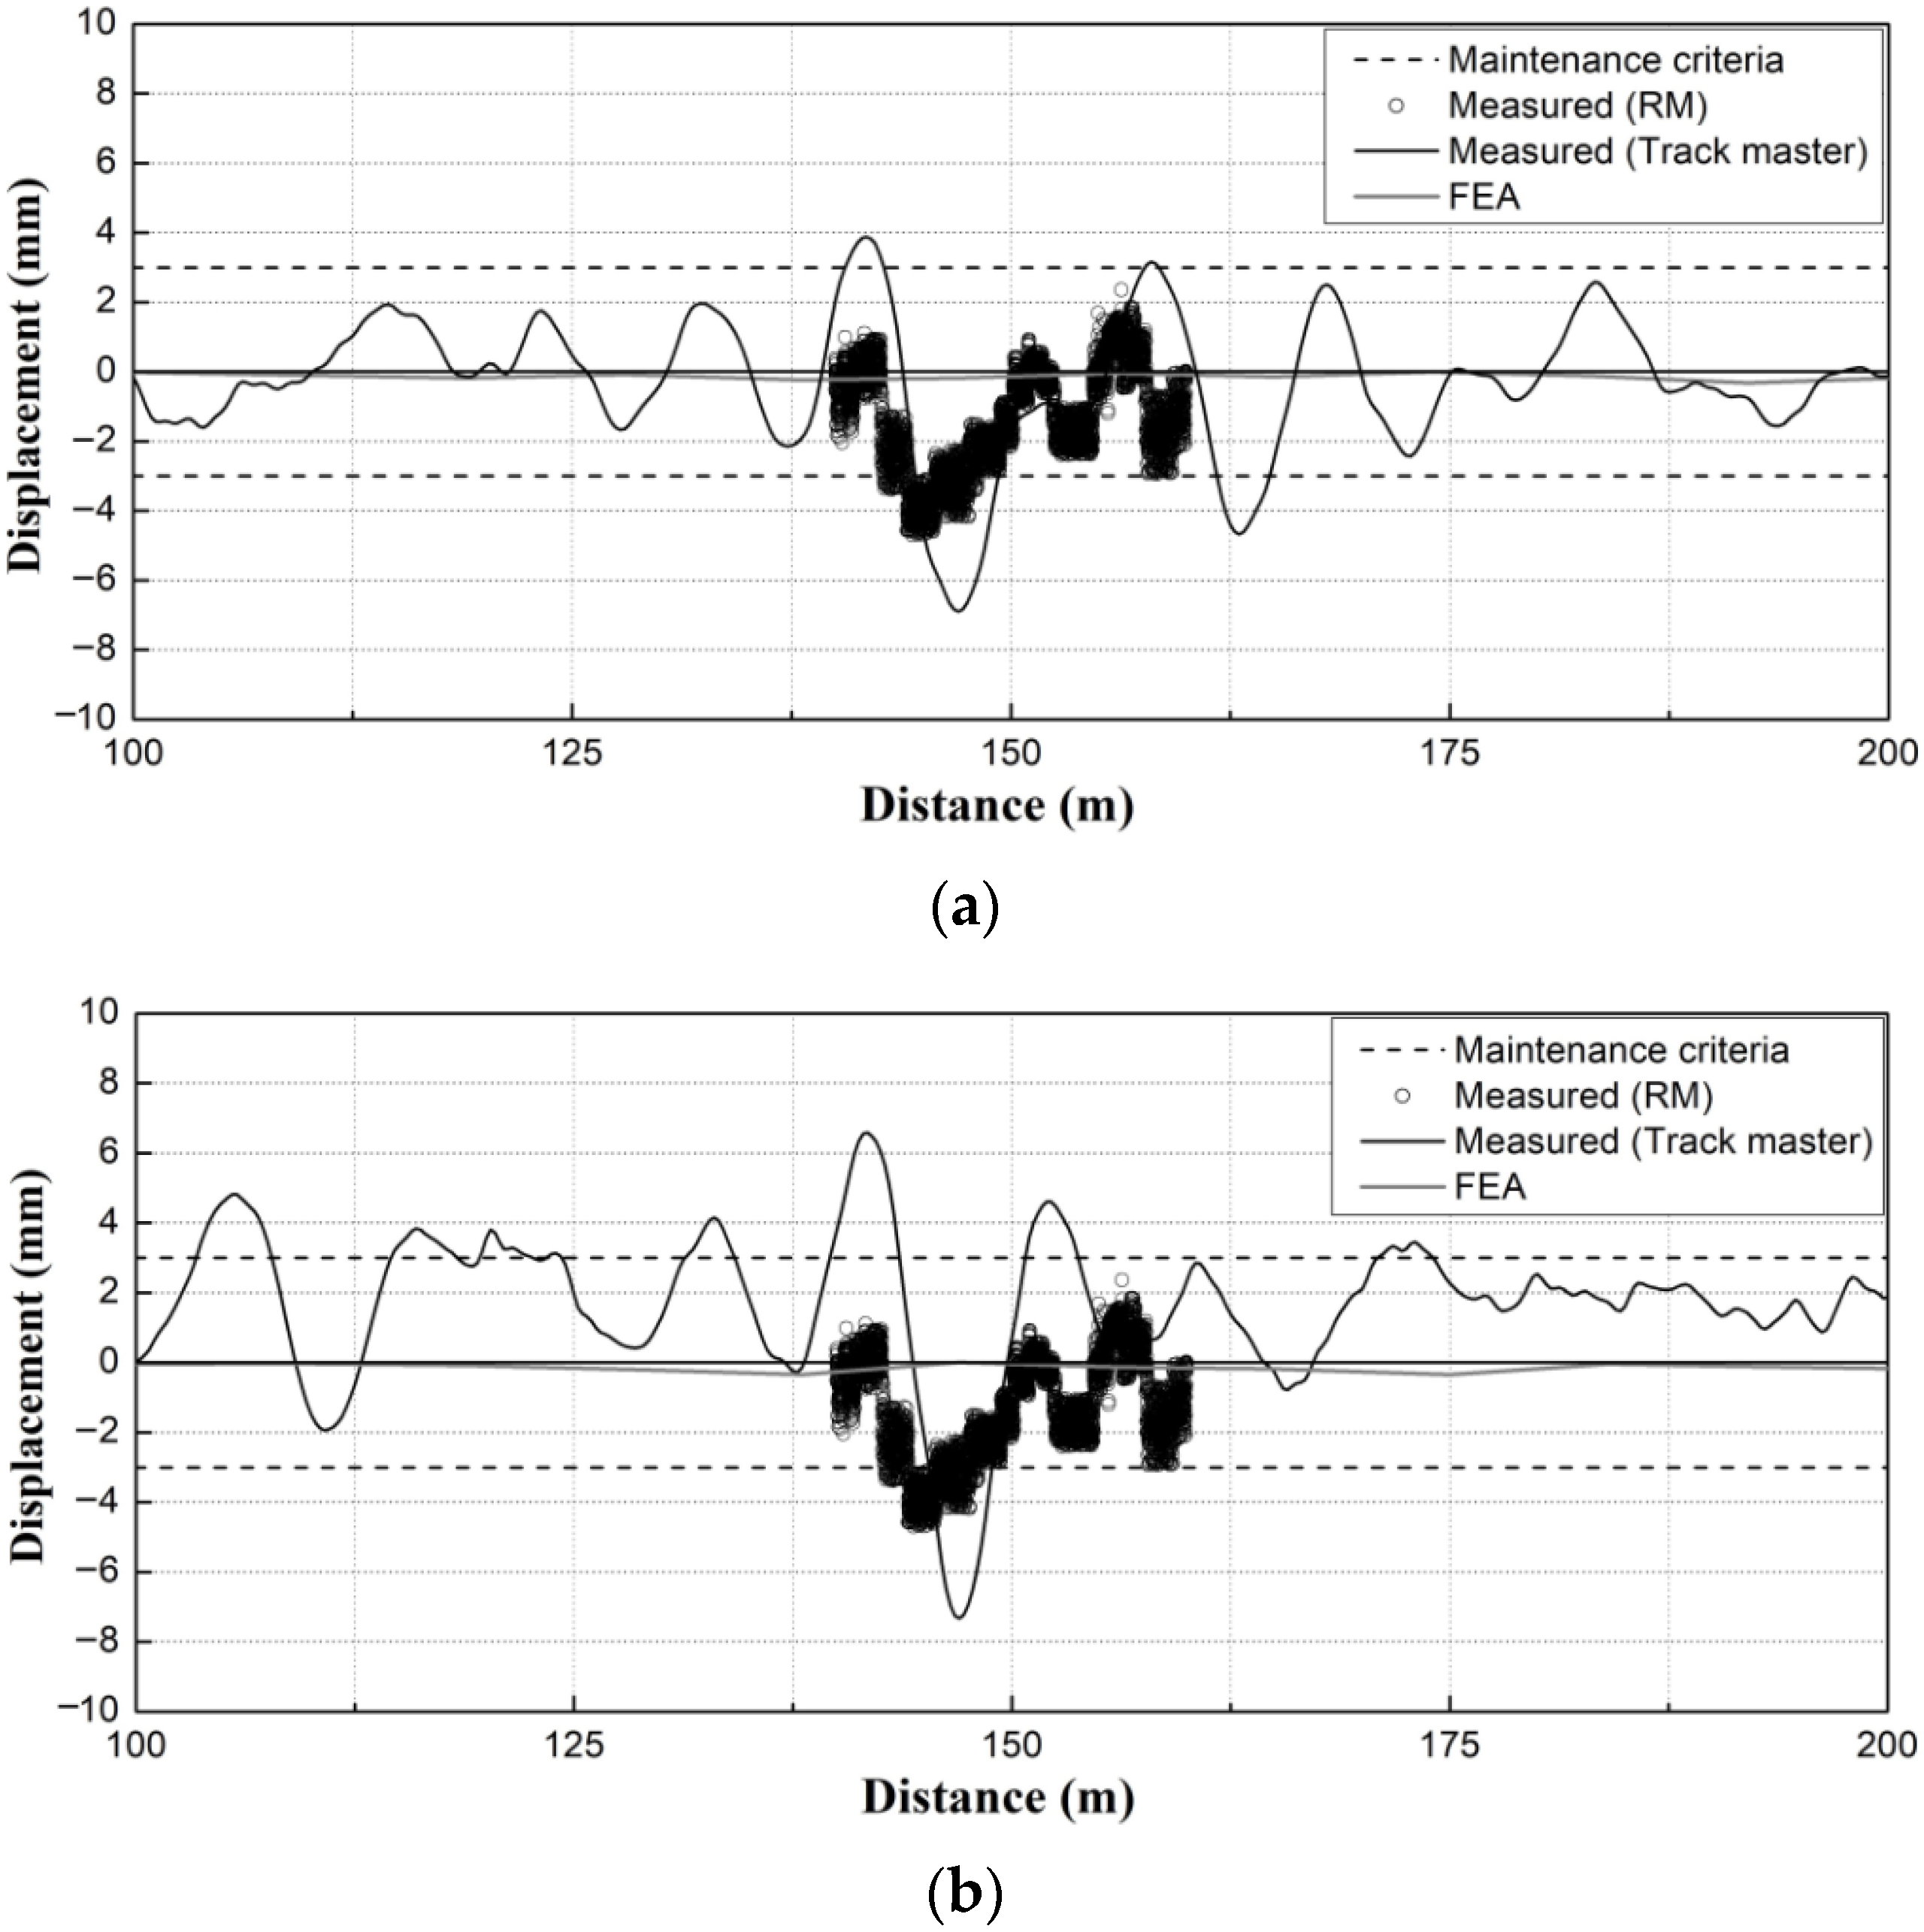
4.1. Comparative Analysis of Field Measurements and Numerical-Analysis Results
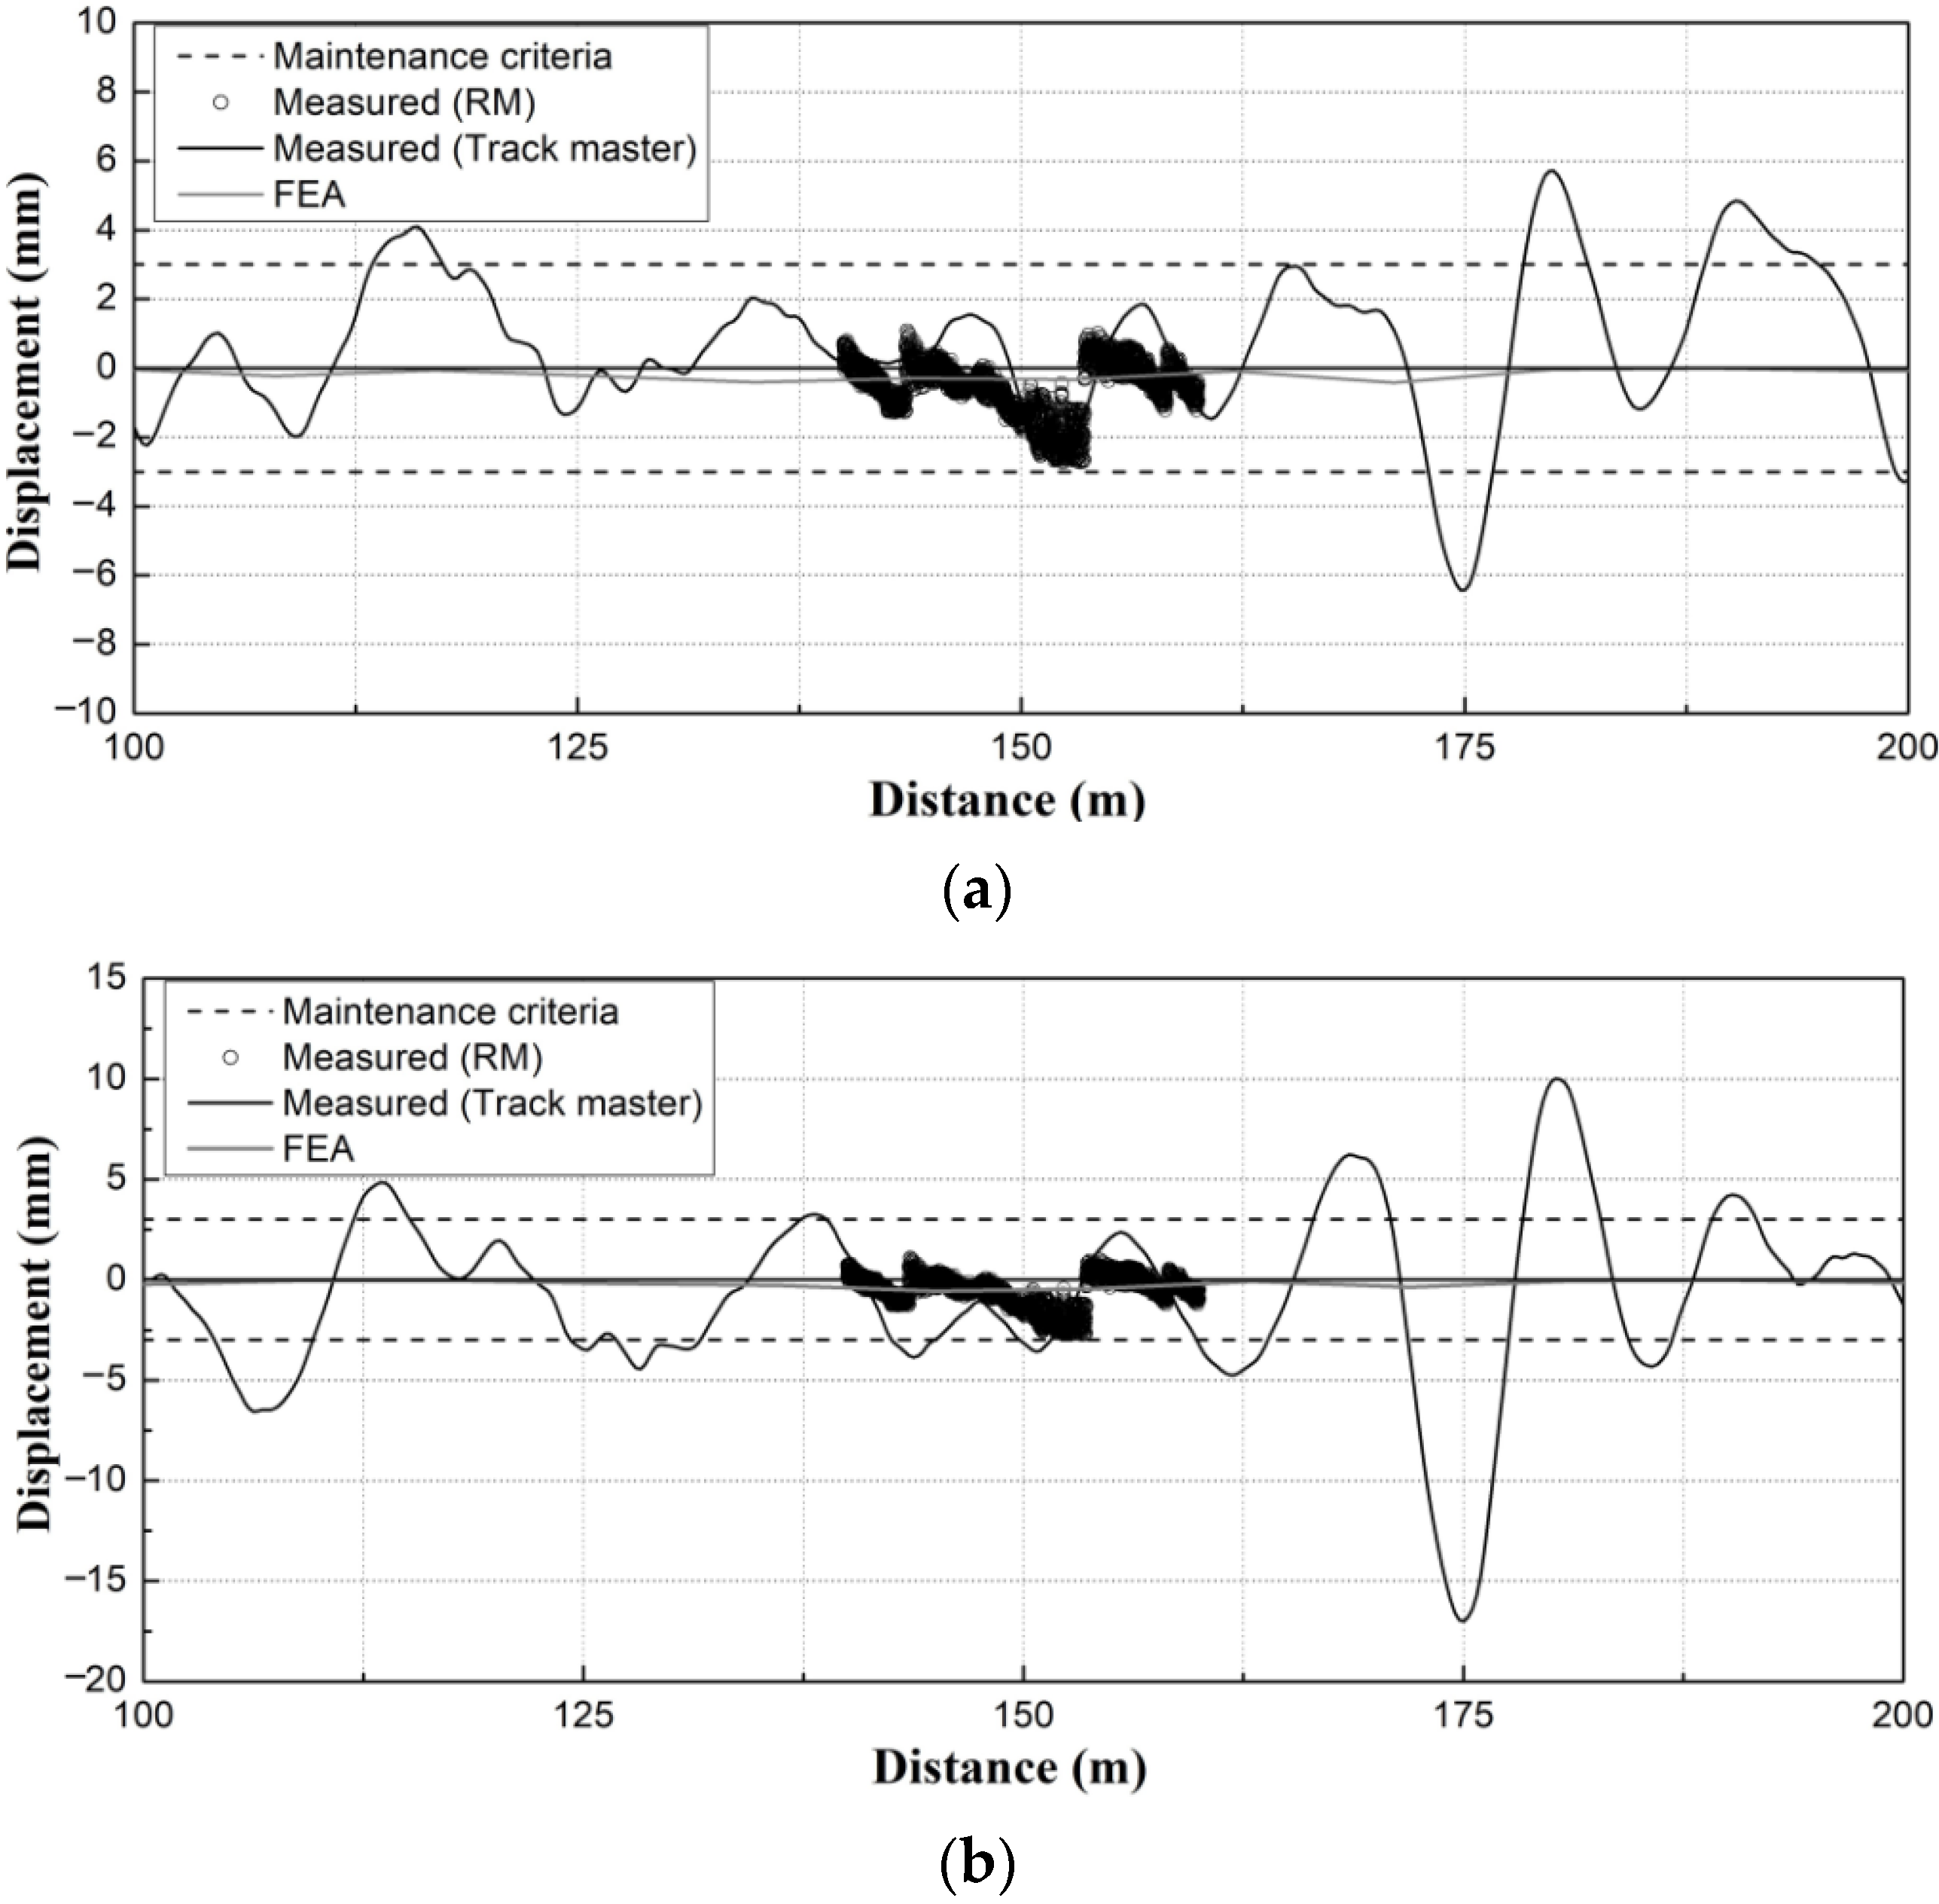
To evaluate the effect of track irregularities on the ballasted track on a serviced railway line due to adjacent excavation, the measured data of the vertical profile and track settlement and the numerical-analysis results were comparatively analyzed as shown in
Figure 15.
In terms of the position of the maximum vertical profile, there was a difference between the numerical-analysis and field-measurement results, and the maximum difference was approximately 3–7 mm.
The field-measurement results measured by the RM sensor and the results measured by the Track master exhibited a similar trend. In all of the field-measurement results, which used the RM sensor and Track master, and the numerical-analysis results, the vertical profile was the largest at the center of the excavation site.
Additionally, in the case of the HSR T1 section, the maximum vertical profile measured by the Track master was ~6.9 mm, and the maximum vertical profile measured by the RM sensor was ~4.7 mm, which was analyzed to be ~31.8% smaller than the measurement value of the Track master.
As shown in
Figure 16, in the case of HSR T2 section, the positions of the maximum vertical profile measured by the RM sensor and by the Track master (installed at the center of the excavation area) did not agree. Moreover, in the case of the RM sensor measurements and the numerical-analysis results, a large vertical profile was observed at the center of the excavation area. However, in the case of the Track master measurement, a large vertical profile was measured at a location ~25 m away from the center of the excavation area.
As a result of the vertical profile analysis, the maximum vertical profile measured by the Track master at the location at which the RM sensor was installed was ~2.83 mm, and the maximum vertical profile measured by the RM sensor was ~2.77 mm, which was ~2% smaller than the value measured by the Track master.
4.2. Comparative Analysis between Wheel-Rail-Interaction-Analysis Results and Field Measurements of Track Geometry
We aimed to analyze the Wheel-Rail interaction force based on the track-irregularity data obtained from field measurements.
According to previous studies [
2,
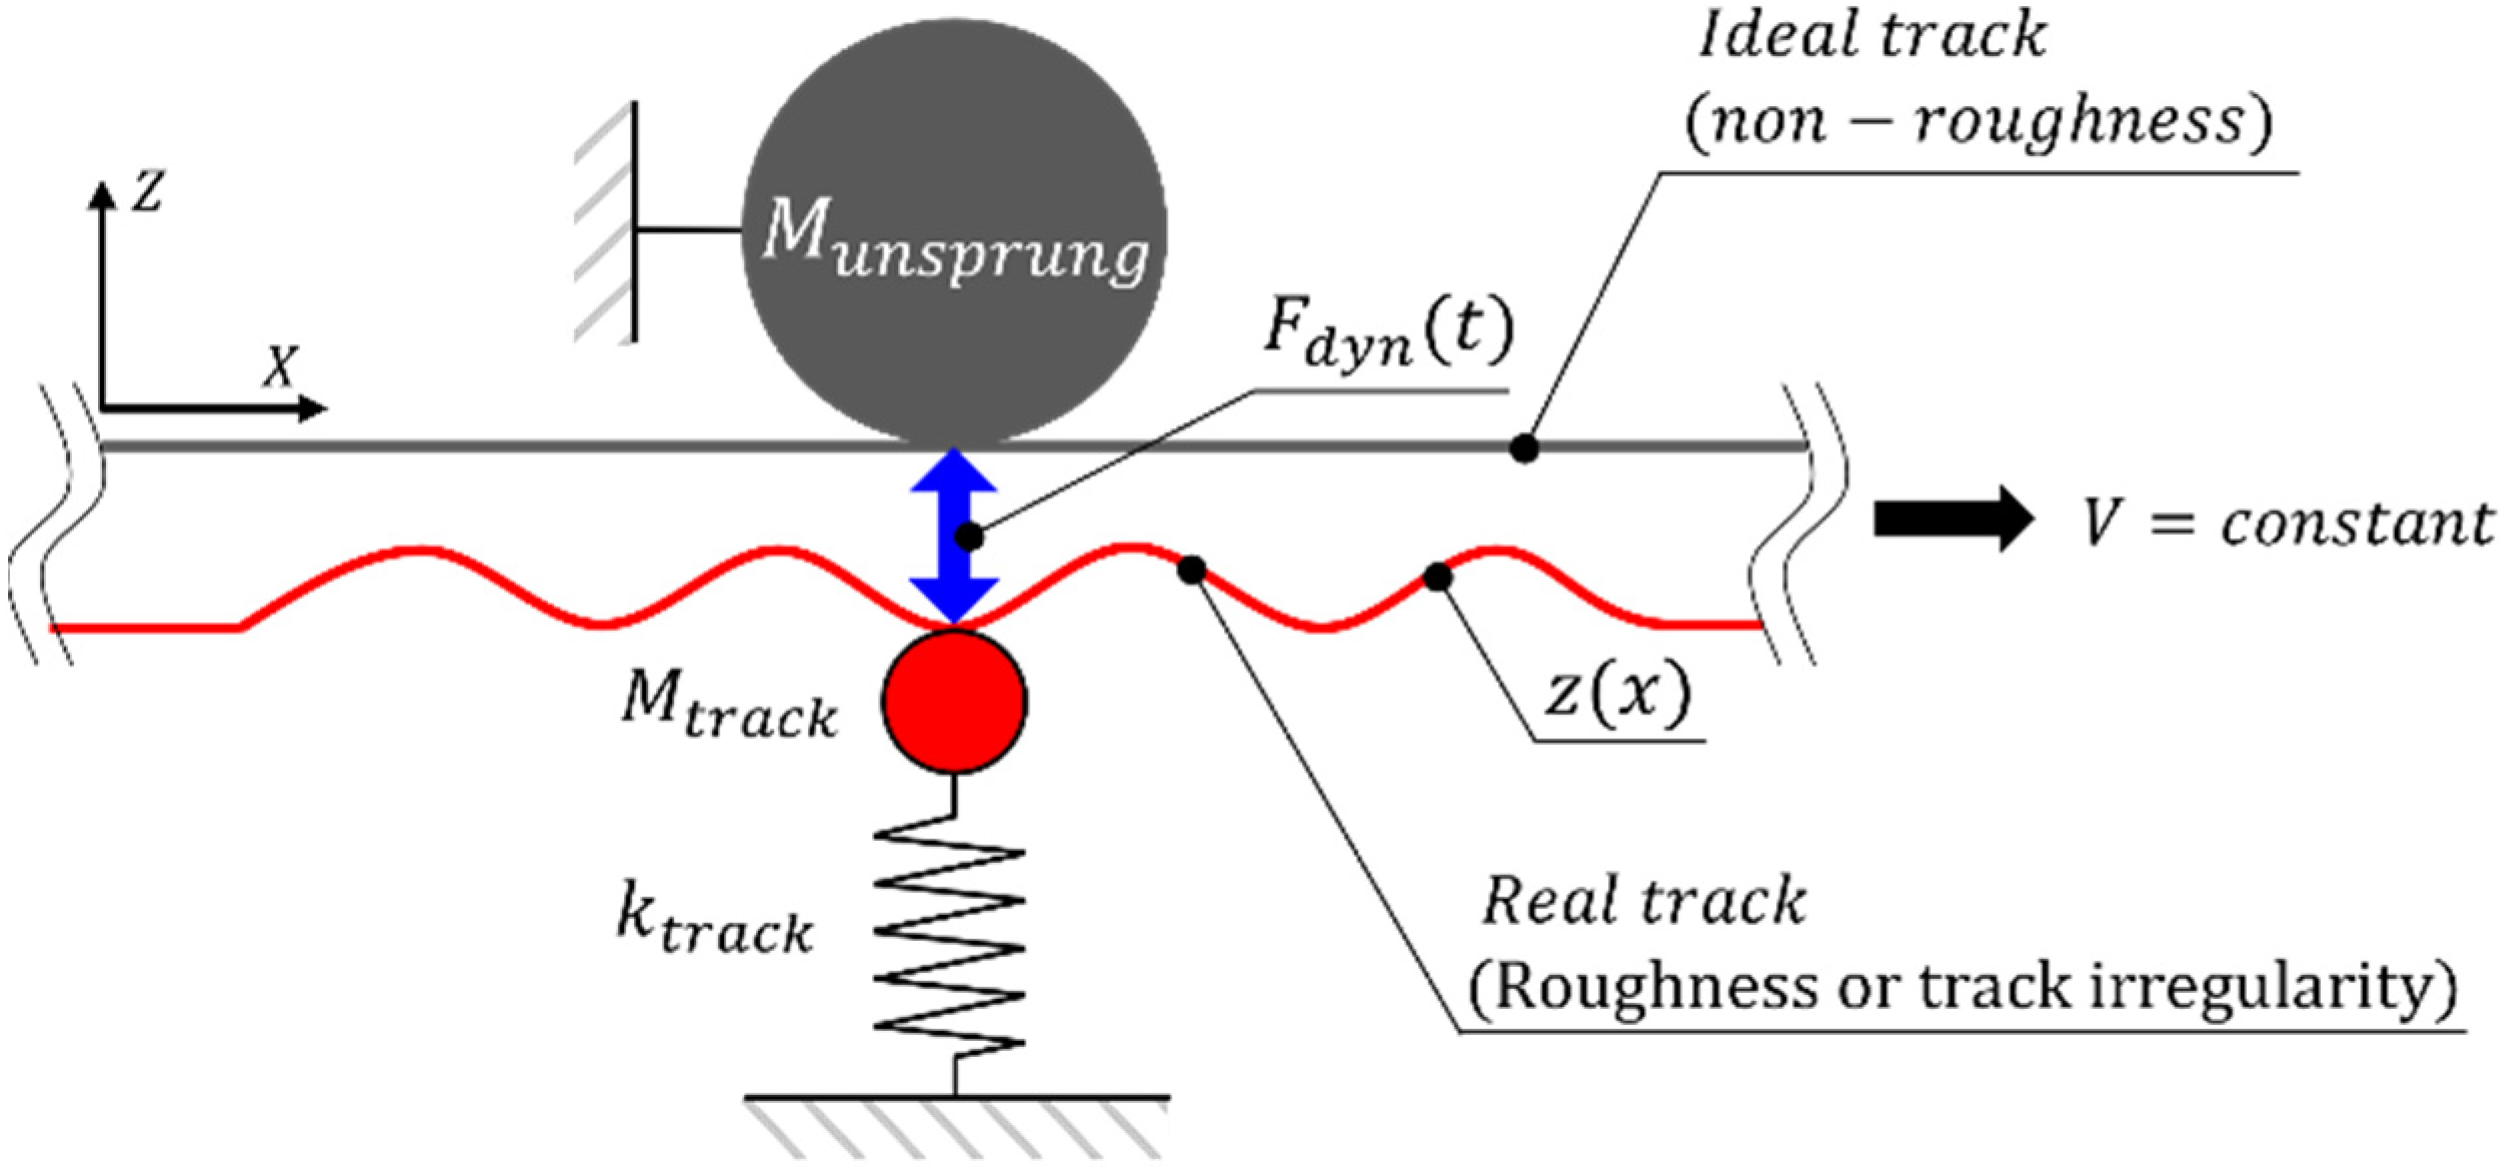
3], the irregularity in the vertical direction of the rail surface in contact with the wheel increases the Wheel-Rail interaction force, thus resulting in an increase in the impact force. The dynamic model considering the Wheel-Rail interaction is shown in
Figure 17 [
2,
17]. The dynamic Wheel-Rail interaction force was calculated using Equation (1) [
2,
3].
where
M = equivalence mass (Wheel-Rail system),
Lo = reference wavelength,
z =
zosin(2
πvt/L), and
β = dimensionless calibration factor.
The dynamic model of the track that considers the Wheel-Rail interaction force is based on a principle which allows the calculation of the increase in the inertia force caused by the irregularity of the rail surface in contact with the wheel attributed to the increase in the Wheel-Rail contact load.
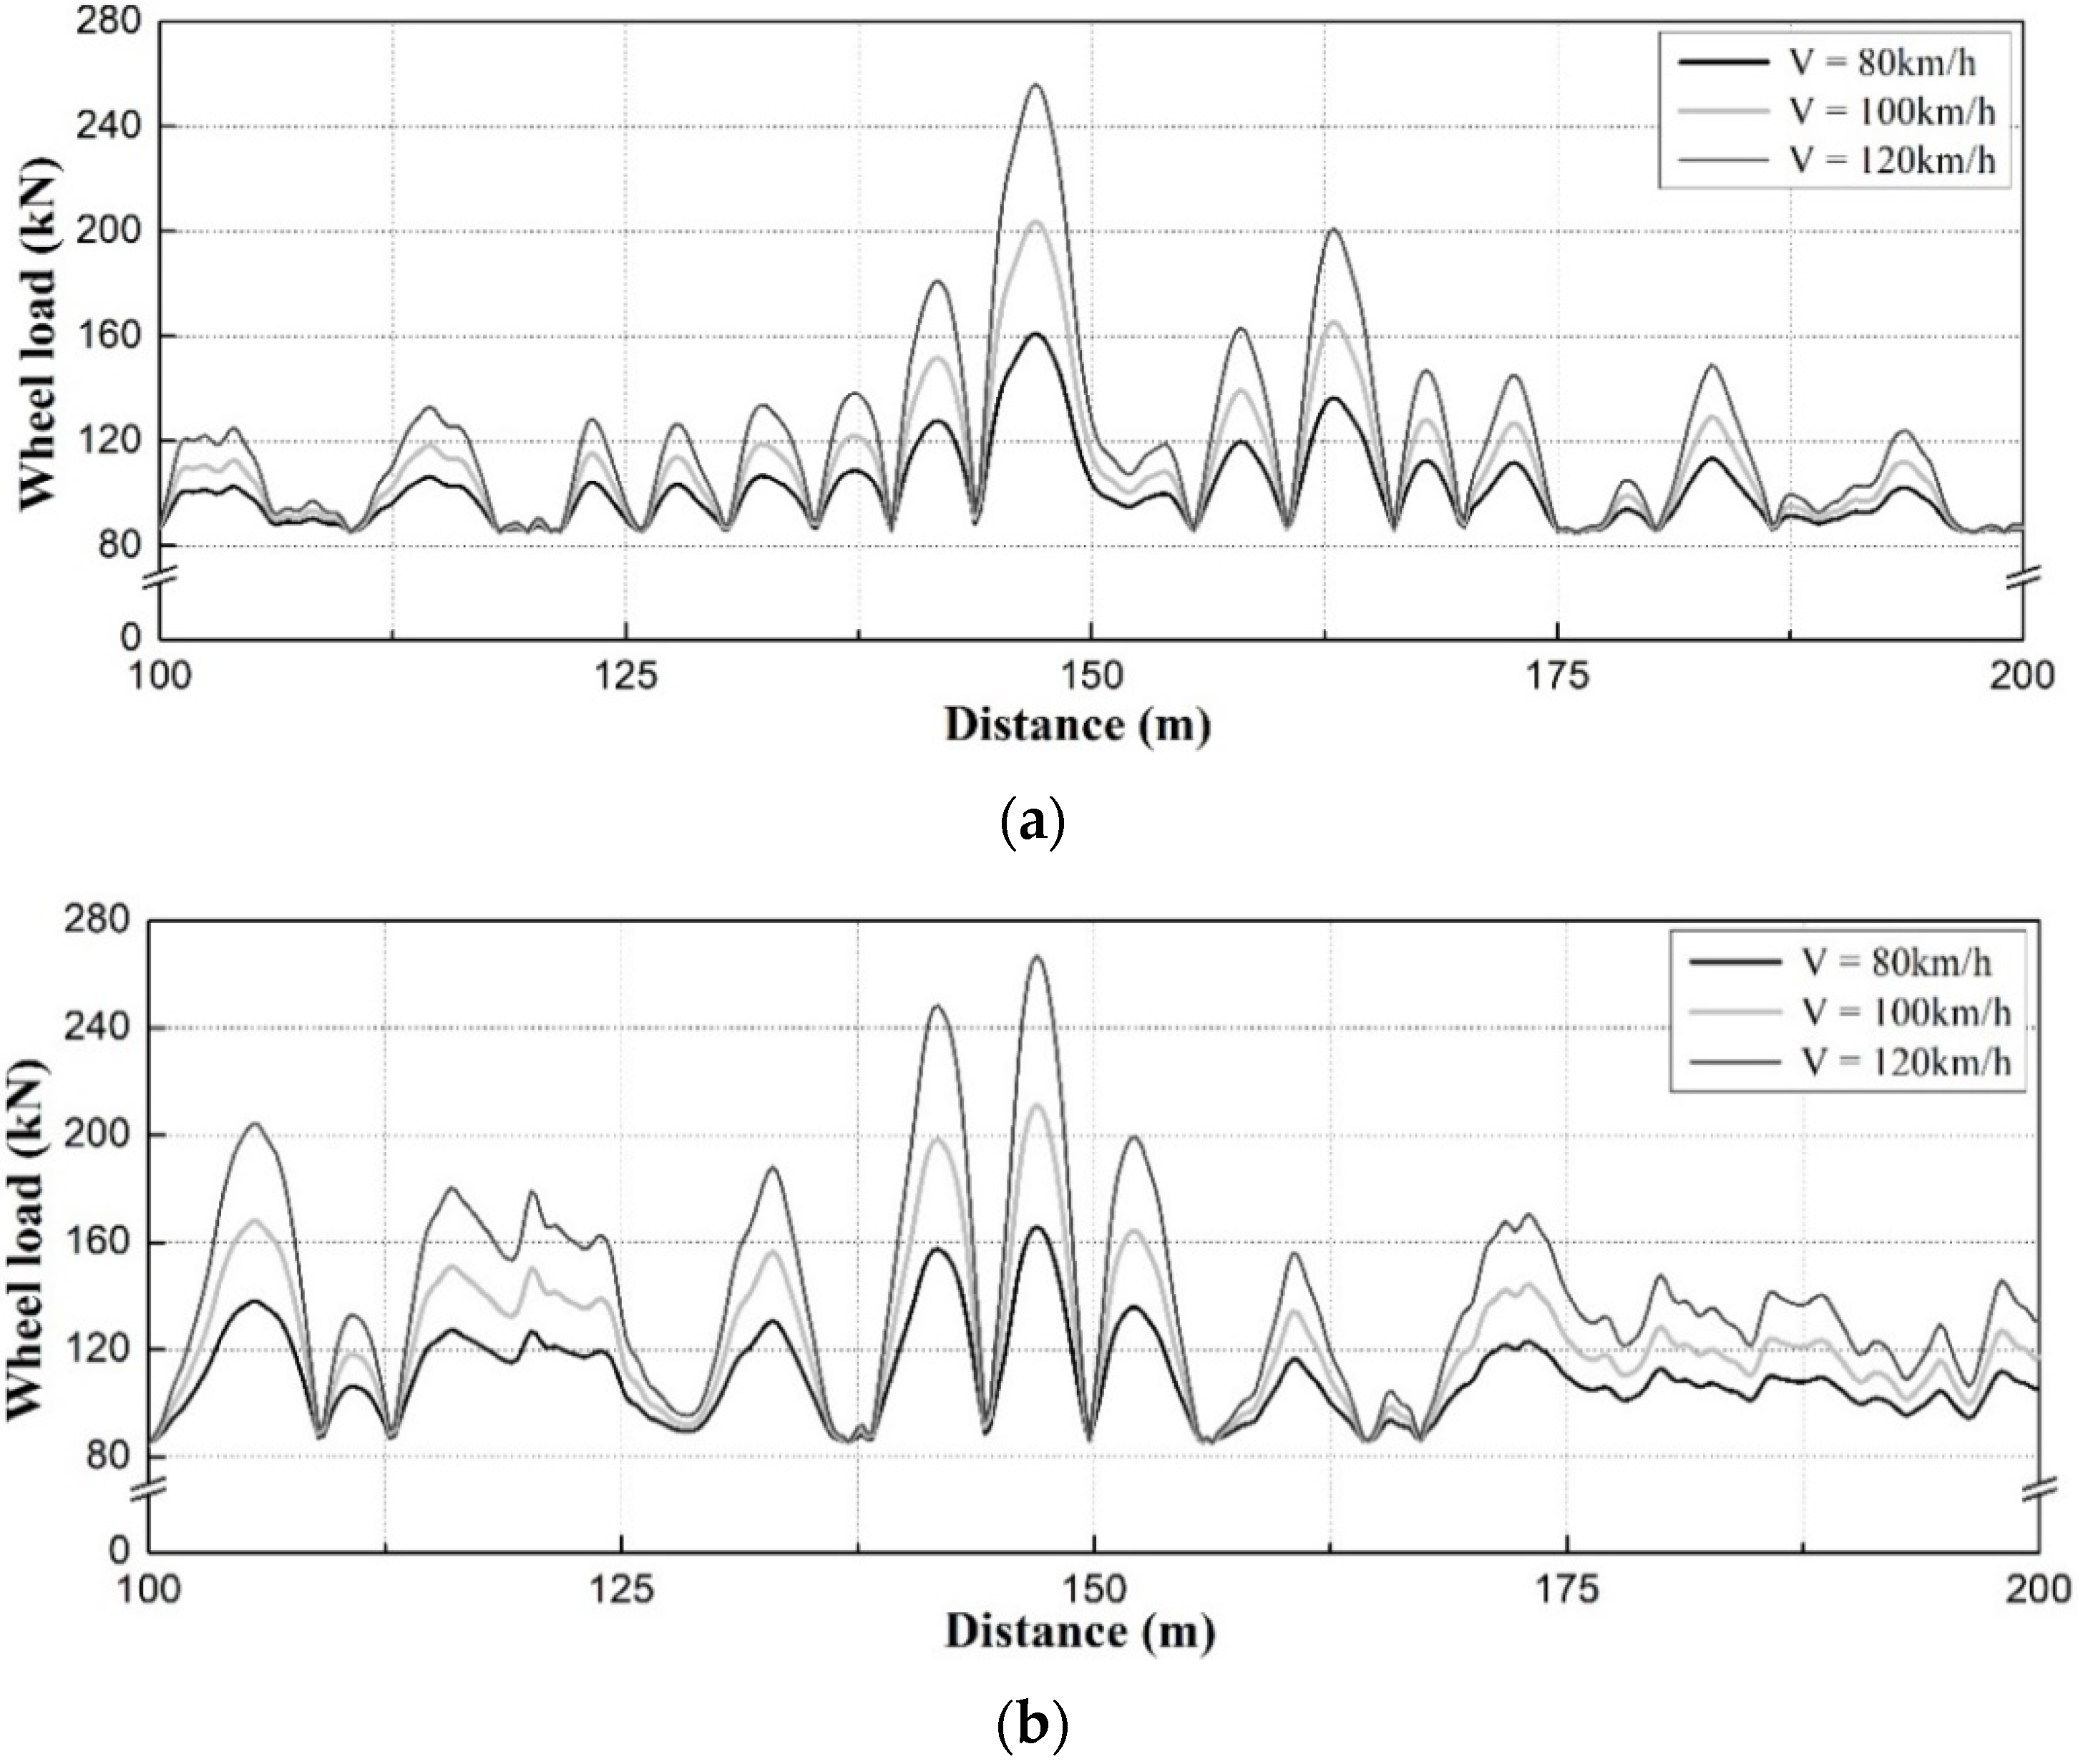
The Wheel-Rail interaction force was analyzed for each speed range as shown in
Figure 18 and
Figure 19 using the vertical profile data obtained from the field measurement.
As shown in
Figure 18, the result of the Wheel-Rail-interaction-force analysis of the HSR T1 track shows that in the case of the left rail of the HSR T1 track, the maximum dynamic wheel load was approximately 241 kN at a train speed of 120 km/h in the maximum vertical profile section, which corresponds to an increase by ~2.01 times compared with the static wheel load. However, at a train speed of 80 km/h, the maximum dynamic wheel load was ~151 kN, thus indicating an increase by ~88.7% compared with the static wheel load. In addition, the analyses showed that the dynamic wheel load in the left rail was ~90 kN larger at the train speed of 120 km/h compared with 80 km/h.
In the case of the right rail of the HSR T1 track, the maximum dynamic wheel load was ~251 kN when the train speed was 120 km/h in the maximum vertical profile section. This is ~2.13 times larger than the static wheel load. However, at a train speed of 80 km/h, the maximum dynamic wheel load was ~156 kN, which corresponds to an increase of ~95% compared with the static wheel load. In addition, the analyses showed that the dynamic wheel load in the left rail was ~95 kN larger at the train speed of 120 km/h than that at 80 km/h.
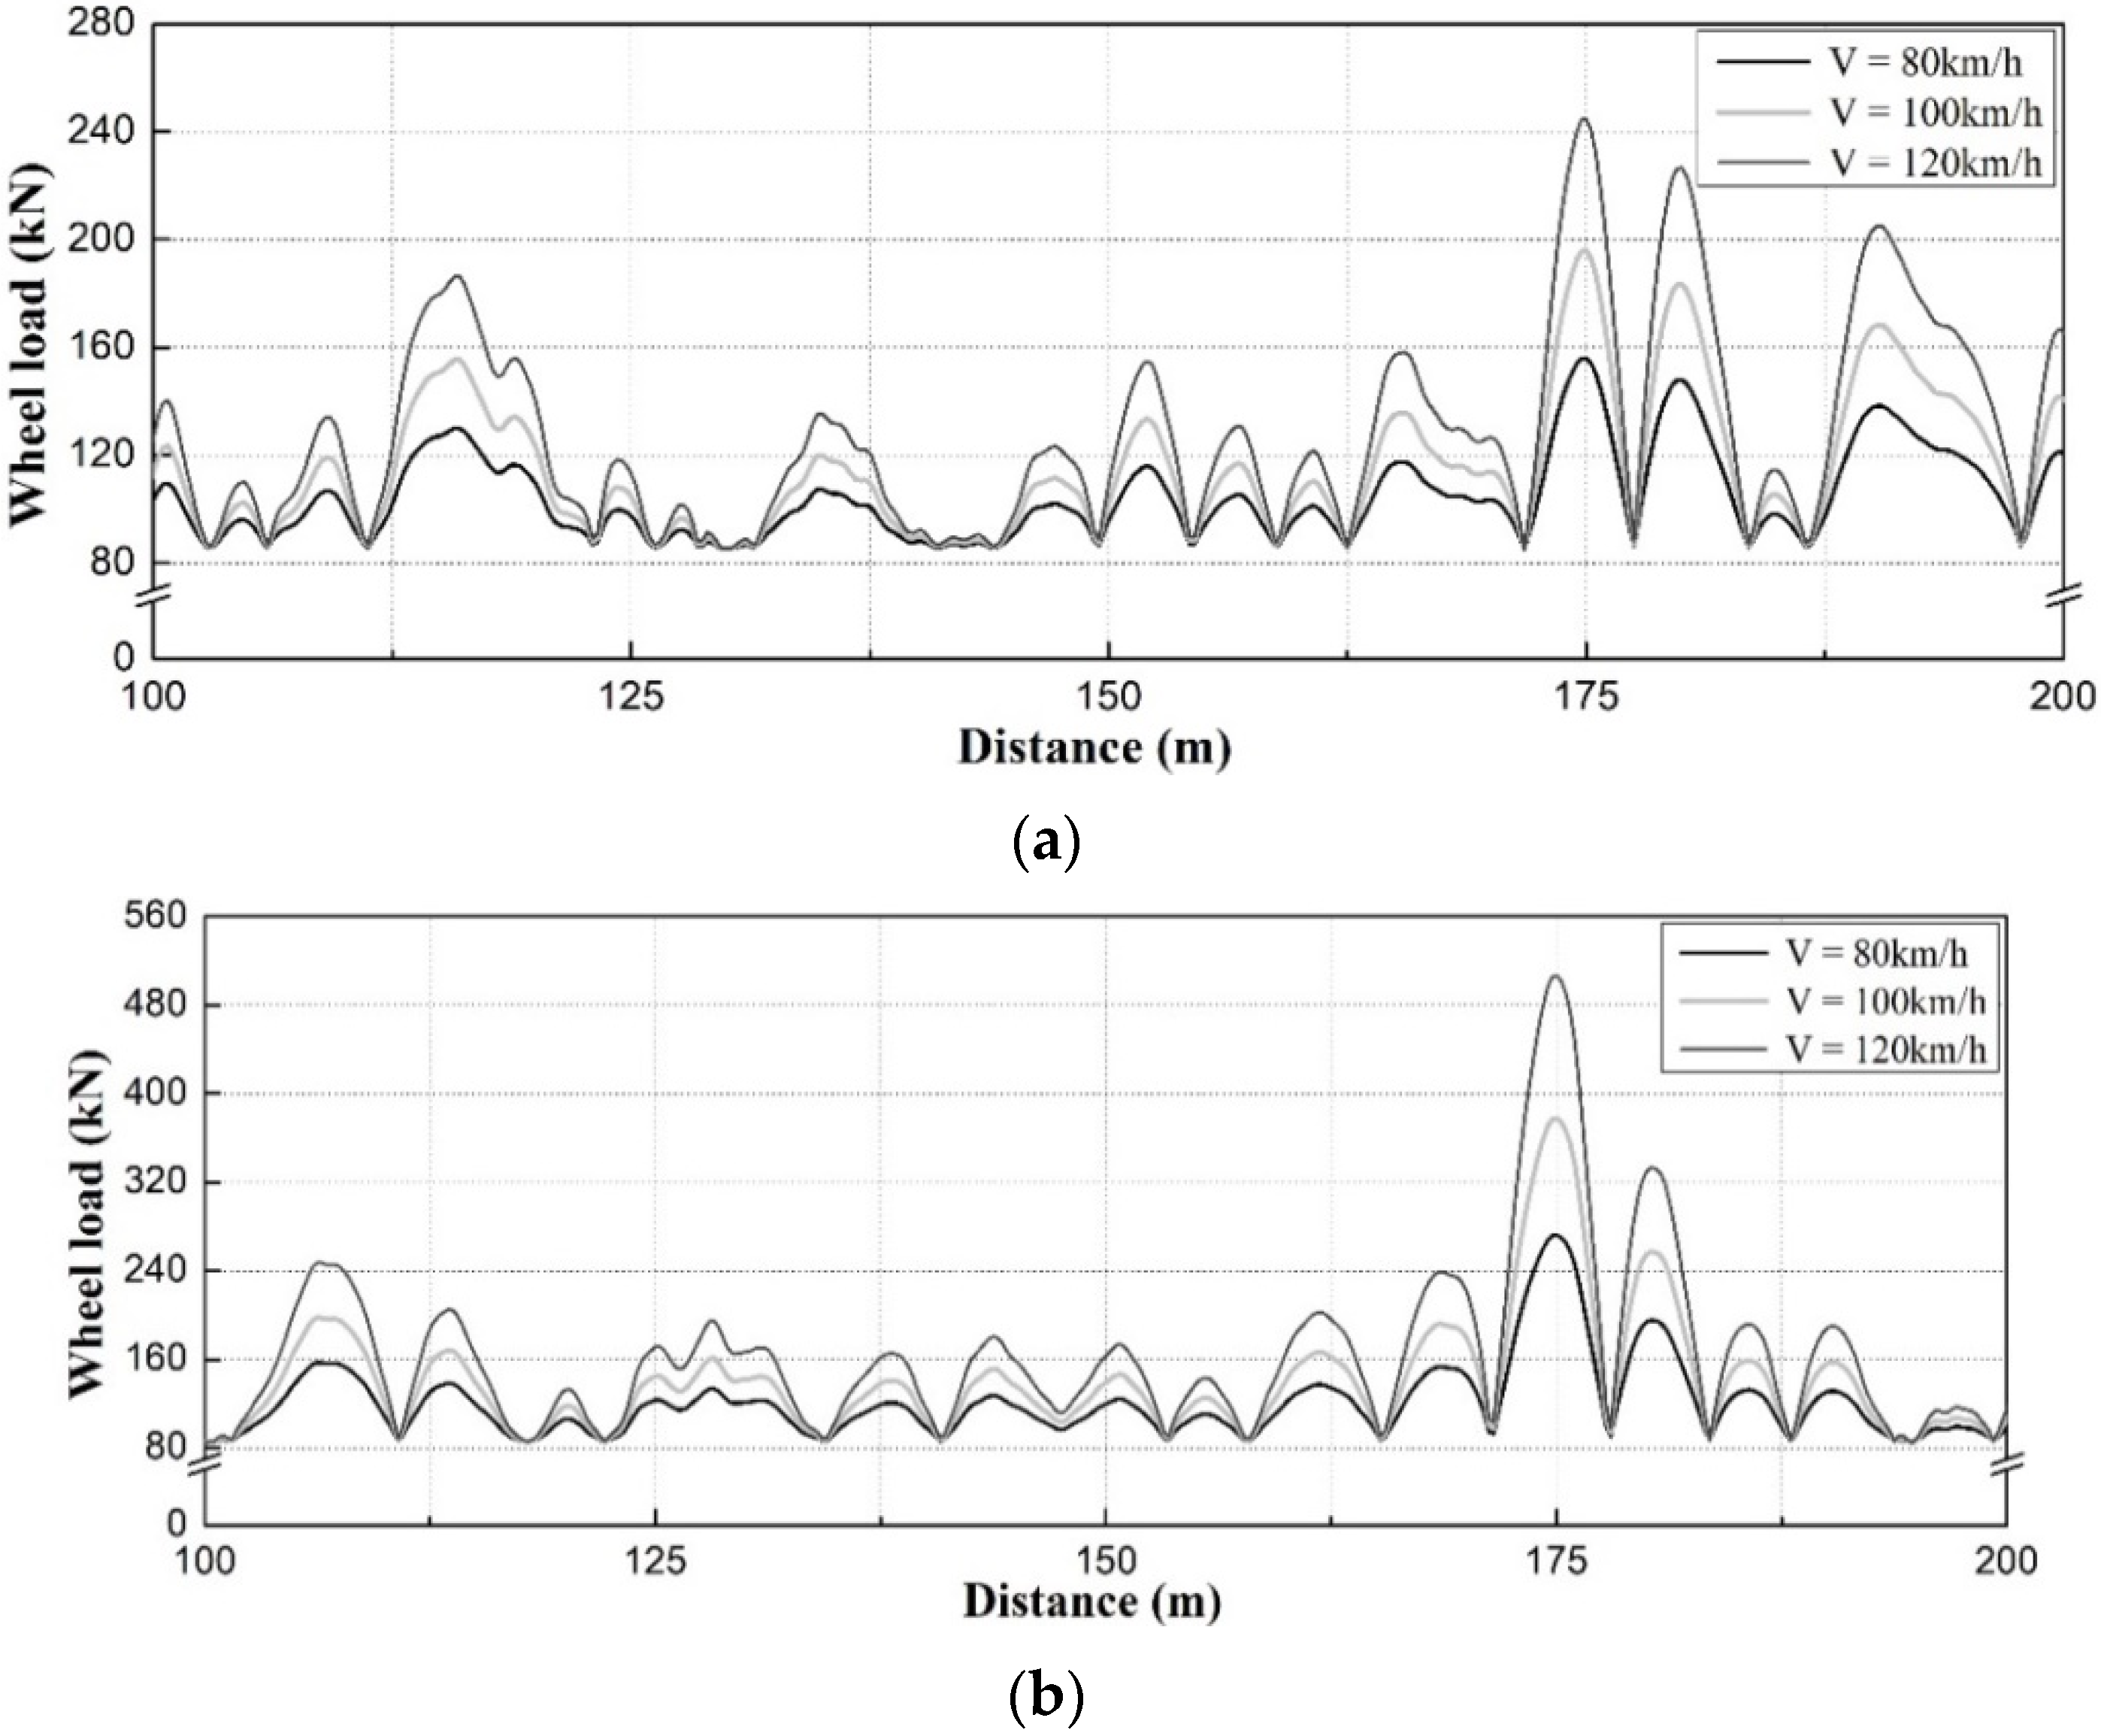
Figure 19 [
17] shows the results of the Wheel-Rail-interaction-force analysis of the HSR T2 track. In the case of the left rail of the HSR T2 track, the maximum dynamic wheel load was ~230 kN when the train speed was 120 km/h in the maximum vertical profile section, which is ~1.88 times larger than the static wheel load. However, at a train speed of 80 km/h, the maximum dynamic wheel load was ~146 kN, which corresponds to an increase of ~82.5% compared with the static wheel load. In addition, it was analyzed that the dynamic wheel load in the left rail was ~84 kN larger at the train speed of 120 km/h compared with 80 km/h.
In the case of the right rail of the HSR T2 track, the maximum dynamic wheel load was ~477 kN when the train speed was 120 km/h in the maximum vertical profile section. This is ~4.96 times larger than the static wheel load. At a train speed of 80 km/h, the maximum dynamic wheel load increased by ~2.2 times to ~256 kN. In addition, it was analyzed that the dynamic wheel load in the left rail was ~221 kN larger at the train speed of 120 km/h than that at 80 km/h.
For general rail surface irregularities, the increase in the dynamic Wheel-Rail interaction is 1.8 times or more depending on the speed, even if it is less than about 1 mm [
18]. In this study, the increase is due to the irregularity of the rail surface of 15 mm or more, and because the speed of the train is high. The result of the Wheel-Rail-interaction-force analysis as a function of the track irregularities for each speed range showed that even with the same track irregularities, the level of increase in the dynamic load can yield a considerable difference depending on the train speed. The effect of the train speed was more dominant on the increase of dynamic wheel load compared with the effects of track irregularities.
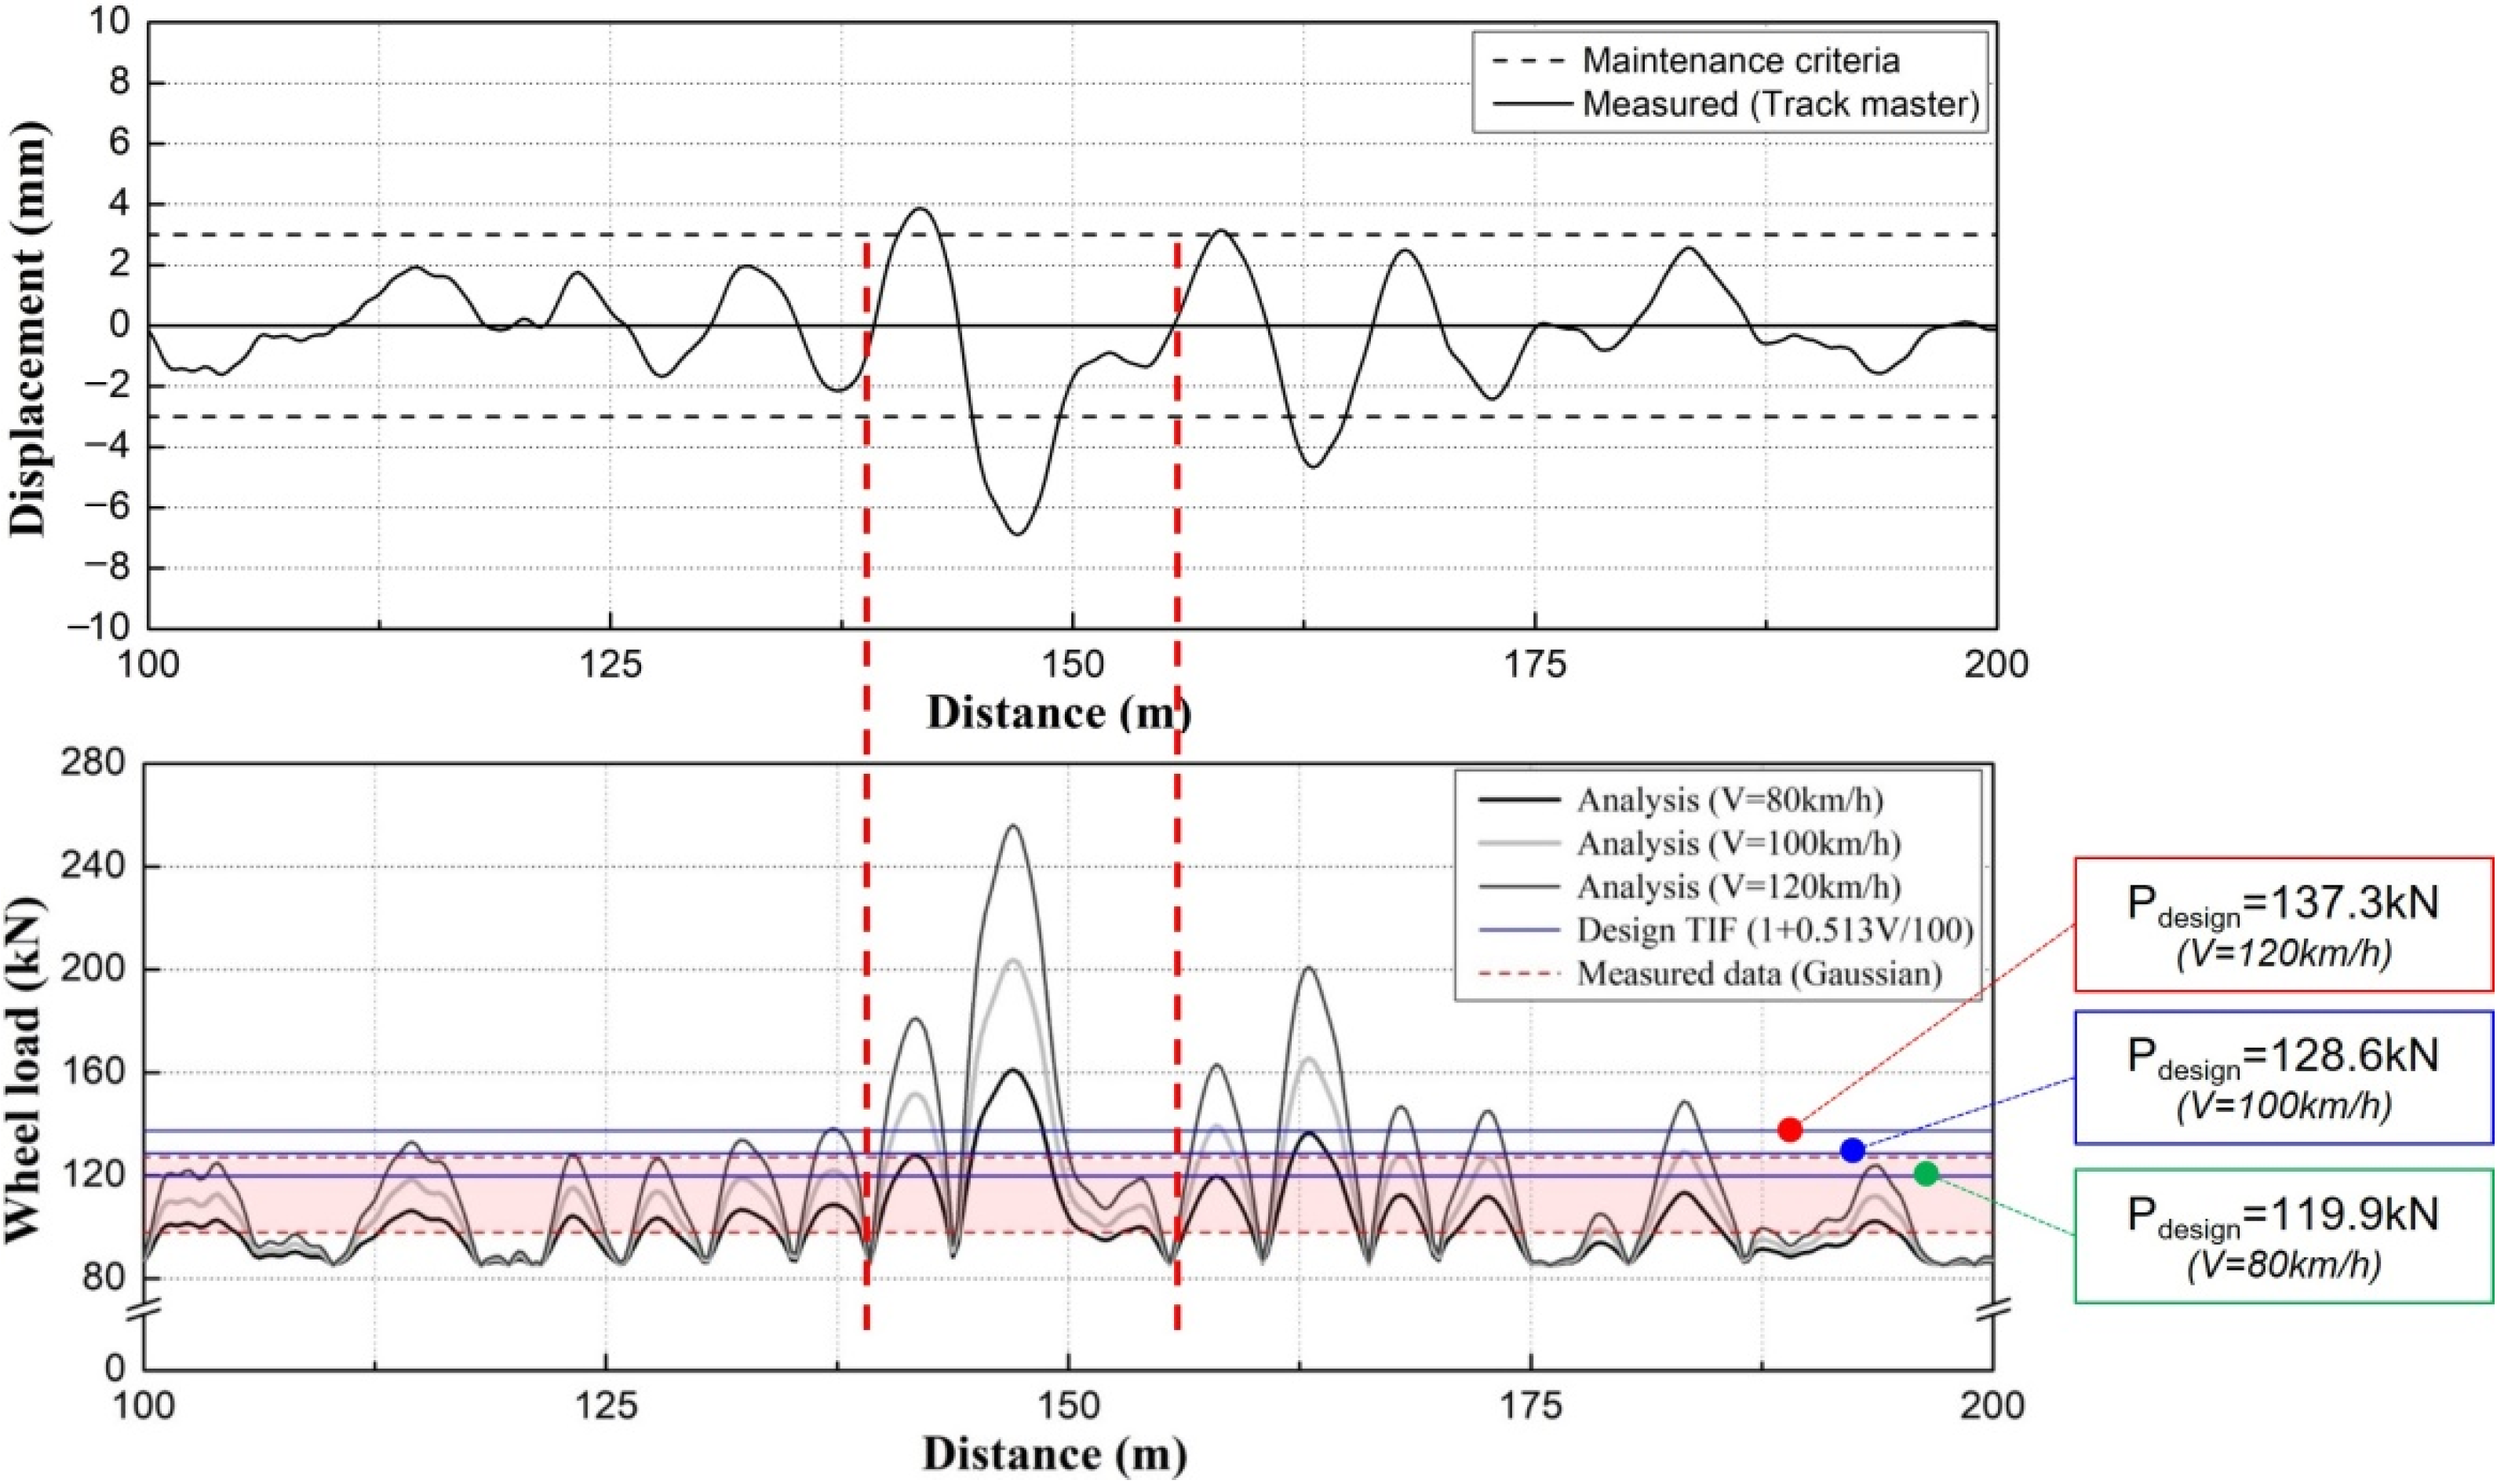
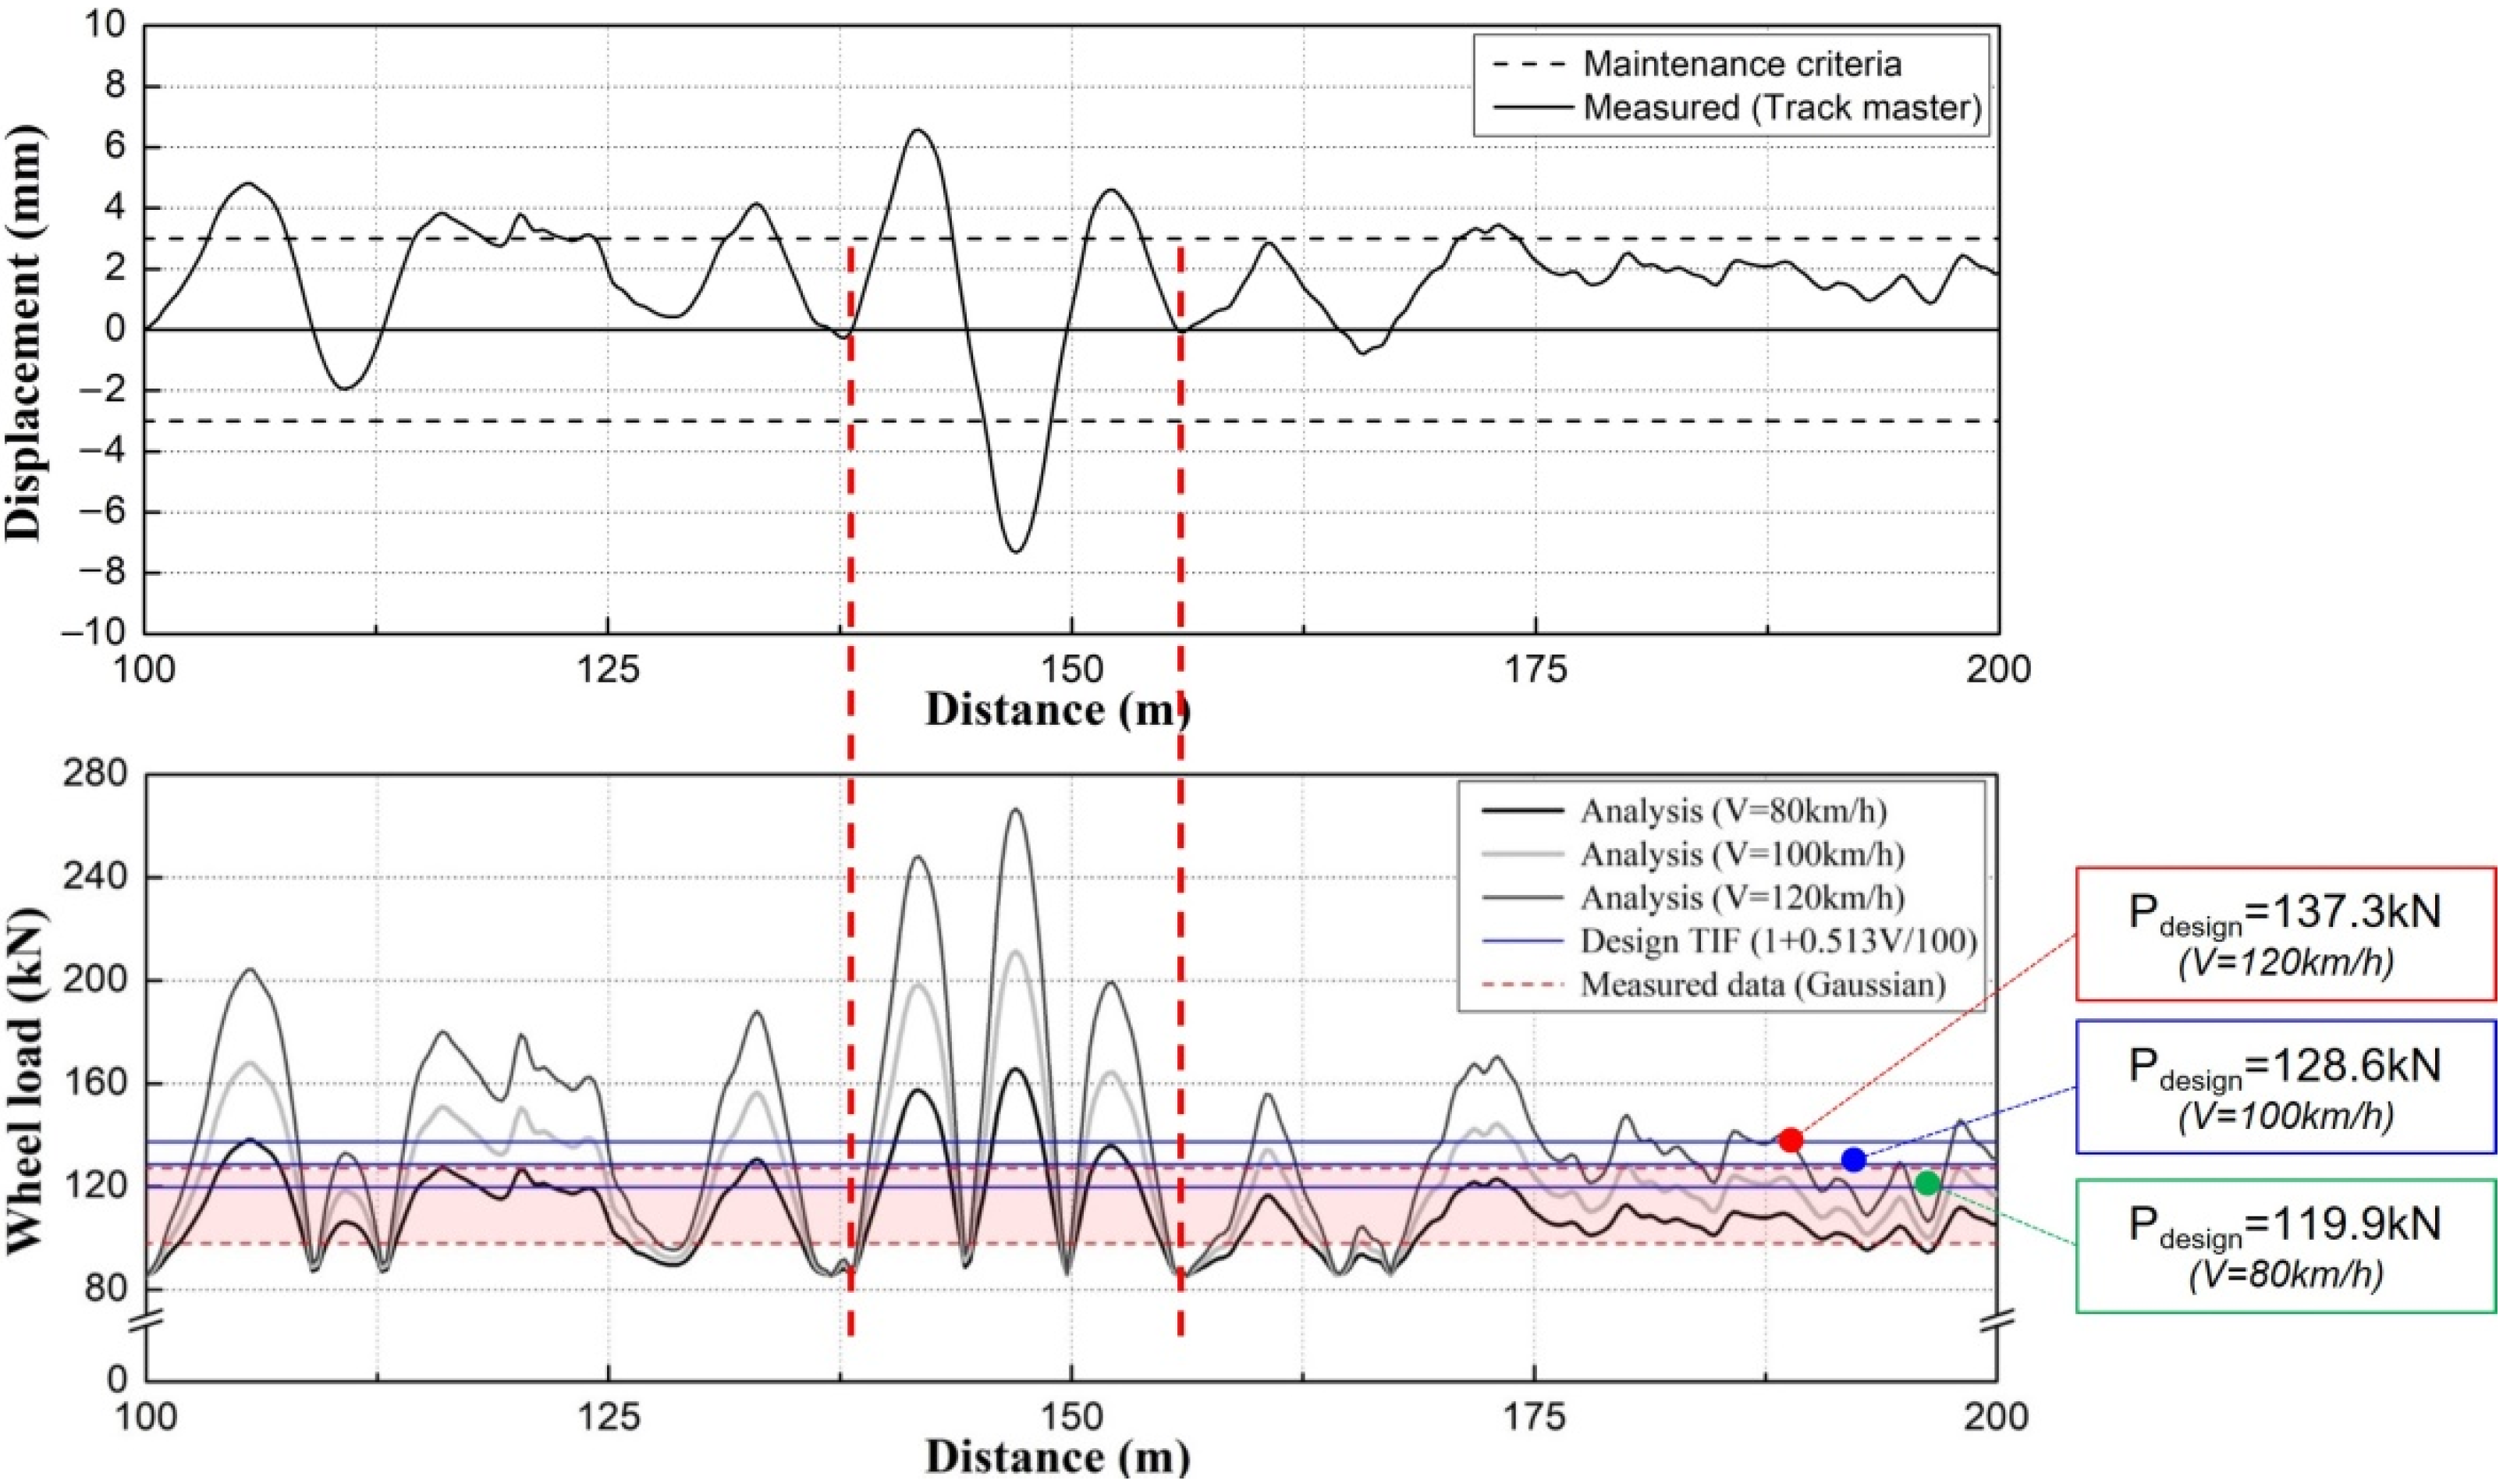
As a result of the correlation analysis between track irregularities and Wheel-Rail interaction force, as shown in
Figure 20 and
Figure 21, in the section in which track irregularities exceeded the maintenance criteria value, the Wheel-Rail interaction force considerably exceeded the ballasted track representative value and the design load regardless of the train speed [
17].
In addition, the Wheel-Rail interaction force exceeded the value of the design load (137.3 kN) by almost two times when the applied track impact factor (V = 120 km/h) was used. In this case, the analysis showed that the Wheel-Rail interaction force was large in the section in which track irregularities did not exceed the maintenance criteria value, but a similar level of vertical profile still occurred.
5. Conclusions
This study investigated a load-based track-irregularity-analysis technique for ballasted tracks on a serviced railway line with respect to adjacent excavations. Based on comparative analyses between the numerical and field-measurement results, the correlation between track irregularities and Wheel-Rail interaction force was verified. Thus, we emphasized the necessity for a load-based track-irregularity-management plan.
As a result of the numerical analysis of the track deformation, the locations wherein the maximum vertical and lateral deformations occurred differed with respect to the excavation area. Therefore, instead of a concentrated installation of the sensors in the center of the excavation area during the adjacent excavation, the ends of the excavation section should be included for installation. Additionally, it is advisable to examine the locations of sensor installation based on the considerations of the location of the serviced railway line track.
As a result of the measurements of track irregularities using the track-geometry-measurement system (Track master) and railbed-settlement-monitoring sensor (RM sensor), the maximum vertical profile and alignment values were measured at the center of the excavation work site, and the lateral deformation characteristics, such as the cross level and gauge, were clearly observed at the end points of the track section.
Given that the maximum value measured by the RM sensor was different from the actual level of rail deformation when the RM sensor measurements were close to the maintenance criteria values before, during, and after the excavation work, it would be appropriate to use the Track master for direct measurements of the rail deformation.
As a result of comparisons of the representative value of the dynamic wheel load that was calculated based on measurements of a ballasted track that did not contain any irregularities and based on the analyzed results of the Wheel-Rail interaction force representing the track irregularities, the maximum dynamic wheel load was measured in the range of ~10 m around the location of the occurrence of the maximum track irregularity. The results indicated that in the track section which yielded irregularities within the maintenance criteria, the dynamic-wheel-load value was within the range of the representative value of the dynamic wheel road within the design speed. However, in the section which exceeded the maintenance criteria of track irregularities, the dynamic-wheel-load value exceeded the representative value of the dynamic wheel road, and the increase could be as large as 200% depending on the speed increase. In addition, it was shown that even in the cases in which the maintenance criteria of track irregularities were satisfied, the designed dynamic wheel load could be exceeded depending on the train speed. This is indicative of the possibility of causing damage to the track owing to the impact load. Therefore, even with the same track irregularities, an impact load exceeding the track impact factor (as considered at the design phase) may be induced depending on the speed of the train in the target section.
In the future, the location at which the maximum deformation occurs will be selected based on the numerical-analysis outcomes during the design phase in the cases in which adjacent excavations occur on railway infrastructures; accordingly, stability should be secured by constant monitoring following the installation of an RM sensor in the section with identified vulnerabilities. However, given that the RM sensor measurements may be slightly different from the actual track irregularities of the rail, it is advisable to measure the track irregularities using the Track master before, during, and after the excavation work. In the future, we will study the vertical acceleration of the wheel centers and vibration acceleration.
Author Contributions
Conceptualization, J.-Y.C., D.-R.P. and J.-S.C.; methodology, J.-S.C. and S.-H.K.; software, J.-Y.C.; formal analysis, J.-Y.C. and D.-R.P.; investigation, J.-Y.C.; data curation, J.-Y.C. and S.-H.K.; writing—original draft preparation, J.-Y.C., D.-R.P. and S.-H.K.; writing—review and editing, S.-H.K. All authors have read and agreed to the published version of the manuscript.
Funding
This research received no external funding.
Institutional Review Board Statement
Not applicable.
Informed Consent Statement
Not applicable.
Data Availability Statement
Data sharing is no applicable to this article.
Conflicts of Interest
The authors declare no conflict of interest.
References
- Chung, J.S.; Park, D.R.; Choi, J.Y. Evaluation of Track Irregularity Effect due to Adjacent Excavation on Serviced Railway Line. J. Converg. Cult. Technol. 2019, 5, 401–406. [Google Scholar]
- Choi, J.Y. Qualitative Analysis for Dynamic Behavior of Railway Ballasted Track. Ph.D. Thesis, Technical University of Berlin, Berlin, Germany, 2014. [Google Scholar]
- Hwang, S.K. A Study on Application of Force-based Track Irregularity Analysis Method. Master’s Thesis, Dongyang University, Yeongju-si, Korea, December 2020. [Google Scholar]
- Choi, J.Y.; Yang, G.N.; Kim, T.J.; Chung, J.S. Analysis of Ground Subsidence according to Tunnel Passage in Geological Vulnerable Zone. J. Converg. Cult. Technol. 2020, 6, 393–399. [Google Scholar]
- Lee, H.H. Automatic Measurement Evaluation System for Subway Structure by Adjacent Excavation. Ph.D. Thesis, Dongyang University, Yeongju-si, Korea, December 2020. [Google Scholar]
- Choi, J.Y.; Lee, H.H.; Kang, Y.S.; Chung, J.S. Evaluation of Structural Stability of Tunnel due to Adjacent Excavation on Urban Transit. J. Converg. Cult. Technol. 2020, 6, 503–508. [Google Scholar]
- Cho, S.I. A Study on Deformation of Subway Structures by adjacent Excavation Work. Master’s Thesis, Dongyang University, Yeongju-si, Korea, December 2019. [Google Scholar]
- Knothe, K.; Stichel, S. Rail Vehicle Dynamics; Springer: Cham, Switzerland, 2017. [Google Scholar]
- Wang, Z.; Long, Z.; Li, X. Track Irregularity Disturbance Rejection for Maglev Train Based on Online Optimization of PnP Control Architecture. IEEE Access 2019, 7, 12610–12619. [Google Scholar] [CrossRef]
- Urda, P.; Aceituno, J.F.; Munoz, S.; Escalona, J.L. Measurement of Railroad Track Irregularities Using an Automated Recoding Vehicle. Measurement 2021, 183, 109765. [Google Scholar] [CrossRef]
- Ramos, A.; Correia, A.G.; Calçada, R.; Costa, P.A.; Esen, A.; Woodward, P.K.; Connolly, D.P.; Laghrouche, O. Influence of Track Foundation on the Performance of Ballast and Concrete Slab Tracks Under Cyclic Loading: Physical Modelling and Numerical Model Calibration. Constr. Build. Mater. 2021, 277, 122245. [Google Scholar] [CrossRef]
- Munoz, S.; Ros, J.; Urda, P.; Escalona, J.L. Estimation of Lateral Track Irregularity through Kalman Filtering Techniques. IEEE Access 2021, 9, 60010–60025. [Google Scholar] [CrossRef]
- MIDAS Information Technology Co. MIDAS GTS NX User Manual; MIDAS Information Technology Co.: Seongnam-si, Korea, 2016. [Google Scholar]
- Korea Rail Network Authority Guideline of Track Maintenance; Korea Rail Network Authority: Daejeon, Korea, 2016.
- Kulhawy, F.H. Analysis of a High Gravity Retaining Wall. In Proceedings of the Conference on Analysis and Design in Geotechnical Engineering, Austin, TX, USA, 9–12 June 1974; pp. 159–172. [Google Scholar]
- Choi, H.Y. A Study about the Improvement on Automatic Measure Method of Tunnel. Master’s Thesis, Seoul National University of Technology, Seoul, Korea, August 2007. [Google Scholar]
- Park, D.R. Force-Based Track Irregularity Evaluation for Ballasted Track on Serviced Railway Line. Ph.D. Thesis, Dongyang University, Yeongju-si, Korea, June 2021. [Google Scholar]
- Choi, J.Y.; Yun, S.W.; Chung, J.S.; Kim, S.H. Comparative Study of Wheel-Rail Contact Impact Force for Jointed Rail and Continuous Welded Rail on Light-Rail Transit. Appl. Sci. 2020, 10, 2299. [Google Scholar] [CrossRef] [Green Version]
Figure 1.
Modeling. (a) Ground conditions; (b) Schematic of numerical modeling.
Figure 1.
Modeling. (a) Ground conditions; (b) Schematic of numerical modeling.
Figure 2.
Conceptual diagram for numerical-analysis locations.
Figure 2.
Conceptual diagram for numerical-analysis locations.
Figure 3.
Analyzed results of track irregularities in high-speed railway lines. (a) Vertical profile (based on 10 m); (b) Alignment (based on 10 m); (c) Cross level; (d) Gauge.
Figure 3.
Analyzed results of track irregularities in high-speed railway lines. (a) Vertical profile (based on 10 m); (b) Alignment (based on 10 m); (c) Cross level; (d) Gauge.
Figure 4.
Schematic of target section used for field measurements.
Figure 4.
Schematic of target section used for field measurements.
Figure 5.
Locations of field measurements and target section used for numerical analysis.
Figure 5.
Locations of field measurements and target section used for numerical analysis.
Figure 7.
Railbed-settlement-monitoring (RM) sensor. (a) Overview of RM sensor installation; (b) Photo of a settlement pin.
Figure 7.
Railbed-settlement-monitoring (RM) sensor. (a) Overview of RM sensor installation; (b) Photo of a settlement pin.
Figure 8.
Overview of track field-measurement section and sensor installation. (a) Overview of field-measurement section; (b) Sensor installation.
Figure 8.
Overview of track field-measurement section and sensor installation. (a) Overview of field-measurement section; (b) Sensor installation.
Figure 9.
Particle-size distribution curves for ballast materials in the field-measurement section of the ballasted track.
Figure 9.
Particle-size distribution curves for ballast materials in the field-measurement section of the ballasted track.
Figure 10.
Measurements of track irregularities in the field-measurement section.
Figure 10.
Measurements of track irregularities in the field-measurement section.
Figure 11.
Results of track irregularities measurements (HSR T1). (a) Ground conditions; (b) Alignment; (c) Cross level; (d) Gauge; (e) Twist.
Figure 11.
Results of track irregularities measurements (HSR T1). (a) Ground conditions; (b) Alignment; (c) Cross level; (d) Gauge; (e) Twist.
Figure 12.
Track-settlement measurements (HSR T1). (a) Points 1–5; (b) Points 6–10.
Figure 12.
Track-settlement measurements (HSR T1). (a) Points 1–5; (b) Points 6–10.
Figure 13.
Measurements of dynamic responses of the track. (a) Example of dynamic-wheel-load waveforms; (b) Dynamic-wheel-load measurements with respect to the train speed.
Figure 13.
Measurements of dynamic responses of the track. (a) Example of dynamic-wheel-load waveforms; (b) Dynamic-wheel-load measurements with respect to the train speed.
Figure 14.
Analysis of probability density function of dynamic wheel load for the ballasted track which did not contain irregularities. (a) Gaussian probability density function of dynamic-wheel-load measurements; (b) Analysis of representative values of dynamic wheel load for the ballasted track which did not contain irregularities.
Figure 15.
Comparative analysis between measurements of vertical profile, track settlement, and numerical-analysis results (HSR T1). (a) HSR T1 left rail; (b) HSR T1 right rail.
Figure 15.
Comparative analysis between measurements of vertical profile, track settlement, and numerical-analysis results (HSR T1). (a) HSR T1 left rail; (b) HSR T1 right rail.
Figure 16.
Comparative analysis between measurements of the vertical profile and track settlement and numerical-analysis results (HSR T2). (a) HSR T2 left rail; (b) HSR T2 right rail.
Figure 16.
Comparative analysis between measurements of the vertical profile and track settlement and numerical-analysis results (HSR T2). (a) HSR T2 left rail; (b) HSR T2 right rail.
Figure 17.
Mass-stiffness combinations in the wheel- rail system.
Figure 17.
Mass-stiffness combinations in the wheel- rail system.
Figure 18.
Analysis of Wheel-Rail interaction forces at different train speeds (HSR T1). (a) Left rail; (b) Right rail.
Figure 18.
Analysis of Wheel-Rail interaction forces at different train speeds (HSR T1). (a) Left rail; (b) Right rail.
Figure 19.
Analysis of Wheel-Rail interaction at different train speeds (HSR T2). (a) Left rail; (b) Right rail.
Figure 19.
Analysis of Wheel-Rail interaction at different train speeds (HSR T2). (a) Left rail; (b) Right rail.
Figure 20.
Analysis of correlation between track irregularities and Wheel-Rail interaction force (left rail).
Figure 20.
Analysis of correlation between track irregularities and Wheel-Rail interaction force (left rail).
Figure 21.
Analysis of correlation between track irregularities and Wheel-Rail interaction force (right rail).
Figure 21.
Analysis of correlation between track irregularities and Wheel-Rail interaction force (right rail).
Table 1.
Reference values for management and maintenance of track irregularities for high-speed railway infrastructure (unit: mm, based on 10).
Table 1.
Reference values for management and maintenance of track irregularities for high-speed railway infrastructure (unit: mm, based on 10).
| Maintenance Phase | Vertical Profile | Alignment | Twist | Cross level | Gauge |
|---|
construction value
(CV) | N10 m ≤ 2 | D10 m ≤ 3 | g3 ≤ 3 | Ed ≤ 3 | 1434 ≤ Eavg ≤ 1438 |
target value
(TV) | N10 m ≤ 3 | D10 m ≤ 4 | g3 ≤ 3 | Ed ≤ 4 | 1434 ≤ Eavg ≤ 1440 |
warning value
(WV) | 5 ≤ N10 m < 10 | 6 ≤ D10 m < 7 | 5 < g3 ≤ 7 | 7 < Ed ≤ 9 | 1433 ≤ Eavg < 1434 |
action value
(AV) | N10 m ≥ 10 | D10 m ≥ 7 | g3 > 7 | Ed > 9 | Eavg < 1433 |
speed reduction value
(SV) | 18 ≤ N10 m < 22
(170 km/h) | 14 ≤ D10 m < 17
(170 km/h) | 15 < g3 ≤ 21
(170 km/h) | 15 < Ed ≤ 18
(170 km/h) | 1422 ≤ Emin < 1426
1455 < Emax ≤ 1462
(170 km/h) |
| Publisher’s Note: MDPI stays neutral with regard to jurisdictional claims in published maps and institutional affiliations. |
© 2021 by the authors. Licensee MDPI, Basel, Switzerland. This article is an open access article distributed under the terms and conditions of the Creative Commons Attribution (CC BY) license (https://creativecommons.org/licenses/by/4.0/).


