1. Introduction
The rail fastening system firmly connects the rails to the sleepers and its performance affects the structural safety of rails, ride safety and quality, and railway noise. The modern rail fastening system deviates from simply clamping the rail and sleepers together by using tension clamps to resist the tension, compression, and rotation of the rails that derive from the train load or track alignment.
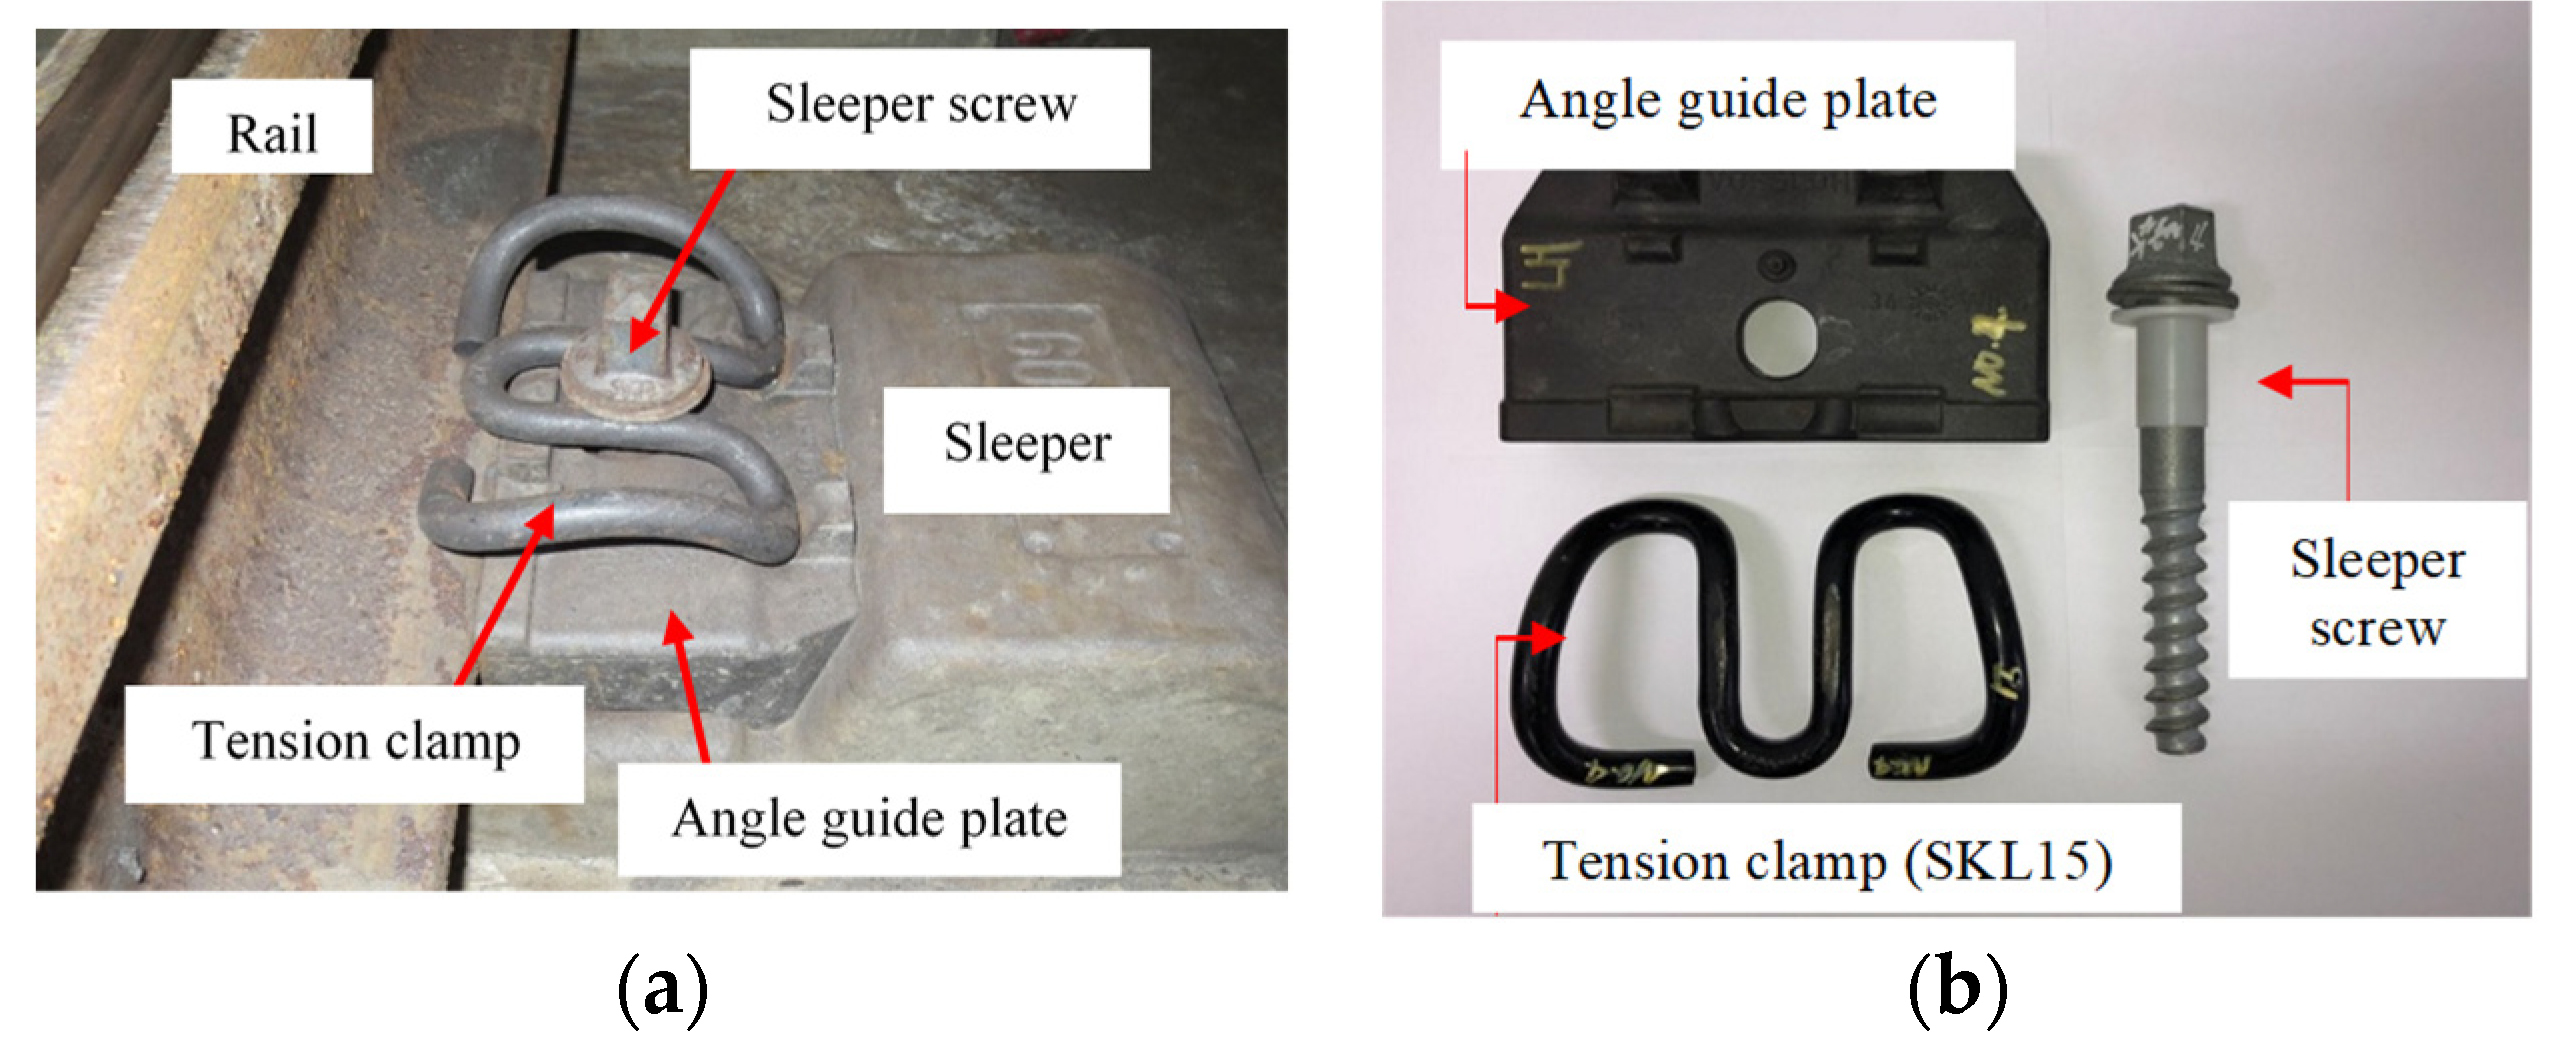
A rail fastening system generally comprises a guide plate, tension clamp, and anchor bolt, as shown in
Figure 1. Among these components, the tension clamp should be sufficiently durable because safety while driving a train cannot be assured if the clamps are damaged or fractured. However, except for the mechanical properties of the tension clamps provided by the manufacturer, experimental or analytical studies conducted on the tension clamps are insufficient [
1,
2,
3]. The behavior of the rail fastening system can be affected by various factors, such as the track condition, track alignment, and initial construction quality. Due to insufficient consideration of these factors, tension clamps often fail earlier than the service life guaranteed by the manufacturer [
1,
4,
5,
6].
Various studies [
7,
8,
9,
10,
11,
12,
13,
14] have been performed to evaluate the fatigue damage to the rail fastening system through finite element analyses (FEA). Hasap et al. [
7], Hong et al. [
8], and Kim et al. [
9] investigated the fatigue failure and fatigue life of rail clips using FEA. Ferreno et al. [
10] and Liu et al. [
11] analyzed the fatigue damage and life through FEA with the material and fatigue properties obtained by experimental studies. Gao et al. [
12] revealed a dynamic failure mechanism of rail fastening clip damage through FEA, and Park et al. [
13] analyzed the effect of the decarburized layer on fatigue cracks using finite element models. Ma et al. [
14] established a random dynamic model of vehicle–track coupling using finite element models and identified the effects of the wheel–rail random load on the fatigue damage of rail fastening clips. However, the reliability levels of a rail fastening system that has been damaged by fatigue have been rarely reported, except for two papers [
15,
16] in which the statistical parameters of the equivalent stress ranges were estimated using the finite element analysis. The reliability levels of rail fastening systems need to be estimated accurately by field measurement data to provide a foundation in the reliability-based design and maintenance of the rail fastening system.
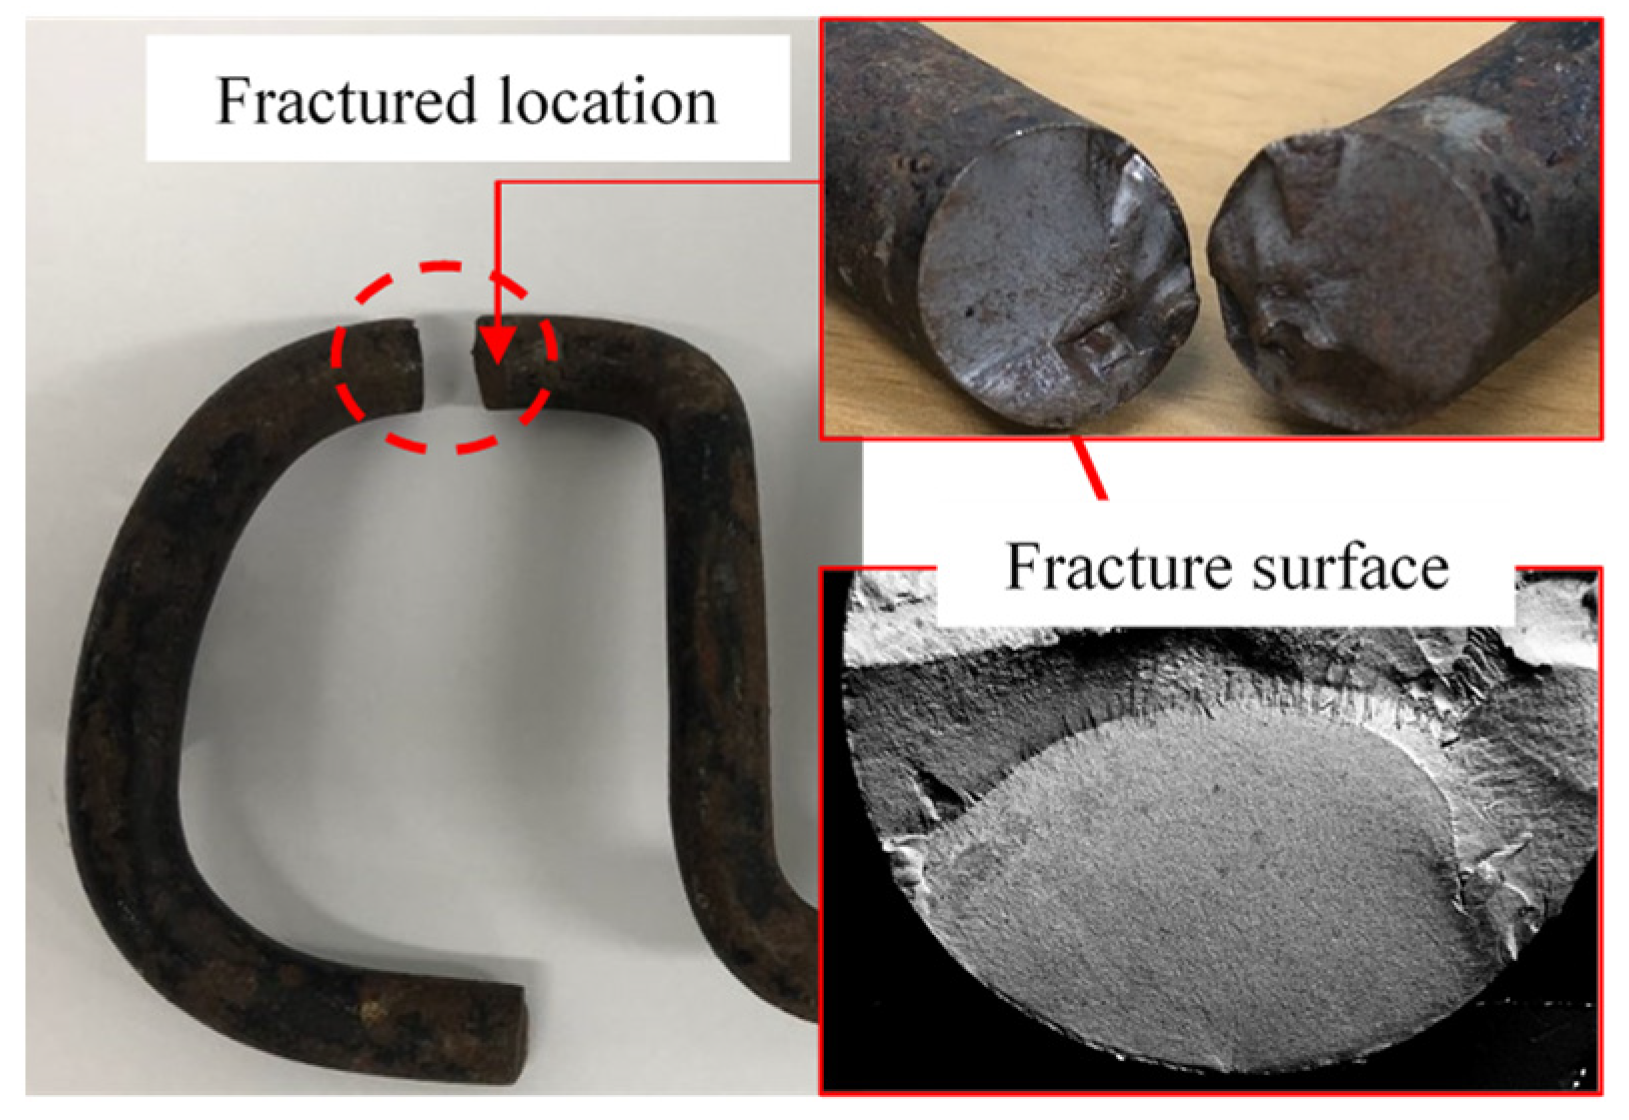
One year and five months after opening the urban railway in South Korea, 0.17% of the SKL15 tension clamps in the DFF-300 rail fastening system had been damaged. The SKL15 tension clamps were made from a spring steel, which had the minimum yield and tensile strengths of 1150 MPa and 1300 MPa, respectively [
6]. As shown in
Figure 2, the fracture surfaces of the damaged tension clamps showed the typical characteristics of a fatigue crack, which has an elliptical shape and a smooth surface. All of the cracked tension clamps were observed on the railroad with a curve radius (
R) of 1200 m or less. Specifically, 79.1% of the damage occurred on the railroad with a curve radius of 800 m, and 94.5% of the cracked tension clamps were installed on the inner rail. The inner and outer rails can be divided into the inside and outside track gauges at the curved sections. Approximately 56% of the damage was found on the inside track gauge;
Table 1 summarizes the statuses of the cracked tension clamps. Since the failure of the tension clamps is caused by fatigue, a fatigue reliability analysis was performed where most of the cracks occurred and the reasons for the tendency of fatigue cracks in the inner and outer rails were investigated.
This paper analyzes the causes of the fatigue failure of the tension clamps based on a reliability assessment using field measurement data. The measured strains of the tension clamps were used to estimate the stress range, which is an important factor affecting the fatigue failure of the tension clamps. The statistical parameters of the stress range were identified by applying linear regression to the measured data and the distribution type was determined by comparing the likelihood function values. The advanced first-order second-moment reliability method [
17] was adopted to conduct the reliability analyses of the tension clamps. The limit state function of the tension clamps was defined using critical and cumulative damage indexes.
The reasons for the damaged tension clamps in the field were identified through the results of the reliability analyses. The probability of the failure of the tension clamps installed on the inside track gauge was found to be higher than those installed on the outside track gauge, and the probability of the failure of the inner rail was also higher than that of the outer rail.
2. The Statistical Model for the Stress Range
The statistical model for the stress range of the tension clamps was developed to estimate the fatigue reliability indexes using field measurement data.
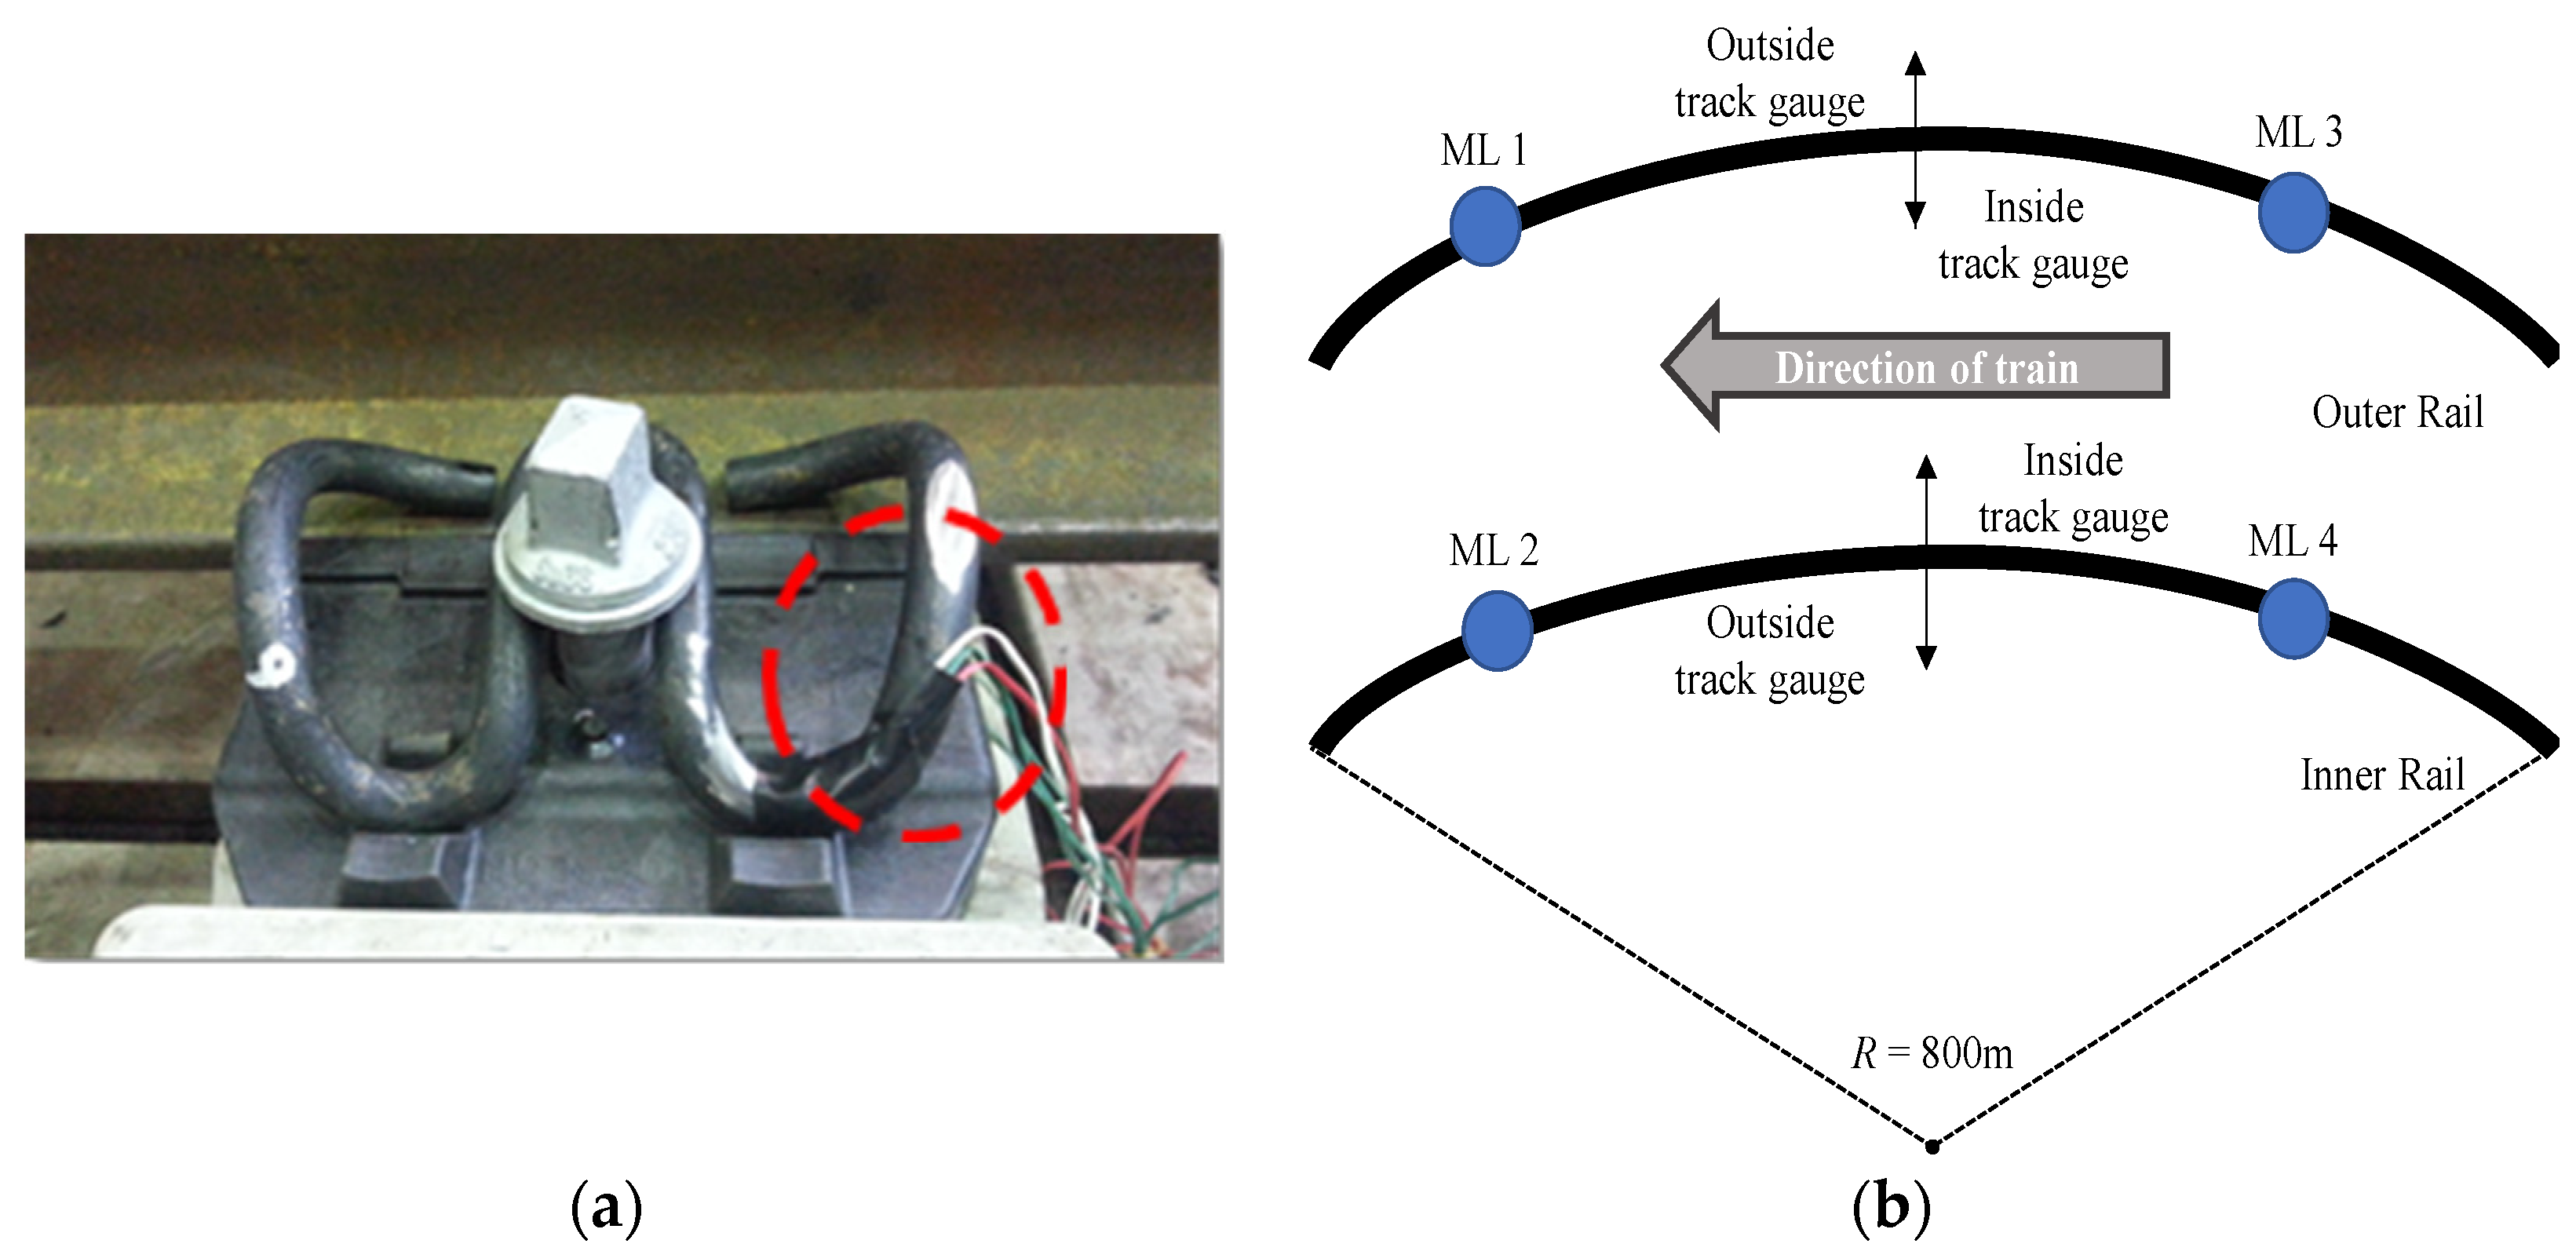
Figure 3a shows a rosette strain gauge attached to the top of the middle bend of a tension clamp and
Figure 3b presents the four measurement locations (MLs) on the railway track. ML1 and ML3 were located on the outer rail of the railway track while ML2 and ML4 were positioned on the corresponding inner rail of the railway track. The field measurements were performed on both the inside and outside track gauges at the four MLs.
Hook’s law was employed to determine the principal stresses using the field measurements as follows:
where
,
,
, and
are the maximum and minimum principal stresses, the elastic modulus, and Poisson’s ratio, respectively, and
,
, and
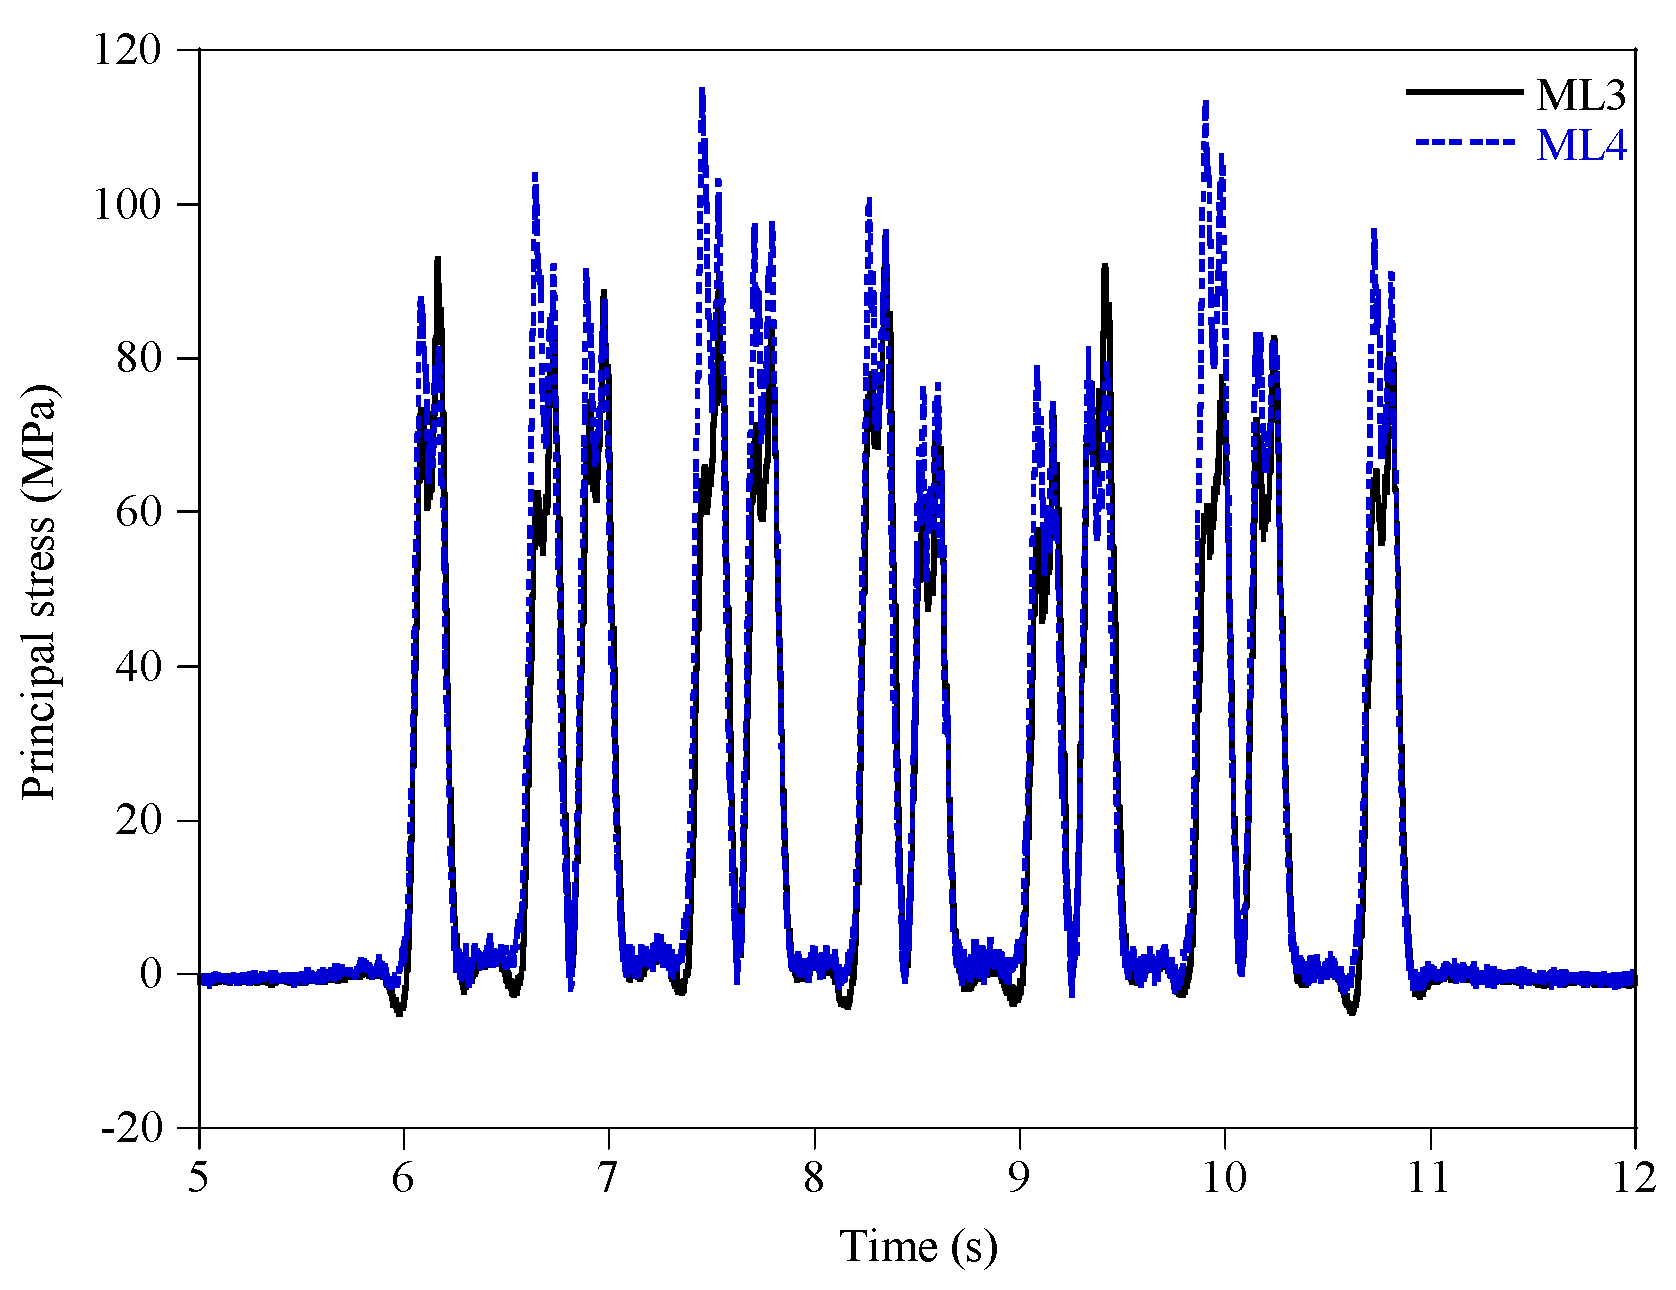
indicate the measured strains with the rosette strain gauge. As a representative case, the variations in the principal stresses for the outside track gauge at ML3 and ML4 during the train passage are illustrated in
Figure 4; there seems to be a clear distinction between the main vibrations due to the tandem axle of each carriage and the resulting residual vibrations. The train was composed of six carriages and each carriage had two tandem axles. Thus, 12 stress peaks are shown in the figure.
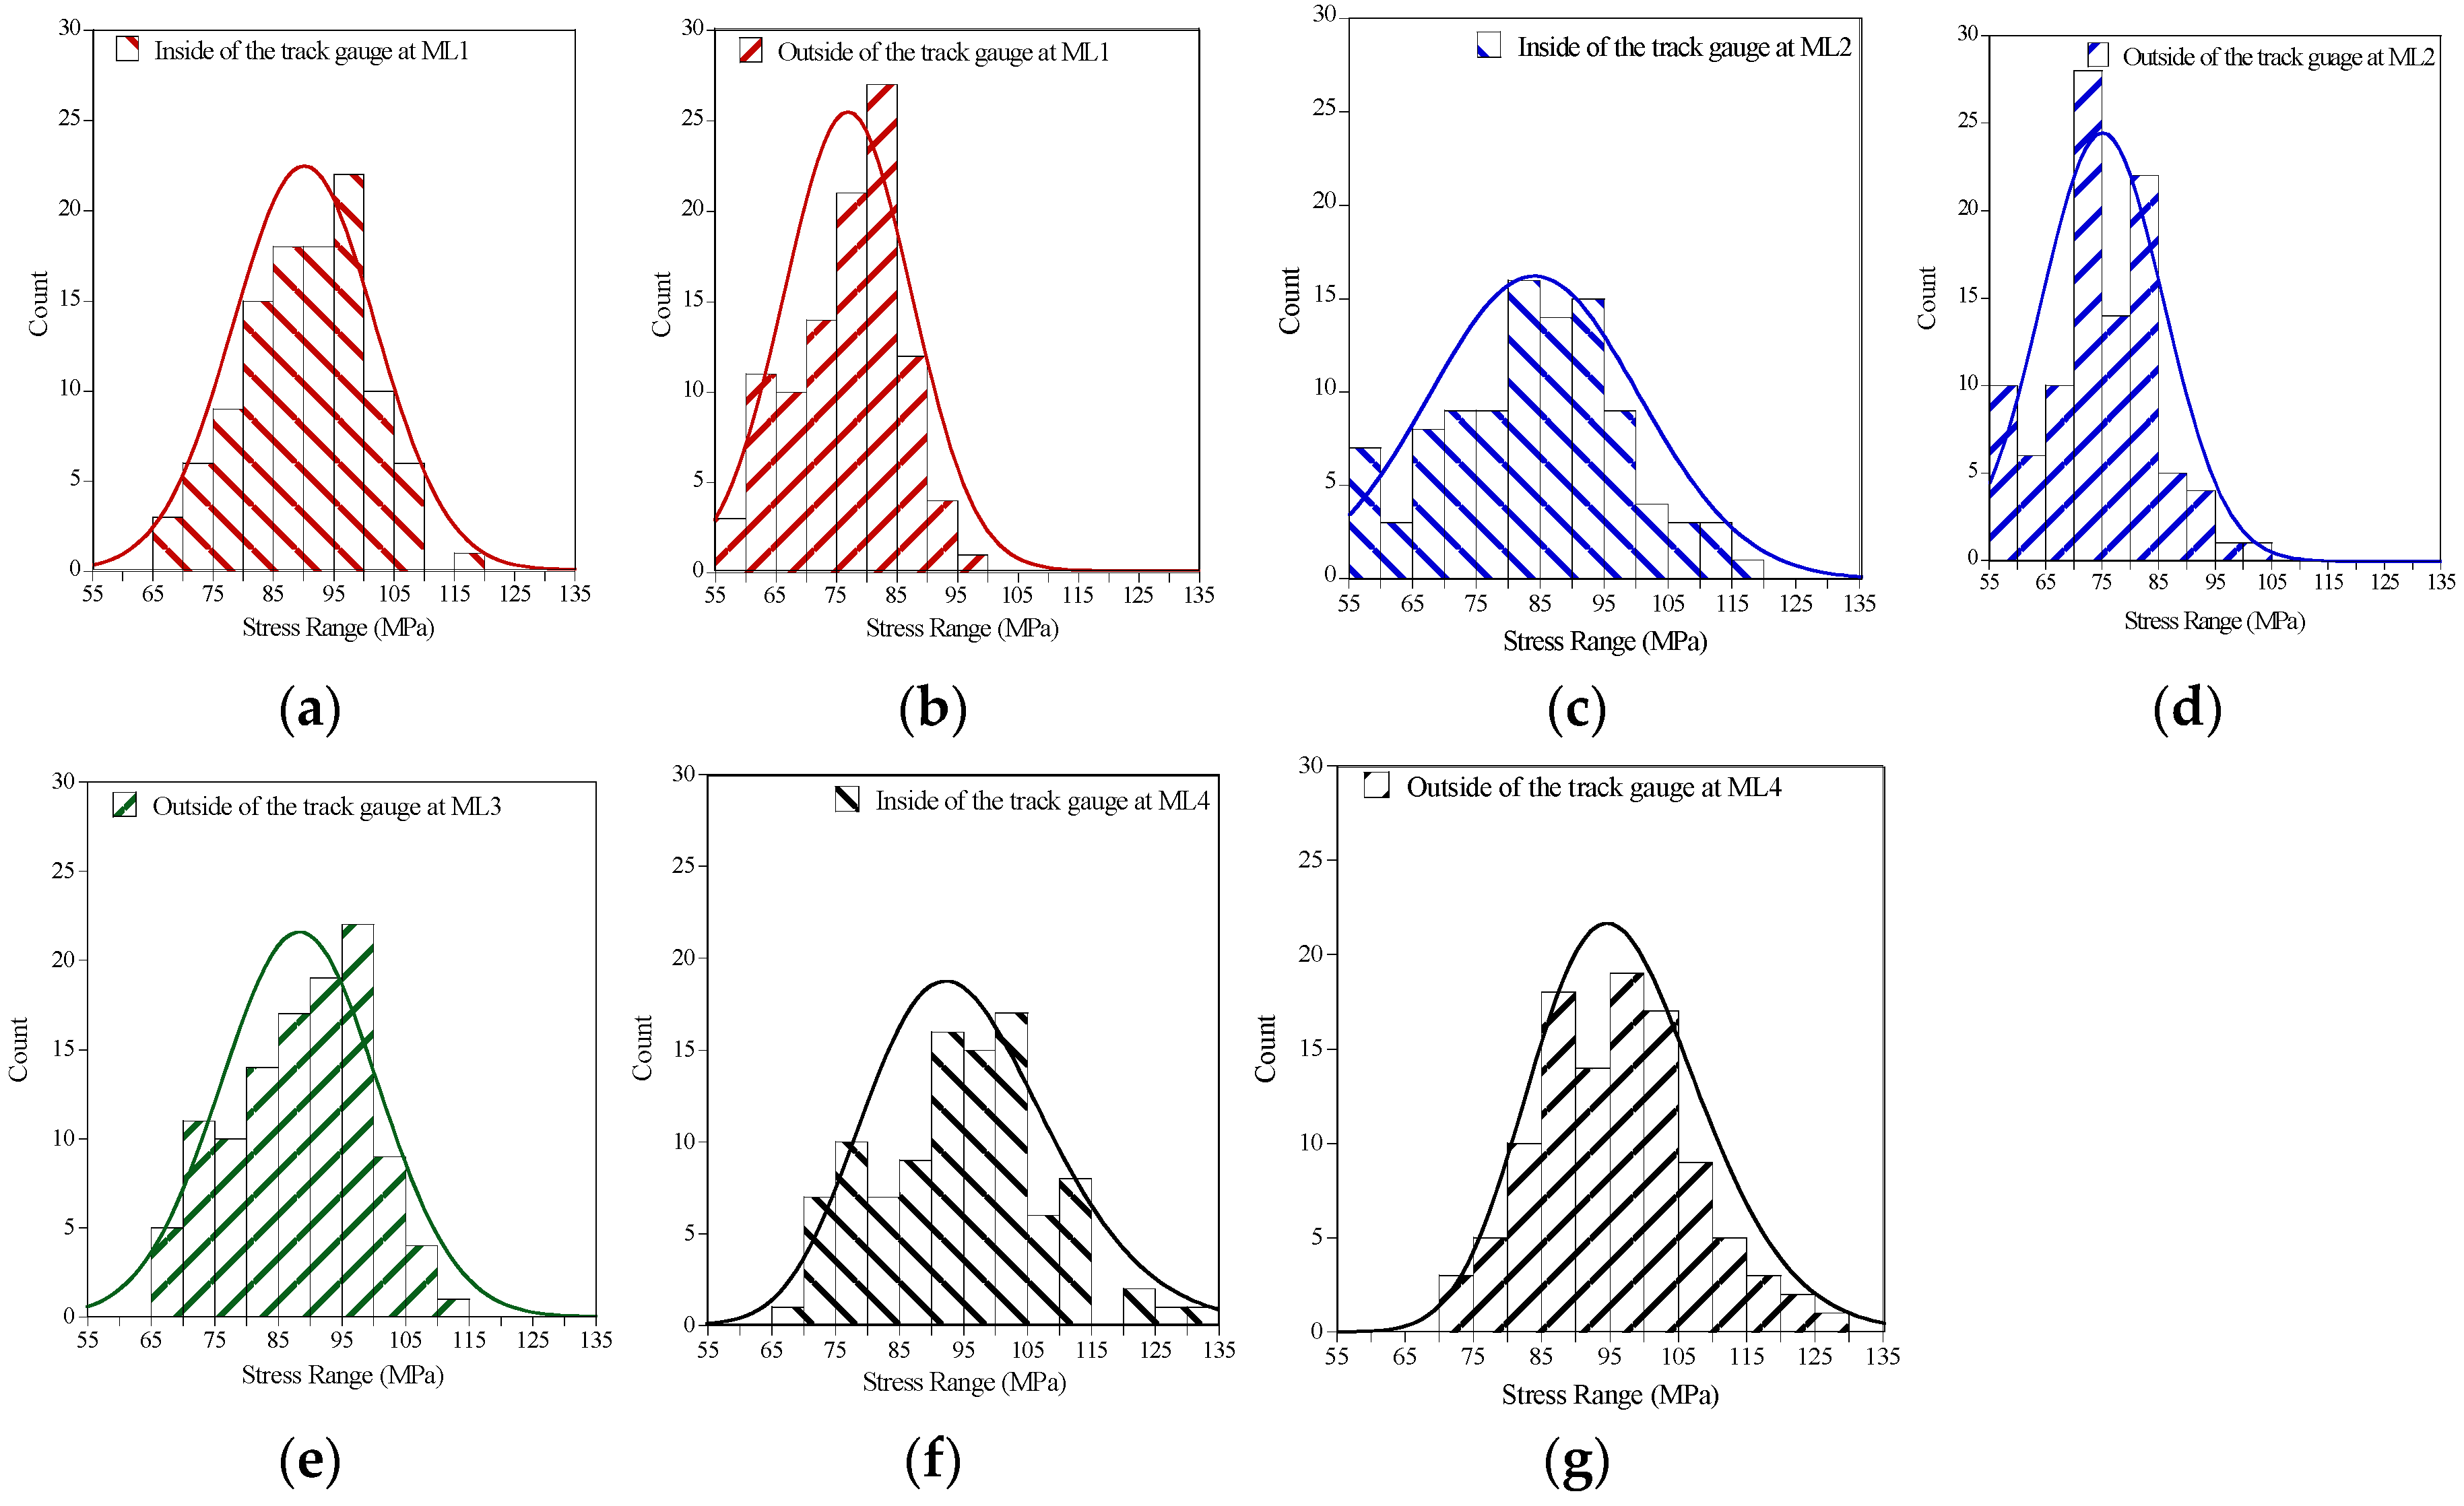
The rainflow-counting algorithm [
18] was adopted to calculate the stress range and the histograms of the stress ranges of the main vibrations are plotted for the four MLs in
Figure 5. The histogram for the stress range of the inside track gauge at ML3 is not presented because there was a measurement error in the data. The stress ranges due to the main vibrations were calculated as 55 to 120 MPa, while the stress range due to the residual vibrations was 30 MPa or less. According to the findings from a previous study [
19], a stress range of less than a quarter of the constant amplitude fatigue threshold (CAFT) can become truncated. Since the CAFT of the base metal is 165 MPa [
20], the stress ranges that were less than 41 MPa could be excluded.
Since most incidences of the fatigue damage to the tension clamps are observed on the inner rail, probabilistic models for the stress range were developed for the inner and outer rails and for the inside and outside track gauges individually for comparison purposes. The distribution type of the stress range was determined through the likelihood function and the Kolmogorov–Smirnov goodness of fit test [
21] for five distribution types. Normal, lognormal, Gumbel, Frechet, and Weibull distributions were not rejected as a result of the goodness of fit test for all stress ranges (
Figure 5). To confirm the most likely distribution type for the stress range, the likelihood functions were calculated for the five tested distribution types. The likelihood function
L is defined as follows:
where
and
indicate the
i-th data and the probability density function (PDF) of a random variable
X, respectively, and
denotes the statistical parameters of an assumed distribution. The normal distribution was the most likely distribution type for the stress ranges at ML1, ML2, and ML3, while the lognormal distribution was the most likely for the stress range at ML4.
Table 2 shows the distribution types for the stress ranges at the four MLs.
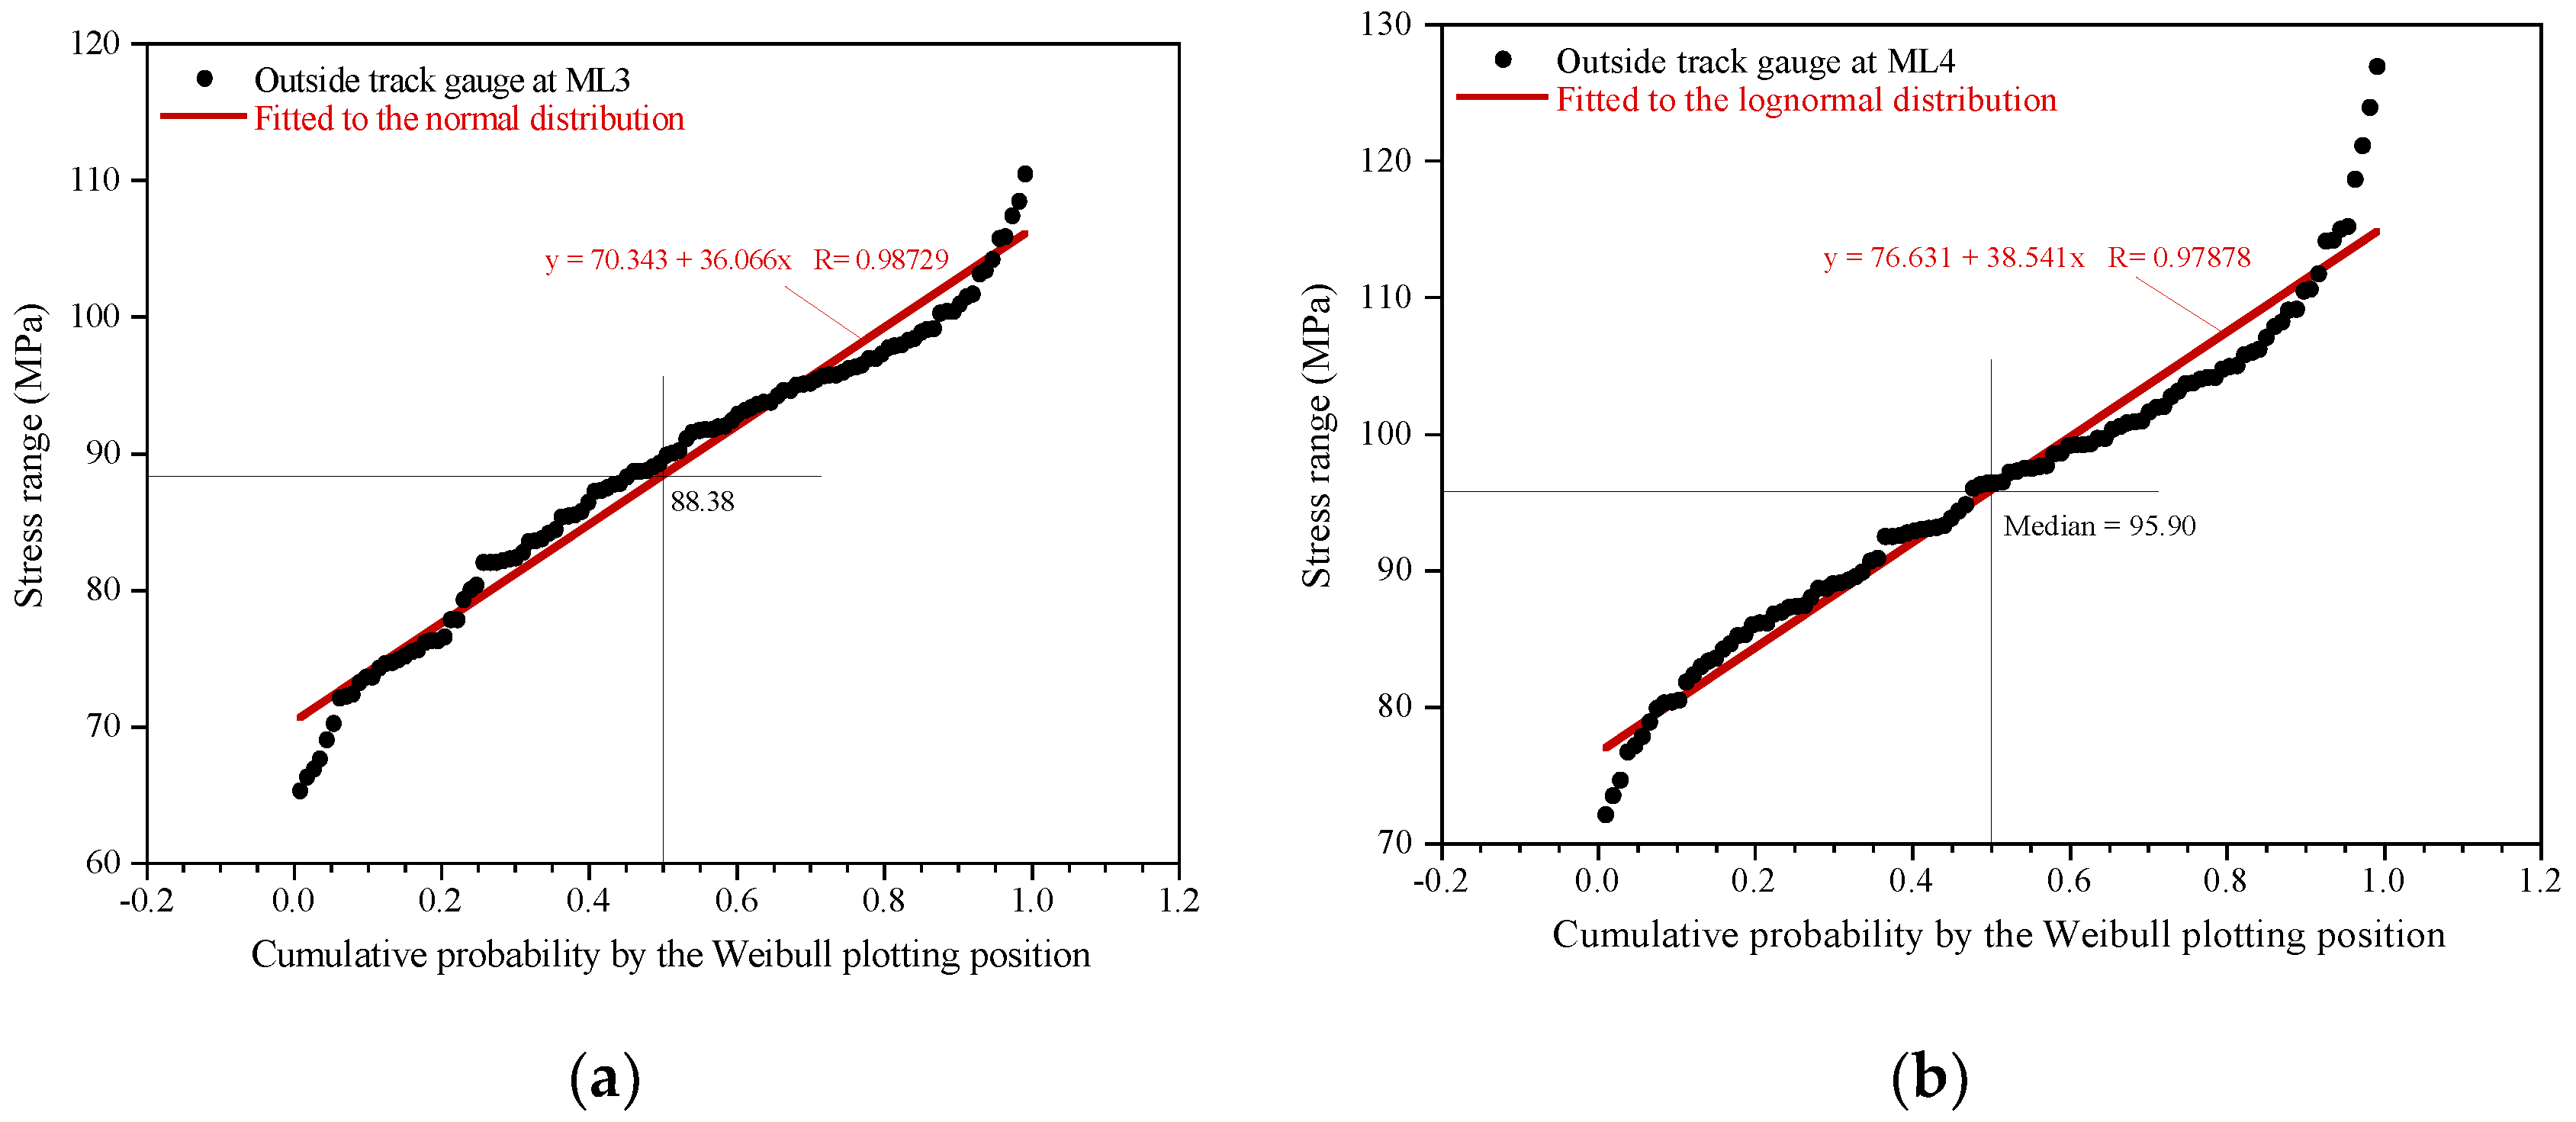
The mean and the coefficient of variation (COV) of the stress range were calculated by applying linear regression to the empirical cumulative distribution function on a probability paper.
Figure 6 shows the cumulative probabilities obtained by the Weibull plotting positions, plotted on the normal and lognormal probability papers with centered symbols for the outside track gauges at ML3 and ML4, respectively, as representative cases. The straight line in each figure indicates the fitted normal and lognormal distributions for the stress ranges. The statistical parameters, such as the mean, standard deviation, and COV, of the stress ranges are summarized in
Table 2 and the PDFs of the fitted distribution for the four MLs are exhibited in
Figure 5. The stress ranges of the inside track gauges are larger than those of the outside track gauges for ML1, ML2, and ML4, as also confirmed by the mean values reported in
Table 2. When comparing the stress ranges of the inner and outer rails, similar levels of the stress ranges were measured at ML1 and ML2, whereas that at ML4 was larger than at ML3.
3. Reliability Assessment of the Tension Clamp
The limit state function for the reliability analysis was defined as the critical cumulative damage index minus the cumulative fatigue damage obtained by the damage rule as follows [
15]:
where
g, Δ, and
n are the limit state function, Miner’s critical damage cumulation index, and the number of cycles in the stress range, respectively. In Equation (3),
A stands for the detail category constant (MPa
3) of the S-N curve in the AASHTO Bridge Design Specifications [
20]. Since the tension clamps were made from a plain base metal without any notches, the value for
A is determined by the Category A.
indicates an equivalent stress range for
m = 3, and
e denotes an error factor, which includes the uncertainties in estimating the stress value. The damage cumulation index, fatigue index, equivalent stress range, and error factor were considered as random variables in the reliability analysis.
The number of cycles in the stress range corresponding to the years in service was calculated by applying the following relationship [
16]:
where
N(
Y) and
Y present the accumulated number of the stress cycles and the number of years in service, respectively.
ADTT refers to the average daily train traffic on a rail. The actual
ADDT was equal to 160 for the urban railway track where the field measurements were performed.
Cs denotes the number of stress cycles per train passage. As a result of the rainflow-counting,
Cs became 10 for ML1, ML2, and ML4 and 11 for ML3.
The advanced first-order second-moment reliability method [
17] is usually adopted to calculate the reliability index, which is obtained by solving the following minimization problem:
where
β is the reliability index,
X denotes the vector of the random variables (
), and
indicates the 2-norm of the vector
X. The Hasofer–Lind–Rackwitz–Fiessler algorithm with the gradient projection method [
22] was adopted for the solution scheme to solve the minimization problem. Since the limit state function in Equation (3) was nonlinear with respect to the random variables, the most probable failure point could be calculated as follows.
where
indicates the vector of the random variables in the reduced coordinate system, which is obtained by the Rackwitz–Fiessler algorithm. The asterisk after derivative indicates the most probable failure point, i.e.,
represents the minimum distance point on the limit state function at the
k-th iteration, and
is the gradient vector of the limit state function at
. Note that
k denotes the iteration count. The statistical parameters of the random variables quoted from previous studies [
15,
23] are summarized in
Table 3.
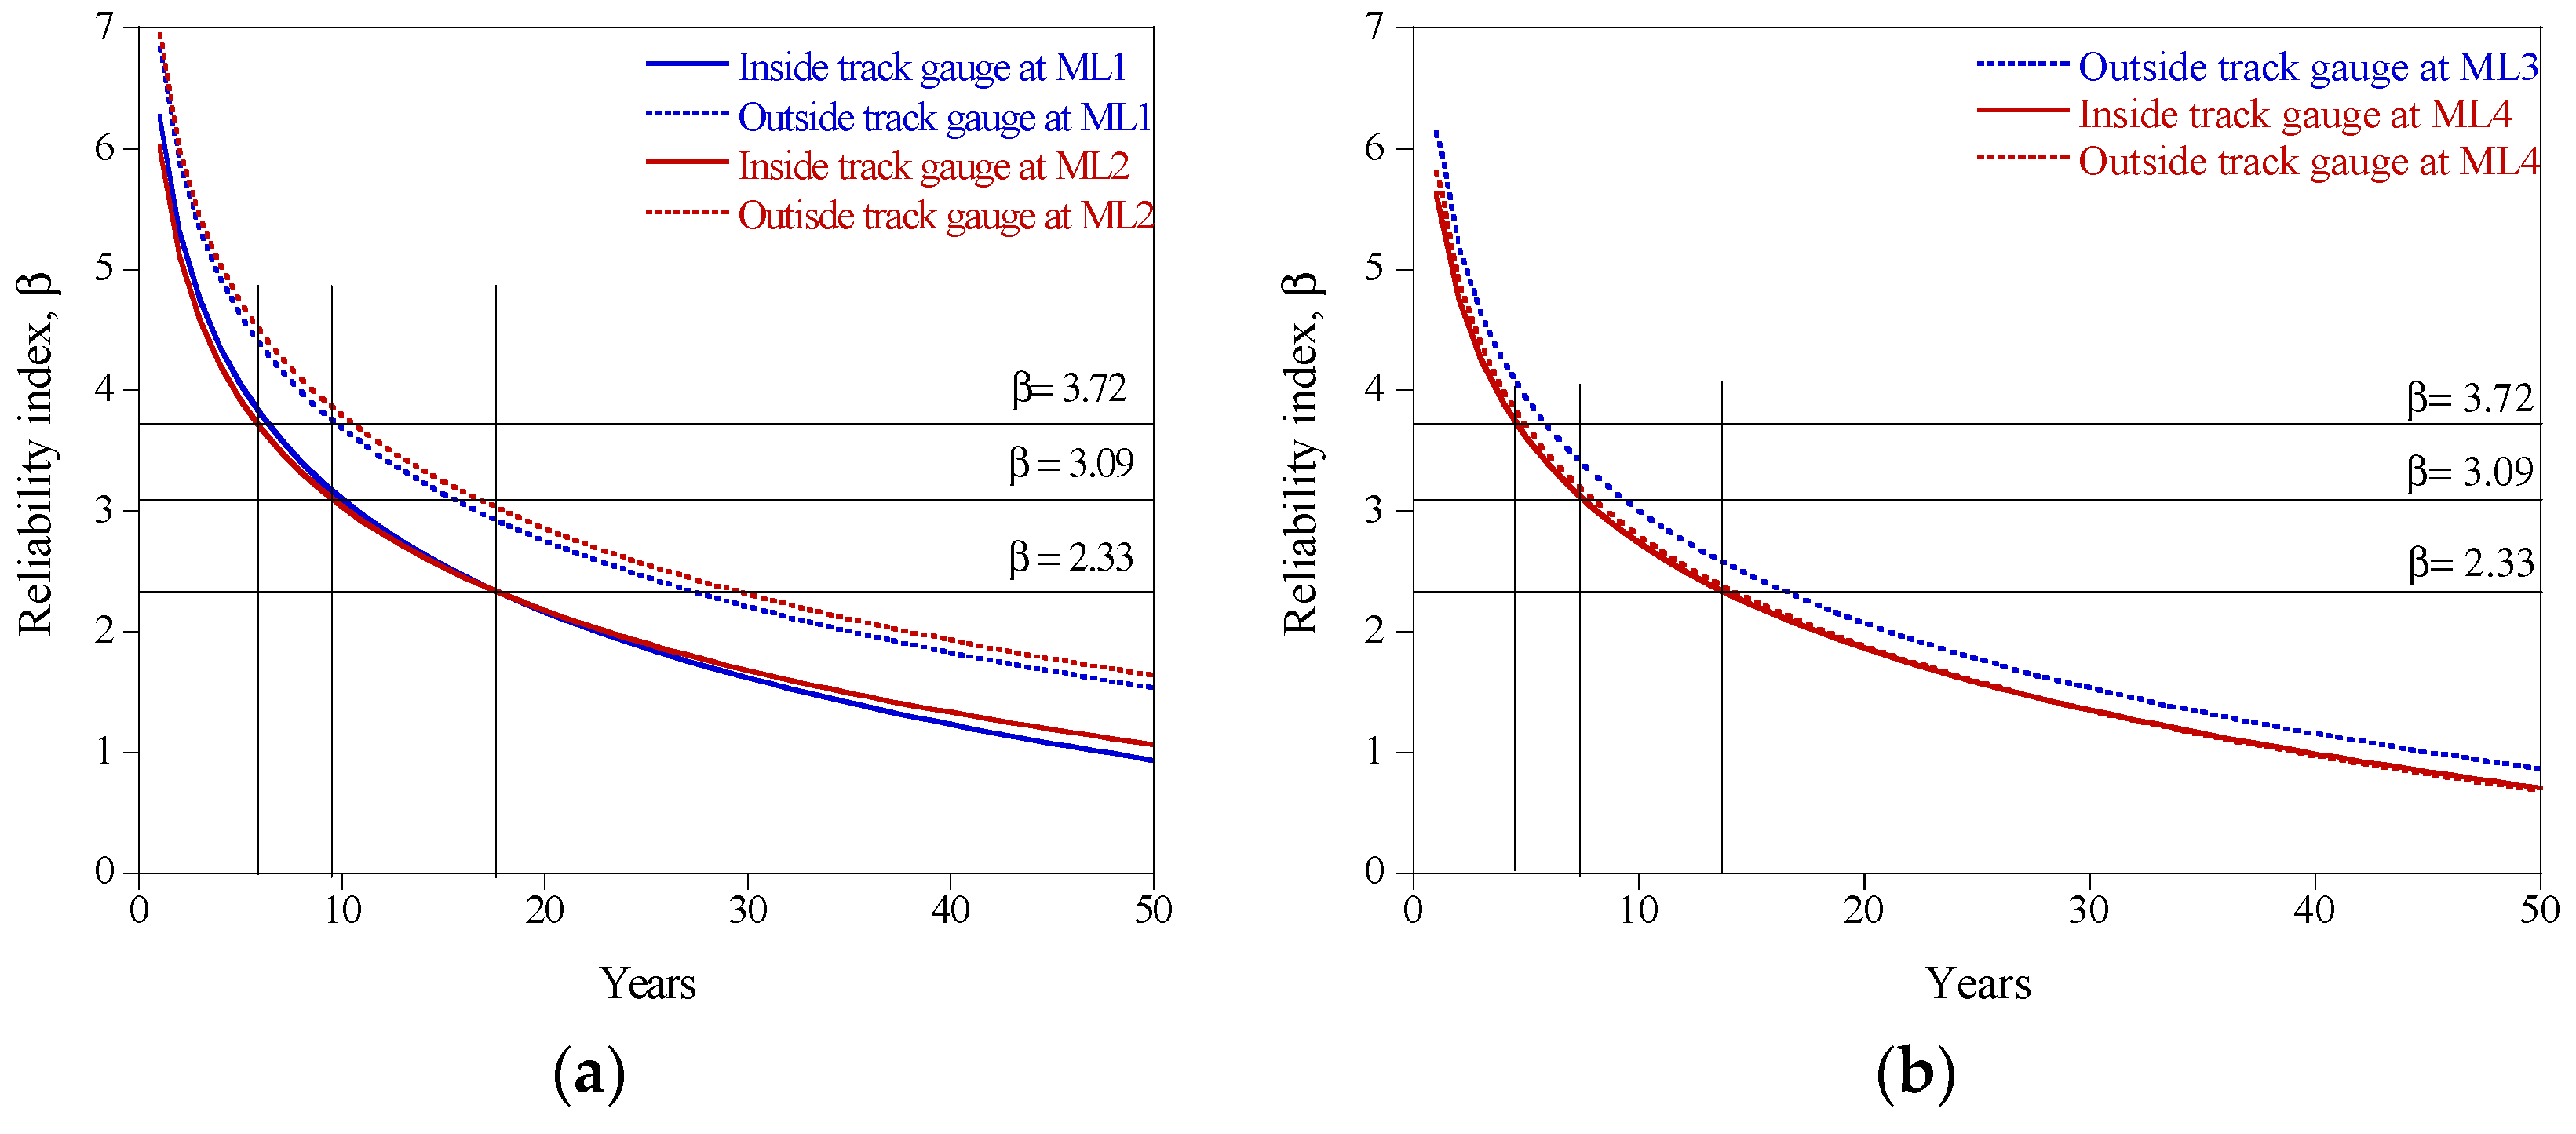
Figure 7 shows the reliability indexes of the tension clamps according to the number of years in service at the four MLs. In the figure, the blue lines indicate the reliability indexes of the outer rails (ML1 and ML3) and the red lines represent those of the inner rails (ML2 and ML4). The solid and dotted lines show the reliability indexes for the inside and outside track gauges of the rail, respectively. The reliability indexes of 3.72, 3.09, and 2.33 corresponding to the probability of failures (
Pf) of 10
−4, 10
−3, and 10
−2 are plotted with solid black lines. The years in service corresponding to the three reliability indexes are given in
Table 4. The reliability indexes of the tension clamps decreased rapidly at the start of use and then decreased gradually. Since the reliability indexes of the tension clamps were reduced by half compared to the initial level within the first 10 years, it is necessary to inspect the tension clamps for fatigue failure.
Figure 7a shows the reliability indexes for the inner and outer rails (ML1 and ML3) calculated for similar years in service. The reliability levels for the inside track gauges were always lower than those for the outside track gauges, which implies that the probability of the failure of the tension clamp on the inside rail in direct contact with the wheels of the train is high. Similarly,
Figure 7b shows that the reliability index for the inside track gauge at ML4 was slightly smaller than that for the outside track gauge. In addition, the reliability indexes for the inner rail (ML4) were much smaller than those for the outer rail (ML3). These results indicate that the tension clamp on the inner rail has a higher probability of failure than that on the outer rail, which is consistent with the field observations of fatigue damage in the tension clamps.
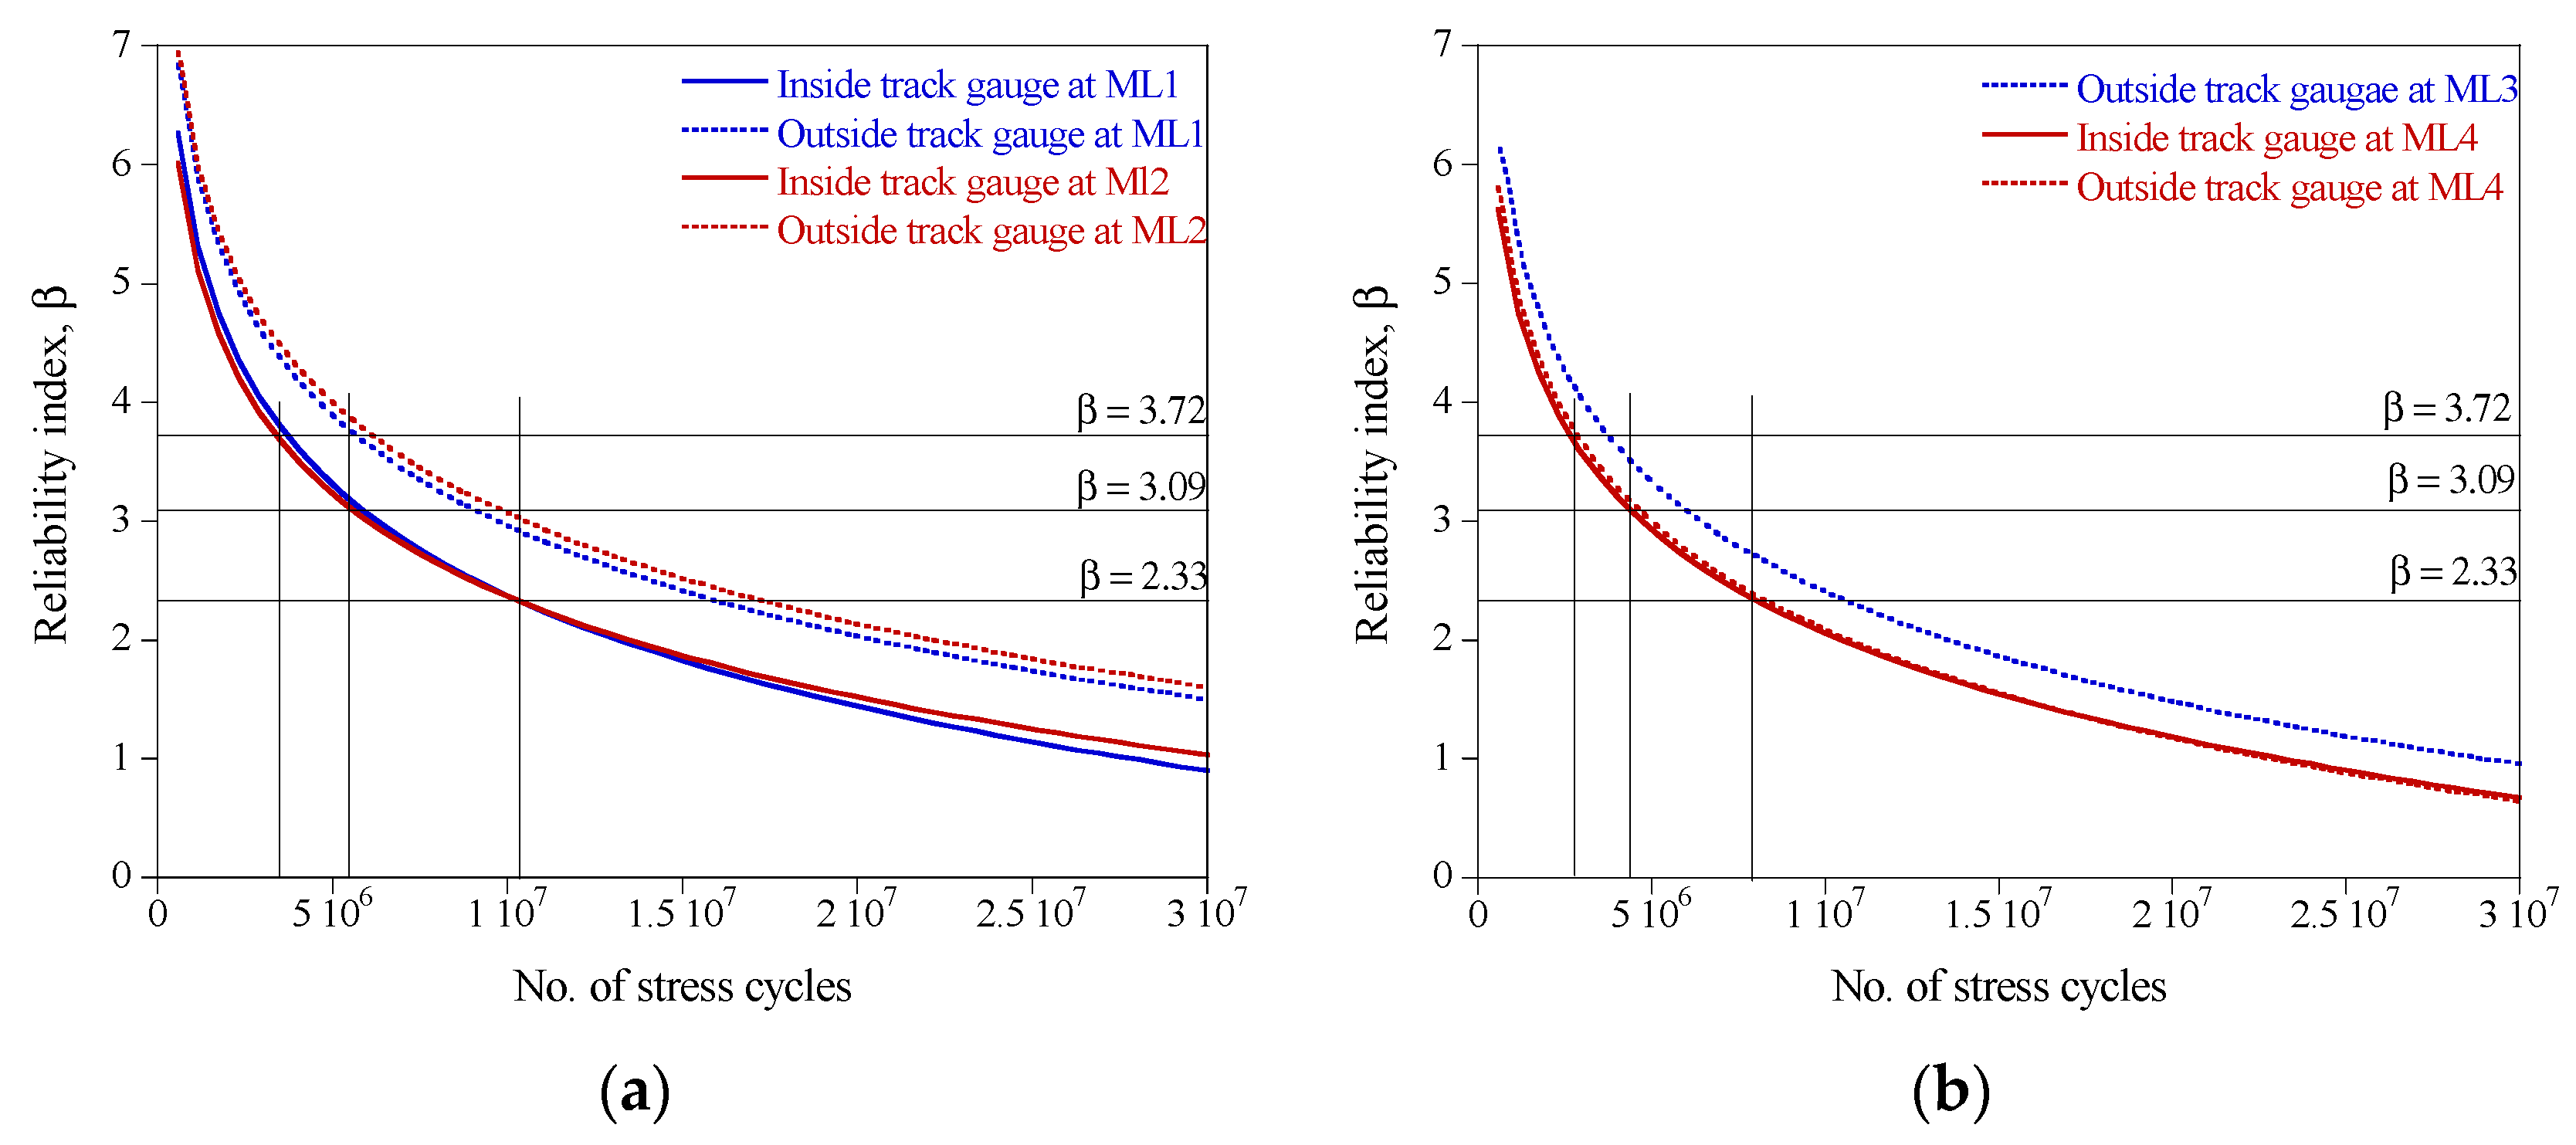
The variations in the reliability indexes against the accumulated number of stress cycles are presented in
Figure 8. It can be clearly observed that the reliability index of the tension clamps decreased rapidly as the number of stress cycles increased. When the cumulative number of stress cycles reached 5 million, the reliability indexes of the tension clamps on the inside track gauges at ML1, ML2, and ML4 decreased to half of the initial value. After 10 million stress cycles, the reliability index of the tension clamps was reduced to less than half of the initial value. As the
Cs values in Equation (4) were set as 11 for ML3 and 10 for ML4, the difference between the reliability indexes for ML3 and ML4 in
Figure 8b is larger than that in
Figure 7b. For equal years in service, ML3 had a larger cumulative number of stress cycles than ML4, so the rate of the decrease in the reliability index for ML3 appeared to be smaller. It is noteworthy that the cumulative number of stress cycles, as well as the years in service, should be considered when estimating the damage to tension clamps and making plans to replace them.
4. Conclusions
This study identified the cause of the fracturing of tension clamps used in rail fastening systems for urban railways and performed reliability analyses on their fatigue failure based on actual measurement data. The stress range, which is the dominant factor in the fatigue failure of the tension clamps, was estimated from the measured strains on the tension clamps at locations where most of the fracturing occurred from repeated train operations. The field measurement data at seven MLs, on both the inner and outer rails and from both inside and outside track gauges, were used in the study.
The statistical model of the stress ranges of the seven MLs was established using the field measurement data. The Kolmogorov–Smirnov goodness of fit test was employed to identify the fitness of the distributions for the stress ranges of five distribution types. The most fitted distribution for the stress range was selected by comparing the most likely values of the five distribution types. The statistical parameters of the fitted distribution were estimated by the linear regression of the empirical cumulative distribution functions plotted on the probability papers for the fitted distribution.
The reliability analysis on the fatigue failure of the tension clamps was performed using the statistical models of the stress ranges based on the measured data. The limit state function was defined as a linear function of the critical and cumulative damage indexes. The random variables for the reliability analysis included the stress range, critical damage index, detail category constant, and error factor. The results of the reliability analysis were mainly dominated by the statistical parameters of the stress ranges. The reliability indexes for the inside track gauges, which had large means or standard deviations of the stress range, were smaller than those of the outside track gauges. Moreover, the reliability level of the inner rails was lower than that of the outer rails at the aforementioned specific MLs, which is consistent with the field observations of fatigue damage to the tension clamps.
It is noteworthy that the reliability index of the tension clamps at all of the MLs decreased to less than half of the initial reliability within 10 years. Therefore, periodic inspection for fatigue damage to tension clamps is required. Furthermore, a system for the maintenance and replacement of the inner and outer rails and the inside and outside track gauges is necessary.


