Article

Monitoring of Liquid Viscosity for Viscous Dampers through a Wireless Impedance Measurement System

1
School of Electronics and Information, Yangtze University, Jingzhou 434023, China
2
National Demonstration Center for Experimental Electrotechnics and Electronics Education, Yangtze University, Jingzhou 434023, China
*
Author to whom correspondence should be addressed.
Appl. Sci. 2022, 12(1), 189; https://doi.org/10.3390/app12010189
Submission received: 3 November 2021 / Revised: 18 December 2021 / Accepted: 22 December 2021 / Published: 24 December 2021

Abstract

:
Viscous dampers are a type of seismic damping equipment widely used in high-rise buildings and bridges. However, the viscosity of the damping fluid inside the viscous damper will change over time during its use, which significantly reduces the seismic performance of the viscous damper. Hence, it is necessary to monitor the viscosity of the fluid inside the damper over its service life. In this paper, a damping fluid viscosity monitoring method based on wireless impedance measurement technology is proposed. A piezoelectric sensor is installed in a damper cylinder specimen, and the viscosity of the damping fluid is determined by measuring the piezoelectric impedance value of the sensor. In this study, 10 samples of damping fluids with different viscosities are tested. In order to quantitatively correlate damping fluid viscosity and electrical impedance, a viscosity index (VI) based on the root mean square deviation (RMSD) is proposed. The experimental results show that the variation of the real part in the impedance signal can qualitatively determine the damping fluid viscosity while the proposed VI can effectively and quantitatively identify the damping fluid viscosity.

1. Introduction

Traditional structures are designed to withstand natural disasters, such as earthquakes, strong winds, and tsunamis, by enhancing the seismic performance of the structure itself [1,2] (e.g., improving strength, stiffness, and ductility). Due to the uncertainties concerning earthquakes and structures, traditional seismic design methods cannot guarantee the safety of the structures under unpredictable large-intensity earthquakes [3]. To reduce the damage caused by earthquakes, various dampers or other vibration suppression technologies are usually applied in buildings or bridges as supplementary approaches to enhance the seismic performance of structures [4,5]. Madhekar studied the application of viscous dampers on highway bridges to reduce the bearing displacements and eliminate the isolator damage [6]. The dampers are often combined with the base isolators to improve the seismic reliability of structures [7,8]. Except passive vibration control technologies, active and semi-active approaches are also developed in civil engineering to provide effective protection in earthquakes [9]. The dampers can substantially dissipate the seismic energy of the structure and mitigate seismic-induced structural damage [10]. Kandemir used viscous dampers for the seismic reconstruction of steel arch bridges [11]. Canio used base isolation technology to protect highly vulnerable statues and delicate objects [12]. Baggio used the isolation technique to reduce the seismic action of the marble sculptures at the Accademia Gallery in Florence, where the sliders were on a small-size double concave curved surface [13].
Viscous dampers have the following characteristics: good energy dissipation effect [14], conveniently adaptable to implement a small amount of earthquake energy dissipation [15]; minimal impact on structural stiffness; flexible arrangement, connection methods, easy integration with the building; low maintenance costs [16]. The use of viscous dampers in civil engineering improves the energy dissipation capacity of the structure, enhances the seismic performance of the structure, and helps better meet safety requirements [17]. Viscous dampers dissipate vibration when the motion of the piston inside the damper forces a viscous fluid to flow from one cavity of the cylinder to another [18]. This flow converts the kinetic energy of the viscous fluid into thermal energy and transfers the energy to the external environment.
The energy dissipation and damping effect of viscous dampers depends on the viscosity of the damping fluid in the dampers [19]. Over time, the viscosity of the damping fluid will gradually decrease, affecting the effectiveness of the damper [20]. Further decreases in viscosity can eventually lead to the failure of the damper, and prevent it from performing its protective function in the event of an earthquake or arrival of strong winds. Hence, it is necessary to continuously monitor the viscosity of the damping fluid.
In recent years, Structural health monitoring (SHM) methods have been increasingly used in civil engineering [21,22]. The definition of SHM is to monitor the status of the tested structure by using damage free monitoring technology [23,24] and data analysis means including a variety of digital signal processing [25,26]. It mainly aims to identify whether there is damage in the structure [27], determine the specific damage location [28], quantify the degree of structural damage, and evaluate the remaining service life of the structure [29]. In addition, piezoelectric ceramics can be used as both sensors and actuators based on the direct and inverse piezoelectric effects [30,31]. In the electro-mechanical impedance (EMI) method [32], the piezoelectric ceramic transducer acts as both an actuator and a sensor to evaluate the health state [33] of the monitored structure by comparing impedance measurements during its baseline healthy state [34] and measurements after damage has occurred [35,36]. Chen et al used the series/parallel multi-sensing technique to simultaneously detect the looseness of multiple bolts [37]. Huo et al used the piezoceramic smart washer to monitoring bolt pre-load [38,39]. Li et al used electromechanical impedance to monitoring corrosion damage [40,41,42]. Shi et al used electromechanical impedance to monitor the grout compactness in a concrete filled fiber reinforced polymer tube [43]. Based on the phase shift, Abdulkareem et al. developed a non-destructive evaluation device to monitor the fluid viscosity [44]. Chen at al. used the wave propagation method to monitor the viscosity of fluids [45]. While the above methods have unique benefits for the precise and accurate monitoring of damage, all require wired connections, which can impede practical implementation. A wireless, piezo-based impedance measurement system would be much more practical.
Furthermore, although the above methods can distinguish changes in liquid viscosity, implementation can be highly complex, and require the use costly, high-end data acquisition equipment. Requirements are compounded when more than one sensor is needed, which limits the practical application of the piezoelectric impedance method. To overcome this drawback, this paper proposes a viscosity monitoring method for viscous damper liquids based on an innovative wireless impedance measurement system that is designed for practical use. In the following experiment, a damper cylinder specimen is designed, and a sensor is embedded inside the specimen. A total of ten different viscosities of damping fluid were tested. A wireless impedance measurement system is used to capture changes in the resonance frequency of the damping fluid over different viscosities. Finally, based on the RMSD method, a normalized viscosity index (VI) is proposed in this paper to evaluate the viscosity variation of the damping fluid.

2. Monitoring Method of Damper Fluid Viscosity

2.1. The Principle of the EMI Method

The piezoelectric effect is a unique property of PZT transducers and is divided into positive piezoelectric effect and inverse piezoelectric effect. The positive piezoelectric effect refers to the deformation of the PZT transducer by applying mechanical force to the transducer, resulting in internal electrodeposition and the generation of positive and negative charges of opposite polarity at both ends of the crystal material. The inverse piezoelectric effect refers to the application of an electric field to the PZT transducer, causing a change in the shape or form of the PZT transducer. In the 1990s, Liang et al. proposed a one-dimensional electromechanical impedance theory model, and the schematic diagram of the model is shown in Figure 1. The principle of the damage monitoring technology of the piezoelectric impedance method is that the mechanical impedance characteristics of the measured structure are coupled to the electrical impedance characteristics of the transducer through the mutual coupling of the piezoelectric ceramic transducer and the measured structure, and the change of the electrical impedance characteristics of the transducer can reflect the change of the mechanical impedance of the structure caused by the damage. Therefore, the damage of the measured structure can be evaluated by analyzing the electrical impedance characteristics of the PZT sensor. Equation (1) is the impedance expression of PZT sensor.
Z ( ω ) = i ω w p l p h p ε ¯ 33 T d 31 2 Y ¯ 11 E Z S Z S + Z A 1

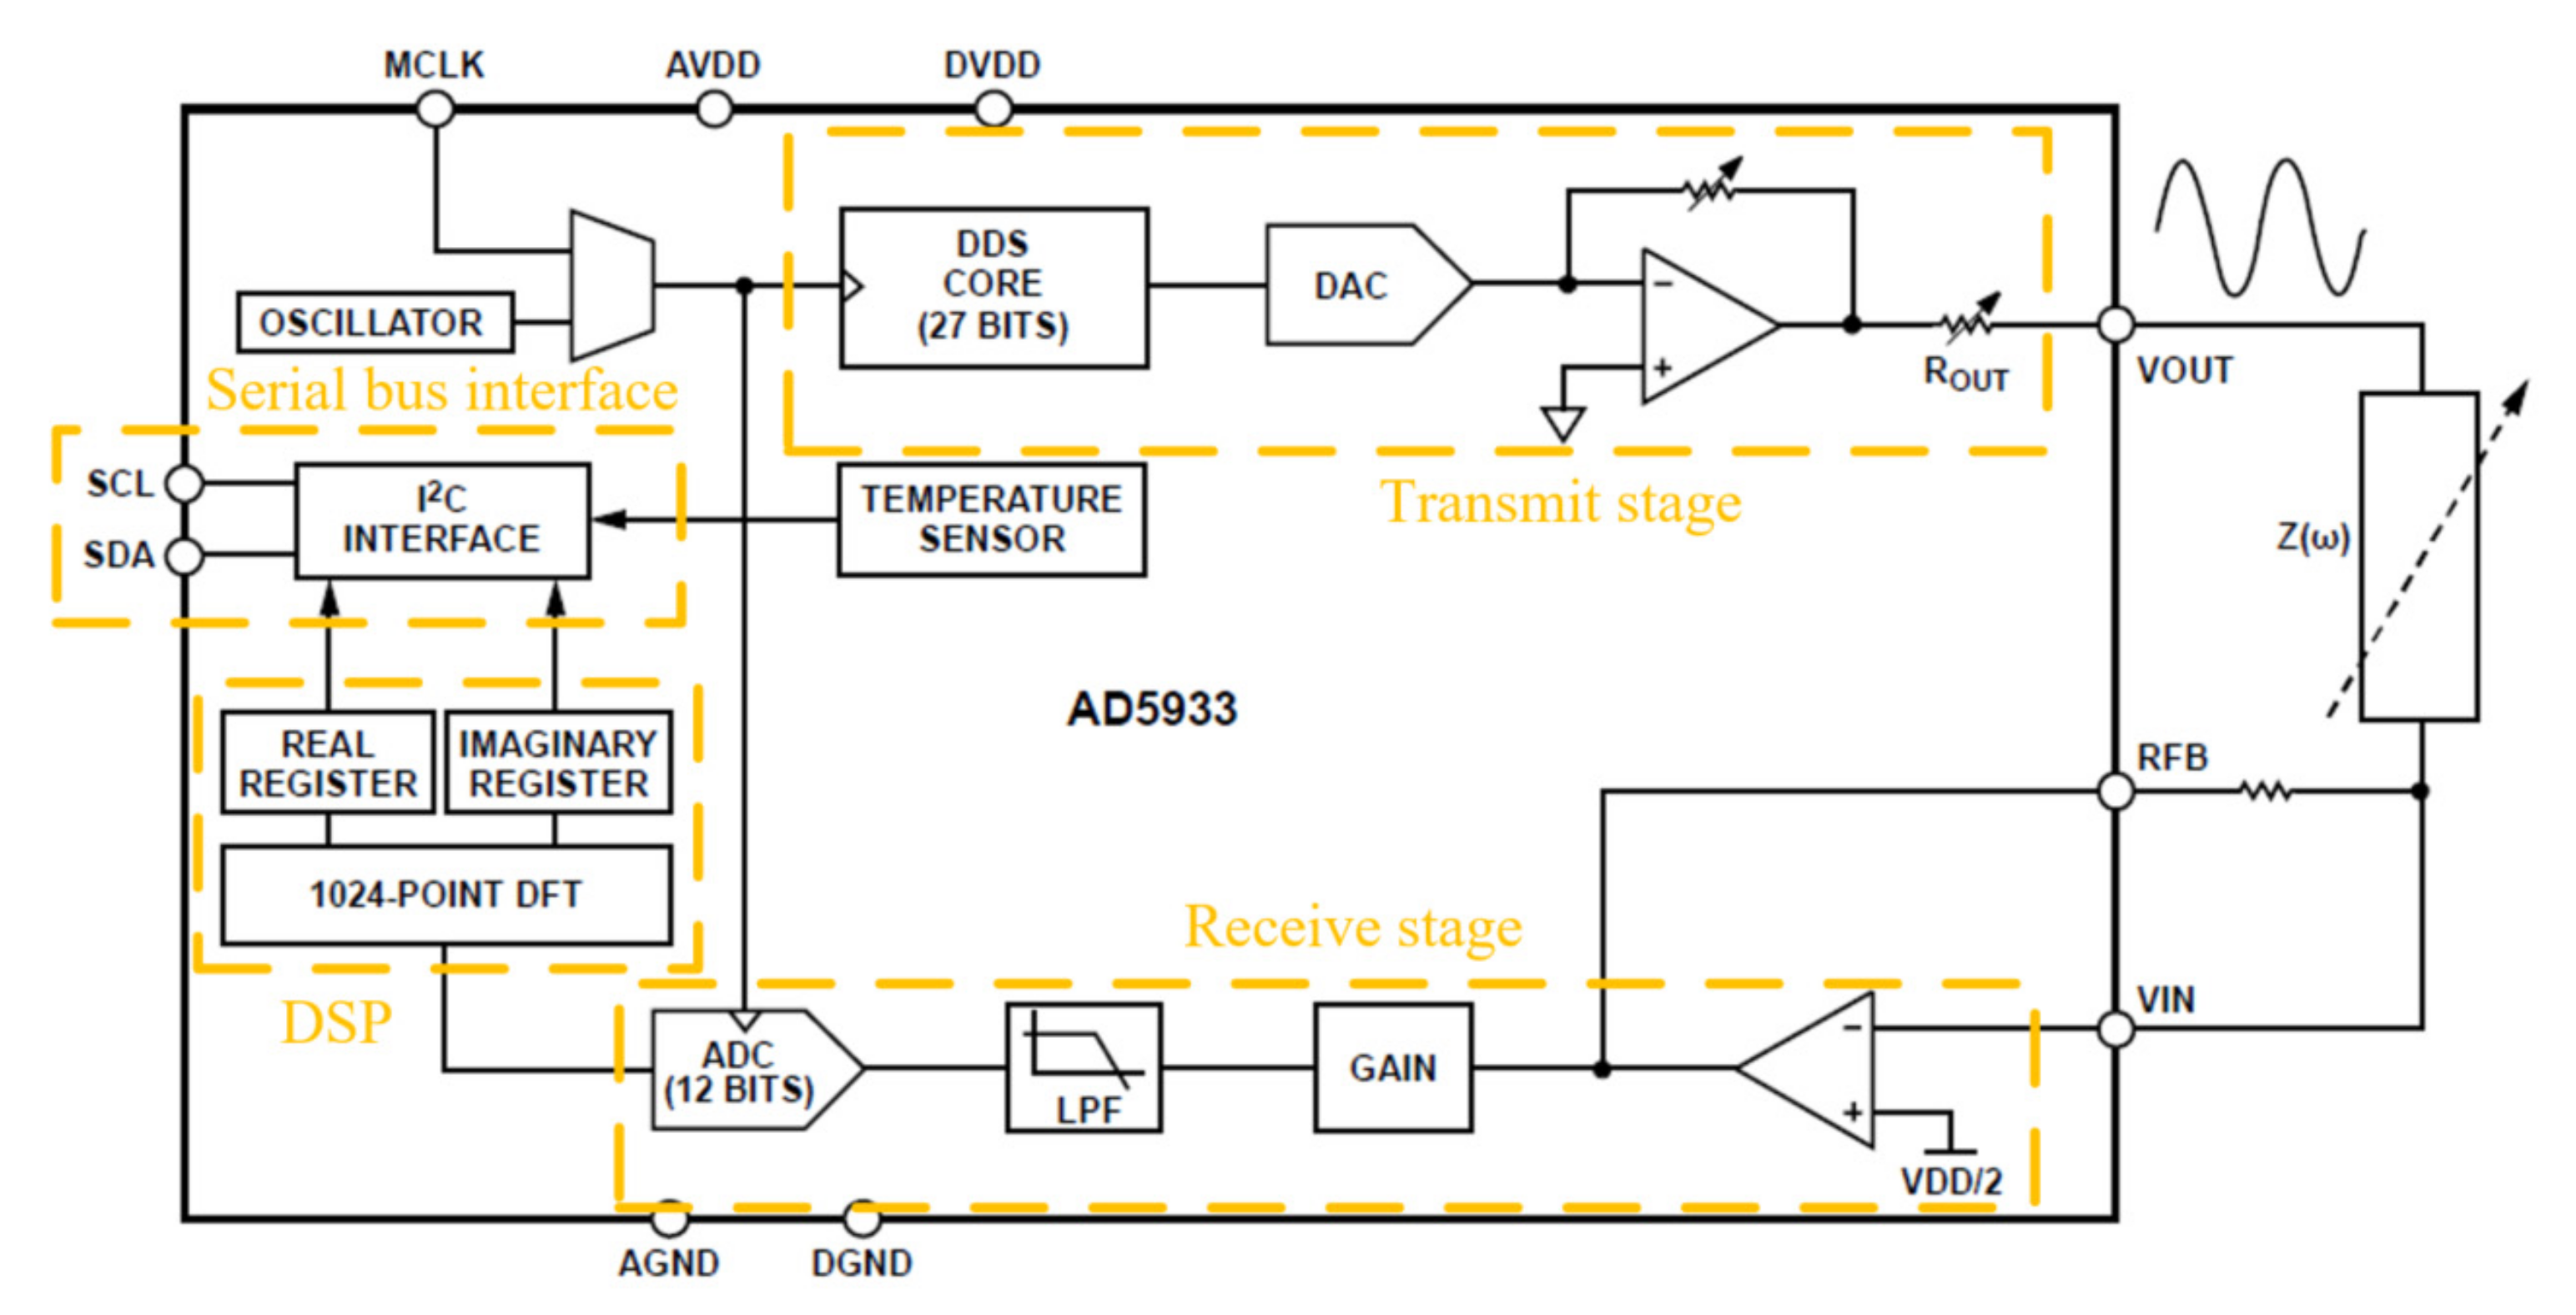
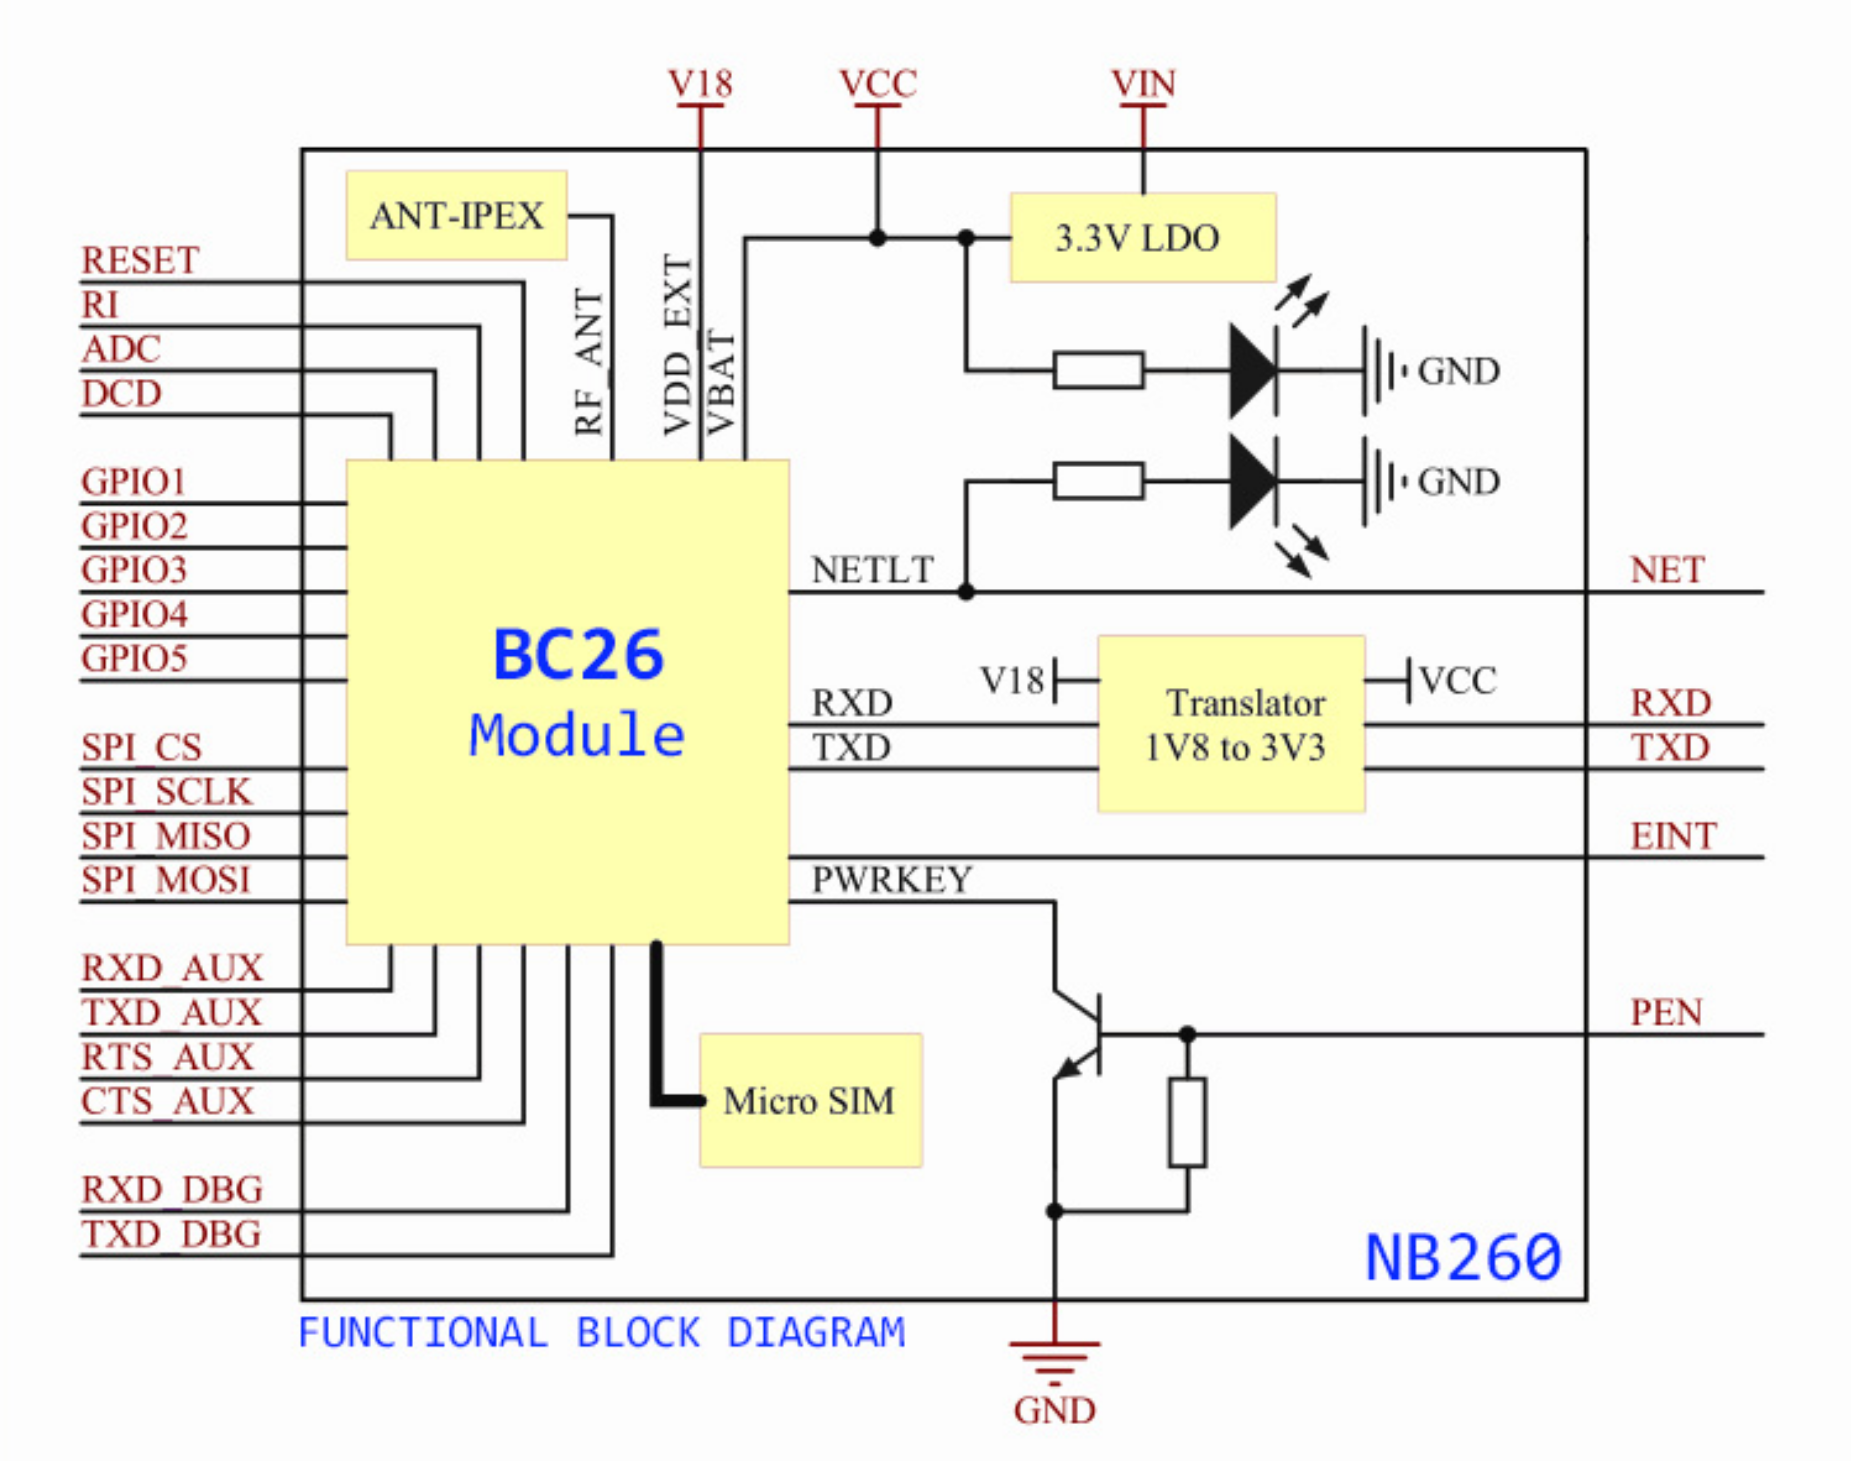
2.2. Design of Wireless Impedance Measurement System

The overall scheme of the wireless impedance measurement system used in this paper is shown in Figure 2. The system consists of the following four modules: power supply, impedance measurer, main controller, and communications. The power supply module can provide +3.3 V working voltage for the system. The main control module STM32F103C8T6 provides control and information processing for AD5933, NB, and other modules. The communications module is responsible for sending measurements to the host computer or cloud server.
The impedance measurement module uses the AD5933 as the core, and the internal functional block diagram of the chip is shown in Figure 3. The AD5933 contains four main parts: the transmitter stage, the receiver stage, the digital signal processor (DSP), and the data transmitter. The transmitter stage generates a sinusoidal excitation signal of up to 100 kHz with a resolution of 0.1 Hz. The receive stage conditions the impedance response signal and then inputs the conditioned signal into a 12 bit, 1 MSPS analog-to-digital converter (ADC). The built-in DSP module performs discrete Fourier transform (DFT) processing on the digital data output from the ADC. The data transfer records the real and imaginary registers after DFT processing at each frequency point through the IIC interface, and finally the impedance of the measured object can be calculated according to Equation (2).
Z = 1 k × Re 2 + Im 2
where |Z| denotes the impedance modulus, k denotes the gain coefficient, and Re and Im denote the real and imaginary parts of the impedance, respectively.
NB260 module is selected as the wireless transmission module. NB260 module is a Narrowband IoT (NB-IoT) series module with high performance, small volume, and low power consumption. It supports NB-IoT all over the world. The minimum power consumption is only 0.2 mW and the size is 33 × 25 × 5 mm. NB-IoT is an international Internet of Things standard. It has the characteristics of flexible deployment, wide coverage, and low cost, supporting the access of a large number of devices, and has the advantage of direct access to the web server. NB260 module and MCU control module interact with each other through serial port. The NB260 module is connected to the master module through a serial port, and the initialization settings and data interaction are performed through AT commands. The NB260 module has three operating states, including a connection mode, an idle mode and an energy saving mode. When the data transmission is completed, the master control module commands the NB260 module to enter energy-saving mode to reduce system power consumption and improve the battery life. The functional block diagram of NB260 is shown in Figure 4. The physical diagram of the wireless impedance measurement system is shown in Figure 5.

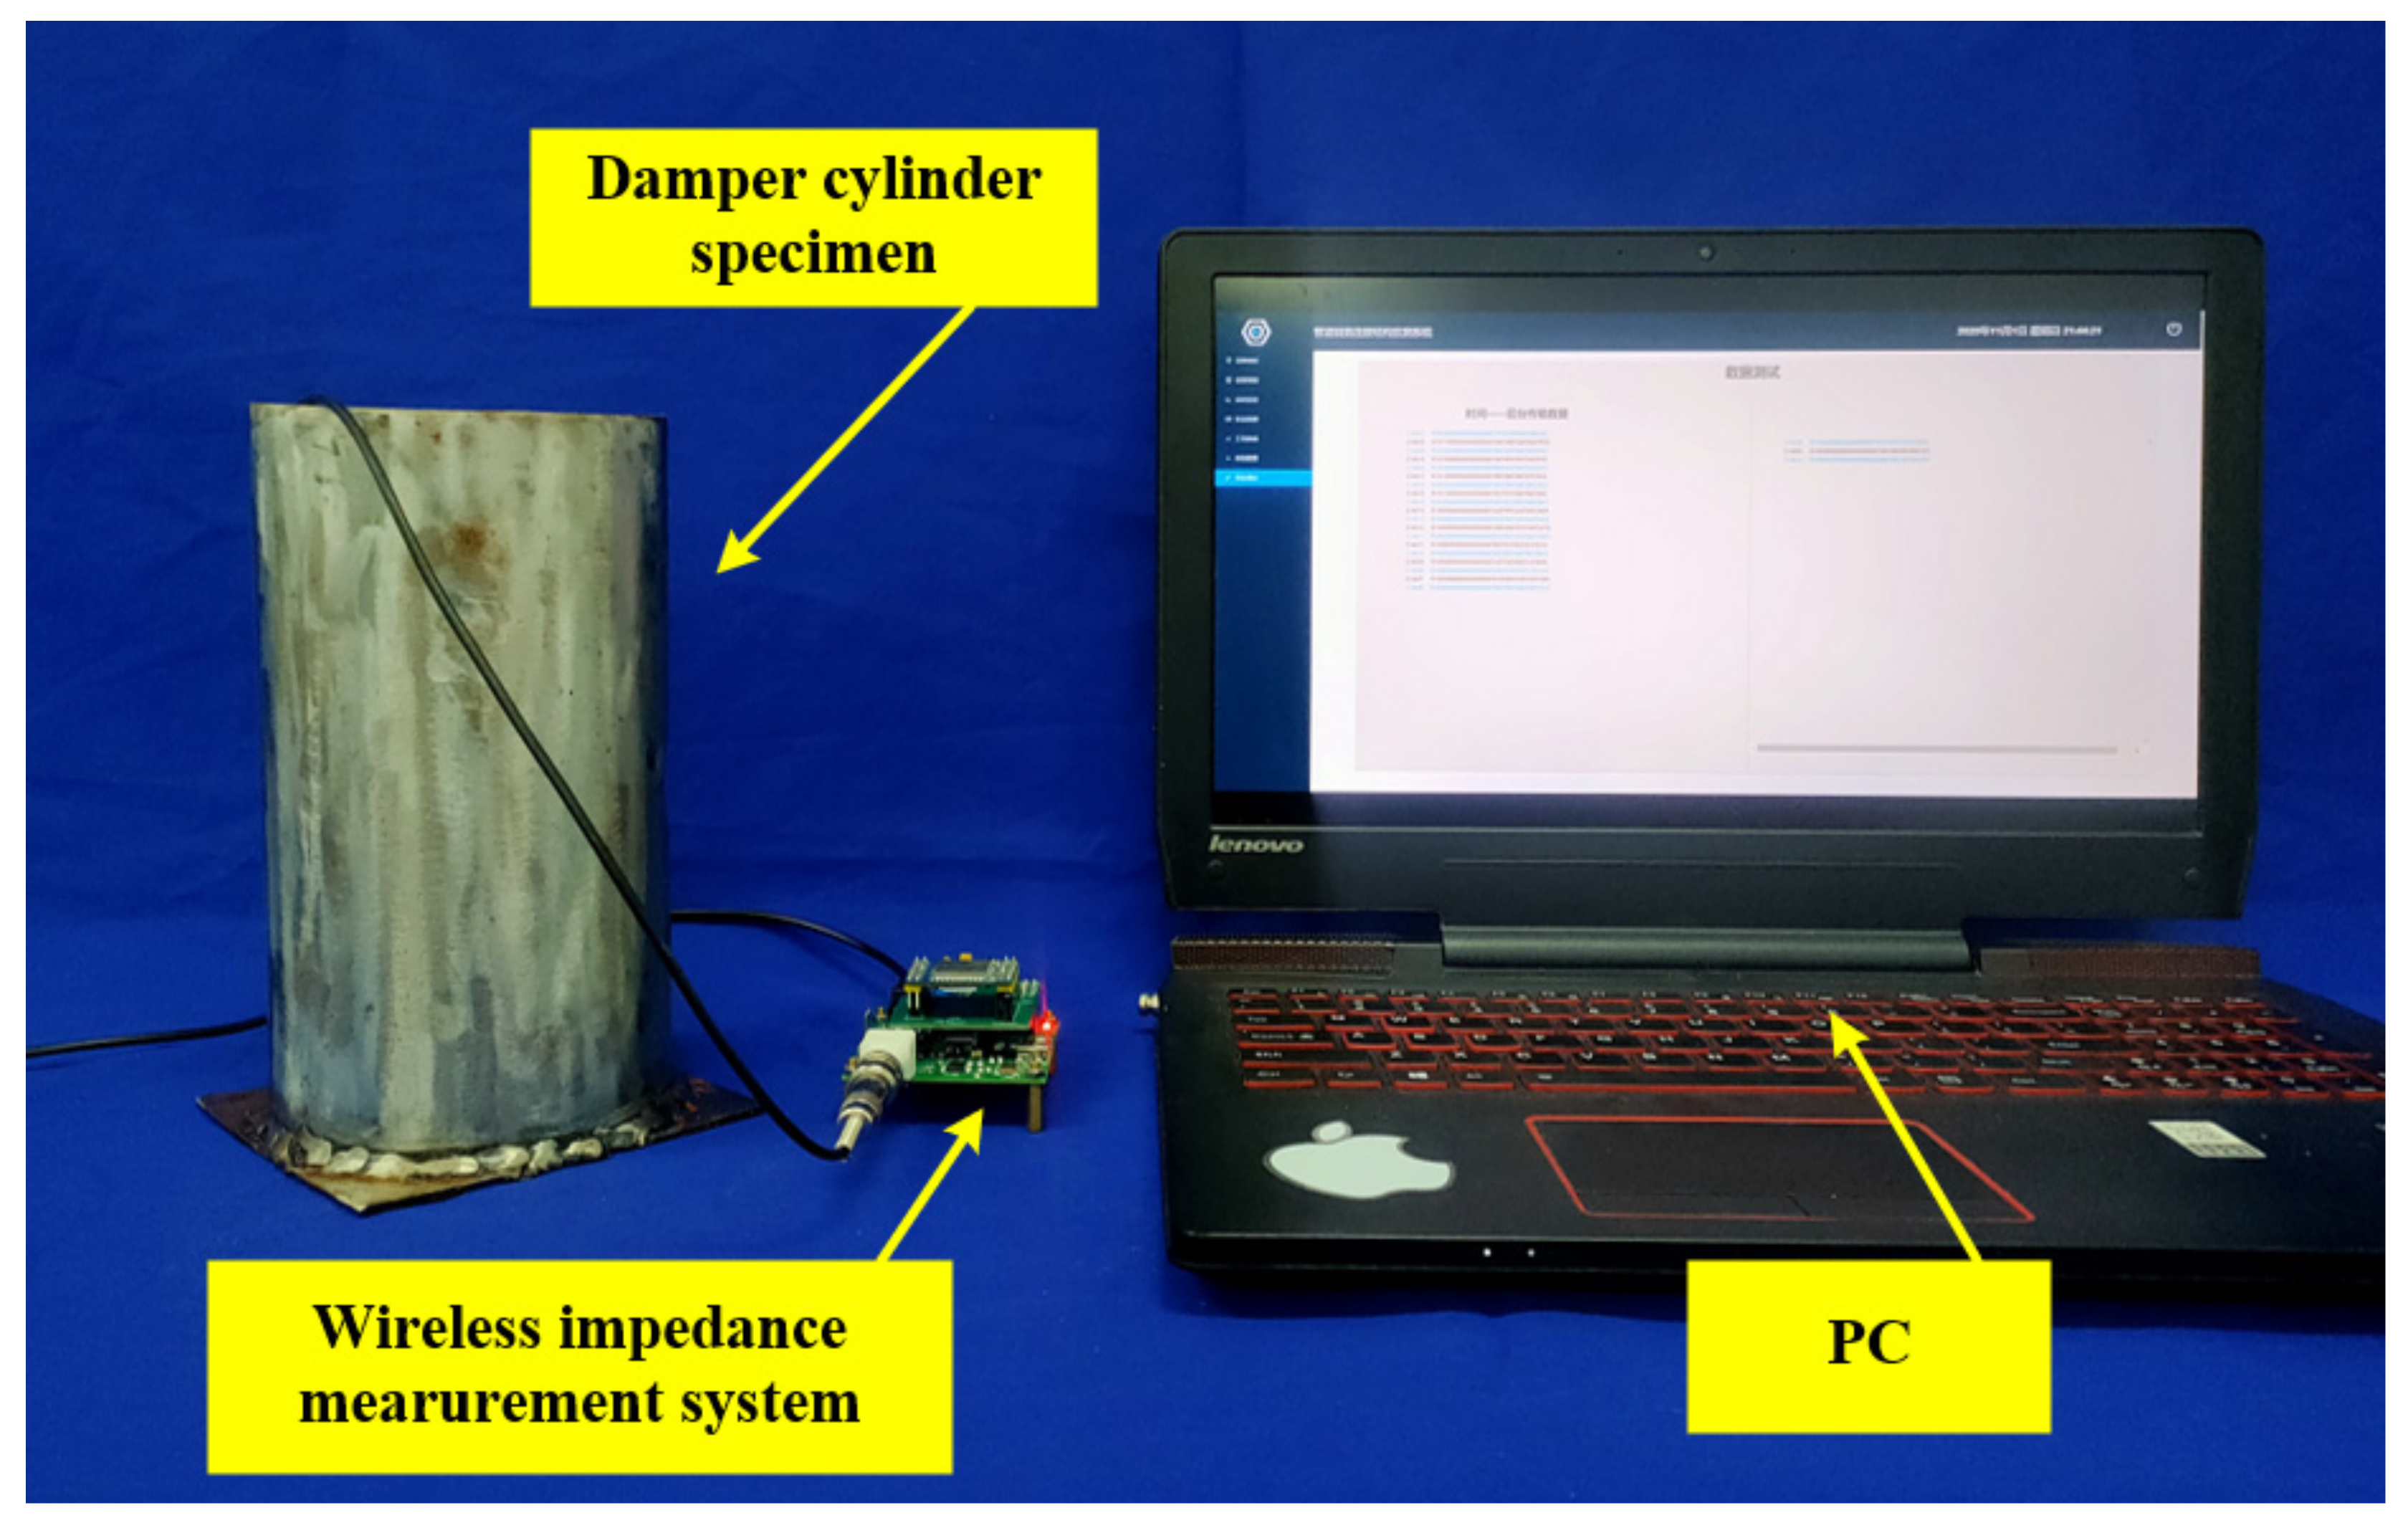
3. Experimental Set Up

The viscous damper is a type of passive velocity-related damper that operates by generating a damping force through the interaction of a viscous medium with structural parts of the damper. Viscous dampers are generally composed of a cylinder, a piston, a damping hole, damping medium (viscous fluid), and a guide rod. In order to simulate the real monitoring environment, the experimental specimen of the damper is made cylindrical in appearance. The physical and structural diagram of the damper cylinder test piece is shown in Figure 6.
The damping medium consisted of methyl silicone oil, which has stable performance and is not affected by temperature. The damping medium will change during use. In order to simulate the viscosity of the damping medium at different stages, high temperature resistant dimethyl silicone oil (Liansheng Dow Corning Silicone Oil Sales, Shenzhen, China and Beijing Haibeisi Company, Beijing, China) is used. Ten different viscosity grades of dimethylsilicone oil are tested, and the viscosity of ten different samples are listed in Table 1 and the physical picture is shown in Figure 7. The samples of damping liquid are odorless and non-toxic, transparent and viscous in appearance, with good chemical stability. The density of these samples is 0.97 g/cm3, and their viscosities are listed in Table 1. A PZT patch (model PZT-5) with the size of 50 mm × 12 mm × 1 mm is bonded inside the specimen, as shown in Figure 8.
The experimental setup for wireless, impedance-based damping fluid viscosity monitoring includes a wireless impedance measurement system, computer, damper cylinder specimen and PZT sensor, as shown in Figure 6, Figure 7, Figure 8 and Figure 9. The wireless impedance measurement system was developed by the authors. The device has a frequency measurement range of 10 –100 kHz and an impedance measurement range of 100 Ω–10 MΩ, with a measurement error of less than 5%. The wireless impedance system measures the electrical impedance of the PZT sensor and sends the data to the PC for storage and processing. Firstly, a wide range of frequency scanning is carried out to determine the appropriate frequency scanning interval. The frequency scanning interval selected in this paper is 70–100 kHz, because the formant is in this interval. The formant is more sensitive to the change of liquid viscosity. Therefore, this frequency range is selected to measure the viscosity of the liquid in the damper specimen. Applying a sinusoidal sweep signal to the piezoelectric transducer mounted on the damper structure causes the piezoelectric sensor to vibrate and interrogate the assembly. The propagation and analysis of vibrations allows the impedance characteristics of the damping fluid viscosity to be measured and expressed in terms of the impedance characteristics of the piezoelectric sensor. By comparing the impedance signals of the piezoelectric transducer at different viscosities, the monitoring of the damping fluid viscosity can be realized.
The maximum value of impedance curve is 83.53 kHz (Figure 10). In order to analyze the peak frequency of the impedance real part curve to more visually monitor the change of damping fluid viscosity, the sweep band of the excitation signal is set to 70–100 kHz with a 6 Hz step in the subsequent experiment.

4. Experimental Results

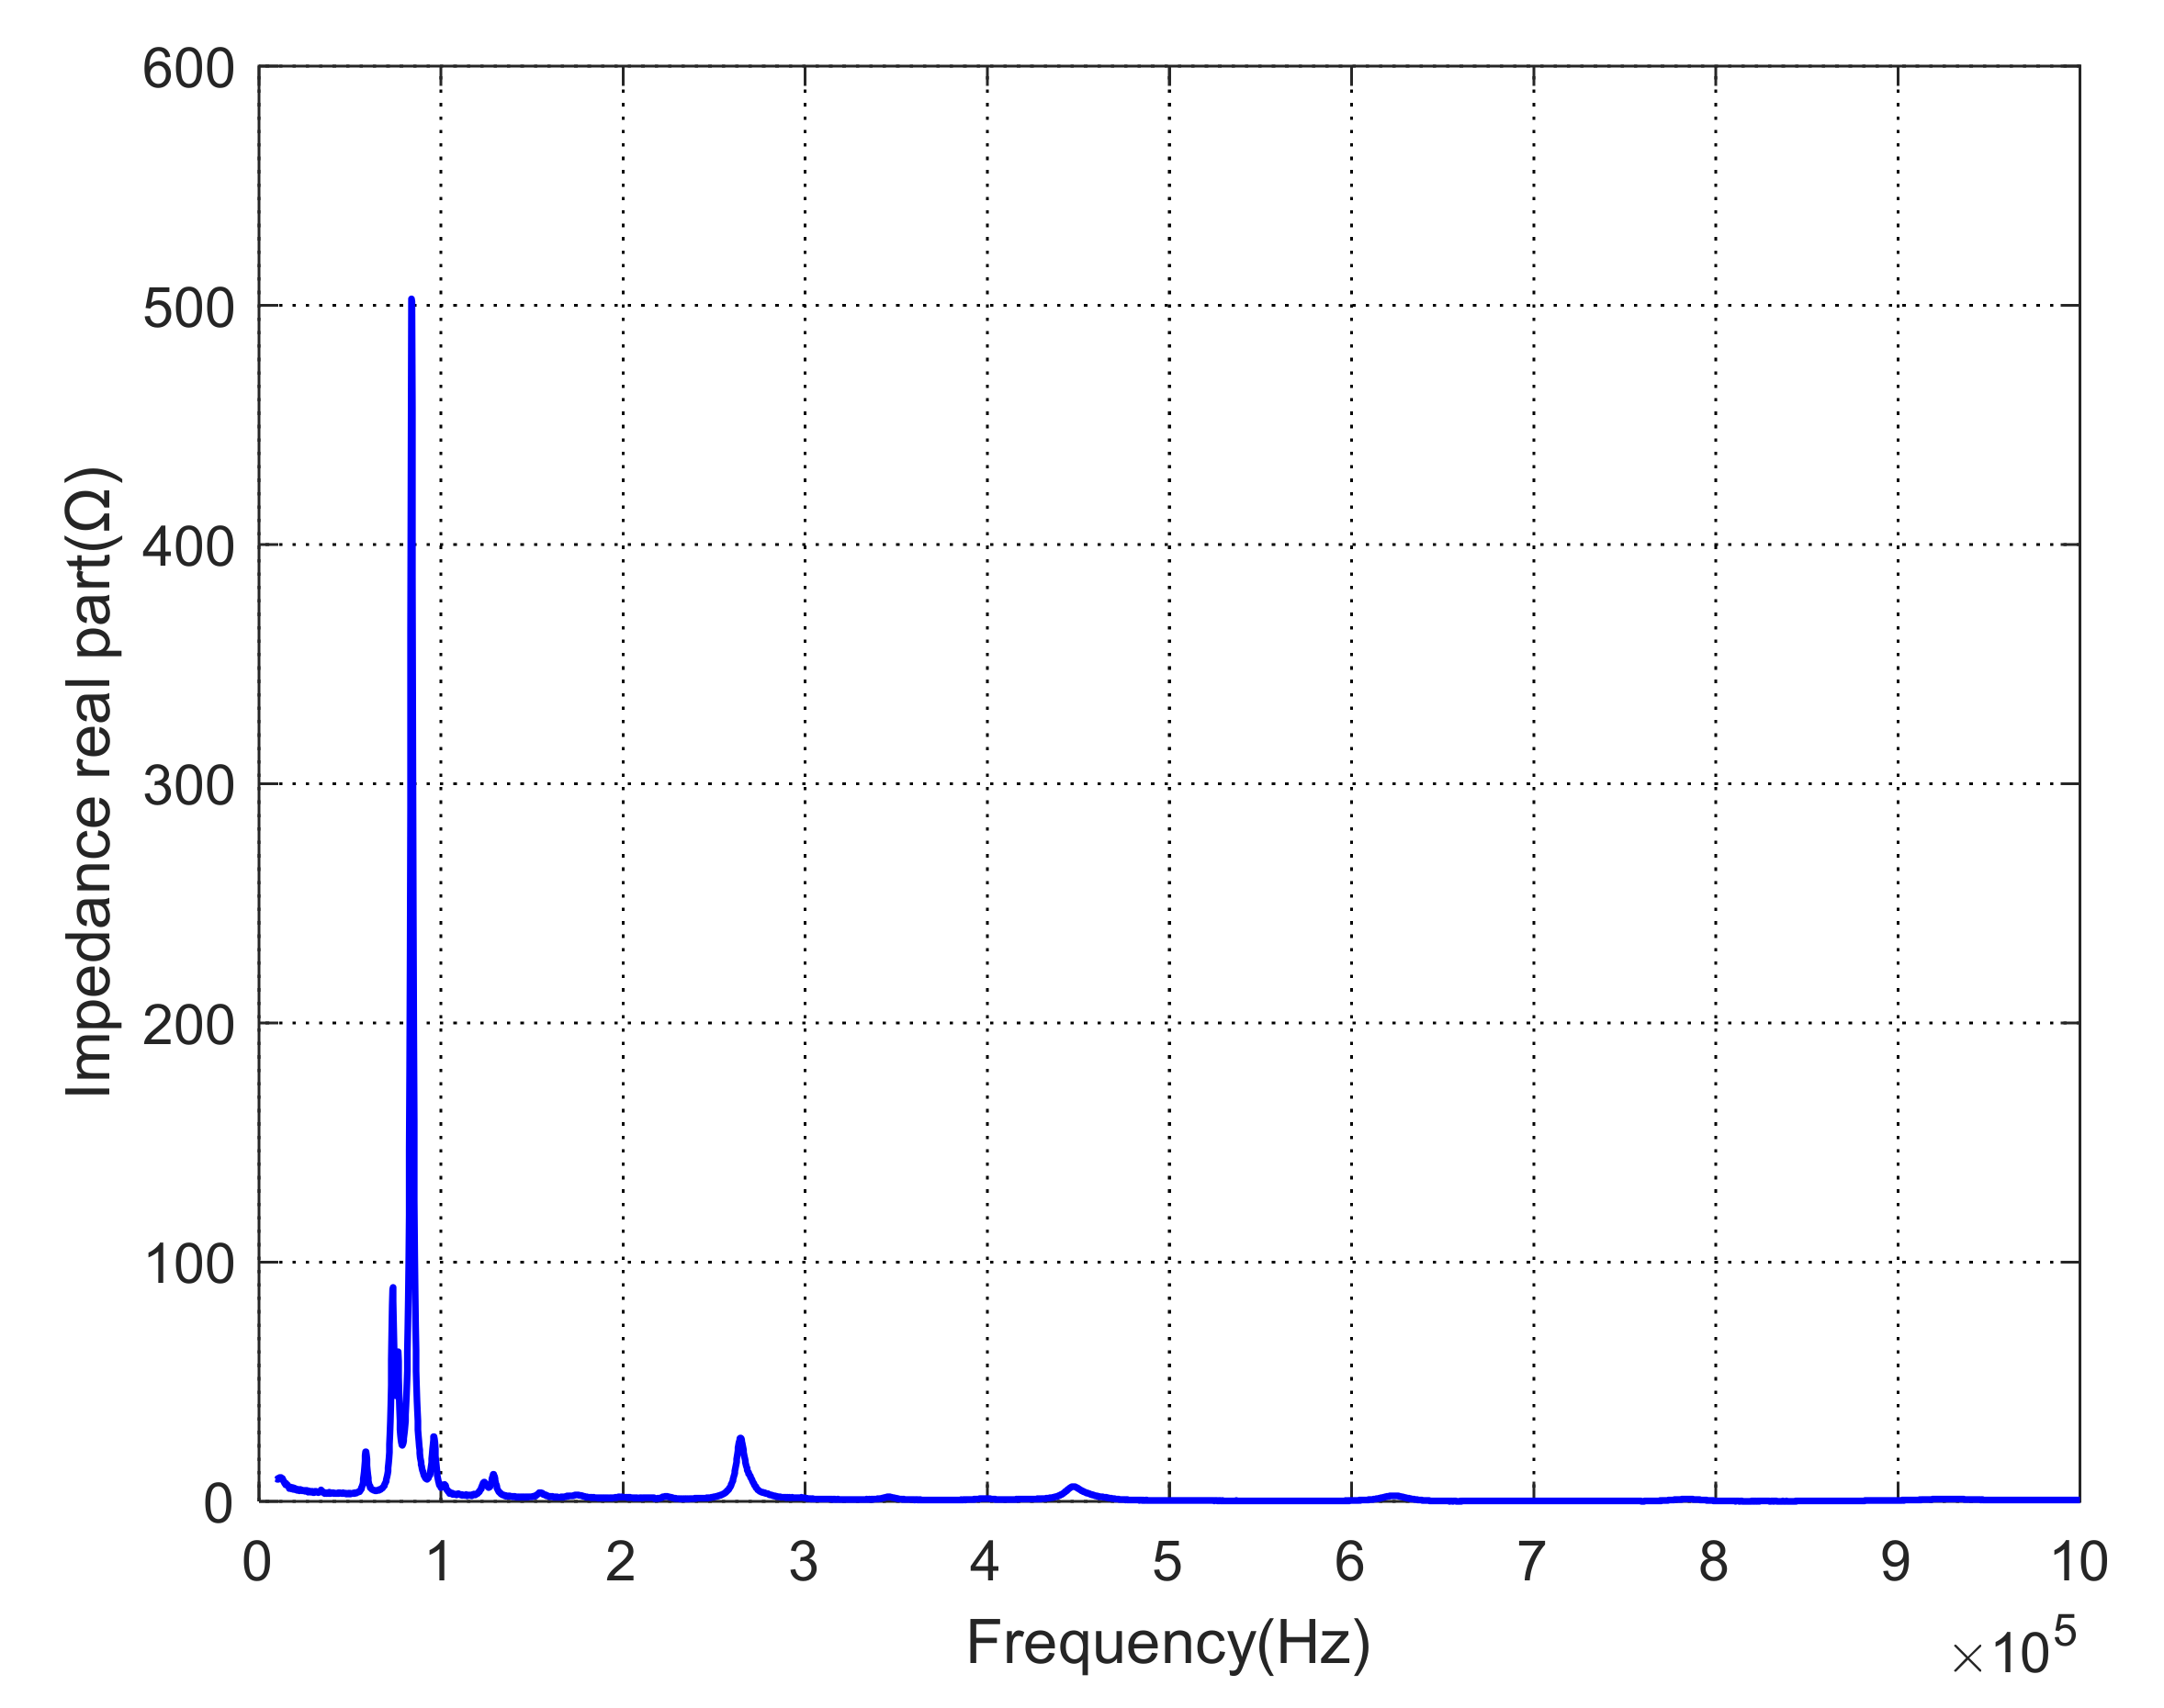
4.1. Results and Analysis

The real part of the impedance is measured for ten different operating viscosities and the results are superimposed as shown in Figure 11.
It can be seen from Figure 11 that the maximum of the impedance real part curve gradually shifts to the left as the viscosity of the damping fluid increases. The real resistance of the impedance signal also increases little by little. Increasing the viscosity of the damping fluid load increases the inductance and resistance of the equivalent circuit and the damping of the system, which decreases the series resonance frequency and increases the real resistance. When the damping fluid viscosity is 5000 cSt, the peak frequency of the impedance curve is 84.058 kHz and the real resistance of the impedance curve is 237.4 Ω. When the damping fluid viscosity is 5,000,000 cSt, the peak frequency of the impedance curve is 83.512 kHz and the real resistance of the impedance curve is 262.5 Ω. Figure 12 shows the relationship between the fluid viscosity and the peak frequency, and Figure 13 shows the relationship between the fluid viscosity and the real resistance.

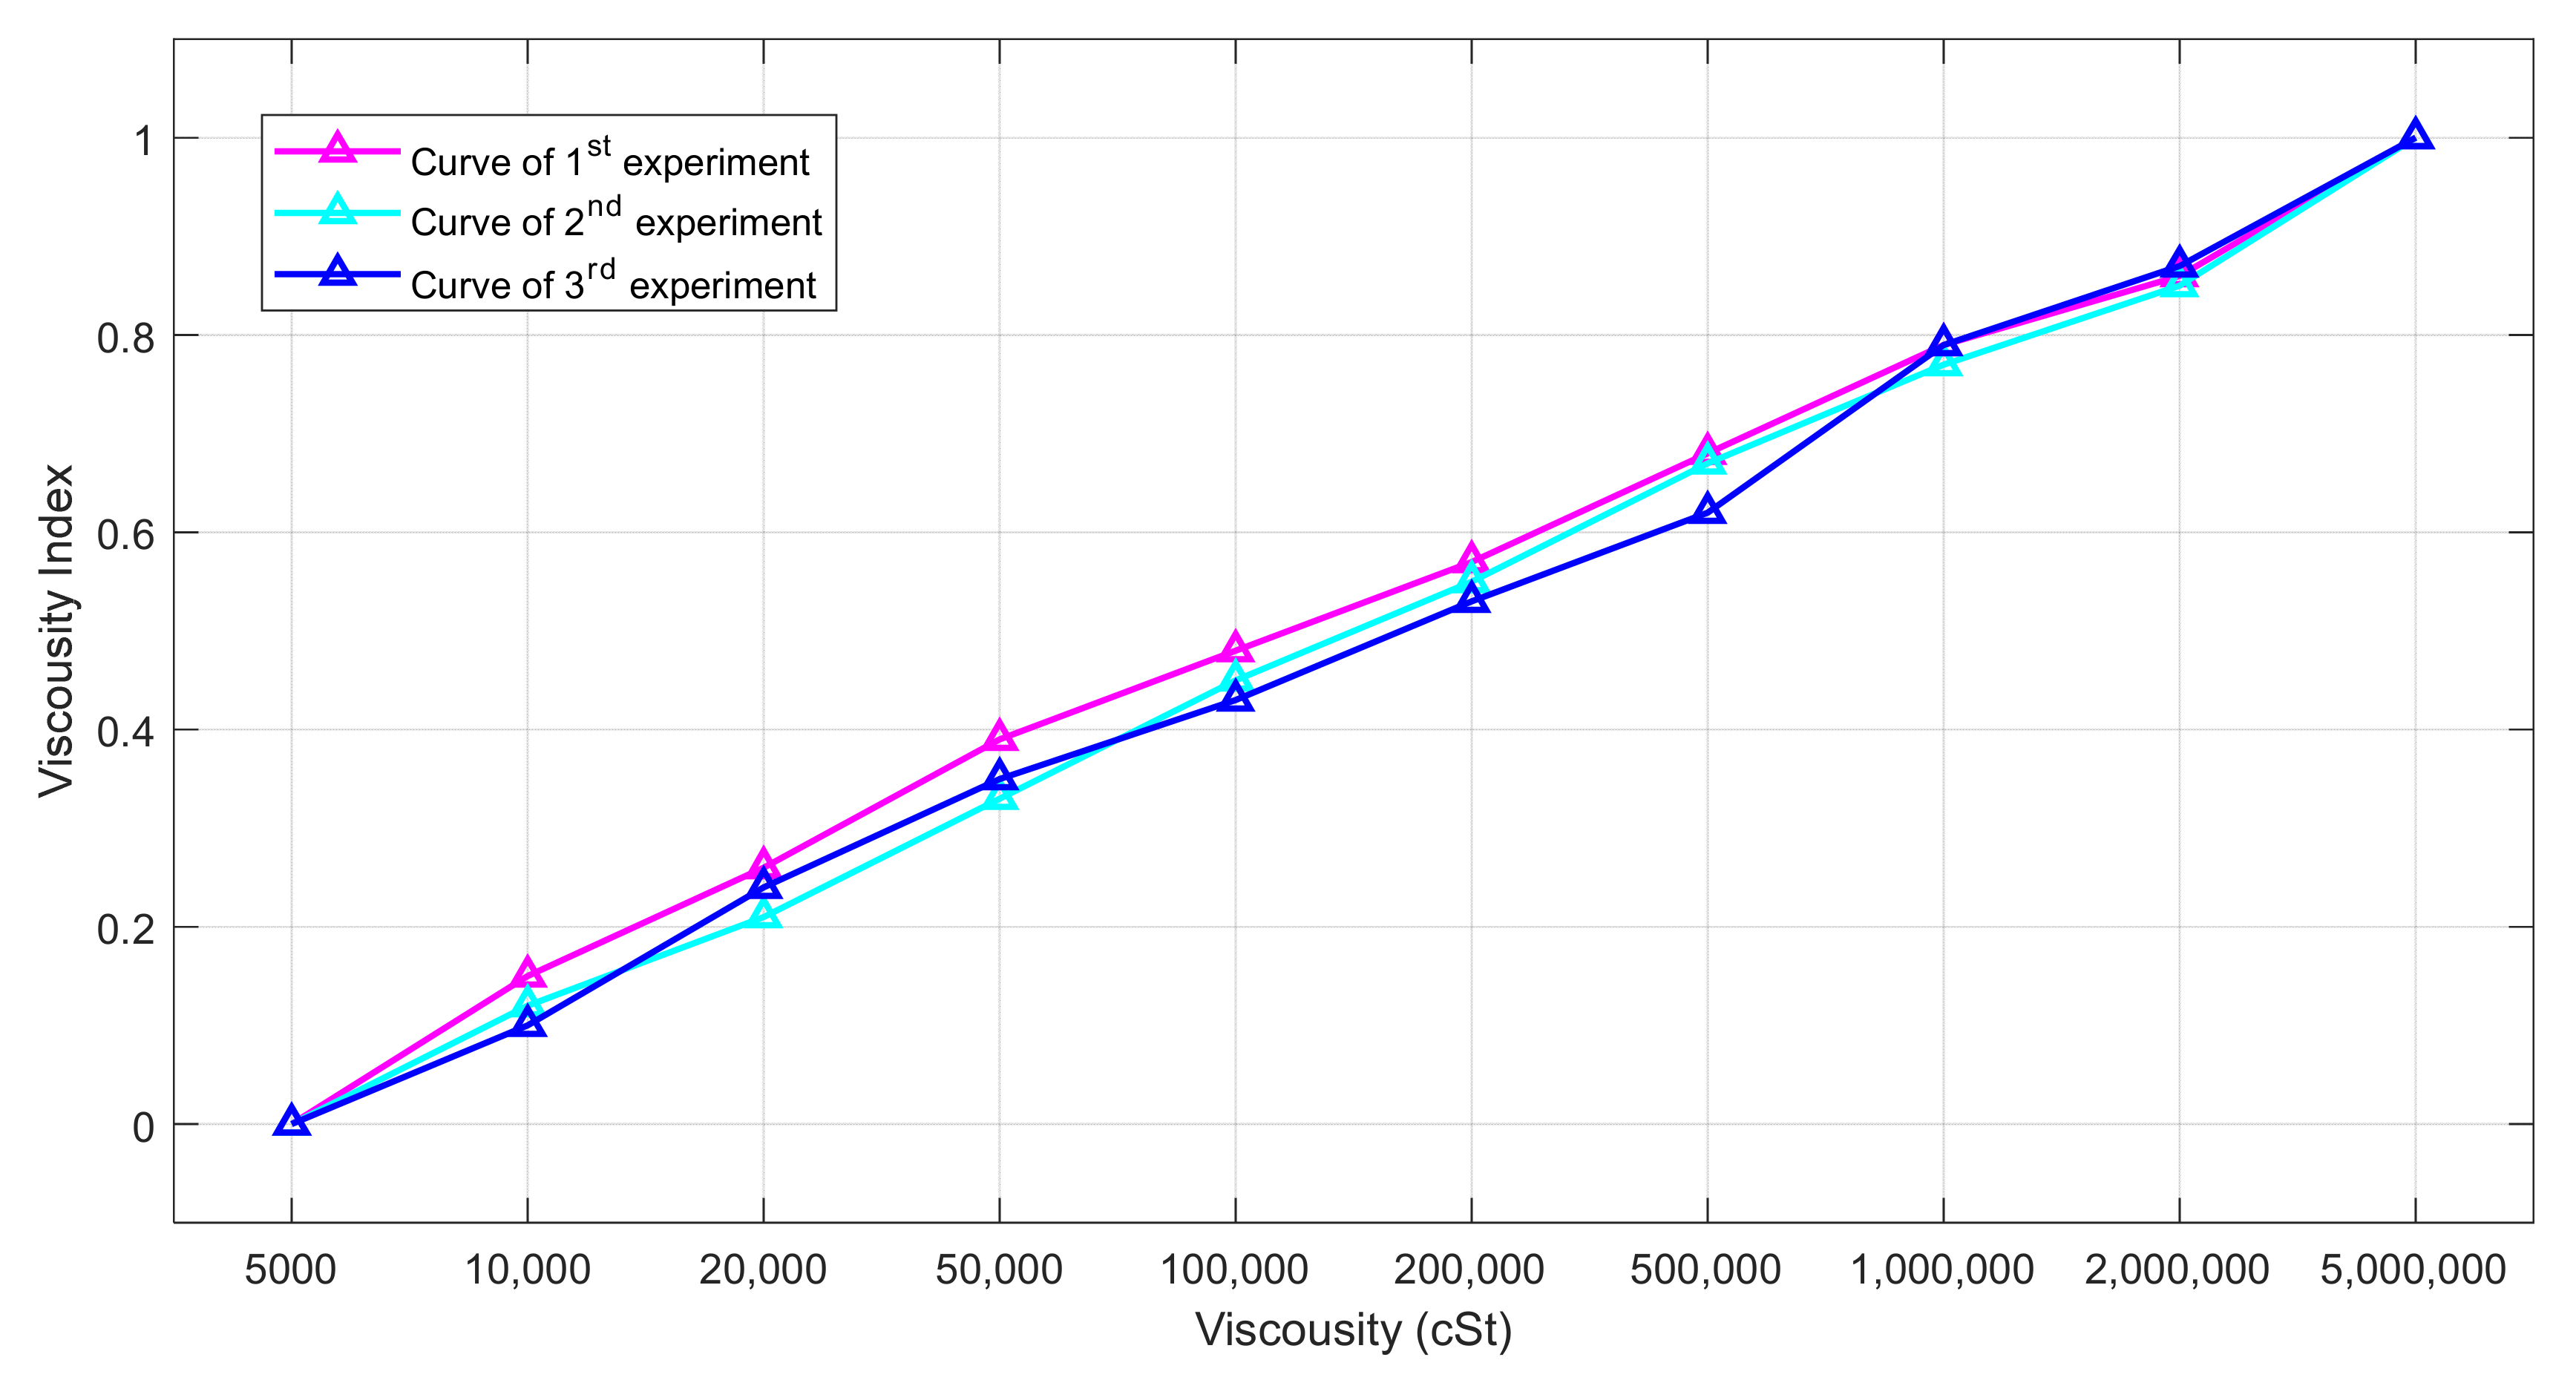
4.2. Viscous Damper Viscosity Index (VI) Based on RMSD

From the above results, it can be seen that the damping fluid viscosity can be monitored qualitatively by the impedance signal. In order to quantitatively represent the relationship between viscosity and the real impedance, this paper proposes a definition of the damping fluid viscosity damper viscosity index (VI) based on the root mean square error (RMSD).
RMSD = i = 1 n ( Z 1 ( ω i ) Z 0 ( ω i ) ) 2 i = 1 n ( Z 0 ( ω i ) ) 2
In Equation (3), n denotes the frequency points in the selected sweep range; i is the i-th frequency point in the sweep range; Z 0 ( ω i ) is the impedance in the initial state of the structure at the i-th frequency point; Z 1 ( ω i ) is the impedance after the lossy viscosity change of the structure at the i-th frequency point. The results of RMSD calculation are listed in Table 2.
VI = RMSD E RMSD L RMSD H RMSD L
In Equation (4), RMSD H is the RMSD at 5,000,000 cSt and RMSD L is the RMSD at 5000 cSt. RMSD E is the RMSD at other measured damping fluid viscosities.
From Figure 14, it can be seen that the viscosity monitoring index is 1 when the viscosity of the damping fluid is 5,000,000 cSt. As the viscosity of the damping fluid decreases, the VI decreases, and reaches 0 when the viscosity of the damping fluid is 5000 cSt. Figure 15 shows the experimental results of three replicate tests. The experimental results show that when the viscosity of the damping fluid changes, the test results of the wireless impedance measurement system are relatively stable. The VI based on the RMSD proposed in this paper can well judge the change of the fluid viscosity. This verifies the reliability and stability of the VI. Thus, the RMSD-based VI can track changes in the damping fluid viscosity.

5. Discussions

The experimental results were obtained in the laboratory at a temperature of 26 °C. In actual monitoring, the viscosity of the damping fluid will be monitored at different temperatures, and there will be temperature fluctuations, which will lead to a decrease in the density of the damping fluid and eventually affect the measurement results. The next work will focus on the influence of temperature on the monitoring of damping fluid. In practical cases, the installation of the sensors and the placement of the wireless impedance measurement system also need to be taken into account.
In addition, the stability and reliability of the developed wireless impedance measurement system and the proposed method will be studied for long time monitoring. One limitation of this study is that the experiments were conducted in the same cylinder for different types of fluids. However, the length and diameter will differ for different dampers in actual engineering. We will further study the relationship between the measured impedance signal and the viscosity for the dampers with different sizes. Another limitation of this study is that the cylinder load was not applied in the experiments. In future work, we will conduct experimental research on the viscosity monitoring of dampers under different cylinder loads.

6. Conclusions

In this paper, a wireless impedance measurement system was used to monitor and quantitatively evaluate the viscosity of damping fluid in a viscous damper. PZT sensors were installed inside the cylinder specimen and the impedance characteristics of these sensors were measured for damping fluids of different viscosities. The test results show that the wireless impedance measurement system can detect changes in the viscosity of the fluid inside the damper. The change of viscosity will cause the impedance signal of PZT sensor to change. The change in the real part of the impedance signal can provide a qualitative measure of viscosity change. Changes in the real part can further be quantified through the proposed VI, which is based on the RMSD of the impedance signal. The VI can eliminate the effects of variation between PZT sensors and help evaluate the viscosity of damper fluids in a more accurate way. This study can serve as a guiding reference for the application of a wireless impedance measurement systems in SHM and liquid viscosity monitoring. The results can help improve and expand the application of wireless impedance measurement systems in practical engineering.

Author Contributions

Methodology, M.L. and S.J.; validation, M.L. and S.J.; formal analysis, M.L. and S.J.; investigation, S.J.; resources, M.L.; data curation, S.J.; writing—original draft preparation, S.J.; writing—review and editing, M.L.; visualization, S.J.; supervision, M.L.; project administration, M.L.; funding acquisition, M.L. All authors have read and agreed to the published version of the manuscript.

Funding

This work was supported by the National Natural Science Foundation of China (No.51978079) and the Hubei Provincial Outstanding Young and middle-aged Science and Technology Innovation Team Project (No. T2020007).

Institutional Review Board Statement

Not applicable.

Informed Consent Statement

Not applicable.

Data Availability Statement

The data presented in this study are available upon request from the corresponding author.

Conflicts of Interest

The authors declare no conflict of interest.

References

  1. Lee, D.; Taylor, D.P. Viscous damper development and future trends. Struct. Des. Tall Build. 2001, 10, 311–320. [Google Scholar] [CrossRef]
  2. Huang, H.C. Efficiency of the motion amplification device with viscous dampers and its application in high-rise buildings. Earthq. Eng. Eng. Vib. 2010, 8, 521–536. [Google Scholar] [CrossRef]
  3. Sonda, D.; Cigada, A.; Ciccaldo, G.; Goppion, A.; Pollini, A.V. Seismic and vibration protection of the statue Pietà Rondanini by Michelangelo. In Proceedings of the Atti del XVII Convegno ANIDIS L’Ingegneria Sismica, Pistoia, Italy, 17–21 September 2017; PISA University Press: Paris, France, 2017; pp. 287–296. [Google Scholar]
  4. Xu, Y.L.; Ko, H. Dynamic response of damper-connected adjacent buildings under earthquake excitation. Eng. Struct. 1999, 21, 135–148. [Google Scholar] [CrossRef]
  5. Giresini, L.; Puppio, M.; Laccone, F.; Froli, M. Experimental and numerical investigation on a passive control system for the mitigation of vibrations on SDOF and MDOF Structures: Mini Tribological ROCKing Seismic Isolation Device (miniTROCKSISD). J. Earthq. Eng. 2021, 1–19. [Google Scholar] [CrossRef]
  6. Madhekar, S.N.; Jangid, R.S. Variable dampers for earthquake protection of benchmark highway bridges. Smart Mater. Struct. 2009, 18, 115011. [Google Scholar] [CrossRef]
  7. Froli, M.; Giresini, L.; Laccone, F. Dynamics of a new seismic isolation device based on tribological smooth rocking (TROCKSISD). Eng. Struct. 2019, 193, 154–169. [Google Scholar] [CrossRef]
  8. Guo, A.; Xu, Y.L.; Wu, B. Seismic reliability analysis of hysteretic structure with viscoelastic dampers. Eng. Struct. 2002, 24, 373–383. [Google Scholar] [CrossRef]
  9. Ceravolo, R.; Pecorelli, M.L.; Fragonara, L.Z. Semi-active control of the rocking motion of monolithic art objects. J. Sound Vib. 2016, 374, 1–16. [Google Scholar] [CrossRef] [Green Version]
  10. Miyamoto, H.K.; Gilani, A.S.J.; Wada, A.; Ariyaratana, C. Limit states and failure mechanisms of viscous dampers and the implications for large earthquakes. Earthq. Eng. Struct. Dyn. 2010, 39, 1279–1297. [Google Scholar] [CrossRef]
  11. Kandemir, E.C.; Mazda, T.; Nurui, H.; Miyamoto, H. Seismic Retrofit of an Existing Steel Arch Bridge Using Viscous Damper. Procedia Eng. 2011, 14, 2301–2306. [Google Scholar] [CrossRef] [Green Version]
  12. De Canio, G. Marble devices for the Base isolation of the two Bronzes of Riace: A proposal for the David of Michelangelo. In Proceedings of the XV World Conference on Earthquake Engineering-WCEE, Lisbon, Portugal, 24–28 September 2012; pp. 24–28. [Google Scholar]
  13. Baggio, S.; Berto, L.; Favaretto, T.; Saetta, A.; Vitaliani, R. Seismic isolation technique of marble sculptures at the Accademia Gallery in Florence: Numerical calibration and simulation modelling. Bull. Earthq. Eng. 2015, 13, 2719–2744. [Google Scholar] [CrossRef]
  14. Radestroem, S.; Uelker-Kaustell, M.; Andersson, A.; Tell, V.; Karoumi, R. Application of fluid viscous dampers to mitigate vibrations of high-speed railway bridges. Int. J. Rail Transp. 2017, 5, 47–62. [Google Scholar] [CrossRef]
  15. Wei, M.; Lin, K.; Liu, H. Experimental investigation on hysteretic behavior of a shear thickening fluid damper. Struct. Control Health Monit. 2019, 26, e2389. [Google Scholar] [CrossRef]
  16. Lavan, O. On the efficiency of viscous dampers in reducing various seismic responses of wall structures. Earthq. Eng. Struct. Dyn. 2012, 41, 1673–1692. [Google Scholar] [CrossRef]
  17. Ikago, K.; Saito, K.; Inoue, N. Seismic control of single-degree-of-freedom structure using tuned viscous mass damper. Earthq. Eng. Struct. Dyn. 2012, 41, 453–474. [Google Scholar] [CrossRef]
  18. Marano, G.C.; Trentadue, F.; Greco, R. Stochastic optimum design criterion for linear damper devices for seismic protection of buildings. Struct. Multidiscip. Optim. 2007, 33, 441–455. [Google Scholar] [CrossRef]
  19. Chen, C.; Chen, G. Shake table tests of a quarter-scale three-storey building model with piezoelectric friction dampers. Struct. Control Health Monit. 2004, 11, 239–257. [Google Scholar] [CrossRef]
  20. Lin, S.; Tian, H. Study on the sandwich piezoelectric ceramic ultrasonic transducer in thickness vibration. Smart Mater. Struct. 2008, 17, 015034. [Google Scholar] [CrossRef]
  21. Ihn, J.-B.; Chang, F.-K. Detection and monitoring of hidden fatigue crack growth using a built-in piezoelectric sensor/actuator network: I. Diagnostics. Smart Mater. Struct. 2004, 13, 609–620. [Google Scholar] [CrossRef]
  22. Bhalla, S.; Soh, C.K. Structural health monitoring by piezo-impedance transducers. II: Applications. J. Aerosp. Eng. 2004, 17, 166–175. [Google Scholar] [CrossRef]
  23. Bhalla, S.; Soh, C.K. Structural Health Monitoring by Piezo-Impedance Transducers. I: Modeling. J. Aerosp. Eng. 2004, 17, 154–165. [Google Scholar] [CrossRef]
  24. Gyuhae, P.; Hoon, S.; Farrar, C.R.; Inman, D.J. Overview of piezoelectric impedance-based health monitoring and path forward. Shock Vib. Dig. 2003, 35, 451–463. [Google Scholar] [CrossRef] [Green Version]
  25. Wang, T.; Song, G.; Wang, Z.; Li, Y. Proof-of-concept study of monitoring bolt connection status using a piezoelectric based active sensing method. Smart Mater. Struct. 2013, 22, 087001. [Google Scholar] [CrossRef]
  26. Gong, P.; Luo, M.; Zhou, L.; Jiang, L.; Chen, X. An image processing method for extraction of the stress wave reflection period. Appl. Sci. 2020, 10, 3486. [Google Scholar] [CrossRef]
  27. Shao, J.; Wang, T.; Yin, H.; Yang, D.; Li, Y. Bolt looseness detection based on piezoelectric impedance frequency shift. Appl. Sci. 2016, 6, 298. [Google Scholar] [CrossRef]
  28. Song, G.; Gu, H.; Mo, Y.L.; Hsu, T.T.C.; Dhonde, H. Concrete structural health monitoring using embedded piezoceramic transducers. Smart Mater. Struct. 2007, 16, 959–968. [Google Scholar] [CrossRef] [Green Version]
  29. Mitra, M.; Gopalakrishnan, S. Guided wave based structural health monitoring: A review. Smart Mater. Struct. 2016, 25, 053001. [Google Scholar] [CrossRef]
  30. Wang, B.; Huo, L.; Chen, D.; Li, W.; Song, G. Impedance-based pre-stress monitoring of rock bolts using a piezoceramic-based smart washer—A feasibility study. Sensors 2017, 17, 250. [Google Scholar] [CrossRef]
  31. Zhao, N.; Huo, L.; Song, G. A nonlinear ultrasonic method for real-time bolt looseness monitoring using PZT transducer–enabled vibro-acoustic modulation. J. Intell. Mater. Syst. Struct. 2019, 31, 364–376. [Google Scholar] [CrossRef]
  32. Luo, Z.; Deng, H.; Li, L.; Luo, M. A simple PZT transducer design for electromechanical impedance (EMI)-based multi-sensing interrogation. J. Civ. Struct. Health Monit. 2021, 11, 235–249. [Google Scholar] [CrossRef]
  33. Zhang, Y.; Liu, Z.; Ding, F.; Zhang, W. Effect of piezoelectric ceramic particles size gradation on piezoelectric properties of 0–3 cement-based piezoelectric composites. Smart Mater. Struct. 2018, 27, 085029. [Google Scholar] [CrossRef]
  34. Lin, S.; Hu, J.; Fu, Z. Electromechanical characteristics of piezoelectric ceramic transformers in radial vibration composed of concentric piezoelectric ceramic disk and ring. Smart Mater. Struct. 2013, 22, 045018. [Google Scholar] [CrossRef]
  35. Annamdas, V.G.M.; Yang, Y. Practical implementation of piezo-impedance sensors in monitoring of excavation support structures. Struct. Control Health Monit. 2012, 19, 231–245. [Google Scholar] [CrossRef]
  36. Wang, F.; Huo, L.; Song, G. A piezoelectric active sensing method for quantitative monitoring of bolt loosening using energy dissipation caused by tangential damping based on the fractal contact theory. Smart Mater. Struct. 2017, 27, 015023. [Google Scholar] [CrossRef]
  37. Chen, D.; Huo, L.; Song, G. EMI based multi-bolt looseness detection using series/parallel multi-sensing technique. Smart Struct. Syst. 2020, 25, 423–432. [Google Scholar]
  38. Huo, L.; Chen, D.; Kong, Q.; Li, H.; Song, G. Smart washer—A piezoceramic-based transducer to monitor looseness of bolted connection. Smart Mater. Struct. 2017, 26, 025033. [Google Scholar] [CrossRef]
  39. Huo, L.; Chen, D.; Liang, Y.; Li, H.; Feng, X.; Song, G. Impedance based bolt pre-load monitoring using piezoceramic smart washer. Smart Mater. Struct. 2017, 26, 057004. [Google Scholar] [CrossRef]
  40. Li, W.; Liu, T.; Gao, S.; Luo, M.; Wang, J.; Wu, J. An electromechanical impedance-instrumented corrosion-measuring probe. J. Intell. Mater. Syst. Struct. 2019, 30, 2135–2146. [Google Scholar] [CrossRef]
  41. Li, W.; Liu, T.; Zou, D.; Wang, J.; Yi, T.-H. PZT based smart corrosion coupon using electromechanical impedance. Mech. Syst. Signal Process. 2019, 129, 455–469. [Google Scholar] [CrossRef]
  42. Li, W.; Liu, T.; Wang, J.; Zou, D.; Gao, S. Finite-element analysis of an electromechanical impedance–based corrosion sensor with experimental verification. J. Aerosp. Eng. 2019, 32, 04019012. [Google Scholar] [CrossRef]
  43. Shi, Y.; Luo, M.; Li, W.; Song, G. Grout compactness monitoring of concrete-filled fiber-reinforced polymer tube using electromechanical impedance. Smart Mater. Struct. 2018, 27, 055008. [Google Scholar] [CrossRef]
  44. Abdulkareem, A.; Erturun, U.; Mossi, K. Non-destructive evaluation device for monitoring fluid viscosity. Sensors 2020, 20, 1657. [Google Scholar] [CrossRef] [PubMed] [Green Version]
  45. Chen, S.; Chen, D.; Fan, S.; Huo, L.; Song, G. Monitoring of viscous damper fluid viscosity using piezoceramic transducers—A feasibility study. Smart Mater. Struct. 2021, 30, 025034. [Google Scholar] [CrossRef]
Figure 1. One dimensional model of electromechanical impedance.
Applsci 12 00189 g001
Figure 2. Wireless impedance measurement system model.
Applsci 12 00189 g002
Figure 3. Block diagram of impedance measurement function.
Applsci 12 00189 g003
Figure 4. NB260 functional block diagram.
Applsci 12 00189 g004
Figure 5. Photos of wireless impedance measurement system.
Applsci 12 00189 g005
Figure 6. Photos of damper cylinder specimen. (a) Schematic diagram (b) physical diagram.
Applsci 12 00189 g006
Figure 7. Photos of ten samples of damping fluids with different viscosities. (a) packages of damping fluid samples. (b) damping fluid samples inside packages.
Applsci 12 00189 g007
Figure 8. PZT transducer.
Applsci 12 00189 g008
Figure 9. Experimental setup.
Applsci 12 00189 g009
Figure 10. 10 kHz–1 MHz conductivity curve.
Applsci 12 00189 g010
Figure 11. Impedance curves for different viscosity damping fluids.
Applsci 12 00189 g011
Figure 12. Impedance frequency peaks at different viscosity damping fluids.
Applsci 12 00189 g012
Figure 13. Impedance real part resistance of damping fluid with different viscosity.
Applsci 12 00189 g013
Figure 14. Viscosity index of different viscosity damping fluids.
Applsci 12 00189 g014
Figure 15. Normalized viscosity monitoring index for three replicated experiments.
Applsci 12 00189 g015
Table 1. Damping fluid samples with ten different viscosities.
Test No.Viocousity (cSt)Test No.Viscousity (cSt)
150006200,000
210,0007500,000
320,00081,000,000
450,00092,000,000
5100,000105,000,000
Table 2. Calculation results of RMSD for different damping fluids.
Viscosity of Damping Fluid (cSt)RMSDViscosity of Damping Fluid (cSt)RMSD
50000.0958200,0000.0412
10,0000.0814500,0000.0307
20,0000.07091,000,0000.0201
50,0000.05842,000,0000.0134
100,0000.04985,000,0000
Publisher’s Note: MDPI stays neutral with regard to jurisdictional claims in published maps and institutional affiliations.

