Article

Risk-Based Selection of Inspection Method for External Post-Tensioning System of Bridges

Department of Civil and Environmental Engineering, Florida International University, 10555 West Flagler Street, EC 3600, Miami, FL 33174, USA
*
Author to whom correspondence should be addressed.
Appl. Sci. 2022, 12(14), 7103; https://doi.org/10.3390/app12147103
Submission received: 29 May 2022 / Revised: 26 June 2022 / Accepted: 10 July 2022 / Published: 14 July 2022

Abstract

:
The increasing complexity associated with the maintenance of bridges with post-tensioning tendons, along with growing public awareness to ensure higher levels of safety in bridges, has put additional pressure on the designers and the owners to find innovative solutions to ensure safe as well as economically viable solutions. Risk-based inspection and maintenance helps in finding such solutions and, thus, it is gaining more importance in the field of infrastructure management. Within the framework of current risk-based inspection methodologies, it is normally assumed that the method by which the inspection is performed is known beforehand. However, the selection of the inspection method by itself should be given importance and viewed as the first key step for any inspection. The lack of quantitative data in the initiation step makes this selection uncertain and the decision making rather subjective. Despite recent release of comprehensive reports and other publications on condition assessment of bridges with post-tensioning systems, a quantitative approach and a decision-making framework for the selection of the inspection method and associated protocol are still missing, and the inspection strategy and methods are determined purely by the experience of the inspector or the owner. In this paper, a simple and structured risk-based selection methodology is presented that can bridge the existing knowledge gap. The proposed methodology uses a statistical approach to quantify the likelihood of the inspection error utilizing a variety of applicable NDE (Non-destructive Evaluation) methods. To give the methodology both accuracy and practicality, the specifications for the national bridge inventory (SNBI) condition rating was incorporated in this methodology and the accuracy of the inspection methods are measured against determining the correct SNBI condition. Application and effectiveness of the proposed methodology are demonstrated using a case study inspection conducted earlier by the authors. The results, in this case, converged to the selection of one of the NDE methods, which consequently was accepted by the bridge stakeholders.

1. Introduction

Risk is a measure of the probability of occurrence and the severity of the adverse effects of an undesirable event [1]. Bridges, specifically bridges using post-tensioning (PT), cannot be designed and operated under ‘no-risk’ assumptions [2]. It is recognized that a certain level of risk should be acceptable. Acceptable risk levels are defined recognizing the fact that not every failure will lead to severe consequences, and similarly, incidents of very serious consequence may occur with a very low likelihood [3]. Assessment, management, and communicating risk constitute the process of risk analysis [4]. Within the framework of current risk-based inspection methodologies, it is normally assumed that the method by which the inspection is performed is known beforehand. However, the selection of the inspection method by itself should be given importance and viewed as the first step of any inspection. Risk-based selection of an inspection method should be included in the framework for risk analysis and decision-making, which is used in developing inspection and maintenance programs. Risk-based selection of inspection method can be used to identify the methods by which the inspections will provide the most benefit in reducing the overall risk. The complexity of a post-tensioning system and tendons in relation to installation, maintenance, and operation has been increasing steadily. This, combined with the growing usage of post-tensioned structures owing to the efficiency of structural cables and tendons, has motivated the designers and operators to find innovative solutions to ensure a safe as well as an economically viable operation.
Risk-based selection of the inspection method can help in finding such solutions. Accuracy of the inspection method generally plays an important role in ensuring safety as well as providing the necessary information for secondary structural analysis and bridge condition rating. Employing techniques with a low accuracy may incur a lower initial cost but may produce higher maintenance and failure rates in time and vice versa. The trade-off between the accuracy of the inspection (maintenance cost) and the risk resulting from the associated lower safety level is achieved through the principle of ‘as low as reasonably practicable (ALARP)’. Risk is considered to be ALARP once the cost of further risk reduction can be shown to be grossly disproportionate to the benefits accrued [5]. In the last two decades, a wealth of literature has become available that addresses this subject extensively. Different methodologies were developed and applied within different industries. These methodologies use a wide range of qualitative, semi-quantitative, and quantitative approaches [6]. In the meantime, the determination of an absolute risk is a complex, time-consuming, and expensive process, in addition to the high inherent uncertainties associated with the result. On one hand, this renders the determination of an absolute risk an impractical feat, and on the other hand, the implementation of the concept of risk-based decision-making is inevitable, especially for infrastructure-related projects. A wide range of methodologies is already in use in different industries such as infrastructure management, oil, and gas, as well as environmental protection.
Despite extensive investigations on the condition assessment of external post-tensioning systems in structures [7,8,9], a lack of informed decision-making framework for the selection of the inspection method can be recognized as a critical knowledge gap. This paper aims at developing and customizing a risk-based methodology for the selection of the inspection method (RBSIM) that is applicable to the external post-tensioning system and tendons.
To address the knowledge gap, nondestructive evaluation (NDE) methods, corresponding accuracy for the detection of the section loss, the current condition of the post-tensioning system, and the accuracy of current condition are considered to measure the likelihood of “error in detection of section loss”. To help the situation, statistical logic is employed to convert the qualitative approach to a quantitative approach. Aggregation of the likelihood for several attributes associated with each method-condition is performed using the joint probability density function [10]. Figure 1 shows the general procedure of the proposed risk-based selection of inspection method (RBSIM).
The approach proposed is applied to an actual post-tensioning system of a bridge which was under investigation by the authors for potential damages to steel elements from corrosion and section loss. Data and information for the case study that is based on the proposed procedure is presented in the paper. The results, in this case, converged to the selection of one of the two-stage NDE methods. This method had the minimum risk within the available NDE methods.

2. Literature Review

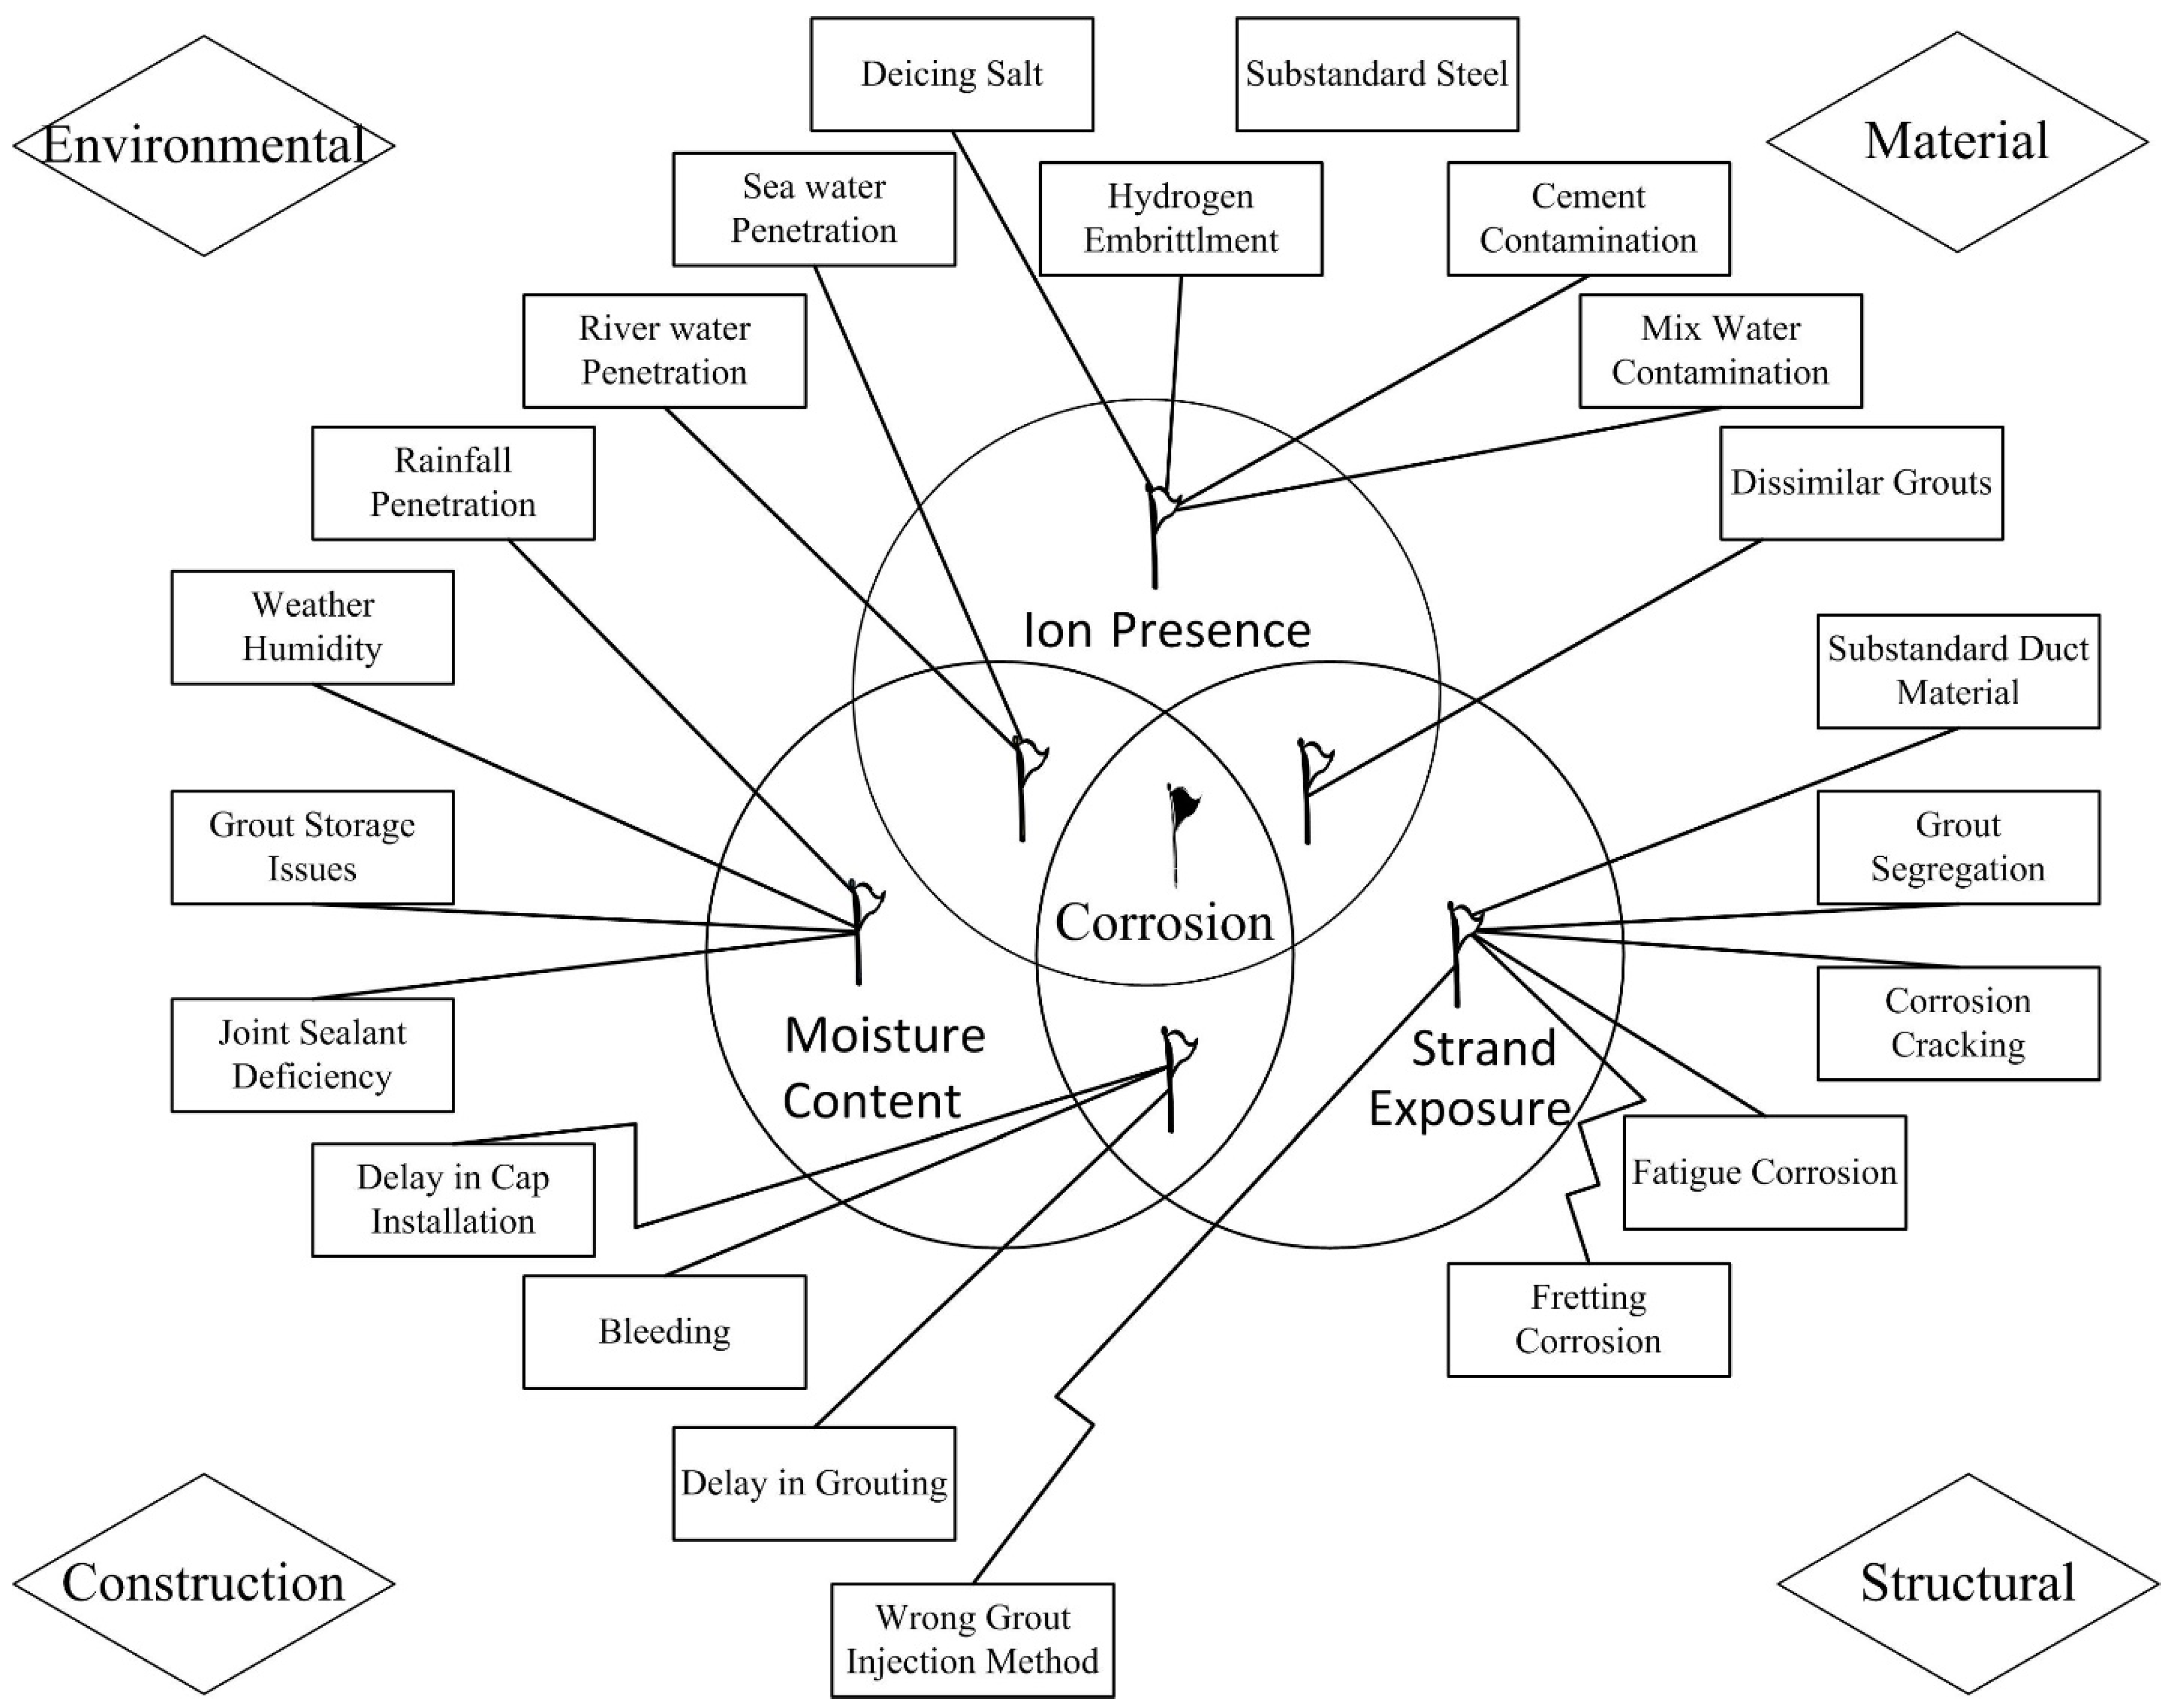
2.1. Deterioration of Post-Tensioning Elements

Typically, post-tensioning (PT) tendons are comprised of high-strength steel strands encased in a duct (cover pipe) and grouted to fill the internal space of the duct for corrosion protection purposes. For long-span bridge constructions, post-tensioning can be a cost-effective and time-saving solution [11]. Post-tensioning is commonly used in the building of new bridges, as well as the restoration and strengthening of existing bridges [12]. Post-tensioning systems are categorized as internal or external depending on where the tendons are located. An internal tendon is described as one that is placed inside the concrete, whilst an external tendon is defined as one that is placed outside the concrete. In general, segmental PT bridges may have either or both of these tendon systems. External post-tensioning systems are less complicated to monitor, repair, and maintain than internal post-tensioning systems because the tendons are not encased in hardened concrete [13]. External tendons, on the other hand, might be more sensitive to corrosion than internal tendons, even when exposed to identical conditions, due to the lack of protection from the concrete cover and the potential existence of undesirable air-voids [14]. Although post-tensioning systems offer several benefits for designers and builders, they have also highlighted concerns about their corrosion [15]. Unlike traditional reinforced concrete systems, where corrosion distress is visible as staining, cracking, or spalling of the concrete cover, corroding post-tensioning systems seldom exhibit similar surface distress signs [16]. Because the tendons are embedded in ducts away from the structure’s exterior surface or inside the ducts, these distress indications are often not visible [17]. Accordingly, structural performance of the post-tensioning systems is more sensitive to corrosion than conventionally reinforced systems. Furthermore, tendon replacement can be very costly [18].
Post-tensioning systems are complicated, and environmental, construction, material, and structural factors can be involved in their deterioration. The literature suggest that the presence of ions (corrosive ions), moisture content, and strand exposure are the three main causes of corrosion, all of which are needed to initiate and sustain the corrosion [19]. Ions that result in partial or complete loss of the passive layer of steel lead to active corrosion. Chloride and carbonation-induced ions are those most often mentioned in the literature [20]. Figure 2 shows the classification of factors that can be involved in the corrosion of post-tensioning elements and the relationship with the essential corrosion causes.
The first class of factors is environmental, as indicated by Figure 2. In some climate conditions, deicing is inevitable for the operation of highways during the winter; however, side effects influence the long-term use of road and bridge elements. Salt consumption for deicing purposes is extremely high. For instance, the salt consumption in Denmark, which has only 43,000 km2 roads, is approximately 300,000 tons per year [21]. Salt supplies chloride as a corrosive ion, which is one of the corrosion causes, and increases the deterioration rate of a post-tensioning system [22]. While seawater and river water supply both ion and moisture content, rainfall and weather humidity will replenish moisture content. Another important factor is proper storage of materials before application. For example, grout mix may be delivered in bags but should be stored in a weatherproof building. Storage in the open may be allowed, providing that the materials are on a raised, dry platform with adequate weatherproof covering. Neglecting these critical practices will result in grout storage issues [23].
The second category shown in Figure 2 is the material-related factors. Hydrogen embrittlement could be the result of inappropriate steel production or improper cathodic protection. Due to the cold-drawing process, strands conforming to the ASTM A 416 are relatively resistant to hydrogen embrittlement; however, negligence in production or protection allows embrittlement to occur [24]. Cement and mix water contamination will make ion present in the grouted zone by additional chemicals [25]. Using dissimilar grouts during the construction or repair of the post-tensioning elements makes ions available and facilitates strand exposure [26]. The last factors under material are substandard duct material and grout segregation, which weaken the grouted area and cause strand exposure [23]. Substandard steel, which can be a significant issue for steel strands during the construction or rehabilitation process, is a potential manufacturing issue in the case of weak quality control in steel manufacturing plants. Although substandard steel does not relate to corrosion principles directly, it plays an important but indirect role and speeds up the corrosion of post-tensioning system. The lack of array for substandard steel in Figure 2 describes the indirect relation to corrosion principles. Substandard steel cannot be detected by well-known nondestructive inspection methods [23].
Corrosion cracking, fatigue corrosion, and fretting corrosion are three different corrosion-related factors that have been classified under the structural category. All factors under the structural category facilitate strand exposure and speed up the possible corrosion. The production of cracks in a corrosive environment is known as (stress) corrosion cracking. It can cause typically ductile metal alloys subjected to tensile stress to fail unexpectedly and suddenly, especially at high temperatures [27]. Fatigue corrosion is the mechanical degradation of a material under the joint action of corrosion and cyclic loading. All structures, specifically post-tensioned concrete structures, experience some form of alternating stress and are exposed to toxic environments during their service life [28]. Fretting corrosion refers to corrosion damage at the asperities of contact surfaces. This damage is induced under load and in the presence of repeated relative surface motion, as generated, for example, by vibration [29].
The fourth class of factors that Figure 2 summarizes is construction. This category includes joint sealant barrier, delays in cap installation, bleeding, delays in grouting, and wrong grout injection method. While joint sealant barrier facilitates access of moisture content to post-tensioning elements, delays in cap installation, bleeding, and delays in grouting relate to two corrosion principles: moisture content and strand exposure. However, the wrong grout injection method provides strand exposure [19]. Different combinations of factors in the construction category will make the grout out of specifications which are named deficient grout [30,31].
Deficient grout with voids plays an inevitable role in the corrosion of post-tensioning elements. In two ways, voids in ducts can compromise the strength of the tendon system. For starters, voids can cause tendon weakness due to a lack of stress redistribution inside the beam. Second, and most crucially, when strands are perched in cementitious material and exposed to air conditions through voids, corrosion can develop. Strands in grouted PT concrete bridges will invariably be exposed to both environments because of the grouting materials and installation procedures [32]. Other factors can impact the corrosion rate, in addition to the varied exposure circumstances between strands perched in grout and those exposed to the void environment. The major defense for PT tendons is grout. Even yet, voids in grouted ducts are prevalent, especially when the workmanship and grouting material are of low quality. Voids are more prone to appear in some places, such as at the highest points of parabolic ducts, where the curves are steeper [33]. During the grouting process, cavitation of the grout might result in future grout sinking. Large pockets of air can become trapped in the grout as a result of this. During grouting, a number of things might happen that lead the grouting team to assume the ducts are full of grout. After the grout has been applied, air trapped between strands rises to the surface. The rate at which this air escapes is determined by the qualities of the grout and the trap’s shape. Because air passage from the trap to the grout is time-dependent, air pockets in the ducts are common even when a “steady stream” of grout runs from the vent. Furthermore, if tendons in the higher ducts of vertically aligned ducts are post-tensioned before those in the lower ducts, the strands may break through the lower duct wall, allowing grout to flow into the lower duct. Corrosive conditions in the voids, such as rainfall, seawater, salt fog, de-icing/anti-icing salts, or a mix of these, can cause strand corrosion, particularly localized corrosion. Corrosion reduces tension capacity, which can have a negative impact on the structural capacity and dependability of PT bridges [34].

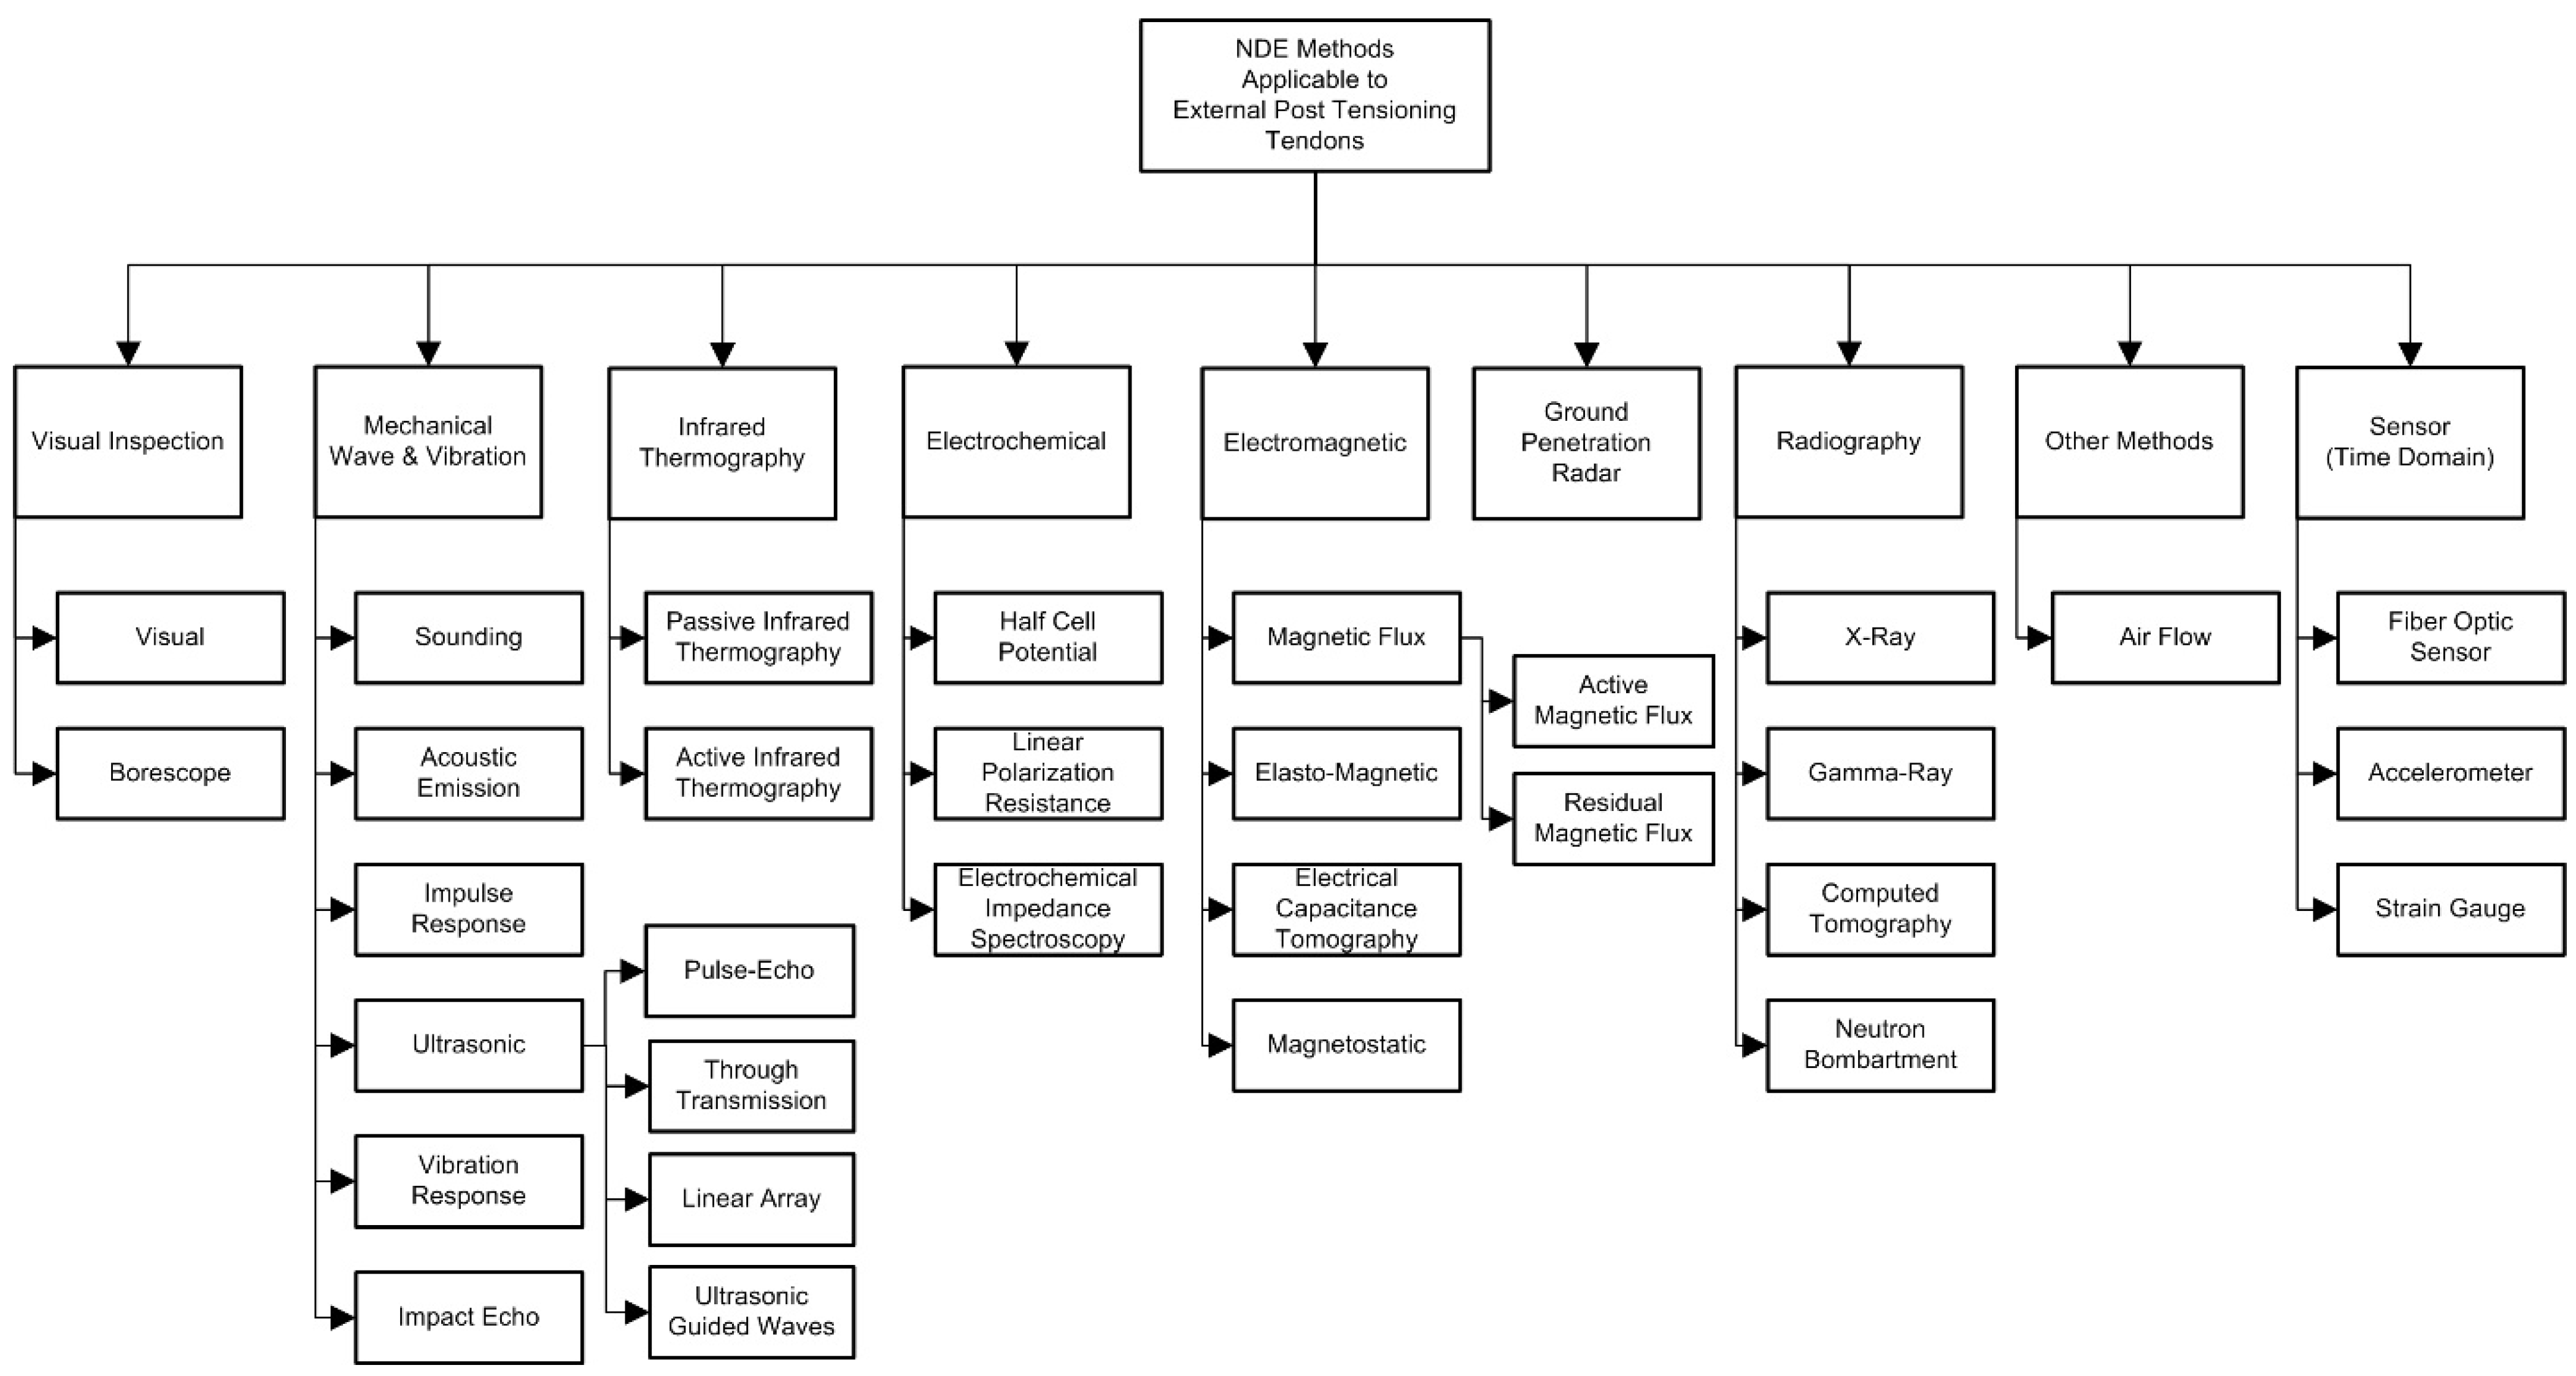
2.2. Defining and Classifying Applicable Inspection Methods

NDE methods potentially applicable to external tendons can be classified into nine categories based on the technology and physical attributes used in the design of the corresponding NDT (Non-destructive Test) tools. These are visual, mechanical waves and vibration, infrared thermography, electrochemical, electromagnetic, ground penetration radar, radiography, other unclassified methods, and sensors [9,16]. Figure 3 shows the NDE methods applicable to external post-tensioning tendons.

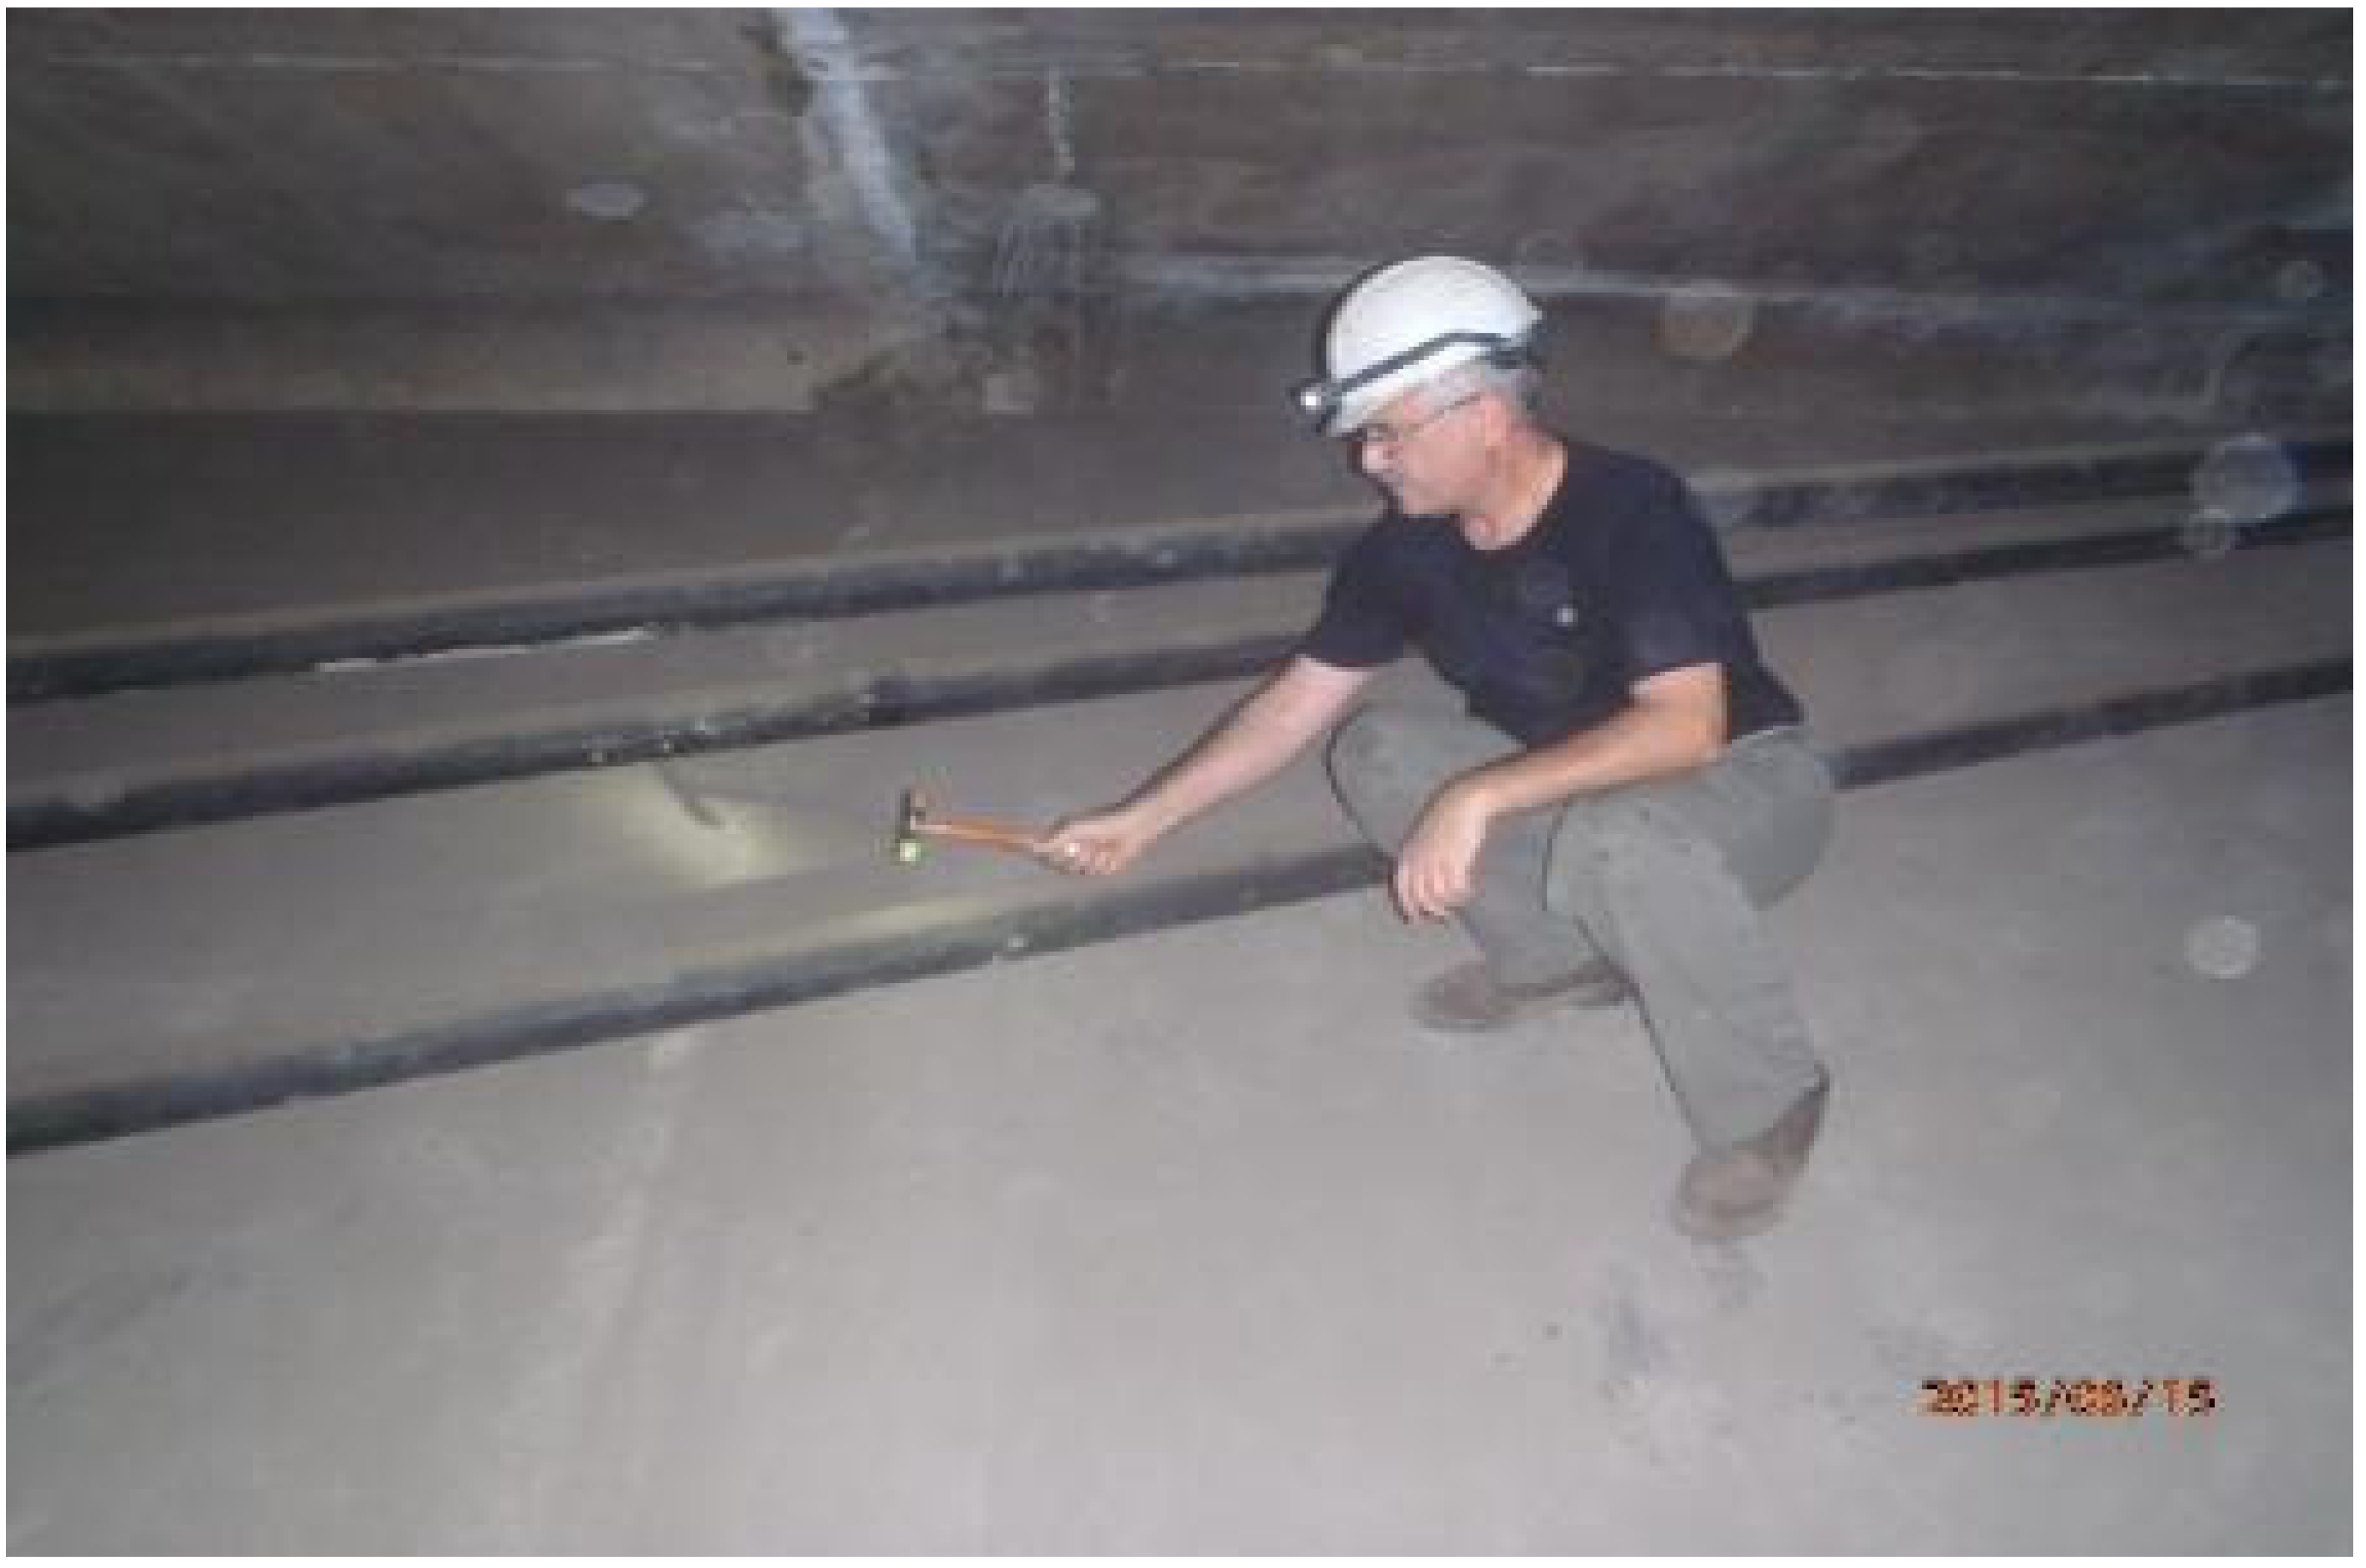
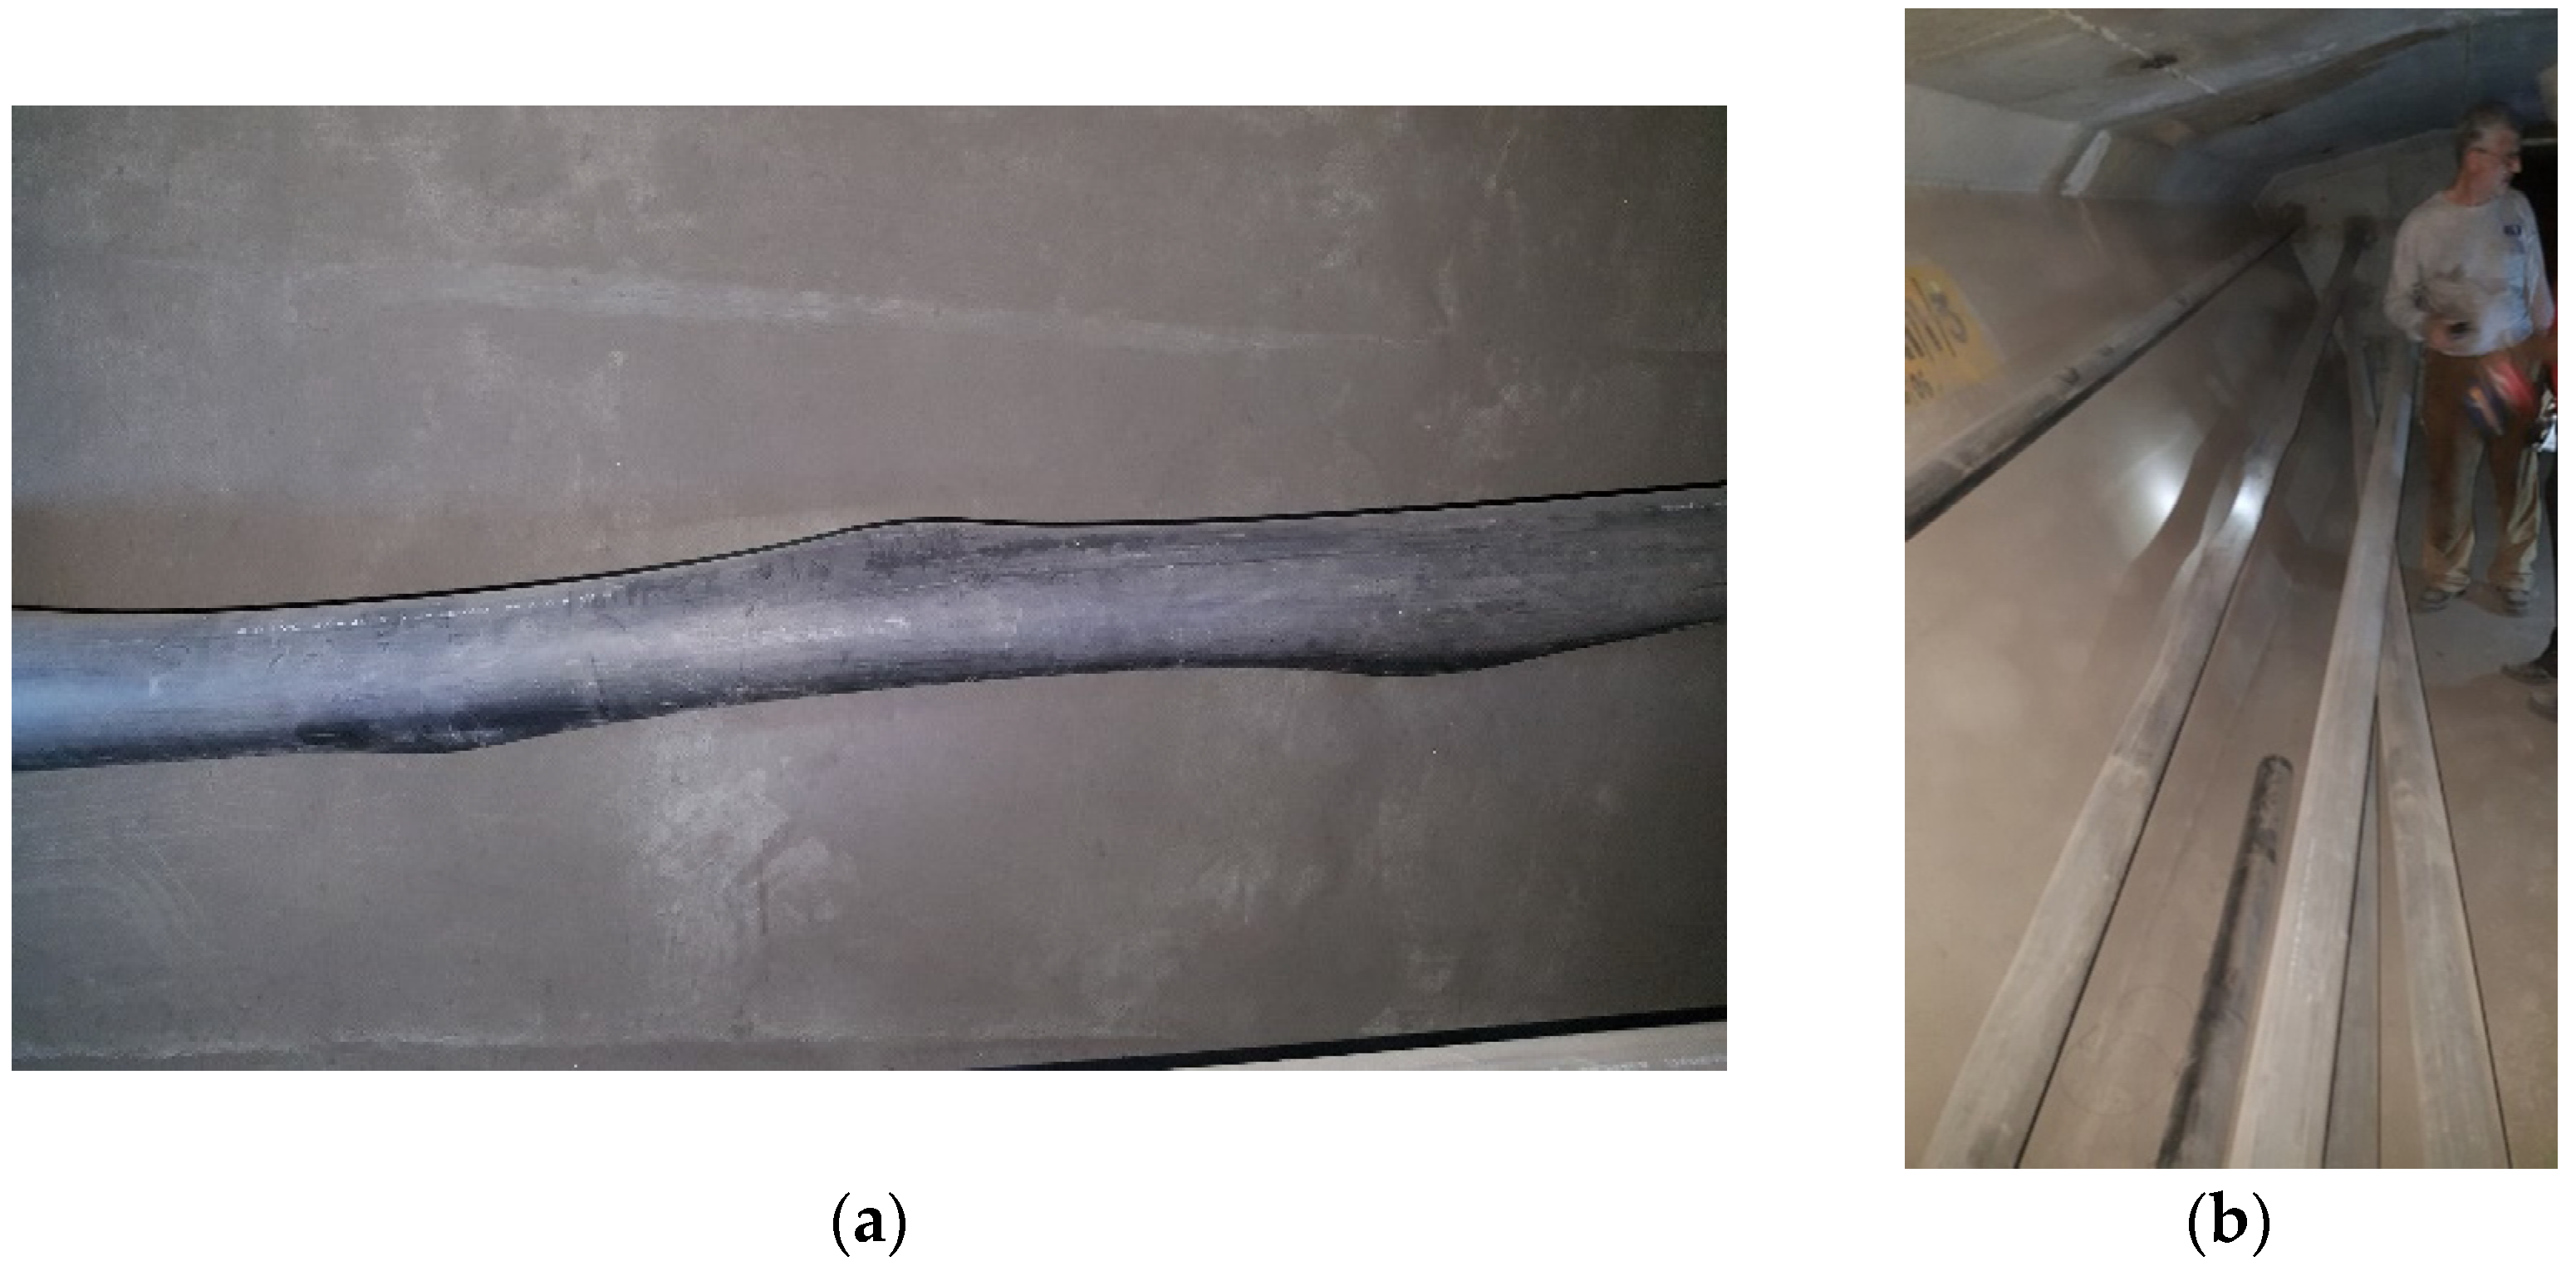
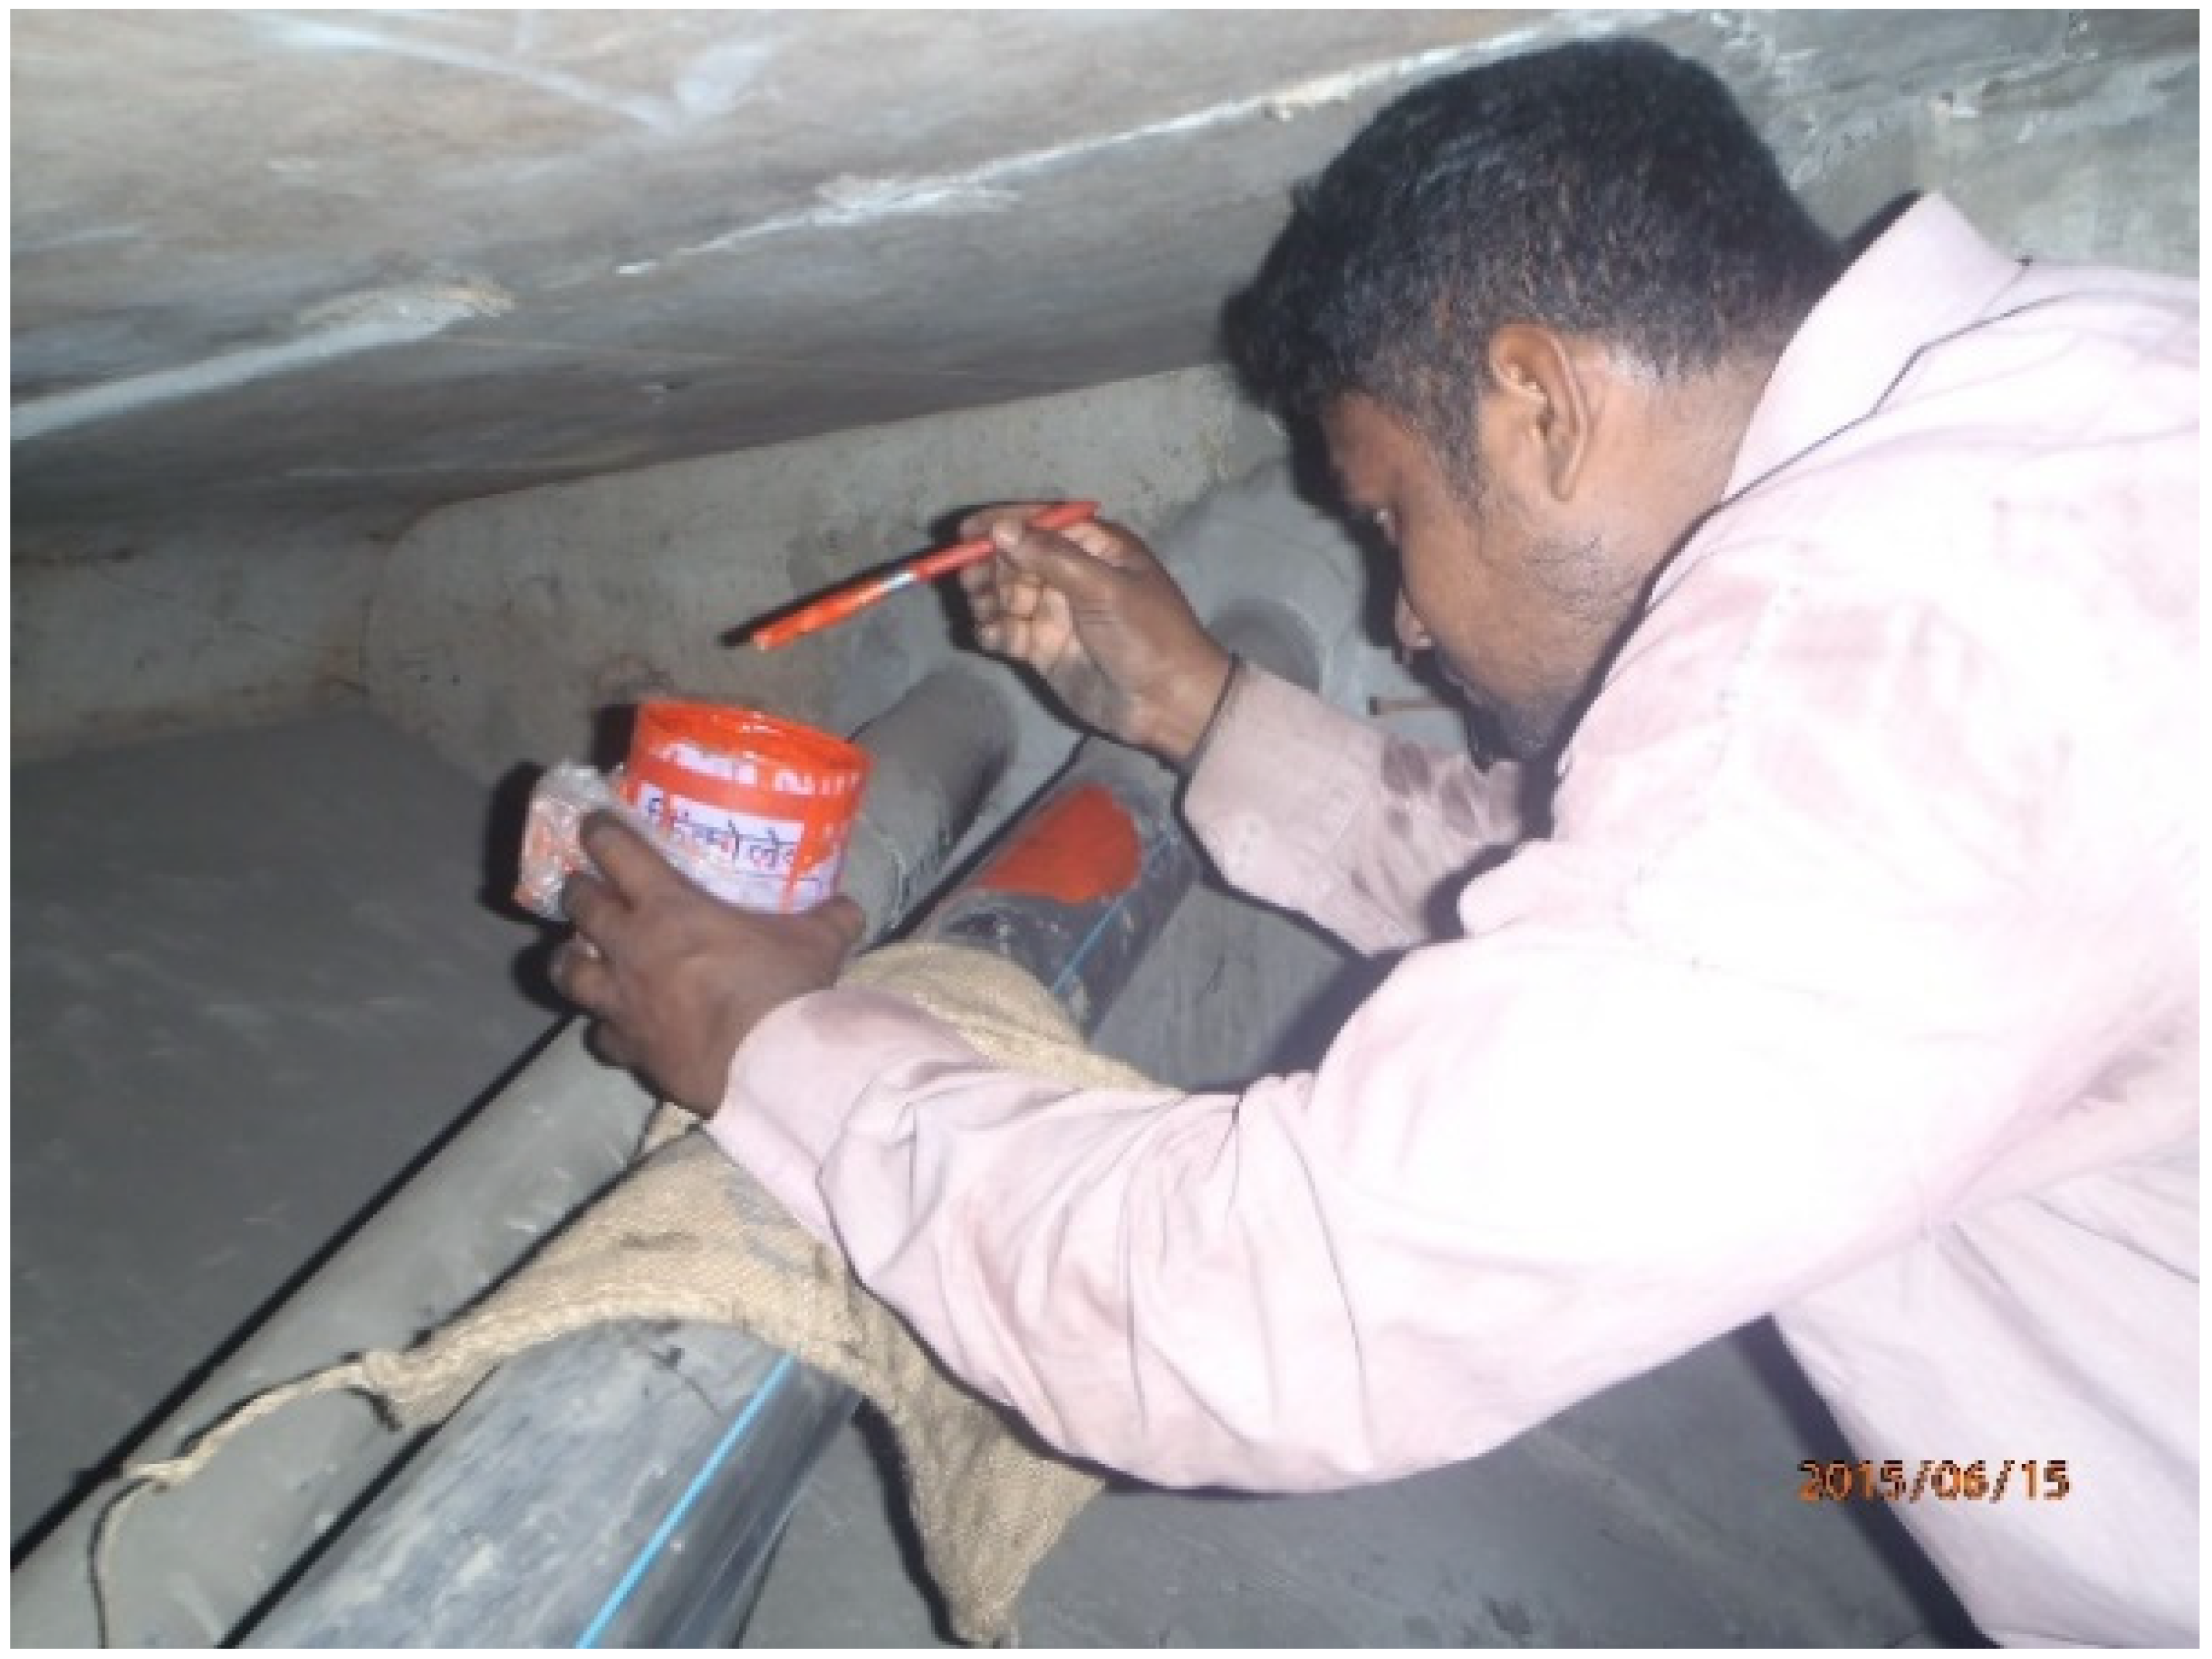
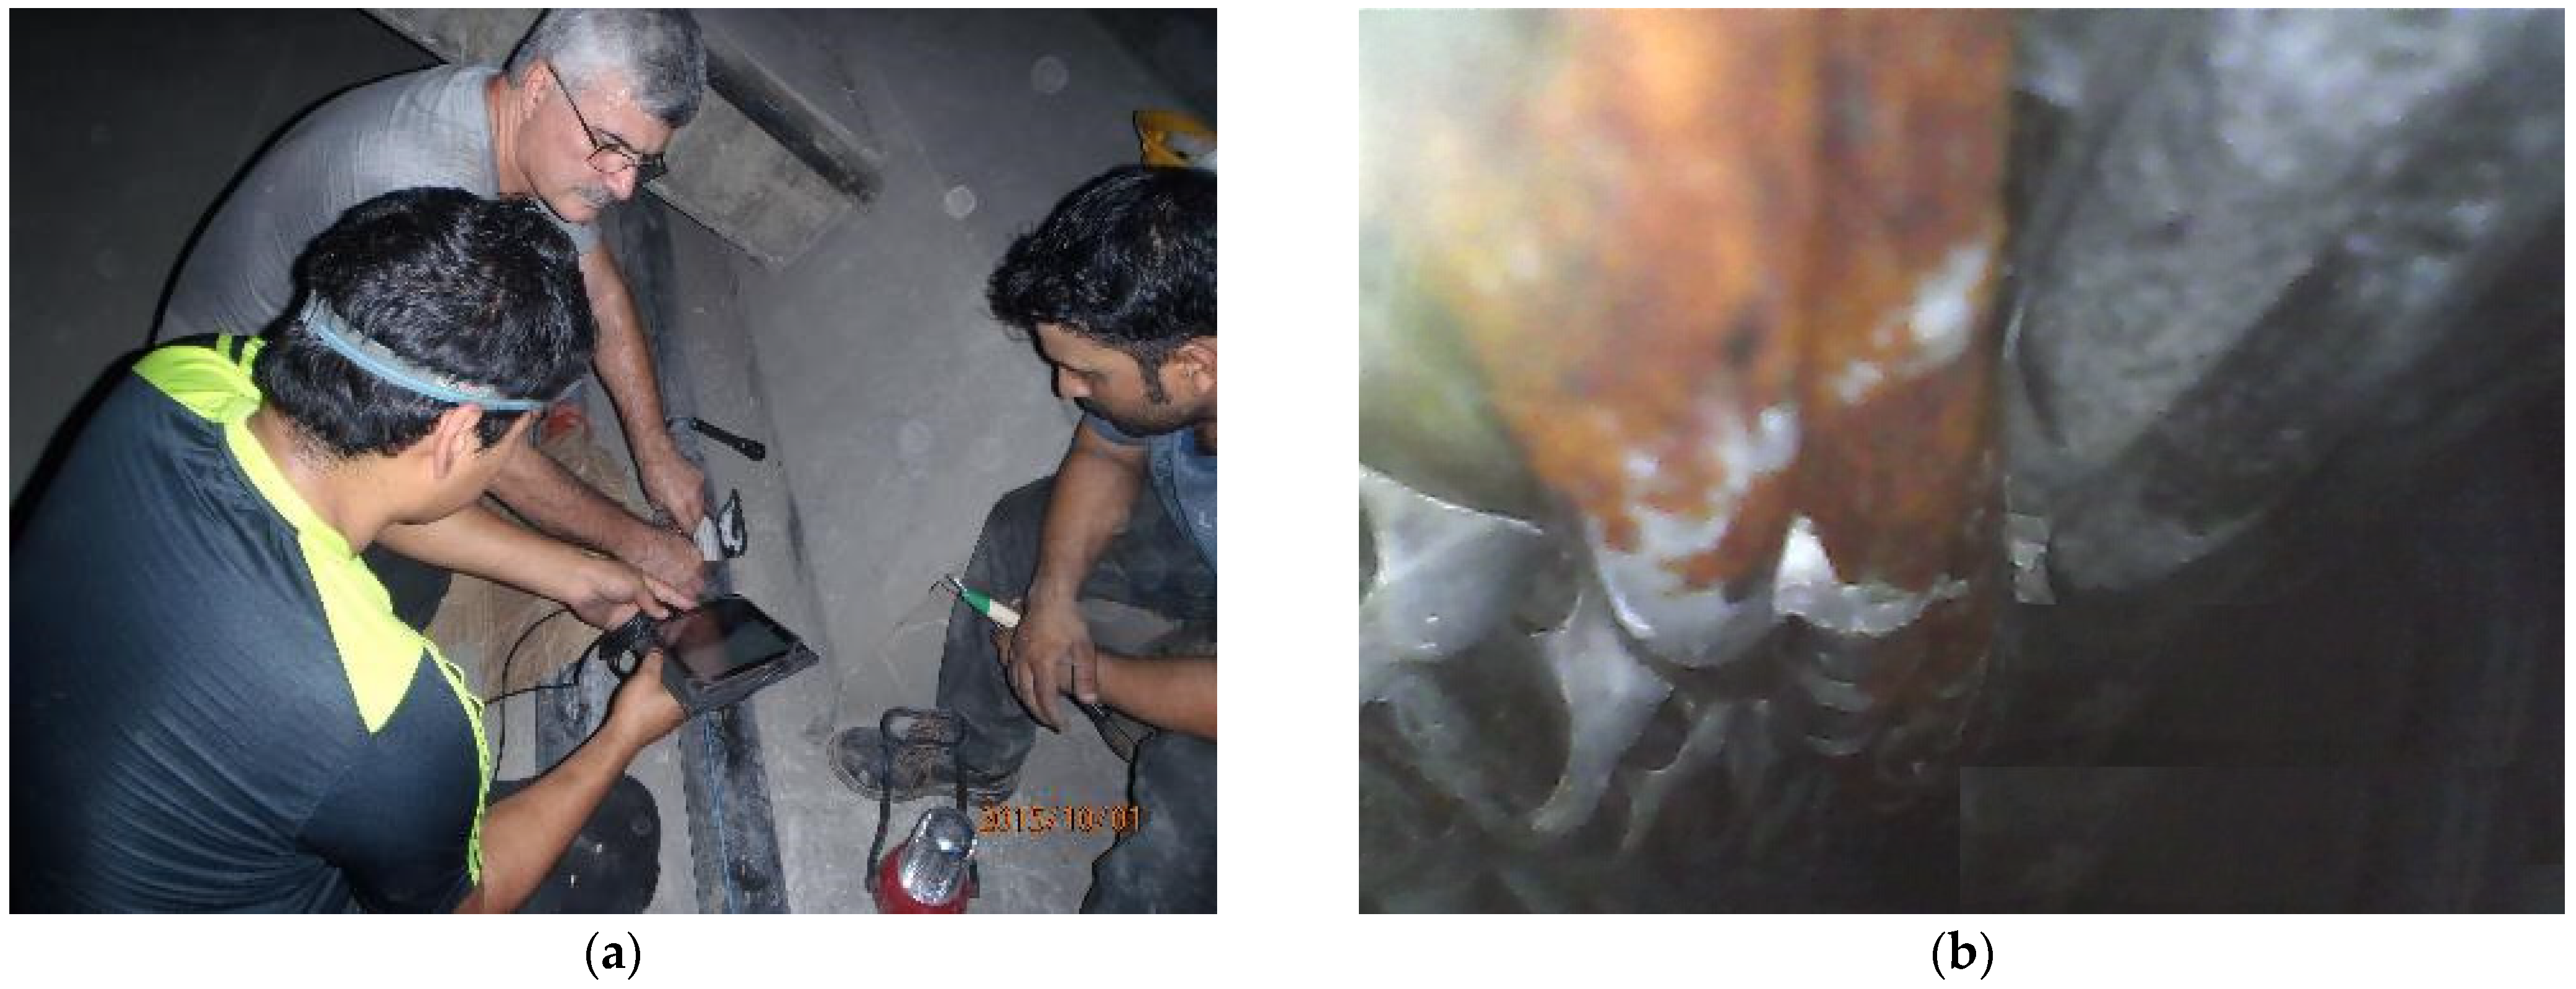
2.2.1. Visual Inspection

Visual inspection is the most popular method for the nondestructive evaluation of PT tendons and is widely used as a way of evaluating external PT tendons. Inspectors are taught to make meticulous records of the physical changes that occur as a structure ages [35]. Signs of structural deterioration are usually tracked over time to determine the risk of structural failure [36,37,38,39]. Visual inspection of external tendons is limited to nondestructive inspection of HDPE ducts for cracking and deviator block assemblies and invasive inspection of the anchorage zones, which involves removing the end caps and inspecting the exposed strand ends, sockets, and locking plates for water, corrosion activity, or voids [40]. A borescope is a common visual inspection instrument that is used to look for voids and corrosion activity in anchoring zones or drilled holes in external conduits. Using a borescope to check voids requires access holes, but it may provide a clear and concise view of hidden places within ducts. Borescopes can also be equipped with small video cameras on their ends to record footage of the inspection [41].

2.2.2. Mechanical Waves and Vibration Methods

Inspection methods based on mechanical waves and vibration have the affiliate mechanical source and taking advantage of the disturbance and the fact that the wave propagation velocity varies in different perimeters [42]. Sounding, acoustic emission, impulse response, impact echo, vibration response, and ultrasonic are NDE methods that can be classified under mechanical waves and vibration methods.
Sounding inspections are carried out on PT bridges on a regular basis by tapping an impactor (Figure 4). Although sounding inspections need professional inspection experts, they are simple to do in the field and are a quick way to find voids in ducts. The sounding inspection method has trouble detecting microscopic voids, but it could detect relatively moderate and big voids. Voids indicate the possibility of corrosion. As a result, the sounding method can be an efficient tool for locating voids in the field [43]. Acoustic emission is based on recording (in situ) damaging events from a structure emanating mechanical waves through the medium (called acoustic emissions). Data acquisition systems record events picked up by sensors connected or installed in the structure when damage happens, whether it’s concrete cracking or strands/wire anchored in tendons. The acoustic emission method is a passive NDE methodology which allows a structure to be tested continuously rather than at regular intervals while it is in use [44]. The impulse response approach includes creating flexural vibrations in a structural component by delivering a low-frequency impact and using load cells and attached transducers to measure both the force of impact and the structural reaction (accelerometers, geophones, etc.). In contrast, vibration response is a technique in which a dead-blow hammer is used to strike an external tendon. Accelerometers at fixed places record the vibrational patterns. The tension forces in the tendon then would be estimated, modeling the response as a dynamic system [45]. The impact echo method generates stress pulses on post-tensioning elements by impacting it mechanically. The impact echo approach is particularly promising for discovering defects in post-tensioned concrete structures since the impact generates a high energy pulse and can penetrate the structure [46].
Pulse-Echo, through-transmission, linear array, and ultrasonic guided waves have been classified under ultrasonics methods. Pulse echo uses a single device to send and receive sound waves to detect cracks, voids, and other defects [47]; however, through-transmission uses a pair of ultrasonic probes instead of a single sensor. One probe sends the sound waves, and another probe receives the waves on an opposite surface [47]. The linear array method uses several sensors in the shape of a matrix to monitor the condition of the structure [16]. Guided Wave Ultrasonics is a nondestructive testing technology that uses sound waves to detect corrosion or other damage along pipe walls. A ring of transducers is placed around a pipe to conduct this procedure. These transducers produce sound waves that flow in both directions down the tendon. If they come into touch with rust or damage, they will reflect back to the transducers, which will immediately capture the data [48,49].

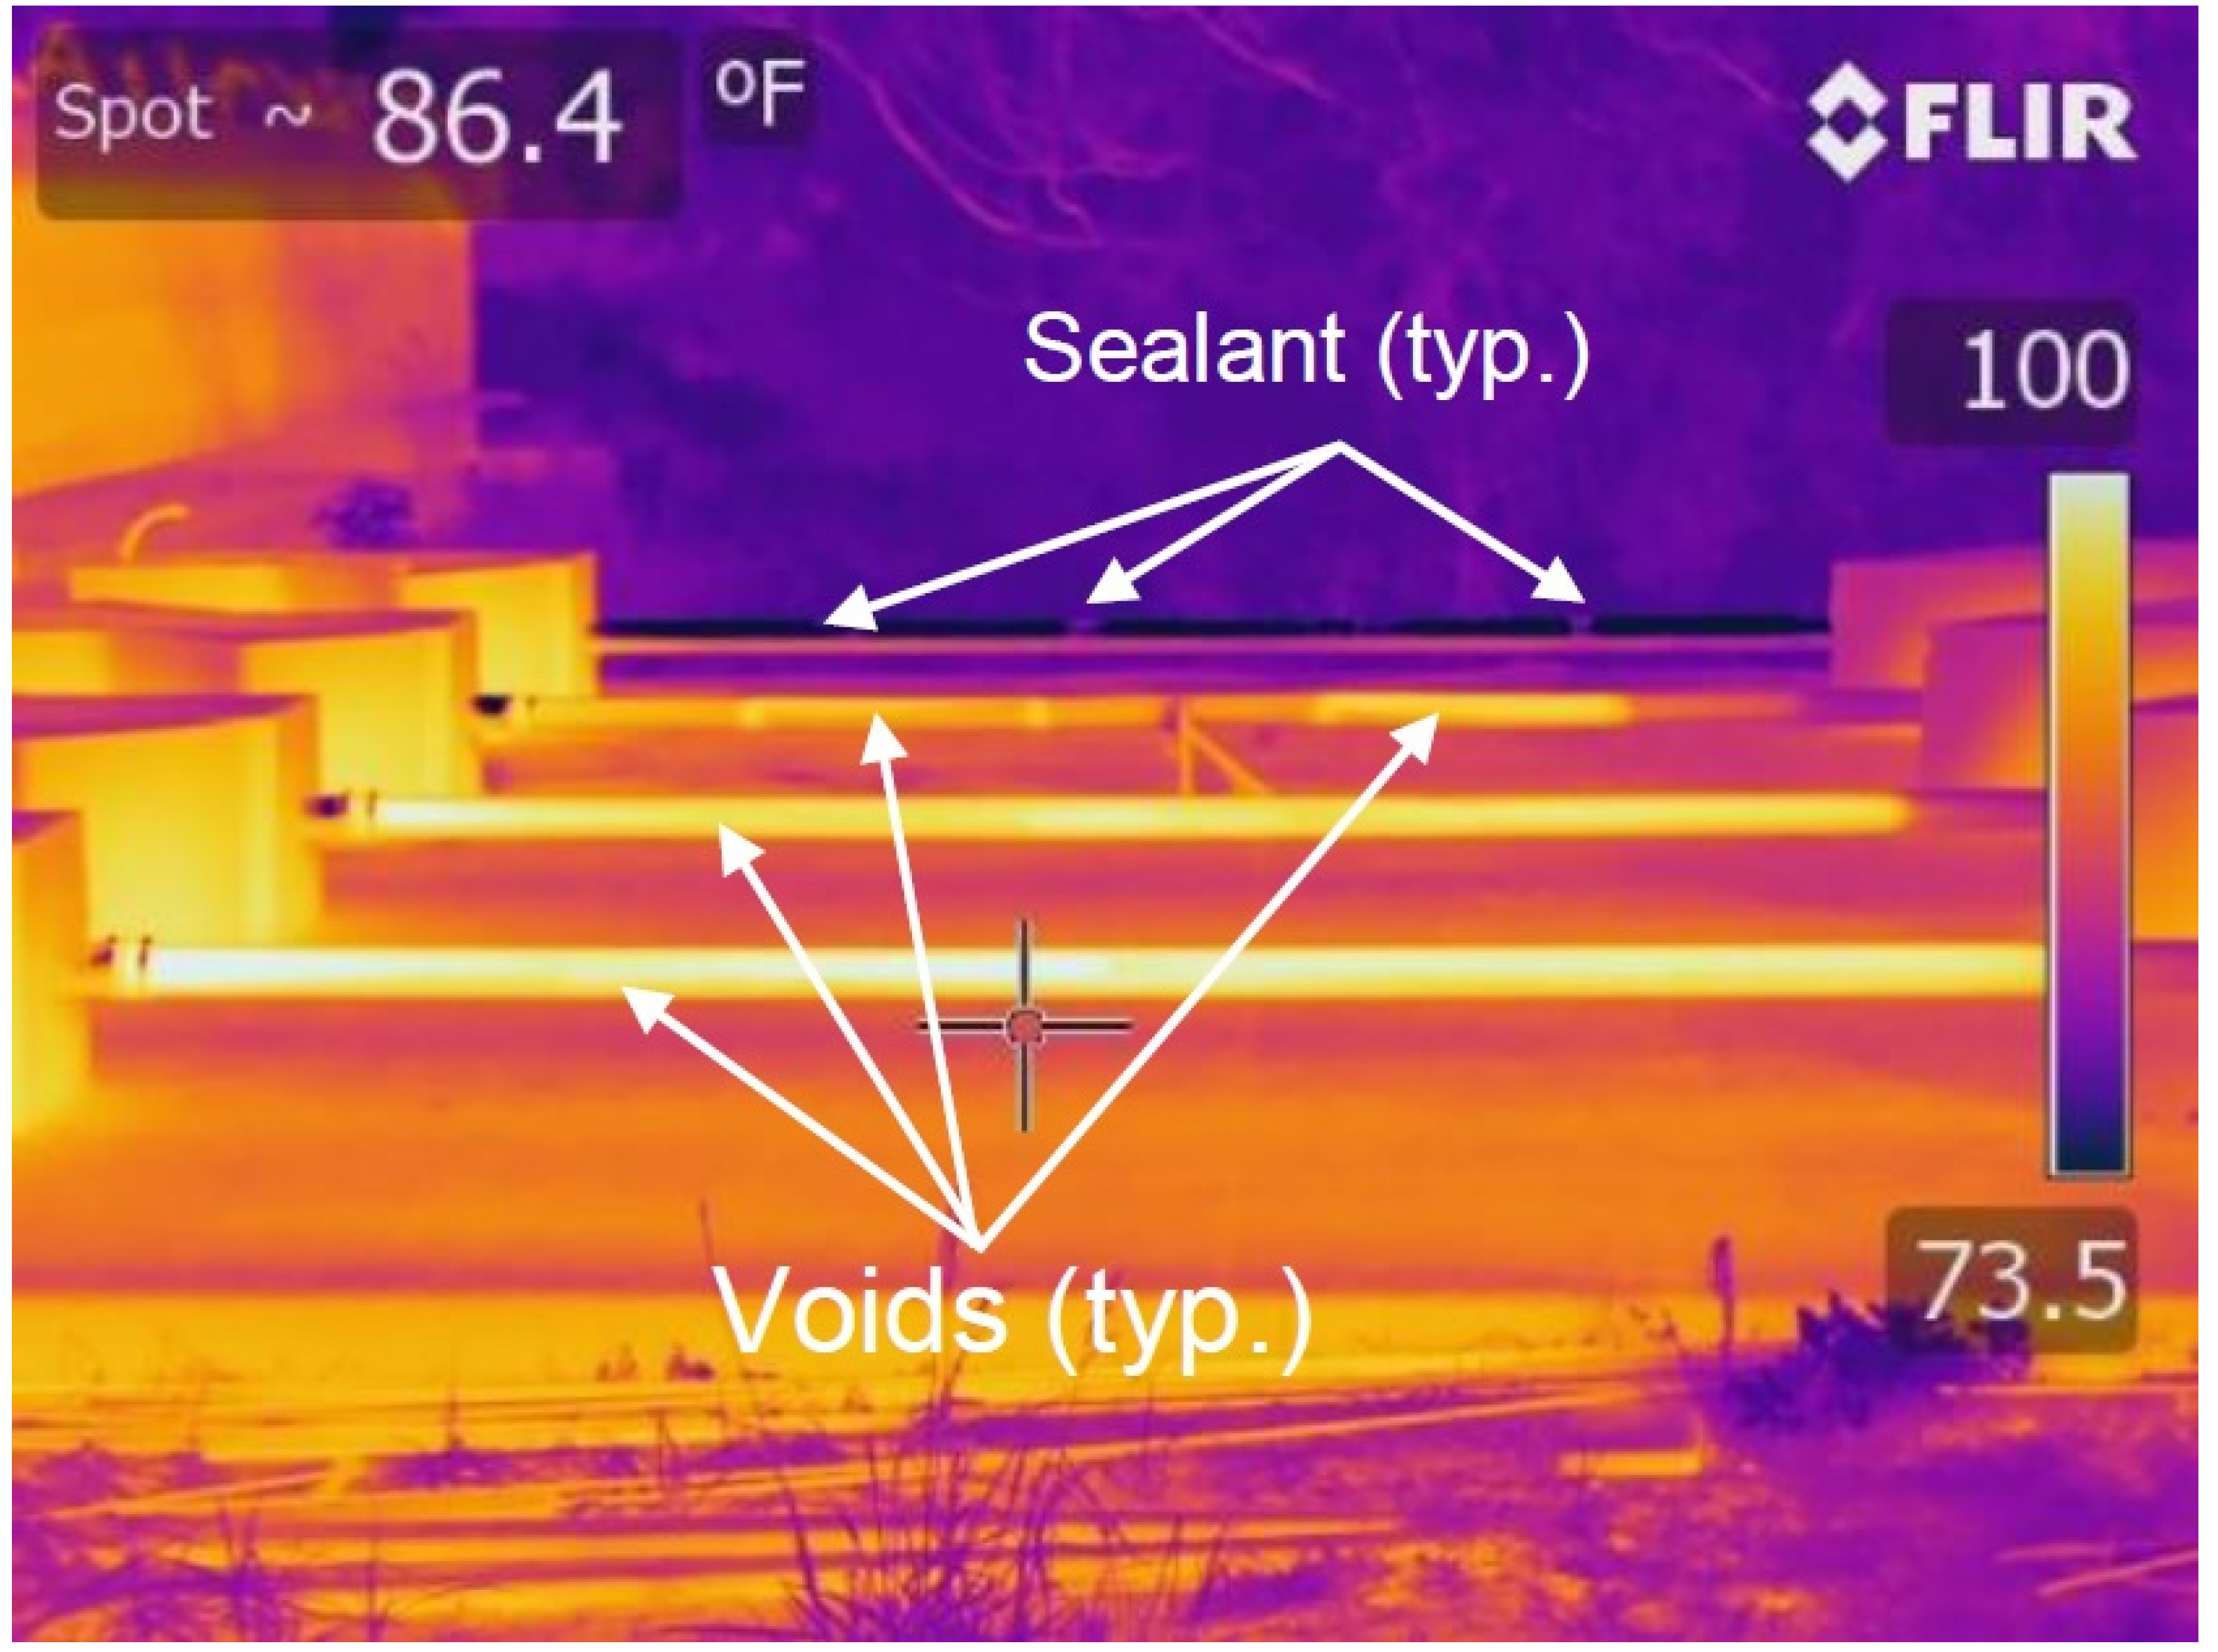
2.2.3. Infrared Thermography

Thermal energy emissions that exit the surface under investigation are translated into a temperature map via infrared thermography, an imaging method. The photos created provide information about the temperature gradients that were noticed.
Delamination and voids function as thermal barriers for heat emitted from concrete, making this an efficient NDE approach; Figure 5 [9] shows the photo that was taken by infrared thermography and the corresponding result. However, because infrared thermography devices are extremely reliant on ambient temperature conditions, doing this testing can be problematic. The best results are obtained at the time of day when the temperature fluctuates the greatest. Over the last few decades, infrared thermography has evolved into valuable equipment widely known for its capacity to detect surface faults in concrete structures. It may be mounted on a vehicle for 360-degree tunnel inspections or used with handheld cameras. Active or passive systems are the two types of infrared thermography devices. Passive infrared systems are non-contact technologies that use the sun’s heat at different times of day when the environment is warming or cooling to provide temperature gradients for thermal inspection. The application of the heat source is the only difference between active and passive infrared systems. In active infrared thermography, a heater is used to warm a specific part of the structure in a controlled setting [50].

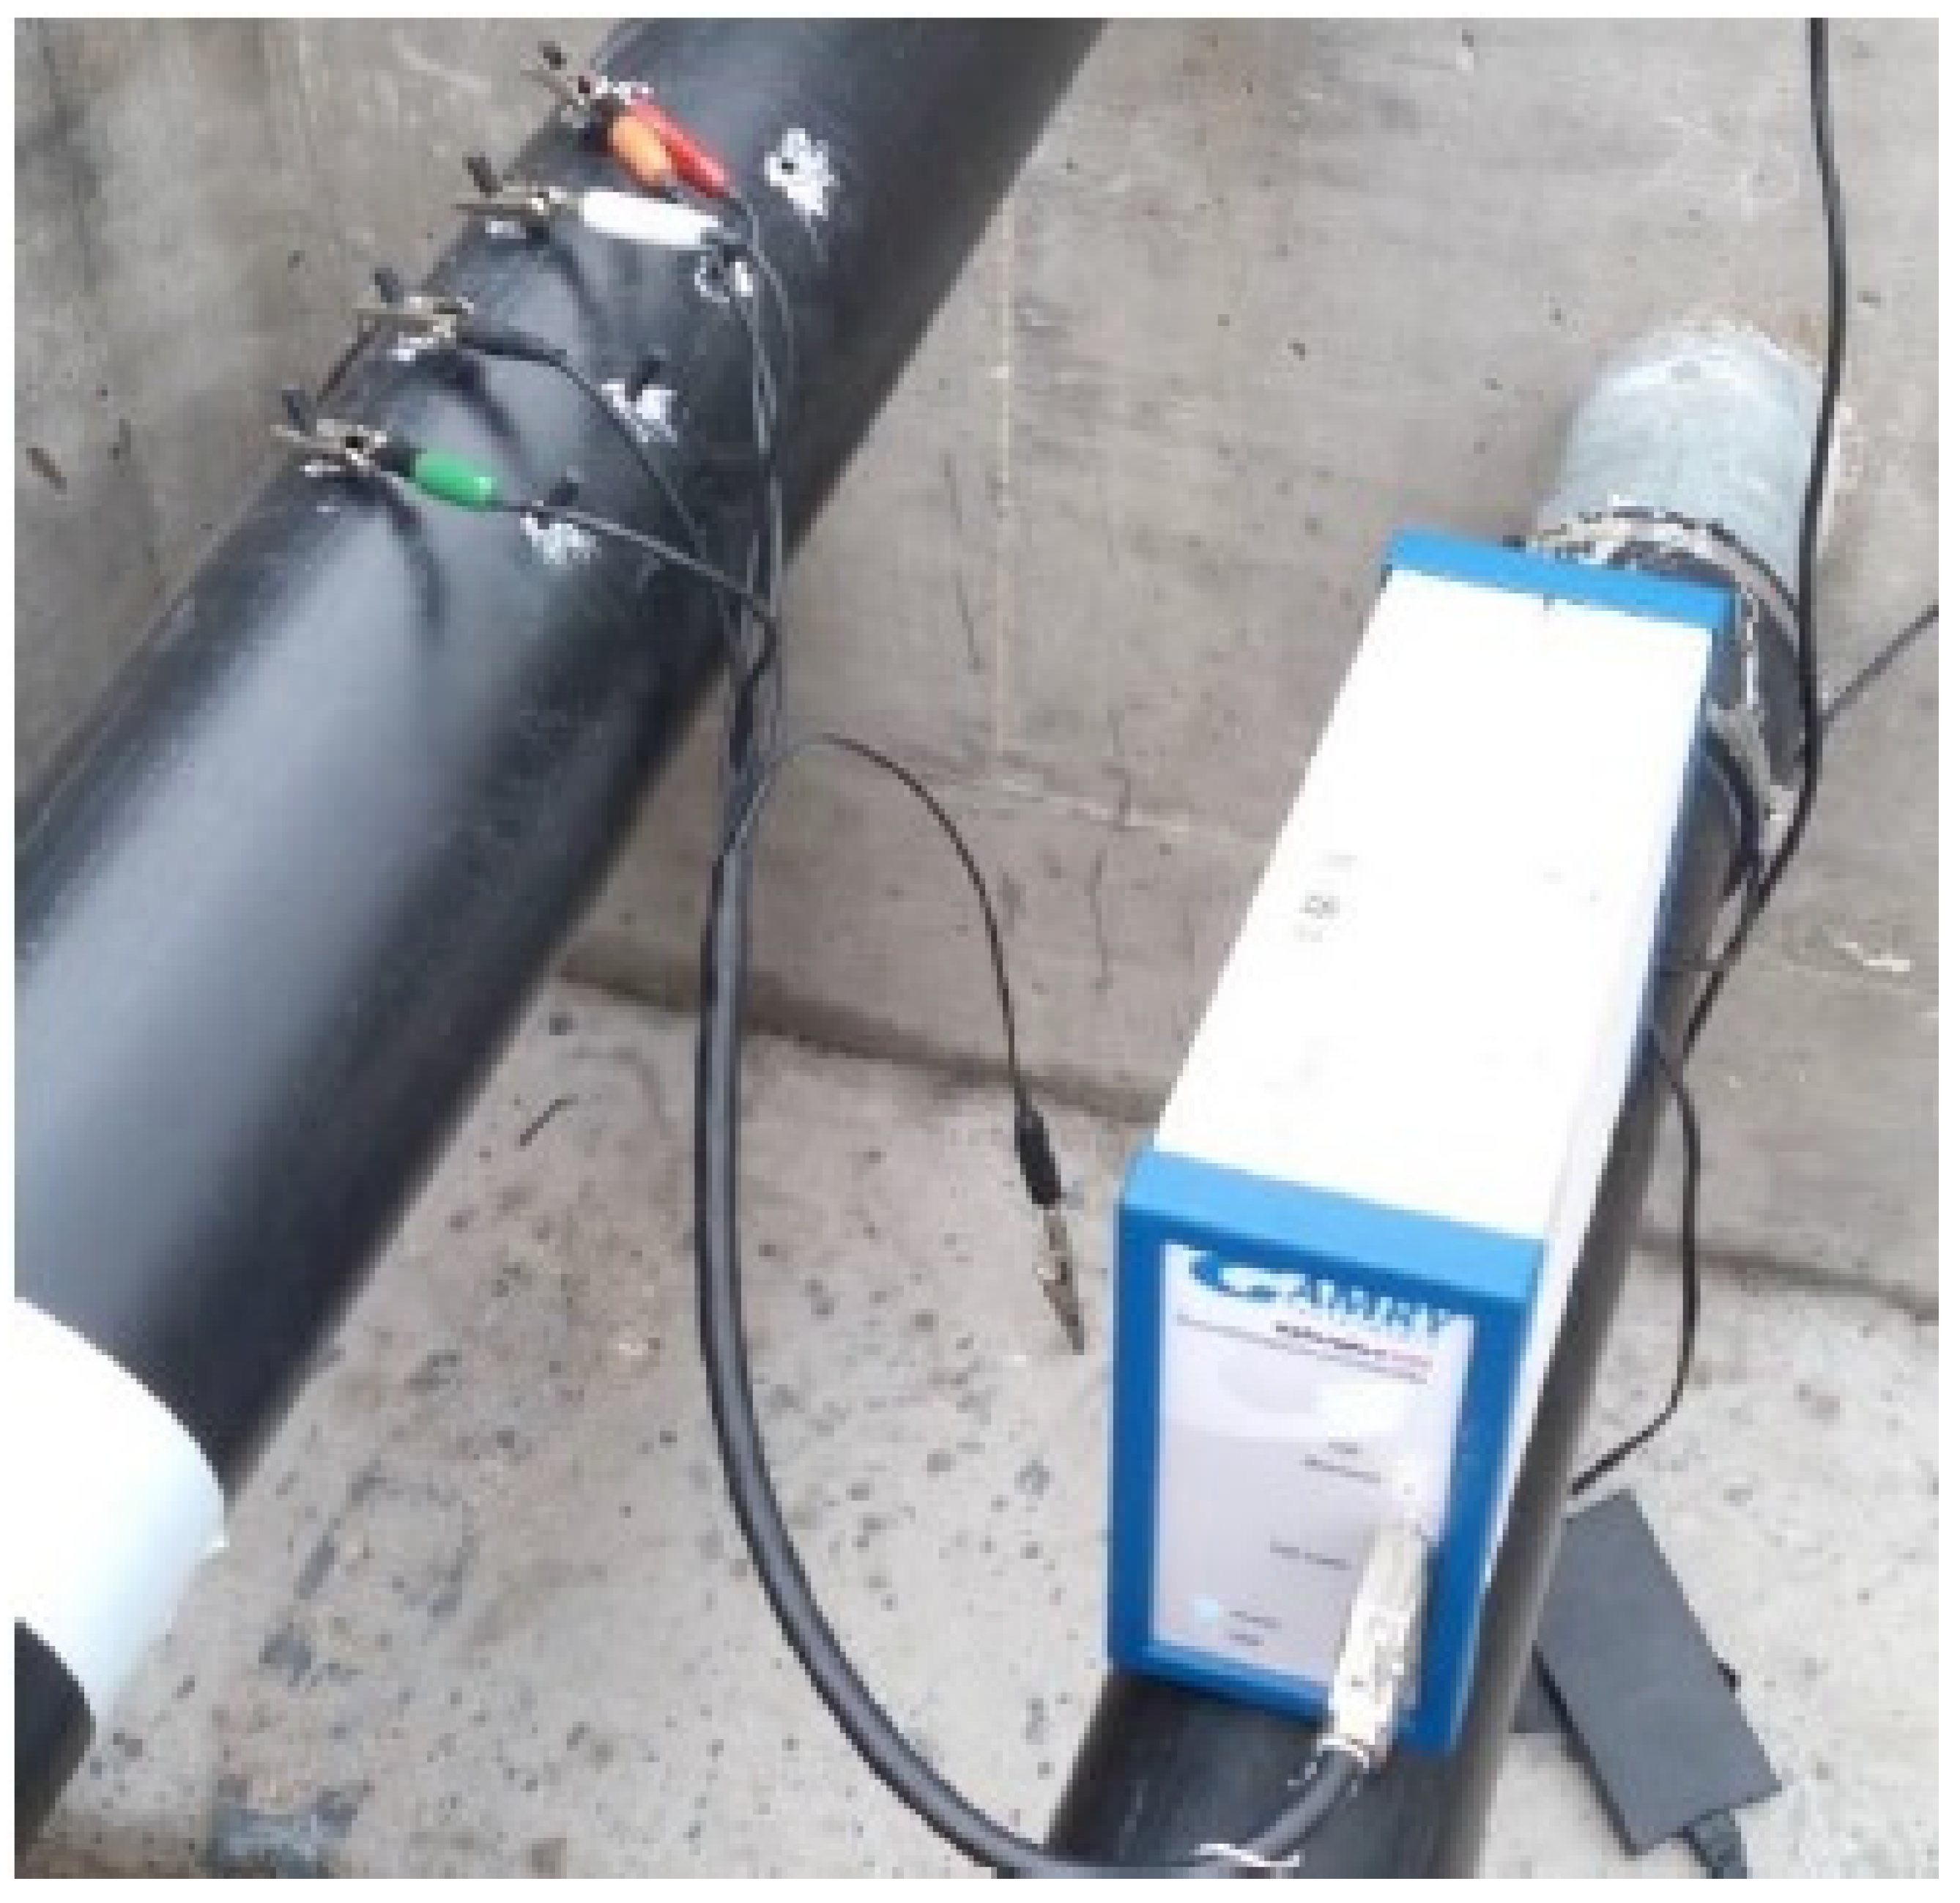
2.2.4. Electrochemical Methods

Half-cell potential, linear polarization resistance, and electrochemical impedance spectroscopy will be classified under electrochemical methods. By measuring the electrical potential difference between the steel reinforcement/strand and a portable reference electrode, the half-cell potential approach determines the possibility of corrosion. Direct access to bars or strands is required for this procedure [51]. Linear polarization resistance calculates the rate of the corrosion of steel embedded in concrete in real time. This is done potentiostatically by introducing a change in potential and measuring the ensuing current decay, or galvanostatically by introducing a change in current and measuring the resulting potential decay [52]. Electrochemical impedance spectroscopy is an impedance technique that uses a low-amplitude voltage to test steel across a wide frequency range. Figure 6 [9] shows the configuration of electrochemical impedance spectrometer to evaluate the condition of a post-tensioning element. The impedance of the concrete-steel contact may be determined by detecting changes in phase shift and signal amplitude [53].

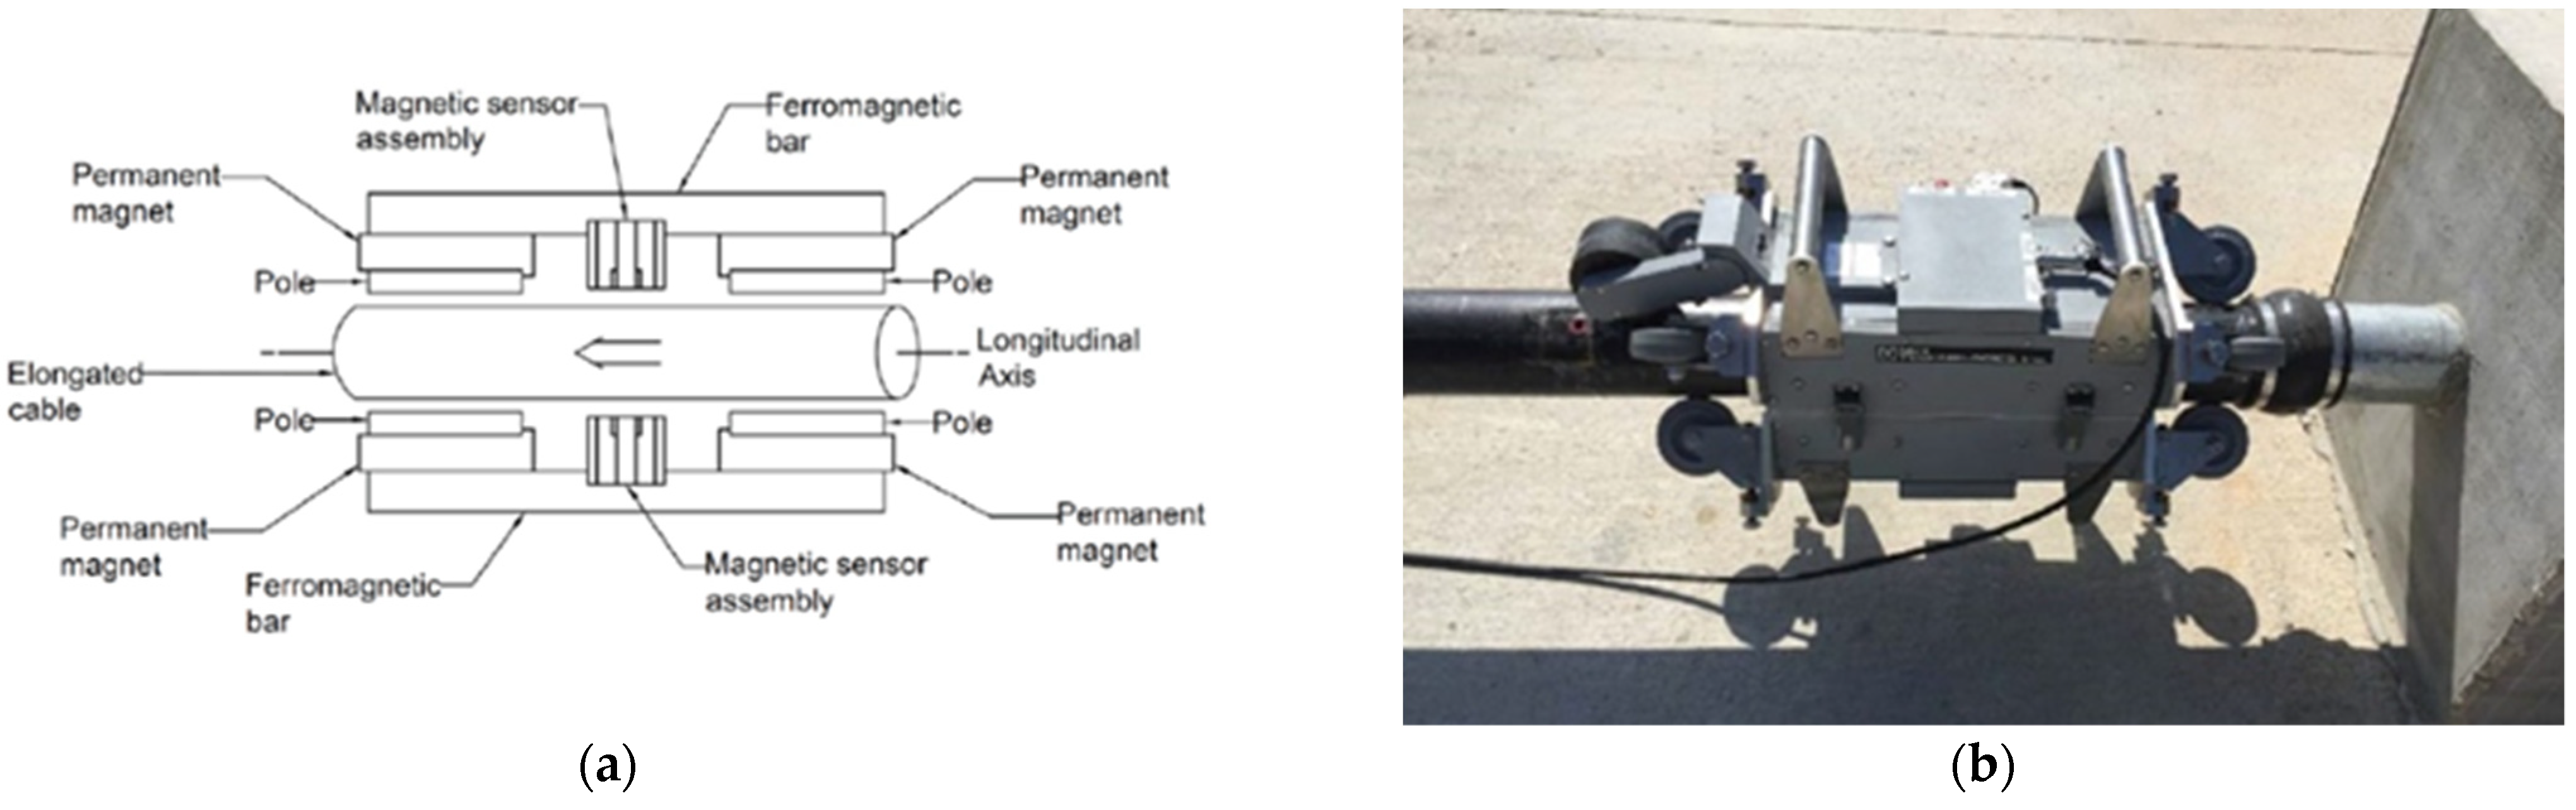
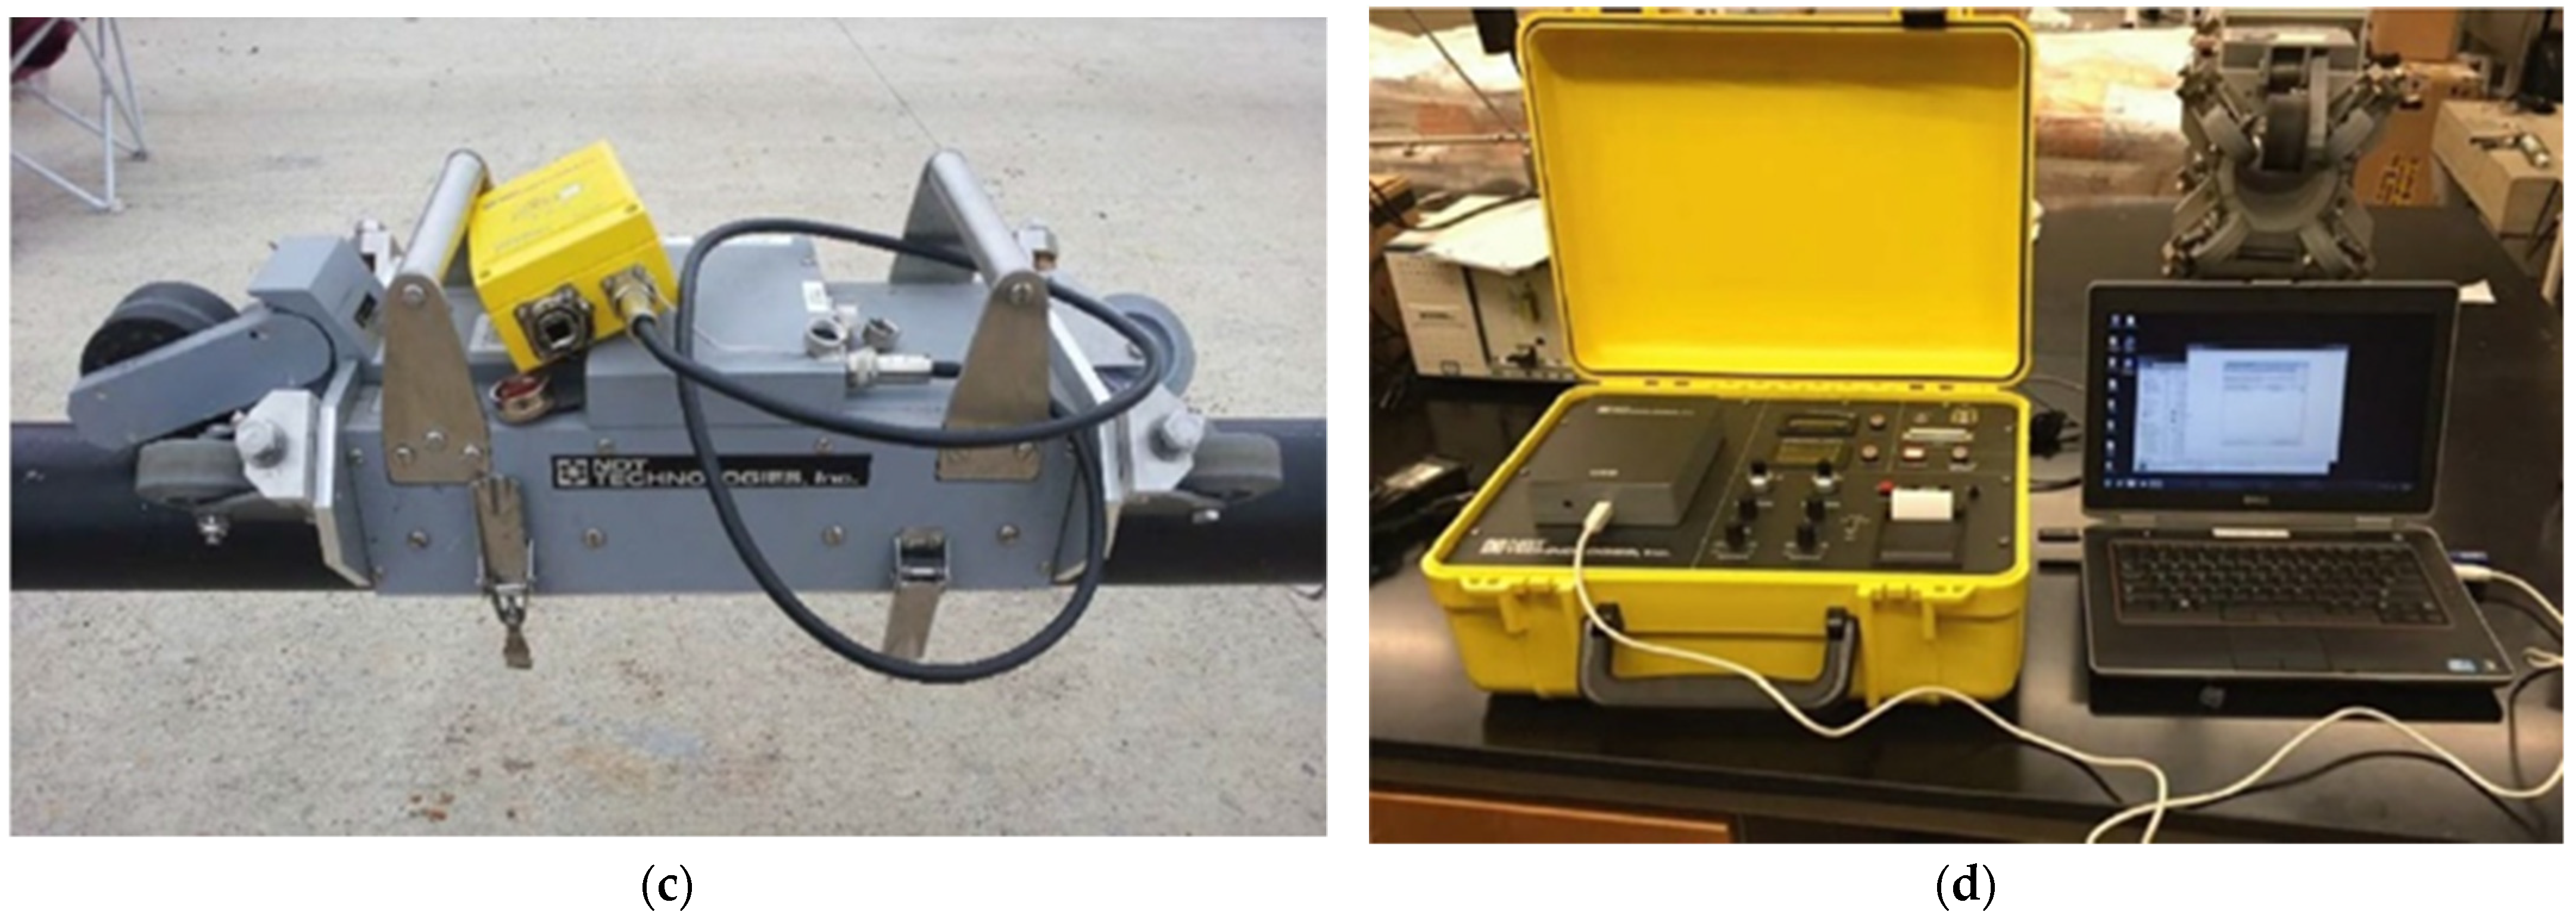
2.2.5. Electromagnetic Methods

Electromagnetic methods will be divided into four inspection categories: magnetic flux, elasto-magnetic method, electrical capacitance tomography, and magnetostatics.
Magnetic flux leakage methods include two major categories: active magnetic flux leakage and residual magnetic flux leakage. A portable magnet is used to submit a ferrous material/steel to a high magnetic field in the active magnetic flux leakage technique. This creates flux routes between the two poles of the material. The magnetic field in the material “leaks” from its regular path of least resistance to spots where there is a section loss. The leak is detected using a magnetic field detector (made up of Hall-effect sensors) placed between the magnet’s poles and is sensitive to the change in the magnetic field. The residual approach involves bringing the steel to full magnetic saturation to erase its unknown magnetic history, then removing the magnet and passing the sensors over the portion to detect the remaining magnetic field [53,54]. Figure 7 [9] shows the schematic of the sensor probe, full head sensor, half head sensor, and the connection of the NDE extension to the computer.
Elasto-magnetic approach, also known as the magneto-elastic technique, was developed to estimate cable stress and may detect stress changes and section loss caused by corrosion. The approach is based on the idea that magnetic permeability is responsive to stress variations. In laboratory studies, stress measurements utilizing elasto-magnetic sensors were shown to be in good agreement with load cell results. The stress loss due to shrinkage, relaxation, creep, and elastic deformation was clearly observed using elasto-magnetic sensors on the Kamikazue viaduct to quantify stress changes in an external tendon system [55,56].
Electrical capacitance tomography gathers capacity data from multi-electrode sensors and creates permittivity pictures of sections over thousands of repetitions. The researchers used a pair of electrodes on a tiny HDPE conduit with one strand and successfully identified both air- and water-filled holes in ducts. When it comes to attaining accurate estimation, however, the electrical capacitance tomography design is challenging; careful design and rigorous verification are necessary [14,40,43].
Magnetic fields cause small changes in the physical dimension of steel, while material strains cause changes in magnetization, according to the technology’s idea. As a result, when the magnetic field surrounding the steel element changes, an elastic wave travels in both directions along the wire’s length. The stress wave changes the material’s magnetic induction, causing the voltage to be produced in the receiving coil. This can be monitored and used for the detection of flaws in magnetostatics.

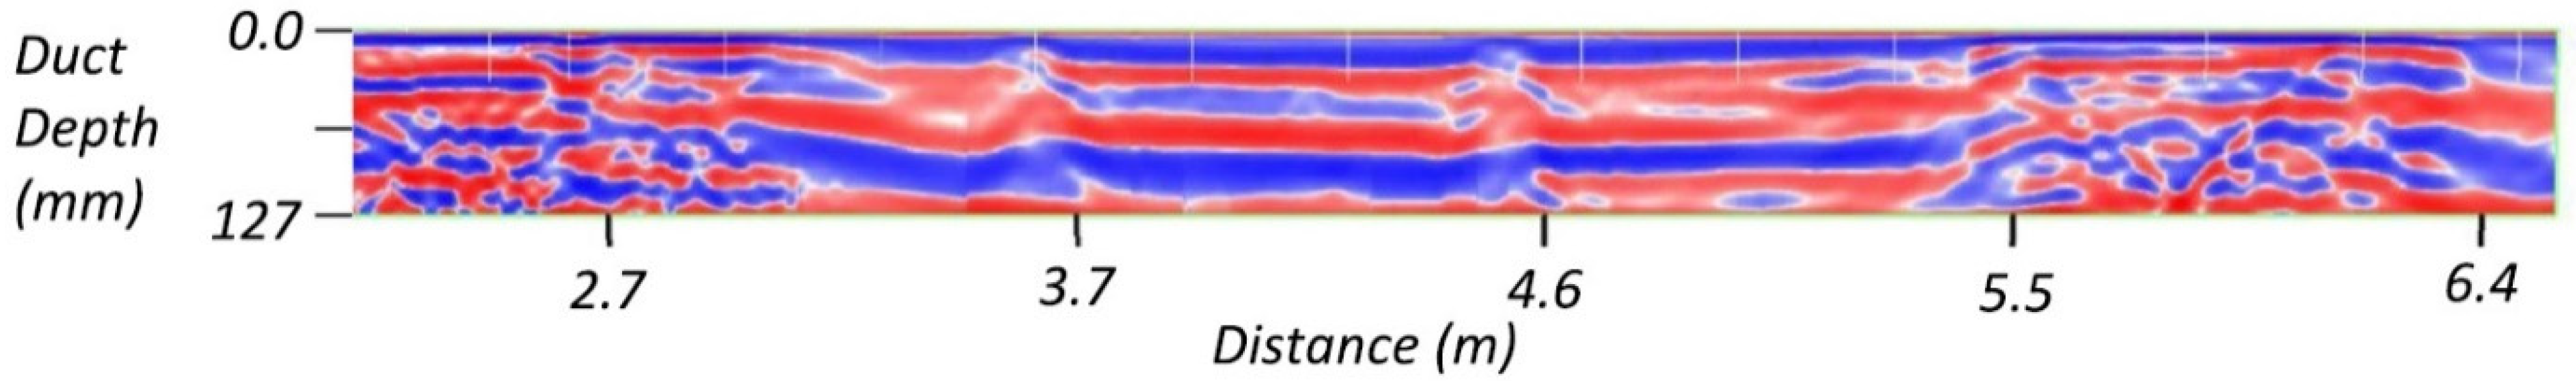
2.2.6. Ground Penetration Radar

Ground penetration radar is a radar imaging technology that uses an antenna to transmit electromagnetic pulses—basically on the order of 109 Hz—and internal reflectors to receive the returned pulses. Figure 8 [9] shows an external tendon in the picture that was taken by a ground penetration radar (GPR) unit. Changes in the material’s electrical conductivity and dielectric permittivity create reflections. It is one of the most successful high-speed methods for detecting damage to concrete buildings and is very sensitive to metallic elements in structural applications [9].

2.2.7. Radiography

Radiography has four different subcategories including X-ray radiography, Gamma-ray radiography, computed tomography, and neutron bombardment.
Radiography is a method that uses high-energy electromagnetic radiation to examine photographs of an item. A linear accelerator, a cyclic particle accelerator, or an X-ray generator are the most common sources of X-rays. X-ray radiography is a method that involves using film to evaluate an object. Gamma-ray inspection uses radioactive sources to create gamma-rays that are caught on film. Computed Tomography is a technology that uses both X-rays and gamma-rays and numerous scan angles, computer processing, and reconstruction techniques to produce 2D pictures of a 3D object. When utilizing X-ray sources, some researchers use Computed Tomography, while when using gamma-ray sources, they use “reinforced concrete tomography,” or RCT. Neutron bombardment, for example, employs a beam of neutrons to emit prompt gamma rays, which are then measured by a gamma ray spectrometer [57,58,59]. Figure 9 [9] shows a result of radiography of an external tendon using gamma-ray.

2.2.8. Other Methods

Air flow is the only method that has been classified as other methods at this point. Pumping a known volume of dry air through a duct via the anchoring zone or a destructive bore and catching the air from the opposite end of the duct or destructive bore is one use of this approach. The moisture content of the air is measured [60].

2.2.9. Sensors

Time domain structural health monitoring is often done using sensors. In the case of the selection of the inspection method, by default, there are methods in which the inspection time is limited to the days of the presence of inspection agents, while in the inspection by time domain methods, the entire data of inspection interval is monitored. A variety of sensors have been named in the literature; however, fiber optic sensors, accelerometers, and strain gauges are more common within them. Fiber optic sensors are lightweight, unobtrusive, and insensitive to electromagnetic interference [61]. Accelerometers are used to measure the stiffness, define the modal shapes, and find the force within post-tensioning elements along time continuously. The use of strain gauges data and corresponding time domain records for analysis of section loss and corrosion is sophisticated, since all environmental parameters and load patterns influence the strain. Nevertheless, comparing the structural behavior pattern over time can be considered a sign of deterioration [62,63]. Figure 10 [9] shows the strain gauge on the post-tensioning strand.

3. Risk-Based Framework and Attributes for Selection of Inspection Method

Despite the efforts of inspectors and experts in structural health monitoring to provide accurate reports on the condition of the bridges, the reports and methods used always have their errors and risks; non-destructive methods related to the post-tensioning system of bridges are not an exception. Although extensive research has been conducted to investigate the accuracy of NDE in bridge engineering [64,65,66], there is no unified scale to measure the accuracy of the NDE methods. Therefore, there is no reliable framework available based on which the bridge stakeholders can make their decision. This decision is normally made only based on anecdotal evidence and experiences of the inspectors. Selection of the inspection method is one of the decisions that need to include not only cost and the current condition but also the accuracy of the applicable NDE methods; therefore, the decision has become challenging for bridge stakeholders and managers. A risk-based framework for choosing the inspection method by proposing a scale can consider the cost, current condition, and accuracy of the NDE methods. One of the most common tools for determining the condition of bridges is using the specifications for the national bridge inventory (SNBI) rating, which has been introduced and requested by the federal highway administration (FHWA). Additional guidelines issued by FHWA specify the requirements for determining a bridge rating. On the other hand, research shows that the reliability of the bridges is significantly correlated with the corresponding rating of the specifications for the national bridge inventory (SNBI) [67,68,69]. Therefore, it can represent the health index as a suitable scale while also being practically standard. In this paper, SNBI rating was proposed to be the scale used to measure the accuracy of the NDE methods. An error inspection report that expresses the condition of the bridge within the acceptable rating, while the actual condition is not acceptable, is the error in structural health monitoring of the bridges. The likelihood of this error with corresponding consequences will form the risk of the decision in the selection of the inspection method. In this paper, the accuracy of the NDE method, the current condition of the bridge, and the accuracy of the current condition of the post-tensioning system have been considered as involved attributes to conclude the probability of the inspection error.

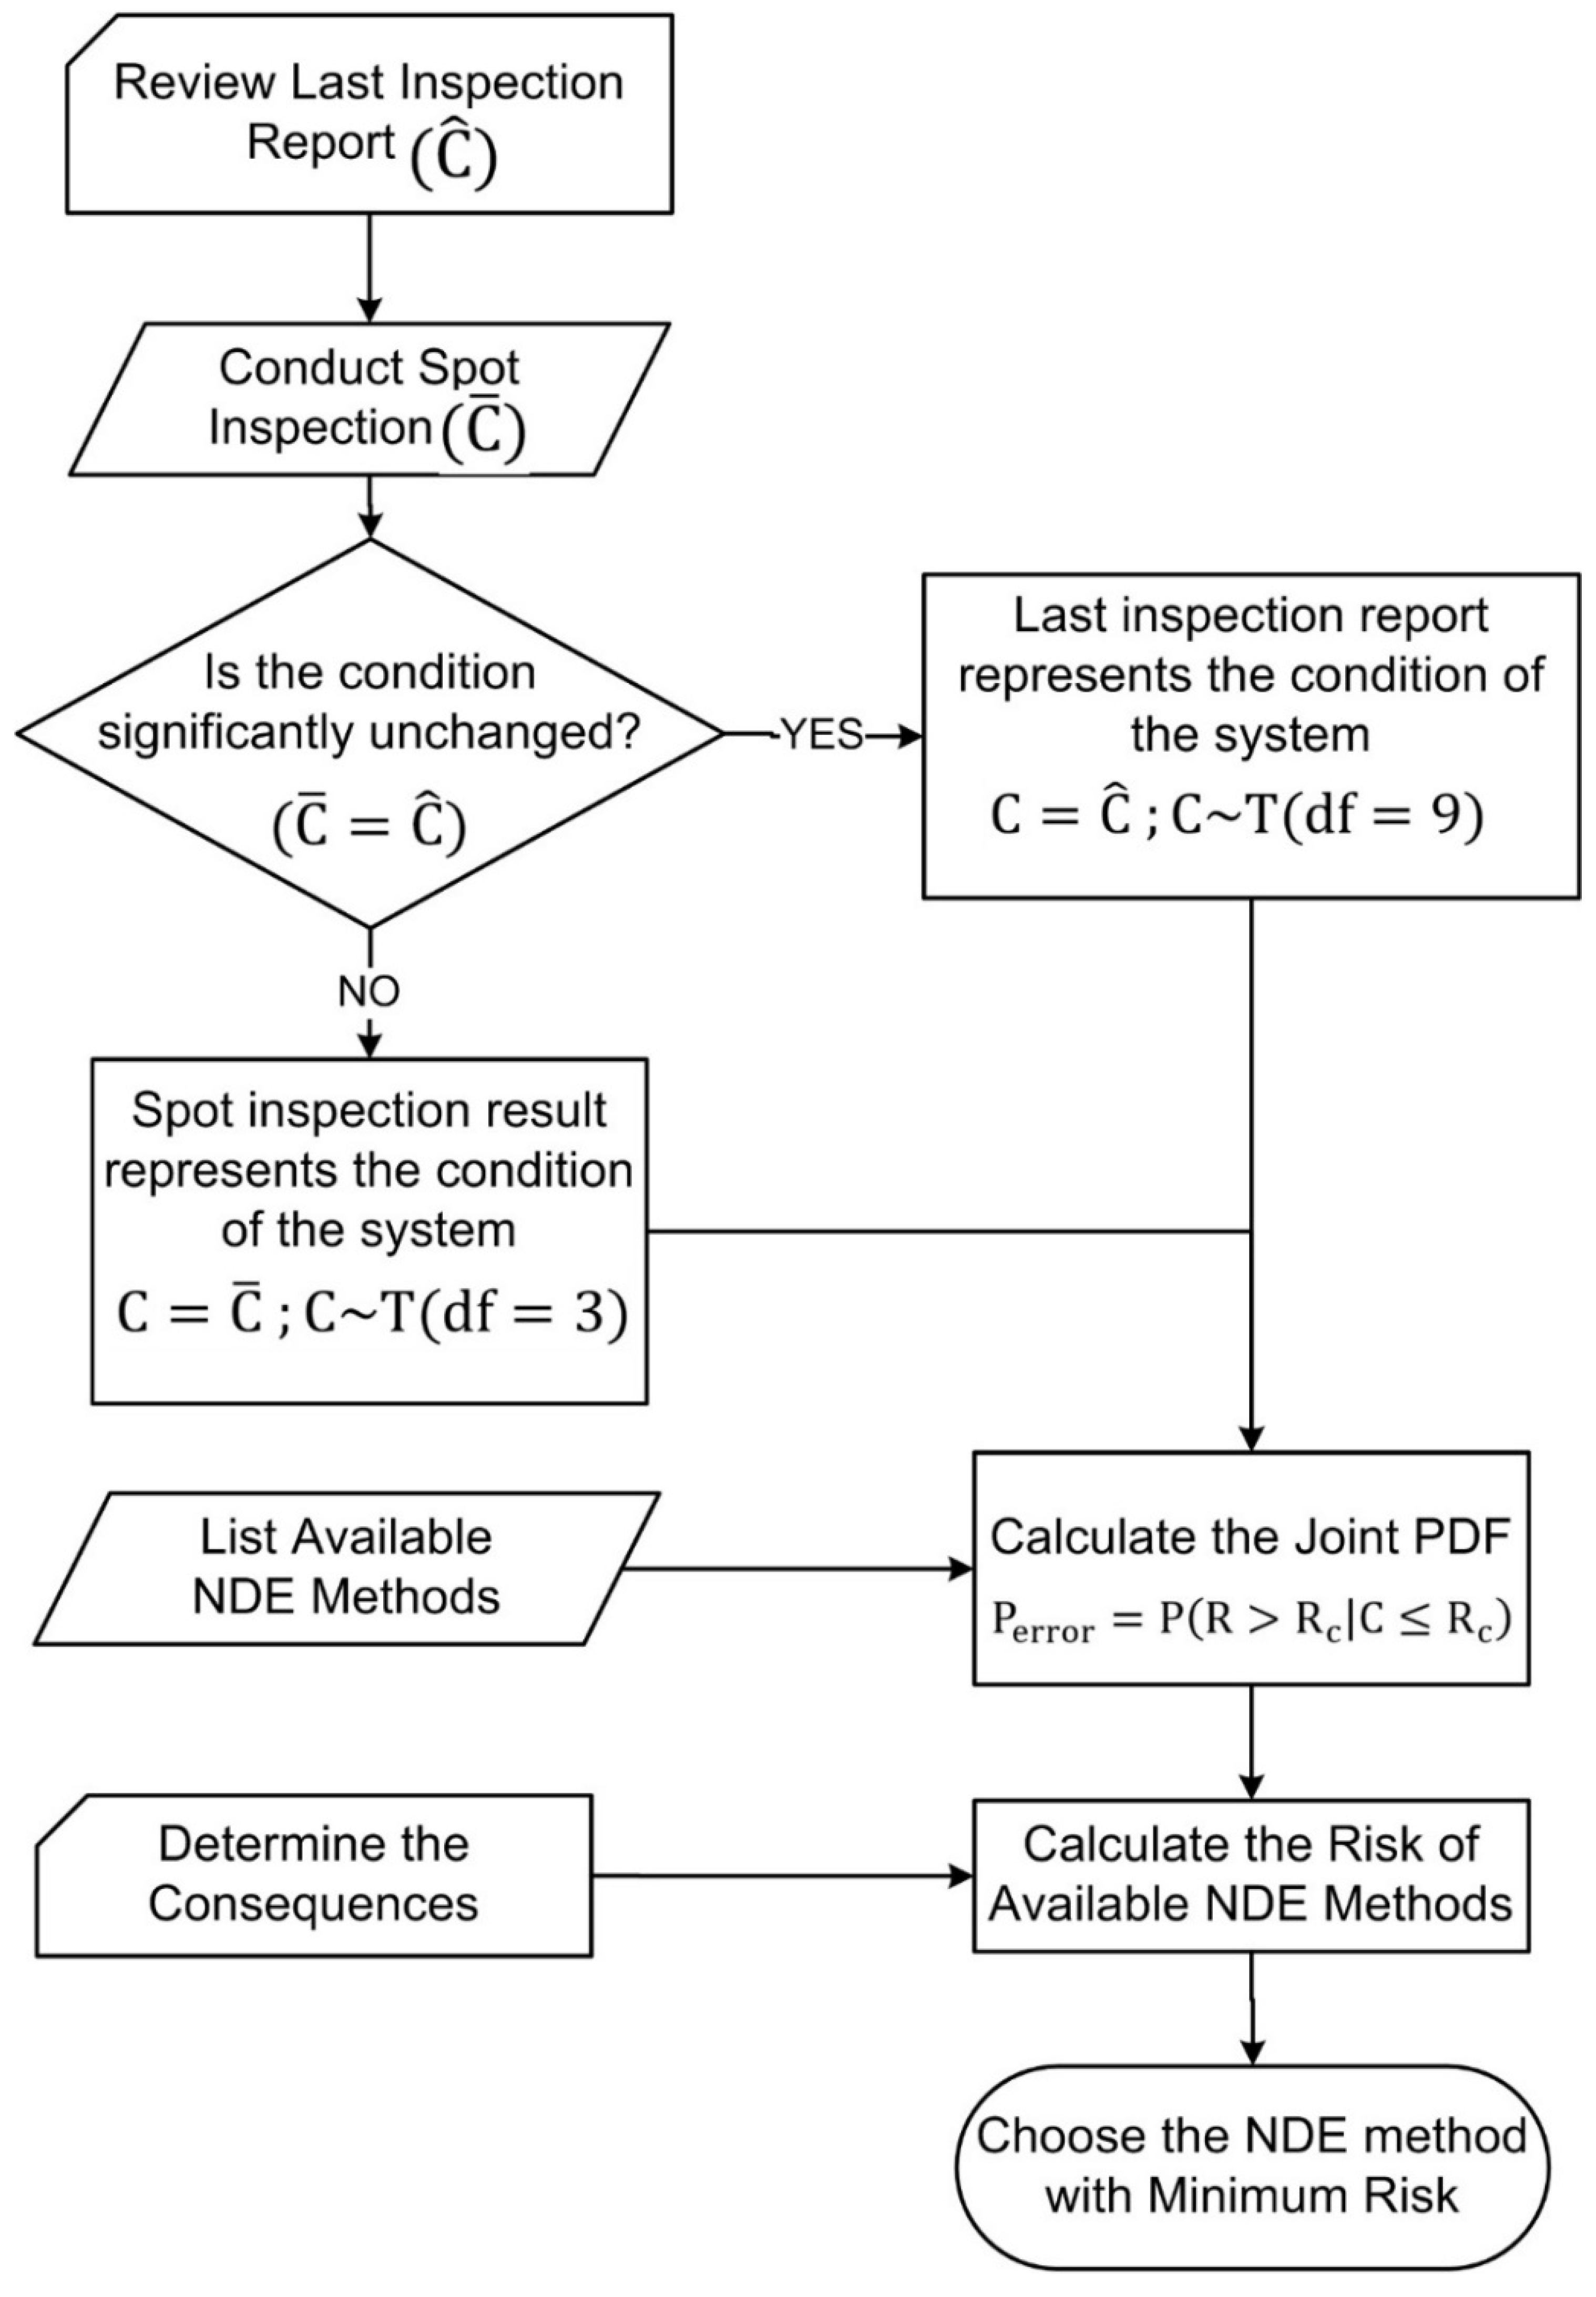
3.1. Estimation of the Current Condition

Although the selection of the inspection method is in the initiation steps within the health monitoring of the post-tensioning system, having an estimation of the condition of the post-tensioning system is a must. Spot inspection (an inspection based on a random or representative sample, or one made without prior warning) is used to verify whether the condition of the bridge (C) is the same range as the last available report ( C ^ ) . Having the result of the spot inspection C ¯ , hypotheses testing is conducted and checked.
H 0 :   C ¯   =   C ^ H a :   C ¯ <   C ^
A t-test is used to test the hypothesis. The approximate sample size in spot inspection varies based on the condition of the post-tensioning system and can be done by expert judgment. Such expert judgment is based on the prediction of the condition change, the standard deviation of the condition, and the accuracy of the NDE method that will be used in spot inspection. The hypothesis can be checked at a 90% confidence level. More confidence levels change the path of the risk analysis, and only in poor and fair conditions (SNBI ratings less than 5) will be recommended. The result of the testing hypothesis is highly effective since it will influence the characteristics of distribution that is assigned to the condition of the post-tensioning system. If the null hypothesis is rejected, the condition of the post-tensioning system will be assumed as spot inspection result C ¯ ; otherwise, the condition is assumed to be the previous condition that was reported in the last inspection report ( C ^ ) . Another impact that the model should consider is the distribution characteristics for condition (C) based on the hypothesis test result. If the null hypothesis is rejected, t-distribution with three degrees of freedom is assigned to the condition since the result of the spot inspection represents the condition of the whole system, and deterioration is significant based on the hypothesis conclusion. If the null hypothesis is adequate, t-distribution with nine degrees of freedom is assigned to the condition since the number of SNBI ratings is ten (nine degrees of freedom), the previous state is still valid, and fewer contingencies have been assessed within the post-tensioning system. Equations (2) and (3) represent the logic that is used in the proposed model.
H 0 :   C ¯ =   C ^   C ~ T μ ^ C , σ ^ C ;   df = 9
H a :   C ¯ <   C ^   C ~ T μ ¯ C , S ¯ C ;   df = 3

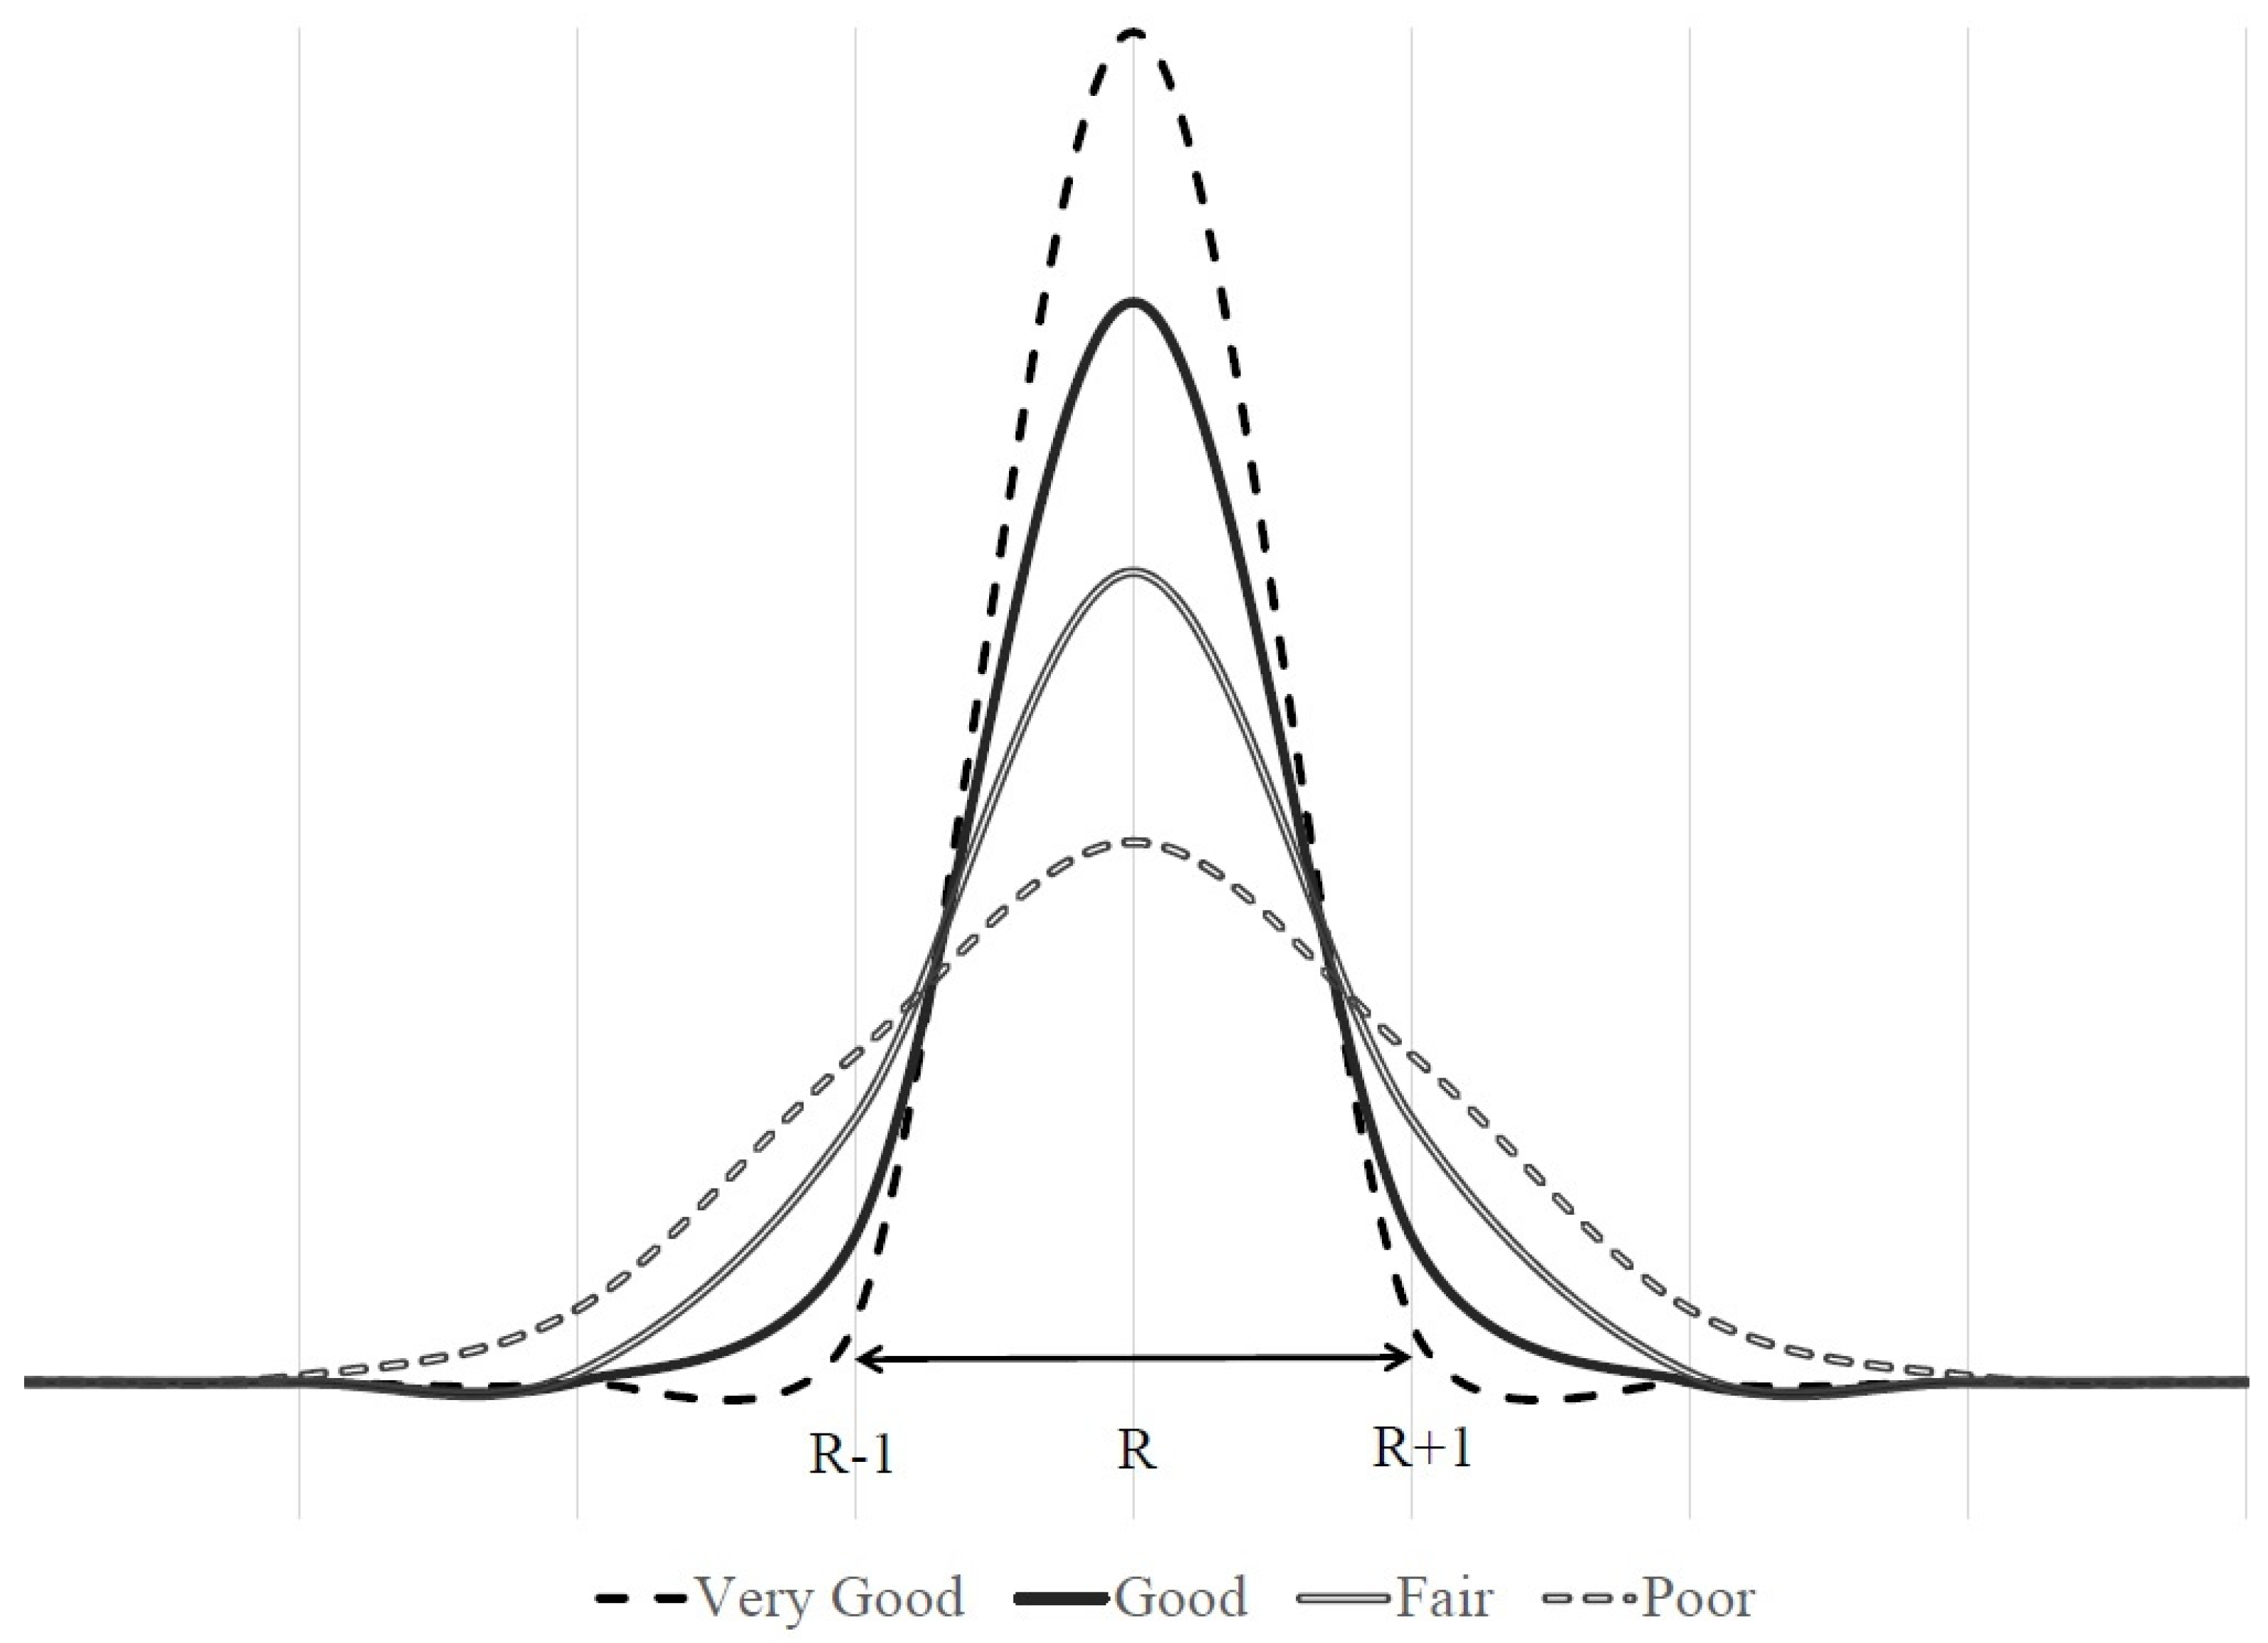
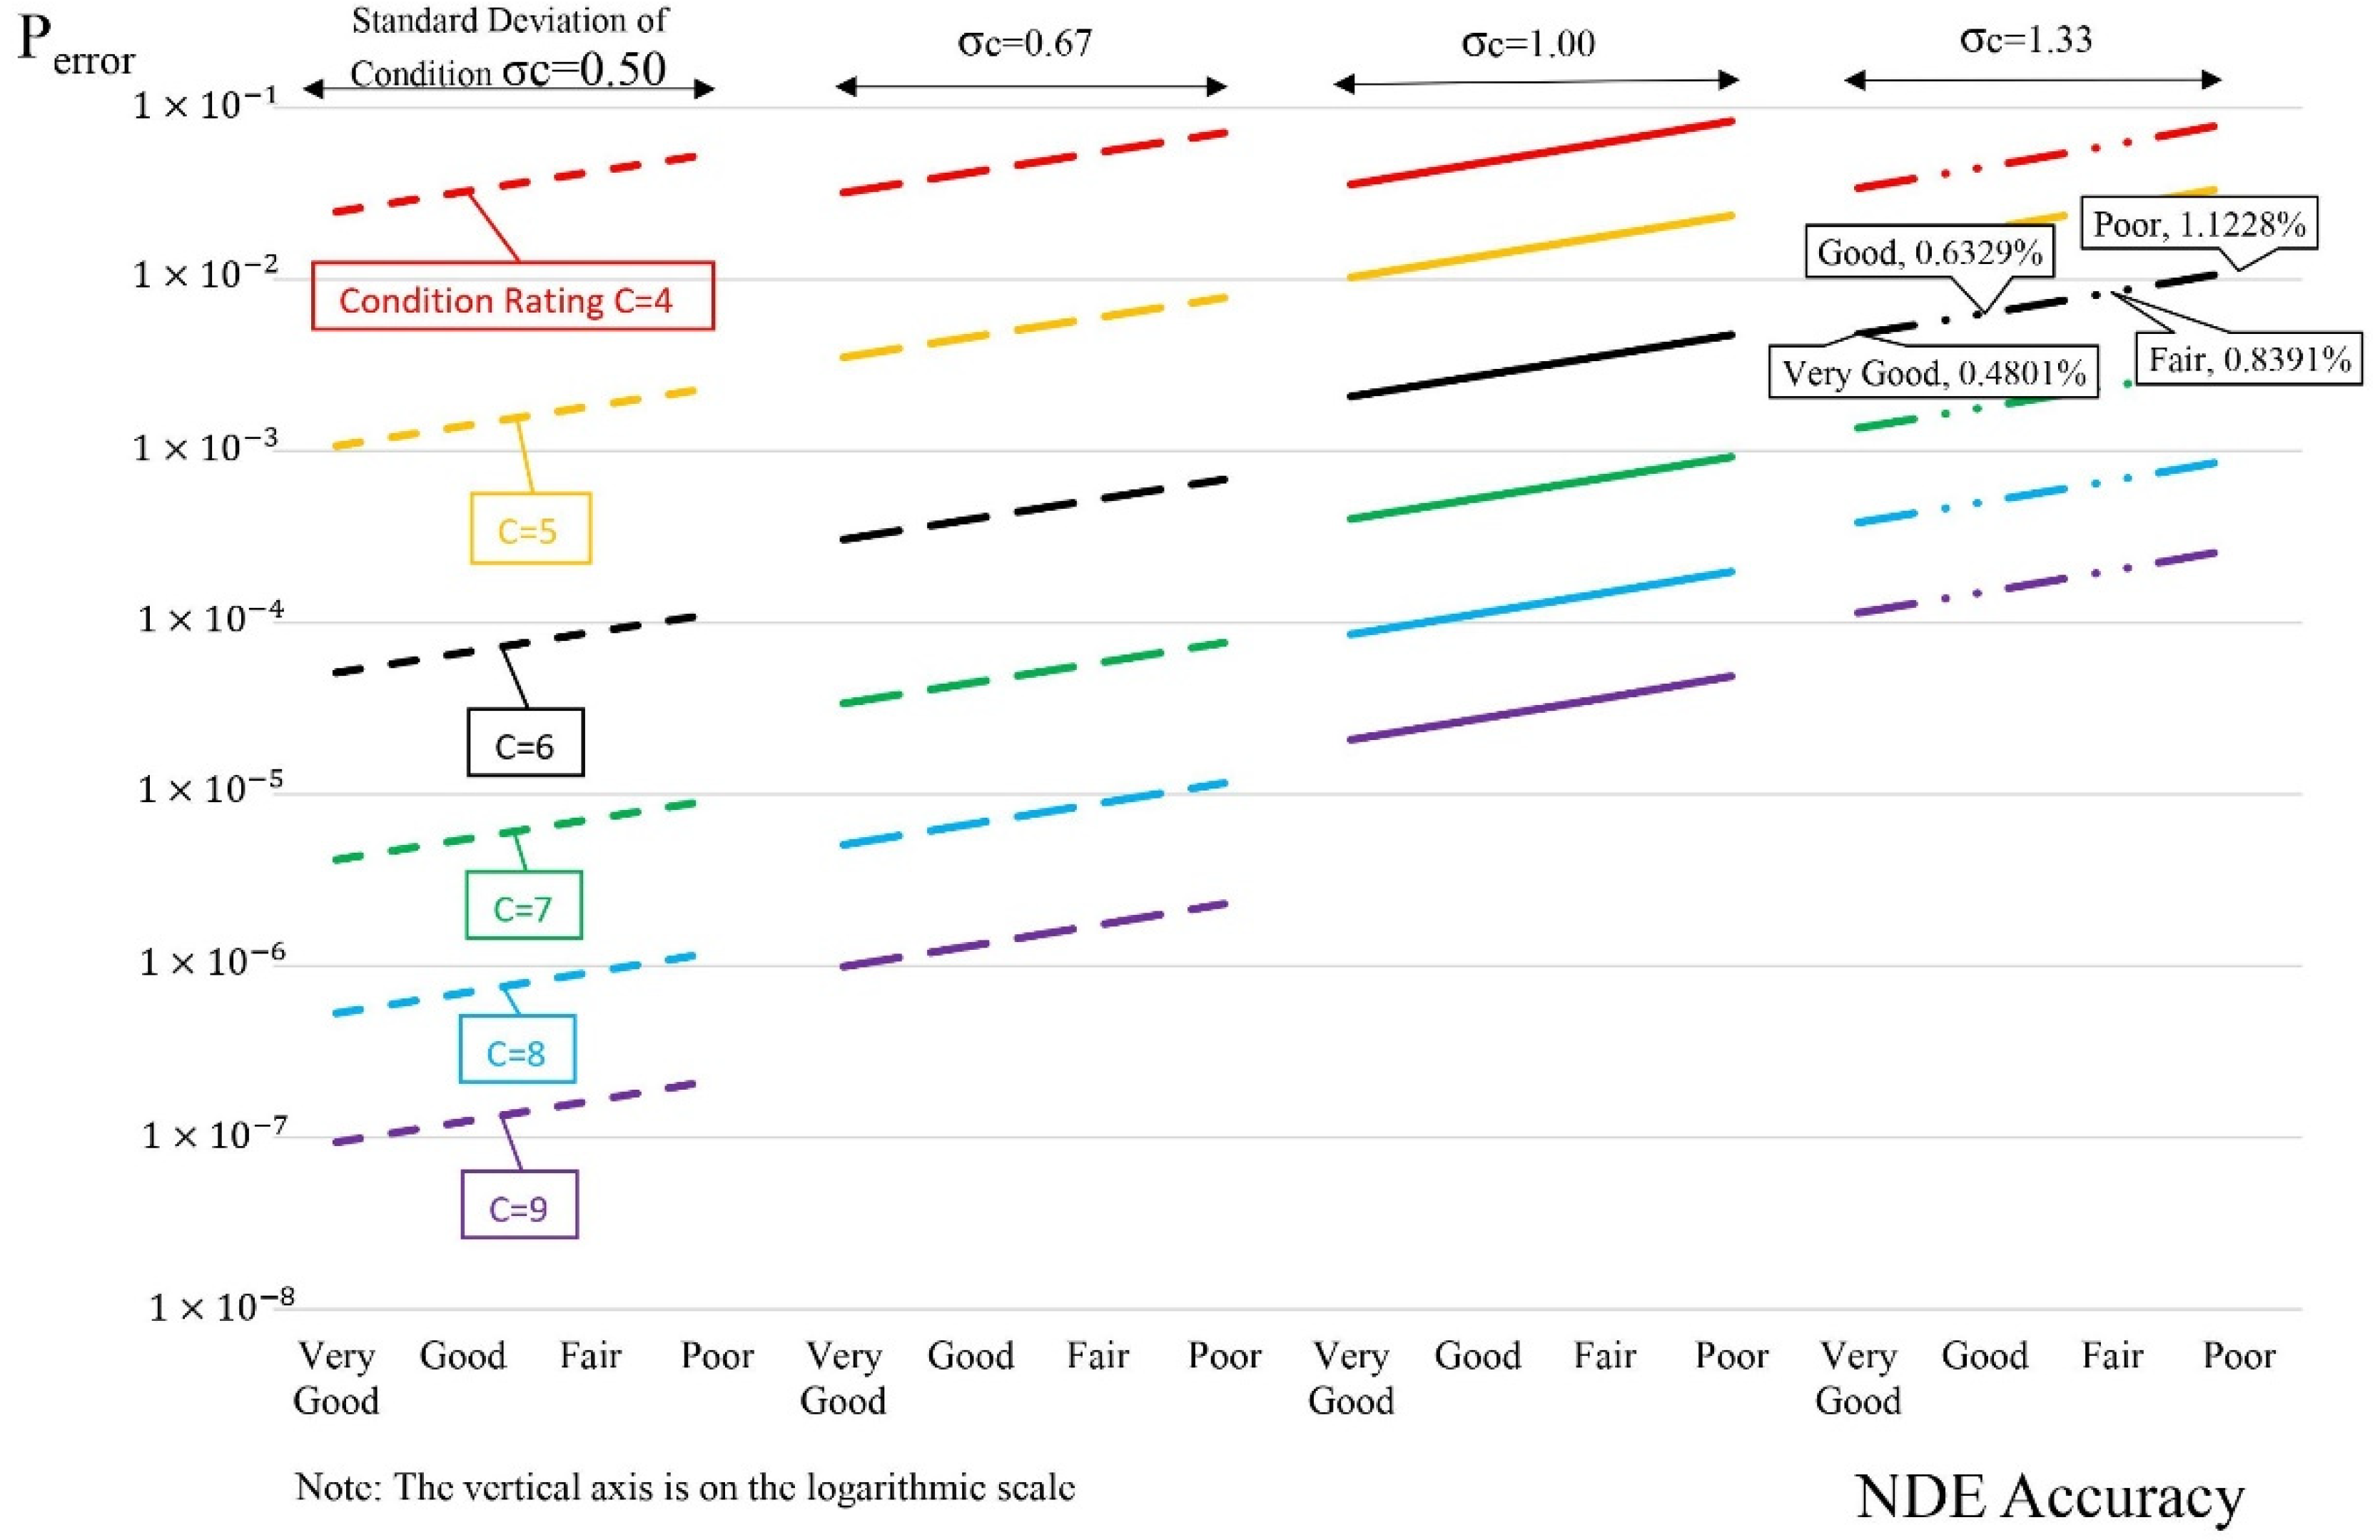
3.2. Inspection Error in Health Monitoring of Post-Tensioning System Using NDE Methods

The most important reason for the bridge inspection is to answer whether there is any serious defect that threatens the safety of the whole structure. In the case of a negative answer to the question, there is a possibility of having a false negative answer, representing an inspection error, which is defined in Equation (4):
P error = P R > R C | C R C
where Perror is the probability of error (false negative result), R is the condition rating that the NDE method will report, C is the actual condition rating, and Rc is the critical condition rating that the bridge manager aims to avoid that is recommended to be R C = 3 .
To elaborate on and solve Equation (4), some clarifications and assumptions are needed that includes:
Condition rating adapted based on the SNBI ratings per Table 20 of the specifications of national bridge inventory (SNBI) [70] for external post-tensioning system as shown in Table 1.
It is assumed that R fits by t-distribution R ~ T μ R , σ R .
The structural difference between consecutive SNBI ratings is the same for all.
The most critical parameter that influences accuracy of NDE methods is the technology used in the NDE tools. Because of this, NDE methods were classified based on the corresponding technology. The condition of the structure, size of the defects, and environmental parameters might influence the accuracy of the NDE methods; however, these parameters are not named as essential as the NDE technology in the literature [65,71]. Therefore, proposed accuracy of the NDE method covers the systematic error of the methods and will not cover random error, since the proposed model just considers the technology of the NDE method. The accuracy of the NDE methods discussed in the previous section for evaluating the corrosion and section loss has been reflected qualitatively in Table 2 based on available literature [9,14,16,41,43]. The proposed model in this paper has four accuracy levels: Very Good, Good, Fair, and Poor. In the proposed model, σ R represents the accuracy of the NDE method. Very Good defines the evaluation method which reports the SNBI rating by a five sigma (5σ) confidence level according to quality control process terminology [10]. This is equivalent to the vicinity of an SNBI rating within a radius of one accordingly. Good, Fair, and Poor refer to the NDE methods that report the SNBI rating by a confidence level of 4σ, 3σ, and 2σ, respectively. Figure 11 schematically shows the probability density function related to classification of the accuracy levels in the NDE methods. The degree of freedom related to the t-distribution of the condition reported by the NDE method (R) is considered nine (9). In the absence of reliable experimentation to define a unified accuracy level as described above for NDE methods, the qualitative accuracy scale reported in Table 2 based on the available literature will be used within the RBSIM framework.

3.3. Two-Stage Inspection Methods

In practice, it may be quite beneficial to inspect the post-tensioning system with an NDE method as the primary inspection, identifying the potential defects for further investigation using a secondary inspection with another NDE method. In this paper, this is called the “two-stage” inspection method [72]. The accuracy of the two-stage inspection method is a question to be answered, since only detected defects are investigated in secondary inspection. On one hand, the accuracy of the method in secondary inspection should be more than the primary inspection logically. On the other hand, the error of both the NDE methods are independent of each other, hence the possibility of the error while applying both methods will be achieved using the Bayesian theorem [73]. To investigate the accuracy of the combined method, the ratio of the post-tensioning elements that participate in the secondary inspection is needed. In practice, inspectors put a criterion for sending the detected defects to secondary inspection. Such a criterion is based on the policy at the inspection; however, since the goal of this paper is to propose the model to select the inspection method for structural health monitoring of a post-tensioning system, deterioration of the elements is considered. In practice, in the two-stage inspection method, the inspector sends all the elements with a detected defect with respect to deterioration; any element with sign of corrosion and section loss will be sent to secondary inspection for further investigation.
The SNBI rating that the first clues of deterioration are named is R = 6. The probability of having the result of the NDE report equal to or less than the specified criterion regarding the deterioration P R 6 is considered as the ratio of the post-tensioning elements that will be sent to secondary inspection. Considering the levels of accuracy in Table 2, it can be shown that with a secondary NDE method more accurate than the primary inspection, the accuracy of the two-stage inspection will be increased. Table 3 shows how the accuracy can be improved when using a two-stage method. The table is arranged for two NDE methods, the second (Column 2) with a better accuracy than the first (Column 1) for the condition of the structure/post-tensioning system being in one of 6, 7, or 8. The table compares the increased accuracy by the proposed model and calculates accuracy with respect to the condition of the post-tensioning system. Nevertheless, the accuracy of the two-stage inspection method can be considered one level more than the accuracy of the primary inspection for the cases where the SNBI rating of the post-tensioning system is equal or less than seven (7); for instance, the accuracy of the two-stage inspection method can be considered “Good”, while it is the combination of a primary inspection method with “Fair” accuracy and a secondary inspection method with “Good/Very Good” accuracy. This means that if the condition of the post-tensioning system is “Excellent” or “Very Good”, the application of the two-stage inspection cannot increase the accuracy of the whole procedure since the possibility of utilization of the secondary inspection is very low. Additionally, if the accuracy of the primary inspection is “Good”, the accuracy of the two-stage inspection will be considered “Good” for conditions with an SNBI rating of equal or less than seven (7).
There are three criteria involved in the calculation of results in Table 3: accuracy of the primary and secondary inspections, condition of the post-tensioning system, and the accuracy in determining this condition. In Table 3, for “TRUE Diagnosis”, it is assumed that the accuracy of determining the condition is “Poor”. Further, in this table, the accuracy of the secondary NDE method is better than the primary method. For example, a “Poor” primary inspection should be combined with a “Fair,” “Good,” or “Very Good” for the secondary method. By considering the accuracy of determining the condition as poor, the calculations in Table 3 are, therefore, conservative and that with more accuracy in determining the condition of the post-tensioning system, the accuracy of the two-stage inspection method will increase. The results show that the two-stage inspection method as shown in this table increases the accuracy of the NDE method for conditions with an SNBI rating of equal or less than seven (7).

3.4. Calculation of the Risk for Selection of Inspection Method

The integrated risk for the selection of the inspection method is the trade-off between the risk of the false negative inspection report and the cost of the inspection/NDE method, which is defined in Equation (5):
Risk Total = P error × Consequence + Cost Inspection/NDE
Equation (5) represents the total integrated risk corresponding to the decision for selection of the inspection method. Perror is the probability of a false negative inspection report that was calculated by Equation (4). Consequences of the false negative inspection report varies from case to case and should be investigated on case-by-case basis. In the field of bridge engineering, the consequence can be defined as bridge replacement cost, or its combination with social, environmental, and economic cost associated with the failure. The cost of inspection is the direct cost of the implementation of inspection/NDE method. When the risk is calculated using Equation (5) for available NDE methods, the NDE method with the minimum RiskTotal is selected for the inspection of the bridge/post-tensioning system.
To illustrate the relationship between parameters in risk evaluation, Perror can be estimated using Equation (4) for various combinations of NDE accuracy (Very Good/Good/Fair/Low) and SNBI condition rating and its standard deviation (e.g., Condition Rating 4 − σc = 0.5 refers to a case with SNBI rating of 4 determined with standard deviation of 0.5). The results of this calculation for the case of significant change observed in spot inspection is shown with the chart in Figure 12. This chart can be used to estimate Perror for the evaluation and selection of the inspection method for any post-tensioning system to be inspected.

4. Application of RBSIM for Selection of Inspection Method, a Case Study

The proposed methodology was applied to a case of an actual bridge structure inspected by the authors. The main bridge structure crosses a wide river connecting City X and City Y on two sides of the river. Approaching the main structure on City Y side are viaducts connected to approach ramps and access roads on embankments on either side. During a routine inspection of the bridge, problems were detected in the post-tensioning tendons in the approach spans. Making a decision on the selection of the inspection method among the methods available to the owner was challenging. To address the situation, the RBSIM procedure as shown in Figure 1 was followed. The steps are shown below, description follows in the next sections, and the results are shown in Table 4 and Table 5.
  • Review of the last inspection report ( C ^ t = 3 )
  • Conducting Kolmogorov–Smirnov test to verify normal distribution
  • Conducting the spot inspection ( C ¯ t = 8 )
  • Conducting test hypothesis to see if the condition change is significant
  • Identifying available NDE methods and estimating cost
  • Calculating joint probability density function Perror for available NDE methods
  • Determining the consequences of a false negative report
  • Calculating risk corresponding to available NDE methods
  • Selecting the inspection method with minimum risk

4.1. Spot Inspection and Sample Size

Spot inspection was planned to examine the current condition of the post-tensioning system. The bridge structure was divided into nine zones, City X East approach, City X West approach, City Y East approach, City Y West approach, City Y-Ramp A, City Y-Ramp B, City Y-Ramp C, City Y-Ramp D, and the Main Bridge. Each zone was investigated independently to consider the local possible environmental, construction, structural, and material parameters affecting the health of the post-tensioning system. Sounding was used to evaluate the current condition of the tendons ( C ¯ ) . Table 4 shows the zones, the number of tendons in each zone, the corresponding sample size, the statistical parameters, and the results of the test hypothesis.
All in all, it was observed that the condition of the post-tensioning system has significantly changed since the last report; therefore, it was decided to inspect the post-tensioning system using the NDE methods. Figure 13 shows the investigators conducting a spot inspection at the bridge.

4.2. Determination of Consequences for Risk Analysis

The consequences of a bridge failure can be devastating. The cost of reconstructing a structure is generally significant, but the loss of functionality that can have an impact on the surrounding area in terms of environmental harm and economic losses, among other things, can result in far larger expenses. However, in the structural risk and reliability analysis of the bridge of the case study, for simplicity, the bridge construction cost/bridge value is considered as the consequence of failure similar to some of the available literature [1,74]. To establish a correspondence between bridge failure and condition rating, the condition rating of equal or less than three (3) was basically interpreted as failed/obsolete bridge. Also, as described earlier, the probability of a false negative inspection report is equated with a condition rating of equal or less than three (3). Therefore, it can be assumed that the consequence of a false negative inspection report is the same as consequence of bridge failure.
The risk and reliability analysis of bridges normally involves a combination of structural systems. For instance, in the bridge of the case study, three different structural systems most influential in the bridge load carrying capacity are external post-tensioning system, deck system (in main bridge and approaches), and cable stay system (in main bridge only). Therefore, the structural capacity and redundancy analysis of the bridge should include the combination of these systems. However, for cases such as that studied in this research, where one system is deemed to be most critical in load carrying capacity, or if the defects and damages are proven to be concentrated in one system, the focus can remain on the critical system, and the contribution of the other systems can be conservatively ignored. This will also simplify the analysis. This is why the study has focused on the external post-tensioning system. Therefore, the failure of the post-tensioning system is assumed as the failure of the whole bridge structure.

4.3. Selection of Inspection Method, Application, and Results

Based on the results of the test hypothesis in Table 4, since the p-Value is less than 0.1, the change in the condition of the post-tensioning system points to significant deterioration. Therefore, the spot inspection results C ¯ shall be considered as the current condition of the post-tensioning system, and Equation (3) shall be used. In other words, the last inspection report ( C ^ ) of post-tensioning system was deemed invalid; hence, it was replaced by the spot inspection result. Furthermore, a Kolmogorov–Smirnov test was conducted on the spot inspection results. It was verified that the distribution of condition is normal and confirms prior analysis assumption. Available NDE methods in the region where the bridge is located included visual inspection, sounding, impulse response, ultrasonic\Pulse-Echo, vibration response, passive infrared thermography, Residual Magnetic Flux, X-Ray and 2 two-stage inspection methods which are sounding-borescope and sounding-radiography. These methods are listed in Table 5 with the corresponding basic estimate.
To apply the proposed risk-based selection of the inspection method, accuracy of the available NDE methods from Table 2 and the results of spot inspection C ¯ from Table 4 were used. The joint probability density function according to Equation (4) was calculated for available NDE methods and is reflected as “Perror” in Table 5. In this table, “Cpi”, “Csi”, and “CTi” represent the cost of primary, secondary, and total inspection, respectively. The column under “Risk Error” in this table introduces the risk of false negative inspection reports corresponding to each NDE method based on the probability and the consequences. The total risk in Table 5 is calculated as the sum of the “Risk Error” and the total cost for each NDE method. The two-stage inspection that includes sounding-borescope was identified with the minimum total risk, based on the analysis. The results of the study were presented to the bridge owners and a conclusion for using the sounding-borescope method was approved. Accordingly, all external post-tensioning elements were inspected first using the sounding method. The elements in which defects were detected were included for further investigation and suspect locations along the post-tensioning elements were marked for further investigation (See Figure 14). The suspect locations were dissected for application of the second stage of inspection, i.e., the use of a borescope (See Figure 15). In this manner, the condition of the post-tensioning system in each structural zone was evaluated and remedial actions were recommended to the bridge owners for implementation. These actions included the repair of a large number of elements and the replacement of a portion of the post-tensioning elements.

5. Summary and Conclusions

Post-tensioning elements play a critical role in the structural integrity of post-tensioned bridges and their inspection is important for the maintenance of these bridges. However, the selection of inspection method for a condition rating of these elements has been rather subjective, relying mostly on the experience of the inspectors. A unified and reliable risk-based selection method is, however, lacking. Such risk-based methods should rely on the success and accuracy of the inspection method for detecting defects and risk/consequence for lower accuracy or false negative results. Towards addressing this knowledge gap, a study was conducted exploring practical means and a procedure for the risk-based selection of the inspection method. Since corrosion is the major deteriorating factor for post-tensioning elements, this study focused on inspection methods capable of detecting corrosion of the main tension steel elements. Twenty-nine NDE methods were reviewed and classified under nine main categories for their applicability and corresponding accuracy. A risk-based selection of the inspection method (RBSIM) was developed based on NSBI condition rating scales and the accuracy levels for NDE methods obtained from the literature. For calculating risk, the consequence of a false negative inspection was equated to bridge failure. To demonstrate the process, the proposed RBSIM framework was used to select the inspection method for a case study bridge. Among ten available NDE methods, a two-stage inspection method was selected because of its minimum risk calculated by the procedure. The recommended method was implemented successfully for the bridge of the case study identifying damage and defects requiring remedial actions recommended to the bridge owners.

Author Contributions

Conceptualization, M.T. and A.B.M.; methodology, M.T. and A.B.M.; formal analysis, M.T. and A.B.M.; resources, M.T. and A.B.M.; writing—original draft preparation, M.T.; writing—review and editing, M.T. and A.B.M.; supervision, A.B.M. All authors have read and agreed to the published version of the manuscript.

Funding

This research received no external funding.

Institutional Review Board Statement

Not applicable.

Informed Consent Statement

Not applicable.

Data Availability Statement

The data presented in this study are available on request from the corresponding author.

Conflicts of Interest

The authors declare that they have no known competing financial interest or personal relationships that could have appeared to influence the work reported in this paper.

References

  1. Decò, A.; Frangopol, D.M. Risk assessment of highway bridges under multiple hazards. J. Risk Res. 2011, 14, 1057–1089. [Google Scholar] [CrossRef]
  2. Khatami, D.; Shafei, B.; Smadi, O. Management of Bridges under Aging Mechanisms and Extreme Events: Risk-Based Approach. Transp. Res. Rec. 2016, 2550, 89–95. [Google Scholar] [CrossRef]
  3. Saydam, D.; Frangopol, D.M. Risk-Based Maintenance Optimization of Deteriorating Bridges. J. Struct. Eng. 2015, 141, 4014120. [Google Scholar] [CrossRef]
  4. Ellingwood, B.R. Acceptable risk bases for design of structures. Prog. Struct. Eng. Mater. 2001, 3, 170–179. [Google Scholar] [CrossRef]
  5. Abrahamsen, T.A.E. On the use of cost-benefit analysis in ALARP processes. Int. J. Perform. Eng. 2007, 3, 345. [Google Scholar]
  6. Abdallah, A.M.; Atadero, R.A.; Ozbek, M.E. A Comprehensive Uncertainty-Based Framework for Inspection Planning of Highway Bridges. Infrastructures 2021, 6, 27. [Google Scholar] [CrossRef]
  7. Tabatabai, H. Inspection and Maintenance of Bridge Stay Cable Systems: A Synthesis of Highway Practice; Transportation Research Board: Washington, DC, USA, 2005. [Google Scholar]
  8. Mehrabi, A.B.; Ligozio, C.A.; Ciolko, A.T.; Wyatt, S.T. Condition assessment, rehabilitation planning, and stay cable replacement design for the Hale Boggs Bridge in Luling, Louisiana. In Proceedings of the International Bridge and Structure Management Conference, Buffalo, NY, USA, 20–22 October 2008; pp. 215–233. [Google Scholar]
  9. Hurlebaus, S.; Hueste, M.; Karthik, M.M.; Terzioglu, T. Condition assessment of bridge post-tensioning and stay cable systems using NDE methods. In Transportation Research Board of the National Academies; Texas A&M Transportation Institute: College Station, TX, USA, 2016. [Google Scholar]
  10. Ott/Longnecker. Introduction to Statistical Methods and Data Analysis; Cengage Learning: Boston, MA, USA, 2015. [Google Scholar]
  11. Chen, W.; Duan, L. Bridge Engineering Handbook: (Construction and Maintenance); CRC Press: Boca Raton, FL, USA, 2019. [Google Scholar]
  12. Burdet, O.; Badoux, M. Long-Term Deflection Monitoring of Prestressed Concrete Bridges Retrofitted by External Post-Tensioning—Examples from Switzerland; IABSE: Zürich, Switzerland, 2007. [Google Scholar]
  13. Suntharavadivel, T.G.; Aravinthan, T. Overview of external post-tensioning in bridges. In Proceedings of the 2005 Southern Region Engineering Conference (SREC 2005), Toowoomba, Queensland, 15 October 2005. [Google Scholar]
  14. Terzioglu, T.; Karthik, M.M.; Hurlebaus, S.; Hueste, M.B.D. Nondestructive Evaluation of External Post-Tensioning Systems to Detect Grout Defects. J. Struct. Eng. 2019, 145, 5018002. [Google Scholar] [CrossRef]
  15. Permeh, S.; Krishna Vigneshwaran, K.K.; Lau, K.; Lasa, I. Corrosion of Post-Tensioned Tendons with Deficient Grout, Part 3: Segregated Grout with Elevated Sulfate and Vestigial Chloride Content. Corrosion 2019, 75, 848–864. [Google Scholar] [CrossRef]
  16. Azizinamini, A.; Gull, J. FDOT Protocol for Condition Assessment of Steel Strands in Post-Tensioned Segmental Concrete Bridges: Volume II; Florida Department of Transportation (FDOT): Tallahassee, FL, USA, 2012. [Google Scholar]
  17. Trejo, D.; Pillai, R.G.; Hueste, M.B.; Reinschmidt, K.F.; Gardoni, P. Parameters Influencing Corrosion and Tension Capacity of Post-Tensioning Strands. ACI Mater. J. 2009, 106, 144. [Google Scholar]
  18. Freyermuth, C.L.; Harder, J.; Webster, N. Status of the durability of post-tensioning tendons in the United States. BULLETIN-FIB 2001, 15, 43–50. [Google Scholar]
  19. Lau, K.; Lasa, I. Corrosion of Steel in Concrete Structures; Poursaee, A., Ed.; Woodhead Publishing: Cambridge, UK, 2016; pp. 37–57. [Google Scholar]
  20. Minh, H.; Mutsuyoshi, H.; Niitani, K. Influence of grouting condition on crack and load-carrying capacity of post-tensioned concrete beam due to chloride-induced corrosion. Constr. Build. Mater. 2007, 21, 1568–1575. [Google Scholar] [CrossRef]
  21. Andersen, U.S.; Nielsen, H. Assessment and repair of bridges subjected to de-icing salts. Routes/Roads 2014, 361, 82–89. [Google Scholar]
  22. Woodward, R.J. Collapse of a segmental post-tensioned concrete bridge. In Transportation Research Record; Transportation Research Board, National Research Council: Washington, DC, USA, 1989; Volume 1211. [Google Scholar]
  23. FHWA. Post-Tensioning Tendon Installation and Grouting Manual; Federal Highway Administration: Washington, DC, USA, 2013; p. 184. [Google Scholar]
  24. Perrin, M.; Gaillet, L.; Tessier, C.; Idrissi, H. Hydrogen embrittlement of prestressing cables. Corros. Sci. 2010, 52, 1915–1926. [Google Scholar] [CrossRef]
  25. ACI Committee 222. ACI Report on Corrosion of Prestressing Steels; American Concrete Institute: Farmington Hills, MI, USA, 2014. [Google Scholar]
  26. Lau, K.; Rafols, J.; Lasa, I.; Paredes, M. Laboratory Corrosion Assessment of Post-Tensioned Tendons Repaired with Dissimilar Grout; CORROSION: Orlando, FL, USA, 2013. [Google Scholar]
  27. Ramadan, S.; Gaillet, L.; Tessier, C.; Idrissi, H. Detection of stress corrosion cracking of high-strength steel used in prestressed concrete structures by acoustic emission technique. Appl. Surf. Sci. 2008, 254, 2255–2261. [Google Scholar] [CrossRef]
  28. Yang, D.; Yi, T.; Li, H. Coupled Fatigue-Corrosion Failure Analysis and Performance Assessment of RC Bridge Deck Slabs. J. Bridge Eng. 2017, 22, 4017077. [Google Scholar] [CrossRef]
  29. Remitz, J.; Empelmann, M. Cyclic tensile tests on prestressing strands embedded in concrete. Mater. Struct. 2020, 53, 53. [Google Scholar] [CrossRef]
  30. Krishna Vigneshwaran, K.K.; Permeh, S.; Echeverría, M.; Lau, K.; Lasa, I. Corrosion of Post-Tensioned Tendons with Deficient Grout, Part 1: Electrochemical Behavior of Steel in Alkaline Sulfate Solutions. Corrosion 2018, 74, 362–371. [Google Scholar] [CrossRef]
  31. Permeh, S.; Krishna Vigneshwaran, K.K.; Echeverría, M.; Lau, K.; Lasa, I. Corrosion of Post-Tensioned Tendons with Deficient Grout, Part 2: Segregated Grout with Elevated Sulfate Content. Corrosion 2018, 74, 457–467. [Google Scholar] [CrossRef] [Green Version]
  32. Angst, U.M. Challenges and opportunities in corrosion of steel in concrete. Mater. Struct. 2018, 51, 1–20. [Google Scholar] [CrossRef] [Green Version]
  33. Freij, H.; Dukeman, D.; Alexander, C.L.; Sagüés, A.A. Practical Cross-Section Imaging of External Tendons to Reveal Grout Deficiencies Relative to Strand Pattern. J. Bridge Eng. 2020, 25, 4020100. [Google Scholar] [CrossRef]
  34. Permeh, S.; Lau, K. Review of Electrochemical Testing to Assess Corrosion of Post-Tensioned Tendons with Segregated Grout. Constr. Mater. 2022, 2, 70–84. [Google Scholar] [CrossRef]
  35. Lee, J.K. Structural Responses of External Post-Tensioned Tendons to Increasing Localized Damage. ACI Struct. J. 2017, 114, 1155. [Google Scholar] [CrossRef]
  36. Dolati, S.S.K.; Mehrabi, A.; Dolati, S.S.K.; Caluk, N. NDT methods for damage detection in steel bridges. In Health Monitoring of Structural and Biological Systems XVI; SPIE: Bellingham, WA, USA, 2022; Volume 12048, pp. 385–394. [Google Scholar]
  37. Dolati, S.S.K.; Malla, P.; Mehrabi, A.; Polanco, J.O.; Nanni, A. Non-destructive testing applications for in-service FRP reinforced/strengthened concrete bridge elements. In Nondestructive Characterization and Monitoring of Advanced Materials, Aerospace, Civil Infrastructure, and Transportation XVI; SPIE: Bellingham, WA, USA, 2022; Volume 12047, pp. 59–74. [Google Scholar]
  38. Khedmatgozar Dolati, S.S.; Caluk, N.; Mehrabi, A.; Khedmatgozar Dolati, S.S. Non-Destructive Testing Applications for Steel Bridges. Appl. Sci. 2021, 11, 9757. [Google Scholar] [CrossRef]
  39. Phares, B.M.; Rolander, D.D.; Graybeal, B.A.; Washer, G.A. Reliability of visual bridge inspection. Public Roads 2001, 64, 22–29. [Google Scholar]
  40. Hurlebaus, S.; Hueste, M.B.D.; Karthik, M.M.; Terzioglu, T. Inspection Guidelines for Bridge Post-Tensioning and Stay Cable Systems Using NDE Methods; Transportation Research Board: Washington, DC, USA, 2017. [Google Scholar]
  41. Im, S.B.; Hurlebaus, S.; Trejo, D. Inspection of Voids in External Tendons of Posttensioned Bridges. Transp. Res. Rec. 2010, 2172, 115–122. [Google Scholar] [CrossRef]
  42. Sharp, S.R.; Ozyildirim, H.C. Nondestructive Measurements Using Mechanical Waves in Reinforced Concrete Structures; Virginia Department of Transportation: Richmond, VA, USA, 2014. [Google Scholar]
  43. Im, S.B.; Hurlebaus, S. Non-destructive testing methods to identify voids in external post-tensioned tendons. KSCE J. Civ. Eng. 2012, 16, 388–397. [Google Scholar] [CrossRef]
  44. Ebrahimkhanlou, A.; Choi, J.; Hrynyk, T.D.; Salamone, S.; Bayrak, O. Acoustic emission monitoring of containment structures during post-tensioning. Eng. Struct. 2020, 209, 109930. [Google Scholar] [CrossRef]
  45. Sajid, S.; Chouinard, L. Impulse response test for condition assessment of concrete: A review. Constr. Build. Mater. 2019, 211, 317–328. [Google Scholar] [CrossRef]
  46. Tinkey, Y.; Olson, L.D. Sensitivity Studies of Grout Defects in Posttensioned Bridge Ducts Using Impact Echo Scanning Method. Transp. Res. Rec. 2007, 2028, 154–162. [Google Scholar] [CrossRef]
  47. Muldoon, R.; Chalker, A.; Forde, M.C.; Ohtsu, M.; Kunisue, F. Identifying voids in plastic ducts in post-tensioning prestressed concrete members by resonant frequency of impact–echo, SIBIE and tomography. Constr. Build. Mater. 2007, 21, 527–537. [Google Scholar] [CrossRef]
  48. Beard, M.D.; Lowe, M.J.S.; Cawley, P. Ultrasonic Guided Waves for Inspection of Grouted Tendons and Bolts. J. Mater. Civ. Eng. 2003, 15, 212–218. [Google Scholar] [CrossRef]
  49. Pavlakovic, B.; Lowe, M.; Cawley, P. Guided Ultrasonic Waves for the Inspection of Post-Tensioned Bridges. In Review of Progress in Quantitative Nondestructive Evaluation; Springer: Boston, MA, USA, 1998. [Google Scholar]
  50. Musgrove, R.R. Nondestructive Detection of Post-Tensioning Tendons and Simulated Voids in Concrete Specimens Using Thermal Imaging. Doctoral Dissertation, Washington State University, Pullman, WA, USA, 2006. [Google Scholar]
  51. Novokshchenov, V. Corrosion Surveys of Prestressed Bridge Members Using a Half-Cell Potential Technique. Corrosion 1997, 53, 489–498. [Google Scholar] [CrossRef]
  52. Pacheco, A.R.; Schokker, A.J.; Volz, J.S.; Hamilton, H.R. Linear Polarization Resistance Tests on Corrosion Protection Degree of Post-Tensioning Grouts. ACI Mater. J. 2011, 108, 365. [Google Scholar]
  53. Alexander, C.L.; Orazem, M.E. Indirect electrochemical impedance spectroscopy for corrosion detection in external post-tensioned tendons: 1. Proof of concept. Corros. Sci. 2020, 164, 108331. [Google Scholar] [CrossRef]
  54. Karthik, M.M.; Terzioglu, T.; Hurlebaus, S.; Hueste, M.B.; Weischedel, H.; Stamm, R. Magnetic flux leakage technique to detect loss in metallic area in external post-tensioning systems. Eng. Struct. 2019, 201, 109765. [Google Scholar] [CrossRef]
  55. Kim, J.; Park, S. Field applicability of a machine learning–based tensile force estimation for pre-stressed concrete bridges using an embedded elasto-magnetic sensor. Struct. Health Monit. 2020, 19, 281–292. [Google Scholar] [CrossRef]
  56. Changdoga, M.; Jarosevic, A. Health Monitoring of the Prestressing Steel Using the Elasto-Magnetic Method. In Proceedings of the 3rd ACF International Conference-ACF/VCA, Ho Chi Minh City, Vietnam, 11–13 November 2008; pp. 910–917. [Google Scholar]
  57. Matt, P. Non-destructive evaluation and monitoring of post-tensioning tendons. BULLETIN-FIB 2001, 15, 103–108. [Google Scholar]
  58. Pimentel, M.; Figueiras, J.; Mariscotti, M.; Thieberger, P.; Ruffolo, L.M.; Frigerio, T. Gamma-ray inspection of post tensioning cables in a concrete bridge. Struct. Faults Repair 2010, 2010, 1–8. [Google Scholar]
  59. Freij, H.; Dukeman, D.; Alexander, C.L.; Ruffolo, M.D.; Frigerio, T.; Boselli, J.; Mariscotti, M.A.J.; Sagüés, A.A. Comparison of novel imaging sensor and gamma ray tomography imaging of grout deficiencies in external post-tensioned structural tendons. NDT E Int. Indep. Nondestruct. Test. Eval. 2021, 117, 102368. [Google Scholar] [CrossRef]
  60. Stain, R.T.; Dixon, S. Inspection of cables in post-tensioned bridges. Constr. Repair 1994, 8, 38–40. [Google Scholar]
  61. Duke, J.C. Health Monitoring of Post-Tension Tendons in Bridges; Virginia Transportation Research Council: Charlottesville, VA, USA, 2003. [Google Scholar]
  62. Olund, J.; DeWolf, J. Passive Structural Health Monitoring of Connecticut’s Bridge Infrastructure. J. Infrastruct. Syst. 2007, 13, 330–339. [Google Scholar] [CrossRef]
  63. Ferguson Structural Engineering Laboratory. Installation of Strain Gages on Prestressing Strands; Ferguson Structural Engineering Laboratory: Austin, TX, USA, 2016. [Google Scholar]
  64. Hesse, A.A.; Atadero, R.A.; Ozbek, M.E. Uncertainty in Common NDE Techniques for Use in Risk-Based Bridge Inspection Planning: Existing Data. J. Bridge Eng. 2015, 20, 4015004. [Google Scholar] [CrossRef]
  65. Omar, T.; Nehdi, M.L.; Zayed, T. Performance of NDT Techniques in Appraising Condition of Reinforced Concrete Bridge Decks. J. Perform. Constr. Facil. 2017, 31, 4017104. [Google Scholar] [CrossRef]
  66. Martin, J.; Hardy, M.S.A.; Usmani, A.S.; Forde, M.C. Accuracy of NDE in bridge assessment. Eng. Struct. 1998, 20, 979–984. [Google Scholar] [CrossRef]
  67. Estes, A.C.; Frangopol, D.M. Bridge Lifetime System Reliability under Multiple Limit States. J. Bridge Eng. 2001, 6, 523–528. [Google Scholar] [CrossRef]
  68. Frangopol, D.M.; Dong, Y.; Sabatino, S. Bridge life-cycle performance and cost: Analysis, prediction, optimisation and decision-making. Struct. Infrastruct. Eng. 2017, 13, 1239–1257. [Google Scholar] [CrossRef]
  69. Yang, D.Y.; Frangopol, D.M. Risk-Informed Bridge Ranking at Project and Network Levels. J. Infrastruct. Syst. 2018, 24, 4018018. [Google Scholar] [CrossRef]
  70. FHWA. Specifications for the National Bridge Inventory; Federal Highway Administration: Washington, DC, USA, 2022. [Google Scholar]
  71. McCoy, K.M. Non-Destructive Evaluation of Bridge Stay Cable and External Post Tensioning Systems. Doctoral Dissertation, Texas A&M University, College Station, TX, USA, 2014. [Google Scholar]
  72. Sheils, E.; O’Connor, A.; Breysse, D.; Schoefs, F.; Yotte, S. Development of a two-stage inspection process for the assessment of deteriorating infrastructure. Reliab. Eng. Syst. Saf. 2010, 95, 182–194. [Google Scholar] [CrossRef] [Green Version]
  73. Li, M.; Jia, G. Bayesian Updating of Bridge Condition Deterioration Models Using Complete and Incomplete Inspection Data. J. Bridge Eng. 2020, 25, 4020007. [Google Scholar] [CrossRef]
  74. Andrić, J.M.; Lu, D. Risk assessment of bridges under multiple hazards in operation period. Saf. Sci. 2016, 83, 80–92. [Google Scholar] [CrossRef]
Figure 1. General procedure for risk-based selection of inspection method.
Applsci 12 07103 g001
Figure 2. Classification of factors involved in corrosion of external post-tensioning system.
Applsci 12 07103 g002
Figure 3. Classification of NDE methods applicable to external post-tensioning system.
Applsci 12 07103 g003
Figure 4. Sounding used for spot inspection.
Applsci 12 07103 g004
Figure 5. Photo captured by infrared thermography with interpretation [9].
Applsci 12 07103 g005
Figure 6. Electrochemical impedance spectrometer [9].
Applsci 12 07103 g006
Figure 7. Magnetic flux leakage (a) sensor probe, (b) full head sensor, (c) half head sensor, (d) the connection of the NDE extension to the computer [9].
Applsci 12 07103 g007aApplsci 12 07103 g007b
Figure 8. Photo captured by ground penetration radar [9].
Applsci 12 07103 g008
Figure 9. Photo captured by gamma-ray with interpretation [9].
Applsci 12 07103 g009
Figure 10. Strain gauge on the post-tensioning strand [9].
Applsci 12 07103 g010
Figure 11. Accuracy Levels of NDE methods.
Applsci 12 07103 g011
Figure 12. Probability of false negative inspection report (Perror) based on involved parameters.
Applsci 12 07103 g012
Figure 13. Spot inspection activities (case study) to verify the current condition of the bridge; (a) one of defected external tendons, (b) inspectors during spot inspection.
Applsci 12 07103 g013
Figure 14. Marking suspect locations along post-tensioning elements.
Applsci 12 07103 g014
Figure 15. Activities during the second stage of two-stage inspection. (a) application of video-borescope, (b) a sample of steel photo captured by borescope.
Applsci 12 07103 g015
Table 1. Condition rating proposed for external post-tensioning tendons adapted based on SNBI rating.
RatingConditionDescription of the Condition
9ExcellentExcellent.
8Very GoodNo problems were noted with corrosion protection barriers and no sign of water or moisture infiltration.
7GoodSome minor problems with corrosion protection barriers.
6SatisfactoryMajor issues exist with corrosion protection barriers; the potential for water infiltration and steel corrosion initiation exists. Corrective action for restoring the barriers can prevent damage to main steel tension elements.
5FairMain steel tension elements of the post-tensioning system show minor corrosion. Deterioration is active in post-tensioning elements.
4PoorAdvanced corrosion and deterioration of main steel tension elements exist.
3SeriousCorrosion, deterioration, and potential breakage of main tension elements have seriously affected external post-tensioning elements.
2CriticalAdvanced deterioration of external post-tensioning elements is apparent. The integrity of the structure may have been affected and may be necessary to close the bridge until corrective action is taken.
1Imminent FailureMajor deterioration or corrosion of the main tension elements of the post-tensioning system, or obvious vertical or horizontal movement affecting structural stability. The bridge is closed to traffic but corrective action may put back the bridge in light service.
0FailedOut of service—beyond corrective action.
Table 2. Accuracy of NDE methods applicable to external post-tensioning system.
NoClassAccuracy
1VisualPoor
2BorescopeGood
3SoundingFair
4Acoustic EmissionPoor
5Impulse ResponseFair
6Ultrasonic\Pulse-EchoGood
7Ultrasonic\Through TransmissionGood
8Ultrasonic\Linear ArrayGood
9Ultrasonic\Ultrasonic Guided WavesGood
10Vibraion ReponsePoor
11Impact EchoFair
12Passive Infrared ThermographyPoor
13Active Infrared ThermographyGood
14Half Cell PotentialGood
15Linear Polarization ResistanceVery Good
16Electrochemical Impedance SpectroscopyGood
17Magnetic Flux/Active Magnetic FluxGood
18Magnetic Flux/Residual Magnetic FluxGood
19Elasto-MagneticGood
20Electrical Capasitance TomographyGood
21MagnetosticsPoor
22Ground Penetration RadarPoor
23X-RayVery Good
24Gamma-RayVery Good
25Computed TomographyVery Good
26Notron BombartmentVery Good
27Air FlowFair
28Fiber Optic SensorFair
29AccelerometerPoor
30Strain GaugeFair
Table 3. Accuracy of two-stage inspection in different combinations of accuracy levels *.
Two-Stage InspectionTRUE Diagnosis; P(R ≤ C)Applied Accuracy
Primary InspectionSecondary InspectionC = 6C = 7C = 8
P(R ≤ 6) = 0.638P(R ≤ 6) = 0.362P(R ≤ 6) = 0.1575
PoorFair0.83920.7730.72390.7647Fair
PoorGood0.85220.78030.72710.7647Fair
PoorVery Good0.86990.79030.73140.7647Fair
FairGood0.88920.83540.79540.8295Good
FairVery Good0.90250.84290.79870.8295Good
GoodVery Good0.92930.88610.85410.8295Good
* Accuracy of condition is influential in table calculations. This table is set based on “Poor” accuracy for the condition of post-tensioning system (σc = 1.33).
Table 4. SNBI rating statistics in different zones of the bridge in the case study.
ZoneLast Inspection Report ( C ^ t = 3 )Spot Inspection Report ( C ¯ t = 8 )p-Value
Number of Tendons μ ^ c σ ^ c Sample Size μ ¯ c S ¯ c
City X East1228.20.7125.21.00.0000 a
City X West1188.20.8128.10.80.3442
City Y East847.40.696.90.80.0531 a
City Y West848.60.896.60.80.0000 a
City Y- Ramp A1428.10.7145.70.90.0000 a
City Y- Ramp B1468.20.8145.40.90.0000 a
City Y- Ramp C2427.20.7256.10.80.0000 a
City Y- Ramp D2428.20.5255.70.70.0000 a
Main Bridge407.70.886.30.80.0006 a
Total12207.90.81306.01.30.0000 a
ap-value is significant at 0.1000 level (1-tailed).
Table 5. Risk Analysis for Available NDE methods.
NoAvailable MethodsPerror (%)Risk Error (K$)Cpi (K$)Csi (K$)Cti (K$)Total Risk (K$)Remark
1Visual1.1228112350 501173
2Sounding0.8391839100 100939
3Impulse Response0.8391839300 3001139
4Ultrasonic\Pulse-Echo0.6329633300 300933
5Vibraion Reponse1.12801123100 1001223
6Infrared Termography\Passive1.12801123200 2001323
7Magnetic Flux\Residual Magnetic Flux0.6329633400 4001033
8Radiography\X-Ray0.4801480500 500980
9Sounding + Broscope0.6329633100127.6227.6860.6Min Risk
10Sounding + Radigraphy0.63296331003194191052
Publisher’s Note: MDPI stays neutral with regard to jurisdictional claims in published maps and institutional affiliations.

