1. Introduction
Dust accumulating on the surface of roads and streets (street dust and road dust) arouses great interest in researchers owing to the pollutants it contains, mainly heavy metals that may pose a threat to human health [
1,
2,
3,
4,
5,
6,
7]. Street dust is composed of mineral and organic particles of varying origin, including industrial sources and those related to vehicle traffic. The main components of the dust are quartz and feldspar, but it also contains heavy metals such as Cd, Cu, Pb and Zn. They originate from the exhaust fumes of car engines and the abrasion of various vehicle parts (tyres and brake discs), road pavements, or the overhead lines (used by trams, trolleybuses and trains). Heavy metals can also originate from operating fluids released from vehicles onto the street surface [
1,
3,
8,
9]. Ongoing studies indicate increased content of trace elements in street dust in urban areas (e.g., [
10,
11,
12,
13,
14]). Such increased concentrations are observed particularly in the case of lead, cadmium, copper, chromium, and nickel. Studies focus on big cities characterized by a high intensity of motor vehicle traffic and the presence of industrial emitters [
15,
16,
17,
18].
The geochemistry of street dust provides a wealth of information about the state of the urban environment. At the same time, street dust can be a health hazard due to its re-suspension. It becomes a component of ground level atmosphere, in the living zone of humans, plants and animals. Therefore, it can penetrate human organisms relatively easily and thus lead to the development of pathogenic processes [
6,
19,
20,
21]. The health risk assessments combine the volume of environmental pollution with the probability of its toxic effect on people. Hazard index (HI) and cancer risk (CR) are the most frequently used indices for a quantitative description of non-carcinogenic and carcinogenic risks related to human exposure to heavy metals contained in street dust [
22,
23,
24,
25,
26,
27,
28,
29,
30].
The objective of this study was to assess the spatial and temporal variation in health risk posed by heavy metals contained in street dust in the area of Lublin. The content of Cd, Cr, Cu, Ni, Pb and Zn, commonly regarded as the most serious sources of pollution in urban areas, was analysed [
6,
31,
32]. The heavy metal content in street dust in Lublin had already been studied [
32,
33]. There are no studies determining the spatial distribution of health risk within the city of Lublin. So far research on this problem has been conducted mainly in cities with a high impact of industrial emissions, which currently do not seem to be a very important source of pollution in Lublin. Our research fills the gap related to the health risks caused by heavy metals in street dust in medium-sized cities without an intensive industrial impact.
2. Materials and Methods
Lublin is located in the north-western part of the Lublin Upland, E Poland (51°08′23.31″–51°17′47.61″ N, 22°27′15.41″–22°40′24.75″ E). The city covers an area of about 150 km
2 and is inhabited by about 350,000 people. In the second half of the twentieth century, several major industrial plants operated there. Today, the city is primarily an academic, administrative and service centre. At present, mainly the food industry (for example, a brewery and a pasta factory) is developing there. There are also a few not very large pharmaceutical, agricultural machinery and chemical plants. All of them are concentrated in the eastern part of the city, which means, given the prevailing western winds, that the emissions of industrial pollution do not have too big an impact on the state of the environment in the city. The conducted research indicates a relatively low level of contamination of soils and street dust with trace metals [
32,
34,
35]. Currently, no measurements of heavy metal emissions to the atmosphere have been carried out in Lublin.
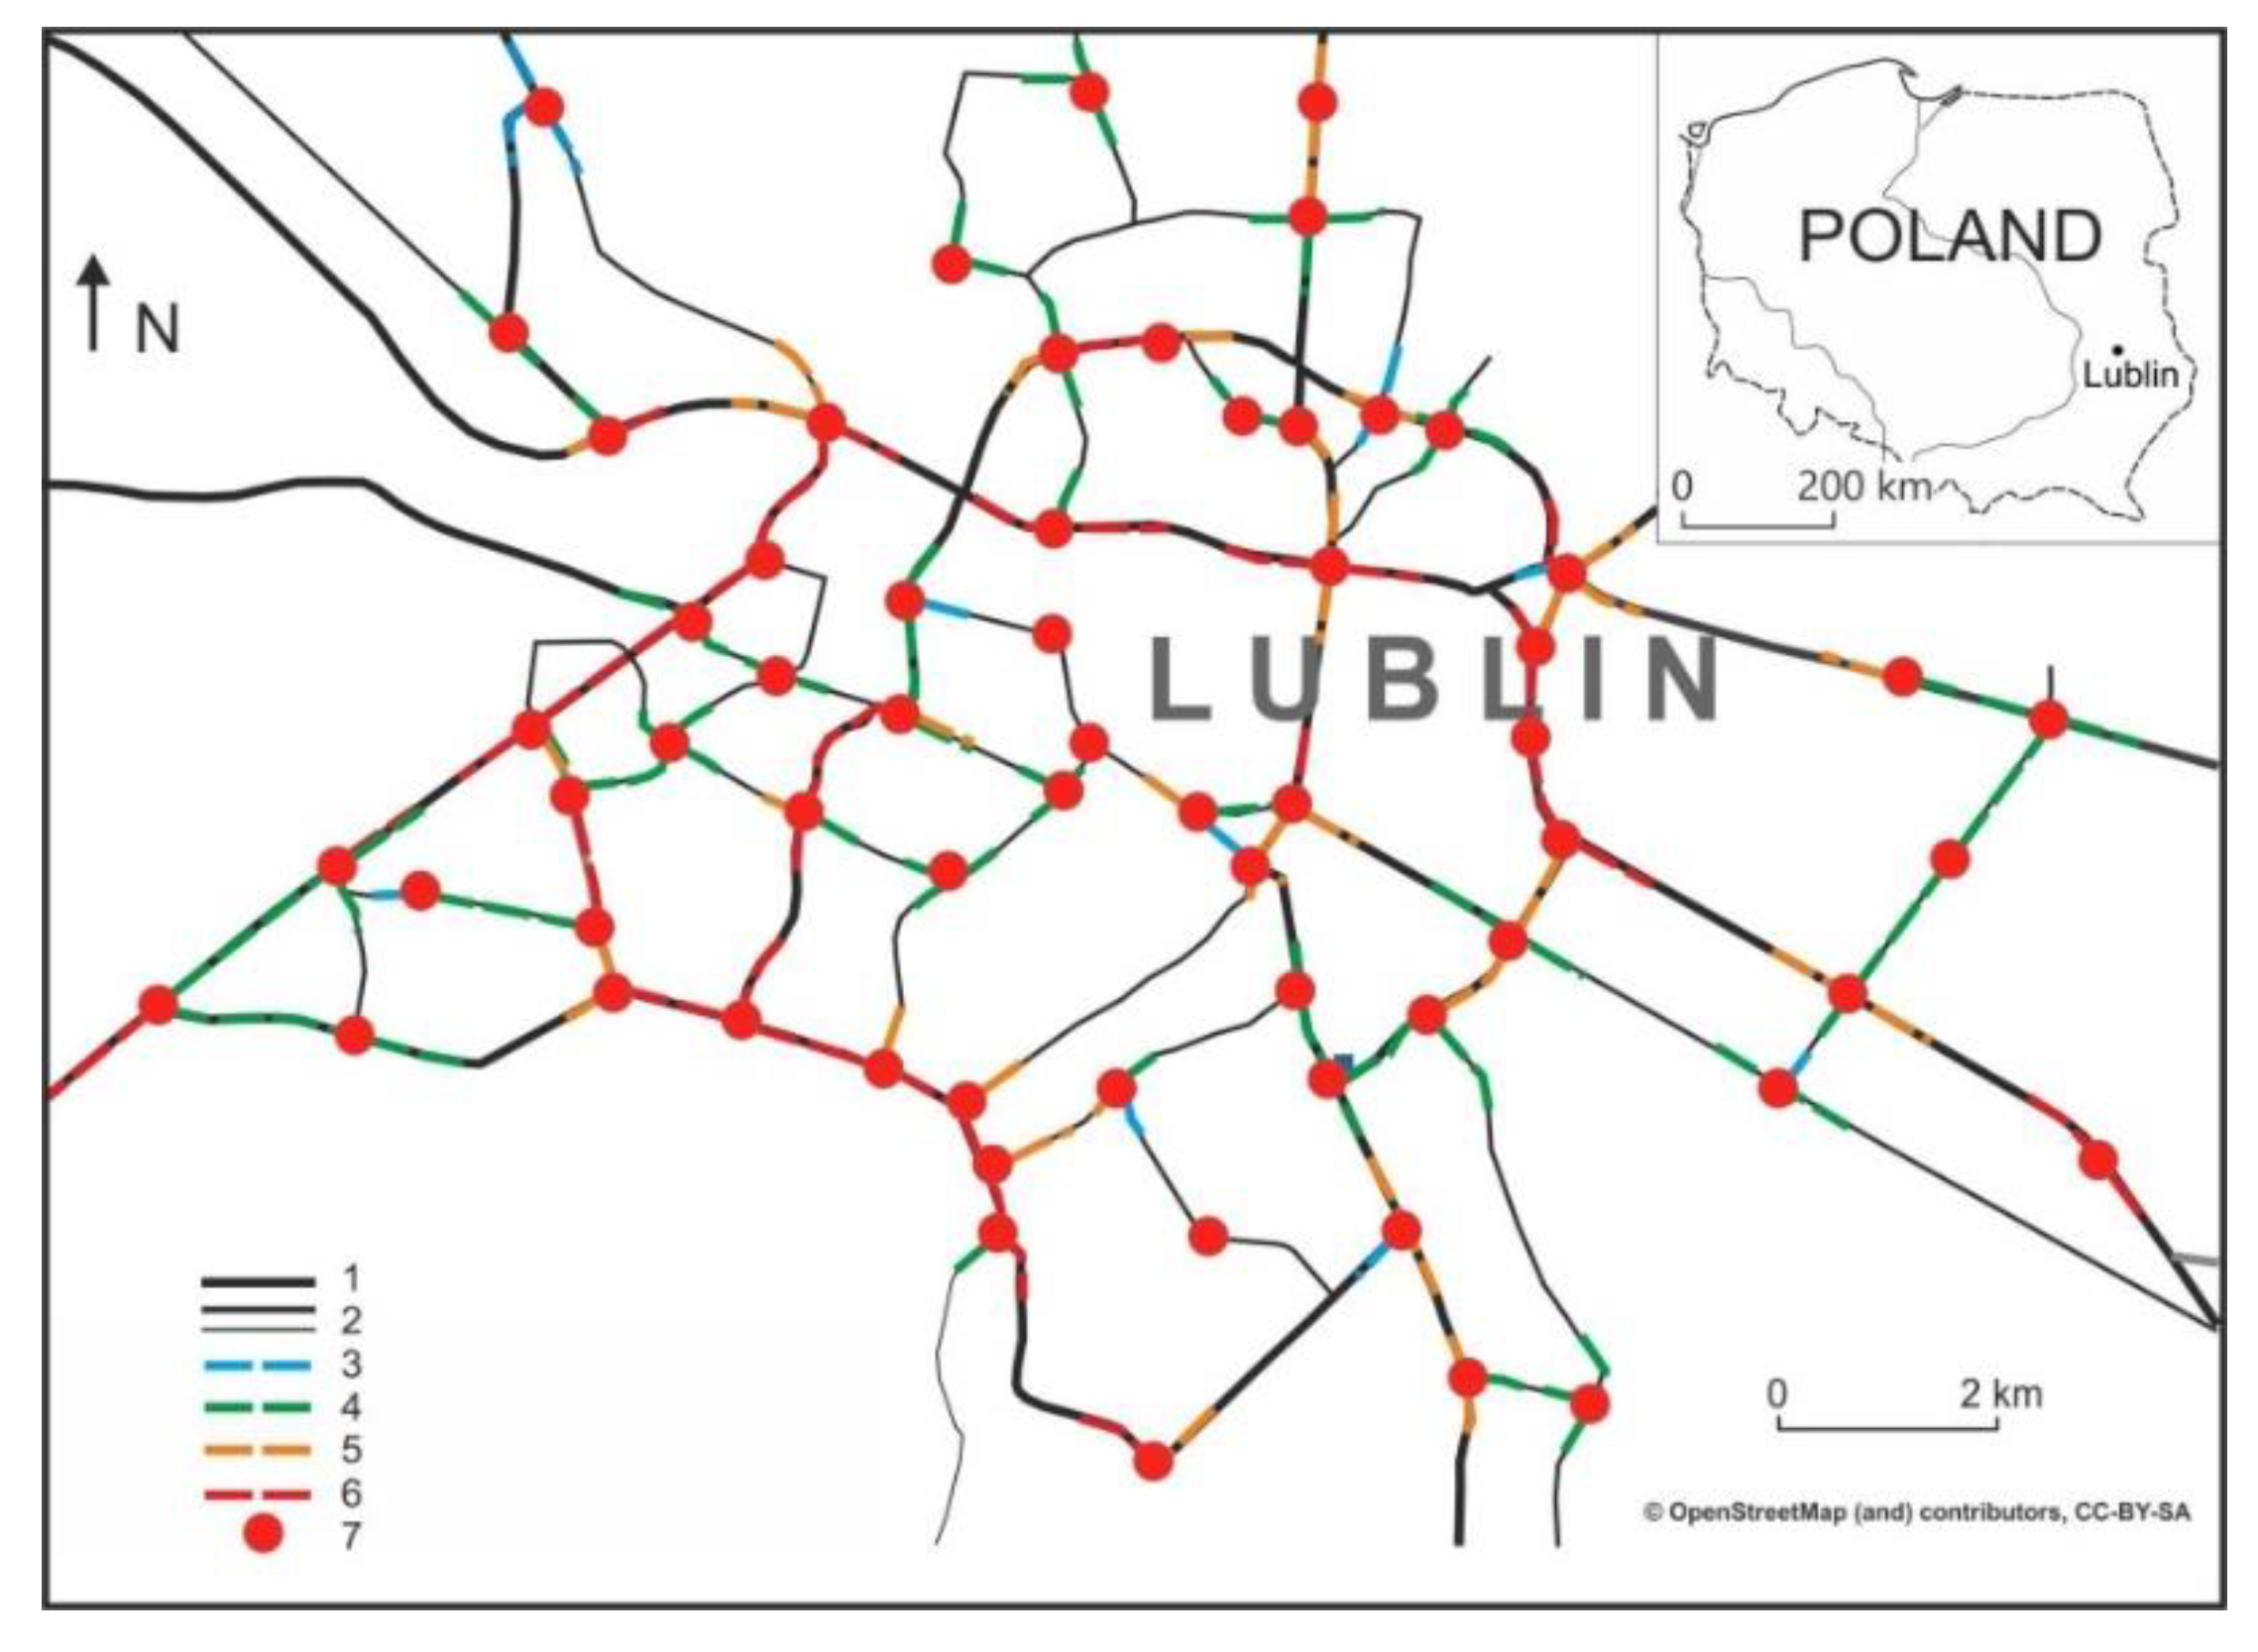
The sampling points were located within different functional areas of the city—residential districts, commercial and service centres, and industrial areas. In total, samples from 62 points (
Figure 1) located near street intersections were analysed. The study material came from street pavements, along the edges of the roadway. The material was sampled twice, in March 2013 and March 2018 (each time, samples were collected over two days). The sampling method used is common in investigations of this kind [
12,
36]. The dust was sampled after a five-day period without precipitation. There was no street washing and there were no snow melting episodes within the month prior to sampling. The samples were collected with a plastic brush into plastic bags, then dried at room temperature, and subjected to preliminary sifting through a 1 mm sieve in order to remove macro debris. The metal content was tested in material with a diameter of less than 63 μm, which was obtained by sieving the samples through a steel sieve.
The street dust was ground in a zirconia ball mill, and then pressed pellets were prepared from it. Analyses of the total Cd, Cr, Cu, Ni, Pb and Zn content were performed on an X-ray fluorescence spectrometer (Epsilon5 Panalytical). The metal content of each sample was measured three times and the average was given as the final result. The accuracy of the method was verified using reference material NCS DC 73,385 (measurement error ranged from 3 to 5%).
The study used hazard index (HI) and cancer risk (CR) for a quantitative description of health risk related to human exposure to heavy metals contained in street dust [
22,
23]. The average daily dose quantifies the risk of cancer and non-cancer diseases as a result of human contact with a selected element (in the case studied, it is contact with the solid fraction in the form of street dust). These models are commonly used in studies of the hazard represented by heavy metals in various types of city street dust [
24,
26,
28,
37,
38]. According to the adopted methodology, three methods of contact with the dust hazard and, therefore, three forms of average daily dose (ADD) intake can be distinguished: inhalation described with the parameter ADD
inh—taking into account, among others, the particle emission factor; skin contact (ADD
derm)—taking into account, among others, the skin area exposed to the carcinogen; and ingestion (ADD
ing). The equations for these parameters take the following form:
where C is the concentration of the element, ingR is the age-dependent ingestion rate, inhR is the age-dependent inhalation rate, EF is the frequency of exposure to pollutants, ED is the exposure duration, SA is the skin area exposed to pollutants, SL is the skin adherence factor, ABS is the dermal absorption factor, PEF is the particle emission factor, BW is the average body weight, and AT is the average exposure time (
Table 1).
The hazard index is the sum of the quotients of the three forms of pollutant intake divided by the corresponding element-specific reference doses (
Table 2). It is calculated using the following equation:
where ADDi is the dose of element i, and RfD is the reference dose of the element. The proportions in this equation refer to non-carcinogenic effects. The probability of such effects occurring is very low for HI < 1, between 1 and 4 the risk of non-carcinogenic effects is possible, for HI > 4 the risk is high [
26,
28].
Lifetime average daily dose (LADD) is represented with equations identical to ADD, only with the parameter AT changed to AL (average life) [
43]. For carcinogenic substances, i.e., As, Cd, Cr, Ni, etc., LADD values are multiplied by an appropriate slope factor (SF), and thus the cancer risk range (CR) is obtained:
These results are considered hazardous when cancer risk ranges (CR) are greater than 10
−6 [
26] or 10
−4; a definitive lower risk limit is still to be established [
24]. In this study, health risk (hazard index and cancer risk) was determined for both adults and children.
Basic descriptive statistics (mean, standard deviation and variation coefficient) of health risk indicators were calculated. HI and CR spatial distribution maps were prepared with the Spatial Analyst (QGIS) package through IDW interpolation using the collected data.
3. Results
Previously conducted studies indicate that the average heavy metal content in 2018 was lower in the case of Cd, Ni, Pb and Zn, while slightly higher for Cr and Cu (
Table 3). The biggest decrease, by 25%, was observed for Pb, followed by Ni and Zn that decreased by about 20%. Similar patterns were found for the maximum values, but the decrease did not occur in the case of Cr and Ni. The highest enrichment factors in relation to the geochemical background were found for Zn (7.8–7.2 times), Cd (7.8–6.8 times) and Cu (6.4–6.7 times). For the maximum values, the factor reached 19 for Cu, 13 for Zn, and 10 for Cd. The variation coefficient in 2018 was higher for Cr and Cu, slightly lower for Cd, and basically unchanged for Ni, Pb and Zn. For both years studied, it was highest for Cu and the lowest for Cd and Ni [
33].
The risk of non-carcinogenic effects appears when HI values are greater than one. In the case of street dust in the Lublin area, even the maximum HI levels for individual elements did not exceed 1/10 of this value, and in most cases (except Pb in 2013 and Cr in 2018) did not exceed 0.03 of the critical value (
Table 4 and
Table 5). This means that streets dust in the area of Lublin is not hazardous to people and should not pose a risk of non-carcinogenic effects. This applies to indices for both adults and children. In the latter case, the more strict standard is not exceeded (H > 0.1) [
42]. There are some differences for individual elements—the index for children is clearly higher in the case of Pb, it is slightly higher for Cr while in the case other metals, the HI is lower for children.
From 2013 to 2018, changes occurred in both the value and variation of HI distribution for the individual elements in the area of Lublin. For Ni, Pb and Zn, changes in the variation of HI distribution (described with VC) were small. The mean HI value in all three cases decreased in 2018 compared to 2013 from about 18% for Zn to more than 56% for Pb. For Cd and Cu, the mean HI value also decreased (by 42% and 27%, respectively), but the variation of HI distribution in 2018 decreased significantly compared to the variation in 2013, which was due to a significant decrease in the maximum HI values. The only increase of the HI between 2013 and 2018 (0.0013/0.0015) was observed for Cr, and, at the same time, there was a twofold increase in the variation of HI distribution within Lublin.
For CR, which is calculated only for carcinogenic elements, the results differ slightly (
Table 6 and
Table 7). When the more strict limit of 10
−6 is adopted for CR values, clear changes can be seen between 2013 and 2018. In 2013, the mean and maximum CR values exceeded 10
−5 for Cd and Cr, while in 2018, the CR for these two elements clearly decreased and were almost below the strict limit of 10
−6. Among carcinogenic elements, only the mean and maximum CR values for Pb did not exceed the strict critical value of 10
−6 in 2013 and 2018. In the case of Cd, Cr and Ni, the mean CR values were of the order of 10
−6 in 2018, but they exceeded this limit. For Cr, on the other hand, the CR values were an order of magnitude greater than the mean values. Between 2013 and 2018, the changes in CR were considerably greater than changes in HI. The mean CR values for Cd, Cr and Pb decreased by nearly an order of magnitude, and in the case of Ni, by 30%. The variation coefficient for CR increased very slightly for Ni and Pb, and more than doubled for Cr. However, in the case of Cd distribution, the variation coefficient for CR was nearly twice as low.
Clearly higher CR values were found in the case of children. For all elements, except Pb, they were of the order of 10−4, which means that they exceeded the critical values. In 2013, the maximum CR value for Cd was 0.0007. In 2018, it decreased by two thirds, while the mean value remained at 0.0002. The mean CR value for Ni also decreased, but its maximum values in 2013 and 2018 were similar—0.00018 and 0.00017, respectively. The maximum CR value for Cr increased considerably from 0.0007 in 2013 to 0.001 in 2018. The mean CR value also increased for Cr.
Pb was the only element for which CR values were below the less strict limit of 10−4 and near the more strict limit of 10−6. Its mean values were twice as low in 2013 compared to 2018, while the maximum values were four times as low. Therefore, it can be assumed that, unlike the other carcinogenic elements, Pb is not hazardous to children in Lublin.
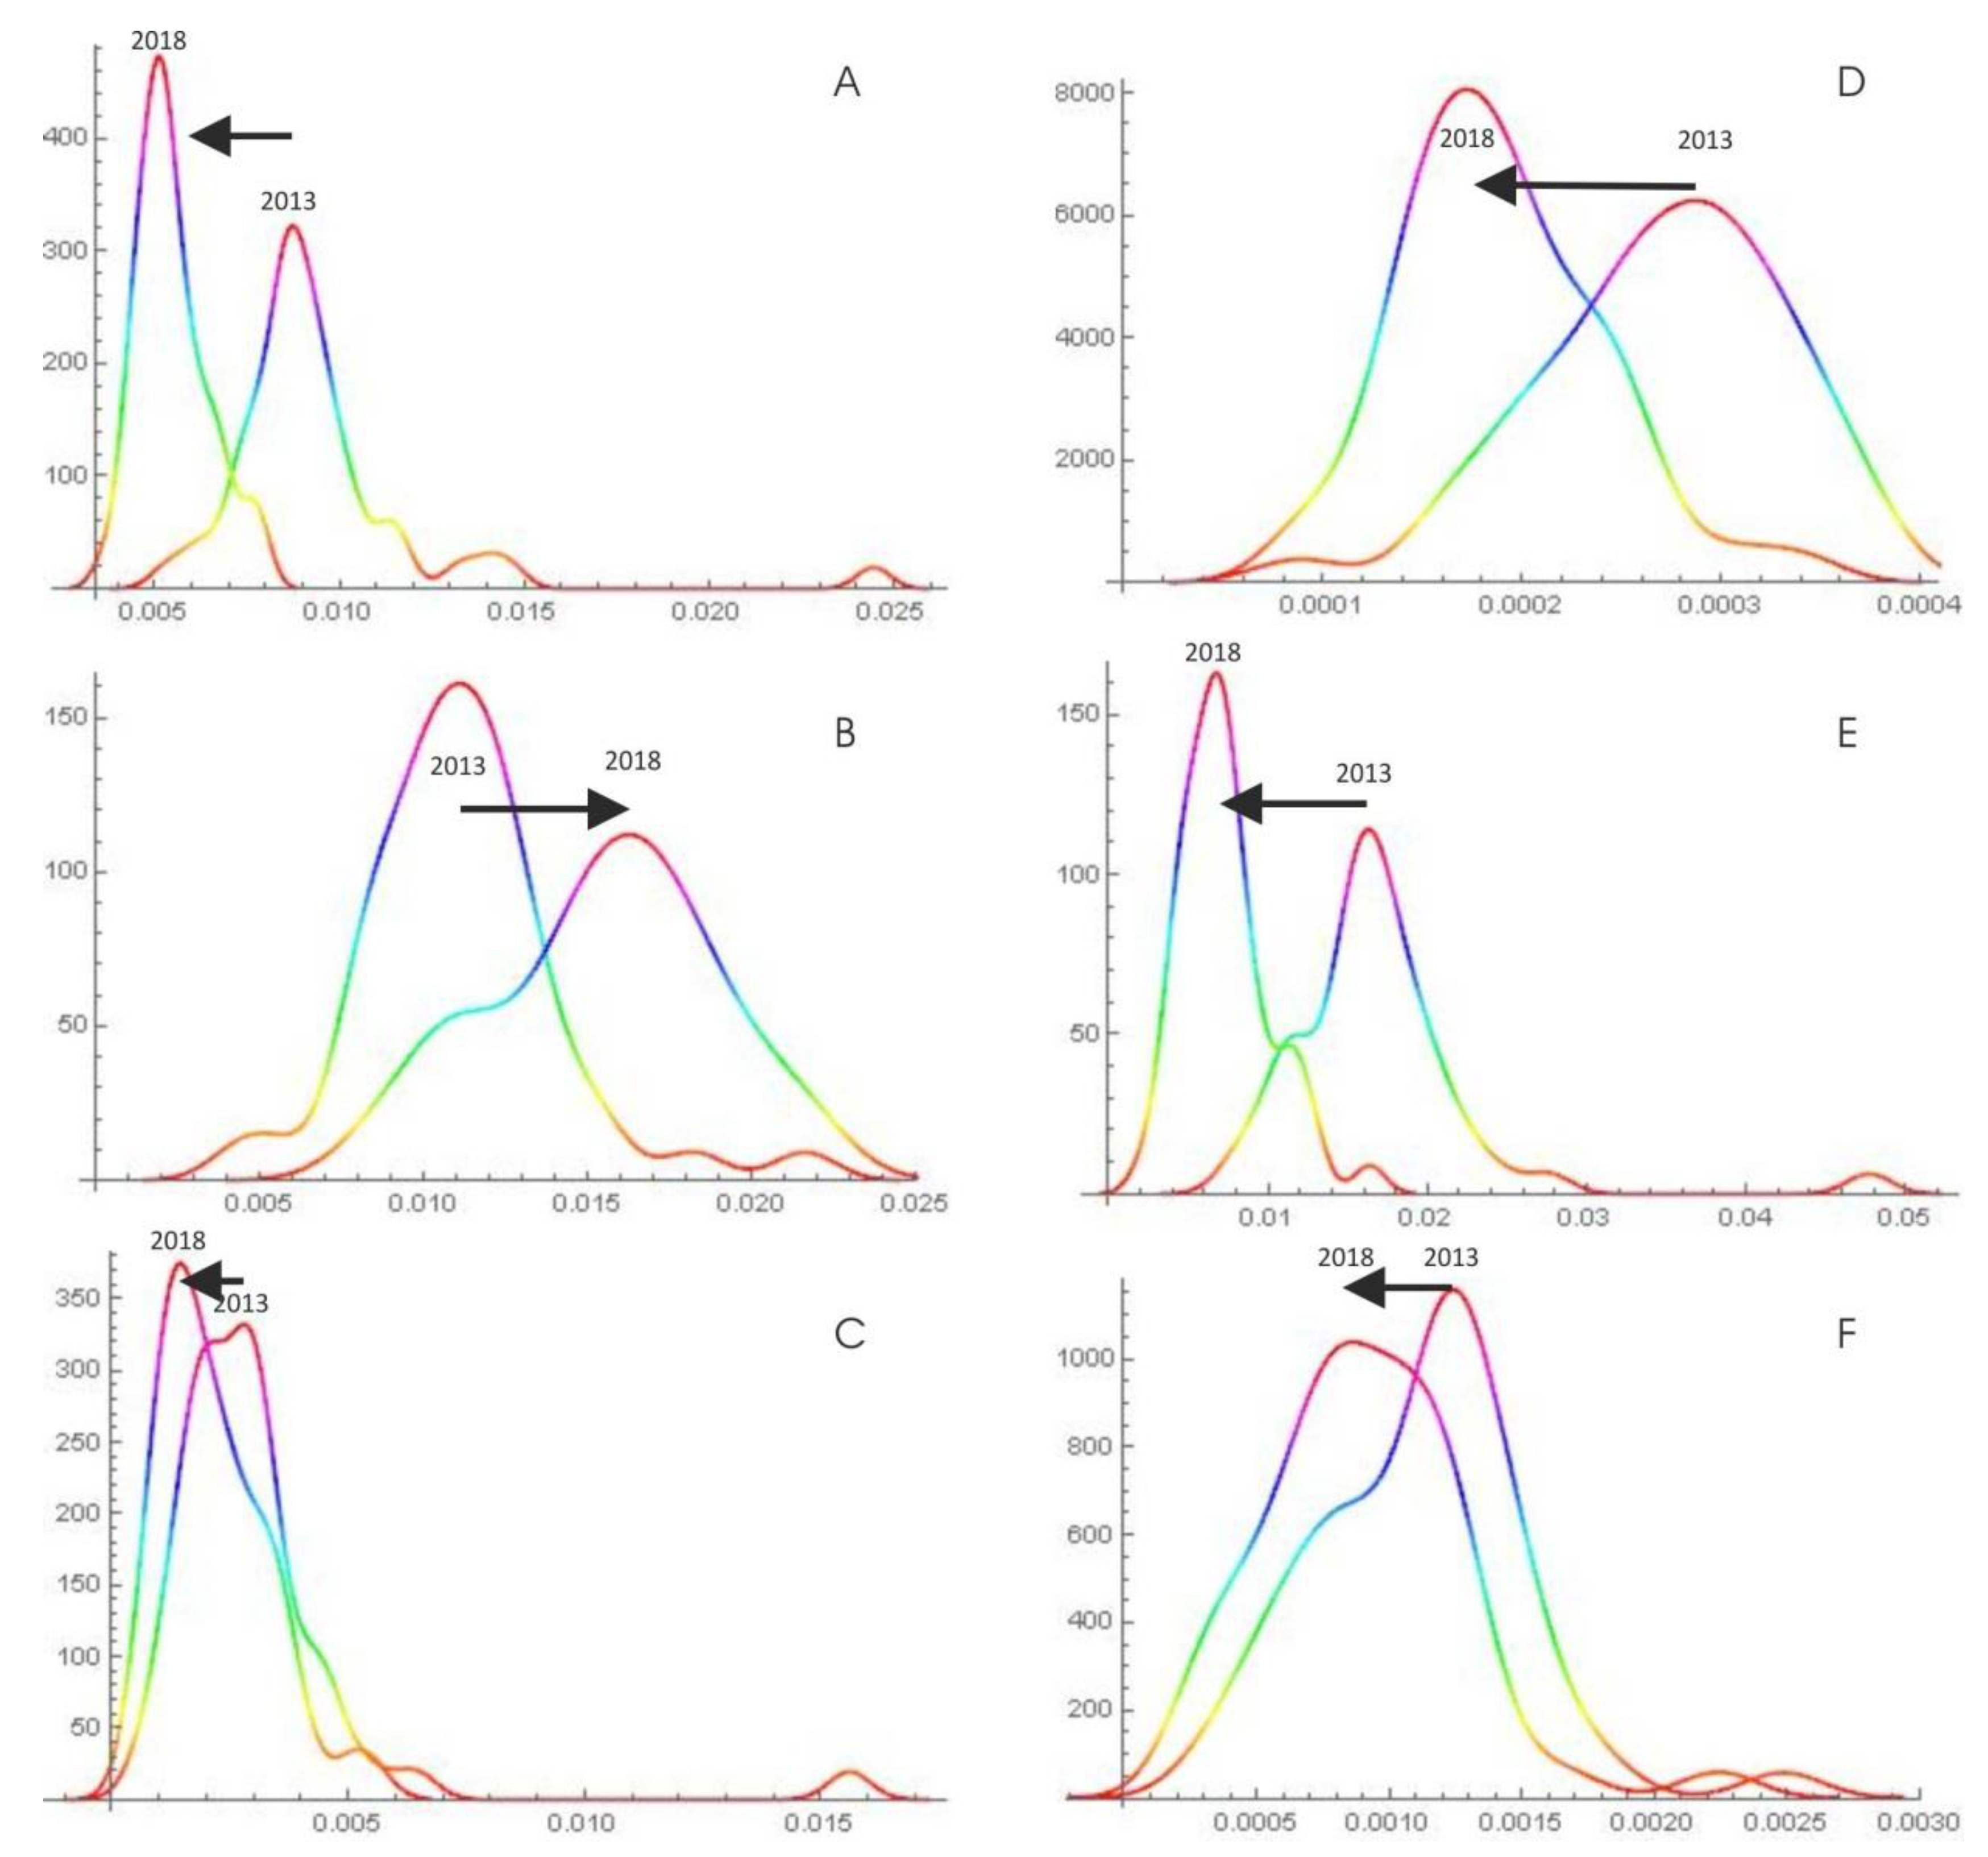
The distribution of HI values for all elements changed between 2013 and 2018 (
Figure 2). For Cd, both distributions are strongly elongated, right-skewed (Cd: 2013, 0.007–0.01; 2018, 0.0043–0.006), but most data for 2018 are concentrated around the lower value of the modal interval. The right-skewed distribution indicates exceptional higher HI values. The HI distribution in 2013 showed very high values that did not occur in 2018. A clear increase of HI values can be observed for Cr in 2018. In 2013, most of the data were contained in the 0.0075–0.014 interval. In 2018, the distribution was more flattened and most of the data were contained in the wide interval of 0.01–0.02. In both cases, the data distribution was elongated, meaning that most of the data were contained near the modal interval with the 2013 distribution being more elongated than the 2018 distribution. For Cu, the HI distribution is strongly elongated and right-skewed. In 2013, most values were contained in the 0.00048–0.0037 interval, but a small peak for large values (i.e., above 0.015) was visible. In 2018, most values were in the 0.001–0.0039 interval, and sites with high HI values did not appear. In 2013, the distribution for Ni was more flattened, with most HI values within the 0.00019–0.000366 interval, and in 2018 the distribution was more elongated, with most HI values in the lower 0.00011–0.000256 interval. At the same time, the kurtosis of the distribution in 2013 was similar to the kurtosis of normal distribution, but the distribution for Ni was left-skewed (i.e., had a surplus of data with high values), while that in 2018 was right-skewed and elongated. This means that most data were contained in the narrower interval with lower values. In the case of the HI for Pb, the kurtosis of distribution in 2013 was significantly higher, while in 2018 it was slightly higher than the kurtosis of normal distribution. The modal interval shifted to lower values in 2018. Most of the data were between 0.011–0.02 in 2013 and between 0.0036–0.09 in 2018. At the same time, there were no high (0.04–0.05) HI values for Pb in 2018. For Zn, both distributions were slightly elongated and statistically symmetrical. However, the distribution for 2018 was more elongated (more compact). In 2013, most of the data were between 0.00055 and 0.00155, and in 2018 between 0.0003 and 0.00138. The HI distribution for the three elements—Cu, Cd and Pb—shows a clear change between 2013 and 2018. There was an absence of the highest values (extremely high compared to the other values) deviating from the modal values.
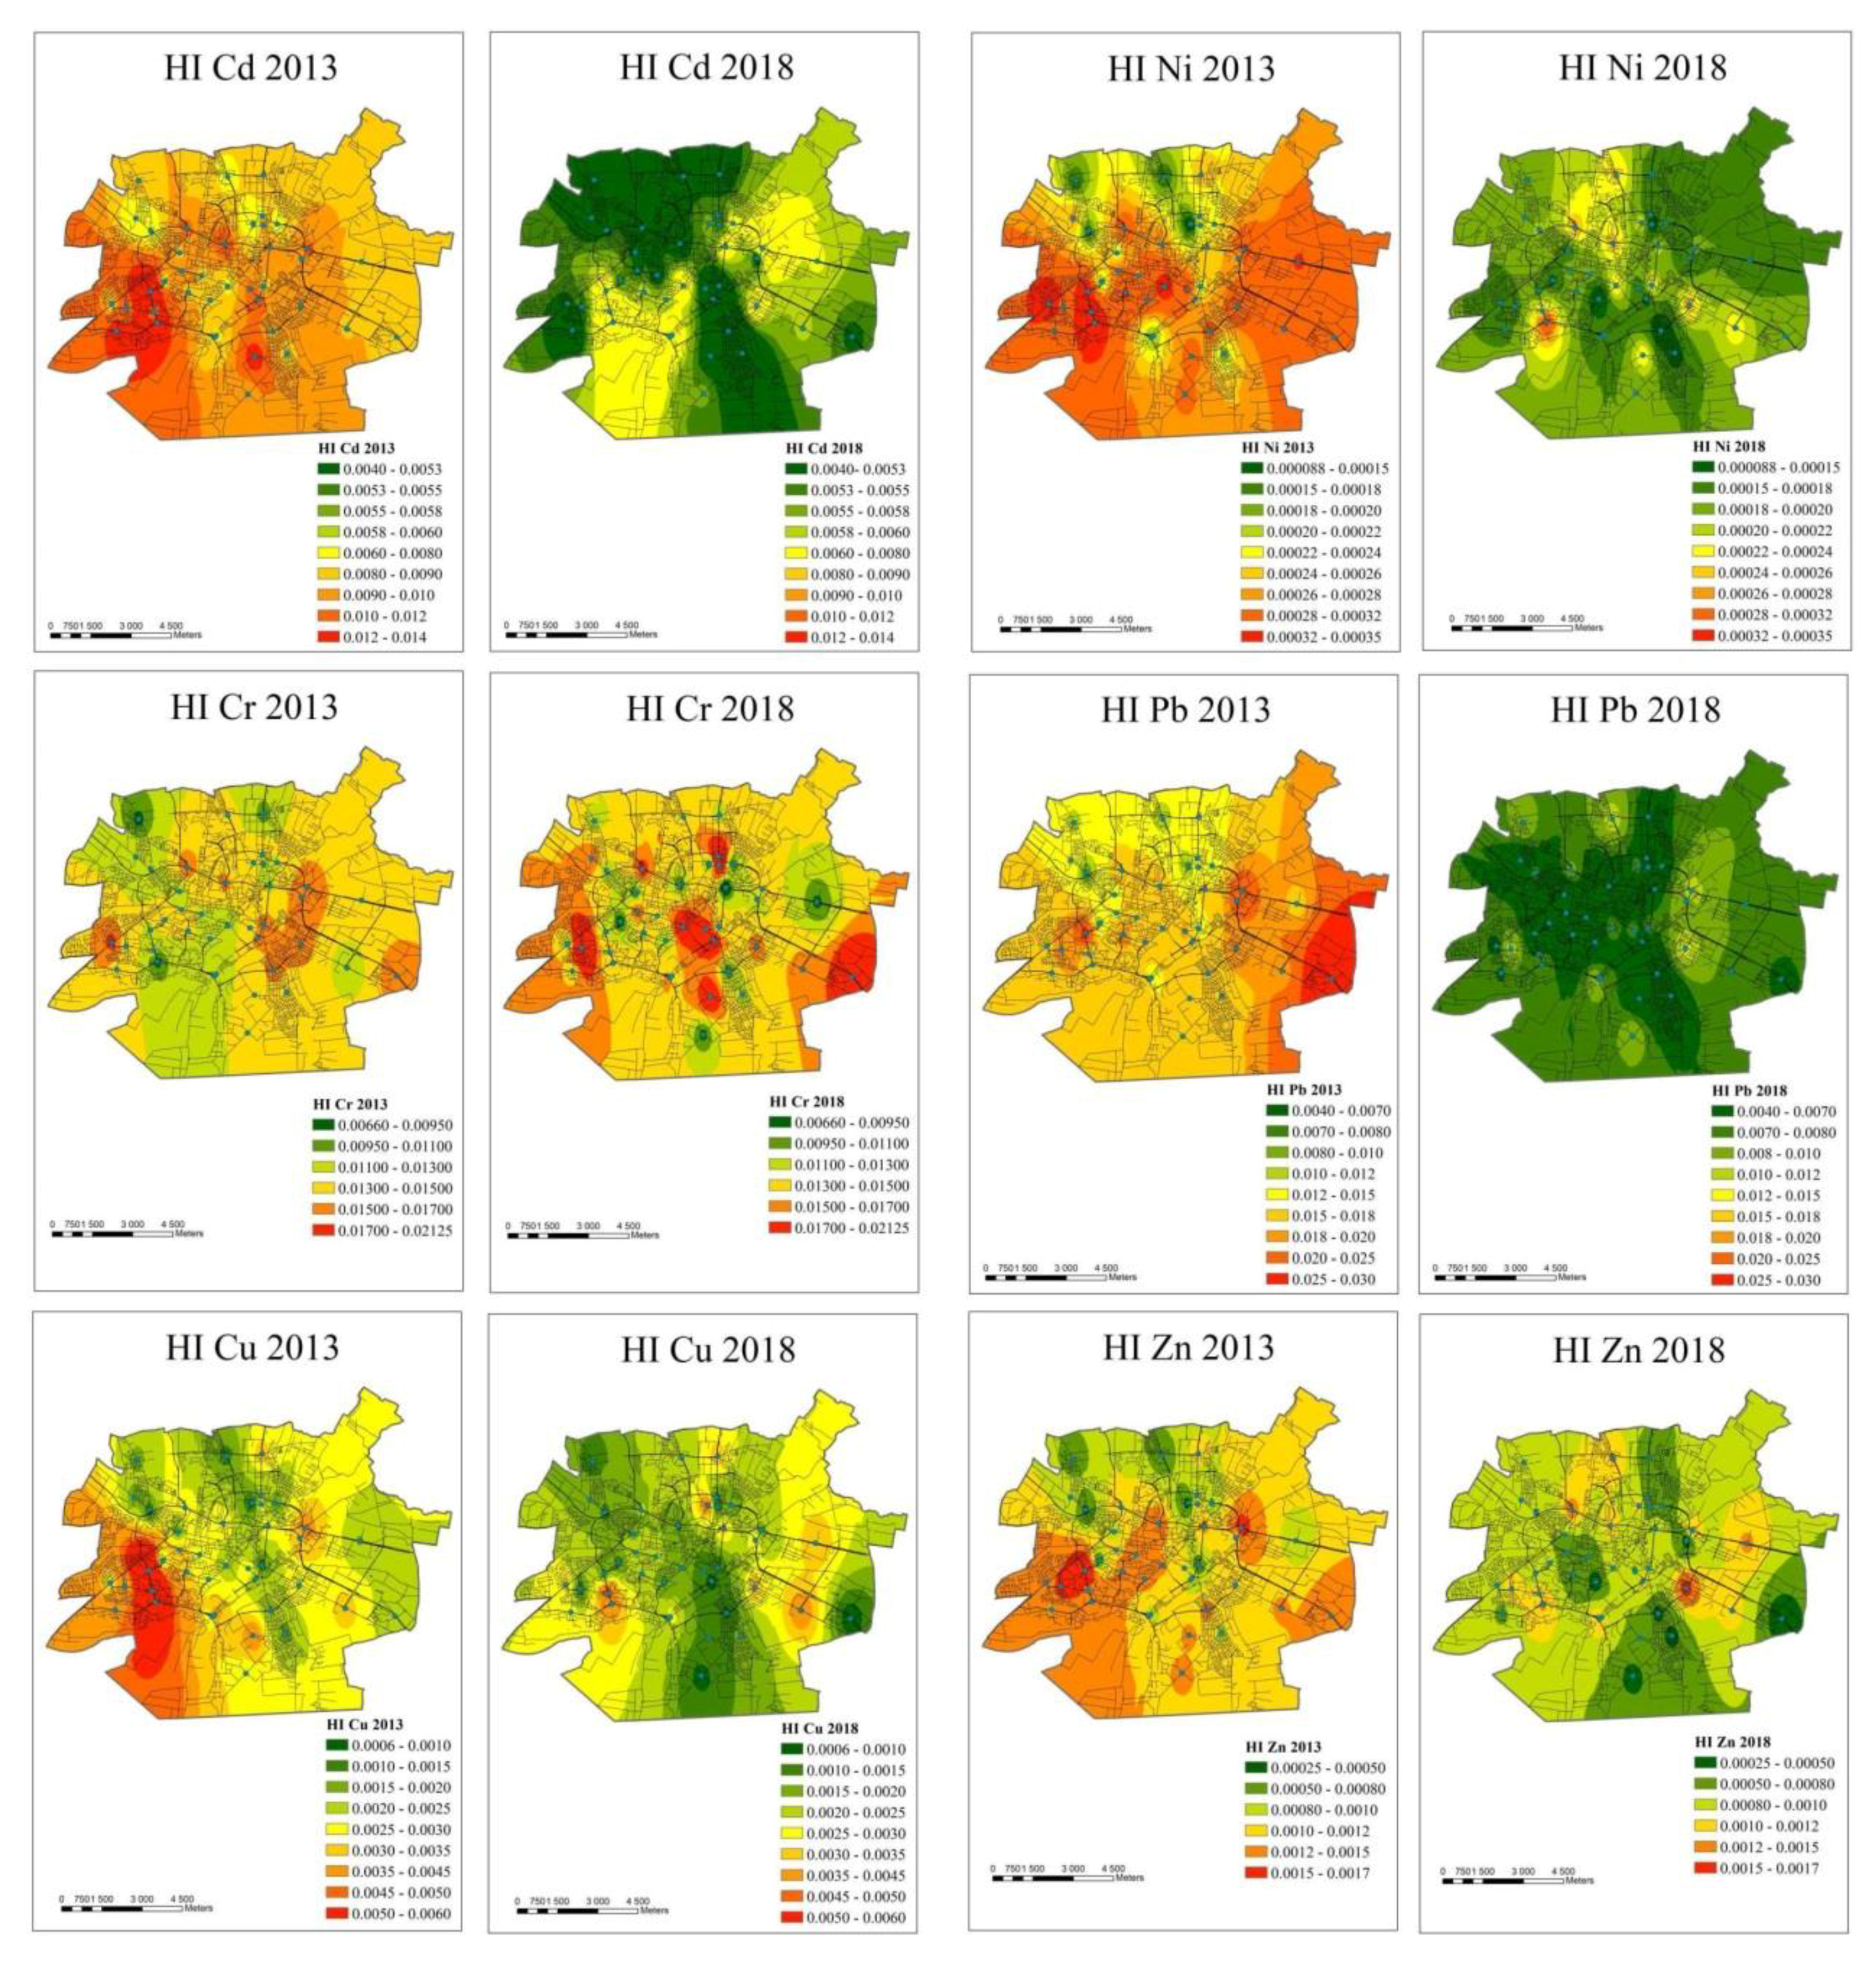
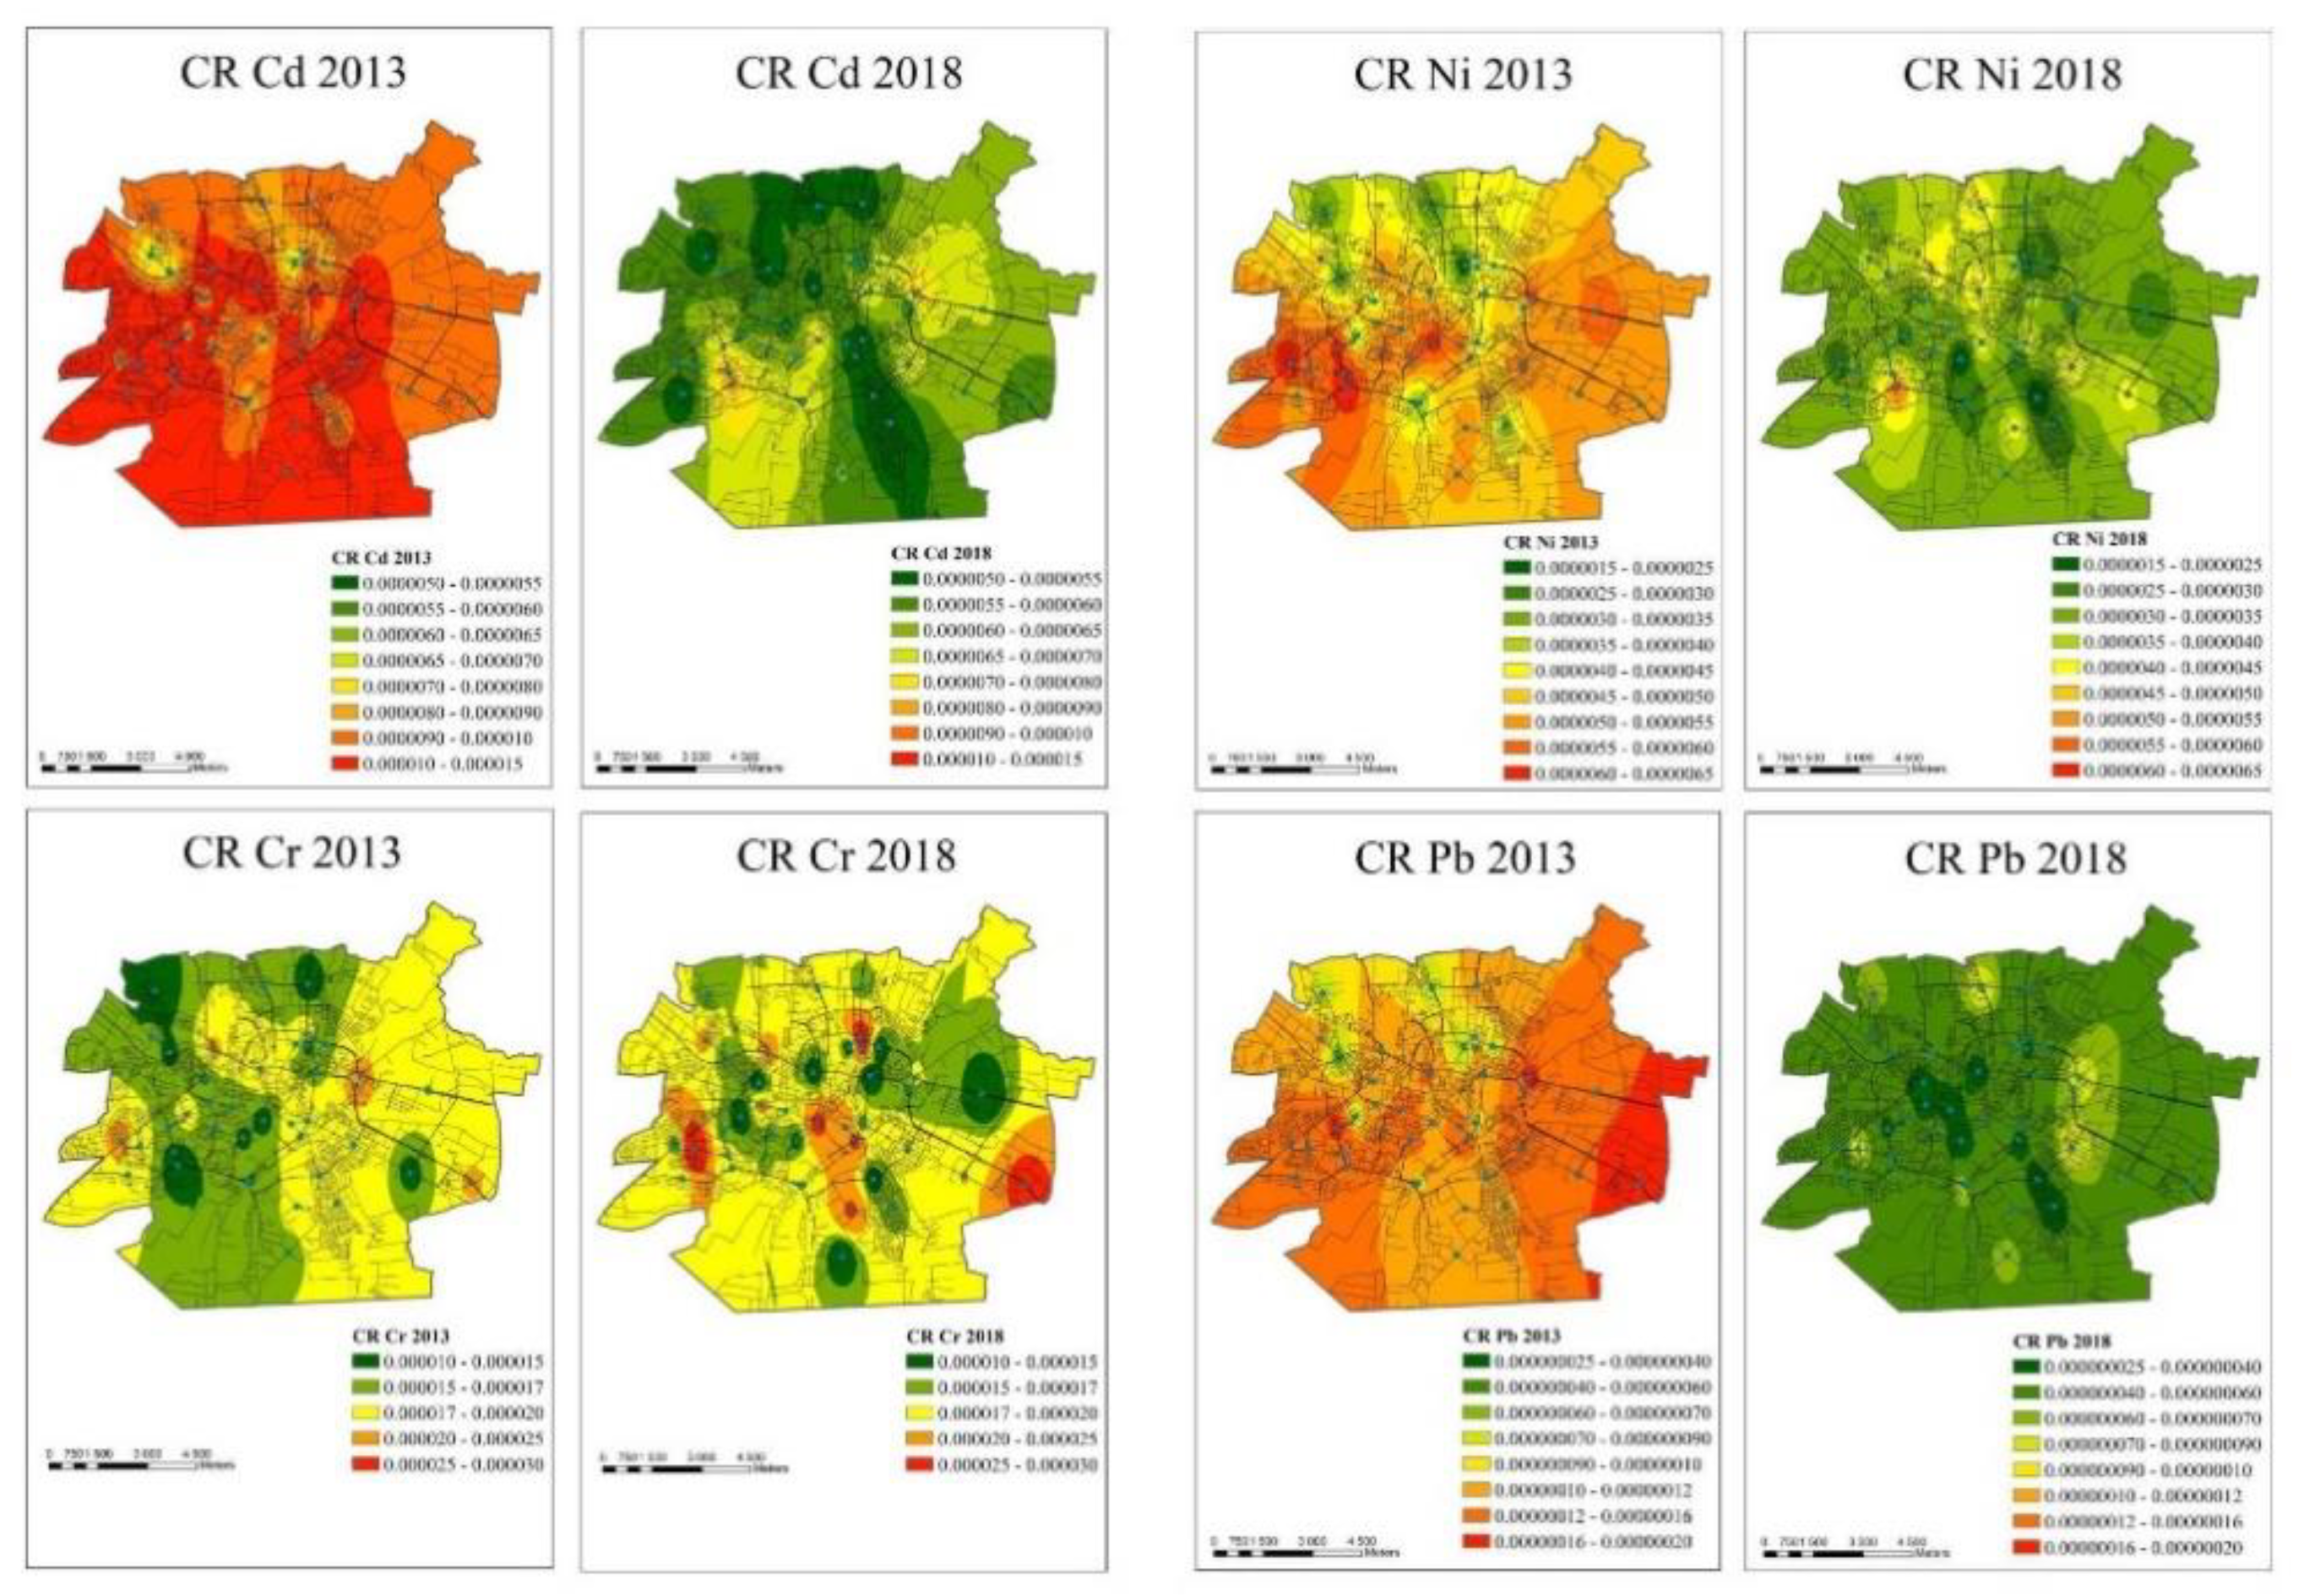
Analysis of the spatial variation of HI and CR values for the individual metals shows clear changes (
Figure 3 and
Figure 4). In 2013, HI reached the highest values for Cd in the south-western part of Lublin. In 2018, there was a very distinct decrease of this index in the entire area of the city. The lowest values occurred in the northern and SE part of the city. In the case of Cr, there was a mosaic-like pattern of areas with different HI values, and the spatial variation was distinctly greater in 2018. In 2013, there was an area with higher values of the index for Cu in the SW part of Lublin, but the same was not observed in 2018. The indices for Ni in 2013 were the highest in the western and eastern part of the city. In 2018, slightly higher values were found in just a few locations. In the case of Pb in 2013, the highest HI values occurred in the eastern part of the city. In 2018, a very distinct decrease was observed for this index, and the lowest values were found in the central part of the city. The distribution of the index for Zn was very similar to its distribution for Cu (
Figure 3).
In 2013, the highest CR values for adults in the case of Cd occurred in the southern, western and central part of the city (
Figure 4). In 2018, areas with slightly higher values of the index were found only in the SW part, but these values were clearly lower than in 2013. CR values for cadmium exceeding the stricter limit of 10
−6 encompassed the entire area of the city in 2013 and 2018 alike. However, these values did not exceed the limit of 10
−4 in any location. CR distribution for Cr in 2013 showed slightly higher values in the western part of the city. In 2018, the distribution was entirely different—there were a few locations with clearly higher values of the index, mainly in the central part of the city. The maximum CR values for Cr, marked with red, are of the order of 3 × 10
−5. In the case of Ni, the highest CR values were recorded in 2013 in the western part of Lublin, while in 2018 nearly all of these anomalies disappeared. The maximum CR values for Ni were of the order of 10
−6. For Pb, the highest values in 2013 occurred in the eastern and south-western part of the city. Similarly to Ni, the situation in 2018 changed and CR reached clearly lower values all over the city (
Figure 4). Despite the variation, CR values for Pb did not exceed the limit of 10
−6 anywhere in Lublin.
4. Discussion
Although for some heavy metals in street dust, the concentrations found in 2013 and 2018 were several times above the level of the geochemical background, the risk of non-cancer health effects was very low. The HI values for maximum and average values were usually around 0.01 (
Table 8). In the case of adults, HI reached the highest values for Pb (2013), 4.8 × 10
−2; Cr (2018), 3.4 × 10
−2; and Cd (2013), 2.8 × 10
−2. The situation was different in the case of CR where the greatest hazard to adults in 2013/2018, respectively, was represented by Cd (2.6 × 10
−5/8.5 × 10
−6) and Cr (2.4 × 10
−5/4.2 × 10
−5). The hazard associated with both elements was greater in 2013. The same elements posed a hazard to children, but the CR values for children were 10 or 100 times higher than for adults (2013/2018)—Cd 2.8 × 10
−4/1.6 × 10
−4 and Cr (3.8 × 10
−4/5.4 × 10
−4). An additional risk associated with Ni occurred (2013/2018)—4.4 × 10
−4/1.3 × 10
−4. Among carcinogenic elements, only Pb concentrations did not pose a health risk (
Table 9).
Zgłobicki et al. (2019) [
33] found that concentrations of heavy metals (except Cd) in street dust in Lublin were distinctly lower compared to other cities in Europe. There was a decrease in the level of contamination of street dust with heavy metals, also observed by other researchers [
44,
45,
46], with the exception of Cr whose content increased slightly. The tendency for the contamination to increase occurred in other cities even though this is a sporadic phenomenon in Europe. A direct comparison of the health threat determined in this study with the results of studies conducted in other cities is difficult due to differences in the methods used to assess the concentration of metals, the size of the fraction in which the concentration was determined, or the rules adopted for the calculation of indices (exposure duration, body weight, ways of exposure to pollution, etc.). Therefore, the intensity of the threat was compared with two cities in Poland where such studies had been carried out previously.
In the case of HI, the determined risk is similarly low as for Wrocław and Kraków [
29], but it should be emphasized that these two cities are definitely larger (
Table 8). A comparison of CR indices for these cities with the data obtained for Lublin indicates a clearly higher risk in the latter city (
Table 9). This is related to the fact that only inhalation was taken into account by Rybak et al. (2020) [
29] as a route by which heavy metals enter the human body. On the other hand, studies conducted by Traczyk and Gruszecka-Kosowska (2020) [
44] took into account all three routes (inhalation, skin contact, and ingestion) and indicated that the total non-carcinogenic risk indices (HI > 1) and total carcinogenic risk indices (1.6–1.7 × 10
−4) were exceeded for both adults and children.
Previous studies indicated that anthropogenic supply is the main source of elements such as Cd, Cu and Zn [
30]. No influence of road traffic intensity in Lublin on the level of the local distribution of pollutants and related health threat was found. The highest spatial variation of indicators occurred in 2013 and concerned elements such as Cr, Cu and Zn. The lack of correlation between traffic intensity and the size of the health threat may result from the supply of combustion products coming from sources other than traffic to street dust [
1,
12]. In the case of Lublin, the combustion of coal in private houses can be the source of pollution. The lack of links between the volume of road traffic and the level of pollution has been reported by other authors [
47,
48]. Another reason for the lack of correlation with traffic intensity may be the displacement of road pollutants by winds, which blow at an average speed of 2.75 m/s in Lublin [
49]. The diversity of the speed and intensity of winds in the city may also be related to the tunnel effects and local differences in surface heating.
The conducted research has a practical application. It enables assessment of the spatial differentiation of health risk in the city. This, in turn, allows for appropriate spatial planning management on the city scale—for example, designating recreational areas for residents, in particular, playgrounds. Knowledge of the general layout of areas with high heavy metal concentrations can also be used when planning new housing developments. It can also be helpful in activities aimed at limiting the negative health effects of pollution of the urban environment. The collected information is particularly valuable because no monitoring studies are carried out on the content of heavy metals in soils, air and city waters.
Future research should focus on a better understanding of the determinants of heavy metal content in road dust in medium-sized cities, as well as an accurate assessment of their concentration in all environmental components—air, soil and road dust.


