Article

Spatial Variation of Water Chemistry in Aries River Catchment, Western Romania

1
INCDO-INOE 2000, Research Institute for Analytical Instrumentation, 67 Donath Street, 400293 Cluj-Napoca, Romania
2
Faculty of Materials and Environmental Engineering, Technical University, 103-105 Muncii Boulevard, 400641 Cluj-Napoca, Romania
3
Department of Geology and Paleontology, Emil Racovitza Institute of Speleology, Calea 13 Septembrie, 050711 Bucharest, Romania
4
Faculty of Chemistry and Chemical Engineering, Babeş-Bolyai University, 11 Arany Janos Street, 400028 Cluj-Napoca, Romania
*
Author to whom correspondence should be addressed.
Appl. Sci. 2021, 11(14), 6592; https://doi.org/10.3390/app11146592
Submission received: 23 June 2021 / Revised: 14 July 2021 / Accepted: 15 July 2021 / Published: 17 July 2021
(This article belongs to the Special Issue Heavy Metals in the Environment – Causes and Consequences)

Abstract

:
This study aims to investigate the quality and vulnerability of surface water (Aries River catchment) in order to identify the impact of past mining activities. For this purpose, the pollution and water quality indices, Piper and Durov plots, as well vulnerability modeling maps were used. The obtained results indicate that the water samples were contaminated with As, Fe, Mn, Pb and have relatively high concentrations of SO42−, HCO3, TDS, Ca, K, Mg and high values for the electrical conductivity. Possible sources of the high content of chemicals could be the natural processes or the inputs of the mine drainage. Generally, according to the pollution indices, which were correlated to high concentrations of heavy metals, especially with Pb, Fe and Mn, the water samples were characterized by heavy metals pollution. The water quality index classified the studied water samples into five different classes of quality, namely: unsuitable for drinking, poor, medium, good and excellent quality. Similarly, medium, high and very high vulnerability classes were observed. The Durov and Piper plots classified the waters into Mg-HCO3 and Ca-Cl types. The past and present mining activities clearly change the water chemistry and alter the quality of the Aries River, with the water requiring specific treatments before use.

1. Introduction

Worldwide, wastewaters resulted from mining operations (metal oRes. exploitation) are released directly into the river catchments. According to a UNESCO report, 80% of the wastewaters are discharged directly into the environment without any previous treatments [1,2]. The anthropogenic activities influence and alter the quality of water systems, generating negative effects on the aquatic flora and fauna. Hence, the well-functioning of the water system is affected. The presence of high concentrations of heavy metals, organic compounds, insecticides and different other chemical compounds in drinking water sources in waters used in agricultural and household activities affect the human health [3]. These organic and inorganic contaminants are found in different toxic and mobile forms. According to the chemistry and dynamics, they act differently and attach easily to the water ecosystems, influencing the quality and the natural flows of the water systems [4,5,6].
In Romania, mining activities were blooming during the last 30 years, together with the pollution levels in water, soil and air. The discharge of industrial and mining wastewaters directly into the water streams, without any pretreatment, and the hazards caused environmental disasters (the cyanide spill near Baia Mare, poisoning animals and inducing cancer cases in the area of the “Black Town”, Copsa-Mica) [7].Since the disaster of Baia Mare area, the mining activities still continued with major impacts on groundwater and surface waters. The Aries River presents a higher vulnerability due to mining activities [8]. The main pollutants of the Aries River are Cu, Pb, Zn and cyanides, due to the acid mine drainage in the mining centers situated along the Aries River [8,9,10]. Different studies on the Aries River catchment revealed that the areas near the mining centers are still highly polluted and implicitly affected [9,10,11,12]. Moreover, the areas crossed by the Aries River represent a petrographic mosaic where the karst landscape is dominant in the upper and middle river catchment (e.g., Bihor Mountains and Muntele Mare areas).
Hence, information regarding the current status of the Aries River is still considered to be essential in order to define and process a suitable decontamination treatment before using the water for drinking purposes, agricultural practices and industrial usages. A part of the water sources monitoring is represented by different and efficient tools such as the water quality indices Appl. to specific points of the water bodies. Two of the most common methods are theHeavy Metal Pollution Index (HPI) and the Heavy Metal Evaluation Index (HEI), used to establish the pollution status of water ecosystems, considering the heavy metals content [13,14,15]. In order to evaluate the water quality regarding different types of physico-chemical characteristics, Horton proposed the Water Quality Index (WQI) [16]. The WQI is widely used to characterize all types of water bodies. Adimala et al. [17], Wang et al. [18] and Sener et al. [19] assessed the quality of various water systems (in Nanganur, South India and in different areas of China and Turkey) by using the WQI.The results were useful in order to assess the quality of surface water resources as an alternative drinking water possibility.
The aim of this study was: (1) to obtain new and valuable data regarding the current quality status and vulnerability of the Aries River, which is situated near the mining areas; (2) to study the impact of historical mining centers on the surface water quality in all the catchment areas, by determining the physico-chemical properties of waters; and (3) to assess the water quality using various heavy metal pollution indexes.

2. Methodology

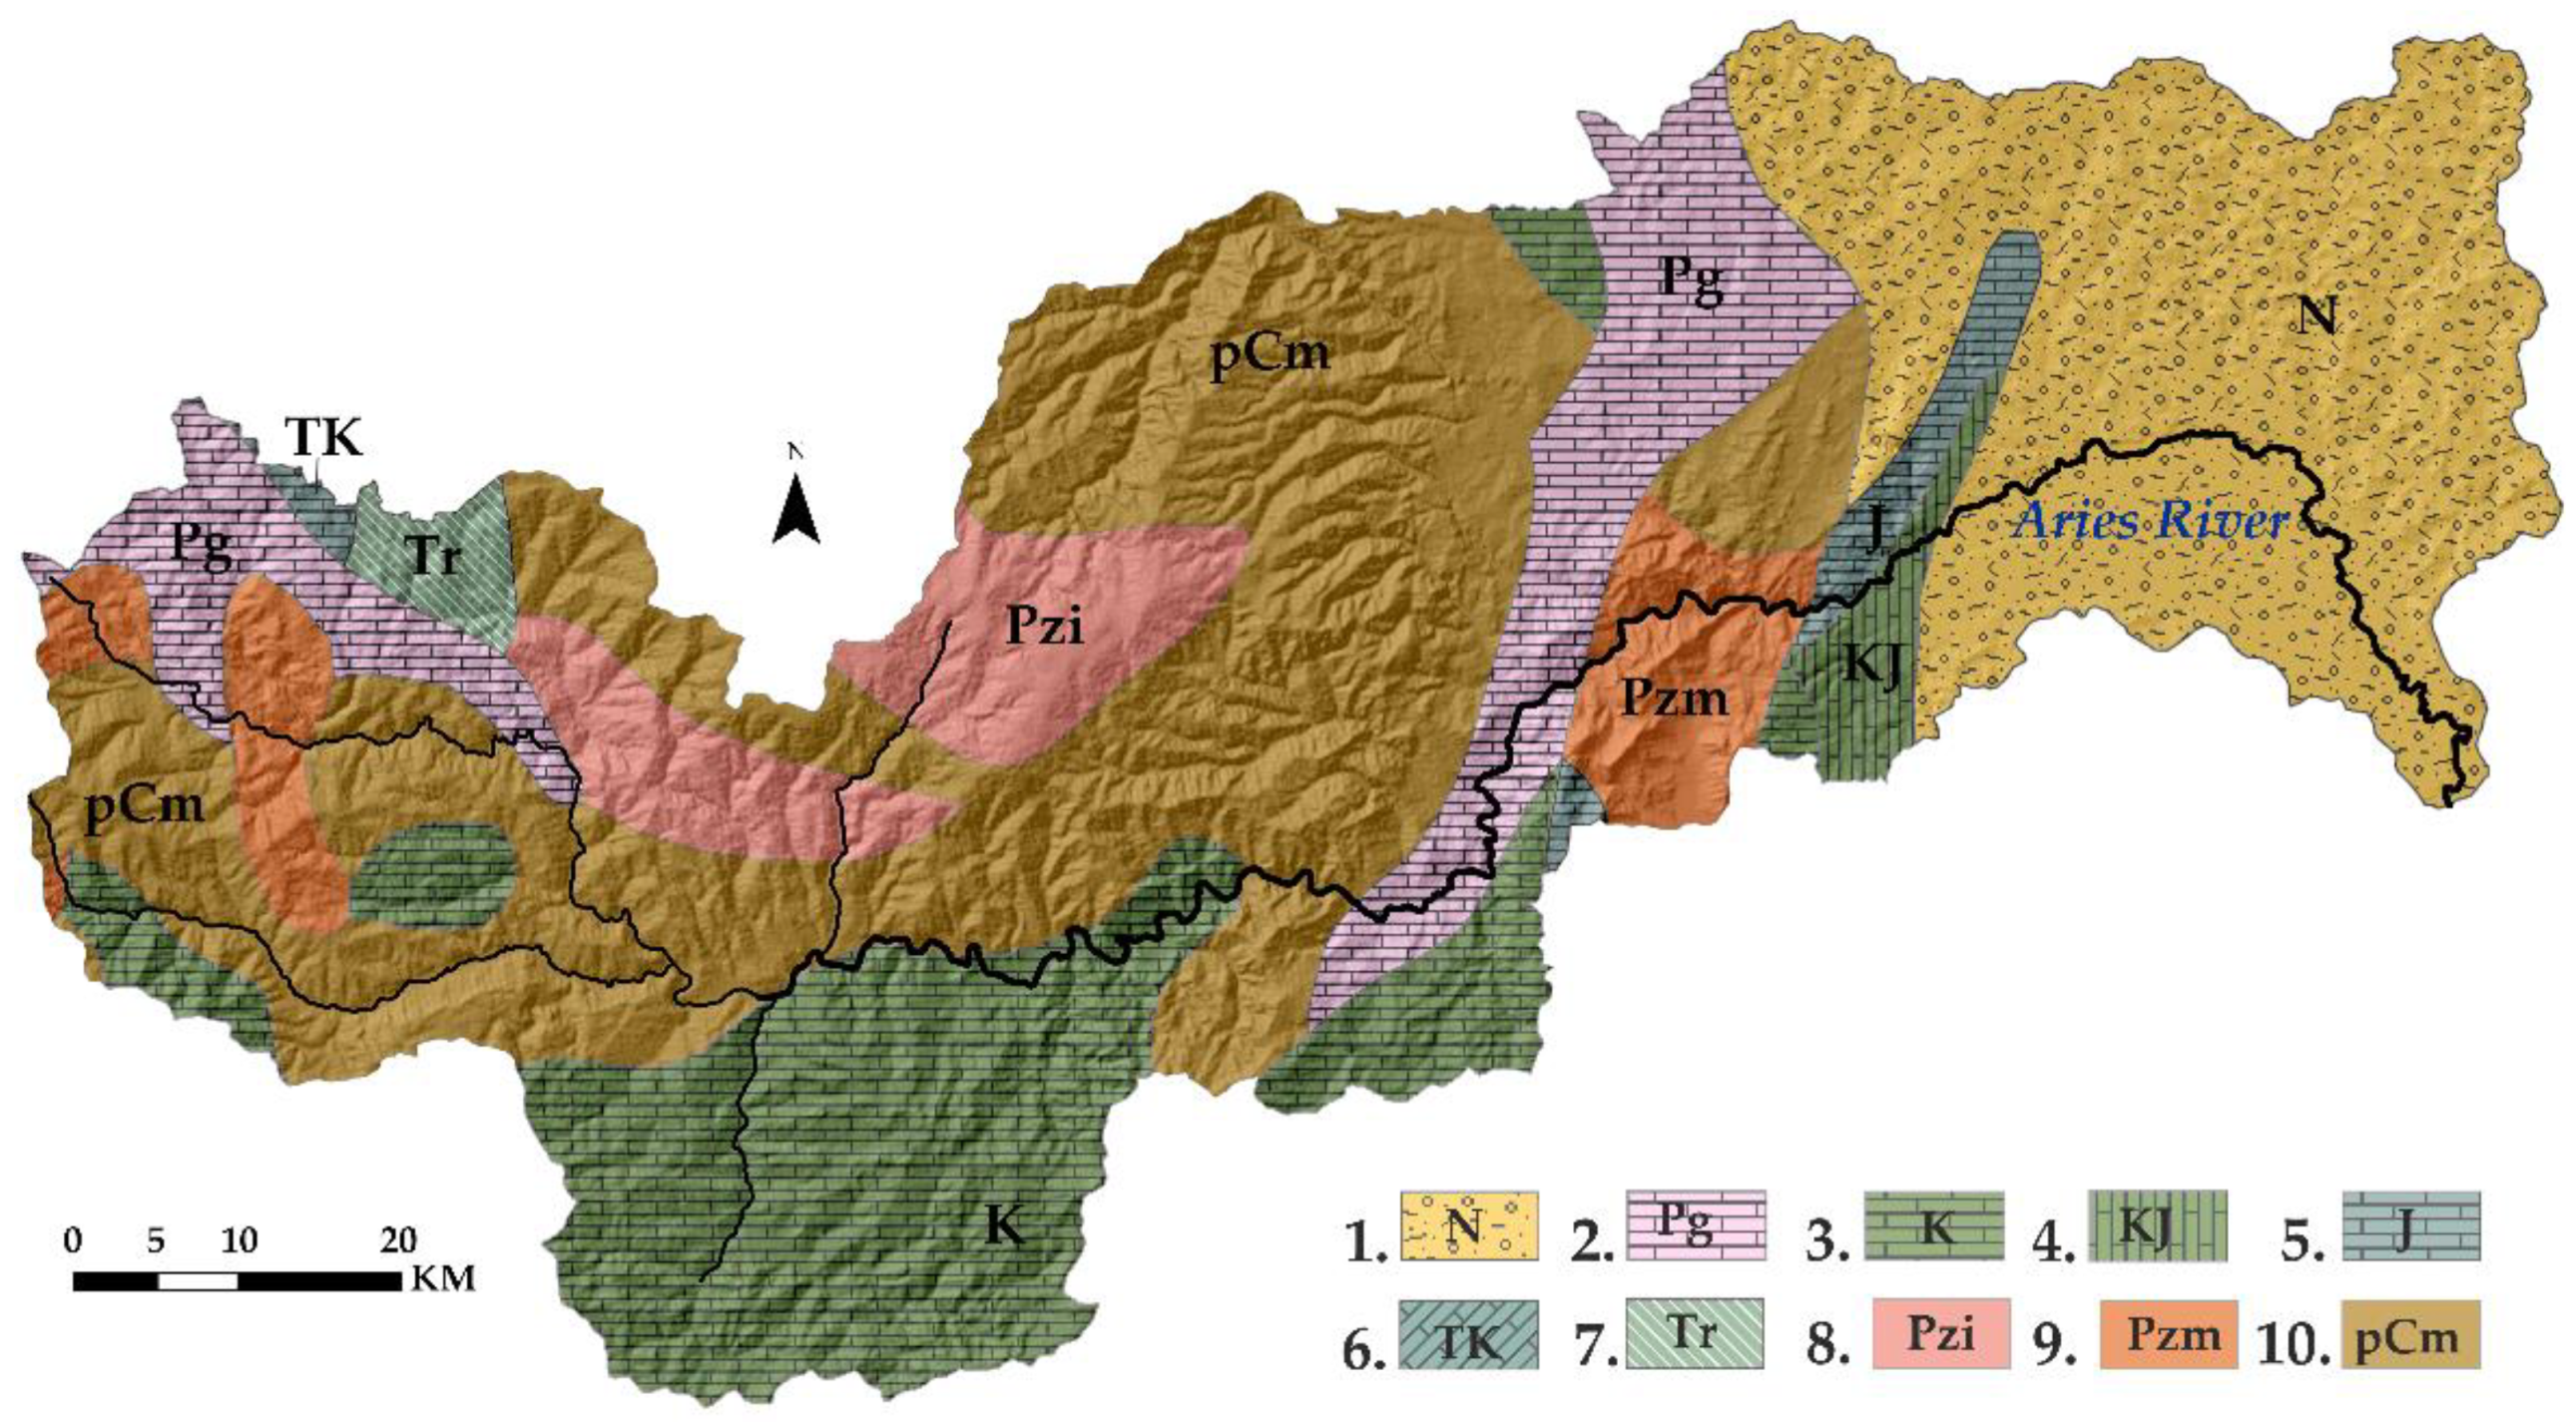
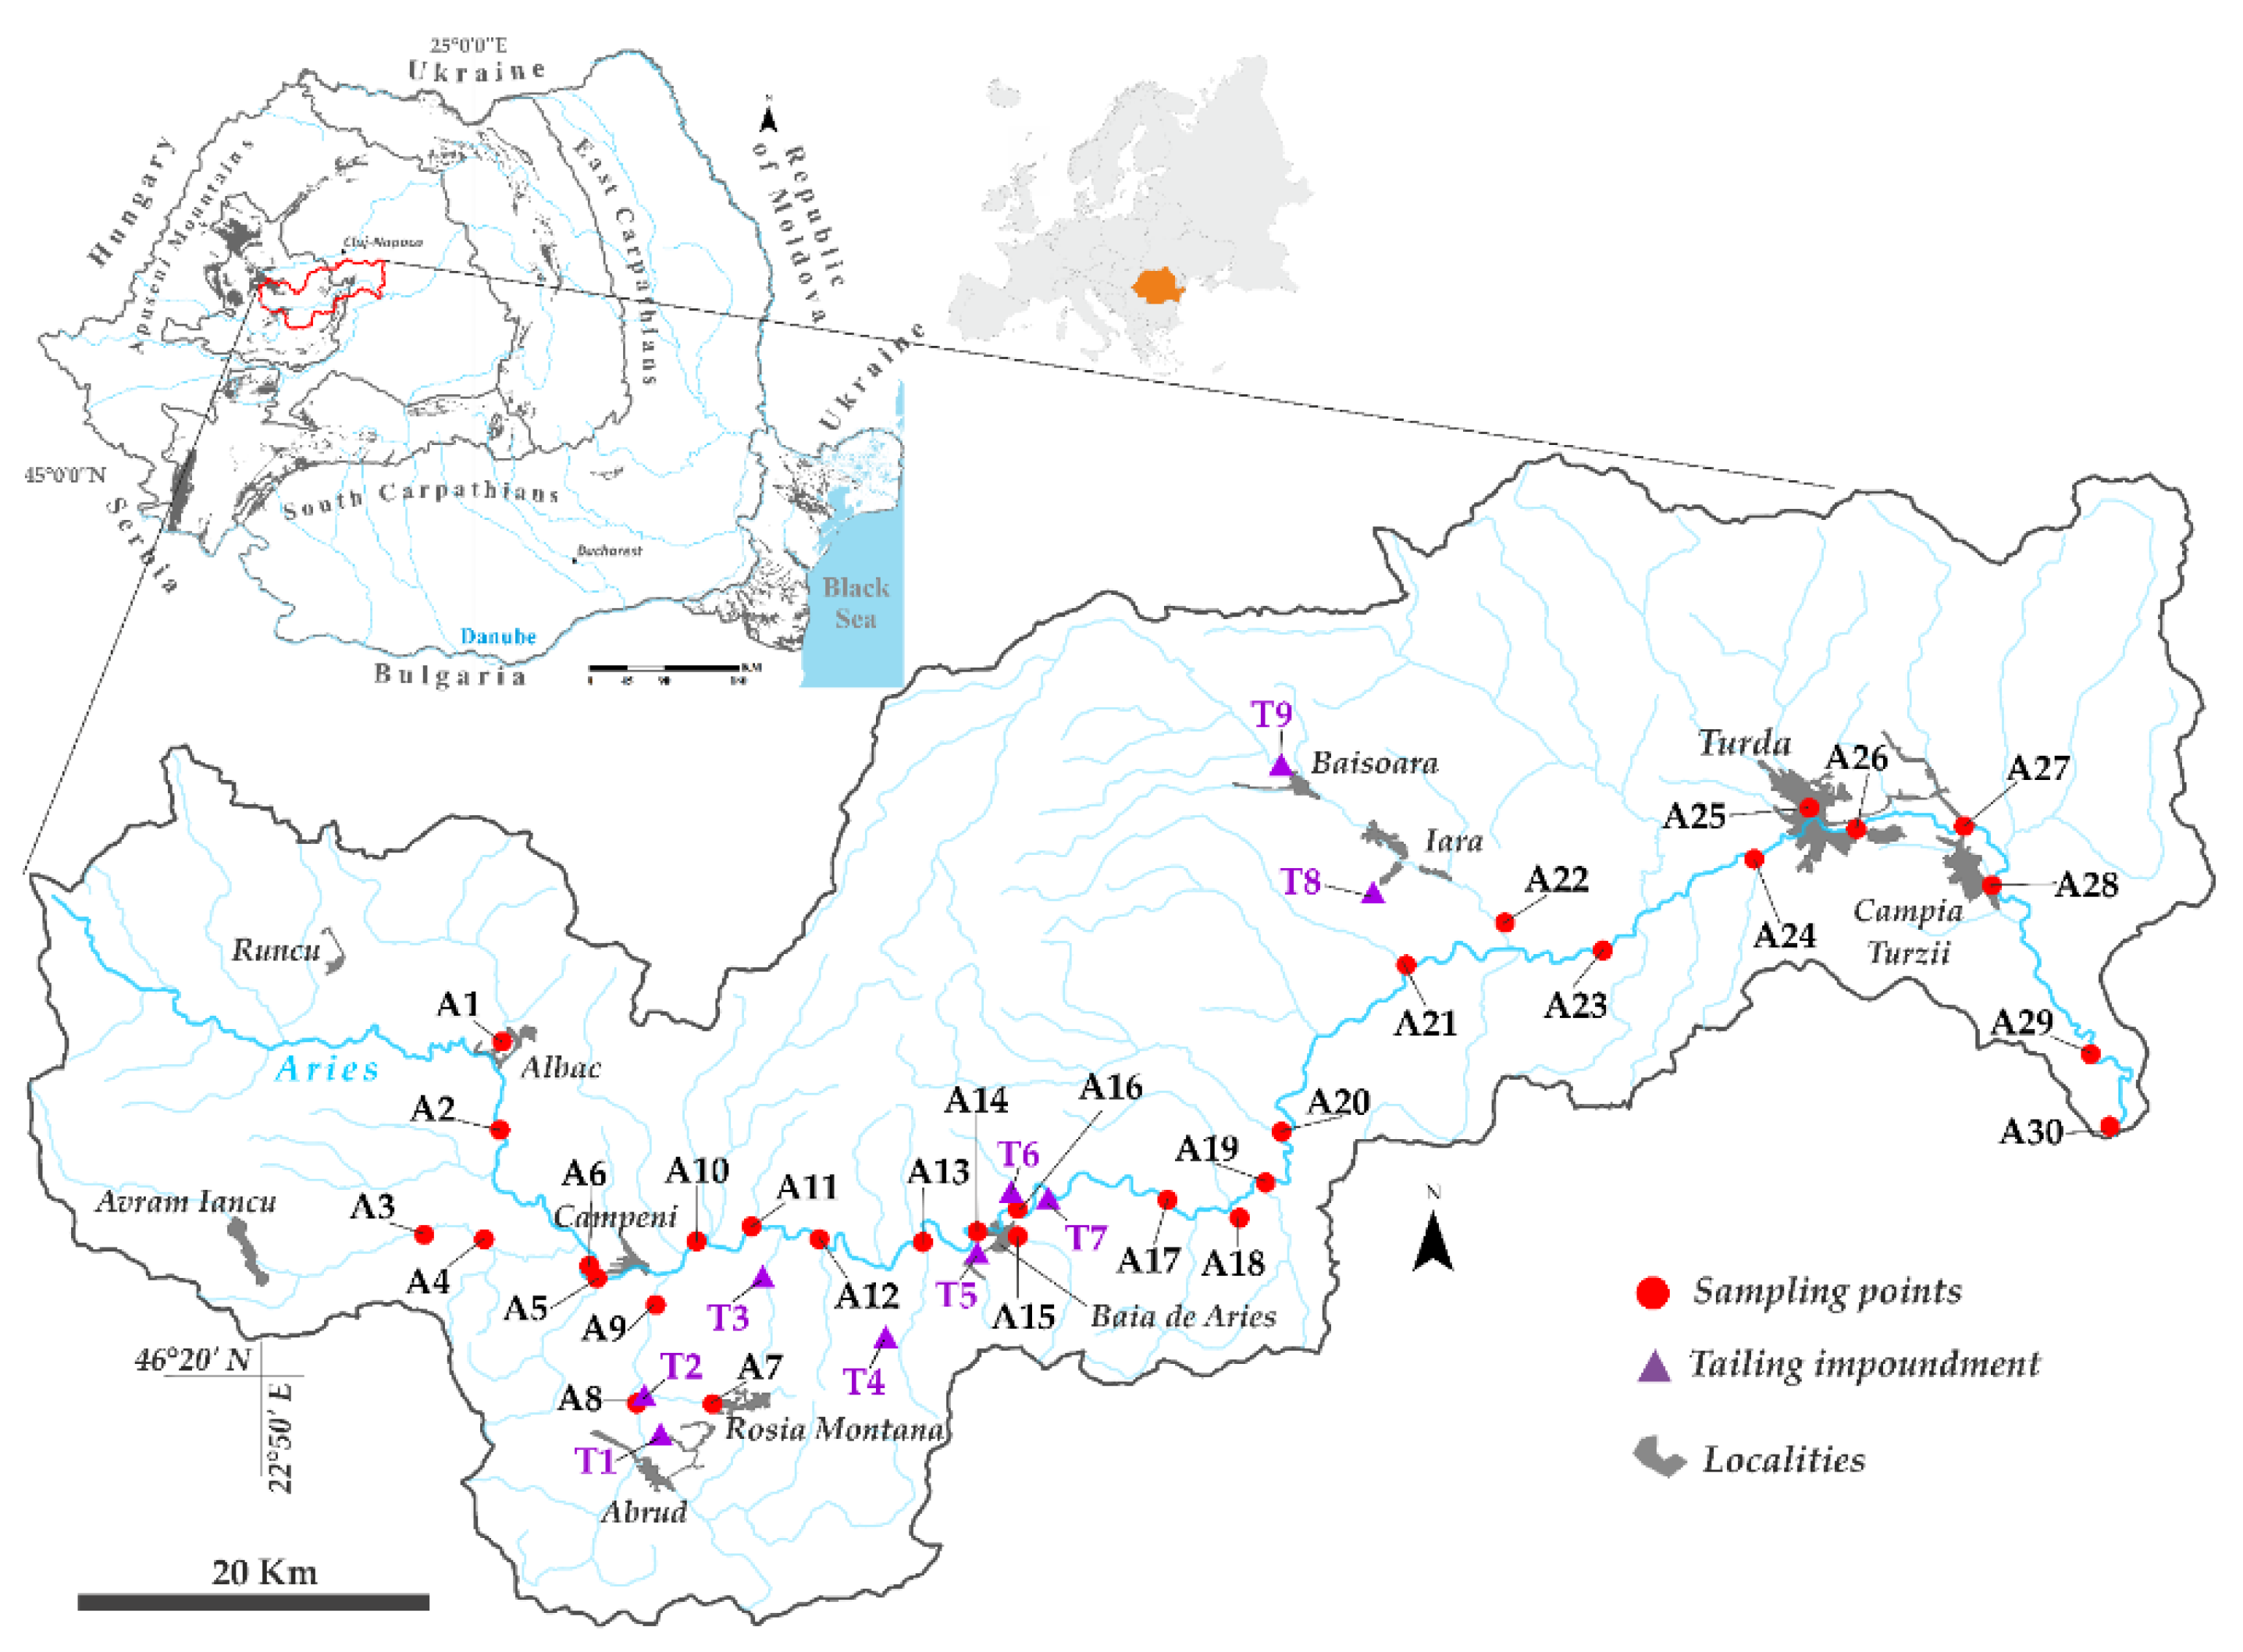
2.1. Geological Settings and Description of the Study Area

The Aries River catchment is part of the Romanian Golden Quadrangle, recognized for the Au, Ag and porphyry copper deposits from Rosia Poieni [20,21]. The Aries River catchment has more than 60% of its surface developed in the Apuseni Mountains and ~40% on the Transylvanian Plateau and Feleacului Hills [22]. The Apuseni Mountains are particular mountains in western Romania, characterized by diverse and unique landforms belonging to the Western Carpathians. The Transylvanian Plateau is represented by three distinct units (Somes Plateau, Transylvanian Plain and Tirnavelor Plateau), defined mostly by depressions, low plateaus and hills (the transition areas near mountains) with different geological structu Ref. [23]. Feleacului Hills cover only a small area of the Aries River catchment (north-eastern part), where marly to sandy clay soils appear, intercalated with sands and sandstones. The Aries River springs from Bihor Mountains (near VirfulVirtopu, 1294 m) and flows into the MuRes. River (near GuraAriesului village, 317 m), with a total length of ~166 km. The Aries River catchment covers several landscapes and landforms of Apuseni Mountains and Transylvanian Plateau (Bihor Mountains in the west part of the country; Metaliferi Mountains in thesouth-central area, Gilau-Muntele Mare in thenorth-central area of the catchment, Trascau Mountains in the south-east area, Feleacului Hills in the north-east area and Transylvanian Plateau in the east part of the country) [22].
The geological framework is diverse and represented by a variety of formations (from north to south), with basement tectonic units (metamorphic rocks and granites), sedimentary and volcanic cover in the northern area, while Middle Jurassic ophiolites, Late Jurassic volcanic rocks and Late Cretaceous sedimentary deposits dominate the southern part of Apuseni Mountains. Moreover, the groundwater resources in the Aries River catchment are mostly related to karst aquifers developed in limestones or fissured rocks, being part of local or discontinuous aquifers (southern part of the basin), while the northern area of the basin is characterized by formations with deep aquifers or without aquifers (Figure 1).
The most significant exploitations conducted in the catchment area are Rosia Montana, Rosia Poieni, Baia de Aries and Iara (Table 1) [21,25,26]. Tailings resulting from the oRes. extractions were stored in several tailing ponds, while all the wastewaters resulted from the mining activities and secondary processing of the oRes. are discharged into the tributaries of the Aries Rivers (Figure 2).Most of the mining and ore processing facilities were demolished or conserved;however, some of them were simply abandoned [27].At present, the open-cast mine Rosia Poieni is the only unity in operation, although reopening the exploitation of gold and silver oRes. at Rosia Montana has been largely debated during the last few years.
Over the years, several remediation measuRes. were taken, but the resulting wastes of the long periods of mining activities and their poor management have led to a significant deterioration of the quality of the natural environment [9,10,27,28].

2.2. Sampling and Analytical Procedures

The study area was selected based on the impacts generated by the mining and industrial activities on the water resources (Figure 2). To evaluate the quality of the surface water, a field survey was conducted across the Aries River catchment. A number of 30 samples were collected from the mainstream (17 samples—A6, A12, A15–A30) and from the tributaries (13 samples—A1–A5, A7–A11, A13, A14) in November 2018.
The samples were collected with a “Grab” device submerged at 20 cm under the water in polyethylene bottles pre-washed with 0.1N HNO3.The water samples were kept at 4 °C until the physico-chemical analysis, but no longer than 24 h.
The pH and electrical conductivity (EC) were measured on-field by using a portable 350I multiparameter (WTW, Weilheim, Germany). The total dissolved solids (TDS) were determined by gravimetry, while bicarbonates (HCO3) were determined by titration with 0.1 N HCl in the presence of bromocresol green indicator. The anions (F, Cl, NO2, NO3, PO43−, SO42−) concentration was measured by ion chromatography using an IC 761 Compact equipment (Metrohm, Herisau, Switzerland) after filtering the samples with 0.45 µm cellulose acetate membrane filters(Isolab, Eschau, Germany), used with no further purification treatments. Samples were directed injected into the equipment, characterized by a flow of 0.7 mL/min, 7.5 mPa pressure and 15.0 μS/cm electrical conductivity. Anions were separated through the anions exchange column and detected with the help of a conductivity detector [29].
For the determination of metals, the samples were filtered with 0.45 µm cellulose acetate membrane and acidified with 65% HNO3. The major cations (Fe, Na, Mg, K and Ca) were analyzed through an inductively coupled plasma optical emission spectrometer(ICP-OES, Perkin Elmer, Waltham, MA, USA), while the trace metals (Ni, Cr, Co, Cu, Zn, Cd, Pb, Mn, Ba, Al, Sr and As) were analyzed through an inductively coupled mass spectrometer (ELAN DRC II ICP-MS, Perkin Elmer, Waltham, MA, USA), due to the very low sensitivity of the equipment [29]. The instruments calibration was performed using analytical curves prepared with a multi-element standard solution from ICP Multi-Element Standard Solution IV (CertiPUR Merck, Darmstadt, Germany) in case of the ICP-OES and PerkinElmer Instrument Calibration Standard 3 in case of the ICP-MS.
In order to ensure the quality of the results, calibration standards, duplicate samples and procedural lab blanks were prepared and determined, in concordance with Moldovan et al. [30]. The accuracy of the metal determinations was tested using the 1643f NIST certified reference material (National Institute of Standards and Technology, Gaithersburg, MD, USA), while the anions were determined according to the IC1 Multi-element standard (CertiPUR Merck, Darmstadt, Germany). The mean recoveries ranged between 94% and 105% for the metals and between 89% and 102% for the anions.
All reagents were of analytical grade and were used without any further purification. Ultrapure water from a Millipore system (Molsheim, France) was used for all dilutions.

2.3. Pollution Assessment

The Heavy Metal Pollution Index (HPI) is a rating model that provides the aggregate influence of individual heavy metals on the overall quality of different water types [31,32]. Seven heavy metals (Cd, Cu, Fe, Mn, Ni, Pb and Zn) were used for the calculation of HPI. The HPI was computed in two steps, according to Equations (1) and (2) [33]:
H P I = i = 1 n ( Q i W i ) i = 1 n W i
Q i = M i S i × 100
where, Qi is the sub-index of the ith parameter, Wi is the unit weightage of the ith parameter and n is the number of the considered chemical parameters. Mi and Si are the concentration of the monitored ith parameter and the standard maximum allowable values (mg/L), according to the Romanian Regulation and to the European Directive concerning water quality [34,35].
HPI scoRes. below the threshold (HPI < 100) indicate low pollution with heavy metals, while scoRes. higher than 100 (HPI > 100) suggest that the water is unsuitable for consumption and, when consumed, it causes harmful health consequences. The case of an HPI > 100 indicates pollution with heavy metals [36].
The Heavy Metal Evaluation Index (HEI) is another tool for assessing water quality, offering an insight into the overall quality of water sources with respect to the heavy metals content, which is consistent with the HPI method. The HEI iscalculated based on Equation (3), according to Bhuiyan et al. [37], Edet and Offiong [38]. The surface water can be classified based on the HEI scores, as follows: surface waters with a low degree of pollution (HEI < 10), waters with a medium degree of pollution (10 < HEI < 20) and waters with a high pollution level (HEI > 20) [39].
H E I = i = 1 n M i S i
where Mi is the determined concentration of the ith parameter and Si represents the maximum allowable concentration (MAC) of the parameters. In the present study, Si values were considered according to the Romanian and International Regulations, namely the Minister Order 161/2006/OD and Directive 2008/32/CE, regarding the quality of surface water resources [34,35]

2.4. Water Quality Index (WQI)

One of the most effective tools in evaluating the quality of waters is represented by the Water Quality Index (WQI), showing the risk posed by the pollutants present in the water constituents matrix [16]. This method provides an overview of the quality status characterizing various water resources. The WQI is computed in four steps: (a) the assignment of the weights (wi) for each physico-chemical parameter based on its importance for the quality of the surface water (Table 2); (b) the calculation of the relative weight (Wi) using Equation (4); (c) establishing the quality rating (qi) according to Equation (5); (d) the calculation of the subindex for each physico-chemical parameter (SIi) and aggregation into the WQI. Equations (6) and (7) are Appl. in the last step of the method [16].
W i = w i i = 1 n w i
q i = w i S i × 100
S I i = W i × q i
WQI = i = 1 n S I i
where, wi is the weight of each parameter, Wi is the relative weight, qi represents the quality rating for each physico-chemical parameter, Ci and Si represent the concentration and the guideline value according to the drinking water quality guidelines established by the Minister Order 161/2006/OD and the Directive 2008/32/CE [34,35], SIi represents the subindex of the ith parameter.
The WQI scoRes. classify the studied waters into five different quality categories: (a) excellent—suitable for drinking, irrigation and industrial usages, WQI = 0–25; (b) good—suitable for domestic, irrigation and industrial usages, WQI = 26–50; (c) poor—suitable for irrigation and industrial usages, WQI = 51–75; (d) very poor—suitable for irrigation usage, WQI = 76–100 and (e) unsuitable for drinking purposes and restricted for irrigation, WQI > 100 [40,41].

2.5. Graphical Approaches of the Quality Status

Piper and Durov diagrams were generated by using AqQa software (free version). The studied water samples were classified, based on the specific concentrations of physico-chemical parameters. For the Piper diagram, specific indicators such as Cl, SO42−, Ca, Mg, Na, K, HCO3 and CO32−, concentrations were used, while for the Durov plot, the pH and TDS content were added [42,43].
To highlight the correlations and similarities among the physico-chemical indicators, the agglomerative hierarchical cluster analysis (HCA) based on the Ward method (Euclidean distance) was assessed. The method was Appl. using XLSTAT software.

2.6. Interpolation Methods Used for Representation of HPI, HEI and WQI

In order to assess the polluted areas, several interpolation methods from ArcGis 10.1 spatial analyst were used: IDW, Ordinary Kriging (OK) and Empirical Bayesian Kriging (EBK). From these methods, only the EBK method was appropriate to represent the contaminated areas regarding the number and the distribution of the sampling points in the Aries catchment. EBK was reported to have good results with small datasets regarding the contaminated areas [44]. However, in order to reduce the bias, the EBK was Appl. only to the mainstream and to the floodplain area around the Aries River (and few tributaries) for determining the polluted areas.

3. Results

3.1. Water Quality Assessment

The monitoring study was conducted in the rainy season (November 2018), which is more susceptible to indicate the actual values of the studied physico-chemical indicators, compared to the warm season, when due to the drought, the concentrations are higher. This season was not characterized by high precipitation amounts; therefore, the dissolution of the physico-chemical compounds and the low concentrations of the chemicals due to the washing by precipitations should be avoided. The total number of sampling sites was set to 30 points, randomly chosen, in order to analyze a number of 27 physico-chemical parameters. The obtained results, along with their statistical data, are presented in Table 3 and Table 4.
The pH of the water samples (7.2–8.7) was within the normal limits except for three sample points: A3 (9.0), A7 (2.8) and A13 (5.2), which were indicating a strong variation of the water character. The slightly alkaline pH values are explained by the dissolution of carbonate minerals [29], while the strong acid character can be attributed to the drainage of the acid mine wastewaters near two mining areas. Acid mine drainage is an important source of surface water pollution worldwide. Luis et al. (2009) reported the effects of the mine drainage into a hydrographic river catchment, in an area characterized by the abundance of sulfide ores, in Portugal [45].
Generally, tailings coming from mineral extraction areas are considered major sources of heavy metals and other chemical compounds (cyanide, sulfuric acid, ammonium nitrate). These chemicals are used during the separation processes of sterile from the ore and excavating machines. However, the natural geological units could also be the source of high amounts of toxic metals (e.g., Cd from sphalerite, Zn from sphalerite and As from oxidation of sulfide minerals pyrite) [46].
The analyzed surface water samples showed a low spatial variation of heavy metals (such as Cd, Mn, Ni and As). However, important differences were observed in the cases of the Fe, Cr, Co, Zn, Sr, Ba, and Al variability. It was observed that the metal concentrations varied in different sampling locations (Figure 3). Samples A9–A13 were characterized by the highest concentrations of As, Fe, Mn and Pb, exceeding the thresholds up to four times. The waters were sampled next to the tailing impoundments and connected to Rosia Montana and Rosia Poieni mining areas, indicating a significant impact on the chemical composition of the Aries River catchment over time. In the proximity of ValeaSesii tailing impoundment, A12 has the highest As, Fe and Mn concentrations, exceeding the thresholds. All samples were contaminated with Pb, with values ranging between 0.041 and 0.227, except for A19, which has a significant concentration of Pb as well, but below the threshold.
Cr, Co and Zn concentrations were below the limits established by the Romanian and European Regulations regarding the quality of water resources [34,35]. The highest Cr concentration was 0.087 mg/L (A14) nearby Baia de Aries (a former mine that stopped its activity in 2004). There are no available data of environmental quality remediation attempts in that area. The Cu and Zn concentrations have a low degree of variation: Cu was in the range of 0.088–0.108 mg/L, and Zn ranged between 0.010 and 0.240 mg/L. Pb (0.041–0.227 mg/L) was identified in samples connected to the tailing impoundments (A7, A9–A15).
Ni, Co and Cd concentrations had a very low spatial variation, indicating no anthropogenic interference in the water chemistry main processes. Ni ranged from 0.038 to 0.081 mg/L, Co from 0.050 mg/L to 0.069 mg/L, with the highest value in A11, while Cd concentrations ranged between 0.020 mg/L and 0.031 mg/L (A17).
In all studied samples, Ba and Al were within the normal limits, Ba ranged between 0.028 mg/L and 0.054 mg/L (A11) and Al between 0.033 mg/L and 0.230 mg/L (A20). Sr had the maximum value of 0.405 mg/L in A14, nearby Baia de Aries.
It was noticed that most of the contaminated sampling points with heavy metals were A7, A9, A12 and A13. The water samples sites were connected to Rosia Montana and Rosia Poieni mining areas, indicating a significant impact on the chemical composition of the Aries River catchment over time.
Previous studies conducted in the investigated area highlighted a high degree of pollution of the Abrud River (A9), emissary river of the Sesii Valley (A7) and of the Aries River, in the proximity of Baia de Aries (A13, A14) [10,47]. Relying on previous studies, it can be concluded that, even if the mining activity reduced or stopped operating in the studied area, the water quality did not present major improvements over time. Some studies indicated a long period of time until major improvements in the quality of the environment and surface waters in areas affected by mining activities are reached without any human intervention [48,49]. Thus, before overflowing into the effluent, wastewaters are highly recommended to be pretreated before being released into the environment in order to prevent the destruction of the natural water system and the imminent negative effects on human health. The nitrification, biochemical removal and thiocyanate processes are three successful wastewater treatment methods for addressing the sources of water contaminated by mining effluents [50]. Gonzalez-Merchan et al. [51] proposed an efficient treatment to neutralize the pH with wet Fe(VI) synthesized from Fe(NO3)3, FeCl3, or Fe2(SO4)3 and removing the toxic elements resulted from mining activities (gold extractions).

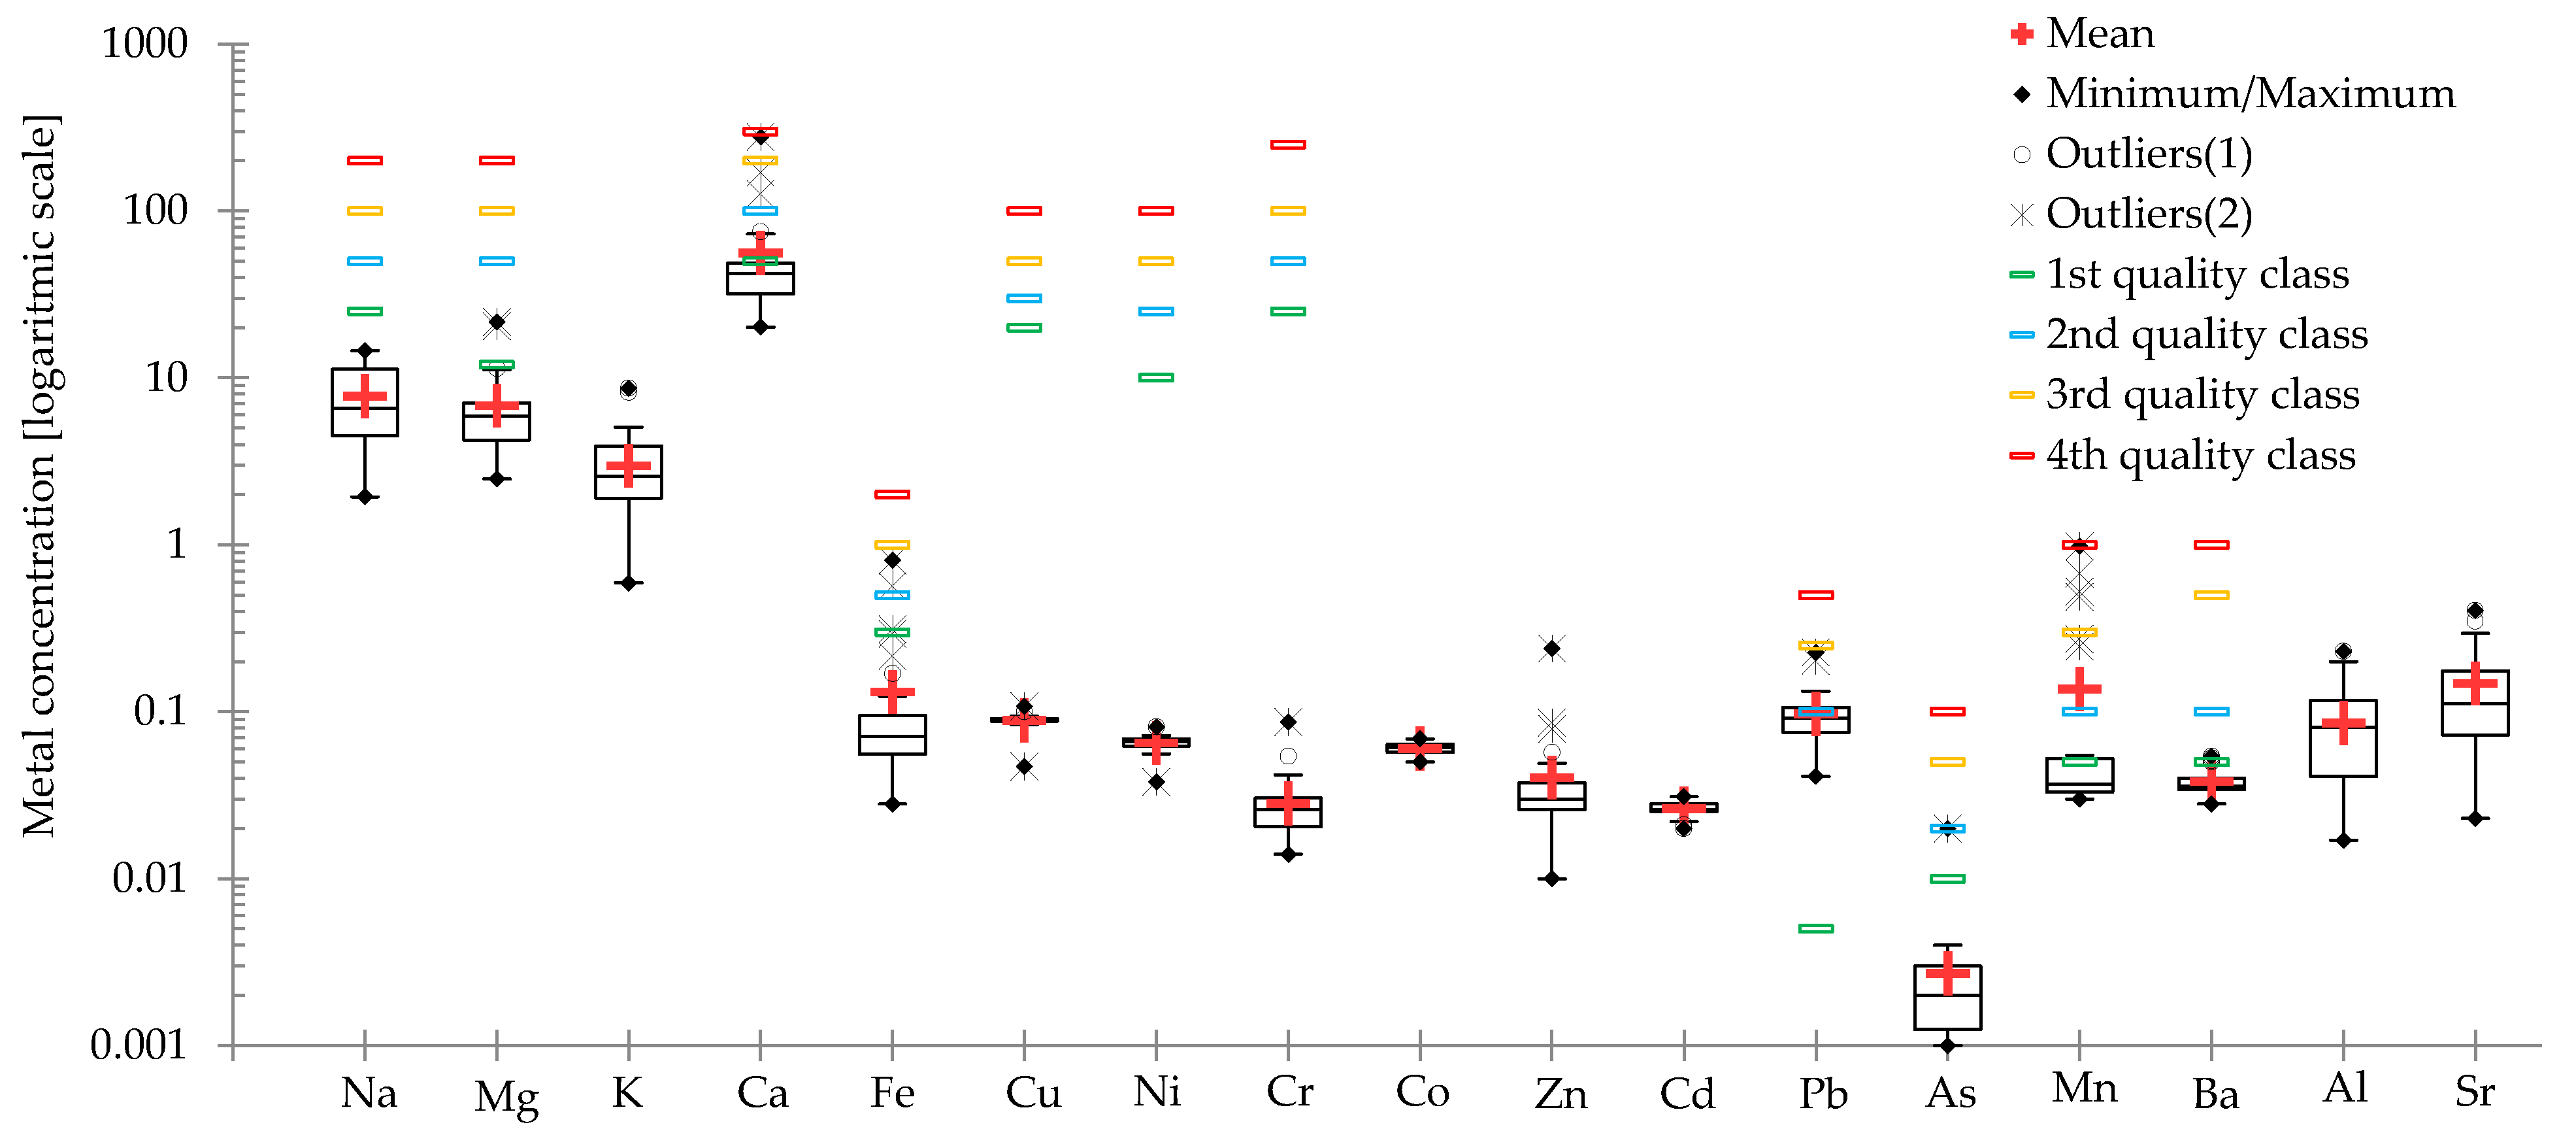
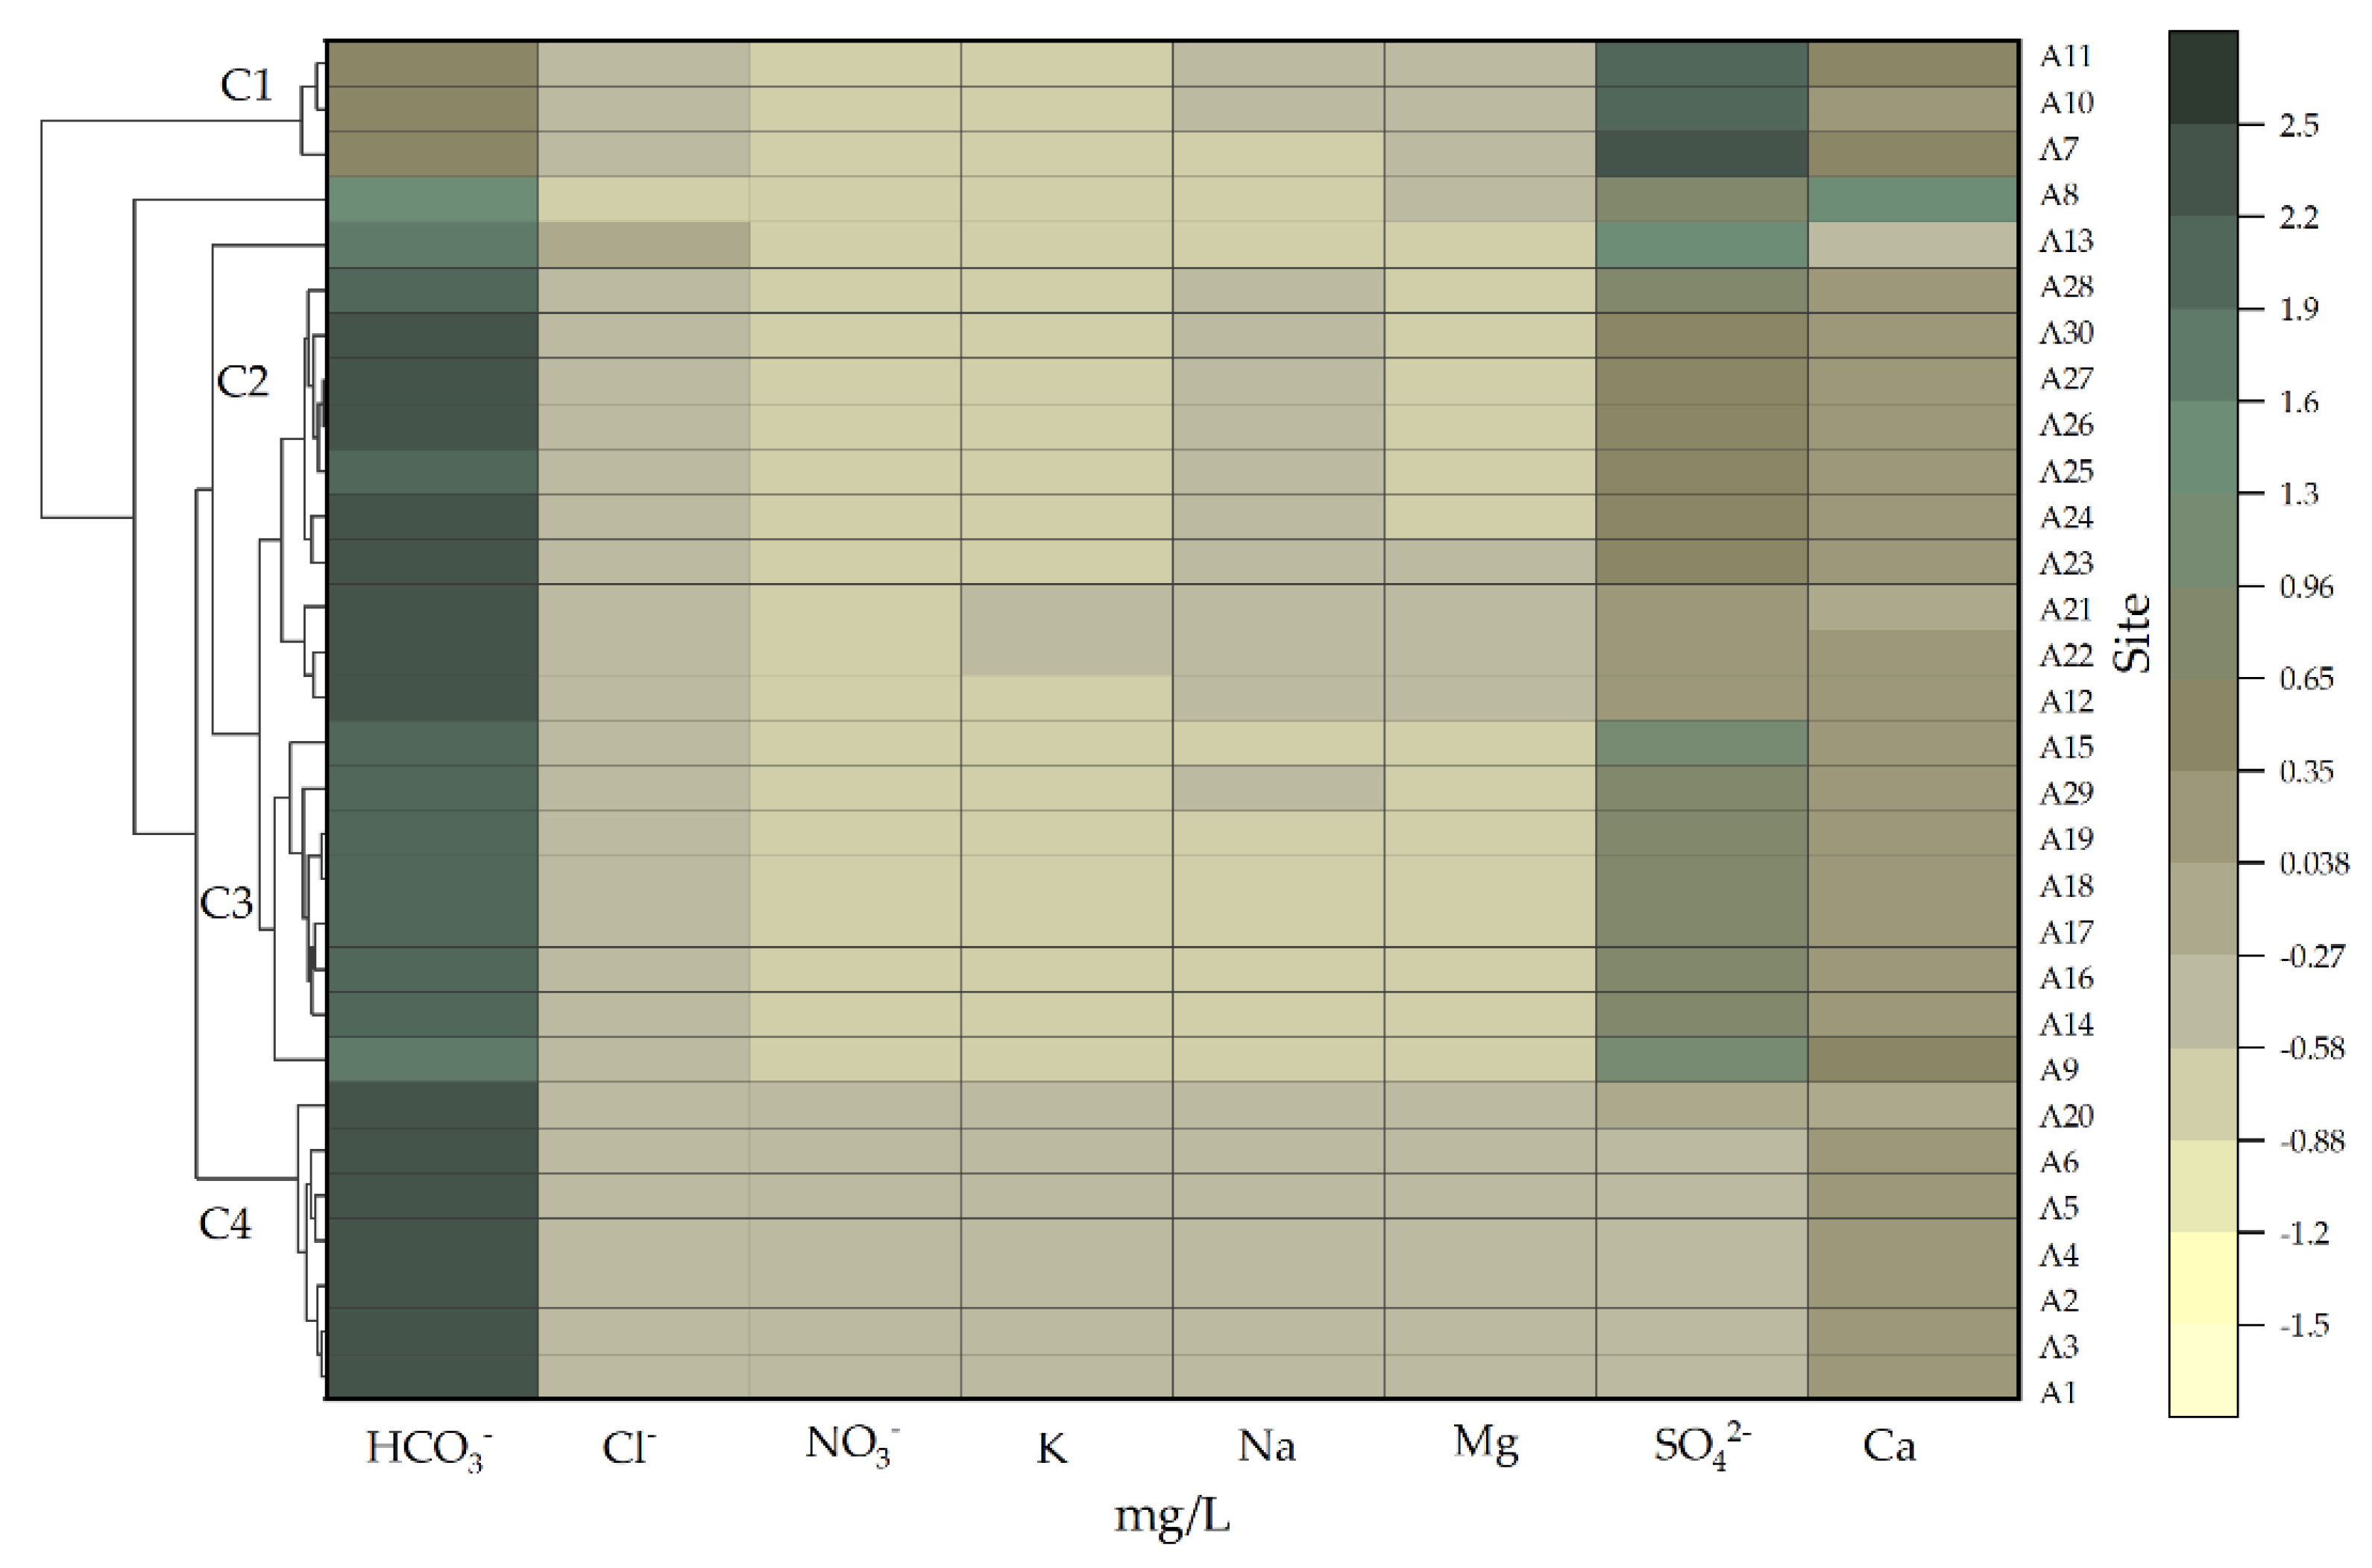
3.2. Cations and Anions Characteristics

The river chemistry is generally associated with human and atmospheric inputs: rock and soil weathering, evaporation and crystallization [42,52]. Ca (56.0 ± 52.1 mg/L) was the dominant major cation across the Aries River catchment, followed by Na (7.77 ± 1.98 mg/L), Mg (6.99 ± 4.52 mg/L) and K (2.96 ± 1.96 mg/L). Na concentration ranged between 1.90 and 14.6 mg/L, with the maximum concentration measured in A27 (Table 4). The highest levels of Mg, K and Ca were identified in A7 and A9. The Ca and Mg concentrations in the water samples from the Aries River catchment were higher than 75% of the total cation amount from the studied area, reflecting the predominance of carbonate weathering in the surface water. By contrast, HCO3 (118 ± 59.7 mg/L) and SO42− (80.5 ± 94.8 mg/L) were the most abundant major anions in the surface waters. The main sources of bicarbonate are the weathering and dissolution processes of different rocks, such as calcite, carbonate, silicate and dolomite. The increasing trend of SO42− concentration in A7 was not attributed to natural fluctuations but related to the industrial and agricultural activities in the Aries River catchment. The samples with the lowest SO42−concentration are also associated with the lowest TDS values.
The NO3 concentrations ranged between 0.5 and 2.5 mg/L. Generally, the lowest values of NO3 are correlated to the highest TDS values, except for sample A13, which was the richest sample in NO3 and had a high value for the TDS.
Regarding the Cl concentration, high values were noticed in samples A7 (42.9 mg/L) and A13 (45.8 mg/L), while in the rest of the samples, Cl ranged between 1.19 and 20.8 mg/L. Furthermore, the chloride (Cl) concentration indicated a low atmospheric contribution in the river catchment area. The highest Fconcentration was determined in sample A13 (0.33 mg/L), while the lowest was in samples A1, A2, A4 and A6.
NO2 and PO43− were lower than the quantification limits (0.05 mg/L) of the method. The low concentrations of anions in the samples A1–A6, A17–A24 were due to the lithology, low human interference and slow weathering rate. The high standard deviations of the anions indicated that the data were usually spread due to the spatial variations among all sites and possible anthropogenic impacts. Other surface waters from Europe are characterized by comparable concentrations of anions, ranging between 0.01 and 0.19 mg/L NO2; 4.51 and 6.49 mg/L NO3; 0.66 and 3.33 mg/L PO43−; 23.5and 265 mg/L SO42−in Coruh River Basin (Georgia and Turkey) and 30.0 and 2000 mg/L Cl, 0.1 and 30.0 mg/L NO3 and 550 and 1000 mg/L SO42−in El Avenque River (Spain) [53,54].
The high values of EC and TDS and the high concentrations of HCO3, SO42−, Mg, K, Ca and Pb determined in samples A7, A9 and A13 clearly indicated an input of mine drainage from the mining-affected sites. Ca and HCO3, K and NO3, Mg and SO42− were observed to have similar spatial variations (Figure 4). The trend of the highest composition of Ca and HCO3 in the Aries River was likely primarily derived from the dissolution of dolomite and from the dissolution of calcite (the upper and middle catchment area is represented mostly by karst landscape), while, based on the cation and anion concentrations, four different clusters were obtained. According to the hierarchical cluster analysis (HCA), four clusters were grouped, as indicated in Figure 4. Cluster 1 was formed by samples A7, A10 and A11, due to high values of Ca and SO42−. Cluster 4 grouped samples A1, A2, A3, A4, A5, A6 and A10, based on the low concentrations of F, Cl, NO3, SO42−, Mg and K. A13 and A8 were not linked to a particular cluster, due to a main characteristic of the sample (in the case of A8, due to a high concentration of SO42− and, in the case of A13, high concentration of HCO3).
The correlations and similarities among the chemical indicators were established with the agglomerative hierarchical cluster analysis. The performed HCA classifies all 30 water samples (A1–A30) into four clusters (Figure 5). Cluster 1 (C1) included pH, NO3, Al, Cd, Ni and Cu, Cluster 2 (C2) contained almost all of the anions (Cl, F, HCO3, SO42−), Ca, TDS and EC, while Cluster 3 (C3) included the rest of the cations (Mg, K, Na) and most of the metals (Sr, Cr, Ba, Fe, Pb, Co, Zn and Mn).
TDS, SO42− and Ca were grouped, suggesting the same source. The high values of TDS were due to the natural dissolution of gypsum or due to anthropogenic activities. NO3, Al, Cd, Ni and Cu (C1), and, respectively, Cr, Ba, Fe, Pb, Co, Zn and Mn (C3) were distant from EC/SO42−, indicating that those parameters behave quite differently. Therefore, a possible mechanism of establishing the main processes controlling the chemistry of surface waters was established. Mining activities are a source of toxic metals, while natural processes, such as the weathering of gypsum, could be the main source of Ca and SO42− [55]. NO3, Mn and As were clustered in sample A12, indicating the same source and similar chemical behavior.
The water types of the analyzed samples were determined using the Piper and Durov diagrams (Figure 6a,b). The hydrochemical facies and different types of waters were assessed based on the major cations and anions projected into the diamond field situated in the center of the Piper plot [32,42]. In the cation plot, most of the studied water samples were situated in the left corner, where the Ca concentration was high, indicating its dominance. In contrast, the anion diagram showed that most of the water samples were distributed in the lower-left corner, characterized by the dominance of HCO3 over Cl and SO42−. However, two samples were situated in the upper corner and dominated by SO42− over Cl and HCO3.
The overall characteristics of the chemistry in the surface water samples, according to the Piper diagram, are the dominance of the alkaline earth elements (Ca and Mg) over the alkaline elements (Na and K) and for the weak acids (HCO3) over the strong acids (SO42− + Cl).
The Piper and Durov diagrams showed that the water samples were divided into two main types: Mg-HCO3 type (A1–A6, A8, A12, A14, A16–A30), indicating their carbonate-dominant lithology and Ca-Cl type (A7, A9, A10, A11, A13, A15). The Durov plot also indicated that the majority of samples are alkaline, except for A7, A9 and A13, which were characterized by low pH values.

3.3. Pollution Index

The water quality of the study area was analyzed using several pollution indices. The HPI is used to characterize the potential environmental risk of heavy metals in water bodies, while HEI gives an overall quality of the water regarding the heavy metal concentration [13,38]. The spatial trends for the HPI and HEI in the Aries River catchment were calculated based on the following heavy metals: Cd, Cu, Fe, Mn, Ni, Pb and Zn. The number of heavy metals was reported to the standard values established by the Romanian Legislation, Order 161/2006/OD and Directive 2008/32/CE [34,35].
HEI ranged from 2.65 to 16.9, indicating a medium level of heavy metal pollution in 5 out of the 30 water samples. The highest HEI results were obtained in the case of A12 (HEI = 16.9), samples collected from the vicinity of Valea Sesii. Based on scaled HEI values, 83% of samples were classified as having low pollution levels and 17% with medium pollution levels (Figure 7b).
Studies from Africa indicated low and moderate–heavy metal pollution in the Malopane region (Dorpsrivier, Mogalakwena Deep pool, Dithokeng, Rooisloot, South Africa), a region with intensive agriculture and mining activities [56].

3.4. Water Quality Index and Vulnerability Assessment

The WQI provides a single value of expression, which outlines various parameters and gives a measure of the water quality. A number of 15 physico-chemical parameters were used for the calculation of the WQI (pH, TDS, Cl, NO3, SO42−, Na, Mg, Ca, Cu, Zn, Pb, Fe, Ni, Mn and As). The results ranged from 17.7 to 103 with a mean value of 31.9 (for all 30 samples), and the mean water quality was rated as “good” in general. Spatially, 21 samples were ranked with excellent quality, three samples with good quality (A14, A15, A16), four with medium quality (A9, A10, A11, A13), one sample was characterized by poor quality (A7) and one sample unsuitable for usage (A12). Thus, the WQI scores. were significantly different among the four spatial groups (Figure 8).
The WQI results were relatively high in Group I (with a mean of 19.1). The second group was characterized by a mean value of 62.9, with only one sample with a WQI score lower than 50 (WQI < 50). Group II area is localized nearby a tailing impoundment and an industrialized location. The WQI has a mean value of 28.2 in Group II. Water quality improves as the distance from mine drainage sources increases in Groups III and IV. According to the WQI classification, the general water quality state characterizes Group I with excellent quality, Group II with moderate quality and Groups III and IV with good and excellent quality.
The WQI scores obtained from different studies from Africa (Limpopo) range between 121 and 4644, indicating very poor quality water and not suitable for drinking due to the rich precipitation, high ionic activities and sedimentation [56]. In Turkey (Kirmir Basin), according to the WQI results, the studied water samples are characterized by very poor quality due to urbanization and anthropogenic activities; WQI ranged from 7.4 to 38.1 [57]. There were considerable spatial disparities in the assessed vulnerability of surface water resources in the study area.
Covering ≈ 68% of all the study area, the vulnerability level was generally reduced, especially in the western and eastern regions. In the central area of the Aries catchment, high and very high vulnerability levels were observed, overlapping with the discharge area of the tailing impoundments, washing water flux and all the streams influenced by their tributary’s poor-quality status. Similar to the water quality classification based on the WQI, a medium vulnerability level was overlying the area characterized by a quality improvement trend (Group III).
Surface water resources in the Apuseni Mountains are abundant, while the ratio between regional supply and water demand in the study area was relatively small. Due to the historical and current mining activities, agricultural water consumption, and low efficiency of water use, the vulnerability of water resources in the Aries catchment remains high.

4. Discussion

On a global scale, acid mine drainage is an important source of surface water pollution. Luis et al. (2009) reported the effects of mine drainage to a hydrographic river catchment in an area characterized by an abundance of sulfide ore bodies from Portugal [45].
The degree of the mineralization process could be reflected by the EC and TDS, which showed variations. The EC and TDS were positively correlated. In the case of samples A7, A8 and A13, the EC and TDS values were in the range of 901–1348 µS/cm and 712–952 mg/L, respectively. Similar results of pH, TDS and EC were reported in the surface water resources nearby the gold mining areas in Tongon—an open-pit gold mine that produced between 2012 and 2015 about 1.356 × 10⁷ tons of ores, located in Cote d’Ivoire Region, Africa [58]. In different parts of Europe (Georgia, Spain and Turkey), comparable results were obtained for Coruh and El Avenque Rivers with pH variation from 4.50 to 9.07, and EC from 114 to 1200 µS/cm [53,54].
In general, the sources of high amounts of heavy metals are industrial and mining activities [53,54]. Recent studies from Turkey and Georgia show relatively high amounts of heavy metals in surface waters, such as 0.33–2.88 µg/L Cd; 0.7–17.2 µg/L Co; 0.13–2.02 µg/L Cr; 0.06–895 µg/L Cu; 53.3–3140 µg/L Fe; 5.8–402 µg/L Mn; 1.4–21.0 µg/L Ni; 0.1–73.0 µg/L Pb and 7.6–537 µg/L Zn [53]. While in Spain (El Avenque River), the heavy metal content varied between 0.01 and 1.00 mg/L Cd, 0.01 and 0.15 mg/L Cu, 0.01 and 0.25 mg/L Pb, and 0.01 and 450 mg/L Zn [54].
In surface water in China, mining activities influenced the quality of water as well, by increasing the level of metals, the studied waters being characterized by relatively high concentrations of As (0.0–6.90 µg/L), Cr (0.95–42.9 µg/L), Cu (1.20–19.0 µg/L), Mn (2.65–168 µg/L), Ni (1.69–164 µg/L), Pb (0.91–28.2 µg/L) and Zn (2.74–490 µg/L) [59].
HPI results were ranging from 68.4 to 412, as indicated in Table 5, showing some pollution levels with the studied heavy metals. The spatial distribution of HPI results is presented in Figure 7a. The mean value of HPI results was 132, indicating a concerning risk of pollution with the analyzed heavy metals in the study area, more specifically with Pb, Mn and Fe. Different studies from Serbia (Ugljesnica River) and India (Bokaro River) indicated no heavy metal pollution with Cd, Cu, Fe, Mn, Pb, Zn with HPI scores. ranging from 66 to 90 and 2.0 to 26 [14,15] although the rivers are located nearby mining areas. In Nigeria (Commodore channel) and China (Houjing River), the HPI results ranged between 985 and 5995, and 100 and 230, indicating high amounts of heavy metals due to industrial (wastewaters, landfill leachate) and household activities [60,61].

5. Conclusions

According to the obtained results, the studied water system (Aries River) was characterized as vulnerable in the presence of mining activities and “historical” pollution.
The mean concentrations of the major ions were in the following order: Ca > Na > Mg > K, HCO3 > SO42− > Cl > NO3 > F, indicating that both natural processes and anthropogenic activities conducted in the study area played an important role in the water quality.
Neutral–alkaline and acid waters characterized the studied water according to the Durov and Piper plots, indicating low water quality. The similarities among the studied physico-chemical indicators given by the HCA indicated the sources of water pollution (natural and anthropogenic) and the low quality of water, respectively.
Even if, in general, the heavy metals concentration was not considered to be higher than the MACs, except for Fe, Mn and Pb, the HPI scores. revealed a relatively high degree of heavy metals pollution in all the studied samples, while the HEI indicated low to high levels of heavy metal pollution in the studied water samples, due to high Fe, Mn and Pb concentrations. According to the WQI, the water quality was classified as excellent, good (A14, A15, A16), medium (A9, A10, A11, A13), poor (A7) and very poor (A12).
Generally, the obtained results showed contamination with metals, especially with As, Fe, Mn and Pb, indicating a degree of vulnerability for the water from the Aries River catchment in front of the mining activities, with historical pollution still present. Furthermore, the Aries River needs immediate quality monitoring and proper treatment in order to prevent hazards and human healthfrom being affected. Thus, the obtained results could be very useful to the local authorities in implementing a sustainable and appropriate management strategy, indicating the clear vulnerability of the water system.

Author Contributions

Conceptualization, A.M., O.C. and V.M.; methodology, A.M., M.-A.H., R.B., O.C. and A.I.T.; sampling, M.R.; analysis, O.C., M.-A.H., A.M. and A.I.T.; visualization, A.M., A.I.T. and I.C.M.; writing—original draft preparation, A.M., M.-A.H., A.I.T. and I.C.M.; writing—review and editing, A.M., M.-A.H. and O.C.; funding acquisition, O.C. All authors have read and agreed to the published version of the manuscript.

Funding

This paper was supported by the Project “Entrepreneurial competences and excellence research in doctoral and postdoctoral programs—ANTREDOC”, a project co-funded by the European Social Fund and The Competitiveness Operational Programme of the Ministry of European Funds, code MY SMIS 107874.

Institutional Review Board Statement

Not applicable.

Informed Consent Statement

Not applicable.

Data Availability Statement

The data presented in this study is available on request from the corresponding author.

Conflicts of Interest

The authors declare no conflict of interest.

References

  1. UNESCO WWAP. The United Nations World Water Development Report, 2017: Wastewater: The Untapped Resource; UNESCO: Paris, France, 2017. [Google Scholar]
  2. UNESCO WWAP. The United Nations World Water Development Report 2016: Water and Jobs; UNESCO: Paris, France, 2016. [Google Scholar]
  3. Miclean, M.; Cadar, O.; Roman, C.; Tanaselia, C.; Stefanescu, L.; Stezar, C.I.; Groza, I.S. The Influence of Environmental Contamination on Heavy Metals and Organochlorine Compounds Levels in Milk. Environ. Eng. Manag. J. 2011, 10, 37–42. [Google Scholar] [CrossRef]
  4. Bonotto, D.M. Hydrogeochemical study of surface waters from Araxá city, Minas Gerais State, Brazil. J. Geochem. Explor. 2020, 213, 106521. [Google Scholar] [CrossRef]
  5. Cadar, O.; Miclean, M.; Cadar, S.; Toselia, C.; Senila, L.; Senila, M. Assessment of heavy metals in cows milk in Rodnei Mountains Area, Romania. Environ. Eng. Manag. J. 2015, 14, 2523–2528. [Google Scholar] [CrossRef]
  6. Protano, G.; Nannoni, F. Influence of ore processing activity on Hg, As and Sb contamination and fractionation in soils in a former mining site of Monte Amiata ore district (Italy). Chemosphere 2018, 199, 320–330. [Google Scholar] [CrossRef]
  7. Hoaghia, M.-A.; Cadar, O.; Levei, E.; Roman, C.; Senila, L.; Ristoiu, D. Assessment of potential contamination and health risk associated with metals in drinking waters from Copsa Mica region. Food Environ. Saf. 2015, XIV, 276–281. [Google Scholar]
  8. Bird, G.; Brewer, P.A.; Macklin, M.G.; Serban, M.; Balteanu, D.; Driga, B. Heavy metal contamination in the Arieş river catchment, western Romania: Implications for development of the Roşia Montană gold deposit. J. Geochem. Explor. 2005, 86, 26–48. [Google Scholar] [CrossRef]
  9. Levei, E.; Ponta, M.; Senila, M.; Miclean, M.; Frentiu, T. Assessment of contamination and origin of metals in mining affected river sediments: A case study of the Aries River catchment, Romania. J. Serb. Chem. Soc. 2014 79, 1019–1036. [CrossRef]
  10. Senila, M.; Levei, E.A.; Senila, L.R.; Roman, M. Preliminary Investigation concerning Metals Bioavailability in Waters of Aries River Catchment by Using the Diffusive Gradients in Thin Films Technique. J. Chem. 2015, 2015, 762121. [Google Scholar] [CrossRef]
  11. Butiuc-Keul, A.; Momeu, L.; Craciunas, C.; Dobrota, C.; Cuna, S.; Balas, G. Physico-chemical and biological studies on water from Aries River (Romania). J. Environ. Manag. 2012, 95, S3–S8. [Google Scholar] [CrossRef] [PubMed]
  12. Rzymski, P.; Klimaszyk, P.; Marszelewski, W.; Borowiak, D.; Mleczek, M.; Nowiński, K.; Pius, B.; Niedzielski, P.; Poniedziałek, B. The chemistry and toxicity of discharge waters from copper mine tailing impoundment in the valley of the Apuseni Mountains in Romania. Environ. Sci. Pollut. Res. 2017, 24, 21445–21458. [Google Scholar] [CrossRef] [PubMed] [Green Version]
  13. Prasad, B.; Bose, J. Evaluation of the heavy metal pollution index for surface and spring water near a limestone mining area of the lower Himalayas. Environ. Geol. 2001, 41, 183–188. [Google Scholar] [CrossRef]
  14. Milivojević, J.; Krstić, D.; Šmit, B.; Djekić, V. Assessment of Heavy Metal Contamination and Calculation of Its Pollution Index for Uglješnica River, Serbia. Bull. Environ. Contam. Toxicol. 2016, 97, 737–742. [Google Scholar] [CrossRef] [PubMed]
  15. Tiwari, A.K.; De Maio, M.; Singh, P.K.; Mahato, M.K. Evaluation of Surface Water Quality by Using GIS and a Heavy Metal Pollution Index (HPI) Model in a Coal Mining Area, India. Bull. Environ. Contam. Toxicol. 2015, 95, 304–310. [Google Scholar] [CrossRef]
  16. Horton, R.K. An index-number system for rating water quality. J. Water Pollut. Control Fed 1965, 37, 300–306. [Google Scholar]
  17. Adimalla, N.; Qian, H. Groundwater quality evaluation using water quality index (WQI) for drinking purposes and human health risk (HHR) assessment in an agricultural region of Nanganur, south India. Ecotox. Environl. Saf. 2019, 176, 153–161. [Google Scholar] [CrossRef]
  18. Wang, J.; Fu, Z.; Qiao, H.; Liu, F. Assessment of eutrophication and water quality in the estuarine area of Lake Wuli, Lake Taihu, China. Sci. Total Environ. 2019, 650, 1392–1402. [Google Scholar] [CrossRef]
  19. Sener, S.; Sener, E.; Davraz, A. Evaluation of water quality using water quality index (WQI) method and GIS in Aksu River (SW-Turkey). Sci. Total Environ. 2017, 584–585, 131–144. [Google Scholar] [CrossRef]
  20. Luca, E.; Chintoanu, M.; Roman, C.; Văşcan, D.; Luca, L.; Puşcaş, A.; Hoban, A. The identification of the sources of pollution from the Aries basin. Bull. Univ. Agric. Sci. Vet. Med. Cluj-Napoca Hortic. 2006, 63. [Google Scholar] [CrossRef]
  21. Steblez, W.G. The Mineral Industry of ROMANIA. U.S. Geological Survey Minerals Yearbook—1994–1999. Available online: https://www.usgs.gov/centers/nmic/europe-and-central-eurasia#ro (accessed on 10 May 2021).
  22. Bilaşco, Ș.; Cocean, P.; Nicula, G.; Drăgan, M. Conditionarea morfometrica a pretabilitatii de amenajare teritoriala in bazinul vaii Ariesului [Morphometric conditioning of territorial planning possibility in the Arieş river basin]. Geogr. Napoc. 2013, 7, 21–35. [Google Scholar]
  23. Petrea, D.; Bilașco, S.; Rosca, S.; Vescan, I.; Fodorean, I. The determination of the landslide occurrence probability by GIS spatial analysis of the land morphometric characteristics (Case Study: The Transylvanian Plateau). Carpath J. Earth Environ. Sci. 2014, 9, 91–102. [Google Scholar]
  24. Pawlewicz, M.J.; Finn, T.M. Vitrinite Reflectance Data for the Greater Green River Basin, Southwestern Wyoming, Northwestern Colorado, and Northeastern Utah. U.S. Geological Survey Open-File Report 2002. Available online: https://pubs.usgs.gov/of/2002/ofr-02-0339/ofr-02-0339.pdf (accessed on 27 January 2021).
  25. Banaduc, D.; Curtean-Banaduc, A.; Cianfaglione, K.; Akeroyd, J.R.; Cioca, L.I. Proposed Environmental Risk Management Elements in a Carpathian Valley Basin, within the Rosia Montana European Historical Mining Area. Int. J. Environ. Res. Public Health 2021, 18, 4565. [Google Scholar] [CrossRef]
  26. Stefanescu, L.; Costan, C.; Ozunu, A. Riscuri asociate stabilităţii iazurilor de decantare din bazinul mijlociu al Râului Arieş- in Romanian. ProEnvironment 2010, 3, 598–607. [Google Scholar]
  27. Levei, E.; Frentiu, T.; Ponta, M.; Tanaselia, C.; Borodi, G. Characterization and assessment of potential environmental risk of tailings stored in seven impoundments in the Aries river basin, Western Romania. Chem. Cent J. 2013, 7, 5. [Google Scholar] [CrossRef] [PubMed] [Green Version]
  28. Friedel, M.J.; Tindall, J.A.; Sardan, D.; Fey, D.L.; Poputa, G.L. Reconnaissance Study of Water Quality in the Mining-Affected Aries River Basin, Romania, 2331-1258. 2008.
  29. Hoaghia, M.-A.; Moldovan, A.; Kovacs, E.; Mirea, I.; Kenesz, M.; Brad, T.; Cadar, O.; Micle, V.; Levei, E.; Moldovan, O. Water Quality and Hydrogeochemical Characteristics of Some Karst Water Sources in Apuseni Mountains, Romania. Water 2021, 13, 857. [Google Scholar] [CrossRef]
  30. Moldovan, A.; Hoaghia, M.-A.; Kovacs, E.; Mirea, I.C.; Kenesz, M.; Arghir, R.A.; Petculescu, A.; Levei, E.A.; Moldovan, O.T. Quality and Health Risk Assessment Associated with Water Consumption—A Case Study on Karstic Springs. Water 2020, 12, 3510. [Google Scholar] [CrossRef]
  31. Rosca, O.M.; Dippong, T.; Marian, M.; Mihali, C.; Mihalescu, L.; Hoaghia, M.A.; Jelea, M. Impact of anthropogenic activities on water quality parameters of glacial lakes from Rodnei mountains, Romania. Environ. Res. 2020, 182, 109136. [Google Scholar] [CrossRef]
  32. Qu, L.; Huang, H.; Xia, F.; Liu, Y.; Dahlgren, R.A.; Zhang, M.; Mei, K. Risk analysis of heavy metal concentration in surface waters across the rural-urban interface of the Wen-Rui Tang River, China. Environ. Pollut. 2018, 237, 639–649. [Google Scholar] [CrossRef] [PubMed] [Green Version]
  33. Appiah-Opong, R.; Ofori, A.; Ofosuhene, M.; Ofori-Attah, E.; Nunoo, F.K.E.; Tuffour, I.; Gordon, C.; Arhinful, D.K.; Nyarko, A.K.; Fosu-Mensah, B.Y. Heavy metals concentration and pollution index (HPI) in drinking water along the southwest coast of Ghana. Appl. Water Sci. 2021, 11. [Google Scholar] [CrossRef]
  34. ORDER, No. 161 for the Approval of the Norm Regarding the Classification of Surface Water Quality in Order to Establish the Ecological Status of Water Bodies. Available online: http://www.monitoruljuridic.ro/monitorul-oficial/161/2006-02-21 (accessed on 15 April 2021).
  35. Directive 2008/32/EC of the European Parliament and of the Council of 11 March 2008 amending Directive 2000/60/EC Establishing a Framework for Community Action in the Field of Water Policy, as Regards the Implementing Powers Conferred on the Commission OJ L 81. 20 May 2008, pp. 60–61. Available online: https://eur-lex.europa.eu/legal-content/EN/ALL/?uri=celex:32008L0032 (accessed on 15 April 2021).
  36. Wątor, K.; Zdechlik, R. Application of water quality indices to the assessment of the effect of geothermal water discharge on river water quality—Case study from the Podhale region (Southern Poland). Ecol. Indic. 2021, 121. [Google Scholar] [CrossRef]
  37. Bhuiyan, M.A.; Islam, M.A.; Dampare, S.B.; Parvez, L.; Suzuki, S. Evaluation of hazardous metal pollution in irrigation and drinking water systems in the vicinity of a coal mine area of northwestern Bangladesh. J. Hazard. Mater. 2010, 179, 1065–1077. [Google Scholar] [CrossRef] [PubMed]
  38. Edet, A.E.; Offiong, O.E. Evaluation of water quality pollution indices for heavy metal contamination monitoring. A study case from Akpabuyo-Odukpani area, Lower Cross River Basin (southeastern Nigeria). GeoJournal 2002, 57, 295–304. [Google Scholar] [CrossRef]
  39. Karaouzas, I.; Kapetanaki, N.; Mentzafou, A.; Kanellopoulos, T.D.; Skoulikidis, N. Heavy metal contamination status in Greek surface waters: A review with application and evaluation of pollution indices. Chemosphere 2021, 263, 128192. [Google Scholar] [CrossRef]
  40. Nong, X.; Shao, D.; Zhong, H.; Liang, J. Evaluation of water quality in the South-to-North Water Diversion Project of China using the water quality index (WQI) method. Water Res. 2020, 178, 115781. [Google Scholar] [CrossRef] [PubMed]
  41. Mahadevan, H.; Krishnan, K.A.; Pillai, R.R.; Sudhakaran, S. Assessment of urban river water quality and developing strategies for phosphate removal from water and wastewaters: Integrated monitoring and mitigation studies. SN Appl. Sci. 2020, 2. [Google Scholar] [CrossRef] [Green Version]
  42. Pant, R.R.; Zhang, F.; Rehman, F.U.; Wang, G.; Ye, M.; Zeng, C.; Tang, H. Spatiotemporal variations of hydrogeochemistry and its controlling factors in the Gandaki River Basin, Central Himalaya Nepal. Sci. Total Environ. 2018, 622–623, 770–782. [Google Scholar] [CrossRef] [PubMed]
  43. Numanbakth, M.A.A.; Howladar, M.F.; Faruque, M.O.; Sohail, M.A.; Rahman, M.M. Understanding the hydrogeochemical characteristics of natural water for irrigation use around the hard rock mine in Maddhapara, Northwest Bangladesh. Groundw. Sustain. Dev. 2019, 8, 590–605. [Google Scholar] [CrossRef]
  44. Mirzaei, R.; Sakizadeh, M. Comparison of interpolation methods for the estimation of groundwater contamination in Andimeshk-Shush Plain, Southwest of Iran. Environ. Sci. Pollut. Res. Int. 2016, 23, 2758–2769. [Google Scholar] [CrossRef]
  45. Luís, A.T.; Teixeira, P.; Almeida, S.F.P.; Ector, L.; Matos, J.X.; Ferreira da Silva, E.A. Impact of Acid Mine Drainage (AMD) on Water Quality, Stream Sediments and Periphytic Diatom Communities in the Surrounding Streams of Aljustrel Mining Area (Portugal). Water Air Soil Pollut. 2008, 200, 147–167. [Google Scholar] [CrossRef]
  46. Rakotondrabe, F.; Ngoupayou, J.R.N.; Mfonka, Z.; Rasolomanana, E.H.; Nyangono Abolo, A.J.; Asone, B.L.; Ako Ako, A.; Rakotondrabe, M.H. Assessment of Surface Water Quality of Bétaré-Oya Gold Mining Area (East-Cameroon). J. Water Resource Prot 2017, 09, 960–984. [Google Scholar] [CrossRef] [Green Version]
  47. Levei, E.; Senila, M.; Miclean, M.; Abraham, B.; Roman, C.; Stefanescu, L.; Moldovan, O.T. Influence of Rosia Poieni and Rosia Montana Mining Areas on the Water Quality of the Aries River. Environ. Eng. Manag. J. 2011, 10, 23–29. [Google Scholar] [CrossRef]
  48. Son, J.; Kim, J.G.; Hyun, S.; Cho, K. Screening level ecological risk assessment of abandoned metal mines using chemical and ecotoxicological lines of evidence. Environ. Pollut. 2019, 249, 1081–1090. [Google Scholar] [CrossRef]
  49. Wang, P.; Sun, Z.; Hu, Y.; Cheng, H. Leaching of heavy metals from abandoned mine tailings brought by precipitation and the associated environmental impact. Sci. Total Environ. 2019, 695, 133893. [Google Scholar] [CrossRef]
  50. Di Biase, A.; Wei, V.; Kowalski, M.S.; Bratty, M.; Hildebrand, M.; Jabari, P.; Devlin, T.R.; Oleszkiewicz, J.A. Ammonia, thiocyanate, and cyanate removal in an aerobic up-flow submerged attached growth reactor treating gold mine wastewater. Chemosphere 2020, 243, 125395. [Google Scholar] [CrossRef] [PubMed]
  51. Gonzalez-Merchan, C.; Genty, T.; Paquin, M.; Gervais, M.; Bussière, B.; Potvin, R.; Neculita, C.M. Influence of ferric iron source on ferrate’s performance and residual contamination during the treatment of gold mine effluents. Miner. Eng. 2018, 127, 61–66. [Google Scholar] [CrossRef]
  52. Wang, B.; Lee, X.-Q.; Yuan, H.-L.; Zhou, H.; Cheng, H.-G.; Cheng, J.-Z.; Zhou, Z.-H.; Xing, Y.; Fang, B.; Zhang, L.-K.; et al. Distinct patterns of chemical weathering in the drainage basins of the Huanghe and Xijiang River, China: Evidence from chemical and Sr-isotopic compositions. J. Asian Earth Sci. 2012, 59, 219–230. [Google Scholar] [CrossRef]
  53. Bilgin, A.; Konanç, M.U. Evaluation of surface water quality and heavy metal pollution of Coruh River Basin (Turkey) by multivariate statistical methods. Environ. Earth Sci. 2016, 75. [Google Scholar] [CrossRef]
  54. Zornoza, R.; Carmona, D.M.; Acosta, J.A.; Martínez-Martínez, S.; Weiss, N.; Faz, Á. The Effect of Former Mining Activities on Contamination Dynamics in Sediments, Surface Water and Vegetation in El Avenque Stream, SE Spain. Water Air Soil Pollut. 2011, 223, 519–532. [Google Scholar] [CrossRef]
  55. Yaraghi, N.; Ronkanen, A.-K.; Torabi Haghighi, A.; Aminikhah, M.; Kujala, K.; Kløve, B. Impacts of gold mine effluent on water quality in a pristine sub-Arctic river. J. Hydrol. 2020, 589. [Google Scholar] [CrossRef]
  56. Molekoa, M.; Avtar, R.; Kumar, P.; Thu Minh, H.; Dasgupta, R.; Johnson, B.; Sahu, N.; Verma, R.; Yunus, A. Spatio-Temporal Analysis of Surface Water Quality in Mokopane Area, Limpopo, South Africa. Water 2021, 13, 220. [Google Scholar] [CrossRef]
  57. Tunc Dede, O.; Telci, I.T.; Aral, M.M. The Use of Water Quality Index Models for the Evaluation of Surface Water Quality: A Case Study for Kirmir Basin, Ankara, Turkey. Water Qual. Expo. Health 2013, 5, 41–56. [Google Scholar] [CrossRef]
  58. Sako, A.; Semdé, S.; Wenmenga, U. Geochemical evaluation of soil, surface water and groundwater around the Tongon gold mining area, northern Côte d’Ivoire, West Africa. J. Afr. Earth Sci. 2018, 145, 297–316. [Google Scholar] [CrossRef]
  59. Wei, W.; Ma, R.; Sun, Z.; Zhou, A.; Bu, J.; Long, X.; Liu, Y. Effects of Mining Activities on the Release of Heavy Metals (HMs) in a Typical Mountain Headwater Region, the Qinghai-Tibet Plateau in China. Int. J. Environ. Res. Public Health 2018, 15, 1987. [Google Scholar] [CrossRef] [PubMed] [Green Version]
  60. Charles, I.A.; Nubi, O.A.; Adelopo, A.O.; Oginni, E.T. Heavy metals pollution index of surface water from Commodore channel, Lagos, Nigeria. Afr. J. Environ. Sci. Technol. 2018, 12, 191–197. [Google Scholar] [CrossRef]
  61. Yeh, G.; Hoang, H.G.; Lin, C.; Bui, X.T.; Tran, H.T.; Shern, C.C.; Vu, C.T. Assessment of heavy metal contamination and adverse biological effects of an industrially affected river. Environ. Sci. Pollut. Res. Int. 2020, 27, 34770–34780. [Google Scholar] [CrossRef] [PubMed]
Figure 1. Geologic map of the Aries catchment (modified after Pawlewicz et al., 2002 [24]). 1. Neogene; 2. Paleogene; 3. Cretaceous; 4. Cretaceous–Jurassic; 5. Jurassic; 6. Triassic–Cretaceous; 7. Triassic; 8. Paleozoic intrusive rocks; 9. Paleozoic metamorphic rocks; 10. Undivided Precambrian.
Applsci 11 06592 g001
Figure 2. Location of the sampling points and the main tailings impoundments in the Aries River catchment.
Applsci 11 06592 g002
Figure 3. The variation of elements in the sampling sites.
Applsci 11 06592 g003
Figure 4. The logarithmic distribution of chemical parameters concentrations (HCO3, Cl, NO3, K, Na, Mg, SO42−, Ca) among the sampling points with the corresponding dendrograms.
Applsci 11 06592 g004
Figure 5. Hierarchical cluster analysis of the physico-chemical indicators for the studied samples.
Applsci 11 06592 g005
Figure 6. Durov (a) and Piper (b) diagrams describing the water facies of the studied surfacewaters.
Applsci 11 06592 g006
Figure 7. Spatial variation of heavy metal pollution index HPI (a) and heavy metal evaluation index HEI (b).
Applsci 11 06592 g007
Figure 8. Spatial variation of the water quality index (WQI).
Applsci 11 06592 g008
Table 1. Characteristics of the main tailing impoundments located in the Aries Rciver catchment [27].
Deposit TypeExtraction TechniqueCurrent
Status
Tailing
Impoundment
Deposit
Volume
(mil m3)
Rosia MontanaAu ores
Ag ores
Cu ores
Open-pit gold mineClosed
since 2006
Seliste6.60
Gura Rosie5.80
Rosia PoieniPorphyritic CuOpen-pit copper mineOpenStefanca11.0
Sesei66.0
Baia de AriesLead-zinc ferrous
Gold-silver ferrous
Gallery mineClosed
since 2004
Cutii1.62
Sartas2.86
Brazesti3.47
IaraFe ores
Mg ores
Open pit mineClosed
since 2005
Baisoara3.33
FagetulIerii1.56
Table 2. List of the parameter values (Si), weights (wi) and relative weights (Wi) used for the calculation of the WQI.
ParameterUnitSi *wiWi
pH-6.5–8.530.06
TDSmg/L130050.10
Camg/L30040.08
Mgmg/L20040.08
Namg/L20020.04
Clmg/L30040.08
NO3mg/L11.250.10
SO42−mg/L30030.06
Asmg/L0.10030.06
Mnmg/L0.10030.06
Femg/L0.20030.06
Pbmg/L0.05030.06
Nimg/L0.10030.06
Znmg/L1.0030.06
Cumg/L1.0030.06
w i = 51 W i = 1.00
* Ministerial Order 161/2006/OD and Directive 2008/32/CE [34,35].
Table 3. Trend of spatial variation of the physico-chemical parameters analyzed in the Aries River water samples.
pHCE
(µs/cm)
TDS
(mg/L)
HCO3
(mg/L)
FClNO3SO43−
A17.618816787.60.068.091.184.78
A27.520215497.60.068.221.225.82
A38.717316294.20.088.611.026.83
A48.314015973.60.061.910.995.67
A58.215716884.50.072.131.085.74
A69.016817880.60.066.521.225.13
A72.89019523020.1542.90.67465
A87.28244851220.1512.80.776.82
A95.24944142770.1214.30.92214
A107.262041262.40.1215.00.88202
A117.457640579.30.1115.50.50194
A127.622223190.70.087.652.3332.2
A135.213487122620.3345.82.45208
A148.04954081710.1319.10.5893.2
A158.035731272.10.1214.21.1187.3
A168.128724983.60.118.211.2756.0
A178.030924689.80.138.411.1962.5
A187.931825888.40.138.771.2066.2
A198.032026384.20.129.001.1368.0
A208.02511971090.0910.81.3817.4
A218.124420274.20.129.561.4550.8
A228.128322798.70.106.821.4143.8
A238.13282341130.109.261.5356.4
A248.23222741080.1017.61.7259.8
A258.44143031260.1121.51.9966.5
A268.54782781230.1121.51.9168.3
A278.44172871310.1221.71.8866.0
A288.54052731140.1220.81.6466.3
A298.63842671080.1118.81.2667.7
A308.33682621170.1314.61.3763.5
Min2.814015462.40.061.910.504.78
Max9.013489523020.3345.82.50465
Average7.74003051180.1114.31.3180.5
MAC *6.5–8.5-1300--30011.2300
* Ministerial Order 161/2006/OD and Directive 2008/32/CE [34,35].
Table 4. The element concentrations (mg/ L) in the surface water samples (A1–A30).
FeNiCrCoCuZnCdPbNaMgKCaMnBaAlSrAs
A10.0410.0690.0170.0640.0880.0320.0280.0804.192.920.63925.30.0320.0340.0380.0230.001
A20.0580.0660.0180.0640.0880.0330.0260.0904.293.070.67727.80.0330.0360.0330.0270.001
A30.1690.0650.0200.0640.0870.0380.0270.0934.363.320.68926.30.0360.0380.1210.0350.001
A40.0500.0600.0140.0610.0890.0150.0250.0871.942.490.59120.20.0340.0500.0410.0380.001
A50.0770.0660.0150.0630.0920.0110.0260.0742.042.610.68222.40.0330.0400.0380.0270.001
A60.0660.0670.0200.0520.0840.0100.0300.0633.492.881.4121.20.0360.0290.0360.0280.001
A70.8070.0640.0350.0650.0840.0380.0280.2277.6321.68.692780.0380.0390.0410.2920.002
A80.0280.0380.0330.0640.0470.0420.0200.0585.214.754.3740.60.0480.0420.0380.2900.001
A90.3130.0690.0220.0640.1080.0860.0260.13211.420.48.191270.4900.0480.2000.2890.001
A100.2940.0720.0280.0670.1000.0790.0270.10411.810.65.0672.80.5220.0510.1280.2900.002
A110.0760.0810.0310.0690.0910.2400.0260.11012.111.24.7675.10.6720.0540.0830.2960.002
A120.3660.0700.0270.0620.0870.0490.0280.2025.504.731.6531.50.9810.0290.0870.0810.020
A130.0700.0660.0280.0600.0900.0570.0260.13310.25.881.881700.2730.0280.0710.0880.002
A140.0830.0630.0870.0600.0920.0360.0250.10711.211.42.9265.90.0430.0530.0690.4050.002
A150.0720.0630.0270.0610.0900.0300.0260.1005.888.163.0442.70.0550.0420.0620.3480.002
A160.0520.0650.0230.0660.0880.0240.0270.0965.653.942.1038.40.2460.0320.0170.0970.002
A170.0990.0690.0160.0620.0920.0270.0300.1136.434.102.4841.90.0460.0320.1420.1040.002
A180.1240.0640.0200.0600.0910.0300.0310.1076.505.032.6740.80.0480.0330.0970.0970.002
A190.2160.0560.0360.0580.0920.0280.0300.0416.695.292.3540.00.0540.0330.0410.0910.003
A200.0780.0610.0280.0500.0860.0300.0290.0943.566.151.9930.80.0480.0350.2300.0690.003
A210.0640.0600.0540.0550.0900.0270.0280.0884.225.872.0232.70.0420.0350.0620.0700.002
A220.0370.0590.0230.0630.0940.0230.0280.0694.955.562.0736.70.0340.0360.0790.0890.002
A230.0750.0580.0230.0600.0900.0270.0220.0936.785.742.4743.30.0330.0350.1190.1190.003
A240.0550.0620.0420.0560.0900.0250.0210.09010.26.433.1845.30.0330.0380.0820.1450.003
A250.0420.0680.0310.0510.0910.0260.0220.09014.17.174.1148.50.0330.0400.0940.1760.003
A260.0670.0700.0250.0570.0900.0260.0260.07414.57.024.2848.80.0300.0370.0880.1760.003
A270.0780.0700.0290.0610.0890.0290.0260.05014.67.094.2448.90.0330.0350.1090.1760.004
A280.0670.0700.0270.0570.0880.0310.0260.08812.87.043.2246.30.0320.0360.1200.1660.003
A290.0670.0690.0250.0570.0880.0360.0250.10411.36.293.2445.80.0340.0390.1320.1570.003
A300.0470.0690.0230.0590.0900.0260.0240.0669.746.123.2946.20.0360.0360.0770.1530.003
Min0.0280.0380.0170.0500.0470.0100.0200.0411.902.500.5920.20.0300.0280.0330.0230.001
Max0.8070.0810.0870.0690.1080.2400.0310.22714.621.68.692780.9810.0540.2300.4050.020
Average0.1240.0620.0360.0610.0930.0440.0260.1027.776.992.9656.00.1430.0420.0910.1540.003
MAC *2.000.1000.2500.1000.1001.000.0500.050200200-3001.001.00--0.100
* Ministerial Order 161/2006/OD and Directive 2008/32/CE [34,35].
Table 5. Results of the calculated pollution and quality indices (HPI, HEI and WQI).
HPIHEIWQI
A191.43.5017.9
A21003.7218.4
A31094.3822.6
A496.23.5317.7
A587.73.4818.8
A678.73.3119.4
A725610.378.9
A868.92.6518.8
A924710.562.5
A1022910.263.0
A1125711.066.7
A1241216.9103
A131887.0746.7
A141174.2425.1
A151134.1825.8
A161505.9433.6
A171254.6223.5
A181214.6224.2
A1969.63.7226.2
A201074.0621.1
A2199.53.7820.9
A2280.23.1719.4
A231023.7021.5
A2499.33.5622.1
A2599.93.5823.1
A2687.53.4523.4
A2768.43.0623.7
A2899.73.7523.3
A291134.1123.2
A3080.73.2421.8
Publisher’s Note: MDPI stays neutral with regard to jurisdictional claims in published maps and institutional affiliations.

