Article

Acoustic Emission for Evaluating the Reinforcement Effectiveness in Steel Fiber Reinforced Concrete

by
Anastasios C. Mpalaskas
1,
Theodore E. Matikas
1,
Dimitrios G. Aggelis
2,* and
Ninel Alver
3
1
Department of Materials Science and Engineering, University of Ioannina, 45110 Ioannina, Greece
2
Department Mechanics of Materials and Constructions, Vrije Universiteit Brussel (VUB), Pleinlaan 2, 1050 Brussels, Belgium
3
Department of Civil Engineering, Ege University, Bornova, Izmir 35100, Turkey
*
Author to whom correspondence should be addressed.
Appl. Sci. 2021, 11(9), 3850; https://doi.org/10.3390/app11093850
Submission received: 24 March 2021 / Revised: 20 April 2021 / Accepted: 22 April 2021 / Published: 24 April 2021

Abstract

:
Steel fiber reinforcement in concrete strongly enhances its ductility and toughness. This is basically due to the additional fracture mechanisms and energy used to overcome the interlocking and adhesion between the fibers and the cementitious matrix. The enhancement of the final properties is measured by mechanical tests and can be assessed only at the end of loading. These processes can be targeted and monitored by acoustic emission (AE) indices offering real-time characterization of the material’s performance much earlier than the final failure or the termination of loading. In this study, steel fiber reinforced concrete (SFRC) beams were tested in bending with simultaneous AE monitoring. Tests conducted independently in different laboratories confirm that the AE behavior at low load levels is very indicative of the amount of reinforcement and consequently, of the final mechanical properties. The reason is that the reinforcement phase is activated through shear stresses in its interphase, a mechanism that is more profound in the presence of higher fiber content, and correspondingly is absent in plain unreinforced material. This finding opens the way to characterize the effectiveness of reinforcement with just a proof loading at less than 30% of the final load bearing capacity.

1. Introduction

The acoustic emission (AE) technique has proven very sensitive to the damage process of concrete. AE can detect the onset of failure more accurately than any other technique, something that is one of the great advantages of AE [1,2]. It also enables localization of sources due to the arrival times of elastic waves to different stations (sensor positions) [3,4,5,6]. Another important feature is the identification of the failure modes. This is feasible due to the correlation between the AE waveform parameters and the crack tip displacement [2,7,8]. It is widely accepted that the tensile mode of fracture leads to higher frequencies and shorter signals than the shear mode in cementitious media [2,9,10,11]. When displacement occurs in an elastic medium (i.e., crack propagation event), this disturbance propagates as an elastic wave (similar to ultrasound) through the medium. There are two basic wave modes in bulk media: the fast longitudinal and slower shear wave mode. Depending on the displacement of the crack tip, the proportion of the different wave modes is defined. Shear events due to the shape change they impose on their vicinity, generate most of their energy in shear (transverse) waves, while the volumetric transient change of tensile cracks gives rise mostly to longitudinal waves, as shown in Figure 1a. Therefore, due to the components of the wave and their different propagation velocity, the shape of the waveform is also influenced. AE signals originating from shear tend to obtain longer waveforms, as the main energy arrives later while tensile signals obtain shorter durations and higher frequencies [2,12,13,14]. Recently it was shown that AE is also sensitive to the preliminary displacements imposed by the stress field and can therefore, provide information on the stress field a long time before the manifestation of cracks in any measurable way [15]. The reason for this is related to the shear stress developed on the interphase between the matrix and the reinforcement (either in the form of steel bars or fibers, under the assumption of perfect bonding). Indeed, the effective contribution of the reinforcement is realized by load transfer through shear stresses between the matrix and the reinforcing element, with this either being a steel bar, patch or fiber. When load is applied, shear stresses (and strains) are automatically developed on the interphase. Even at a low level, these displacements give rise to AE that can be picked up due to the sensitivity of the sensors and allow the understanding of the stress field. This is the reason why AE behavior differs, as will be seen, between the two types of materials (plain and steel fiber reinforced concrete). While Figure 1a demonstrates a depiction of tension and shear for a general case, Figure 1b shows a case closer to the typical events expected in a matrix with reinforcement like concrete with rebar or fibers.
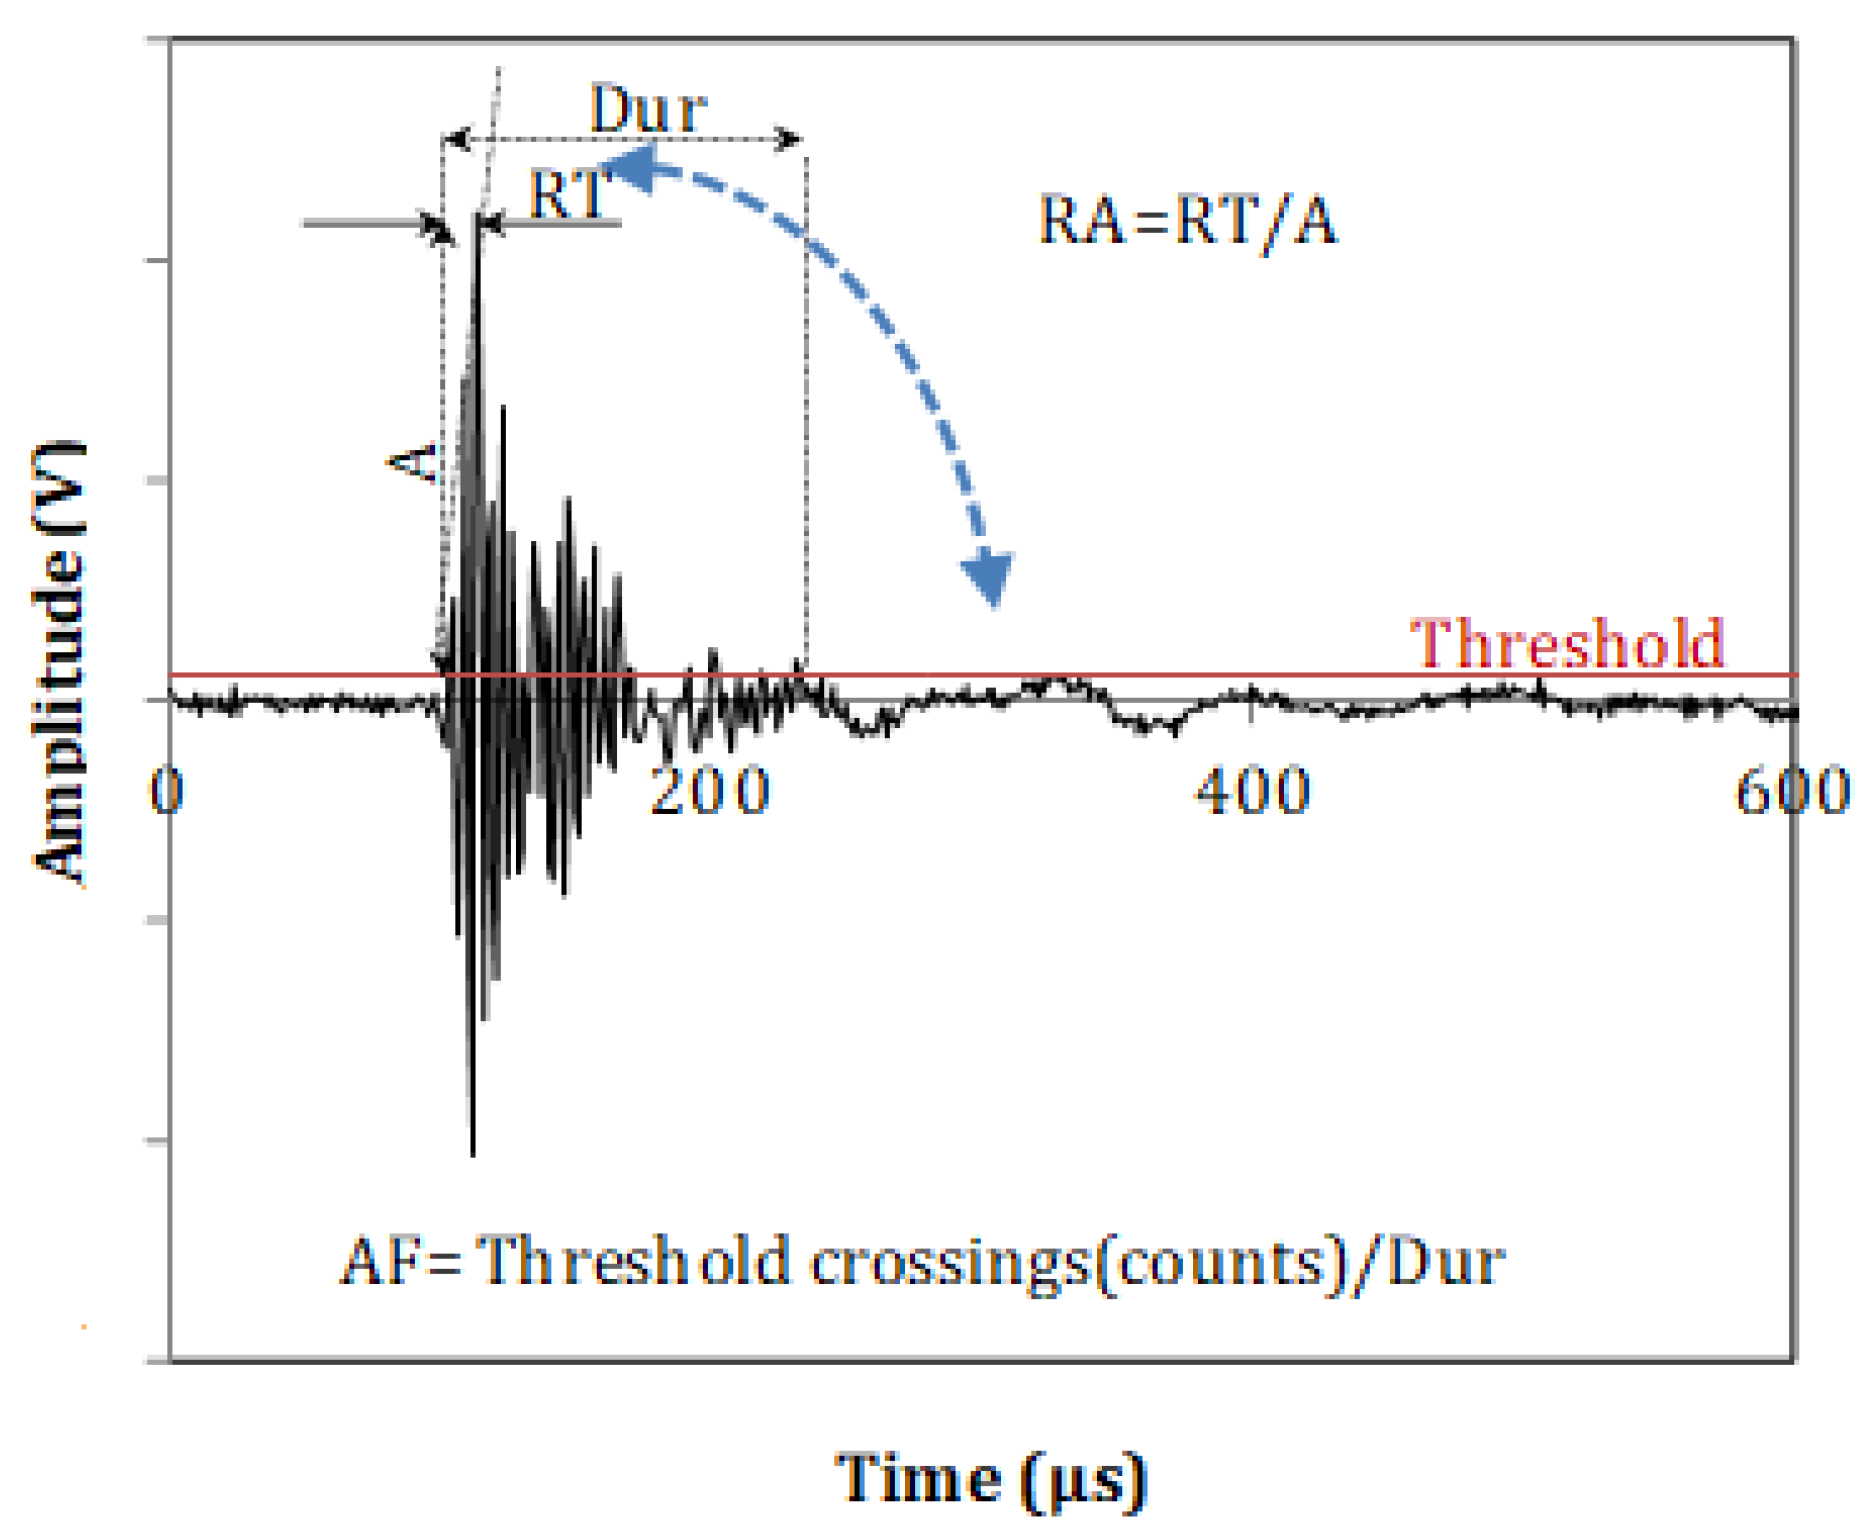
The waveform parameters that appear mostly sensitive to the stress field and the crack tip displacement are presented in Figure 2 and are namely the rise time (RT) or delay between the onset and the highest waveform peak, and the RA value, defined as RT over maximum amplitude (A). The frequency content can be easily assessed by the average frequency (AF) which is the number of threshold crossings over the duration of the waveform, as well as the central frequency (CF) which is the frequency with the highest magnitude after Fast Fourier Transform. Due to its definition, RT receives information by both aforementioned wave modes. Concerning the “tensile” events that carry mostly longitudinal waves, the main energy arrives also with high speed; therefore, the RT is short. In the case of a shear event, the major part of energy comes later due to the lower speed of shear waves. Therefore, the RT (and consequently RA) tend to obtain higher values, while the total duration is also increased. This characteristic renders RT very indicative of the fracture mode [9,11,12,14,15].
Steel fibers are used in concrete to enhance its mechanical behavior by bridging the crack surfaces and transferring tensile stresses [16]. Tensile stresses are transferred across cracks which decrease the width of the cracks, resulting in an increase in the ductility and toughness of the fiber reinforced concrete element [17,18]. Due to their high stiffness, strength and aspect ratio, steel fibers are more commonly used than other types of fibers. The most common applications of steel fiber reinforced concrete (SFRC) are as industrial slabs, tunnel linings, high performance concrete members and precast structural members [19].
In the field of SFRC bending, AE has been applied to monitor the different stages of the fracture process. Initially, the AE behavior is influenced by the tensile bending cracking exhibiting low RT and high frequency values, while just after the moment of main cracking, a sudden shift to lower frequencies and longer RT is noticed. This is interpreted through the addition of the fiber pull-out mechanism, that before main cracking seemed inactive. These changes can be as strong as a 50% drop in AF and even higher increase in RT, showing the sensitivity of AE to the fracture process [11]. Studies on SFRC have been conducted with regard to the orientation of the fibers. Specimens with fibers more aligned to the load direction exhibited higher mechanical properties and a more shear character of AE expressed by AF and RA [20] or a higher AE energy [21]. In general, the conclusion in similar studies is that the addition of fibers shifts the mode of fracture towards shear based on the AE parameters calculation [22]. However, this behavior is addressed for the whole duration of the loading, including the post-peak stage after the main cracking event, when the damage is even visually obvious and when the effect of fibers is stronger. Therefore, the possibility of prediction of the final mechanical performance is not exploited.
The present paper studies the AE behavior in SFRC, focusing on the early load AE. Although the main contribution of fibers is expected in the post-peak regime by increasing the toughness, the sensitivity of AE can help in gathering signals before the main fracturing events, therefore supplying more information on the initial contribution and allowing projections to the final mechanical properties. Experiments were independently conducted in different laboratories with different experimental protocols (3point- and 4point-bending) while different concrete mixes, specimen sizes and fibers were used. A higher content of fibers renders the reinforcing character more effective. Since the reinforcement is activated through shear stresses, it is assumed that early load AE will exhibit more shear character as the fiber content increases, and this is the hypothesis that the present study wishes to test. In general, the failure process in both cases (4p- and 3p-bending) reasonably starts with tensile cracks of the matrix. Concerning 4p-bending, it is also true that nominally there is no shear between the load application points (center of specimen) for a homogeneous material. However, it is a point to be highlighted that although the external loading does not nominally cause shear in the center, the local fields responsible for AE creation are influenced by the fiber presence. Due to heterogeneity (difference between stiffness of concrete matrix and steel fibers) the externally imposed load creates local variations in the stress field. Although the purpose of the paper is not the exact correspondence between AE values and stress values, this has been recently shown in [15], where even in the center of the specimen, shear strains develop in the interface between the matrix and the reinforcement. Therefore, it is normal that AE recorded in plain unreinforced specimens is triggered by pure tension, while for the reinforced specimens, AE is largely triggered by tension, but with elements of shear leading to a more mixed mode character. The received AE at low load shows a satisfactory correlation to the final mechanical properties, opening the way for possible prediction based on a low proof loading.

2. Experimental Details

In order to check the hypothesis under different conditions, two versions of the bending test were followed in parallel (three-point bending and four-point bending) while in both tests, three content of fibers were applied. Details for the individual tests follow.

2.1. Three-Point Bending

Three concrete specimens with 0%, 0.5% and 1% volumetric fraction of fiber content were prepared. The dimensions of the prismatic concrete specimens were 100 × 100 × 600 mm. The water to cement ratio by mass (w/c) of the mix was 0.6 and the cement was Cimentas CEM I 42.5R type. In addition, crushed limestone aggregates were of three classes: 0–3 mm, 5–15 mm and 15–25 mm. The mix proportions of the concrete were: cement 295 kg/m3, water 177 kg/m3, 0–3 mm aggregate 960 kg/m3, 5–15 mm aggregate 394 kg/m3, 15–25 mm aggregate 591 kg/m3, plasticizer 3 kg/m3, steel fiber 39 kg/m3 for 0.5% and 78 kg/m3 for 1%. The bulk density of the concrete was 2378 kg/m3. The slump of the concrete mixture was measured as 8.2 mm. Fibers used in concrete were BetonFiber HE 0735 type hooked steel fibers. The fibers type was cold-drawn with a length of 35 mm, diameter of 0.7 mm and tensile strength of 1400 MPa. After casting, the concrete specimens were cured in the standard conditions for 28 days (20 ± 2 °C and 95% relative humidity). The distribution and orientation of fibers are known to affect the final properties of the beam [23]. The fibers were added to the dry mixture to enable a good distribution. The volumetric distribution of fibers in the beam was not verified after casting. However, after the tests, when the fracture surfaces were examined, a relatively good distribution of the fibers throughout the cross-section could be seen.
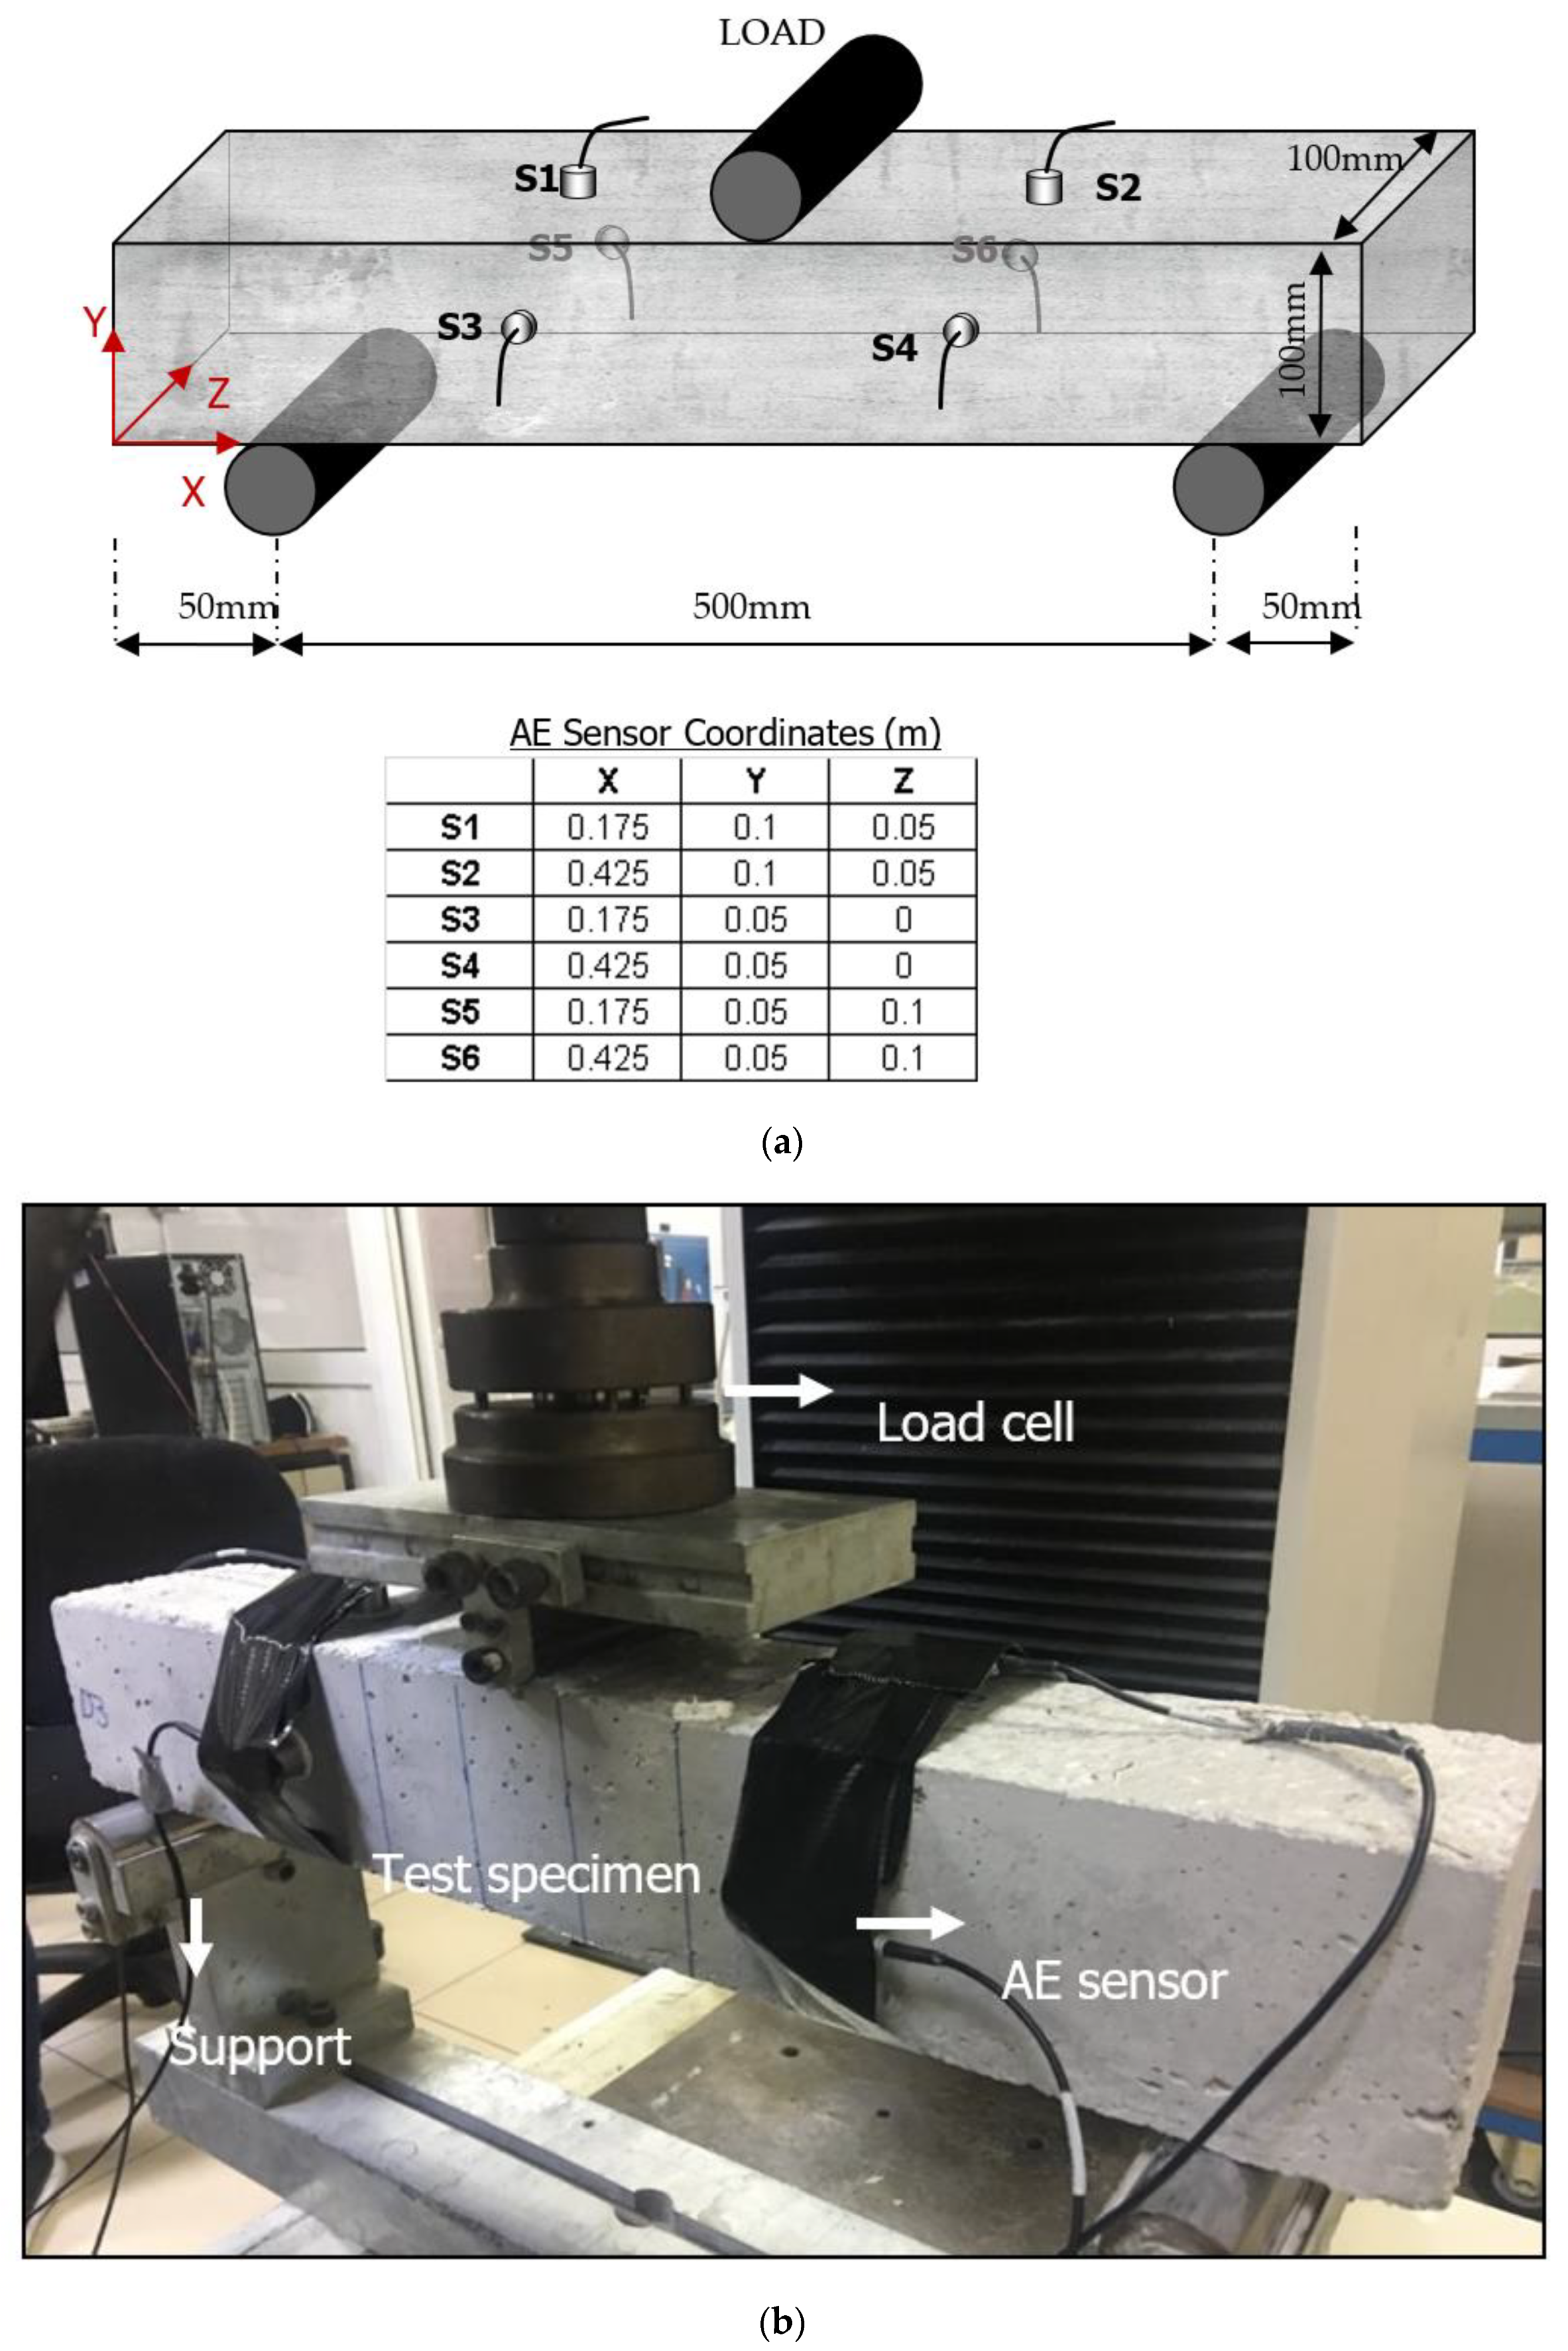
In the experimental study, flexure tests were conducted on each specimen in accordance with the TS EN 12390-5 standard [24] with a net span of 500 mm. Load was applied with a speed of 0.2 mm/min at the center of the mid-span by Shimadzu AG-IS 100 kN Universal Testing Machine (Figure 3). Simultaneously AE data were recorded during the loading. AE activities were recorded by an 8-channel AE system with six R15a AE sensors by Mistras Group (resonant at 150 kHz). Received AE activities were amplified with preamplifiers having 40 dB gain and the threshold was set as 40 dB to eliminate ambient noise. The sensors were hot-glued on the concrete surface to eliminate displacement, especially on the vertical surfaces. Hsu-Nielsen calibration (pencil lead breaks) was applied to ensure the acoustic coupling of the sensors. These experiments were conducted in Ege University, Izmir, Turkey.

2.2. Four-Point Bending

Five concrete mixtures were produced at the laboratory for the manufacture of the three different fiber reinforced concrete specimens per category. The specimens shape was a prismatic beam of size 100 × 100 × 400 mm for conducting the four-point bending test. As far as the concrete mixture is concerned, the aggregates consisted of 56% crushed sand, 13.95% fine gravel and 30.05% coarse gravel with a maximum aggregate size of 31.5 mm, while the water/cement ratio was 0.69 by mass. The crushed sand’s density and water absorption were 2611 kg/m3 and 0.97%, of fine gravel 2631 kg/m3 and 0.74% and of coarse gravel 2685 kg/m3 and 0.62%, respectively. The cement type was CEMII/A-M(P-LL). The precise mix proportions were as follows: cement (type II 42.5 N) 80 kg/m3, cement (type II 32.5 N) 200 kg/m3, water 195 kg/m3, crushed sand 1055 kg/m3, fine gravel 265 kg/m3, coarse gravel 570 kg/m3, retarder—plasticizer (CHEM I) 1.54 kg/m3, retarder—plasticizer (CHEM II) 1.96 kg/m3. The concrete’s actual bulk density was 2365 kg/m3 while the ambient temperature was 21 °C. For the fiber-reinforced concrete with 0.5% vol. of fibers, the addition of 39.3 kg/m3 of hooked and waved steel fibers was made, while 2% was also applied. Their diameter was 0.6 mm, their length was 25 mm, their density was 7850 kg/m3 and they were provided by Chircu Prod-Impex Company Srl, Romania. The addition of the steel fibers was applied during the mixture of the wet concrete with the maximum uniformity. The workability as measured by the slump test was 11 cm. The specimen was cured in water saturated with calcium hydroxide at 23 ± 2 °C.
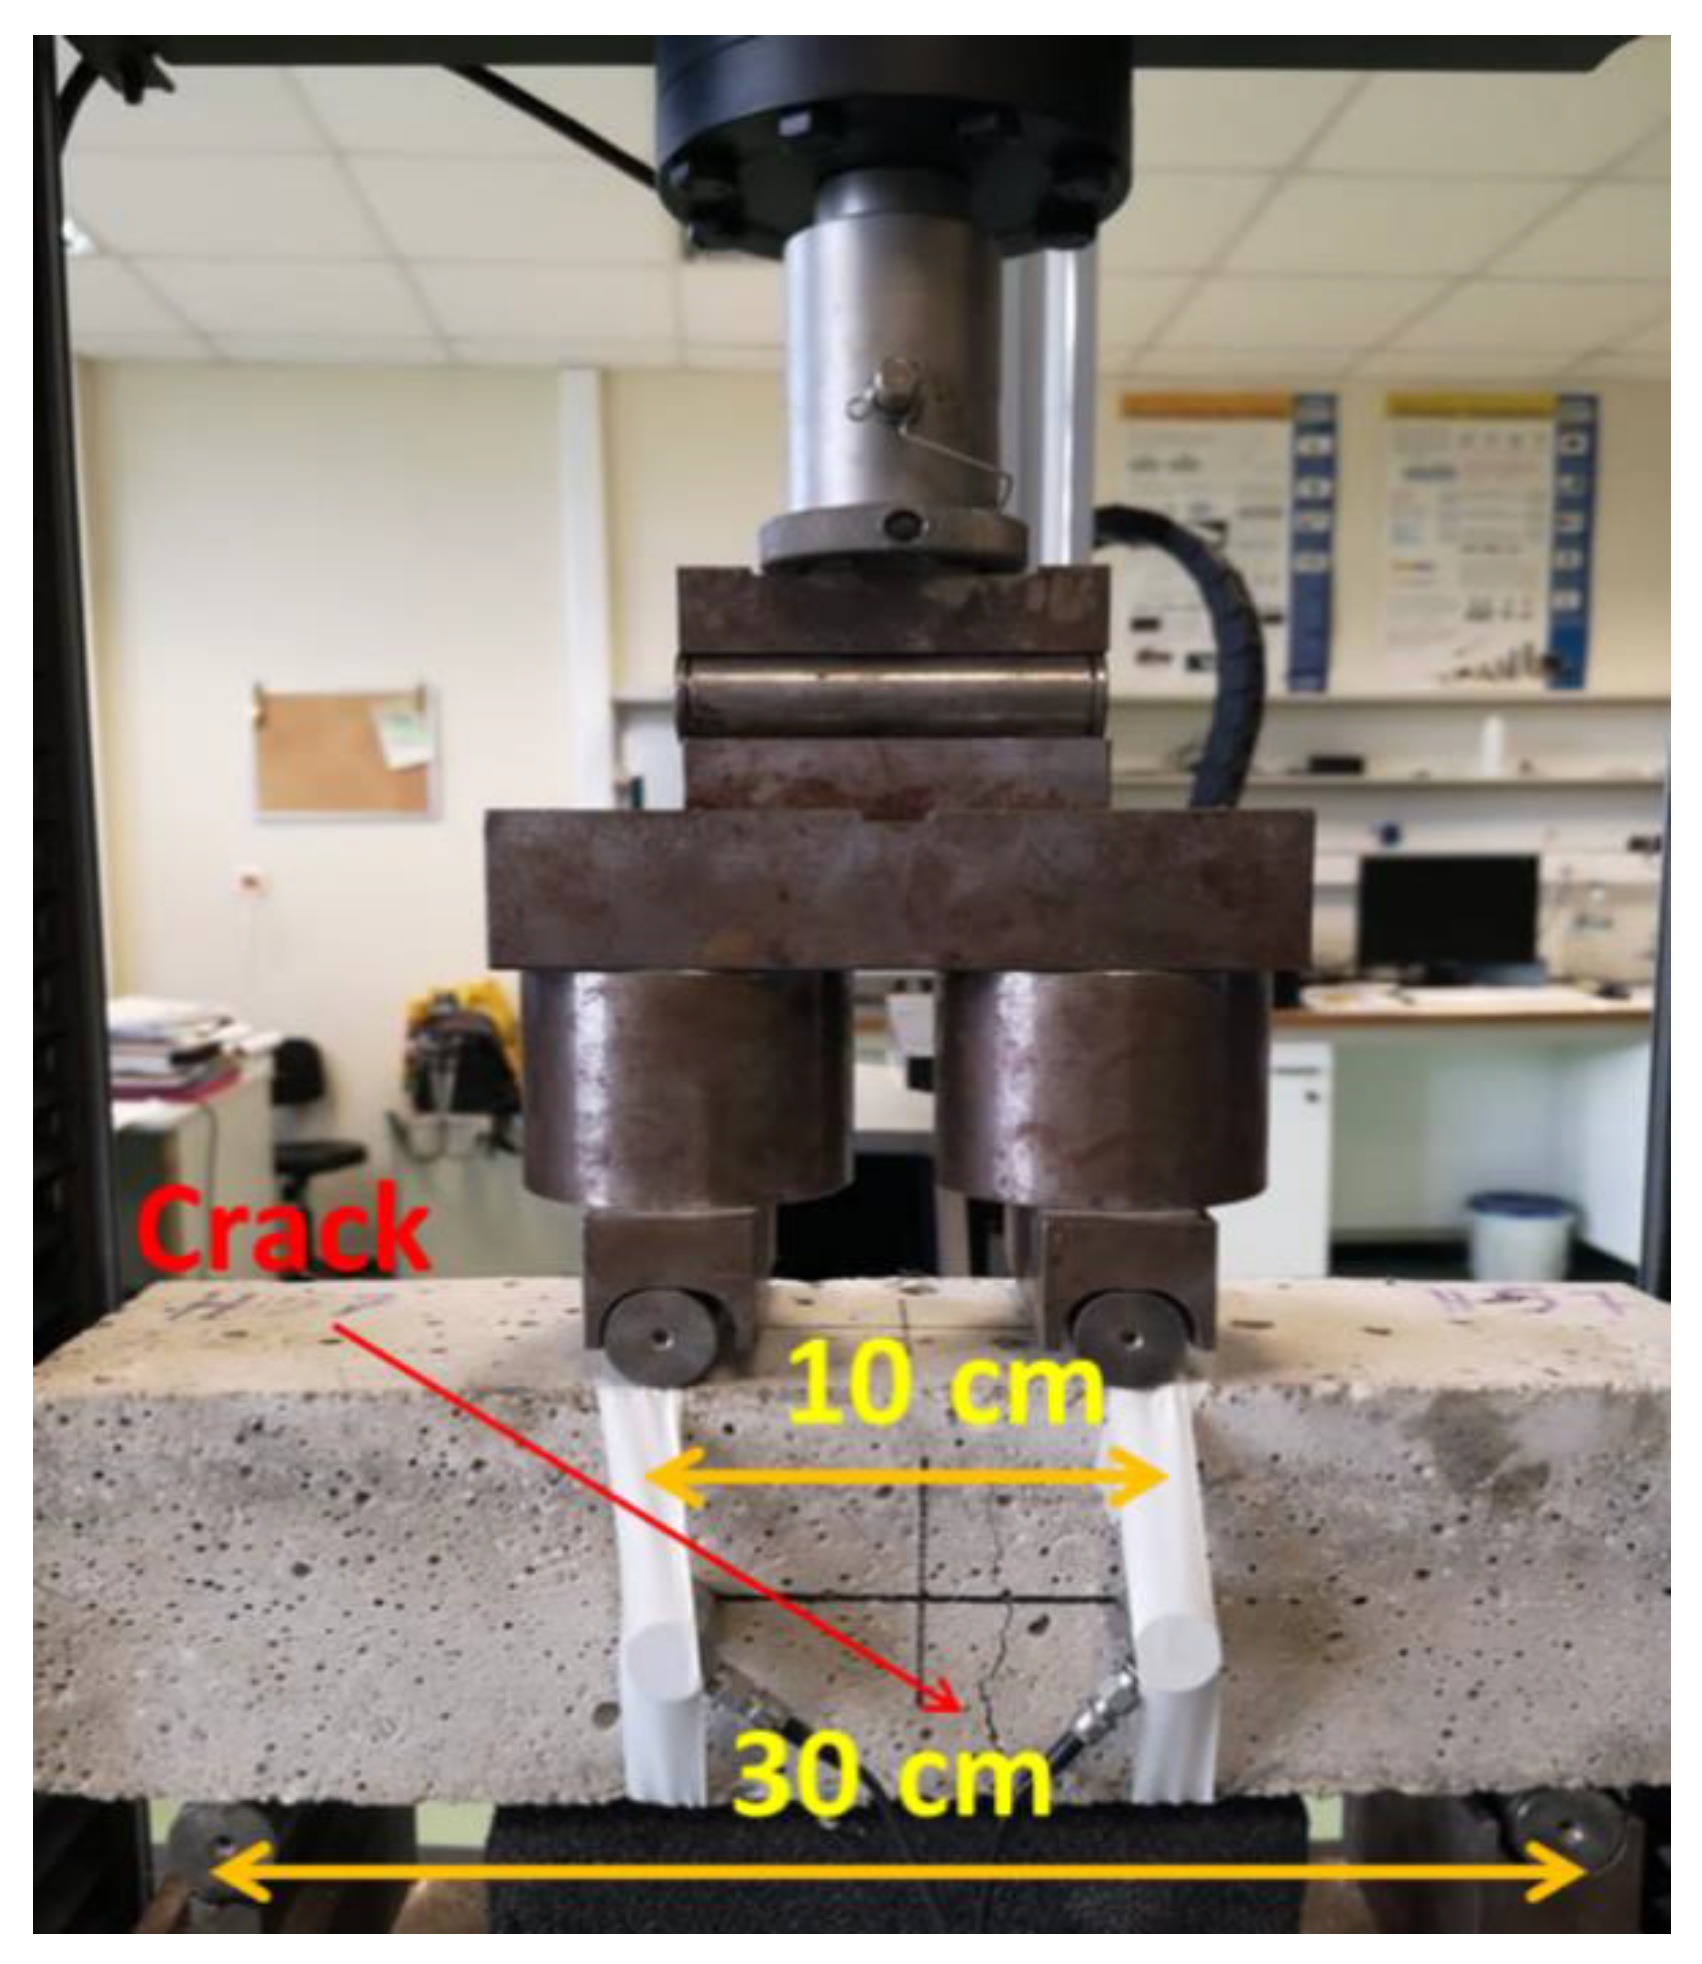
The four-point bending set up is in accordance with ASTM C1609M-05 [25] standard and can be seen at (Figure 4) with the AE sensors mounted by tape. The sensors were of R15a type by Mistras Group. The experiments were conducted in the MSS-NDE laboratory of the University of Ioannina, Ioannina, Greece.

3. Results

3.1. Three-Point Bending AE Results

Figure 5 shows the cumulative curves of individual specimens with a different vol.% content of steel fibers (SF). It is obvious that SFRC produces much more AE activity than reference plain concrete. This is a reasonable trend, as fibers add another failure mechanism (pull-out from the matrix) that does not physically exist in the reference concrete. Indeed, the total activity of reference concrete is almost negligible compared to the SFRC, as shown in Figure 5.
Apart from the basic behavior as shown through the cumulative activity, it is interesting to check specific waveform parameters. Figure 6 shows the RT of the same specimens. The difference in the level of RT is indicative of this extra shear character imposed by the fibers. The plain specimens break with a large crack from the tensile side, without exhibiting a serious shear character. Hence the RT of AE signals stays at relatively low levels. However, when fibers are present, this shear character is enhanced and results in higher RT values for 0.5% and even higher values for 1% of steel fibers.
In Table 1, one can see the average values of some of the main AE parameters for the different fiber contents. The values were taken from the activity before the main cracking occurs, since we focused on the early behavior and the influence of the reinforcement on the initial stress field. It is obvious that the RT increases with the increase of fibers from 0% to 1%, showing the reinforcing effect of fibers as their content increases. Inversely, frequency indicators decrease even though slightly, something that will also be seen in the 4-point bending part of the study. The mechanical test results also depicted in Table 1 show that secant stiffness and toughness values increase with the increase of the fiber content. Hooked fibers work as a bridge to prevent and delay the crack progress which provides a more ductile behavior than the plain concrete. A correlation between AE parameters and toughness is noted with more details in the discussion section.

3.2. Four-Point Bending AE Results

Moving to the four-point bending, the mechanical results revealed the reinforcing effect of the fibers, as expected. Table 2 shows the average maximum load bearing capacity for all mixes. A volume content of 0.5% of fibers considerably increased the load capacity from less than 14 kN of the reference to 16–17 kN, while further addition of fibers to 2% increased the capacity further, especially for the hooked fibers (almost 25 kN).
Indicative cumulative AE activity curves are shown in Figure 7. The trends are quite similar to the previous of three-point bending, with SFRC showing much higher activity than plain concrete.
The most interesting trends come from the behavior of certain AE parameters before the main cracking, as seen in Figure 8. Figure 8a shows the RA value for different contents and types. While the RA value of reference specimens is between 200 and 600 μs/V, this increases up to 1400 μs/V for 0.5% of fibers and even higher for 2%. This shows the certain enhancement of the shear character by the addition of more fibers. At the same time, the effect of fiber shape does not seem similarly influential, as hooked and wavy fibers exhibit close averages.
As reported above for the three-point bending case, here as well, the frequency shows an inverse trend but again the change is proportionally smaller than the one of RA. While the average AF for reference is 310 kHz, this drops to 250 kHz for 2% of fibers.
Figure 9 shows a correlation plot between AF and RA, as proposed by the RILEM recommendation [2]. For each content area, it includes the data of both fiber types (wavy and hooked) since the results were close. As the fiber content increases from 0 to 0.5%, the RA exhibits a jump from 300 μs/V to more than 1000 μs/V. The further increase of fibers to 2% has a clear but relatively weaker push to higher RA values on average. This RA shift according to the recommendation shows the shift towards shear nature of the fracture. From the frequency point of view, there is a clear drop between 0% and 0.5% in AF values, while further addition of fibers does not seem to have an evident effect on further reducing the frequency content. It seems that the crucial change happens between 0 and 0.5% because in the first case there is no reinforcement at all and therefore, no influence on the early AE readings, while at 0.5%, the new shearing mechanism of fiber pull-out is already added. Once this mechanism is present, it may become more intense by adding more fibers, but there is no strong evidence to substantiate that this relation should be linear and that a certain change in fiber content should result in a proportional change in the AE parameters. The relatively large error bars and the overlap between classes is mentioned in more detail in the next section, along with other interesting discussion points.

4. Discussion

The above results based on experiments conducted in different laboratories, following different experimental protocols by different people, prove the sensitivity of AE to the fracture mode of concrete. The study was conducted in different setups (3p- and 4p-bending) to show the effect of the reinforcement on the stress field towards shear, even in the case that nominally there is no shear in the middle (4p-bending). Resonant sensors were used which despite being very sensitive, may also mask the original frequency content of the elastic waves. It is possible that broadband sensors allow better characterization in the frequency domain, decreasing the overlap between different groups.
One of the points of the study that shows strong potential is the possibility to characterize the behavior of a fiber composite material by a low-level proof loading. As shown herein, the sensitivity of AE allows us to track the influence of fibers even during the elastic regime and before cracks are nucleated. This can help in examining or comparing the adhesion between different types of fibers and matrix and lead to an easy way to investigate the suitability for application, helping in material development.
Although this would need further study, the correlations between the AE parameters obtained at low load and the final load capacity or toughness are certainly encouraging towards the final aim of predicting the mechanical properties of SFRC. For such a purpose large numbers of specimens should be tested, a project that is under way by the authors. 
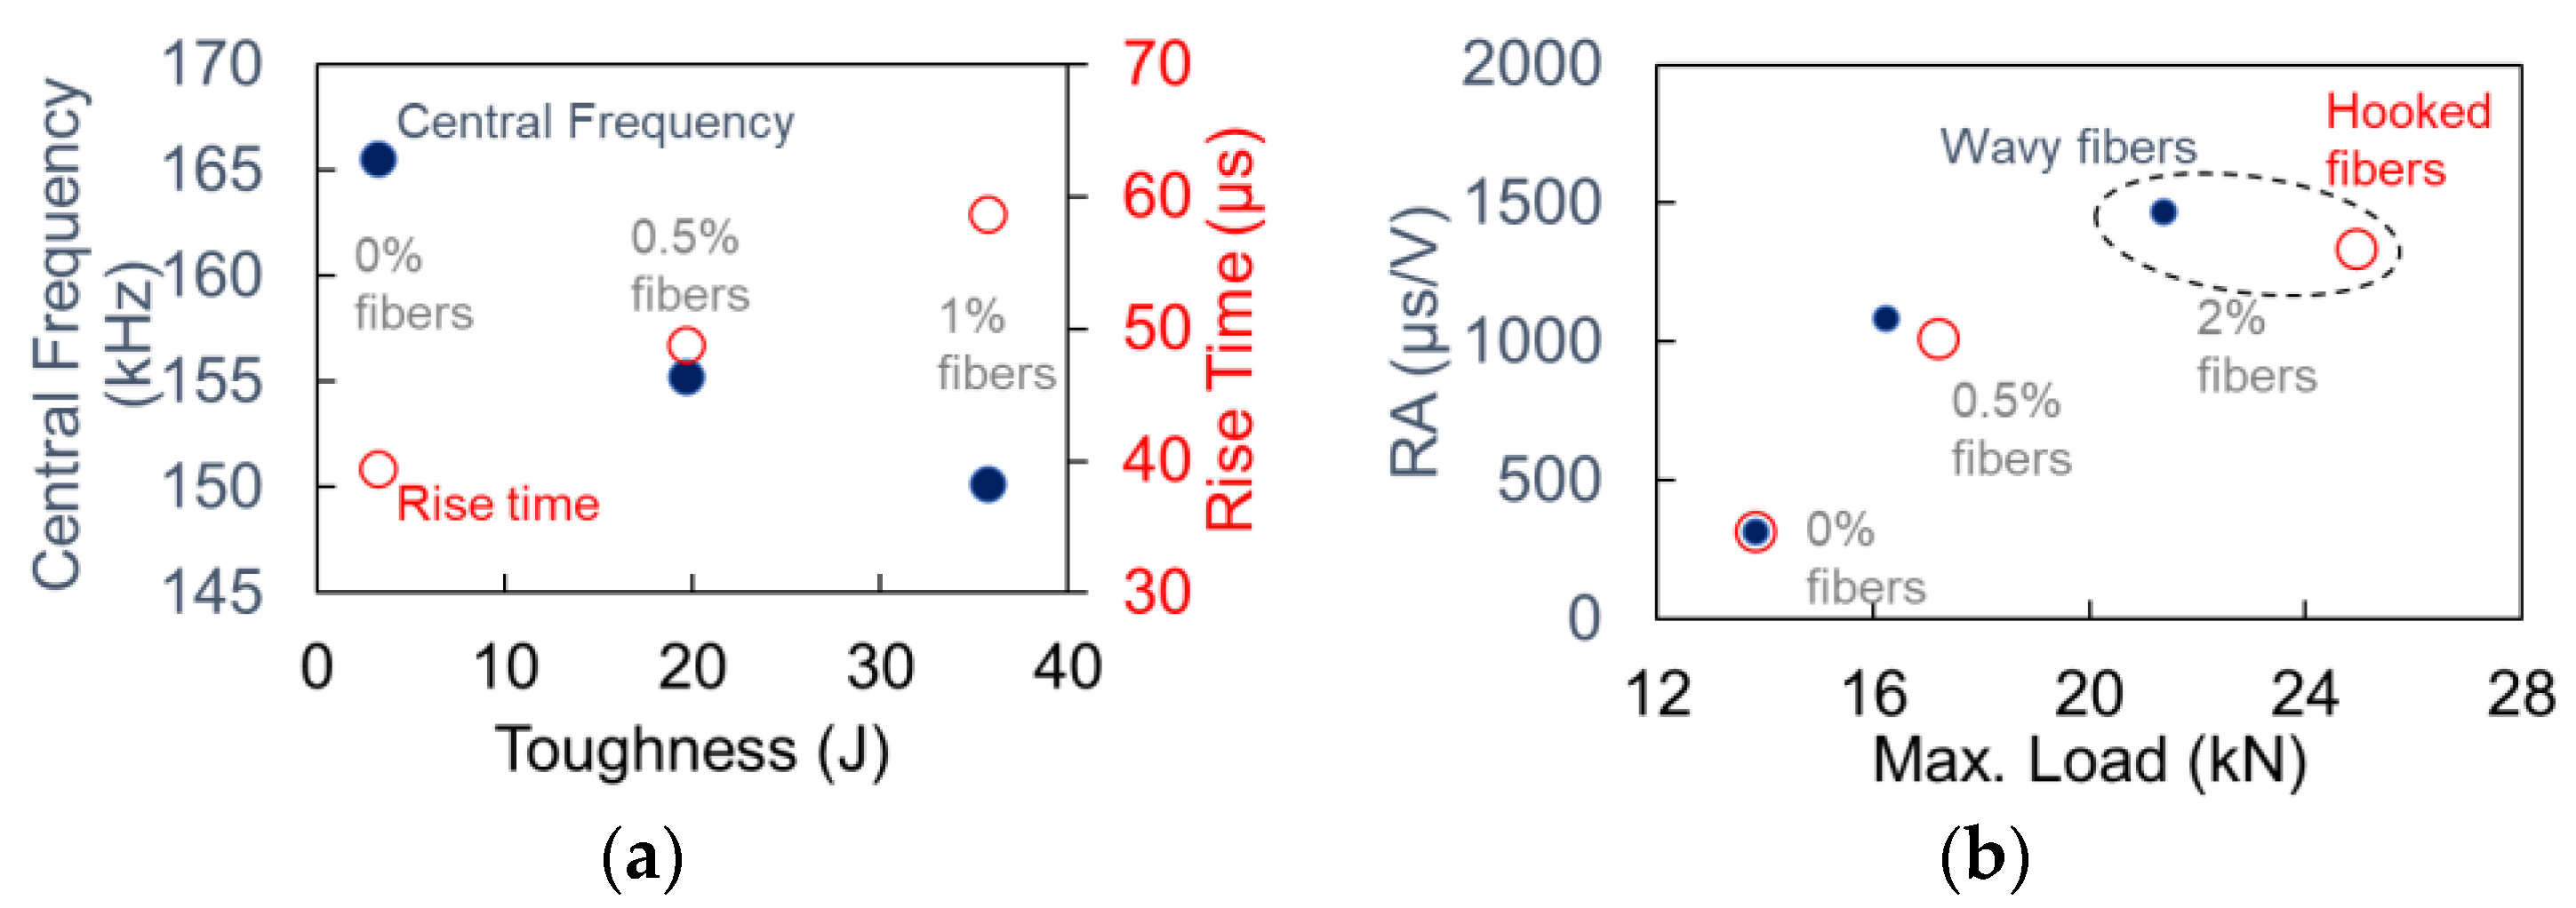
Figure 10 includes correlations between early load AE and final mechanical properties. Figure 10a shows the RT and CF vs. the toughness of the SFRC measured in the 3p-bending test. A strong correlation is obvious, since a decrease of CF and increase of RT at the initial part of the loading is well correlated with an increase in the final toughness. Figure 10b exhibits correlations between early age AE parameters and the load bearing capacity of the beams under 4p-bending. The RA value obtained before the main cracking correlates in a monotonic way with the maximum load for both types of fibers. Therefore, it is implied that the AE during the elastic regime can give serious insight on the final mechanical properties. Although this has not been widely utilized, it is normal, as it expresses the bonding between the matrix and the fibers as mentioned above. Obviously, further study is needed to allow engineering predictions of mechanical properties based on data obtained before cracking. In any case concerning prediction of mechanical properties, one should be very cautious, as absolute values would be important. A standardized procedure should be in place to allow researchers to obtain reliable results, since as previously mentioned, many test parameters influence the absolute value of AE parameters.
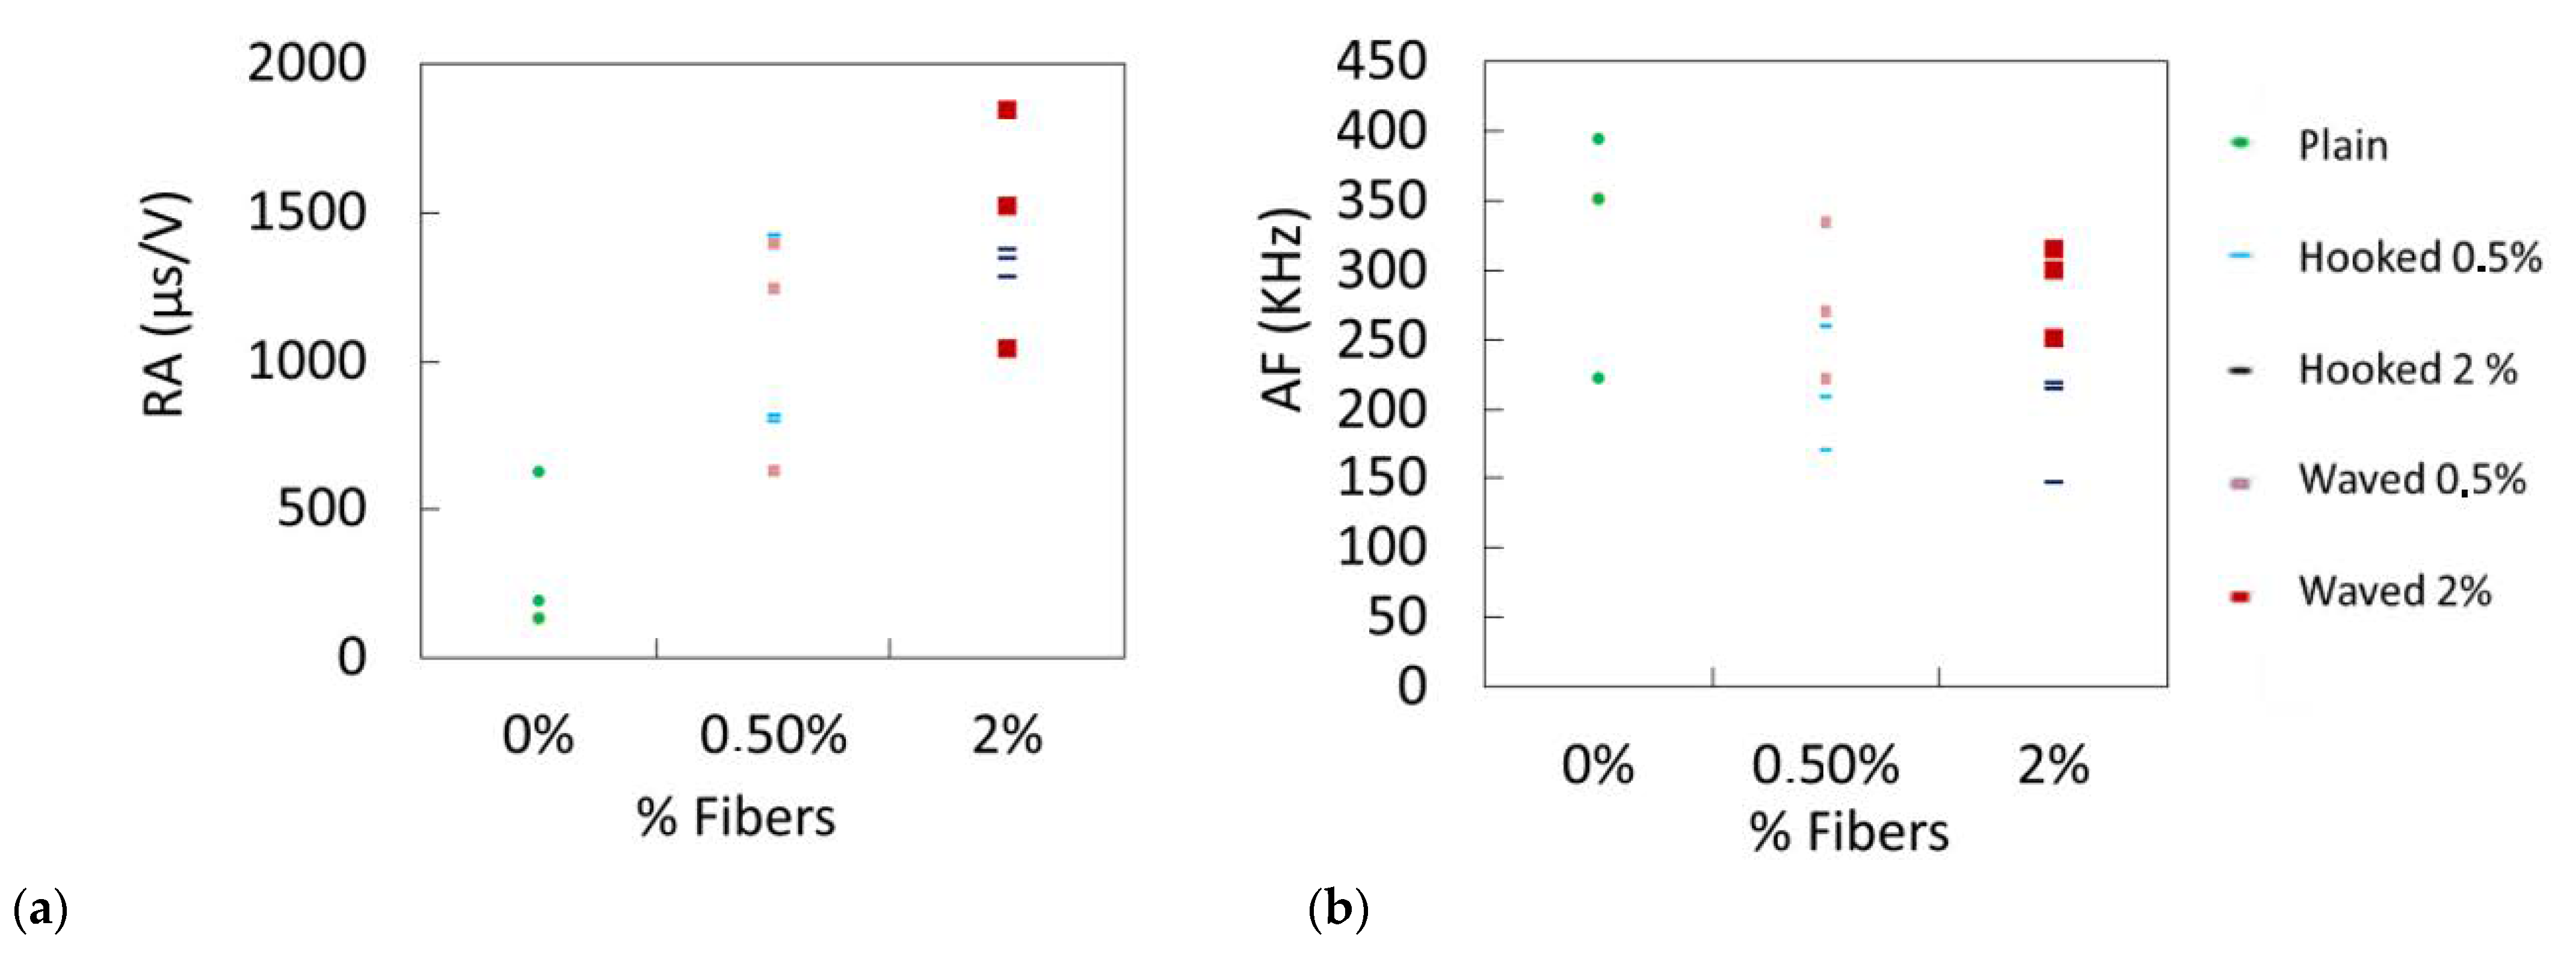
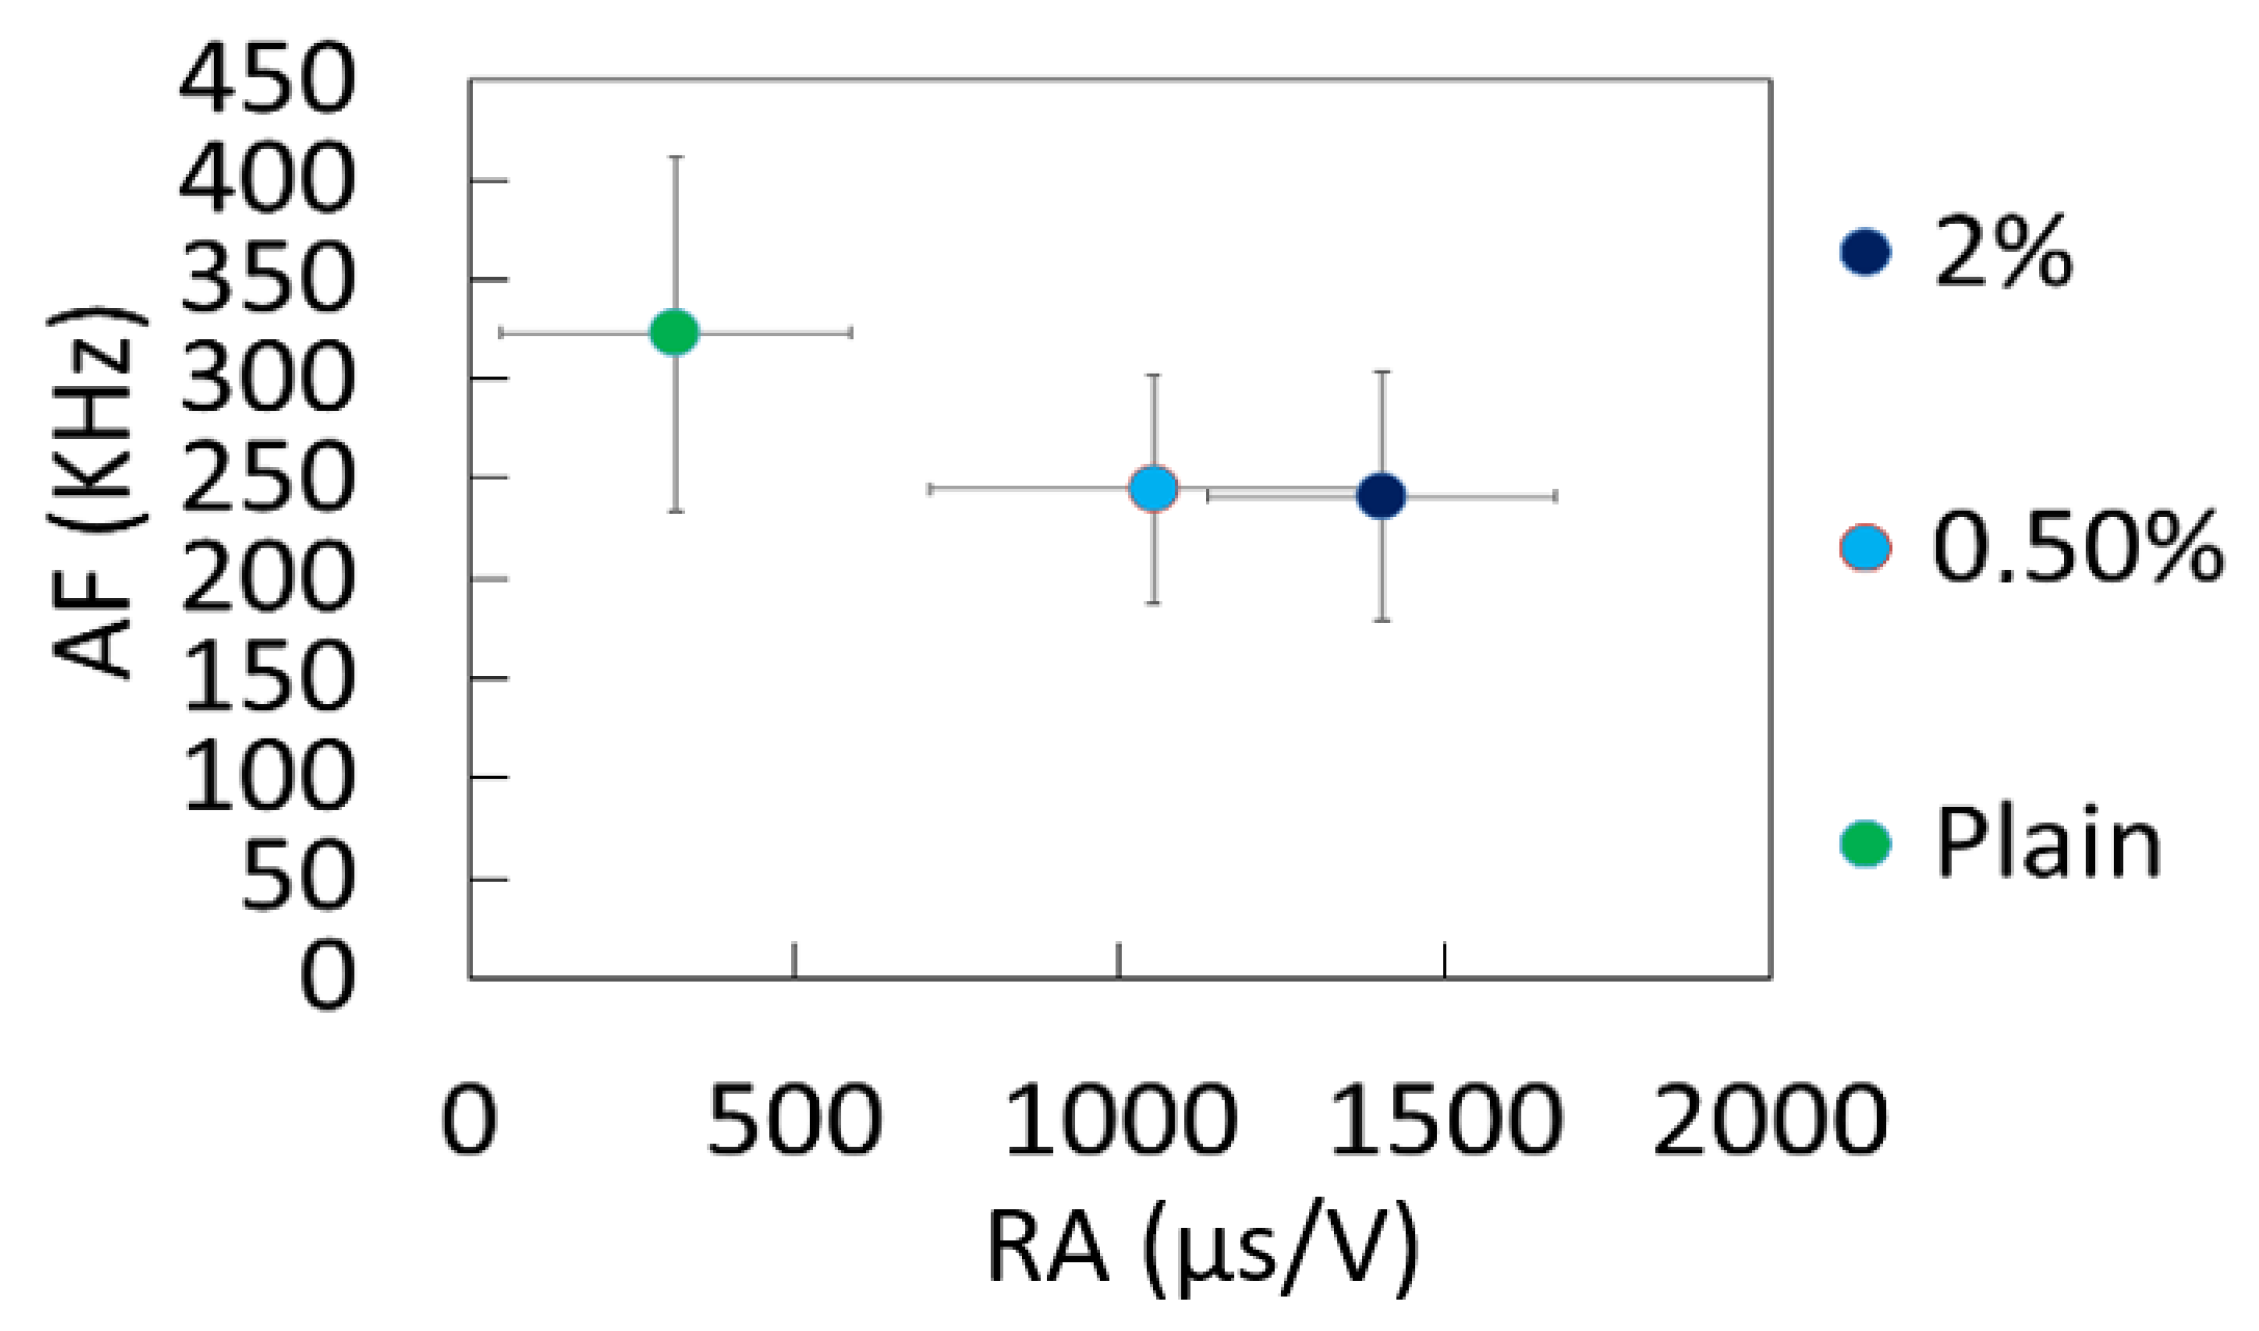
Another point which is noteworthy in experimental studies and in particular in AE is the relatively large error bars or the overlap in the parameters of different groups of specimens, as seen for example in Figure 8 and Figure 9. However, this is inherent to the damage process. The reason for this is that AE is the consequence of fracture, which is an extremely random process. It is reminded that the source of AE in this case is fracture propagation events. Even though the loading pattern does not change, the new crack increment depends on the local stress conditions that have been developed after the previous crack incidents. From the moment the fracture starts, and especially in a heterogeneous material, the process zone is affected “by the stress field generated by the fracture itself” [26]. Thus, it is argued that the stress field is dynamic and changes continuously after each crack propagation event compared to the initial static field. This dynamic character is inevitably transferred into the AE signals, increasing the scatter and it is the reason that pattern recognition approaches have been effectively used in the field for classification of the signals based on different mechanisms [27,28,29]. This stochastic character can only be increased by the heterogeneity and propagation effects. The final parameters measured from the recorded waveform are influenced by several factors, including the wave propagation distance and conditions in general. Although the location of the sensors is constant throughout loading, the sources are not the same, meaning that an event close to a sensor will be recorded with a higher amplitude, while an event similar in mode and intensity further away would be recorded with a lower amplitude and frequency due to attenuation. Obviously, this influences the RA (rise time/amplitude) and frequency content values. In a material like concrete with numerous potential cracking sources (pores, voids, fiber/matrix interphases) the results carry a degree of distortion, so it is normal to expect overlap between different classes. However, the importance is not in accurately defining each one of the recorded hits. This would be an extremely difficult task (if not practically impossible in absolute terms) but also of doubtful significance, since as previously mentioned, the exact values are a function of many conditions apart from the crack itself (wave propagation, sensor sensitivity). Therefore, the importance lies on the comparisons between different cases, since the relative trends between specimens and the fluctuations during loading clearly indicate the correlations between AE and the fracture process in the early or later stages.
RA and RT values have been known to increase throughout the loading of a component as the damage increases, because the mode of stresses shifts from tensile to shear as the material approaches the final failure [10,11,12,13,30,31,
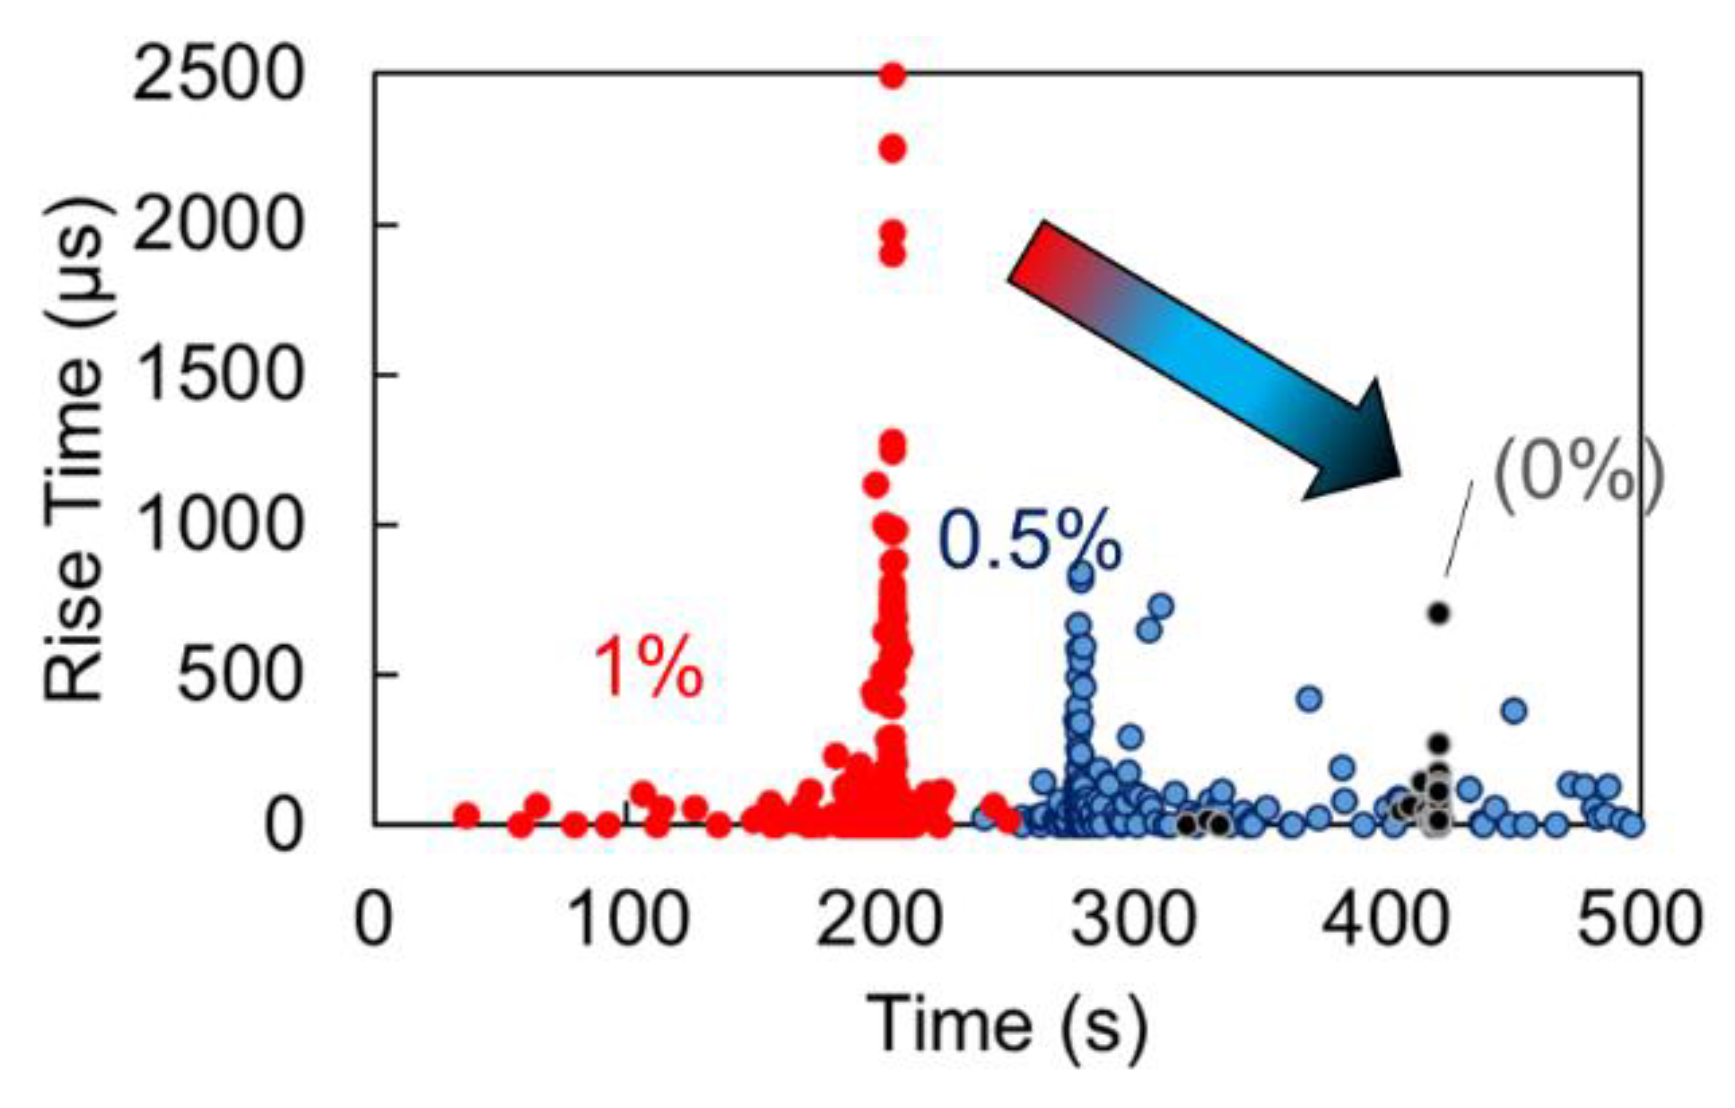
32]. Therefore, in the literature, high values of RA have been associated with a higher degree of damage. While this is a universal trend and holds in usual cases of fracture for each single component or specimen, the importance in this study is focused on the comparison between specimens with different level of reinforcement. The AE indices obtained at low load and before damage is manifested in any measurable way, reveal the effect of the reinforcing mechanism thanks to the development of the necessary additional shear stresses. Enhancement of the fiber content increases the occurrence of local shear stress fields, leaving its signature on the AE parameters by increasing durational characteristics of the waveform and slightly decreasing the frequency content.

5. Conclusions

It is well known that the fibers exercise a strong effect on the mechanical properties of concrete, increasing the strength and mostly increasing the toughness. However, their influence can be seen early, even before the major cracking evolution, because they locally modify the stress field. As the reinforcement effectiveness increases, the local stress field under loading obtains a more shear character naturally due to the fiber-matrix bonding. This reinforcement effectiveness was in this case enhanced by increasing the fiber content. Mechanical tests monitored by AE and performed at different laboratories exhibited that the increase of the reinforcement phase of concrete (in this case steel fibers) apart from increasing the mechanical capacity, at the same time left its fingerprint on the AE behavior through the modification of the stress field. The AE monitoring during low load proved sensitive to this stress field modification, since an increase in the fiber content had a clear influence on increasing the AE waveform parameters like RT, RA and to a lesser extent on decreasing the frequency content of the AE activity. This on one hand shows the sensitivity of AE to processes that are generated in the microstructure. On the other hand, it opens the way for characterization of reinforcement effectiveness based on low proof loading, since the aforementioned sensitivity of AE to the imposed stress field allows correlations to the final mechanical properties before damage is inflicted.

Author Contributions

Conceptualization, D.G.A. and N.A.; methodology, A.C.M.; validation, A.C.M., T.E.M.; formal analysis, D.G.A., A.C.M., N.A.; investigation, T.E.M.; data curation, A.C.M., N.A.; writing—original draft preparation, A.C.M., N.A., D.G.A.; writing—review and editing, T.E.M.; supervision, D.G.A., T.E.M. All authors have read and agreed to the published version of the manuscript.

Funding

This research received no external funding.

Institutional Review Board Statement

Not applicable.

Informed Consent Statement

Not applicable.

Data Availability Statement

The data of this study is available upon request, where justified, by e-mail to the corresponding author.

Acknowledgments

In this section, you can acknowledge any support given which is not covered by the author contribution or funding sections. This may include administrative and technical support, or donations in kind (e.g., materials used for experiments).

Conflicts of Interest

The authors declare no conflict of interest.

References

  1. Grosse, C.U.; Ohtsu, M. Acoustic Emission Testing; Springer: Heidelberg, Germany, 2008. [Google Scholar]
  2. Ohtsu, M. Recommendations of RILEM Technical Committee 212-ACD: Acoustic emission and related NDE techniques for crack detection and damage evaluation in concrete: Test method for classification of active cracks in concrete structures by acoustic emission. Mater. Struct. 2010, 43, 1187–1189. [Google Scholar]
  3. Domaneschi, M.; Niccolini, G.; Lacidogna, G.; Cimellaro, G.P. Nondestructive Monitoring Techniques for Crack Detection and Localization in RC Elements. Appl. Sci. 2020, 10, 3248. [Google Scholar] [CrossRef]
  4. Gollob, S.; Kocur, G.K.; Schumacher, T.; Mhamdi, L.; Vogel, T. A novel multi-segment path analysis based on a heterogeneous velocity model for the localization of acoustic emission sources in complex propagation media. Ultrasonics 2017, 74, 48–61. [Google Scholar] [CrossRef]
  5. Park, W.H.; Packo, P.; Kundu, T. Acoustic source localization in an anisotropic plate without knowing its material properties—A new approach. Ultrasonics 2017, 79, 9–17. [Google Scholar] [CrossRef] [Green Version]
  6. Rouchier, S.; Foray, G.; Godin, N.; Woloszyn, M.; Roux, J.-J. Damage monitoring in fibre reinforced mortar by combined digital image correlation and acoustic emission. Constr. Build. Mater. 2013, 38, 371–380. [Google Scholar] [CrossRef] [Green Version]
  7. Habib, A.; Kim, C.H.; Kim, J.-M. A Crack Characterization Method for Reinforced Concrete Beams Using an Acoustic Emission Technique. Appl. Sci. 2020, 10, 7918. [Google Scholar] [CrossRef]
  8. Sagasta, F.; Benavent-Climent, A.; Roldán, A.; Gallego, A. Correlation of Plastic Strain Energy and Acoustic Emission Energy in Reinforced Concrete Structures. Appl. Sci. 2016, 6, 84. [Google Scholar] [CrossRef] [Green Version]
  9. Tayfur, S.; Alver, N.; Tanarslan, H.M.; Ercan, E. Identifying CFRP strip width influence on fracture of RC beams by acoustic emission. Constr. Build. Mater. 2018, 164, 864–876. [Google Scholar] [CrossRef]
  10. Farhidzadeh, A.; Salamone, S.; Singla, P. A probabilistic approach for damage identification and crack mode classification in reinforced concrete structures. J. Intell. Mater. Syst. Struct. 2013, 24, 1722–1735. [Google Scholar] [CrossRef]
  11. Aggelis, D.G.; Soulioti, D.V.; Gatselou, E.A.; Barkoula, N.-M.; Matikas, T.E. Monitoring of the mechanical behavior of con-crete with chemically treated steel fibers by acoustic emission. Constr. Build. Mater. 2013, 48, 1255–1260. [Google Scholar] [CrossRef]
  12. Mpalaskas, A.; Vasilakos, I.; Matikas, T.; Chai, H.K.; Aggelis, D. Monitoring of the fracture mechanisms induced by pull-out and compression in concrete. Eng. Fract. Mech. 2014, 128, 219–230. [Google Scholar] [CrossRef]
  13. Shiotani, T.; Oshima, Y.; Goto, M.; Momoki, S. Temporal and spatial evaluation of grout failure process with PC cable breakage by means of acoustic emission. Constr. Build. Mater. 2013, 48, 1286–1292. [Google Scholar] [CrossRef]
  14. Wu, K.; Chen, B.; Yao, W. Study on the AE characteristics of fracture process of mortar, concrete and steel-fiber-reinforced concrete beams. Cem. Concr. Res. 2000, 30, 1495–1500. [Google Scholar] [CrossRef]
  15. Tsangouri, E.; Aggelis, D.G. A review of acoustic emission as indicator of reinforcement effectiveness in concrete and ce-mentitious composites. Constr. Build. Mater. 2019, 224, 198–205. [Google Scholar] [CrossRef]
  16. Slater, E.; Moni, M.; Alam, M.S. Predicting the shear strength of steel fiber reinforced concrete beams. Constr. Build. Mater. 2012, 26, 423–436. [Google Scholar] [CrossRef]
  17. Afroughsabet, V.; Ozbakkaloglu, T. Mechanical and durability properties of high-strength concrete containing steel and polypropylene fibers. Constr. Build. Mater. 2015, 94, 73–82. [Google Scholar] [CrossRef]
  18. Mertol, H.C.; Baran, E.; Bello, H.J. Flexural behavior of lightly and heavily reinforced steel fiber concrete beams. Constr. Build. Mater. 2015, 98, 185–193. [Google Scholar] [CrossRef]
  19. Buratti, N.; Mazzotti, C.; Savoia, M. Post-cracking behavior of steel and macro-synthetic fibre-reinforced concretes. Constr. Build. Mater. 2011, 25, 2713–2722. [Google Scholar] [CrossRef]
  20. Mu, R.; Xing, P.; Yu, J.; Wei, L.; Zhao, Q.; Qing, L.; Zhou, J.; Tian, W.; Gao, S.; Zhao, X.; et al. Investigation on reinforcement of aligned steel fiber on flexural behavior of cement-based composites using acoustic emission signal analysis. Constr. Build. Mater. 2019, 201, 42–50. [Google Scholar] [CrossRef]
  21. Landis, E.N.; Kravchuk, R.; Loshkov, D. Experimental investigations of internal energy dissipation during fracture of fiber-reinforced ultra-high-performance concrete. Front. Struct. Civil Eng. 2019, 13, 190–200. [Google Scholar] [CrossRef]
  22. Bhosale, A.; Rasheed, M.A.; Prakash, S.S.; Raju, G. A study on the efficiency of steel vs. synthetic vs. hybrid fibers on fracture behavior of concrete in flexure using acoustic emission. Constr. Build. Mater. 2019, 199, 256–268. [Google Scholar] [CrossRef]
  23. Herrmann, H.; Schnell, J. (Eds.) Short Fibre Reinforced Cementitious Composites and Ceramics; Springer Nature Switzerland AG: Cham, Switzerland, 2019. [Google Scholar]
  24. Turkish Standards Institute. Testing Hardened Concrete—Part 5: Flexural Strength of Test Specimens; TS EN 12390-5; Turkish Standards Institute: Ankara, Turkey, 2010. [Google Scholar]
  25. ASTM C1609/C1609M—5a Standard Test Method for Flexural Performance of Fiber-Reinforced Concrete (Using Beam with Third-Point Loading). Available online: https://www.astm.org/Standards/C1609.htm (accessed on 1 March 2021).
  26. Moore, D.; Lockner, D. The role of microcracking in shear-fracture propagation in granite. J. Struct. Geol. 1995, 17, 95–114. [Google Scholar] [CrossRef]
  27. Brunner, A.J. Identification of damage mechanisms in fiber-reinforced polymer-matrix composites with acoustic emission and the challenge of assessing structural integrity and service-life. Construct. Build. Mater. 2018, 173, 629–637. [Google Scholar] [CrossRef]
  28. Farhidzadeh, A.; Mpalaskas, A.; Matikas, T.E.; Farhidzadeh, H.; Aggelis, D.G. Fracture mode identification in cementitious materials using supervised pattern recognition of acoustic emission features. Construct. Build. Mater. 2014, 67, 129–138. [Google Scholar] [CrossRef]
  29. Godin, N.; Huguet, S.; Gaertner, R. Integration of the Kohonen’s self-organising map and k-means algorithm for the segmen-tation of the AE data collected during tensile tests on cross-ply composites. NDT E Int. 2005, 38, 299–309. [Google Scholar] [CrossRef]
  30. Rasheed, M.A.; Prakash, S.S.; Raju, G.; Kawasaki, Y. Fracture studies on synthetic fiber reinforced cellular concrete using acoustic emission technique. Constr. Build. Mater. 2018, 169, 100–112. [Google Scholar] [CrossRef]
  31. Alver, N.; Tanarslan, H.M.; Tayfur, S. Monitoring fracture processes of CFRP-strengthened RC beam by acoustic emission. J. Infrastruct. Syst. 2017, 23, B4016002. [Google Scholar] [CrossRef]
  32. De Sutter, S.; Verbruggen, S.; Tysmans, T.; Aggelis, D. Fracture monitoring of lightweight composite-concrete beams. Compos. Struct. 2017, 167, 11–19. [Google Scholar] [CrossRef]
Figure 1. (a) Correspondence between stress mode and AE waveform, (b) illustration of typical tensile (top) and shear (bottom) events in reinforced concrete.
Applsci 11 03850 g001
Figure 2. Typical AE waveform with main parameters.
Applsci 11 03850 g002
Figure 3. Three-point flexure test (a) drawing of the geometry and sensor placement, (b) photograph during test.
Applsci 11 03850 g003
Figure 4. Concrete specimen reinforced with hooked fibers after a bending test with the main crack visible.
Applsci 11 03850 g004
Figure 5. Cumulative AE curves for typical concrete specimens with different vol.% of steel fibers tested on three-point bending.
Applsci 11 03850 g005
Figure 6. Rise time for concrete specimens with different vol.% of steel fibers tested on 3p-bending.
Applsci 11 03850 g006
Figure 7. Cumulative AE curves for typical concrete specimens with different vol.% of steel fibers tested on 4p-bending.
Applsci 11 03850 g007
Figure 8. (a) RA value and (b) average frequency AF vs. steel fiber content for different fiber shapes.
Applsci 11 03850 g008
Figure 9. Correlation plot between average frequency (AF) and RA for different steel fiber content. The error bars correspond to the standard deviation.
Applsci 11 03850 g009
Figure 10. (a) Correlation between AE parameters obtained from the elastic regime and toughness of SFRC under 3p-bending. (b) Correlation between RA value and max. load for SFRC under 4p-bending and different contents and types of fibers.
Applsci 11 03850 g010
Table 1. Basic AE parameters and mechanical test results for different fiber contents after the three-point bending test.
Fiber Content (Vol.)AE ParametersMechanical Test Results
Rise Time (µs)Central
Frequency (kHz)
Secant
Stiffness (N/mm)
Toughness
(mJ)
0%39.5165.659693195
0.5%48.8155.3740519,589
1%58.7150.210,81635,693
Table 2. Load capacity for concrete specimens with a different type and content of fibers.
Specimen TypeFlexural Load (St. Dev.)
(kN)
Plain13.82 (3.22)
Waved 0.5%16.22 (0.53)
Hooked 0.5%17.20 (3.48)
Waved 2%21.37 (1.58)
Hooked 2%24.94 (2.44)
Publisher’s Note: MDPI stays neutral with regard to jurisdictional claims in published maps and institutional affiliations.

