Article

A Novel Composite with Structural Health Monitoring Functionality via 2D and 3D Impedance Mapping Topography

by
Georgios Foteinidis
and
Alkiviadis S. Paipetis
*
Department of Materials Science and Engineering, University of Ioannina, 45110 Ioannina, Greece
*
Author to whom correspondence should be addressed.
Appl. Sci. 2021, 11(4), 1647; https://doi.org/10.3390/app11041647
Submission received: 3 December 2020 / Revised: 27 January 2021 / Accepted: 4 February 2021 / Published: 11 February 2021

Abstract

:
We report the transformation of a conventional composite material into a multifunctional structure able to provide information about its structural integrity. A purposely positioned grid of carbon fabric strips located within a glass fibre laminate in alternating 0/90 configuration combined with a ternary nanomodified epoxy matrix imparted structural health monitoring (SHM) topographic capabilities to the composite using the impedance spectroscopy (IS) technique. The matrix was reinforced with homogenously dispersed multi-walled carbon nanotubes (MWCNTs) and carbon black (CB). A sinusoidal electric field was applied locally over a frequency range from 1 Hz to 100 kHz between the junction points of the grid of carbon fabric strips. The proposed design enabled topographic damage assessment after a high-velocity impact via the local monitoring of the impedance. The data obtained from the IS measurements were depicted by magnitude and phase delay Bode plots and Nyquist plots. The impedance values were used to create a 2D and a multi-layer (3D) contour topographical image of the damaged area, which revealed crucial information about the structural integrity of the composite.

Graphical Abstract

1. Introduction

Advanced composite materials nowadays possess a leading position in the aeronautics industry for primary aircraft components (e.g., Airbus A380, Boeing 787). Due to their exceptional specific mechanical properties, corrosion resistance and capability of tailored manufacturing, composite materials are employed for numerous aerospace components such as the wings, fuselage or the aircraft interiors. In fibre reinforced composites, the lightweight advantage is achieved by efficient design and involves structural anisotropy. This anisotropy is accompanied by more complex damage initiation and propagation mechanisms than those commonly encountered in conventional isotropic structural materials. A major disadvantage of composite materials is that they are sensitive to impact damage, e.g. hail damage [1]. The impact is classified into low, intermediate, high and hyper-velocity, according to the velocity of the projectile. Different impact types correspond to different energy transfer from the projectile to the target, which affects energy dissipation inside the material and consequently damage initiation and propagation [2,3].
The ballistic impact is characterised as high-velocity when the velocity of the projectile ranges from 50 m/s to 1000 m/s [3]. For glass fibre reinforced polymers (GFRPs) under ballistic impact, two dominant damage mechanisms are responsible for the energy absorption of the projectile, fibre breakage and delamination [4]. Delaminations between plies usually cannot be detected by visual inspection and therefore, may pose a serious threat to the structural integrity of load-bearing components. A lot of research has been invested into the efficient detection and localization of the extent of damage, particularly in the development of various non-destructive testing (NDT) techniques. Among the most prevalent NDT techniques in the aeronautic field are ultrasonics, IR thermography, vibration methods, radiographic inspection, Eddy currents, electrical methods, etc. [5,6,7,8,9,10,11,12,13,14]. The majority of the techniques mentioned above require both the removal of the component to be tested and the utilisation of bulky and heavy sensors and equipment. The solution of permanently integrating or embedding a sensor in a structure is ideal for the in situ monitoring of the structural integrity or the structural health monitoring (SHM) of the composite during its service life [9].
SHM is vital in providing on-site or even on-line damage detection and topography. Among several SHM techniques, those related to the electrical response to damage can provide information about the structural degradation of the material with high sensitivity and precision. Moreover, the sensing elements may be an integral part of the composite structure, providing self-sensing functionalities [11,15,16,17]. In recent years, numerous studies have been focused on developing self-monitoring systems based on impedance spectroscopy (IS). In various cases, the monitoring system is based on introducing two metallic sheets at the outer surfaces of the fibre reinforced laminate, thus creating a capacitor structure [18,19,20]. Bekas et al. manufactured a diagnostic film with printed sensors/actuators to monitor the curing process and detect the damage in composites. These sensors can be placed either on the surface or embedded within the composite [16,17]. However, embedded sensors may also act as damage initiation sites, compromising the mechanical performance of the structure.
Self-sensing is defined as the ability of the material to provide information about its structural integrity. The self-sensing functionality for structural components presents significant advantages compared to the inclusion of non-structural elements, such as a sensor inside the structure of the composite. Since the sensing element is an integral part of its structure, structural aggravation is minimized [21]. The self-sensing approach has been widely applied for carbon fibre reinforced polymers (CFRPs), where carbon fibres also functioned as sensing elements for the structure, due to their electrical conductivity [22,23]. This approach was also reported to provide in-plane damage mapping [24,25].
Damage monitoring has also been demonstrated for composites with non-conductive reinforcement, such as GFRPs, where the polymeric matrix is “doped” with conductive elements [18,26,27]. A major challenge in imparting multifunctionality to composite materials via the exploitation of electrical properties is tailoring electrical conductivity so that the response of the material to various external fields is noise-free and within the sensitivity and time frame of the monitoring process. The addition of a conductive nano- or micro-scaled filler inside the dielectric epoxy matrix has been reported to improve the mechanical, electrical and thermal properties of the composites [28,29]. According to various studies, the most promising nano-fillers are carbon nanotubes (CNTs) due to their exceptional properties [30]. As an alternative filler, carbon black (CB) is a widely used carbonaceous filler, capable of enhancing these properties [31,32]. Therefore, the homogenous dispersion of these fillers overcomes the obstacles of imparting functional properties to the epoxy resin and more specifically, the SHM functionality [18,33,34].
Within the scope of this research was to impart self-sensing capabilities to the composite to map high-velocity impact damage. Self-sensing was achieved by using the carbon fabric strips both as reinforcing elements and embedded electrodes, in a specific layout between the glass fabric plies, thus eliminating the need for “external” sensors. This targeted layout enabled the structural integrity monitoring through the thickness of the composite, in the junction points of the carbon strips. The strips were selected instead of a sheet of carbon fabric that could not provide damage localization (mapping). The simultaneous incorporation of multi-wall carbon nanotubes (MWCNTs) and CB allowed tailoring the electrical conductivity of the matrix that led to faster transitions and reduced monitoring time and noise. The formed sensing elements enabled the delamination damage mapping topography of the composite in two and three dimensions (2D and 3D damage topography). Multiplexing with an IS spectrometer provided all the in situ records for the structural integrity of the studied material.

2. Materials and Methods

2.1. Materials

In this study, Graphistrength C100 multi-wall carbon nanotubes supplied by ARKEMA France SA, Paris, France were used as the primary filler of the epoxy matrix. The diameter of the MWCNTs varied between 10 and 15 nm and the length ranged from 1 to 10 μm. The nanotubes were provided in the form of agglomerated bundles. The agglomerates had an average diameter of 400 μm ranging from 50 to 900 μm. Milled carbon black provided by R&G composites, GmbH was selected as the secondary reinforcement with agglomerate sizes ranging from 5 to 50 μm.
A two-part low viscosity epoxy resin Aradilte LY5052 and the hardener Aradur 5052, at a mix ratio of 100:38% w/w, provided by Huntsman Advanced Materials, Basel, Switzerland, was selected as the matrix phase. Curing took place for 24 h at room temperature (25 °C).
Unidirectional glass (UD) fabric with an areal density of 320 g/m2 and lamina thickness of 0.260 mm and unidirectional carbon fabric with an areal density of 218 g/m2 and lamina thickness of 0.235 mm were used the reinforcement. Both fabrics were provided by R&G composites, Germany.

2.2. Composites Manufacturing

The homogenous dispersion of carbon fillers was performed by high shear mixing under controlled temperature. The mixing took place in a Dispermat AE laboratory dissolver, Getzmann, equipped with a double-wall vacuum container. High shear mixing with an impeller was selected among other dispersion techniques to avoid the degradation both of the fillers and the resin. A 45 mm diameter toothed impeller disk, offering medium shear forces to the dispersion to reduce agglomerates size, was chosen.
A fundamental parameter for the manufacturing of the composite was for the nano-filler’s concentration at the matrix to exceed the percolation threshold [29,32,35]. Therefore, in the case of damage, the conductive network would be interrupted. This would be reflected by an increase in the impedance. The optimum dispersion conditions that exhibited high conductivity, medium viscosity and could enable the SHM mapping, were selected based on previous research [32,36]. Consequently, 0.5% w/w MWCNTs and 2% w/w CB were dispersed in the epoxy resin (part A) at 3000 revolutions per minute (rpm) at 25 °C. The dispersion was afterwards mixed with part B. The de-gassing of the resin was skipped as the manufacturing of the laminate was performed under vacuum.
For the 2D mapping, an 8-ply [0/90]2s laminate was manufactured using the hand lay-up method under vacuum. Three parallel carbon fibre strips with 2 cm width and 2 cm space between them were positioned on the first layer. Three more carbon fibre strips, with the same width and spacing, were placed after the last layer, at a 90° angle in relation to those positioned on the top layer. The aim of this specific layout was the formation of sensing elements in the junction points of the top and bottom carbon strips. At the edge of each carbon fabric strip, a copper wire was implanted with conductive silver tape. Figure 1 (left) illustrates the layout of the smart composite with 2D SHM topographic capabilities.
The coordinate system of the laminate is presented in Figure 1 (right). A cartesian system was selected to specify the location of the formatted sensing areas. The area of the material under investigation is marked with orange colour. Note that the carbon fibre strips are not in contact.
For the manufacturing of the smart composite with 3D SHM capabilities, a more complex structure was selected. A 9-ply laminate with a lamination of (0/90/0/90/0/90/0/90/0) was manufactured by the hand lay-up method using vacuum bagging as well. As previously mentioned, three parallel carbon fibre strips were introduced with 2 cm width and 2 cm space between them, on top of the first layer. Three more carbon fibre strips, with the same width and spacing, were placed between the third and fourth lamina, forming a 90° angle with the direction of the top strips. Between lamina 6 and 7, three more carbon fibre strips with 0° direction were added. Finally, three carbon fibre strips were placed after the last lamina of glass fabric, with a 90° orientation. As depicted in Figure 2 (left), a copper wire was connected to the edge of each carbon fabric strip using conductive silver tape.
This layout led to the formation of 27 sensing areas, providing SHM capabilities at three different depth levels through the thickness of the composite. This through-thickness damage detection property combined with the nine spots in-plane for SHM topography imparted a 3D mapping topography functionality to the smart composite. In this case, a three-dimensional cartesian system was used to describe the locus of the areas were impedance measurements applied. X and Y axes specify the in-plane location of the sensing elements, while the Z-axis specifies the current depth level. The 3D coordinate system and the coordinates of two spots are illustrated in Figure 2 (right) as an example, i.e., the red volume is located at the left front side of the laminate and according to the defined cartesian system has coordinates (1,3,1), the marked blue area is positioned on the left middle side of the laminate and has coordinates (1,2,2).

2.3. Characterisation Techniques
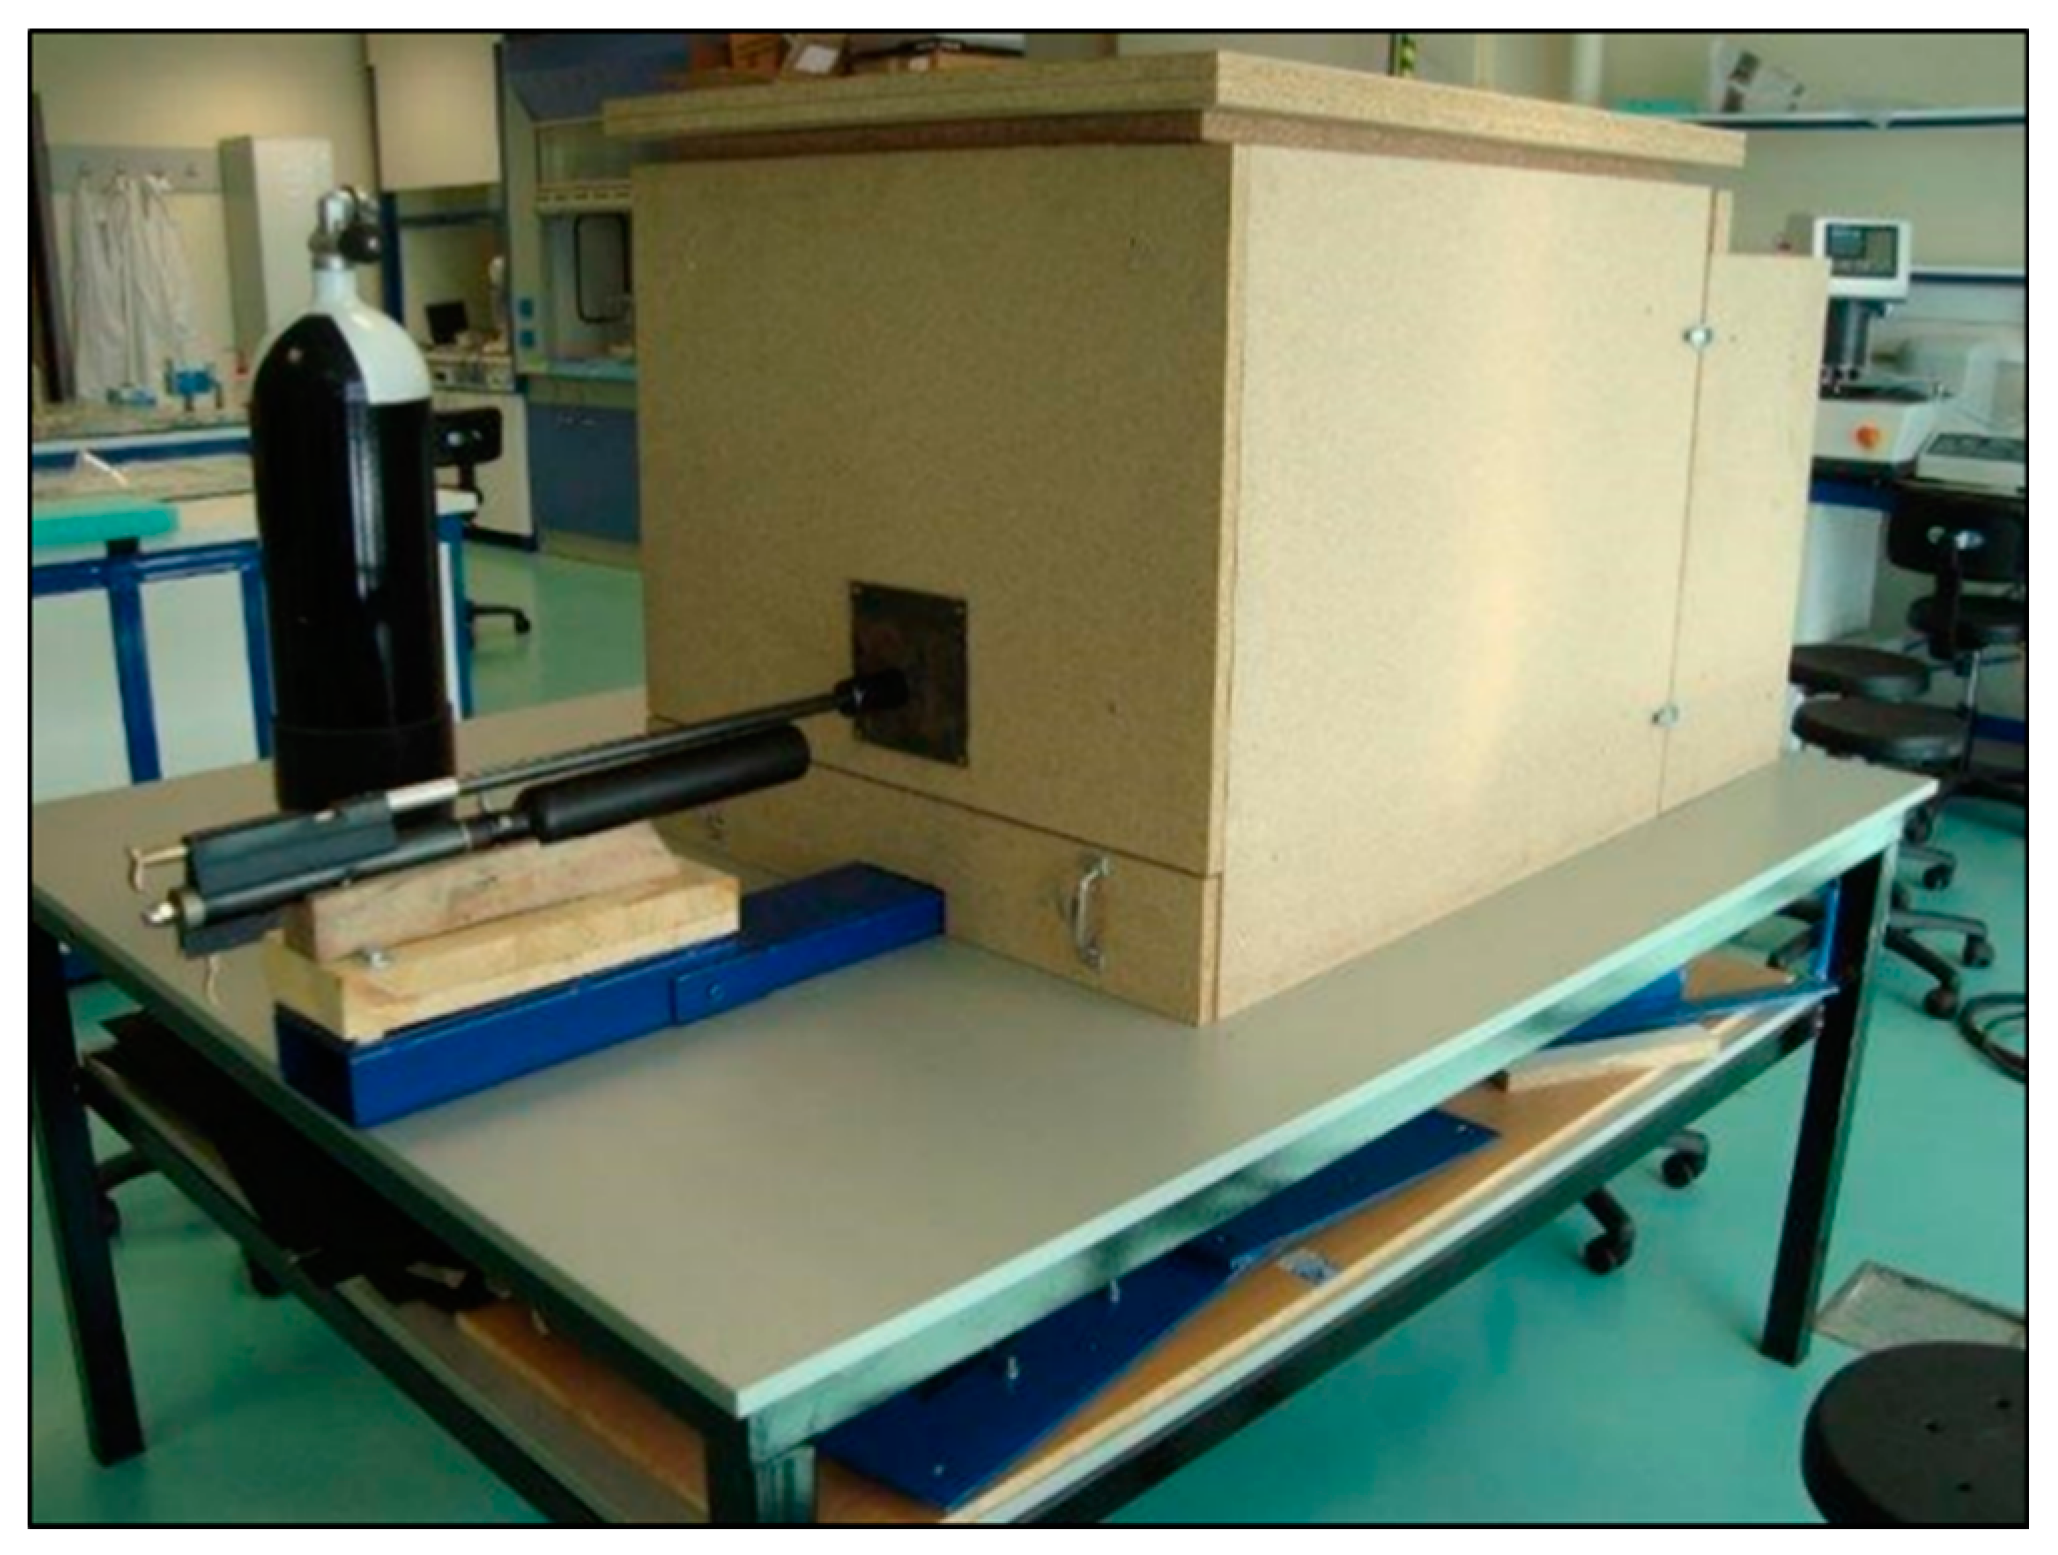
Impedance spectroscopic studies of the smart composite were performed by introducing a sinusoidal voltage to all through-thickness facing pairs of carbon fabric strips. The excitation signal had the form of Equation (1).
Εt = E0 sin(ωt)
where Et (V) is the voltage at a specific time, E0 (V) is the voltage amplitude and ω (rad/s) is the angular velocity. The relation between angular velocity and frequency (f) is described by the equation ω = 2πf.
The formation of a local electric field at the junction points of the carbon fibre strips that serve as a local sensing element provides the response of the material under test to the excitation field. The output current has the same frequency as the excitation voltage, with a phase delay φ which is described by Equation (2).
It = I0 sin(ωt + φ)
Finally, the impedance is estimated by applying an expression analogue to Ohm’s general law for direct current R = E/I, Equation (3).
Ζ = Εt/It = (E0 sin(ωt) )/(Ι0 sin(ωt + φ)) = |Z|(sin(ωt))/(sin(ωt + φ))
The real and the imaginary part of the impedance are calculated according to Equations (4) and (5).
Ζ’ = |Z|cos(θ)
Ζ’’ = |Z|sin(θ)
Impedance measurements were performed using the Advanced Dielectric Thermal Analysis System (DETA-SCOPE) supplied by ADVISE, Chios, Greece. The copper wires of the electrodes were connected to a manual in-house manufactured multiplexing switch which directed the selected electrode pair to the spectroscope. A sinusoidal voltage of 10 V was applied to the electrodes. The frequencies of the performed scans were from 1 to 100 kHz. Every channel was measured individually and the duration of each measurement was 25 s.

2.4. Impact Test

The specimens were subjected to ballistic impact using a gas gun in an in-house manufactured ballistic impact device (Figure 3). The velocity of the projectiles was set by adjusting the air pressure and was measured by a chronograph at 180 m/s, which is between the range of the high-velocity impact (50 m/s to 1000 m/s).
In Figure 4 (left) the laminate with 2D SHM mapping topography after the impact test is presented. The impact site (red circle) is located on the right side of the laminate. As far as the laminate with 3D SHM mapping topography is concerned, the impact site was located at the centre of the composite, as shown in Figure 4 (right) marked with the red circle.

3. Results and Discussion

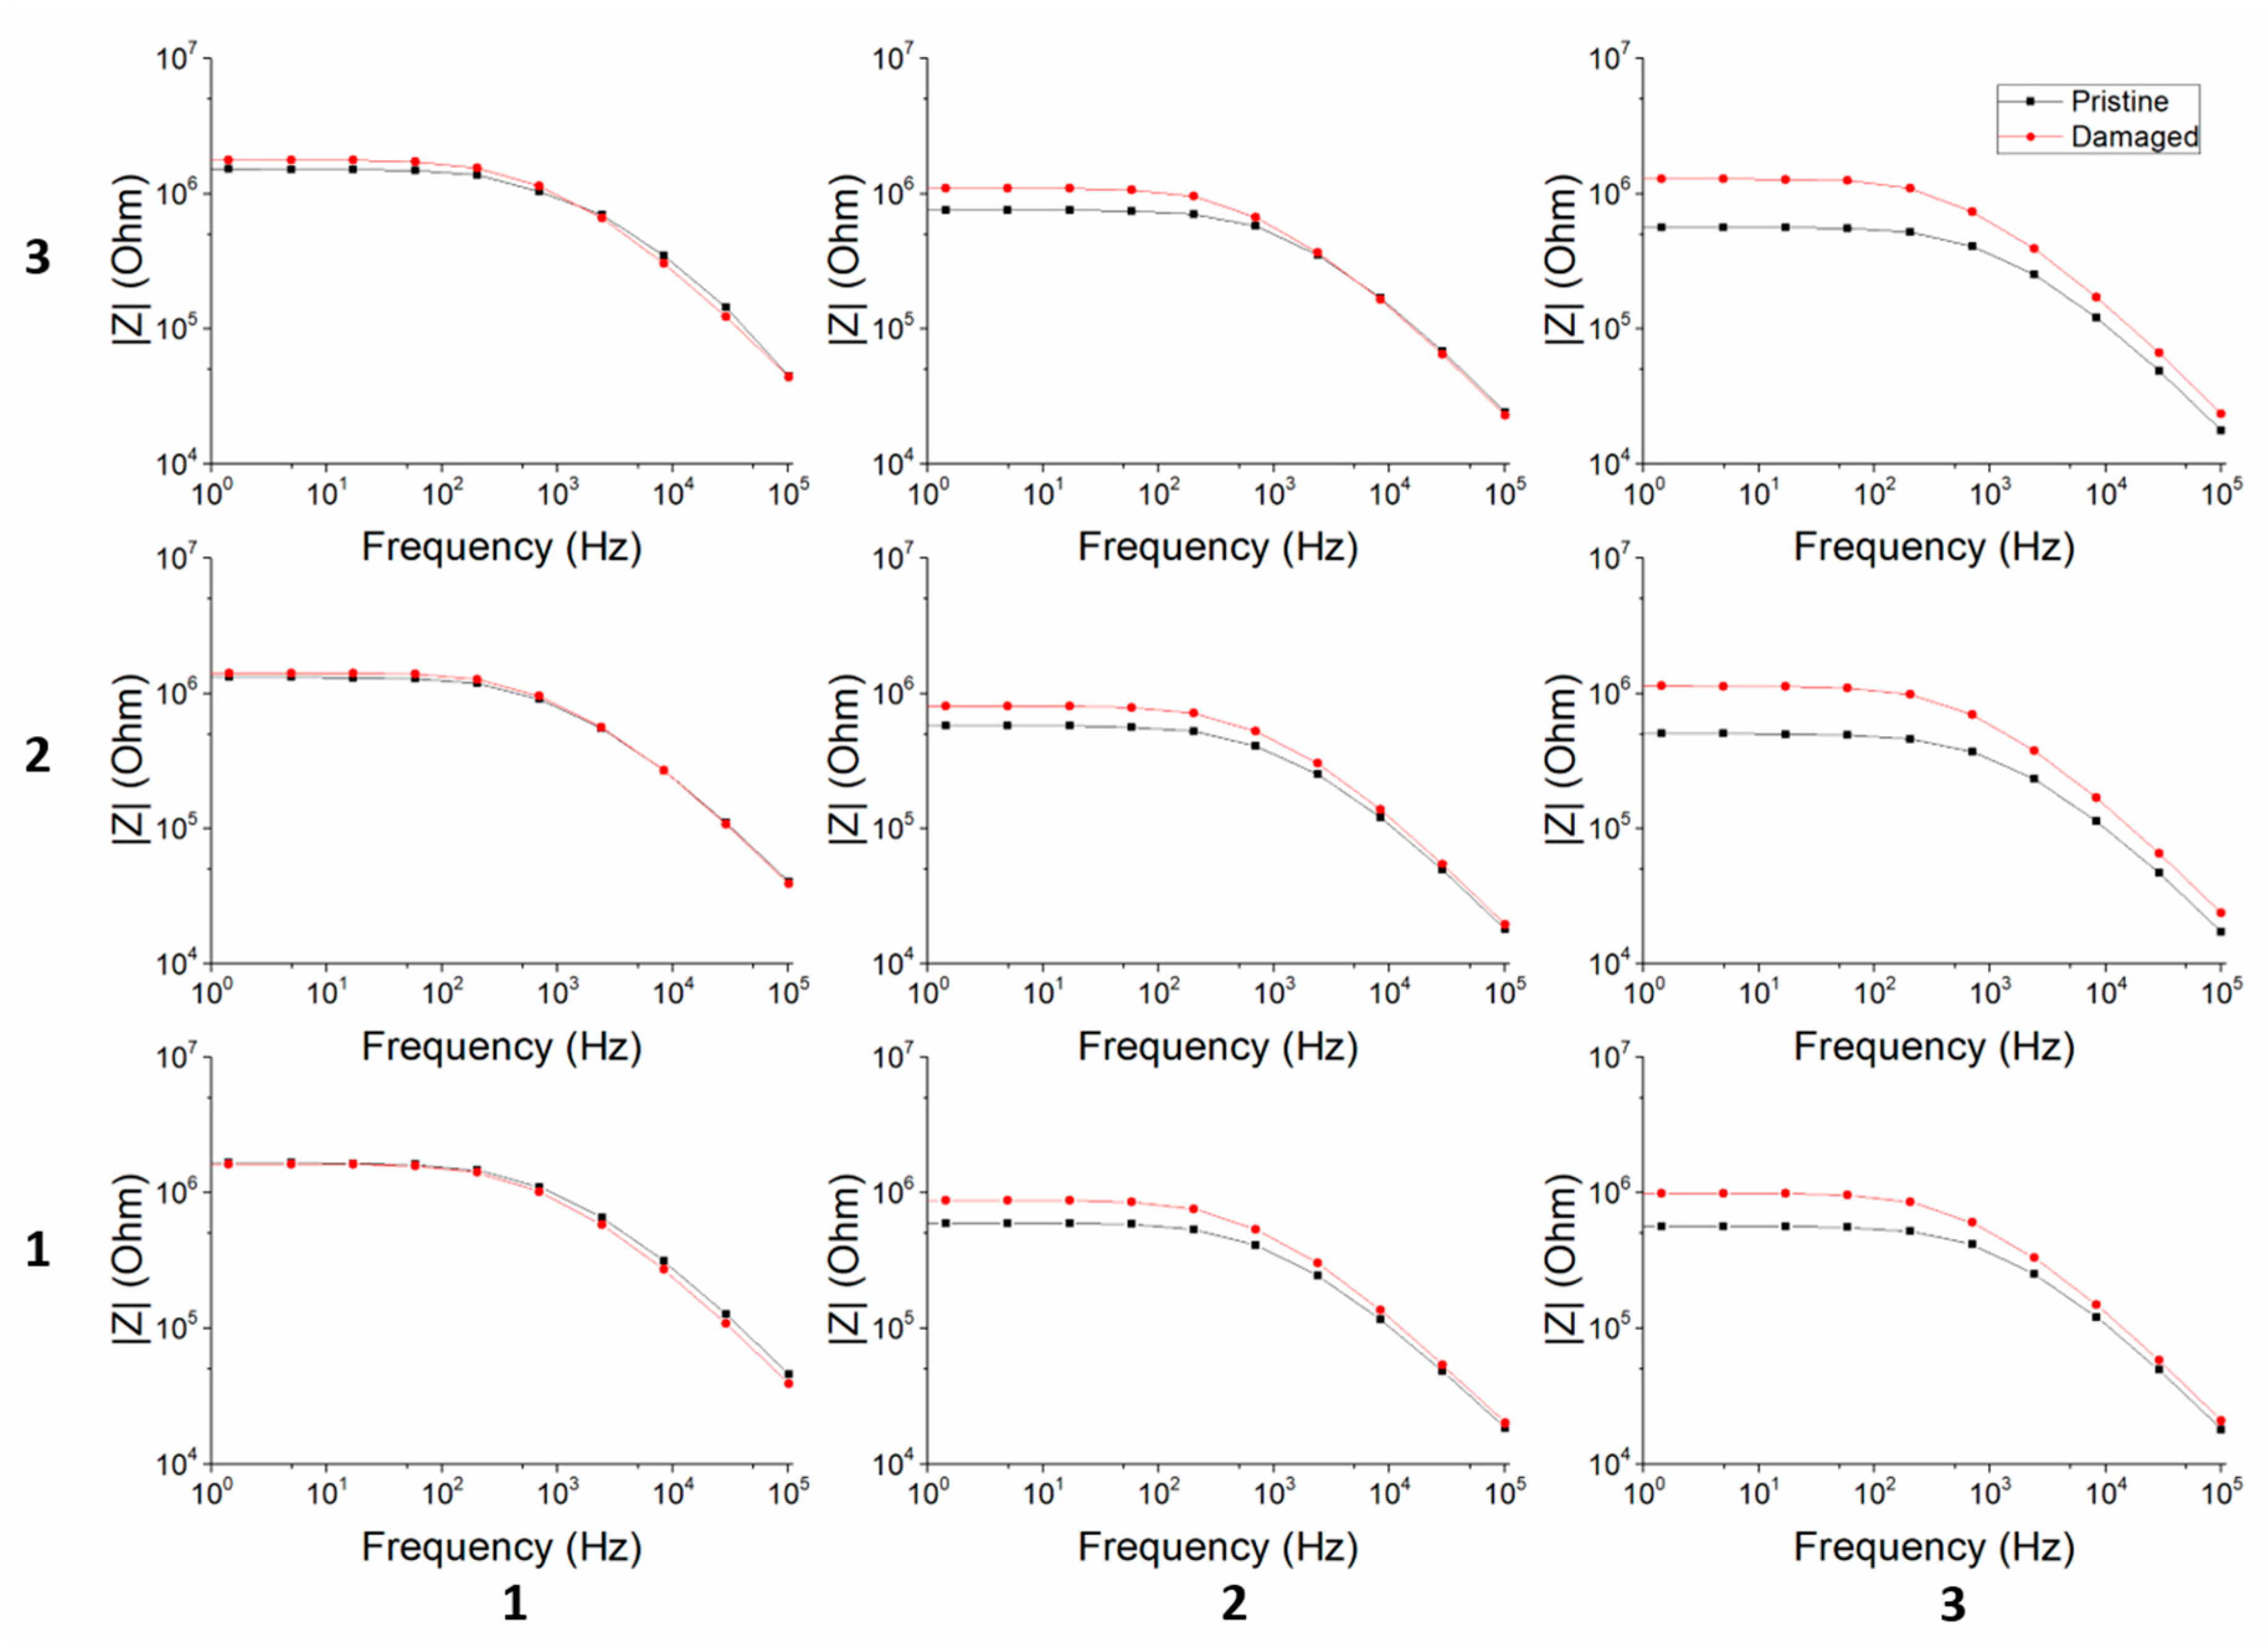
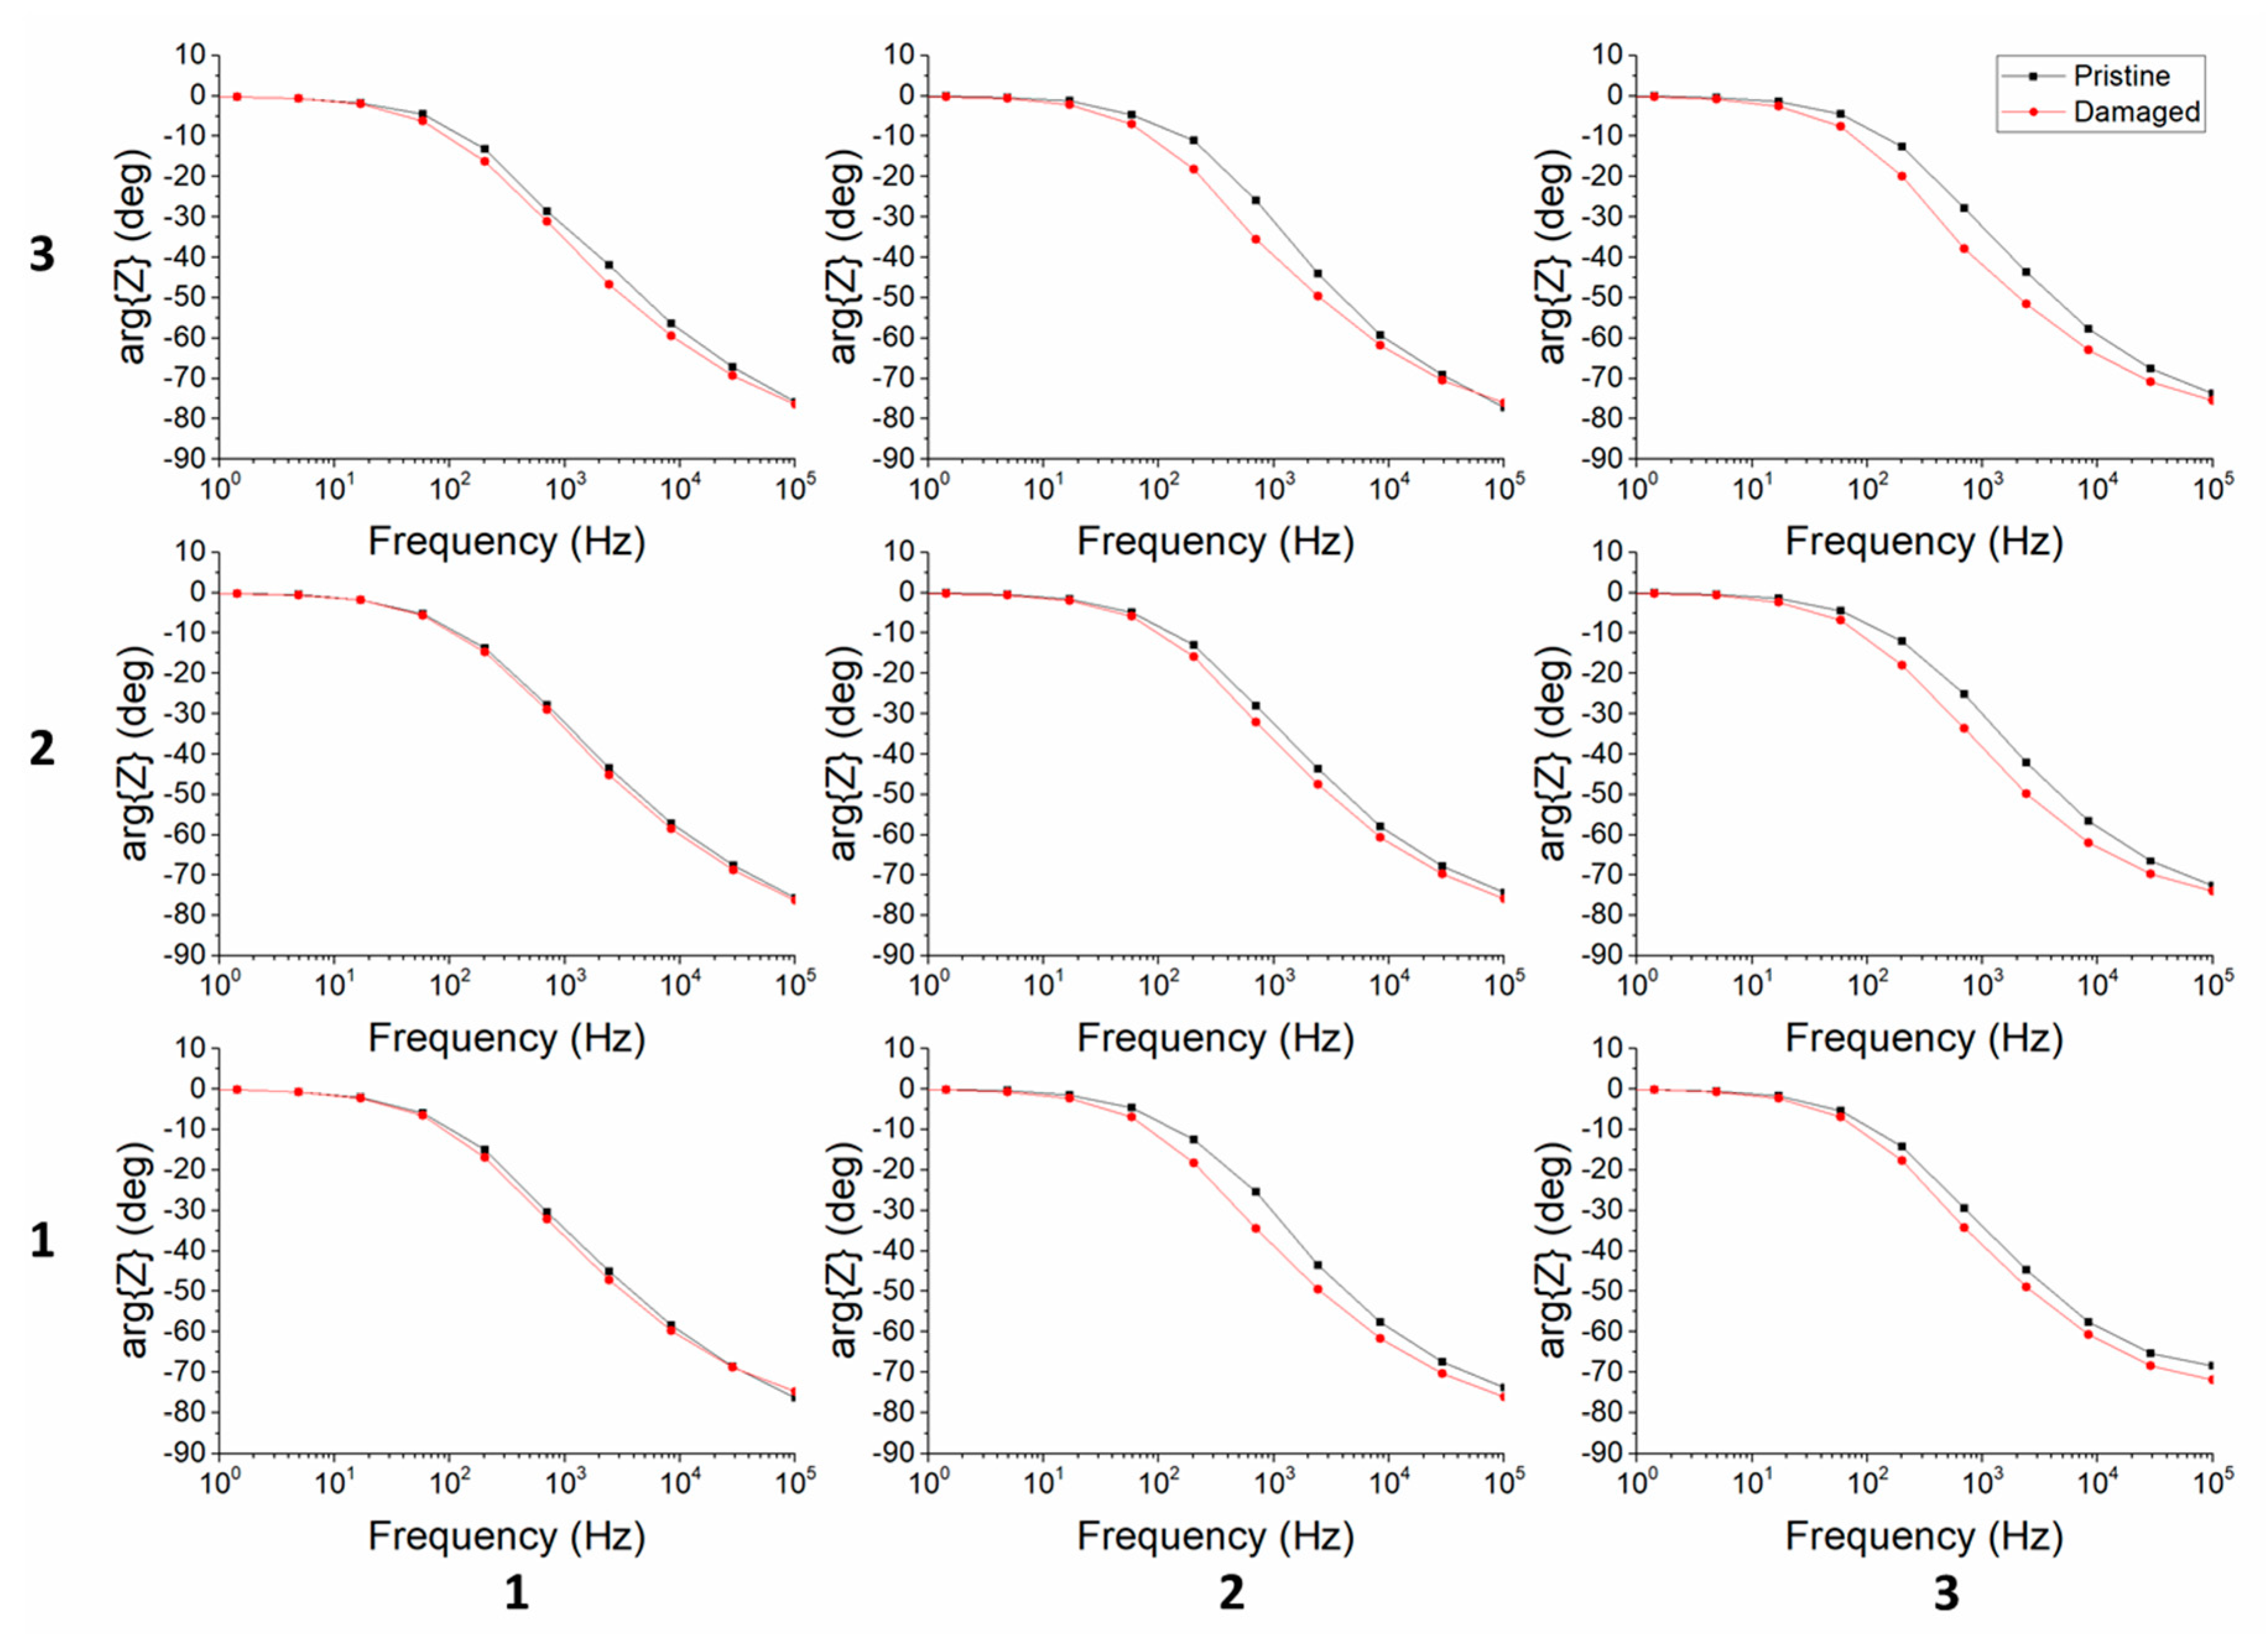
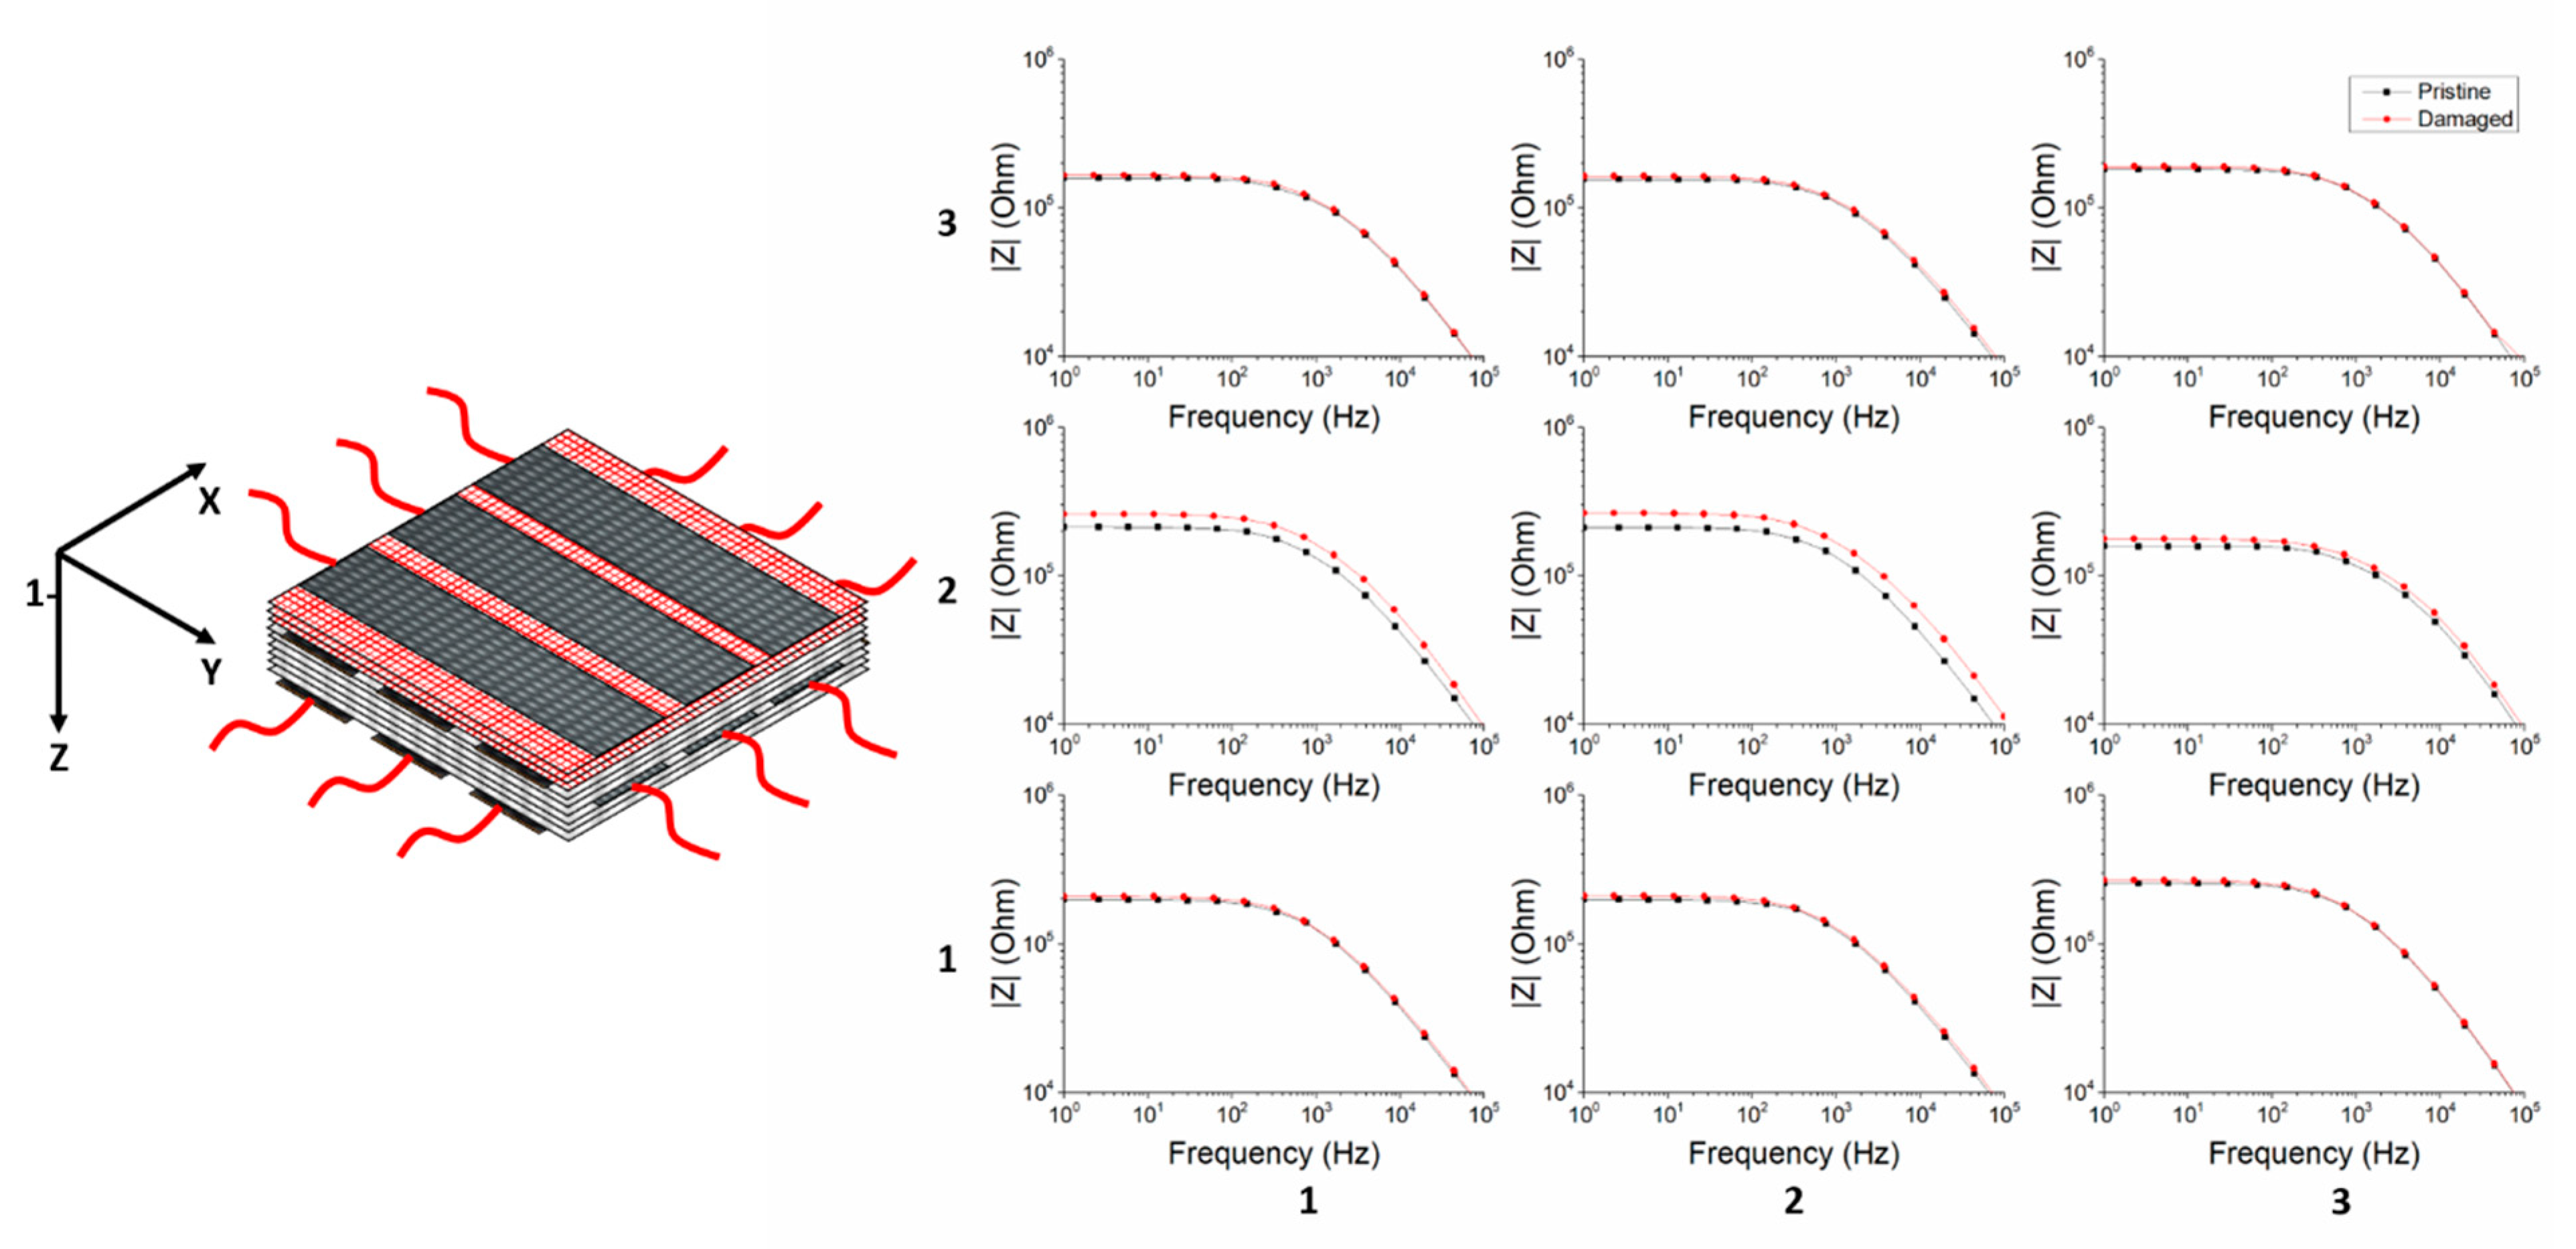
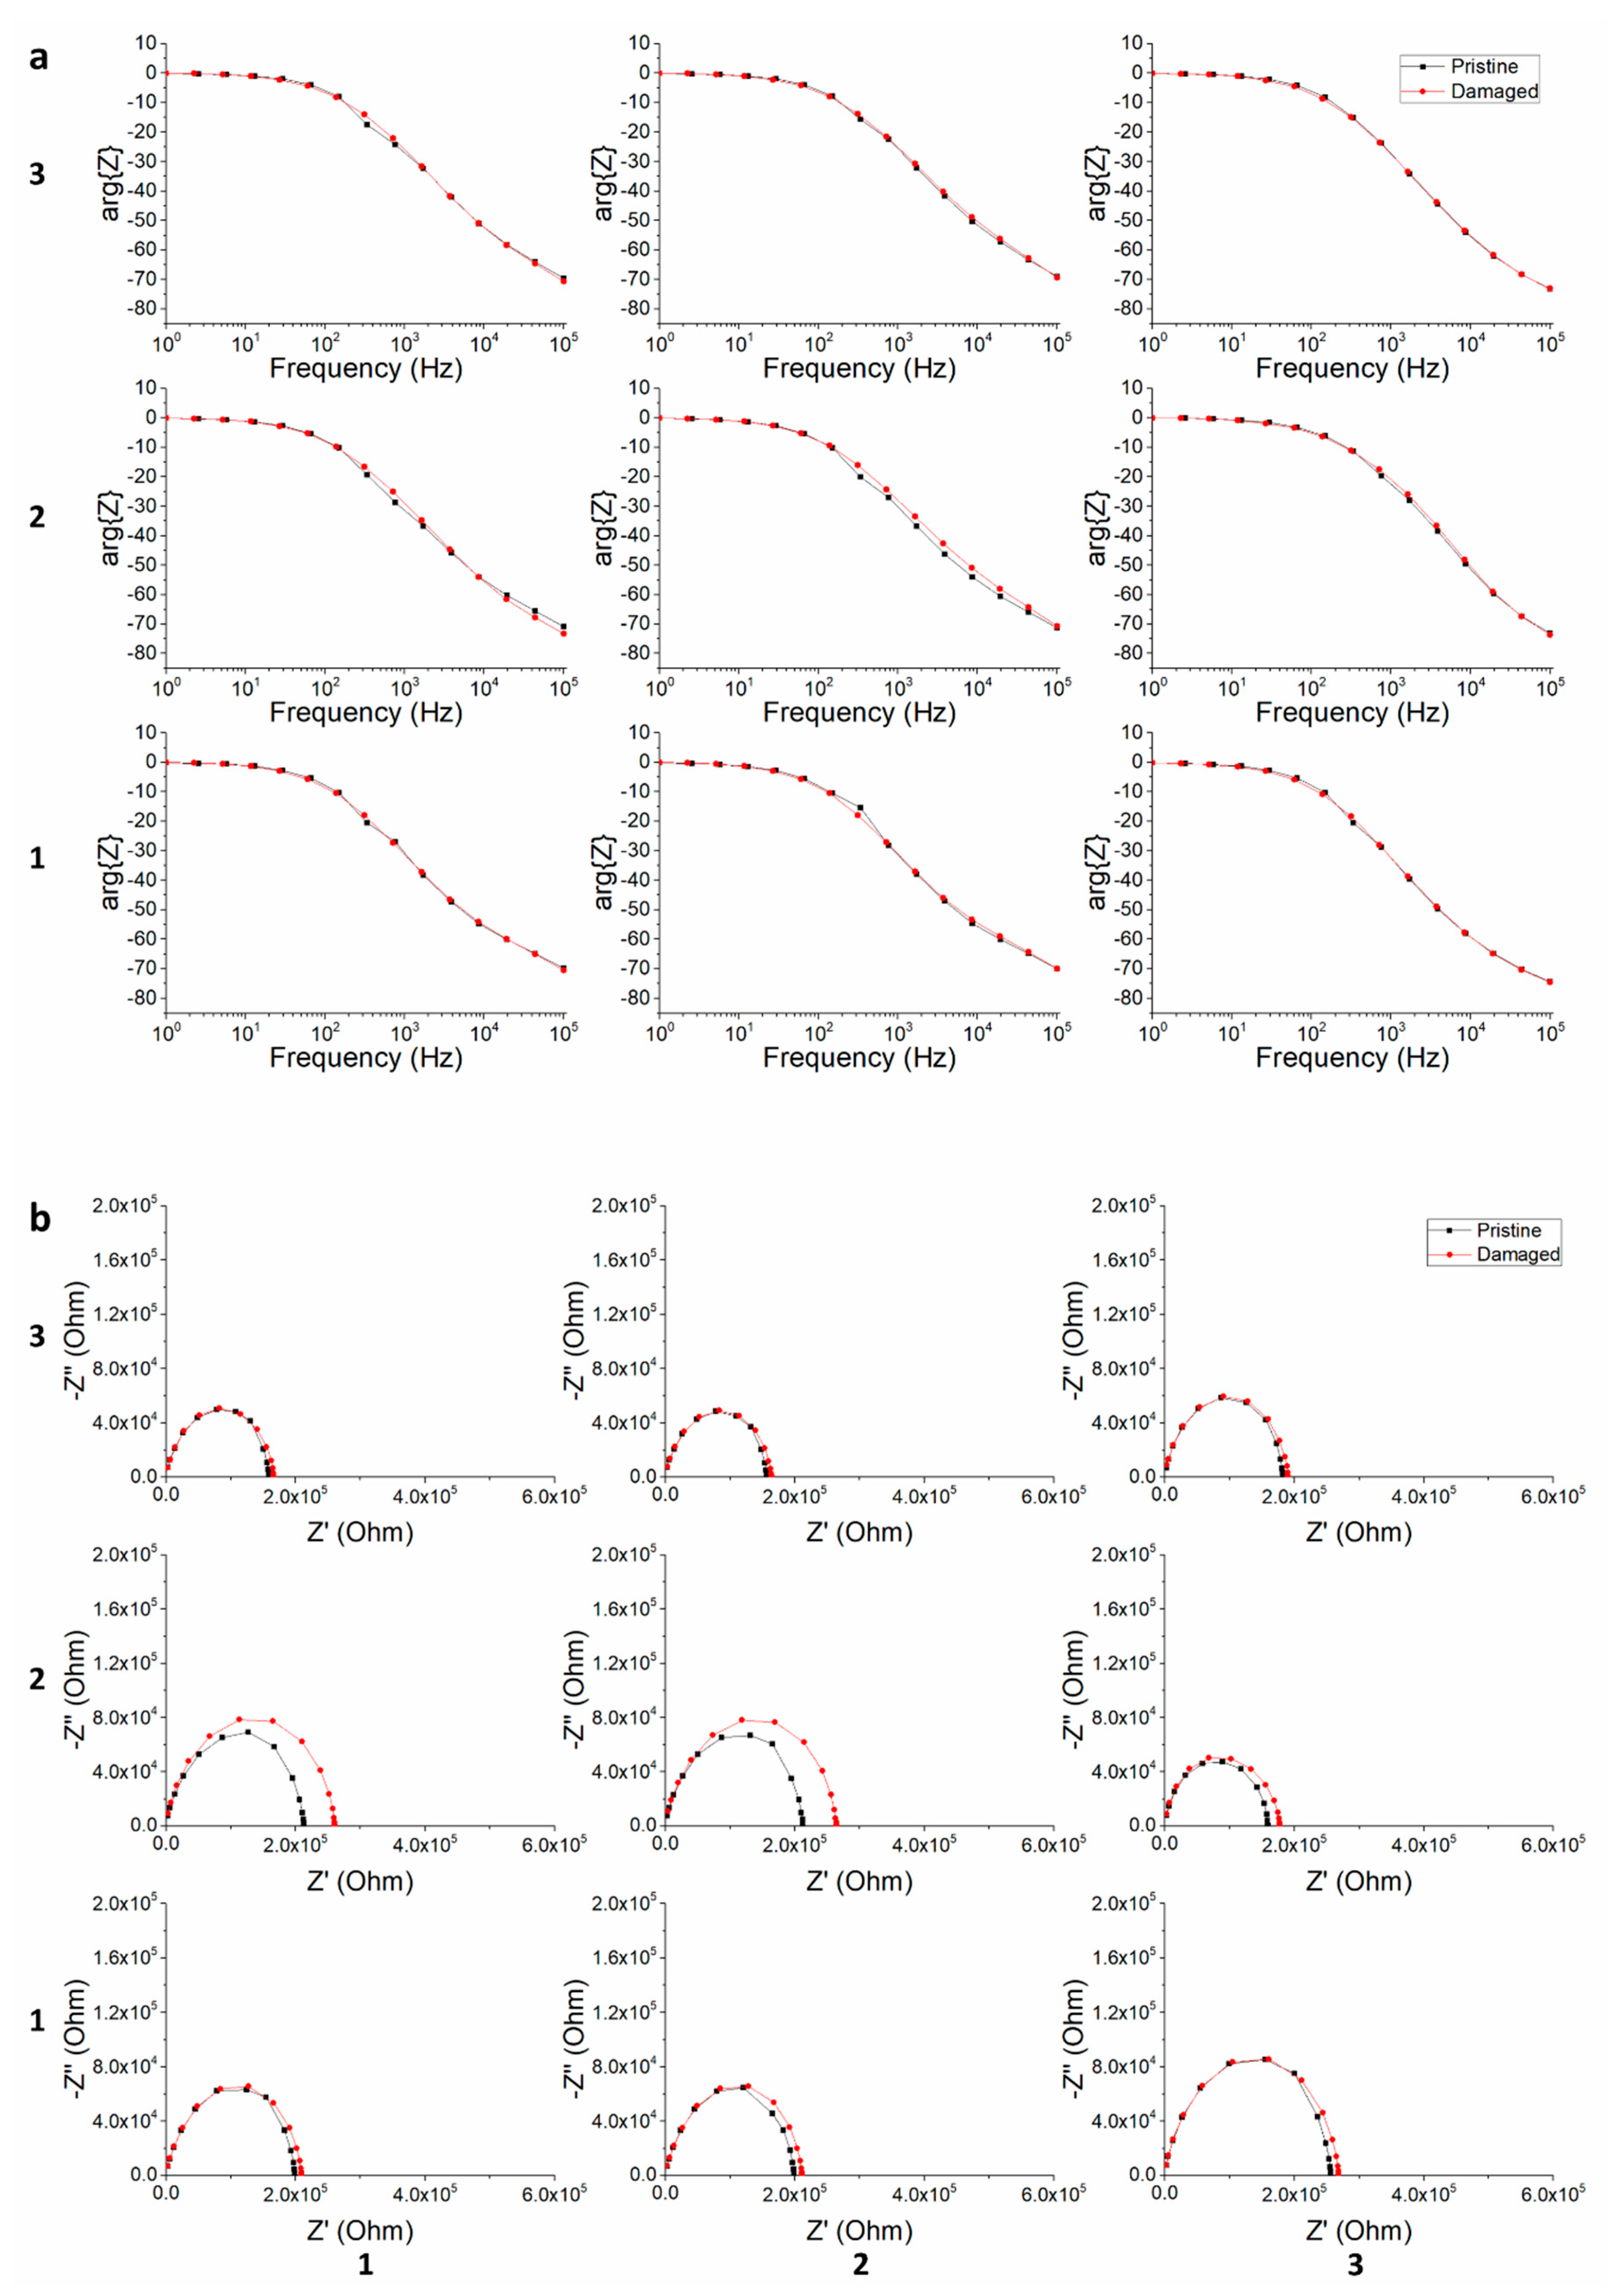
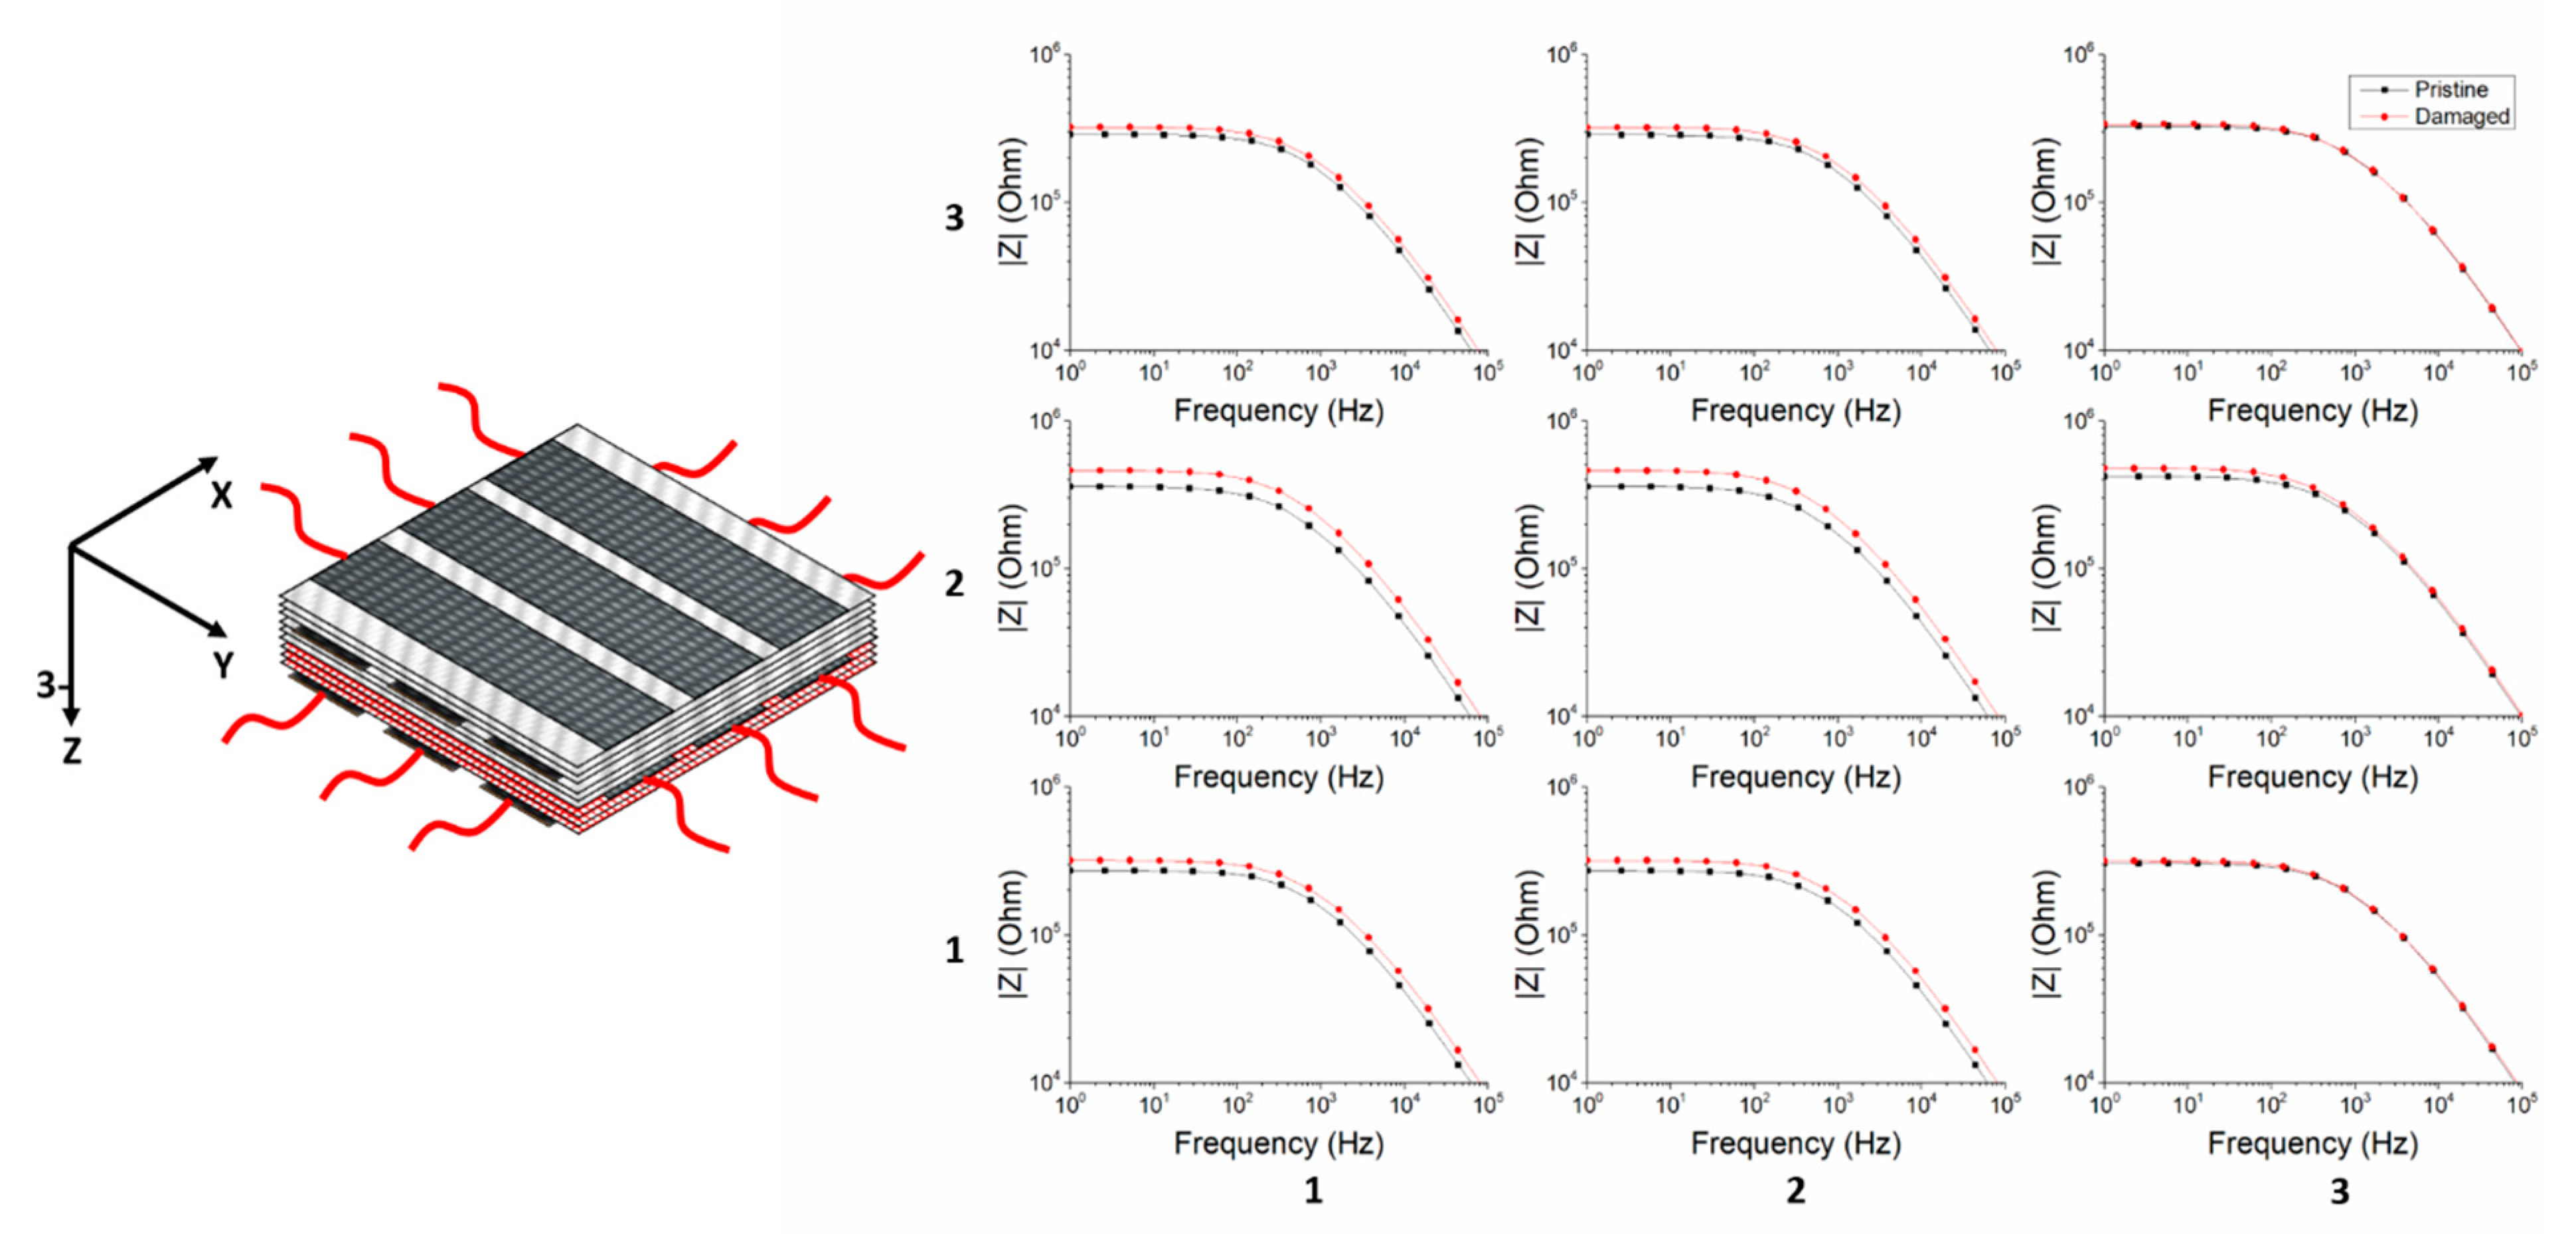
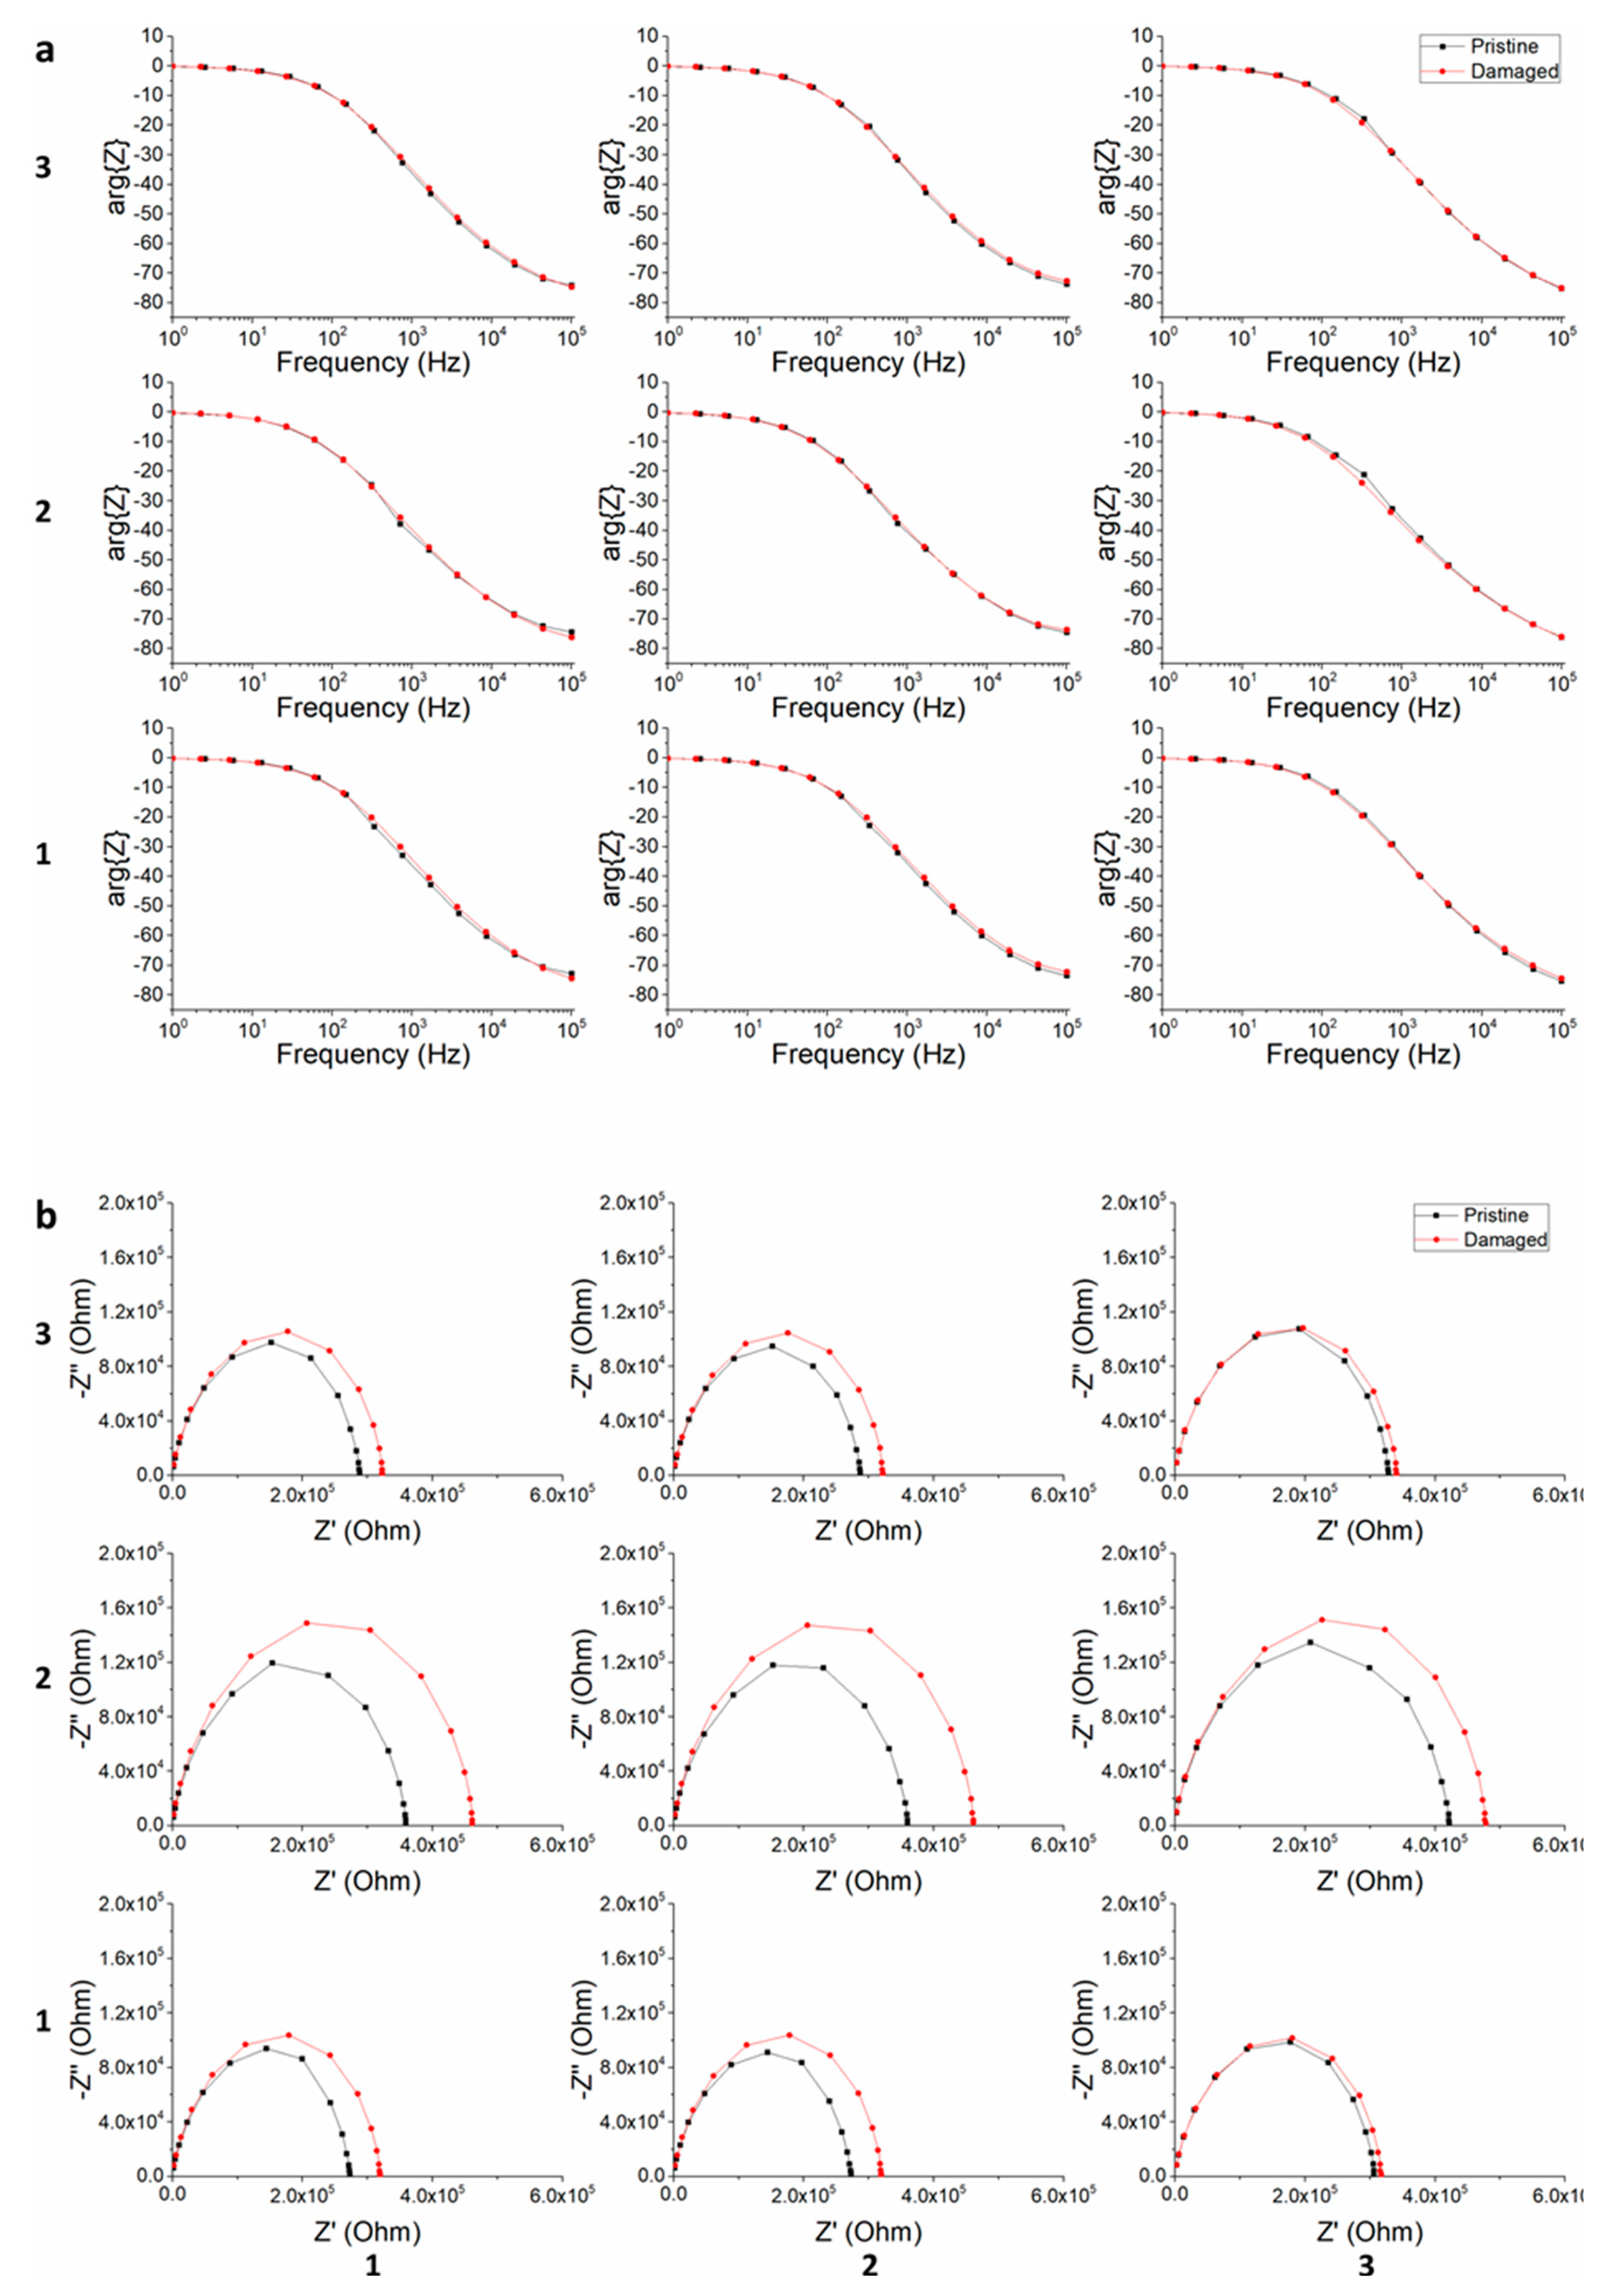
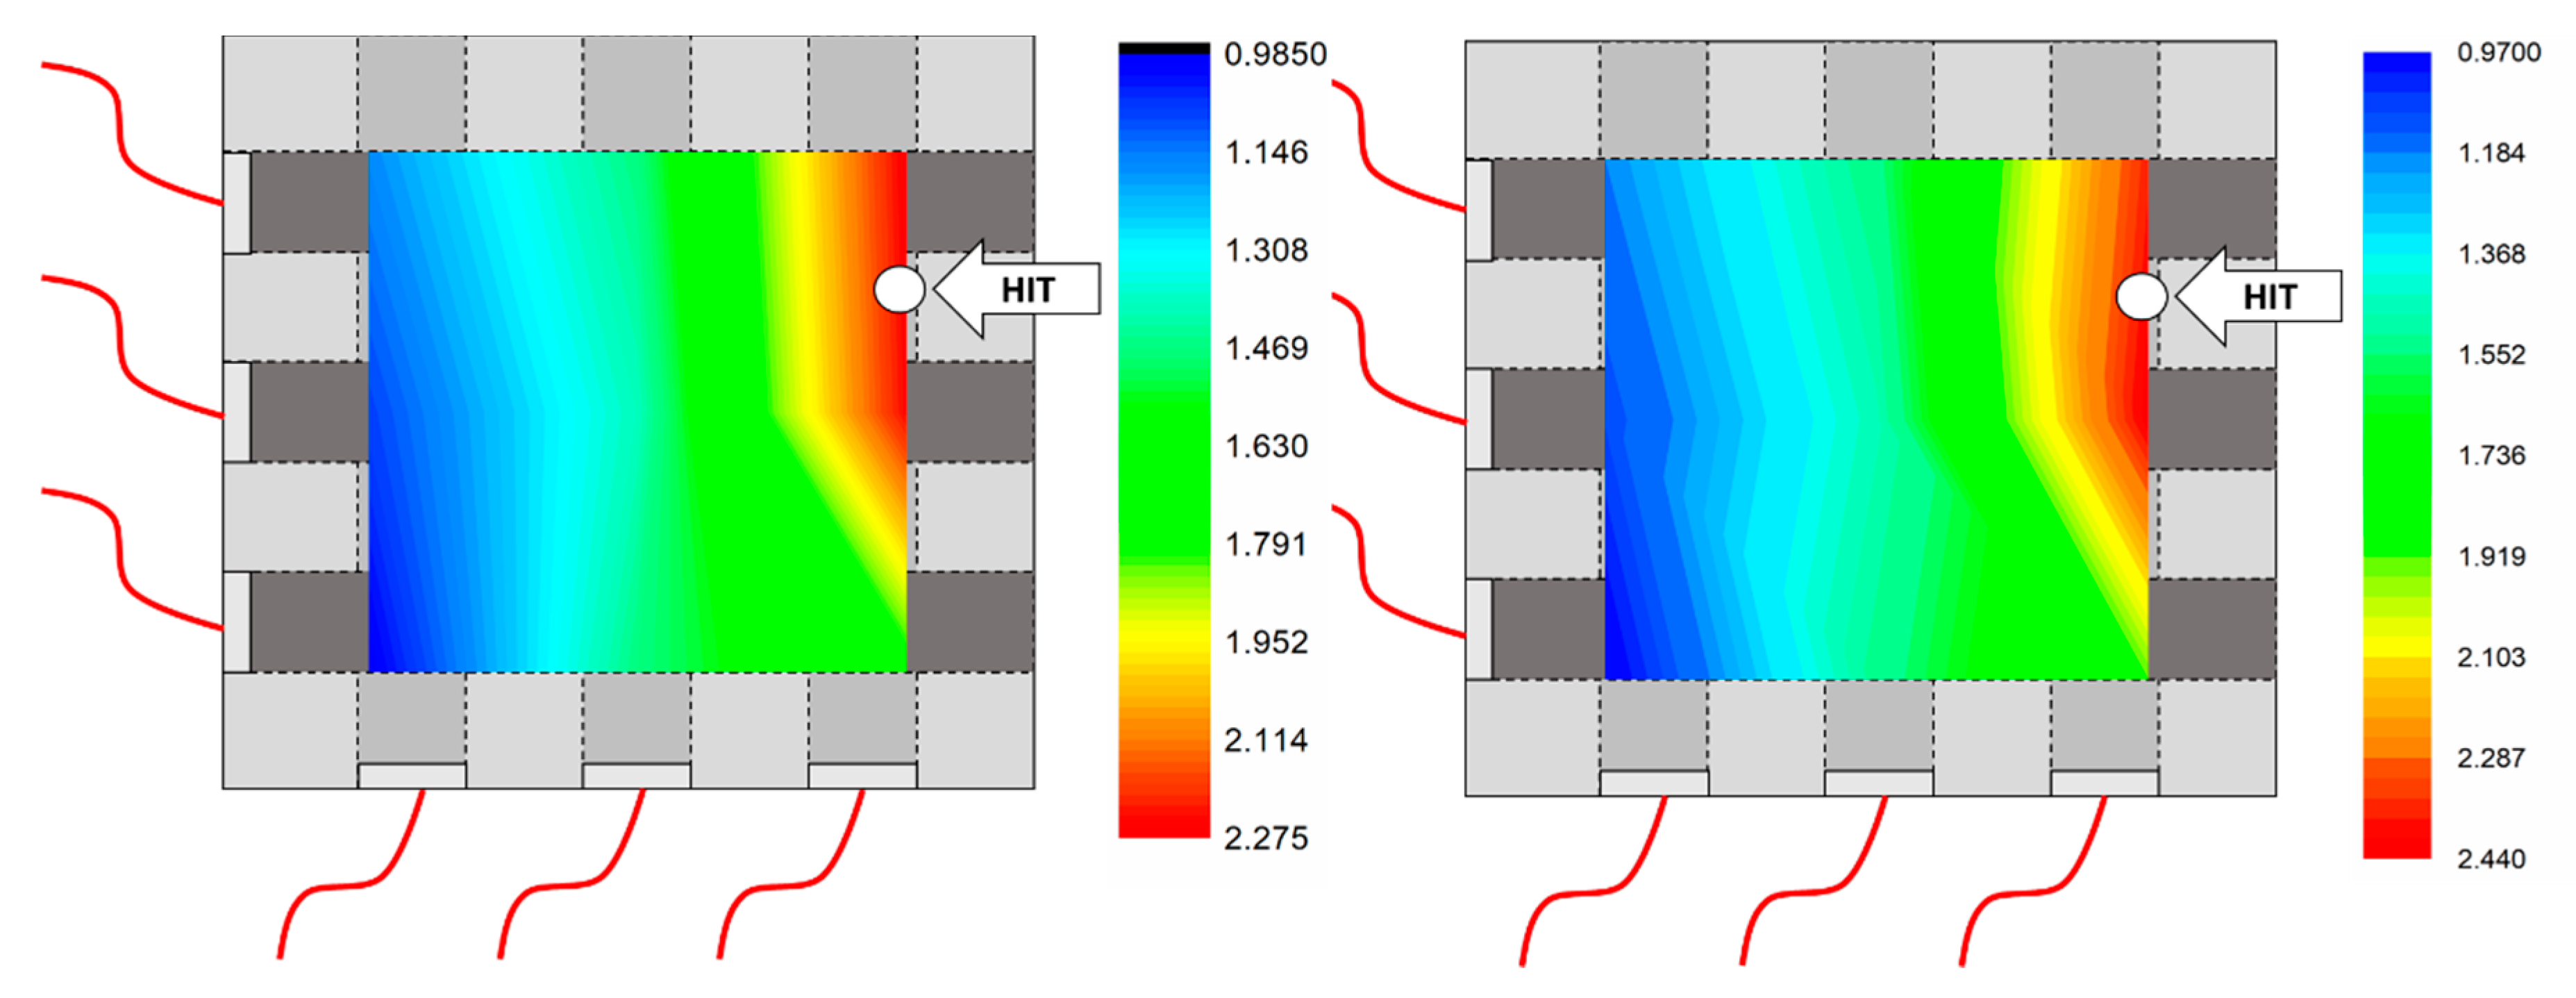
3.1. Impedance Analysis, 2D SHM Damage Localization

Figure 5 depicts the impedance plots of the smart composite for all monitoring sites. Initially, impedance scans were applied to the pristine specimens as a reference, i.e., before the impact test (Figure 5, black curves). The IS scans after high-velocity impact revealed an extensive increase of the magnitude of the impedance at low frequencies for the spectra near the impact spot, that occurred between the areas with coordinates (3,2) and (3,3) (Figure 5, red curves). At low frequencies, the material presented an ohmic behaviour, and therefore the values of the magnitude of the impedance were equal to DC resistance values. This increase can be attributed to the disruption of the MWCNTs/CB conductive network, due to the delaminations and the microcracks [18]. Remarkably, minor damage was identified to a more distant zone of the laminate, stating the high sensitivity of the system.
Figure 6 presents the phase delay of the impedance scans. At low frequencies the argZ fluctuates at zero degrees indicating the ohmic behaviour of the material, while a drop of the argZ occurred at about 1 kHz, denoting the existence of capacitance effects (non-ohmic behaviour). After the impact test, the transition frequency from ohmic to non-ohmic behaviour shifted to lower values, designating that the conductivity mechanisms need more time to adapt to the external field. This occurred due to the enhancement of the interfacial polarization effect. Interfacial polarization is a polarization mechanism that arises at the interface of two materials or regions with different dielectric properties due to an accumulation of charges. The introduction of air into the cracks and the microcracks after the damage increased the interfacial polarization effect, as the phase of air inducted between the corrupted MWCNT/CB network. The most significant changes were revealed on locus with coordinates (3,2) and (3,3) near the impact area, as these areas were mainly affected by the impact.
Figure 7 illustrates the imaginary (−Z”) versus the real (Z’) part of the impedance scans in Nyquist plots. The real part of the impedance represents the resistance behaviour of the material, therefore the imaginary part represents the reactance or the energy storage. In this specific case, the reactance of the system occurred due to capacitance, as the phase delay ranged from −90 to 0 degrees. The values of these plots were calculated from the experimental data according to Equations (4) and (5). After the impact test, the Z’ exhibited an increase caused by the disruption of the MWCNT/CB network, as stated above, while the -Z” also presented an increased due to the rise of the interfacial polarization. Nyquist plots showed the highest sensitivity for the damage identification, especially in the areas which were mostly affected by the damage. Both the real and the imaginary part values of the impedance were, in some cases, more than doubled in relation to the initial values in the loci with coordinates (3,2) and (3,3).

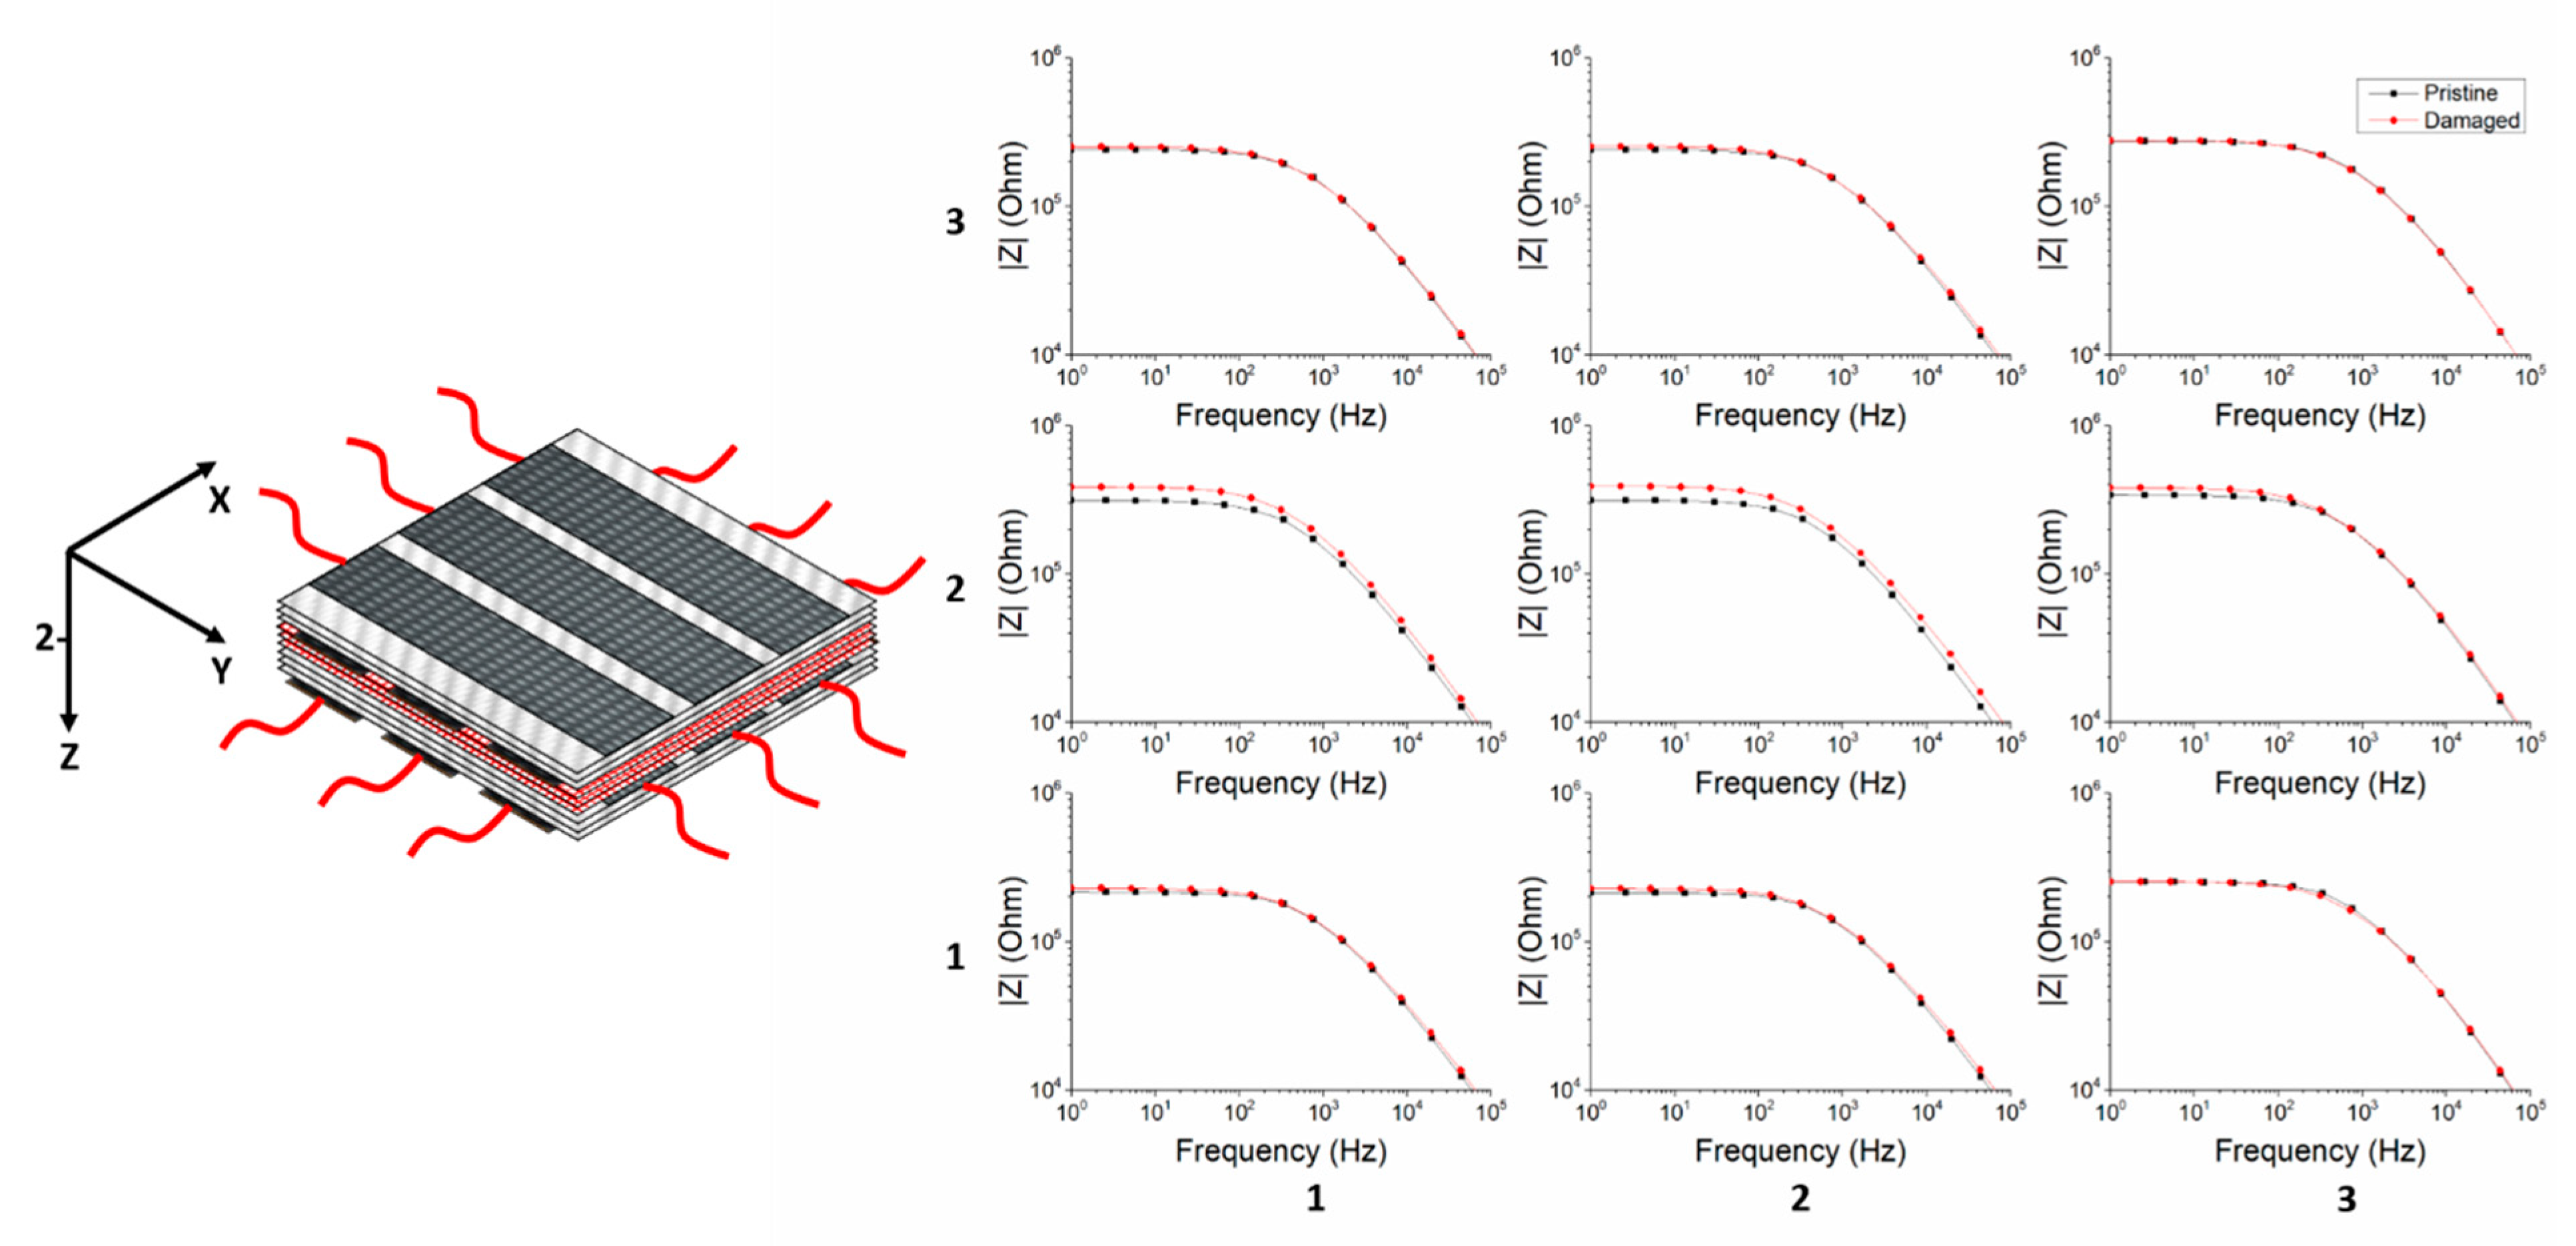
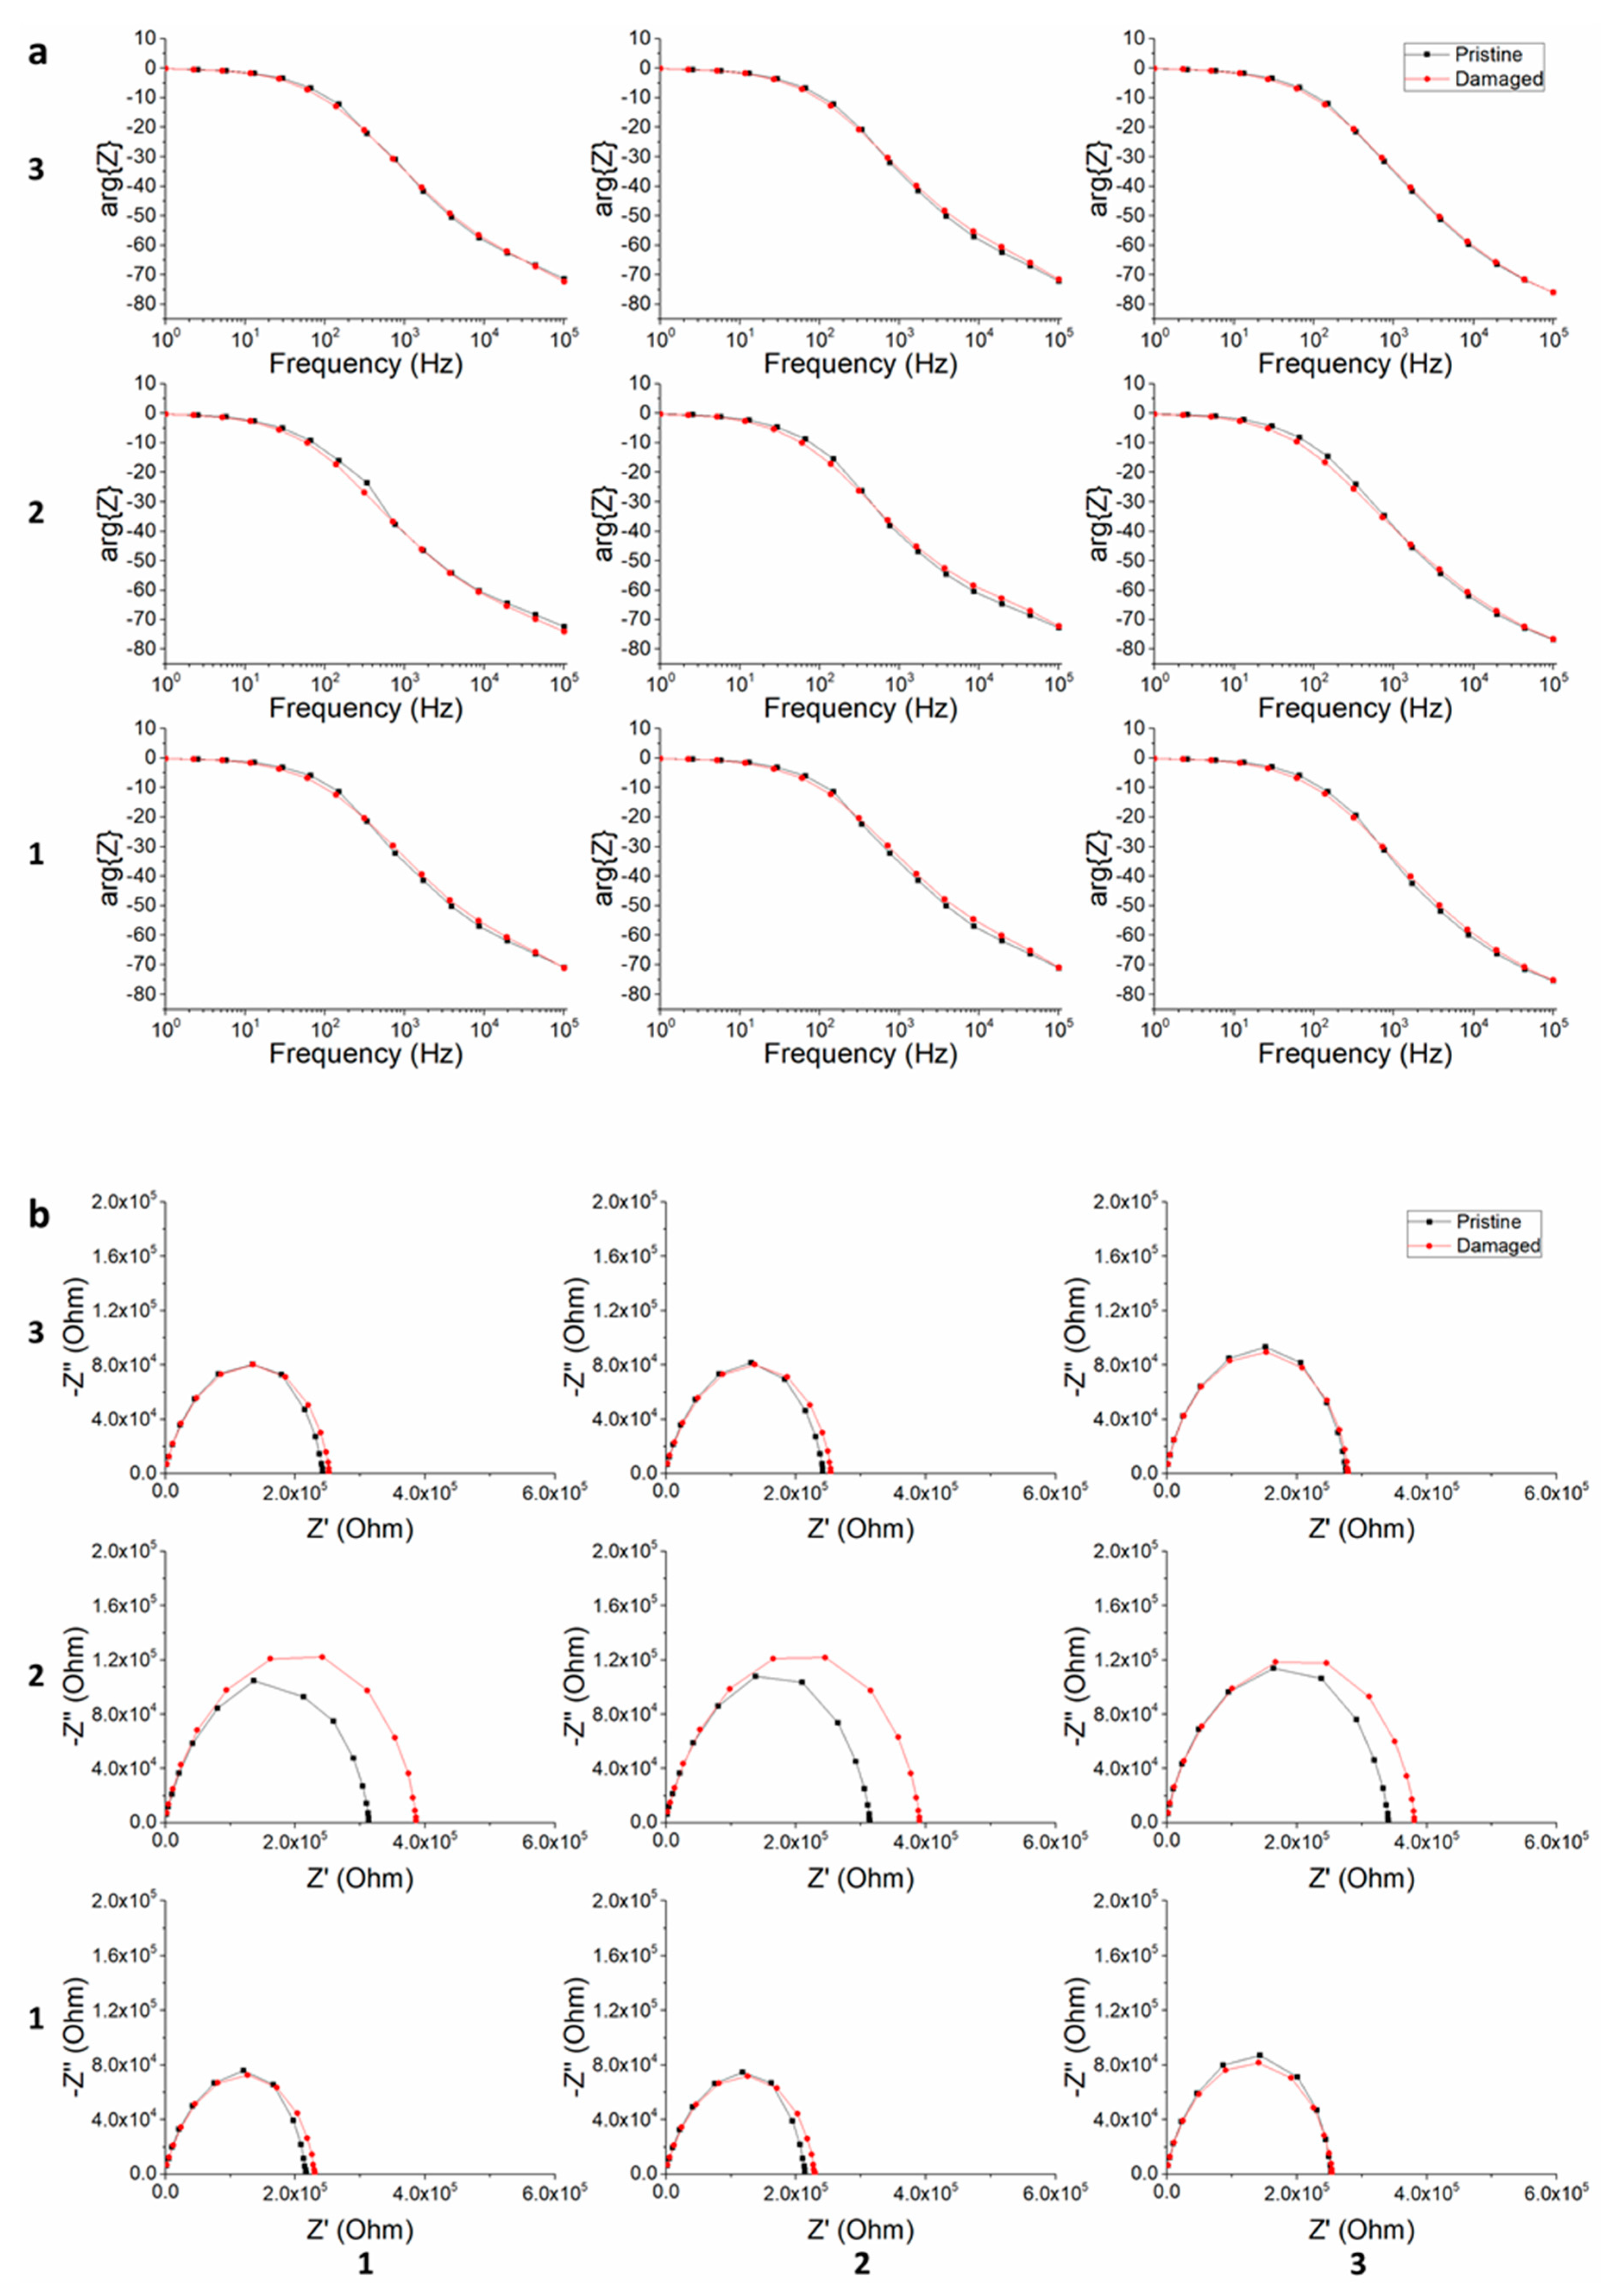
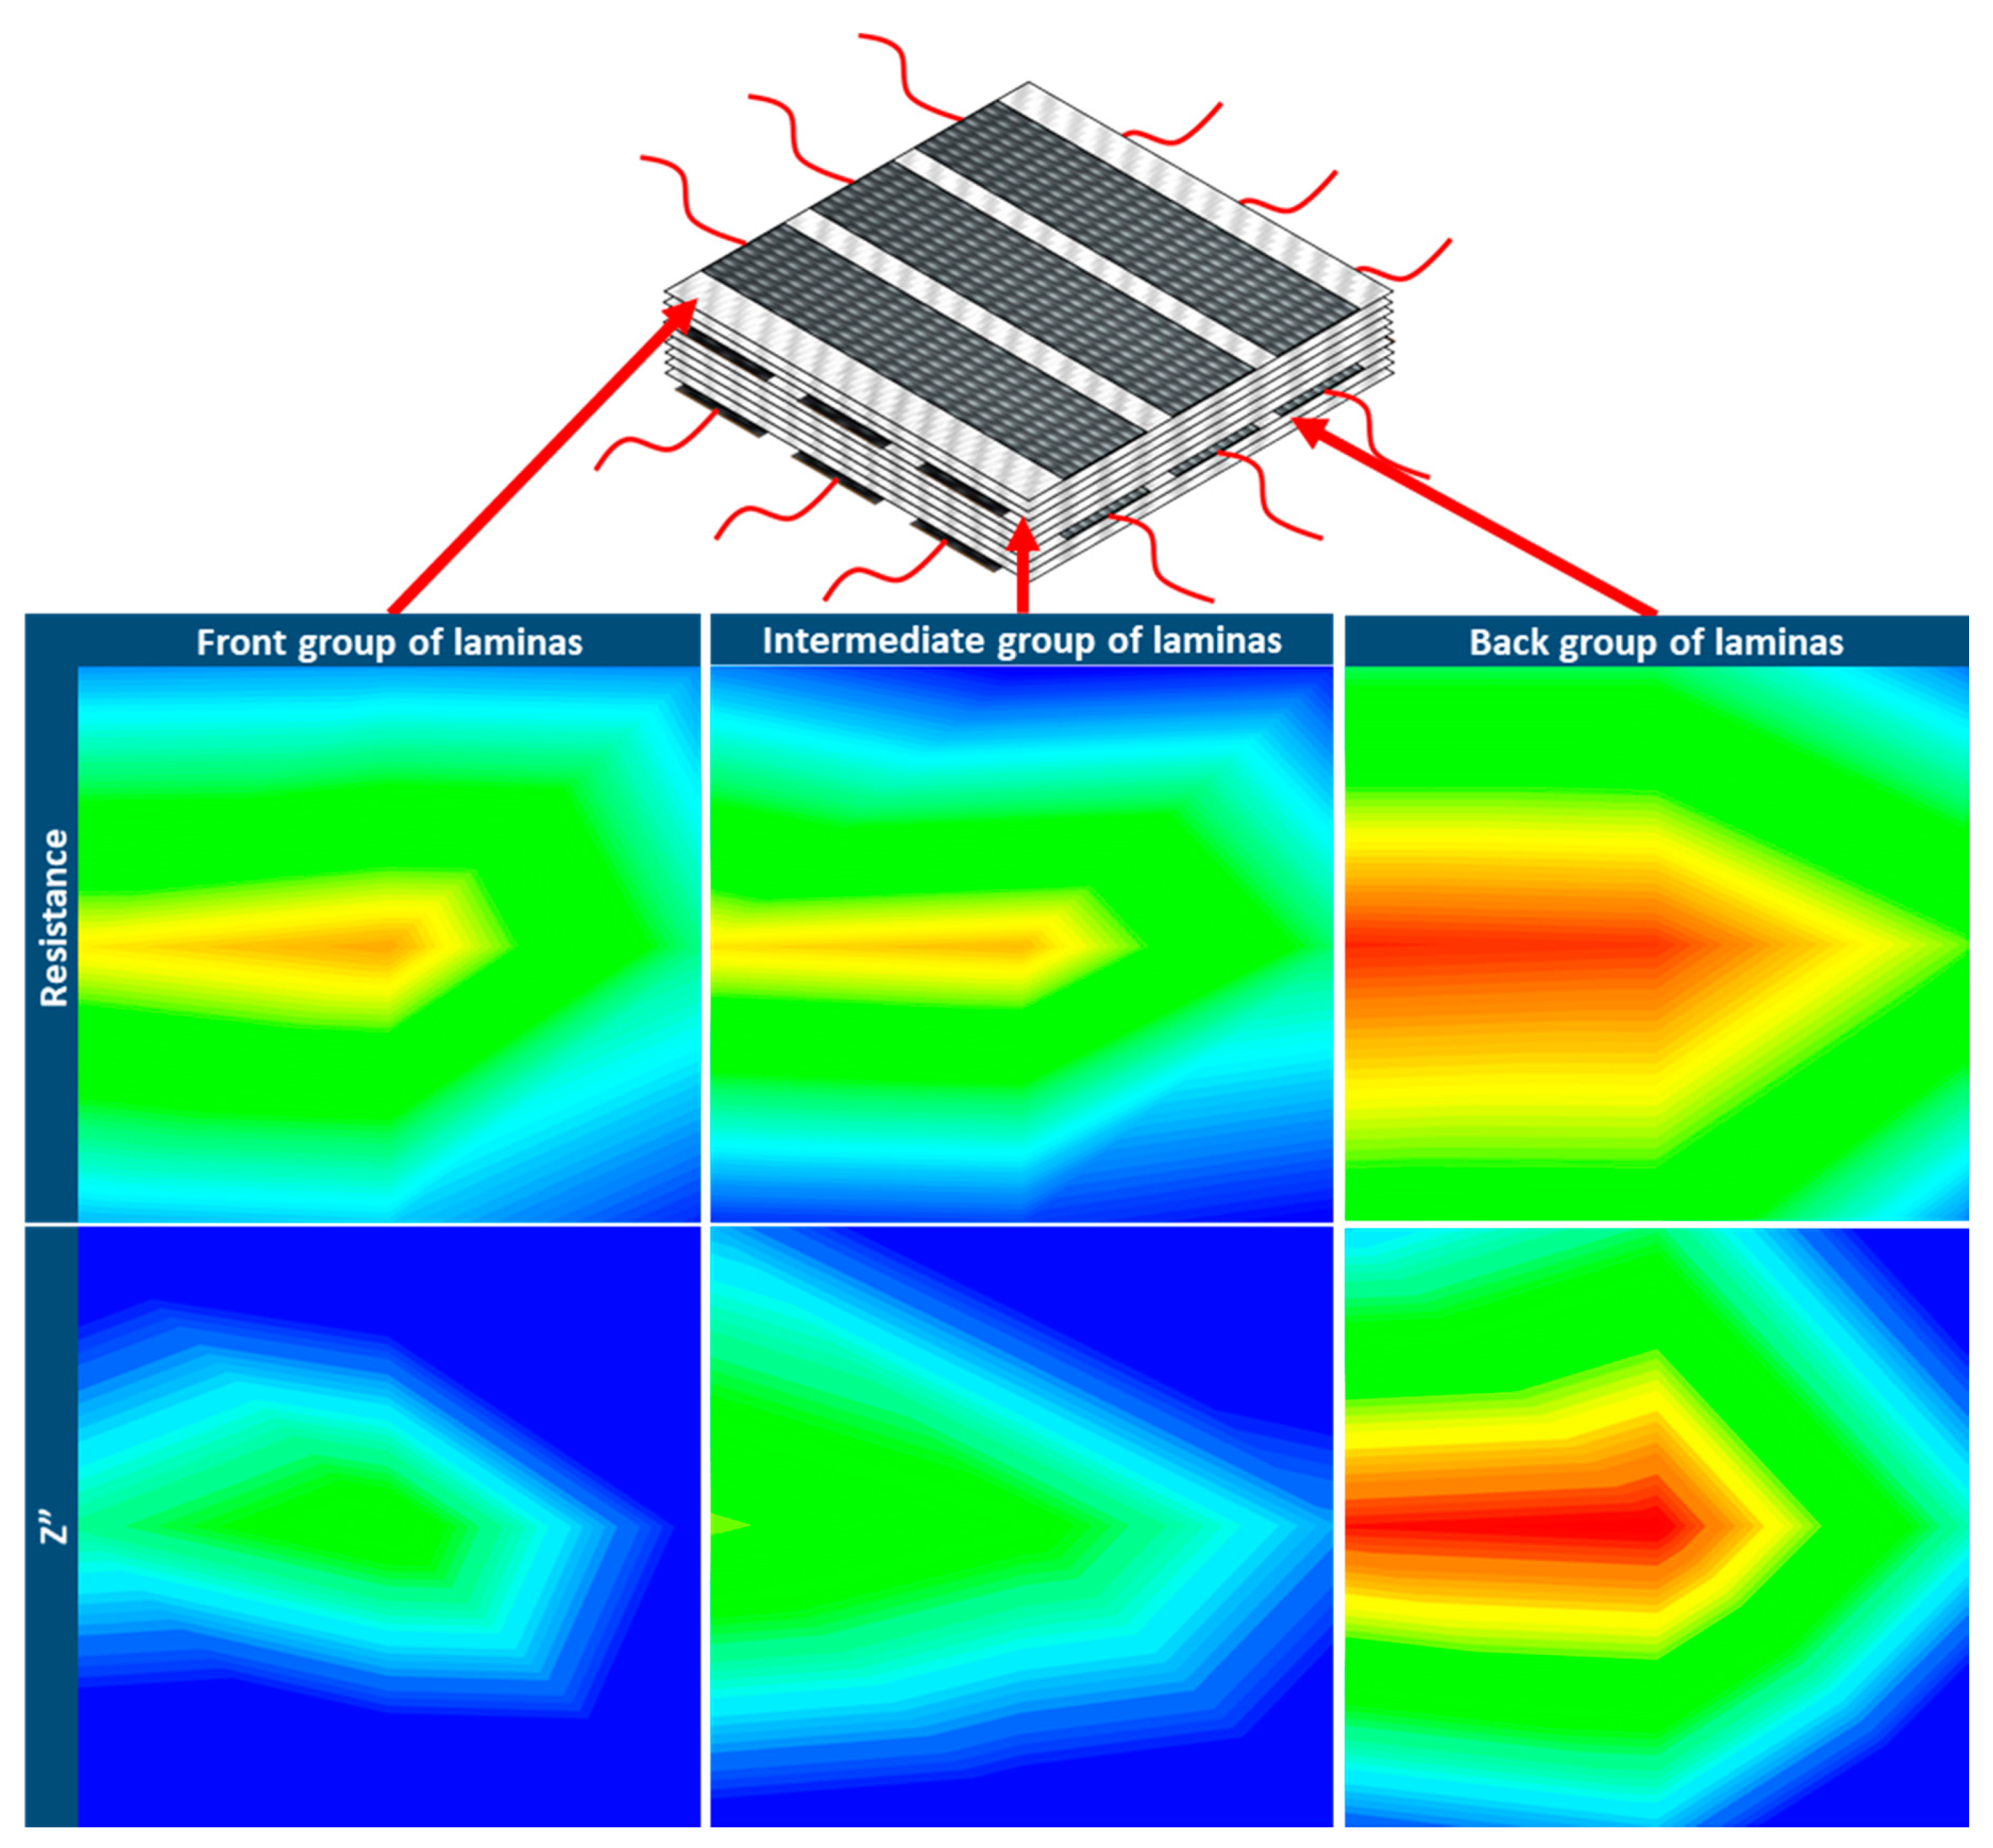
3.2. Impedance Analysis, 3D SHM Damage Localization

Damage mapping was also performed for the 3D composite. Reference IS scans were taken for each of the 27 loci at the junction points of the carbon fabric strips, at three different levels (Figure 8, Figure 9, Figure 10, Figure 11, Figure 12 and Figure 13, black curves). As aforementioned, the projectile impacted the centre of the laminate. The impedance magnitude Bode plots before (black curves), and after the damage (red curves) of the front side of the composite are presented in Figure 8. As can be observed, the impact affected the laminate between locations (1,2,1) and (2,2,1). A minor increase in the measure of the impedance was also detected at the locus (3,2,1). The rest of the area of the top three laminas of the composite remained intact, as shown by the Bode plots of the impedance magnitude.
Figure 9a illustrates the Bode plots of the phase delay of the front group of laminas. As can be observed, the changes in the phase delay after the impact test are almost negligible. As seen in Figure 9b in the relevant Nyquist diagrams, smaller changes were observed after the introduction of damage compared to the laminate with 2D SHM tomography illustrated in Section 3.1 Damage was more distinct only for locations (1,2,1) and (2,2,1). This probably occurred due to the thickness of the scanning area. Regarding the laminate with 2D SHM tomography, the scan took place through the entire thickness of the 8-ply laminate, in contrary to the laminate with 3D SHM tomography, in which every scanning level consisted of only three plies, resulting in a greater crack and microcrack accumulation. This damage accumulation was reflected in both real and imaginary parts of the impedance.
Figure 10 depicts the magnitude of the impedance versus frequency plots of the IS scans which were performed on plies 4–6. The projectile inflicted the same pattern of damage on the intermediate group of laminas as the laminas at the front side of the composite. IS measurements revealed that the area most damaged by the impact was in locations (1,2,2) and (2,2,2). Simultaneously, a slight increase in the magnitude of the impedance occurred in location (3,2,2), pinpointing less significant damage.
In Figure 11a the phase delay Bode plots before and after the impact test of the intermediate group of laminas are presented. As in the case of the plots of the front group, differences after the introduction of the damage were insignificant. According to the Nyquist plots (Figure 11b), the damage was indicated in the junction points of the carbon fibre strips with coordinates (1,2,2), (2,2,2) and (3,2,2). It should be noted that in the locus (3,2,2) damage is more manifested by the Nyquist plot, and not by the Bode plot of the impedance magnitude.
The rear side of the laminate is analysed in Figure 12, which illustrates the IS measurements for laminas 7–9 before and after the impact test. In this case, more extensive damage was detected than in the front and the intermediate group of laminas. The highest increase of the magnitude of the impedance can be observed in loci (1,2,3) and (2,2,3), which was the area where the most intense damage occurred. Extensive damage was also monitored by the IS measurements in areas with coordinates (1,1,3), (1,3,3), (2,1,3), (2,3,3) and (3,2,3) indicating that the back group of laminas was the most significantly affected part of the laminate.
The phase delay Bode plots revealed minor information about damage, as their changes due to the impact test were negligible (Figure 13a). On the contrary, Nyquist plots exhibited significant shifts in the impedance values in the affected areas after the introduction of the damage. In terms of sensitivity for damage identification, changes of the electrical properties in Nyquist plots were more distinct compared to Bode plots for the magnitude of the impedance (Figure 13b).

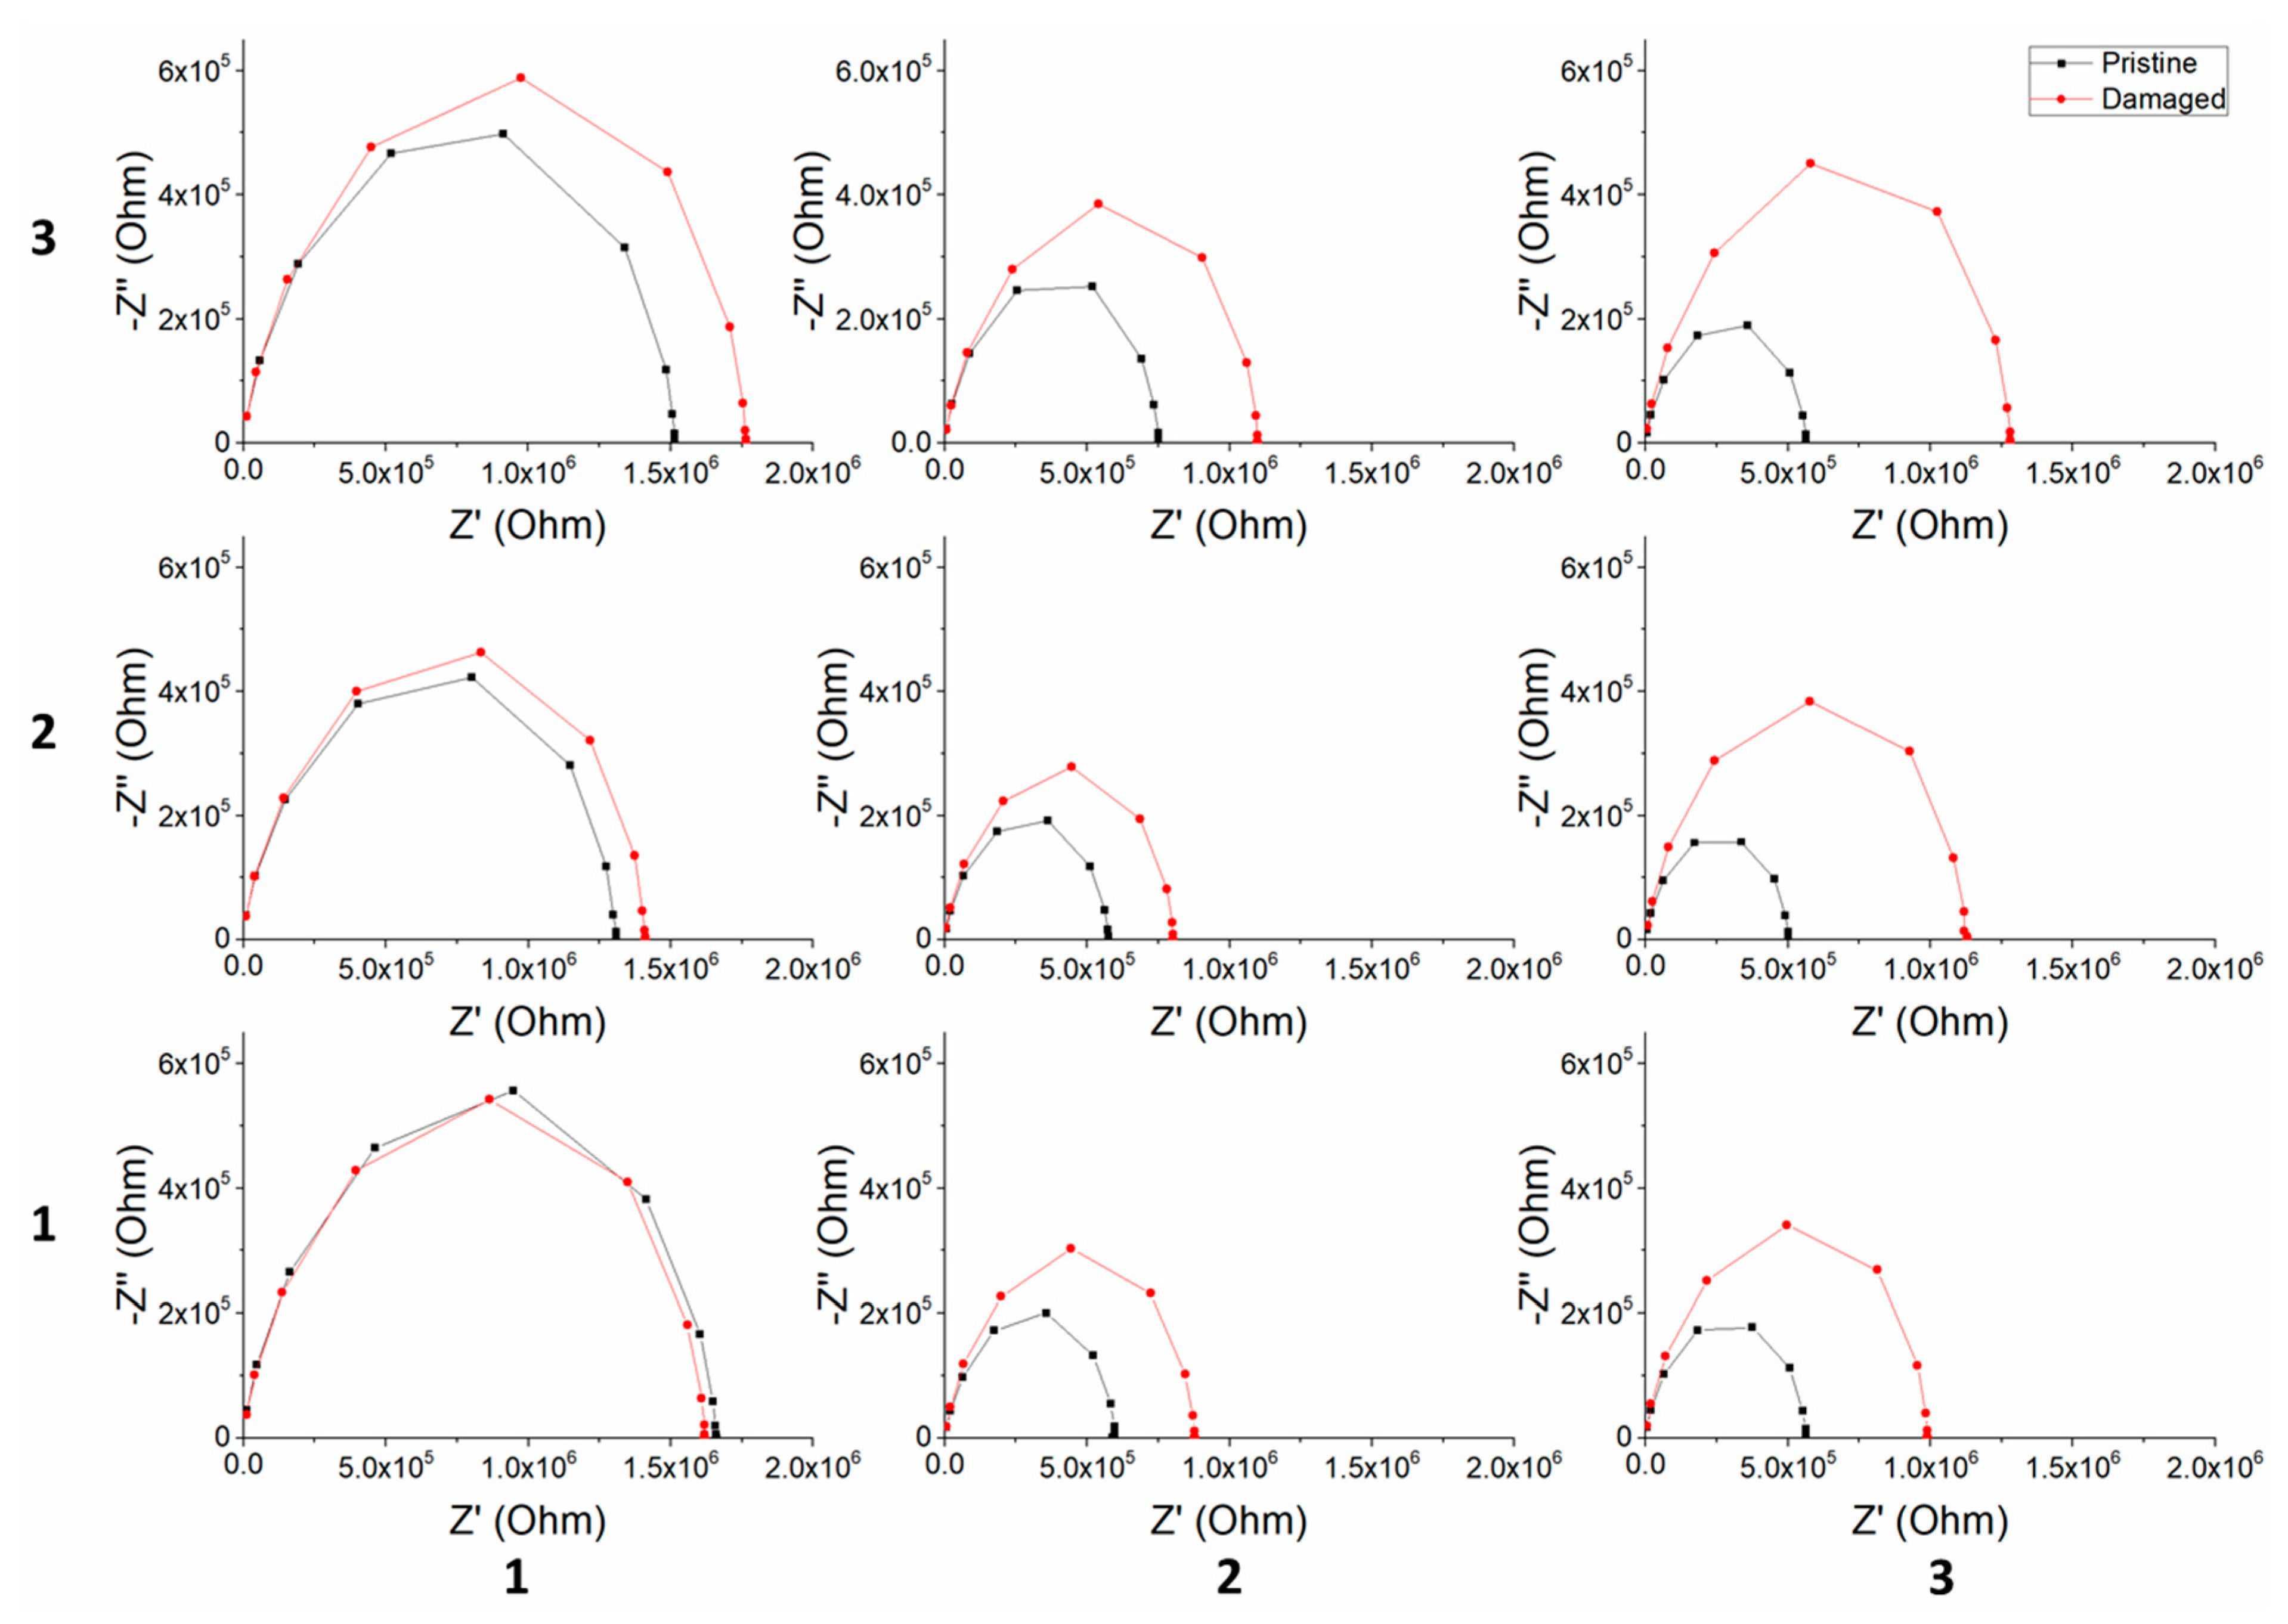
3.3. 2D and 3D Damage Localization by Utilising Equivalent Circuit

By employing impedance values, or the electrical properties of a material over a range of excitation frequencies, an equivalent circuit is used in order to simulate the behaviour of the specimen. The information obtained from the single semicircular shape of the curves of the Nyquist plots indicated that only a time constant element should be present in the equivalent circuit. As was explained above, this corresponds to a capacitor element.
For this reason, a typical circuit consisting of a resistance and a capacitor in parallel was selected. The impedance values were analysed using the Complex Nonlinear Least Squares Fitting Program (LEVM / LEVMW, Version 8.11, Copyright: James Ross Macdonald). The resistance values of the specimen after damage were normalized by the reference values, acquired during the reference scan before impact. The 2D contour topographical image of the smart composite is presented in Figure 14 (left), illustrating the extension of the damage in terms of defective area and degree of structural degradation. The 2D contour topographical image confirmed the results of the impedance plots in Figure 5, Figure 6 and Figure 7. As expected, the most affected area was near the impact point, in locations (3,2) and (3,3). Figure 14 (left) also illustrates the extent of the damage in more distant areas of the composite, leaving intact only the material between locations (1,1) and (1,2) (Figure 14 (left), deep blue colour). It should be noted that only the loci in the junction points of the carbon fibre strips were measured (experimental) values in the contour images.
The imaginary part of the impedance also provided valuable information about the damage identification on the laminates. The initial and after impact maximum values of the -–Z” were normalized and the results are presented in a 2D contour topographical image in Figure 14 (right). The values of Z” offered an identical pattern of the damage extension to the one of resistance values. Comparing the maximum reduced values, the Z” proved to be a slightly more sensitive element.
A similar procedure regarding the previous laminate was followed for the representation of the impact damage on the laminate with the 3D self-sensing capabilities. The impedance values of each group of laminas were analysed using an RC in a parallel equivalent electrical circuit. The normalized values of the resistance before and after damage were used to create the contour topographical damage depiction (Figure 15 (top)). As shown by the Bode and Nyquist plots, in Figure 15 (top), red colour indicates the highest damage level, caused by the impact. The impact affected the centre and the left side of the laminate on the front and the intermediate group of laminas. The blue colour area remained intact after the impact, as the relative resistance before and after impact was negligible. As far as the rear side of the laminate was concerned, the impact inflicted extensive damage. The most affected area was at the centre and the left side of the composite. As should be noted, damage, in this case, occurred on almost the entire back area of the laminates, being distinctly more severe near the impact site (as seen through the thickness of the laminate).
Exploiting the Z” values, a contour topographical damage depiction was created (Figure 15 (bottom)). The changes in the Z” were identical to resistance changes after the impact. Damage (delaminations and microcracks) caused an increase on both real and imaginary parts of the impedance by increasing the resistance and the interfacial polarization due to the disruption of the MWCNTs/CB conductive network and the induction of air inside the composite.

4. Conclusions

The purposely designed lamination of carbon and glass fabrics combined with a MWCNT and CB reinforced epoxy resin matrix imparted SHM topography functionality to a GRFP laminate. The formation of sensing elements at the through-thickness crossing points of carbon fibre strips proved to be sensitive to local damage and allowed for the 2D and 3D impact damage localization via impedance spectroscopy. Although it is well-known that the introduction of a phase with a different stiffness could affect mechanical properties, in this manuscript is reported a novel method of performing electrical NDE on composites by exploiting the properties of each component. In future work, the carbon fibres will be replaced with alternative conductive phases to eliminate this degradation and evaluate the knock-down effect in relation to conventional laminates.
The results of the impedance measurements were presented as (i) magnitude of the impedance Bode plots, (ii) phase delay Bode plots and (iii) Nyquist plots. The Nyquist plots exhibited the highest sensitivity for damage identification, while the phase delay Bode plots revealed the least distinct changes. Furthermore, a typical R-C in parallel circuit was applied in order to simulate the electrical behaviour of the smart composites. The results presented that the disruption of the MWCNTs/CB conductive network led to an increase of the real part of the impedance, while the induction of a new phase, trapped air, inside the laminate enhanced the interfacial polarization, which was reflected on the imaginary part of the impedance. The relative resistance change of the equivalent circuit and the Z” were employed to create qualitative 2D and multi-layer topographical damage plots that depicted the locus and the degree of the damage, demonstrating the sensitivity and the efficiency of the proposed methodology for the realisation of smart self-sensing composite laminates.

Author Contributions

Conceptualization, G.F. and A.S.P.; methodology, G.F.; analysis, G.F.; writing—original draft preparation, G.F.; writing—review and editing, A.S.P.; supervision, A.S.P. All authors have read and agreed to the published version of the manuscript.

Funding

This research received no external funding.

Institutional Review Board Statement

Not applicable.

Informed Consent Statement

Not applicable.

Data Availability Statement

Data available on request.

Conflicts of Interest

The authors declare no conflict of interest.

References

  1. Abrate, S. Impact on Laminated Composite Materials. Appl. Mech. Rev. 1991, 44, 155–190. [Google Scholar] [CrossRef]
  2. Naik, N.K.; Shrirao, P. Composite structures under ballistic impact. Compos. Struct. 2004, 66, 579–590. [Google Scholar]
  3. Safri, S.; Sultan, M.; Yidris, N.; Mustapha, F. Low Velocity and High Velocity Impact Test on Composite Materials—A review. Int. J. Eng. Sci 2014, 3, 50–60. [Google Scholar]
  4. Mouritz, A.P. Ballistic impact and explosive blast resistance of stitched composites. Compos. Part B Eng. 2001, 32, 431–439. [Google Scholar] [CrossRef]
  5. Gholizadeh, S. A review of non-destructive testing methods of composite materials. Procedia Struct. Integr. 2016, 1, 50–57. [Google Scholar] [CrossRef] [Green Version]
  6. Katunin, A.; Dragan, K.; Dziendzikowski, M. Damage identification in aircraft composite structures: A case study using various non-destructive testing techniques. Compos. Struct. 2015, 127, 1–9. [Google Scholar]
  7. Diamanti, K.; Soutis, C. Structural health monitoring techniques for aircraft composite structures. Prog. Aerosp. Sci. 2010, 46, 342–352. [Google Scholar] [CrossRef]
  8. Staszewski, W.J.; Mahzan, S.; Traynor, R. Health monitoring of aerospace composite structures—Active and passive approach. Compos. Sci. Technol. 2009, 69, 1678–1685. [Google Scholar] [CrossRef]
  9. Boller, C.; Chang, F.K.; Fujino, Y. Encyclopedia of Structural Health Monitoring; Jonh Wiley & Sons Ltd.: Hoboken, NJ, USA, 2009; p. 3. [Google Scholar] [CrossRef]
  10. Kostopoulos, V.; Vavouliotis, A.; Karapappas, P.; Tsotra, P.; Paipetis, A. Damage monitoring of carbon fiber reinforced laminates using resistance measurements. Improving sensitivity using carbon nanotube doped epoxy matrix system. J. Intell. Mater. Syst. Struct. 2009, 20, 1025–1034. [Google Scholar]
  11. Vavouliotis, A.; Paipetis, A.; Kostopoulos, V. On the fatigue life prediction of CFRP laminates using the Electrical Resistance Change method. Compos. Sci. Technol. 2011, 71, 630–642. [Google Scholar] [CrossRef] [Green Version]
  12. Aggelis, D.G.; Barkoula, N.M.; Matikas, T.E.; Paipetis, A.S. Acoustic structural health monitoring of composite materials: Damage identification and evaluation in cross ply laminates using acoustic emission and ultrasonics. Compos. Sci. Technol. 2012, 72, 1127–1133. [Google Scholar] [CrossRef]
  13. Grammatikos, S.A.; Kordatos, E.Z.; Matikas, T.E.; Paipetis, A.S. On the fatigue response of a bonded repaired aerospace composite using thermography. Compos. Struct. 2018, 188, 461–469. [Google Scholar] [CrossRef]
  14. Usamentiaga, R.; Venegas, P.; Guerediaga, J.; Vega, L.; López, I. Automatic detection of impact damage in carbon fiber composites using active thermography. Infrared Phys. Technol. 2013, 58, 36–46. [Google Scholar] [CrossRef]
  15. Frias, C.; Faria, H.; Frazão, O.; Vieira, P.; Marques, A.T. Manufacturing and testing composite overwrapped pressure vessels with embedded sensors. Mater. Des. 2010, 31, 4016–4022. [Google Scholar] [CrossRef] [Green Version]
  16. Bekas, D.G.; Sharif-Khodaei, Z.; Ferri Aliabadi, M.H. An innovative diagnostic film for structural health monitoring of metallic and composite structures. Sensors 2018, 18, 2084. [Google Scholar] [CrossRef] [Green Version]
  17. Bekas, D.G.; Sharif-Khodaei, Z.; Aliabadi, F.M.H. A smart multi-functional printed sensor for monitoring curing and damage of composite repair patch. Smart Mater. Struct. 2019, 28, 085029. [Google Scholar] [CrossRef]
  18. Bekas, D.G.; Paipetis, A.S. Damage monitoring in nanoenhanced composites using impedance spectroscopy. Compos. Sci. Technol. 2016, 134, 96–105. [Google Scholar] [CrossRef]
  19. Fazzino, P.D.; Reifsnider, K.L.; Majumdar, P. Impedance spectroscopy for progressive damage analysis in woven composites. Compos. Sci. Technol. 2014, 69, 2008–2014. [Google Scholar] [CrossRef]
  20. Raihan, R.; Adkins, J.M.; Baker, J.; Rabbi, F.; Reifsnider, K. Relationship of dielectric property change to composite material state degradation. Compos. Sci. Technol. 2014, 105, 160–165. [Google Scholar] [CrossRef] [Green Version]
  21. Hayes, S.A.; Swait, T.J.; Lafferty, A.D. Self-Sensing and Self-Healing in Composites; Elsevier Ltd.: Amsterdam, The Netherlands, 2015; ISBN 9781782422921. [Google Scholar]
  22. Todoroki, A.; Haruyama, D.; Mizutani, Y.; Suzuki, Y.; Yasuoka, T. Electrical Resistance Change of Carbon / Epoxy Composite Laminates under Cyclic Loading under Damage Initiation Limit. Open J. Compos. Mater. 2014, 4, 22–31. [Google Scholar] [CrossRef] [Green Version]
  23. Roh, H.D.; Lee, S.Y.; Jo, E.; Kim, H.; Ji, W.; Park, Y. Bin Deformation and interlaminar crack propagation sensing in carbon fiber composites using electrical resistance measurement. Compos. Struct. 2019, 216, 142–150. [Google Scholar] [CrossRef]
  24. Nonn, S.; Schagerl, M.; Zhao, Y.; Gschossmann, S.; Kralovec, C. Application of electrical impedance tomography to an anisotropic carbon fiber-reinforced polymer composite laminate for damage localization. Compos. Sci. Technol. 2018, 160, 231–236. [Google Scholar] [CrossRef]
  25. Grammatikos, S.A.; Kouli, M.; Gkikas, G.; Paipetis, A.S. Structural health monitoring of aerospace materials used in industry using electrical potential mapping methods. In Proceedings of the SPIE 8346, Smart Sensor Phenomena, Technology, Networks, and Systems Integration, San Diego, CA, USA, 26 April 2012; Volume 8346, pp. 1–7. [Google Scholar]
  26. Tzounis, L.; Zappalorto, M.; Panozzo, F.; Tsirka, K.; Maragoni, L.; Paipetis, A.S.; Quaresimin, M. Highly conductive ultra-sensitive SWCNT-coated glass fiber reinforcements for laminate composites structural health monitoring. Compos. Part B Eng. 2019, 169, 37–44. [Google Scholar] [CrossRef]
  27. Bekas, D.G.; Paipetis, A.S. Study of the Effect of Damage on the Electrical Impedance of Carbon Nanotube Reinforced Epoxy Nanocomposites. J. Sens. 2015, 2015, 805303. [Google Scholar] [CrossRef] [Green Version]
  28. Hernández-Pérez, A.; Avilés, F.; May-Pat, A.; Valadez-González, A.; Herrera-Franco, P.J.; Bartolo-Pérez, P. Effective properties of multiwalled carbon nanotube/epoxy composites using two different tubes. Compos. Sci. Technol. 2008, 68, 1422–1431. [Google Scholar] [CrossRef]
  29. Mittal, G.; Dhand, V.; Rhee, K.Y.; Park, S.J.; Lee, W.R. A review on carbon nanotubes and graphene as fillers in reinforced polymer nanocomposites. J. Ind. Eng. Chem. 2015, 21, 11–25. [Google Scholar] [CrossRef]
  30. Allaoui, A.; Bai, S.; Cheng, H.M.; Bai, J.B. Mechanical and electrical properties of a MWNT/epoxy composite. Compos. Sci. Technol. 2002, 62, 1993–1998. [Google Scholar]
  31. Burmistrov, I.; Gorshkov, N.; Ilinykh, I.; Muratov, D.; Kolesnikov, E.; Anshin, S.; Mazov, I.; Issi, J.P.; Kusnezov, D. Improvement of carbon black based polymer composite electrical conductivity with additions of MWCNT. Compos. Sci. Technol. 2016, 129, 79–85. [Google Scholar] [CrossRef]
  32. Foteinidis, G.; Tsirka, K.; Tzounis, L.; Baltzis, D.; Paipetis, A.S. The Role of Synergies of MWCNTs and Carbon Black in the Enhancement of the Electrical and Mechanical Response of Modified Epoxy Resins. Appl. Sci. 2019, 9, 3757. [Google Scholar] [CrossRef] [Green Version]
  33. Baltopoulos, A.; Polydorides, N.; Pambaguian, L.; Vavouliotis, A.; Kostopoulos, V. Exploiting carbon nanotube networks for damage assessment of fiber reinforced composites. Compos. Part B Eng. 2015, 76, 149–158. [Google Scholar] [CrossRef] [Green Version]
  34. Isaac-Medina, B.K.S.; Alonzo-García, A.; Avilés, F. Electrical self-sensing of impact damage in multiscale hierarchical composites with tailored location of carbon nanotube networks. Struct. Health Monit. 2019, 18, 806–818. [Google Scholar] [CrossRef]
  35. Stauffer, D.; Ammon, A. Introduction to Percolation Theory, 2nd ed.; Taylor and Francis: Abingdon, UK, 1994. [Google Scholar]
  36. Baltzis, D.; Bekas, D.G.; Tzachristas, G.; Parlamas, A.; Karabela, M.; Zafeiropoulos, N.E.; Paipetis, A.S. Multi-scaled carbon reinforcements in ternary epoxy composite materials: Dispersion and electrical impedance study. Compos. Sci. Technol. 2017, 153, 7–17. [Google Scholar] [CrossRef]
Figure 1. Smart composite layout for structural health monitoring (SHM) mapping topography (left) and coordinate system (right).
Applsci 11 01647 g001
Figure 2. Smart composite layout with 3D SHM mapping topography capability (left) and the definition of the 3D coordinate system with two examples, the marked red area was the sensing area with coordinates (1,3,1) and the marked blue area was the sensing area with coordinates (1,2,2) (right).
Applsci 11 01647 g002
Figure 3. In-house manufactured ballistic chamber.
Applsci 11 01647 g003
Figure 4. Impacted 2D (left) and 3D (right) laminate with SHM mapping topography.
Applsci 11 01647 g004
Figure 5. Impedance results for the 2D SHM mapping (Bode plots).
Applsci 11 01647 g005
Figure 6. Impedance results for the 2D SHM mapping-phase delay (Bode plots).
Applsci 11 01647 g006
Figure 7. Impedance results for SHM mapping (Nyquist plots).
Applsci 11 01647 g007
Figure 8. Impedance results for SHM mapping of the front group of laminas in the smart composite with 3D mapping capabilities (Bode plots).
Applsci 11 01647 g008
Figure 9. Impedance results for SHM mapping of the front group of laminas in the smart composite with 3D mapping capabilities. (a) Phase delay Bode plots and (b) Nyquist plots.
Applsci 11 01647 g009
Figure 10. Impedance results for SHM mapping of the intermediate group of laminas in the smart composite with 3D mapping capabilities (Bode plots).
Applsci 11 01647 g010
Figure 11. Impedance results for SHM mapping of the intermediate group of laminas in the smart composite with 3D mapping capabilities. (a)Phase delay Bode plots and (b) Nyquist plots.
Applsci 11 01647 g011
Figure 12. Impedance results for SHM mapping of the back group of laminas in the smart composite with 3D mapping capabilities (Bode plots).
Applsci 11 01647 g012
Figure 13. Impedance results for SHM mapping of the rear group of laminas in the smart composite with 3D mapping capabilities. (a) Phase delay Bode plots and (b) Nyquist plots.
Applsci 11 01647 g013
Figure 14. 2D contour topographical image of the composite using resistance values (left) and Z” values (right) after impact damage.
Applsci 11 01647 g014
Figure 15. 3D contour topographical damage depiction of the smart composite with 3D mapping capabilities at three levels using resistance values (top) and Z” values (bottom).
Applsci 11 01647 g015
Publisher’s Note: MDPI stays neutral with regard to jurisdictional claims in published maps and institutional affiliations.

