Article

Verification and Optimization of an Ultra-Low Volume (ULV) Sprayer Used for the Inactivation of Indoor Total Bacteria

1
Department of Health and Safety Convergence Science, Korea University, Anam-ro 145, Seongbuk-gu, Seoul 02841, Korea
2
BK21 FOUR R & E Center for Learning Health System, Korea University, Anam-ro 145, Seongbuk-gu, Seoul 02841, Korea
3
Institute of Health Sciences, Korea University, Anam-ro 145, Seongbuk-gu, Seoul 02841, Korea
4
Department of Health and Environmental Science, Korea University, Anam-ro 145, Seongbuk-gu, Seoul 02841, Korea
*
Author to whom correspondence should be addressed.
Appl. Sci. 2021, 11(8), 3713; https://doi.org/10.3390/app11083713
Submission received: 2 March 2021 / Revised: 17 April 2021 / Accepted: 18 April 2021 / Published: 20 April 2021
(This article belongs to the Section Environmental Sciences)

Abstract

:
Physical and chemical cleaning for the removal of indoor microorganisms, which can cause allergic reactions and respiratory diseases, is labor-intensive and time-consuming. An ultra-low volume (ULV) sprayer, a newly introduced device to inactivate pathogenic microorganisms, allows the disinfectant particles to reach hard-to-reach spaces indoors and is more cost-effective than the existing methods. However, few studies have been conducted to verify the efficiency of the ULV sprayer. Here, we verified the disinfection efficiency of the ULV sprayer for inactivating total bacteria present on indoor surfaces, considering the factors affecting bacteria inactivation, and presented the optimal ULV sprayer usage conditions to achieve the highest disinfection efficiency depending on room size. The total bacteria removal efficiency was high (range: 0.56–2.46 log10 reductions), including hard-to-reach spaces. A response surface model was developed to identify the individual and interactive effects of the disinfectant concentration, spray amount, and room size on total bacteria disinfection efficiency. These three variables had interactive effects on the total bacteria disinfection efficiency. The experimental data were fitted to a second-order polynomial model, with high coefficients of determination (R2) for all models (R2 > 0.82). The optimum conditions were a spray amount of 3.08–6.40 L in 160 m3, 3.78–7.22 L in 230 m3, and 5.68–8 L in 300 m3 surface area when using dilution rates of 100 times. These conditions predicted a bacterial disinfection efficiency of >1.10 log10 reductions (92%) on all surfaces. Our results clearly indicate that the ULV sprayer effectively inactivates total bacteria present on indoor surfaces.

1. Introduction

Nowadays, as people spend approximately 80–90% of their time in indoor environments, it is crucial to prevent infections caused by biological pollutants indoors [1]. Among the various biological pollutants (insects, bacteria, fungi, and mites), bacteria cause the most common infectious diseases as they are present in most indoor spaces, including multi-use facilities and houses, and cause various allergic reactions and respiratory diseases [2,3]. Several studies reported that typical indoor bacterial concentrations were approximately 102 to 106 colony forming units (CFU) m−3, which means the viable bacteria cells per cubic meter [4], and this concentration increased children’s risk of asthma, chronic inflammatory lung diseases, and even lung cancer [5,6]. Bacteria in such environments are transmitted primarily through airborne routes or contaminated environmental surfaces indoors [7]. Several disinfection methods have been developed to control this spread effectively [8,9,10]. Thus far, physical removal methods or chemical agents are used to control indoor microorganisms, including bacteria [10,11]. A typical physical removal method is to wipe the surfaces of the objects with a cloth or sponge soaked in chemical disinfectant. Cleaning (or the physical removal method) is considered the most effective method as it physically removes the source of infection. However, this method has disadvantages, e.g., the spreading of pollutants and organic matter (e.g., blood, secretions, and excretions), if the user does not use the appropriate disinfectants, such as hydrogen peroxide or alcohol. Additionally, physical cleaning requires one to completely empty the indoor space that is to be disinfected and remove all equipment and furniture so that the workers can thoroughly scrub all the surfaces. Therefore, this method is time- and labor-intensive.
Spraying disinfectants that can kill or inactivate microorganisms is a widely used cleaning method as an alternative to physical cleaning [12,13]. The ultra-low volume (ULV) sprayer (Figure 1), which is mainly used to kill pests in agricultural fields, is nowadays being used to disinfect quarantine areas in order to eliminate influenza viruses and other infectious microorganisms from such spaces [13,14,15]. The advantage of a ULV sprayer is that it produces aerosols of a small particle size of 0.1 to 50 μ m in the air, making it possible to reach spaces that are inaccessible to workers and reducing the spread of airborne infectious agents and dust particles in the air, by causing them to combine with the dispersed aerosol droplets and sinking them to the floor [15]. Most of all, this method is cost-effective because it can spray a small amount of disinfectant for a long time. A small disinfectant particle for single-use requires a much smaller amount than the disinfectant used for physical or chemical disinfection methods. In addition, the disinfectant used in the physical disinfection method cleans the surface once, while the disinfectant particles sprayed from the ULV spray disperse in the air for several minutes, continuously sticking to the surface to kill the microorganisms. However, there is a controversy over the disinfection efficiency of a ULV sprayer, because only a few studies have been conducted to verify the movement of the particles sprayed from a ULV sprayer indoors or confirm the mortality rate of microorganisms. Therefore, for efficient disinfection indoors, it is necessary to verify the disinfection efficiency of a ULV sprayer.
Meanwhile, microorganisms are affected by various conditions, including temperature and humidity, such as the disinfectant concentration, spray amount, and space size [16,17,18,19]. According to the World Health Organization (WHO), each disinfectant has an optimal concentration for use that ensures the maximum mortality rate of microorganisms [20]. Several disinfection guidelines recommended using the appropriate amounts depending on the space size as this can prevent the overuse of disinfectants and wastage of money and minimize the health damage caused by residual disinfectants [17,20]. Therefore, it is necessary to know the individual and interactive effects of these conditions on disinfection efficiency and identify the conditions indicating optimal disinfection efficiency, in order to prevent the adverse health effects resulting from the misuse/overuse of disinfectants and increase cost-effectiveness.
It is expected that the ULV sprayer will be more effective and useful in removing and inactivating total bacteria when used in conjunction with physical and chemical cleaning methods. In this study, we evaluated the disinfection efficiency of the ULV sprayer in terms of inactivating total bacteria in indoor spaces and analyzed this efficiency according to the disinfectant concentration, spray amount, and space size. Finally, depending on the size of the space to be disinfected, we presented the optimal ULV sprayer usage conditions to achieve the highest disinfection efficiency.

2. Materials and Methods

Two-stage experiments were performed to verify the efficiency of the ULV sprayer to eliminate total bacteria indoors by the different usage conditions (disinfectant concentration, spray amount, and room size), and to identify the optimum usage conditions for the ULV sprayer, which resulted in the highest disinfection efficiency in all spaces. Figure 2 shows the flow-chart of the experiments. The first step included two experiments, measuring the residence time of the sprayed aerosol and analyzing its disinfection efficiency with regard to total bacteria on indoor surfaces in three different-sized rooms. Based on the results of the first step, the second step was conducted using the response surface method, which is a widely used experimental design to optimize conditions for the inactivation of bacteria.

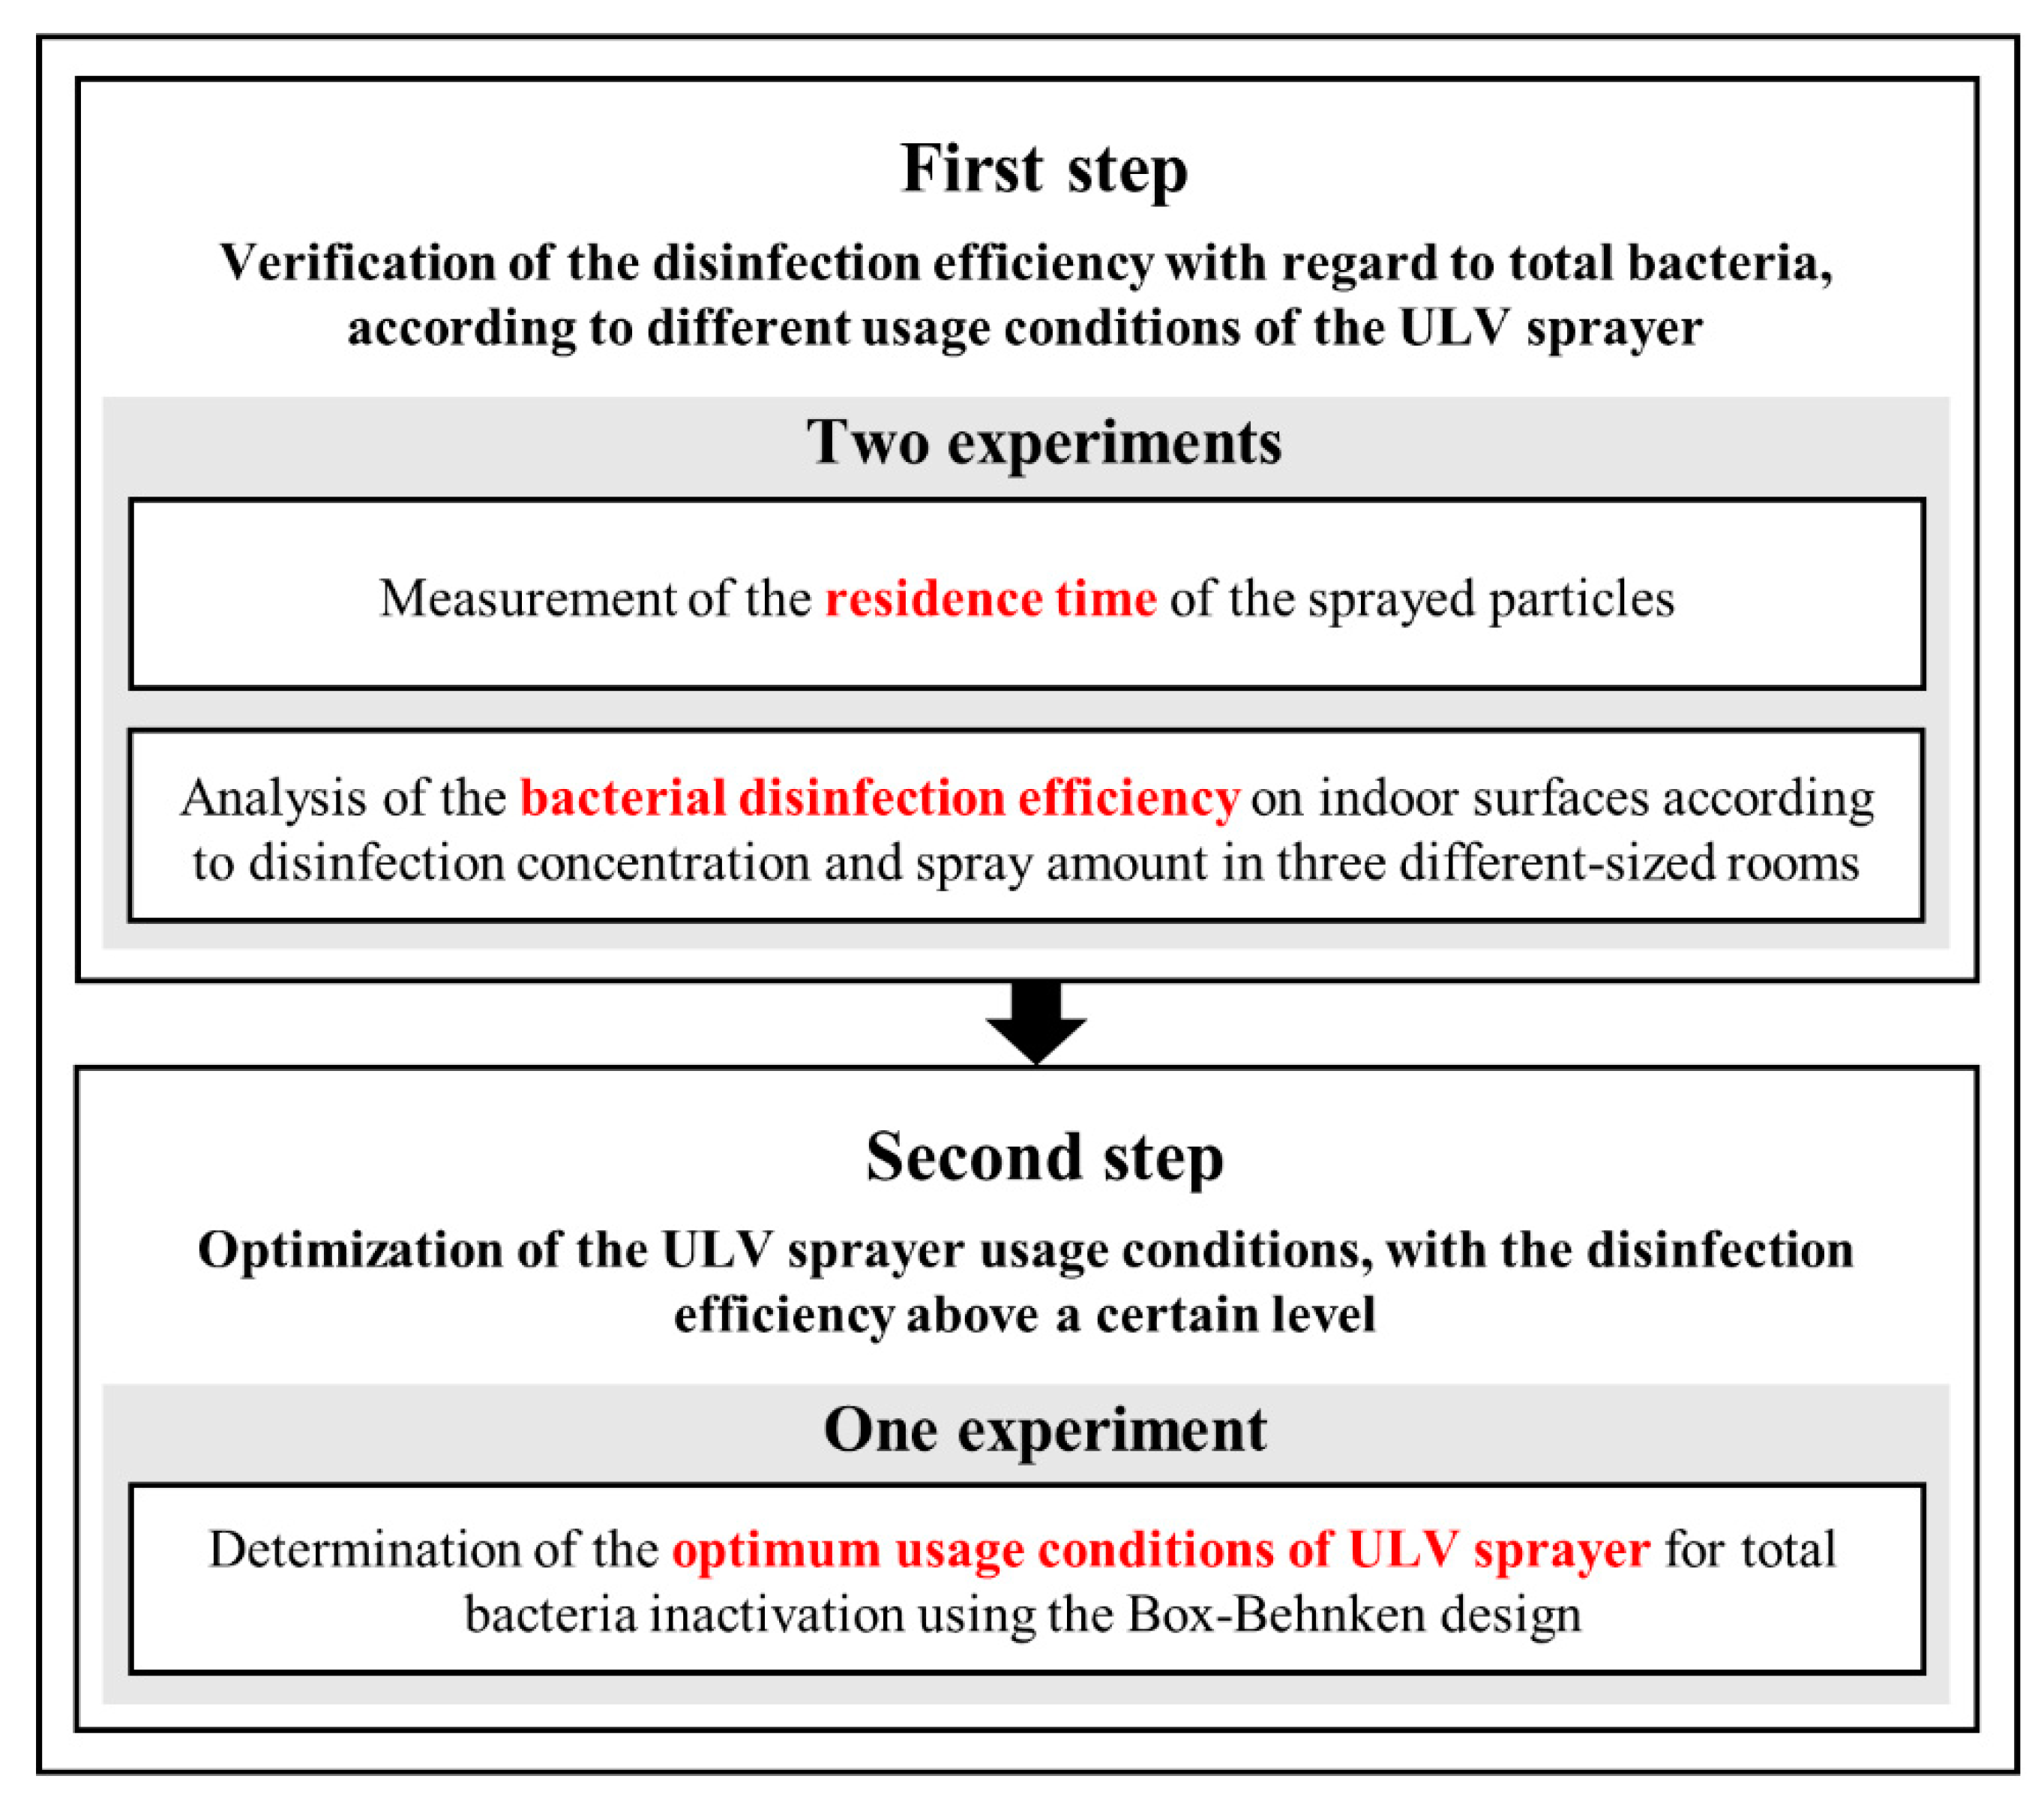
2.1. Target Microorganisms and Measurement of the Residence Time of Dispersed Aerosols

Bacteria exist in various forms on indoor surfaces and in the air, and hundreds of bacteria species inhabit the indoors, including Bacillus, Staphylococcus, and Clostridium [6]. We selected the total bacteria as target microorganisms to comprehensively review each microorganism.
We evaluated the ULV sprayer’s performance by identifying the number of the sprayed particles after dispensing the disinfectant aerosols. Moreover, we measured the aerosol residence time in the air to determine the time for which the disinfection effect was maintained. A portable aerosol spectrometer-1.108 (GRIMM Aerosol Technixk GmbH & Co., Ainring, Germany) was used for the analysis [21]. We defined here the residence time as the time taken for the concentration of sprayed particles to decrease to less than 15 cm−3 without further reductions.

2.2. Analysis of the Total Bacterial Disinfection Efficiency on Surfaces

2.2.1. Microbiological Culture and Biofilm Templates

We prepared microorganisms used for experiments. We obtained total bacteria from a classroom wall (10 × 10 cm2) by gently rubbing it with a sterile cotton swab (3M pipette swab, 3M, St. Paul, MN, USA) and stored it in saline solution (0.9% NaCl). Then, 1 mL of microbial suspension was inoculated onto a tryptic soy agar medium and incubated overnight at 37 °C in an incubator (WiseCubeTM Fuzzy Control System, DAIHAN Scientific, Wonju, Korea) [22,23]. Then, we inoculated the incubated bacteria into the sterilized trypticase soy broth (TSB) and incubated overnight at 37 °C. We followed the serial dilution method to obtain a moderate number of colonies. The inoculum concentration was enumerated and adjusted by the plate count method [24]. According to this method, the inoculum density was approximately 5–6 log10 CFU/mL.
We prepared hydrophobic polypropylene plastic film (5 × 5 cm2) which was pre-cleaned with 70% isopropyl alcohol to make experimental biofilm templates [25]. Each template was inoculated with TSB containing approximately 2–3 log10 CFU/plate of total bacteria and dried overnight on a clean bench.

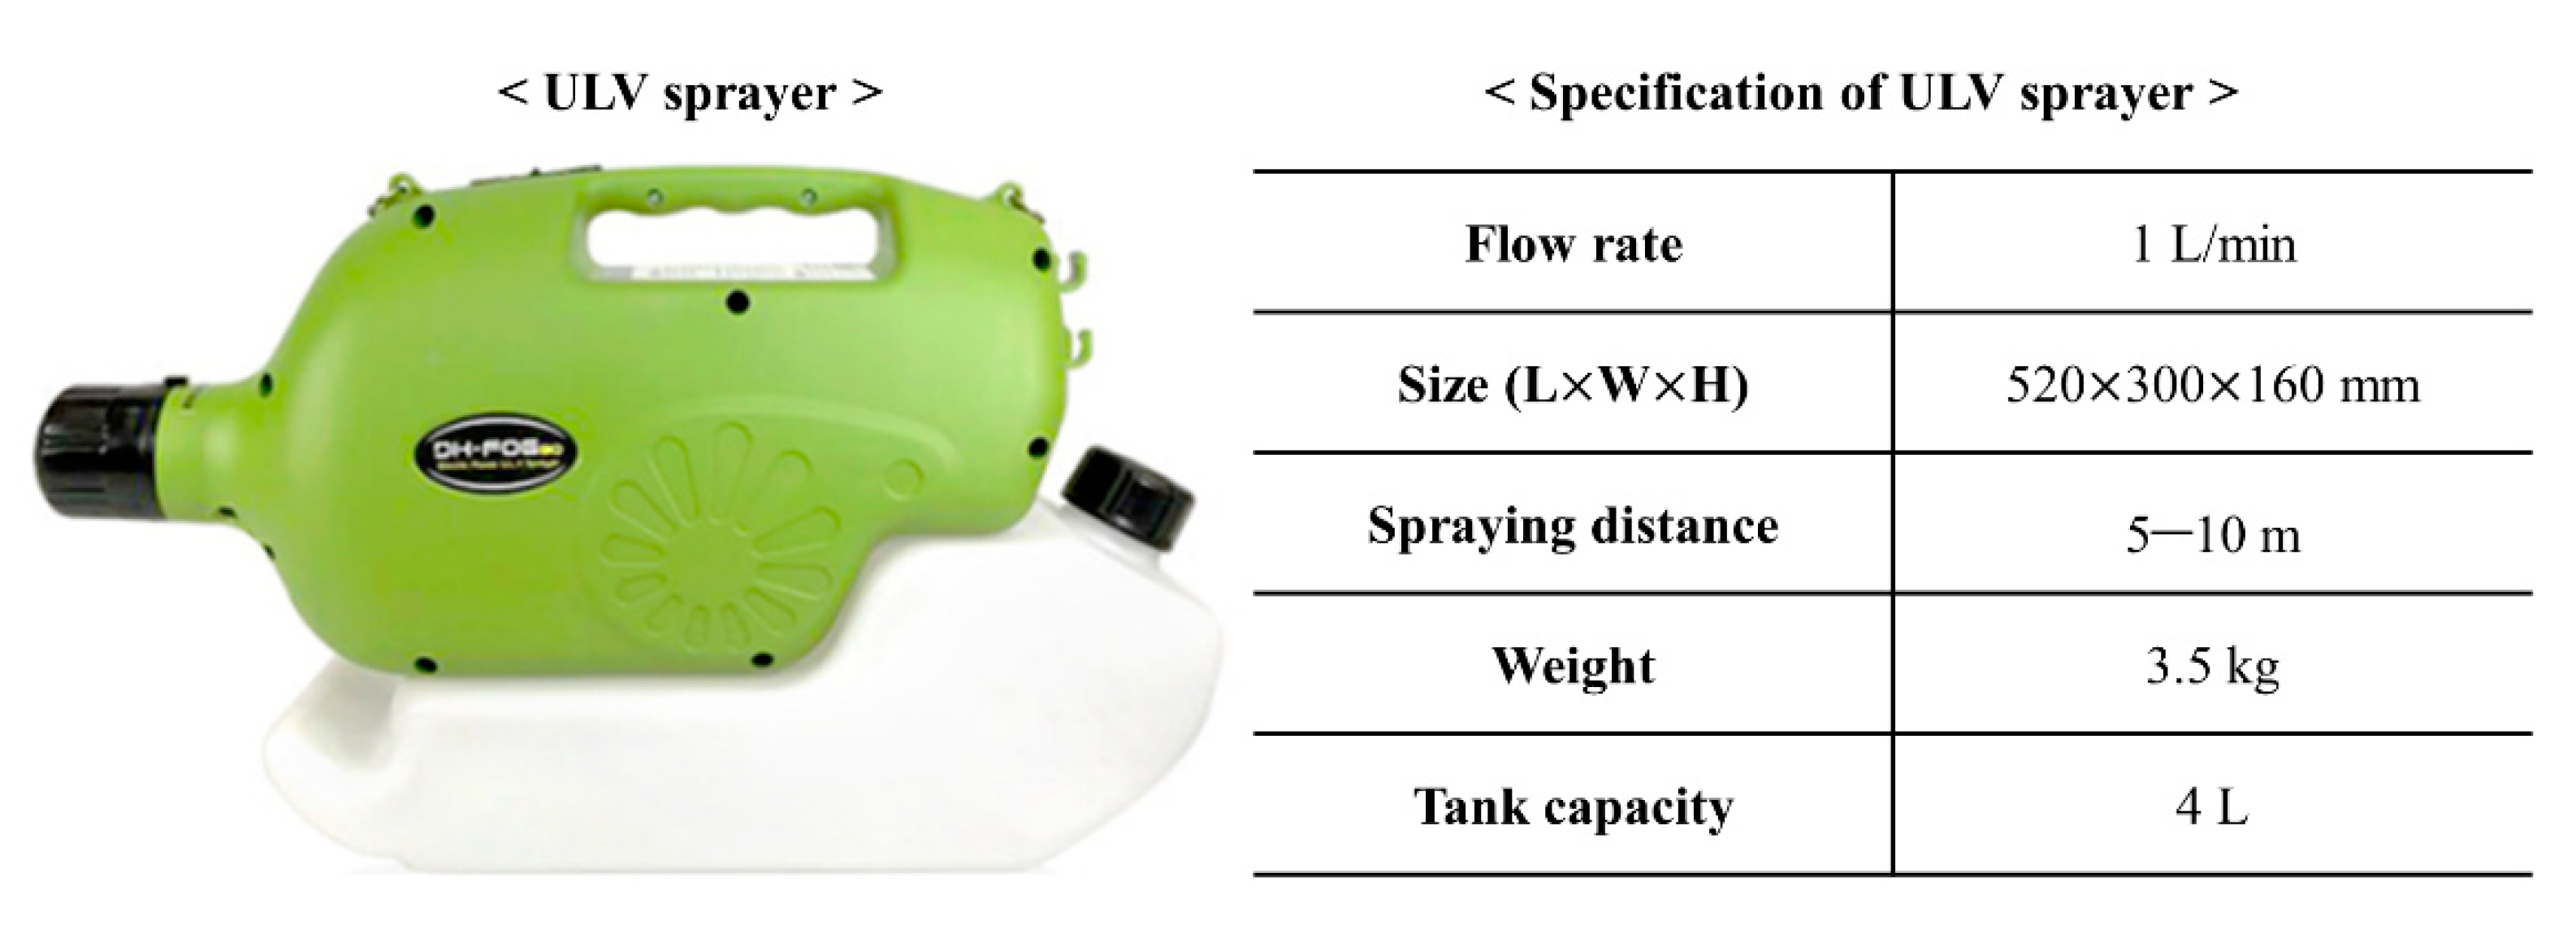
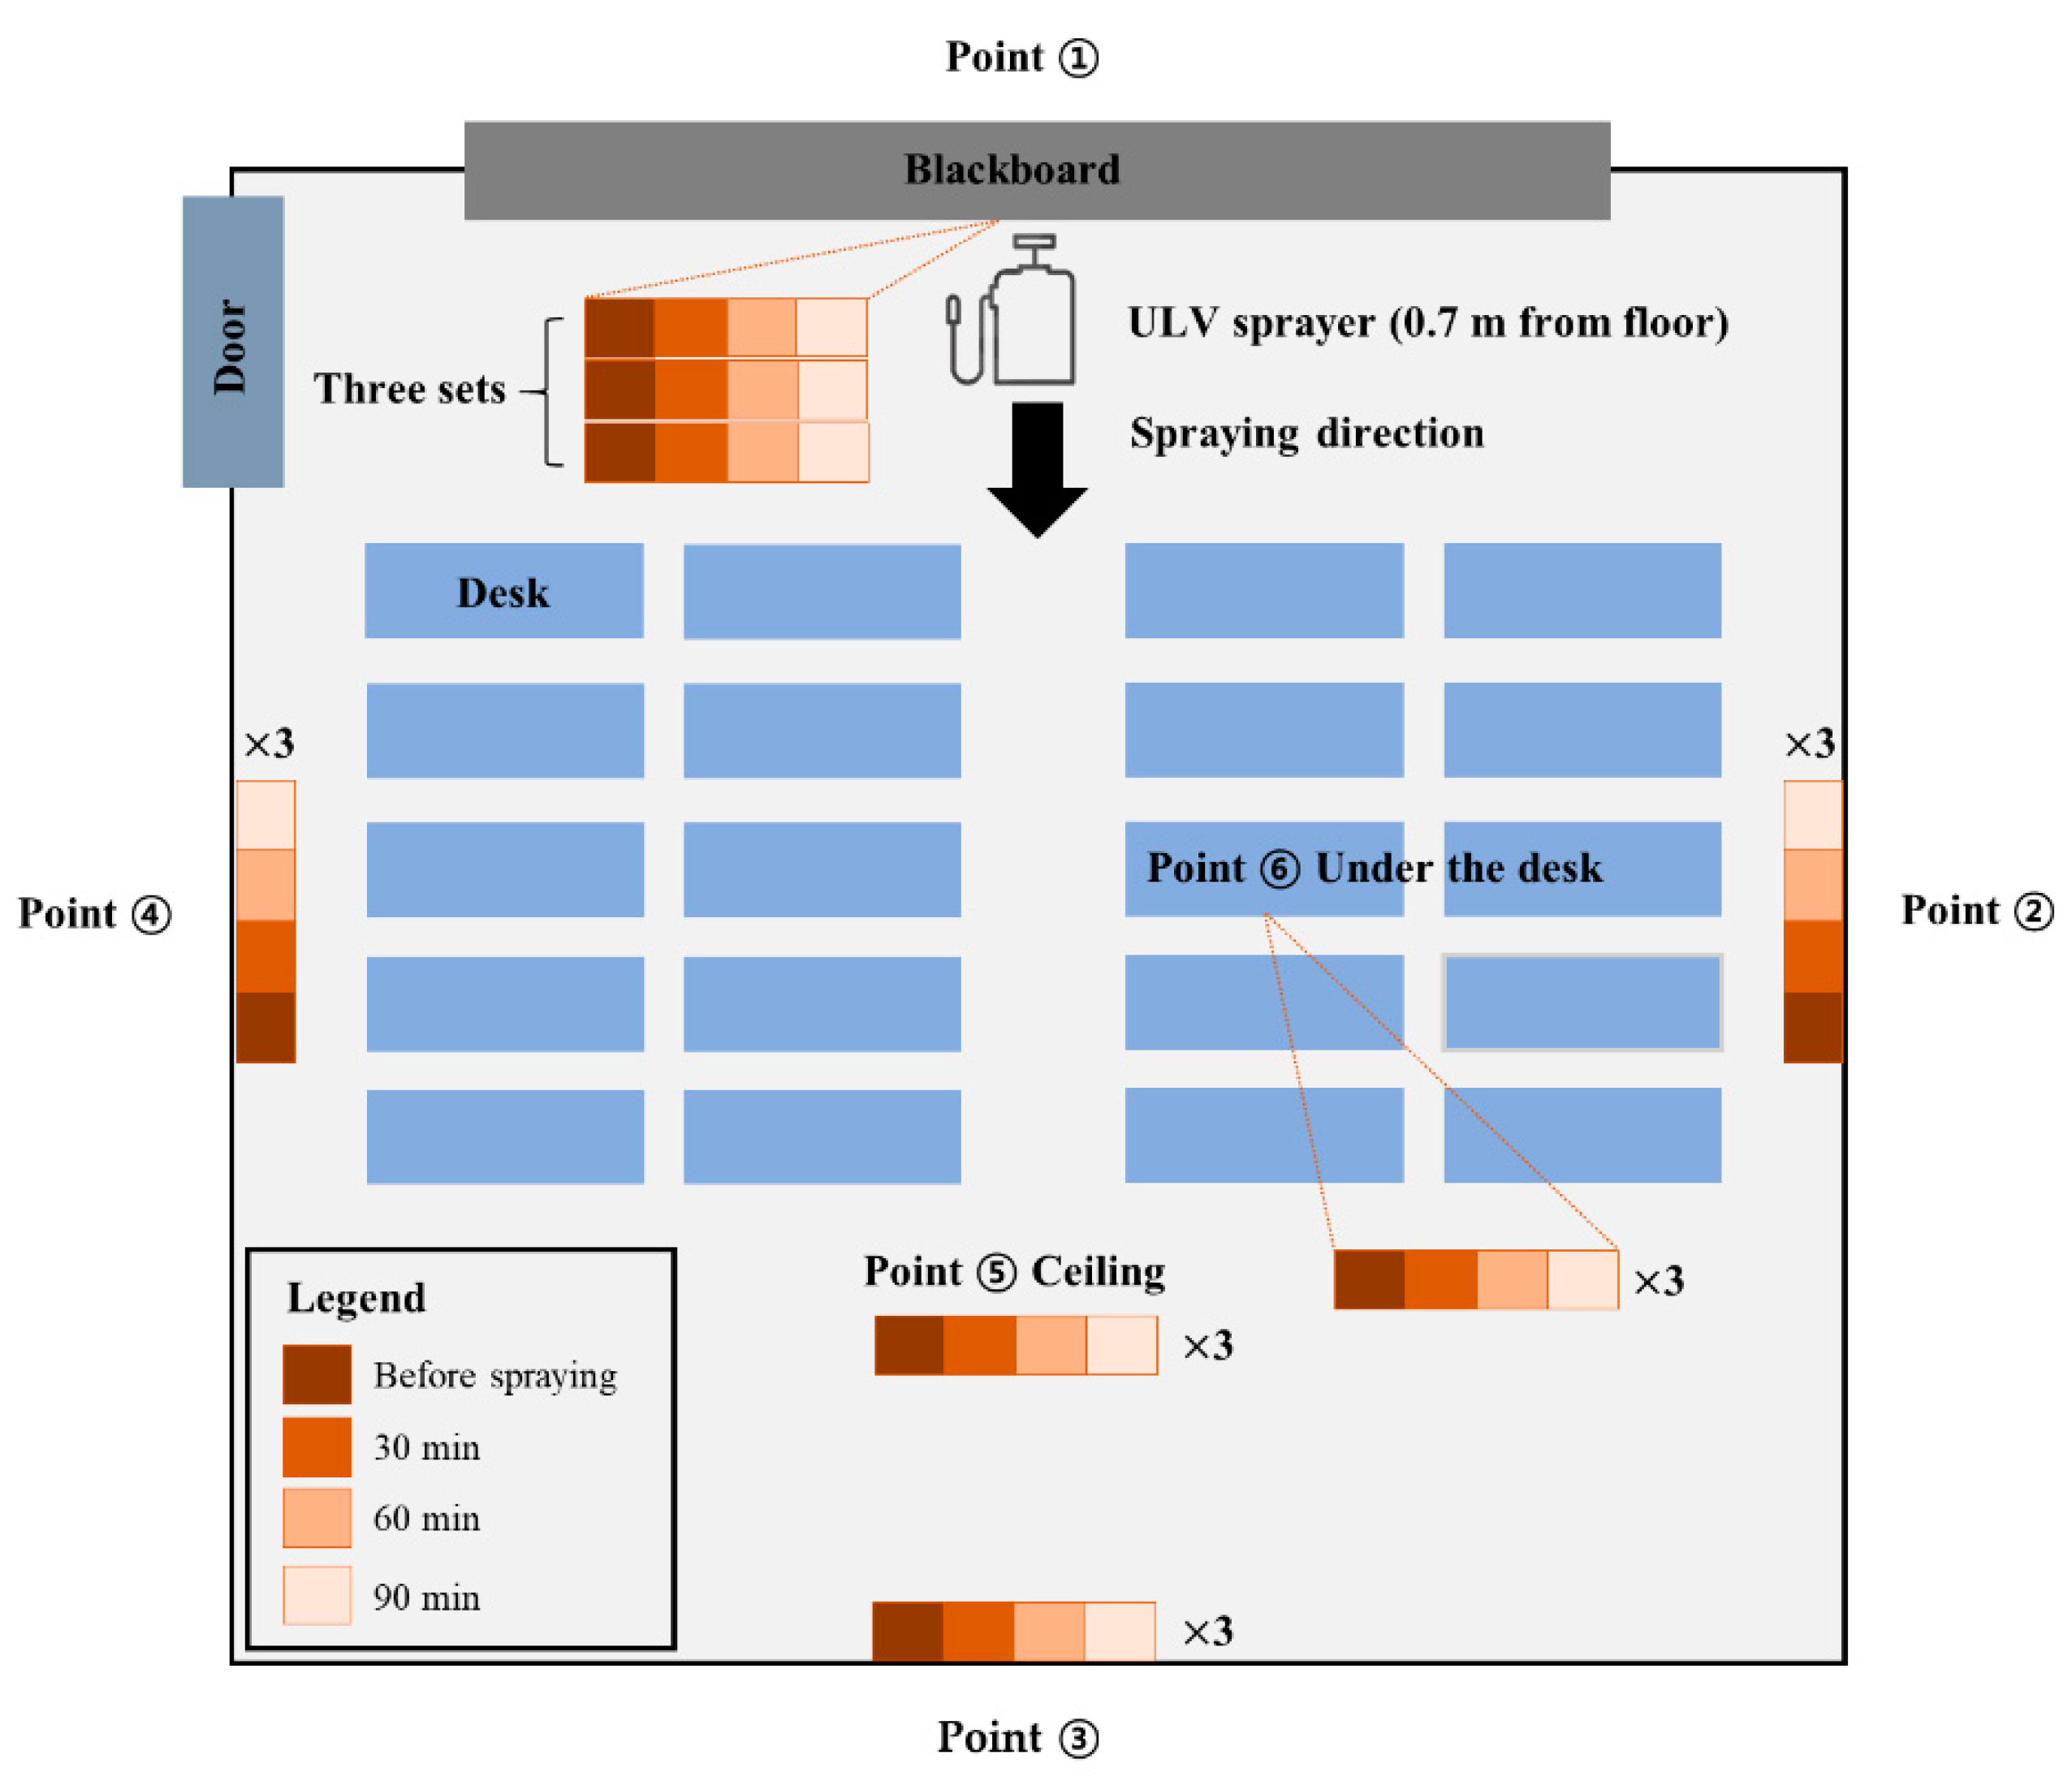
2.2.2. Disinfection Using the ULV Sprayer and Total Bacteria Sampling

We used a ULV sprayer (DH-FOG30, DAEHO GREEN, Gyeongnam, Korea) to conduct indoor disinfection. The flow rate of a sprayer was approximately 1 L/min and it had a spraying distance of 5–10 m horizontally. We used a Rely+OnTM VirkonTM Micro disinfectant (Rely+OnTM VirkonTM Micro, Antec International Limited, Sudbury, Suffolk, UK) containing peroxygen compounds [26]. All doors, windows, and ventilation outlets in the area to be sprayed were closed at the time of spraying.
Figure 3 shows the ULV sprayer’s location in the classroom and the attached points of biofilm templates that were used to identify the disinfection efficiency. Biofilm templates were composed of three replicates. The ULV sprayer was set up on the center front desk in each classroom. The spraying angle was approximately 5 degrees upwards. Based on preliminary experiments, we selected six locations (① blackboard side wall, ② left wall (based on the spray direction), ③ the wall in the direction of the spray, ④ right wall (based on the spray direction), ⑤ ceiling, and ⑥ under the desk) to check the bacterial disinfection efficiency.
We observed the disinfection efficiency for 30, 60, and 90 min after spraying the disinfectant. Bacteria that remained on the biofilms templates at the six points (①–⑥) were recovered using Rodac plates (Trypticase soy agar, B & S, Sanimall, Gyeonggi-do, Korea) [27]. Next, the Rodac plates were incubated overnight at 37 °C. Access to disinfectant-sprayed areas was restricted during and following the ULV spraying. Temperature and humidity were also measured using a thermometer data logger (HOBO MX temp/RH logger, Onset computer co., Bourne, MA, USA) [28]. The experiments were conducted from 28 August 2020 to 9 September 2020.

2.2.3. Determination of the Factors Affecting Bacterial Inactivation

Microorganisms exhibit various inactivation characteristics according to the disinfectant concentration, spray amount, and room size [16,17,18]. Therefore, we determined whether the change in these factors affected the disinfection efficiency of bacteria. To set the minimum and maximum levels of each factor on efficiency, we reviewed several studies and determined the ranges based on the recommended volume and actual-use concentrations. We set the values to be elements of an arithmetic sequence. Disinfectant concentration (dilution rate) was divided into 50, 100, and 200 times based on the recommended dilution rate of the disinfectant we used of 100 times. Spray amount was divided into 2, 5, and 8 L, based on the recommended usage volume of ULV sprayer per time of 5 L. The rooms were selected in order of size by measuring the room size in advance. They reflected the size of the location where quarantine was conducted at the actual site. Room sizes were 8400 mm (length) × 7500 mm (width) × 2500 mm (height) (approximately 160 m3), 10,800 mm (length) × 8400 mm (width) × 2500 mm (height) (approximately 230 m3), and 12,600 mm (length) × 9500 mm (width) × 2500 mm (height) (approximately 300 m3), respectively.
The Box–Behnken design (BBD), one of the response surface methodology designs, was used to identify the individual and interaction effects of each factor on the disinfection efficiency. Response surface methodology is a combination of statistical and mathematical techniques used to develop and optimize processes in which the response of interest is influenced by several factors [29]. The BBD is an independent and rotatable quadratic design with variable combinations at the edges’ midpoints and the center of the experimental space. It requires three levels for each explanatory variable, which requires fewer experiments than the other response surface methodology designs to estimate the effects of variables and their interactions. It is a widely used method for optimizing various conditions for bacteria inactivation [30].

2.2.4. Calculation of the Disinfection Efficiency of Total Bacteria

We counted the viable cell colony grown on the plate using the plate method to calculate the disinfection efficiency [31]. The equations we used are as follows:
DE   = log 10 N B N A
where DE is the disinfection efficiency, NB is the number of colonies before the disinfection, and NA is the number of colonies after the disinfection.

2.3. Statistical Analysis

Data of bacterial disinfection efficiency on indoor surfaces present the average number of colonies for triplicate disinfection experiments. In the optimization analysis, disinfectant concentration, spray amount, and room size were the explanatory variables, and total bacteria disinfection efficiency was the response variable. Each of the three explanatory variables’ levels was standardized. A second-order polynomial model was fitted to correlate the relationship between the response and explanatory variables. The data were evaluated by statistical analysis of variance (ANOVA) using the statistical software Minitab (version 19, Minitab Inc., State College, PA, USA). We also estimated the goodness-of-fit and coefficients of each model. A quadratic model that includes the linear model is as follows [32]:
Y = β 0 + i = 1 3 β i X i + i = 1 3 β i i X i 2 + i = 1 2 j = 2 3 β i j X i X j + e i ,
where Y is the response variable, X i and X j are the explanatory variables, β 0 is the model constant, β i represents the linear coefficient, β i i denotes the quadratic coefficient, β i j indicates the interaction coefficient, and e i is the statistical error.
We performed a Pearson correlation analysis to verify that different size fractions of PMs were correlated with each other during the dispersed aerosols’ residence time. A Spearman correlation analysis was conducted to determine the relationship between the three disinfection conditions and bacterial disinfection efficiency. These statistical analyses were conducted using SPSS version 25.0 (IBM, New York, NY, USA). Statistically significant differences were reported with p-values < 0.05.

3. Results

3.1. Residence Time of Dispersed Aerosols

The residence time of dispersed aerosols following spraying using the ULV sprayer is presented in Figure 4. Residence time, the duration until the sprayed aerosol particle concentration decreased to less than 15 cm−3 without further reductions, was approximately 90 min when spraying 5 L over 230 m3 (Figure 4b). The highest number of PM10, PM2.5, and PM1.0 particles was 39,869, 5987, and 969, respectively, following spraying with the ULV sprayer. After 30 min, the number of particles was 543, 349, and 113, respectively, and after 60 min, it was reduced to 8, 8, and 7, respectively. Even if the spray amount was reduced or increased, the sprayed particles sank after 91 min and 76 min, respectively, resulting in a residence time similar to that for the 5 L spray amount of 91 min (Figure 4a,c).

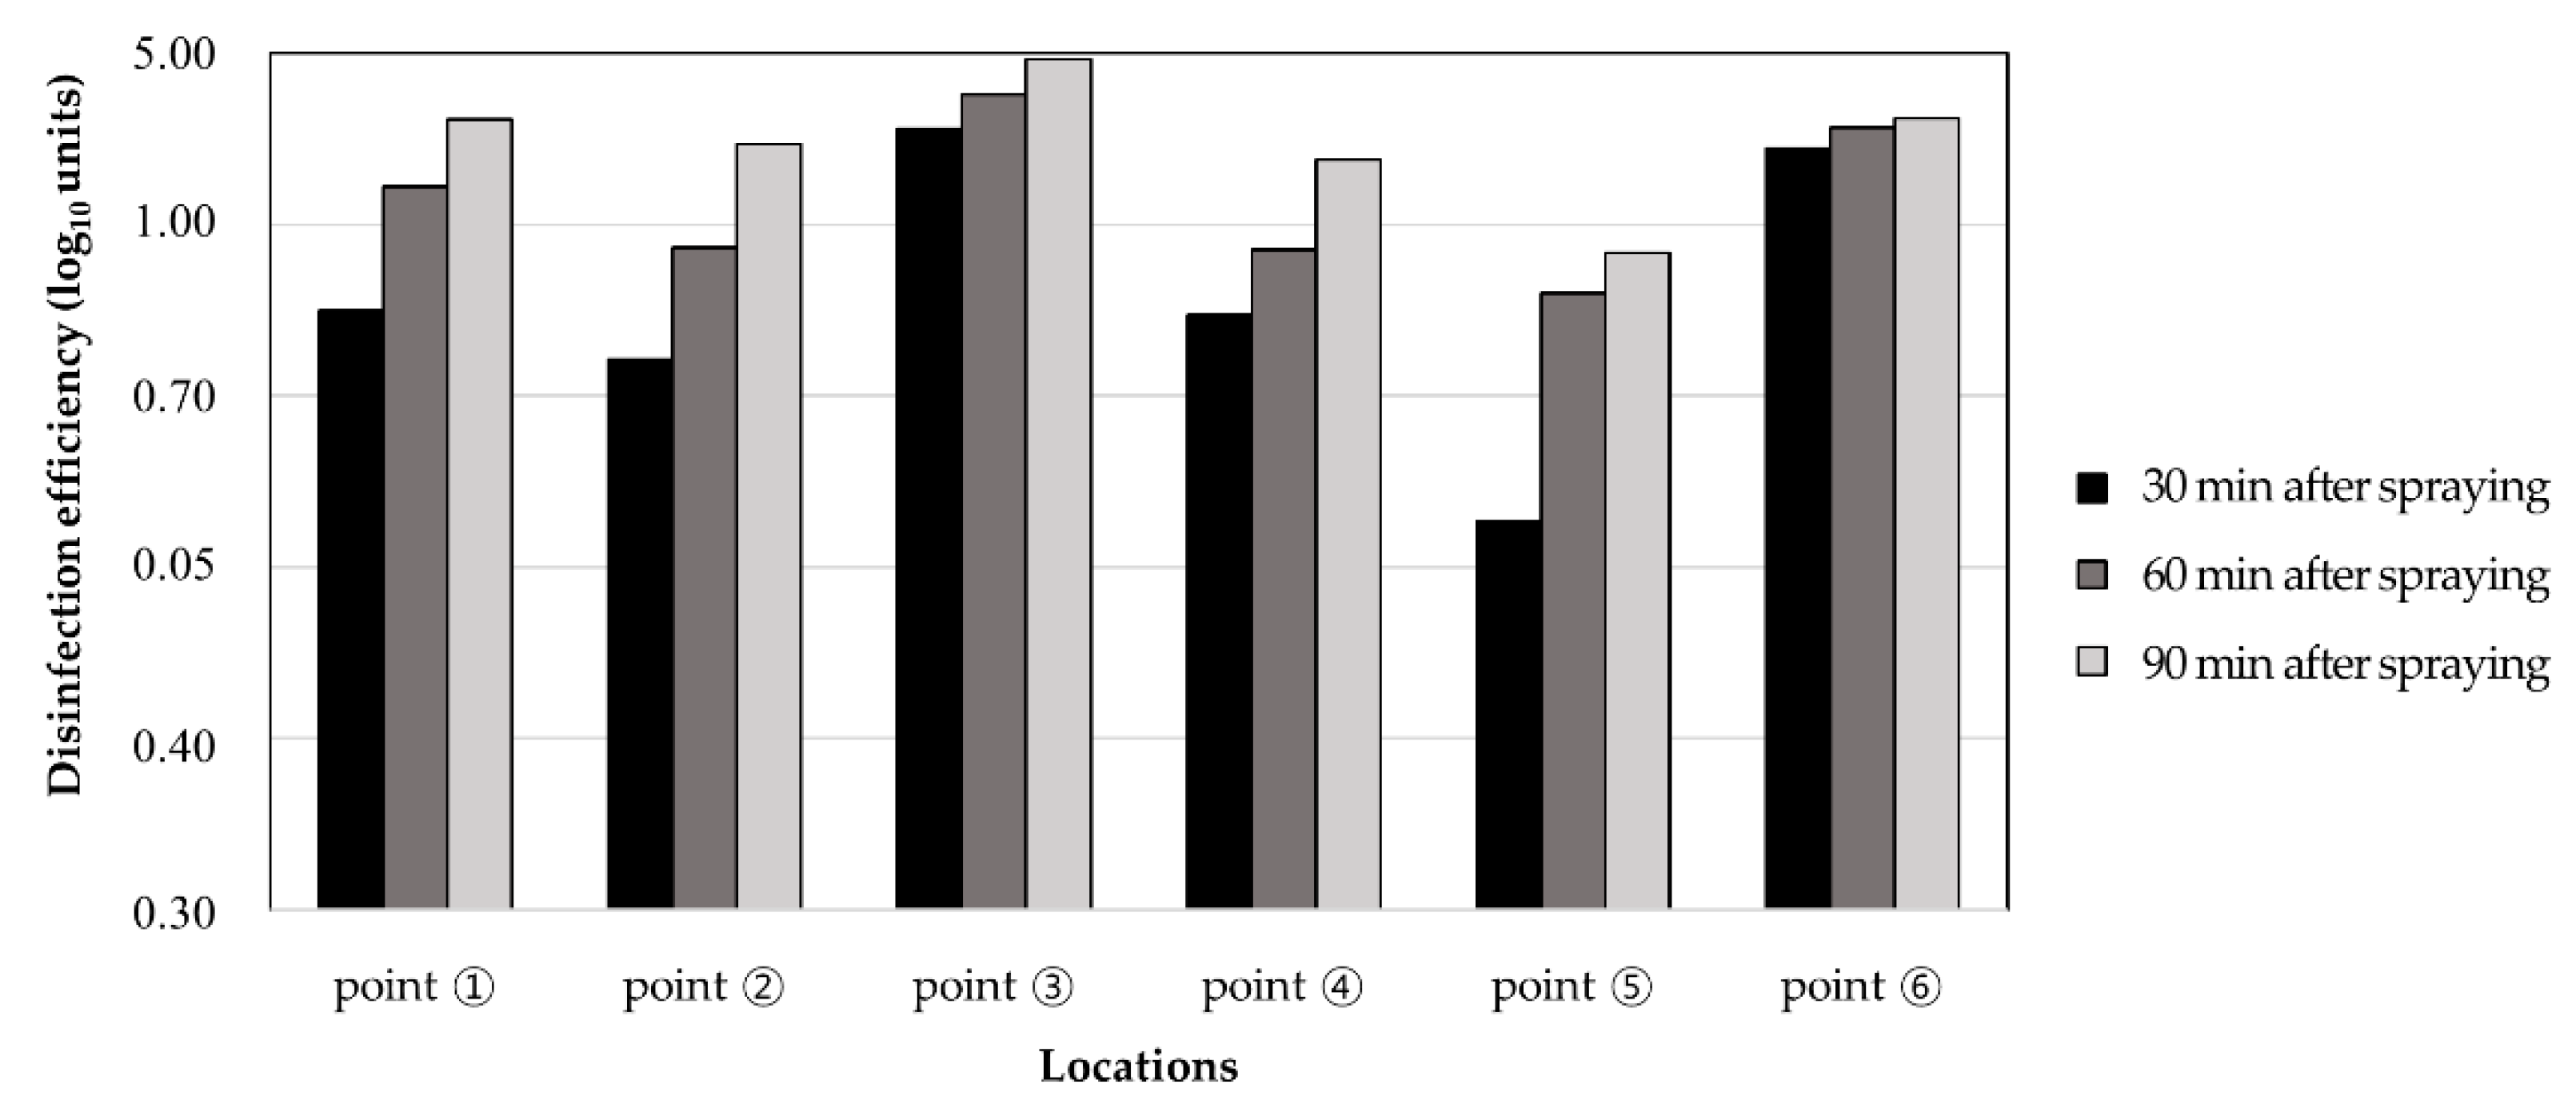
3.2. Efficacy of Bacterial Disinfection on Indoor Surfaces

The disinfection efficiency for total bacteria on indoor surfaces is presented in Figure 5 by location and time after spraying. The disinfection efficiency was 0.56–2.46 log10 reductions at all sites and differed depending on location. The disinfection efficiency for point, ③ the wall in the direction of the spray, was highest at 1.35 log10, 1.61 log10, and 2.46 log10 at 30, 60, and 90 min, respectively. The lowest disinfection frequency was observed for point, ⑤ the ceiling, at 0.56 log10, 0.85 log10, and 0.93 log10 at 30, 60, and 90 min, respectively. Meanwhile, the disinfection efficiency for point, ① the wall behind the ULV sprayer, and point, ⑥ under the desk, was over 0.70 log10 and 1.00 log10, respectively, at 30, 60, and 90 min. Therefore, the ULV sprayer was effective for the disinfection of total bacteria on all indoor surfaces.
Table 1 shows the individual effect of disinfectant concentration, spray amount, and room size on disinfection efficiency for total bacteria. Disinfection efficiency was calculated based on the number of bacteria colonies after 90 min when a maximum disinfection effect was observed as presented in Figure 5. As the spray amount increased, the total bacteria disinfection efficiency in all areas except point ⑤ showed a statistically significant increase (p < 0.01). At point, ③ the wall in the direction of the spray, there was a disinfection efficiency of 5.00 log10 (99.999%) when the spray amount was 5 L. The disinfection efficiency for total bacteria decreased in all areas when the disinfectant concentration increased from 200 to 50 times (p < 0.01) and when the room size increased in all areas except ③ (p < 0.01).

3.3. ANOVA Results and Regression Models

Table 2 shows the experimental design of BBD conducted to determine the effect of the different combinations of conditions on disinfection efficiency and the results for the response variables in each experiment. Over a total of 15 experiments, the ranges for disinfection efficiency for total bacteria in all areas were 0.77–2.72 log10, 0.66–5.00 log10, 1.32–5.00 log10, 0.76–1.99 log10, 0.69–3.40 log10, and 1.03–5.00 log10, at points ①, ②, ③, ④, ⑤, and ⑥, respectively, and the highest efficiency was observed for point ③, the wall in the direction of the spray. The average disinfection efficiency in all areas was 0.93–1.99 log10.
The results of the ANOVA and the goodness-of-fit of the models are presented in Table 3. The p-values for the models for all six response variables, except point ③, were less than 0.05 and had a nonsignificant lack-of-fit (p > 0.05). Therefore, all response variables were fitted well by the quadratic model. In the model for which the response variable was average disinfection efficiency, the p-values of the linear coefficients (X1, X2, and X3), and the interaction coefficients (X1∙X2, X1∙X3, and X2∙X3) were all statistically significant (p < 0.05). In the model for which the response variables were disinfection efficiency at locations ① to ⑥, the significance of the p-values of linear coefficients and the interaction coefficients were varied. The results in which the p-values of coefficients of X1, X2, and X1∙X2 were statistically significant at most locations were notable. All three parameters and their interactions affected the disinfection efficiency. In all models, the coefficients of determination (R2), which explained the variability in the response values by the experimental parameters and their interactions [33], were high, close to 1 (R2 > 0.8186). Therefore, all models were suitable for determining the optimum conditions for bacterial inactivation.

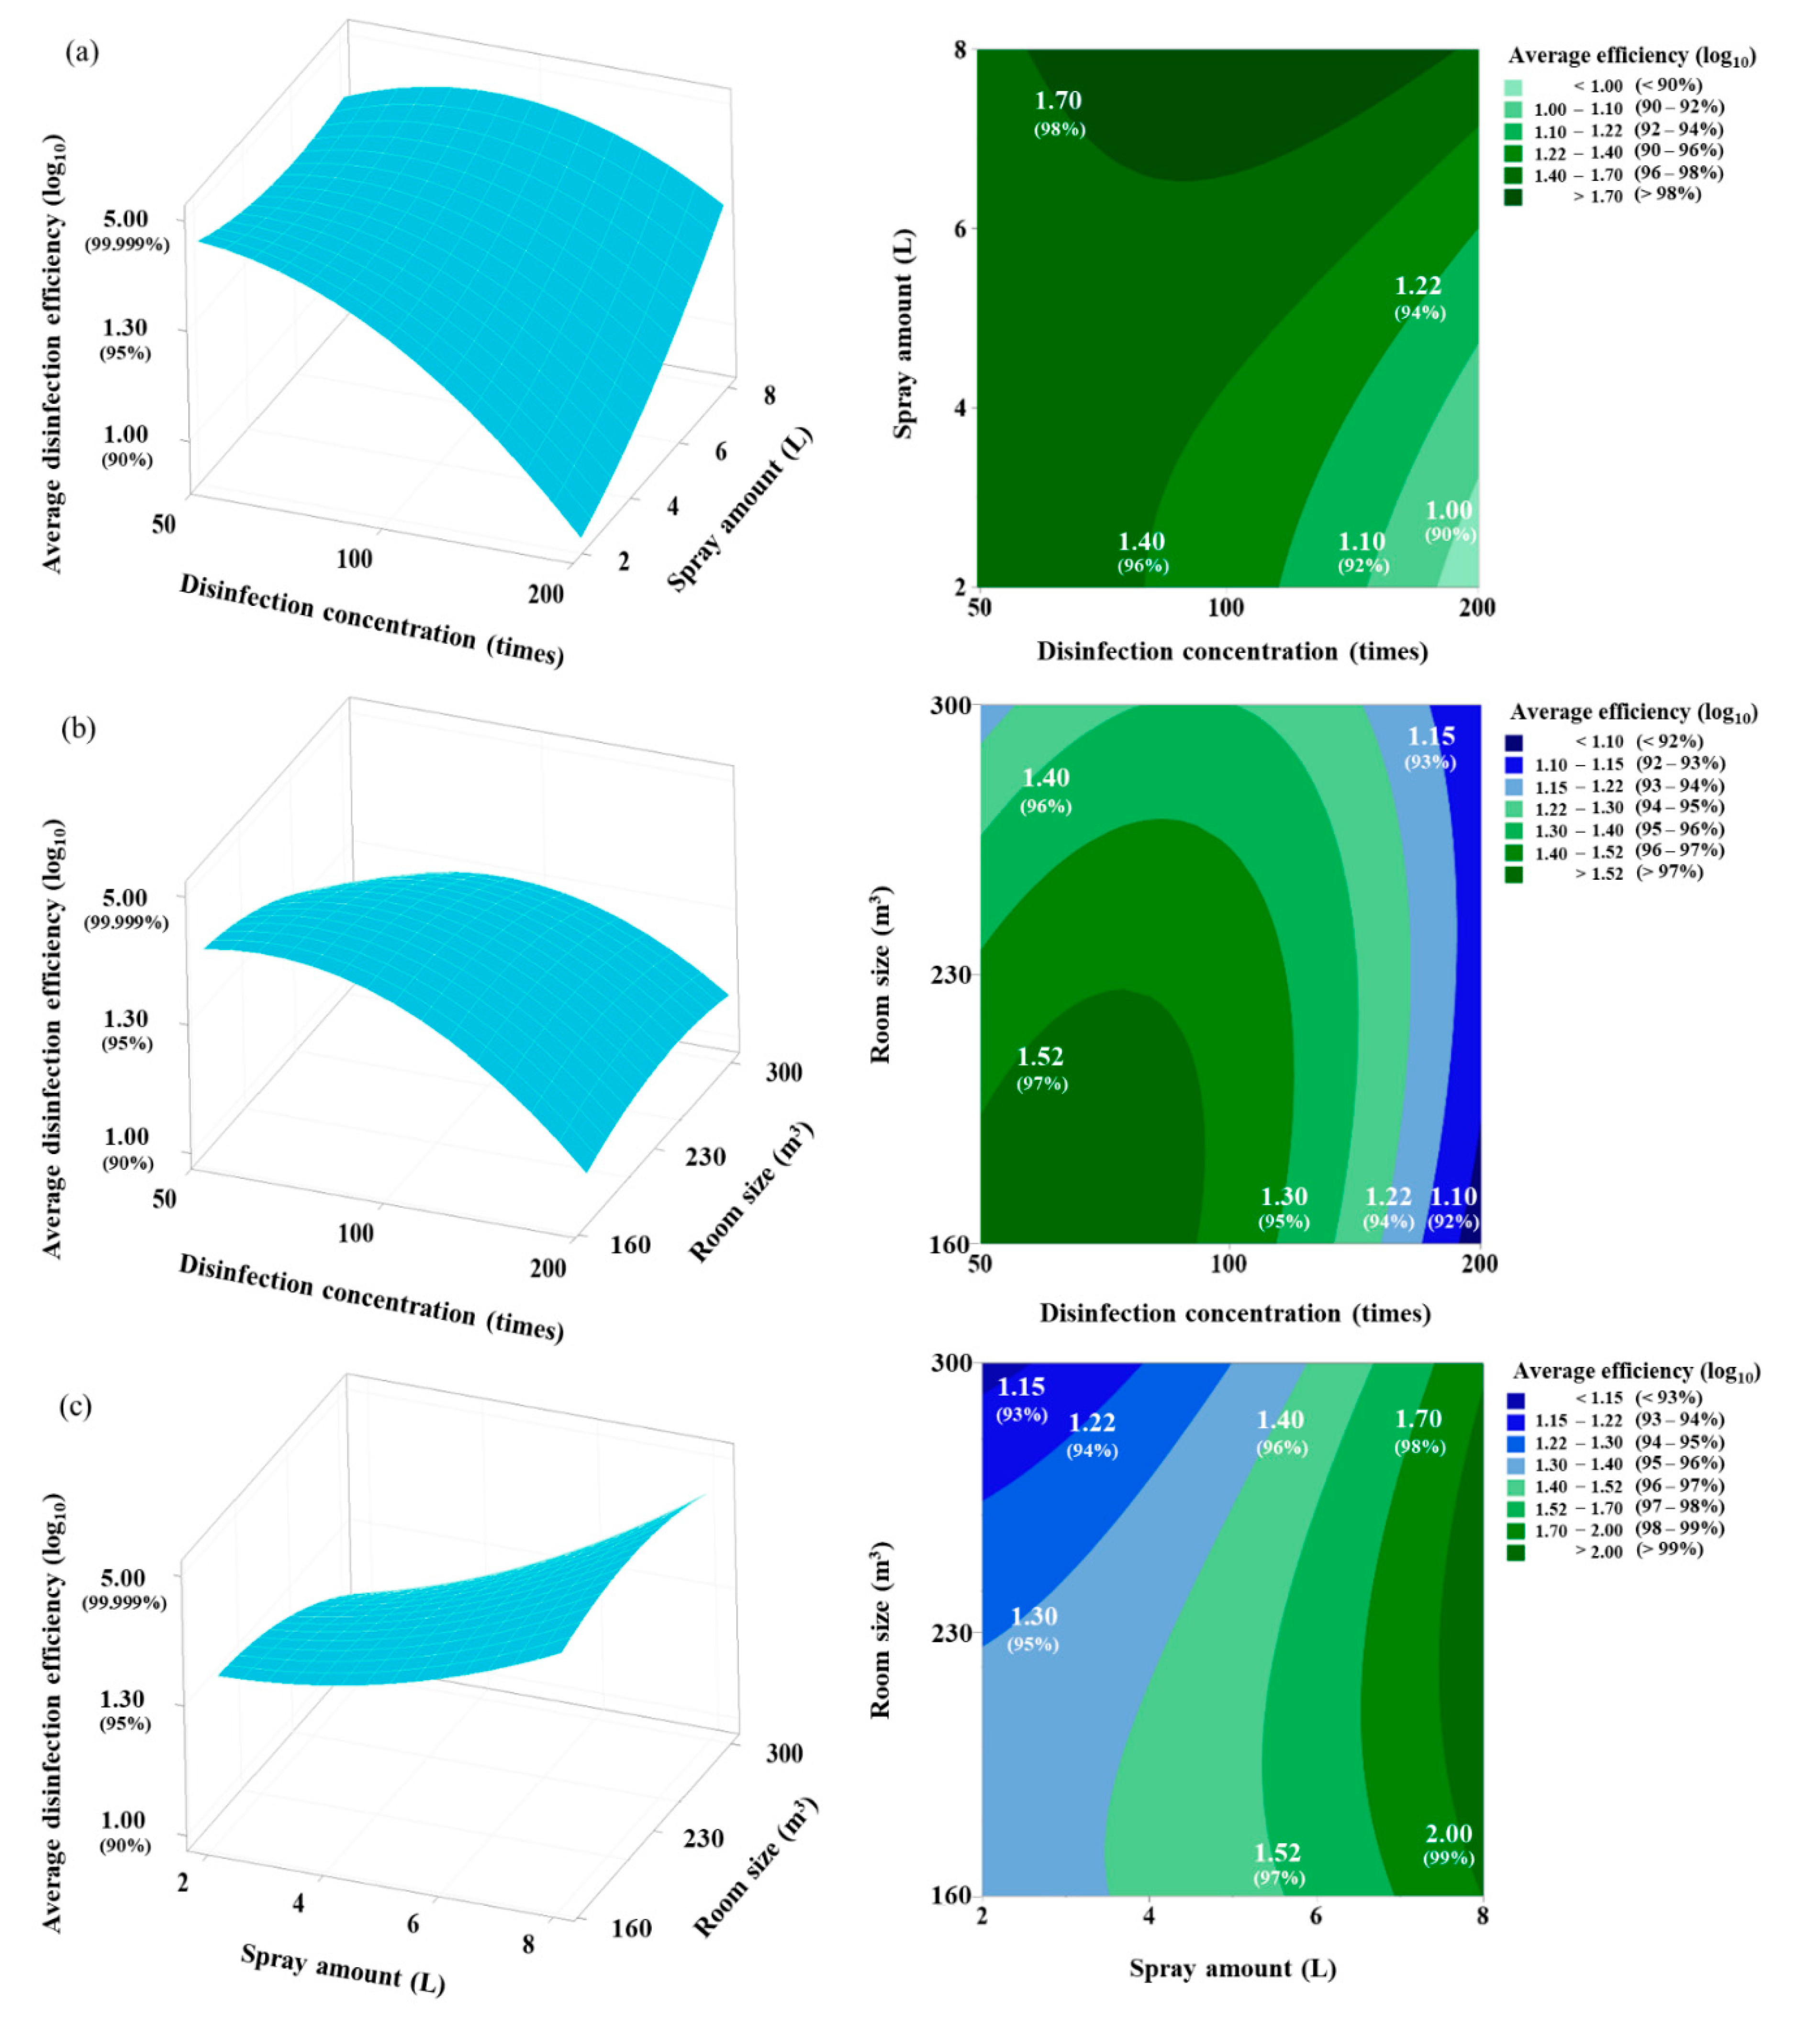
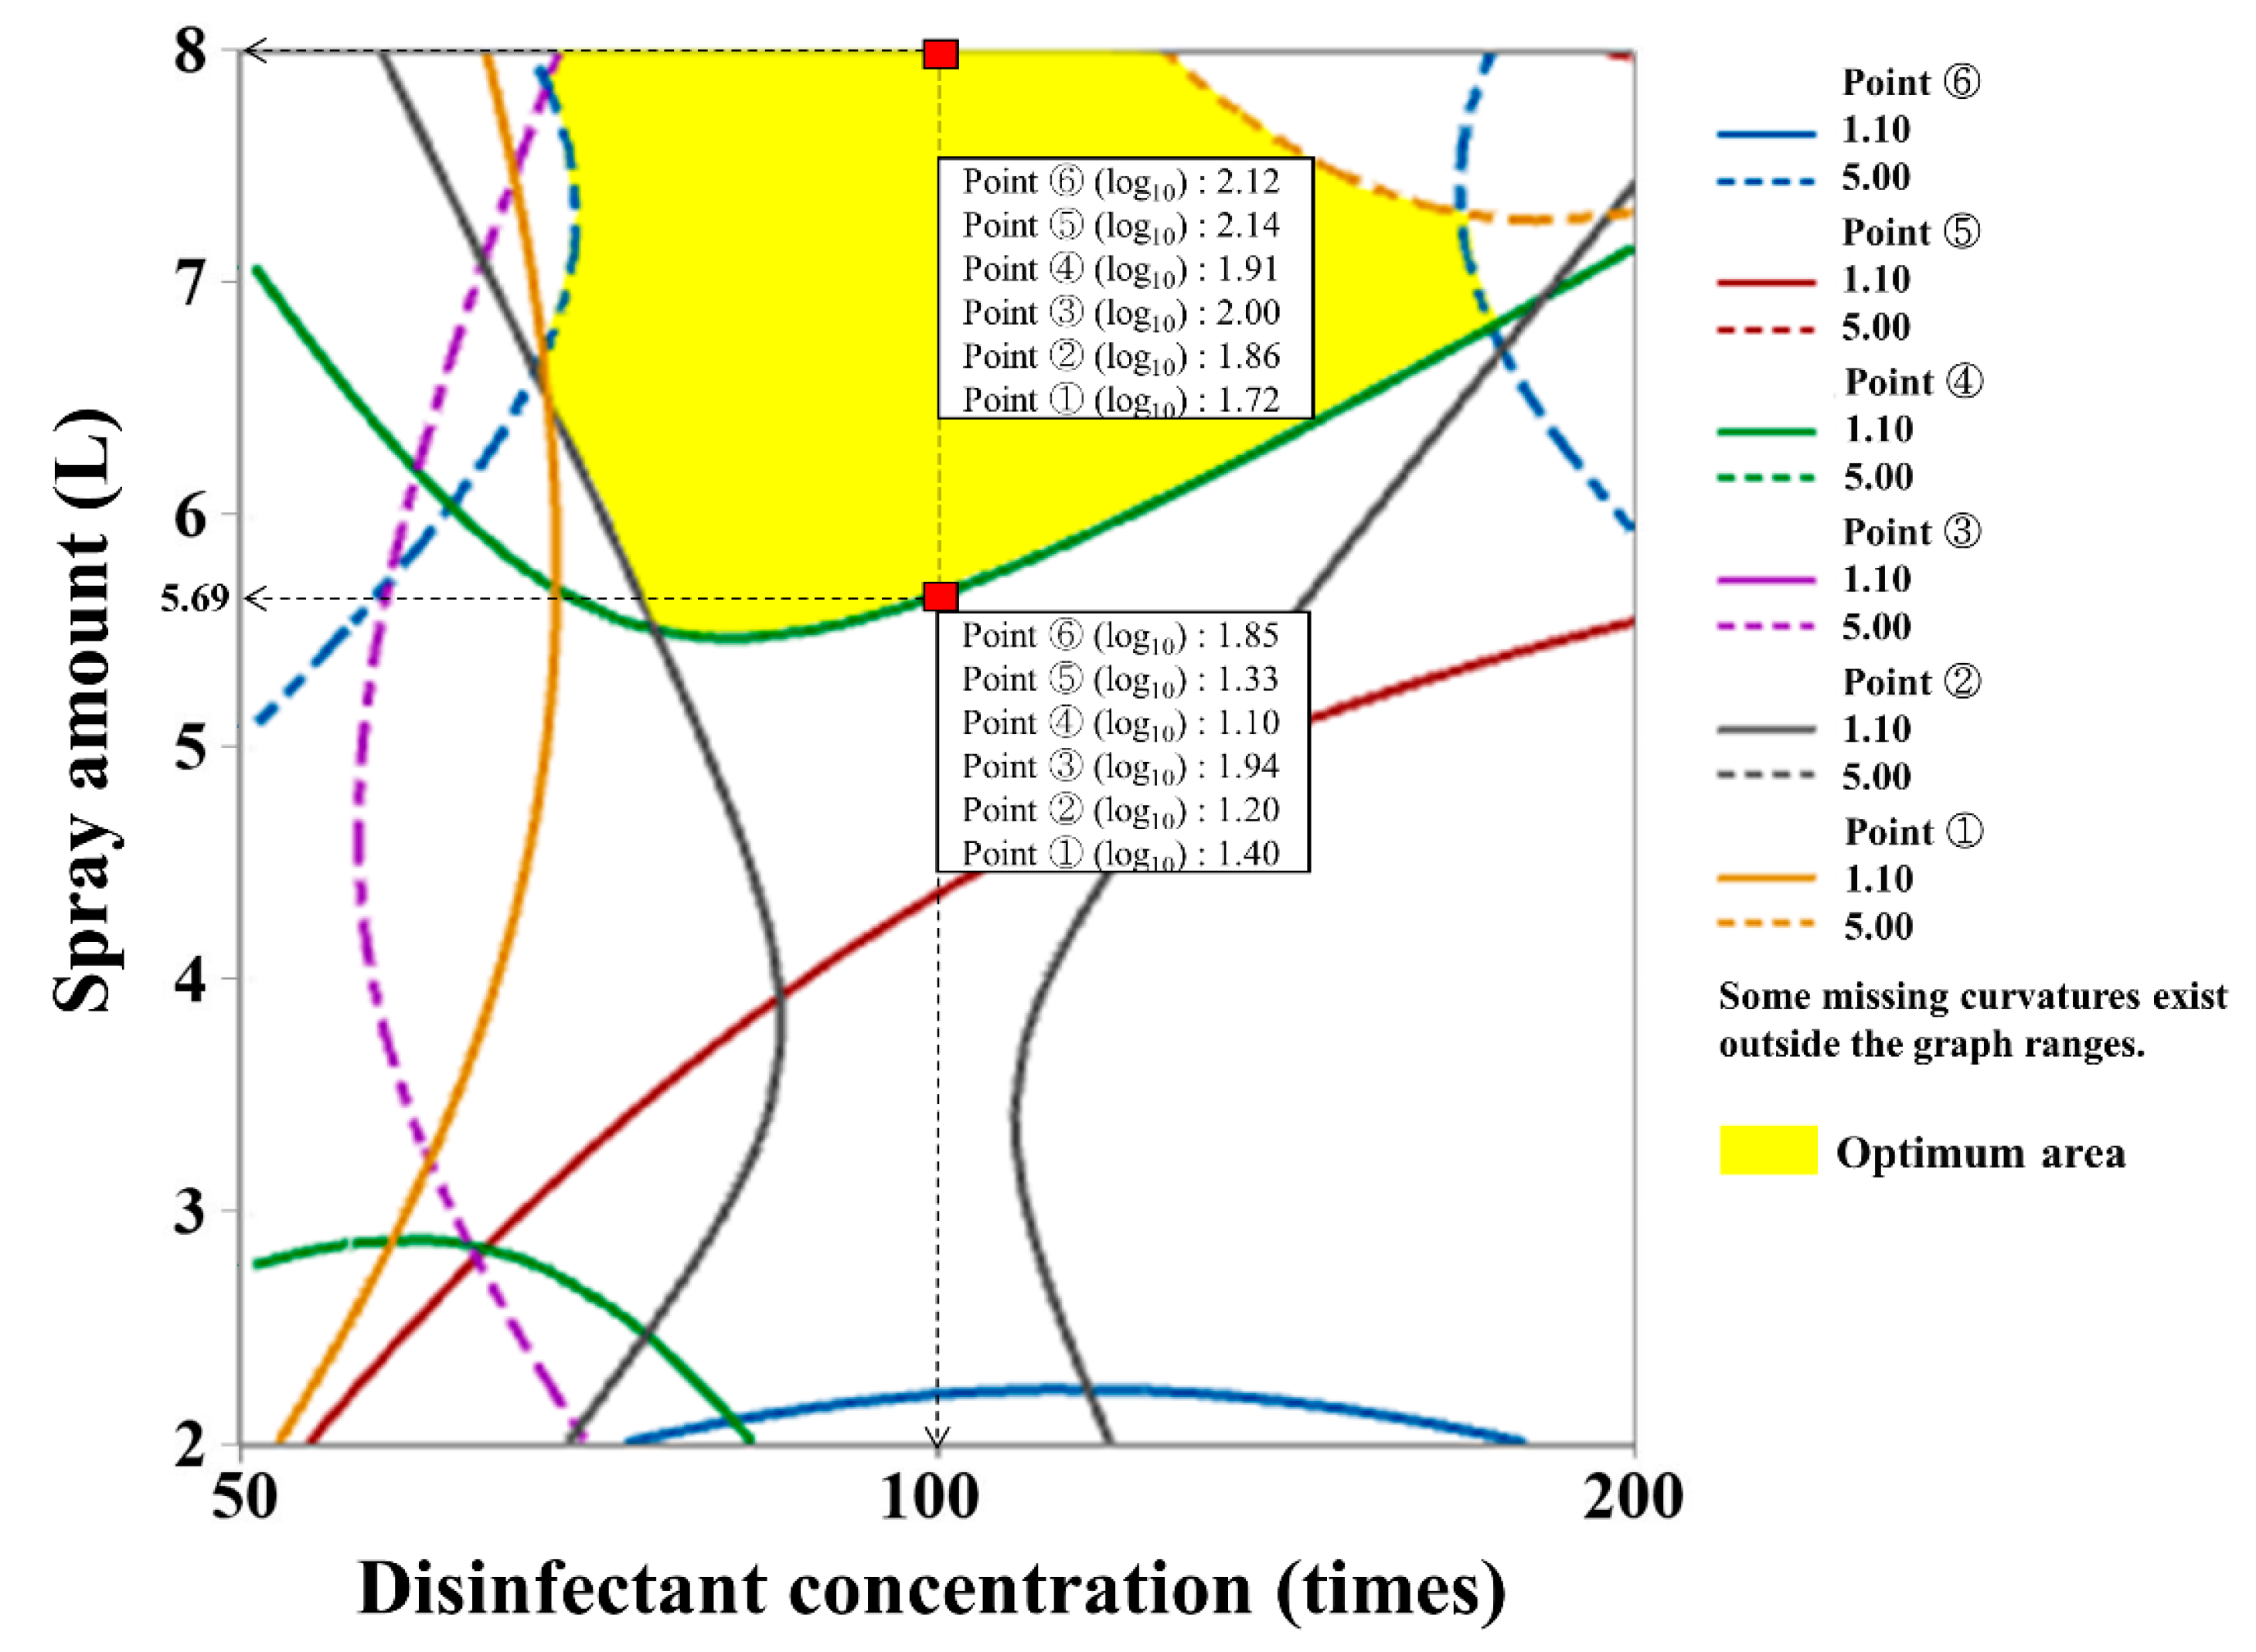
3.4. Response Surface and Contour Plot Analysis

Figure 6 illustrates three-dimensional response surface plots and two-dimensional contour plots explaining the relationship between the explanatory and response variables. We visually determined how the three explanatory variables had interaction effects on the total bacteria disinfection efficiency and how one factor was influenced by another’s change. The average total bacteria disinfection efficiency was considered a response variable and representatively used to examine the relationships between the variables and the total bacteria disinfection efficiency. Figure 6a–c shows the effects of two explanatory variables and their interactions with the response of total bacteria disinfection efficiency at the middle level of another variable. The interaction effect between the disinfectant concentration and spray amount was notable. As both the spray amount and the disinfectant concentration increased, the disinfection efficiency increased (Figure 6a). The higher the disinfectant concentration and the smaller the room size, the higher was the disinfection efficiency (Figure 6b). With an increase in the spray amount and a decrease in room size, there was a slight increase in disinfection efficiency (Figure 6c). When determining the total bacteria disinfection efficiency based on the combinations of the three explanatory variables, although the magnitudes were different, the interaction effects of the three factors on the total bacteria disinfection efficiency were observed in all areas (data not shown).

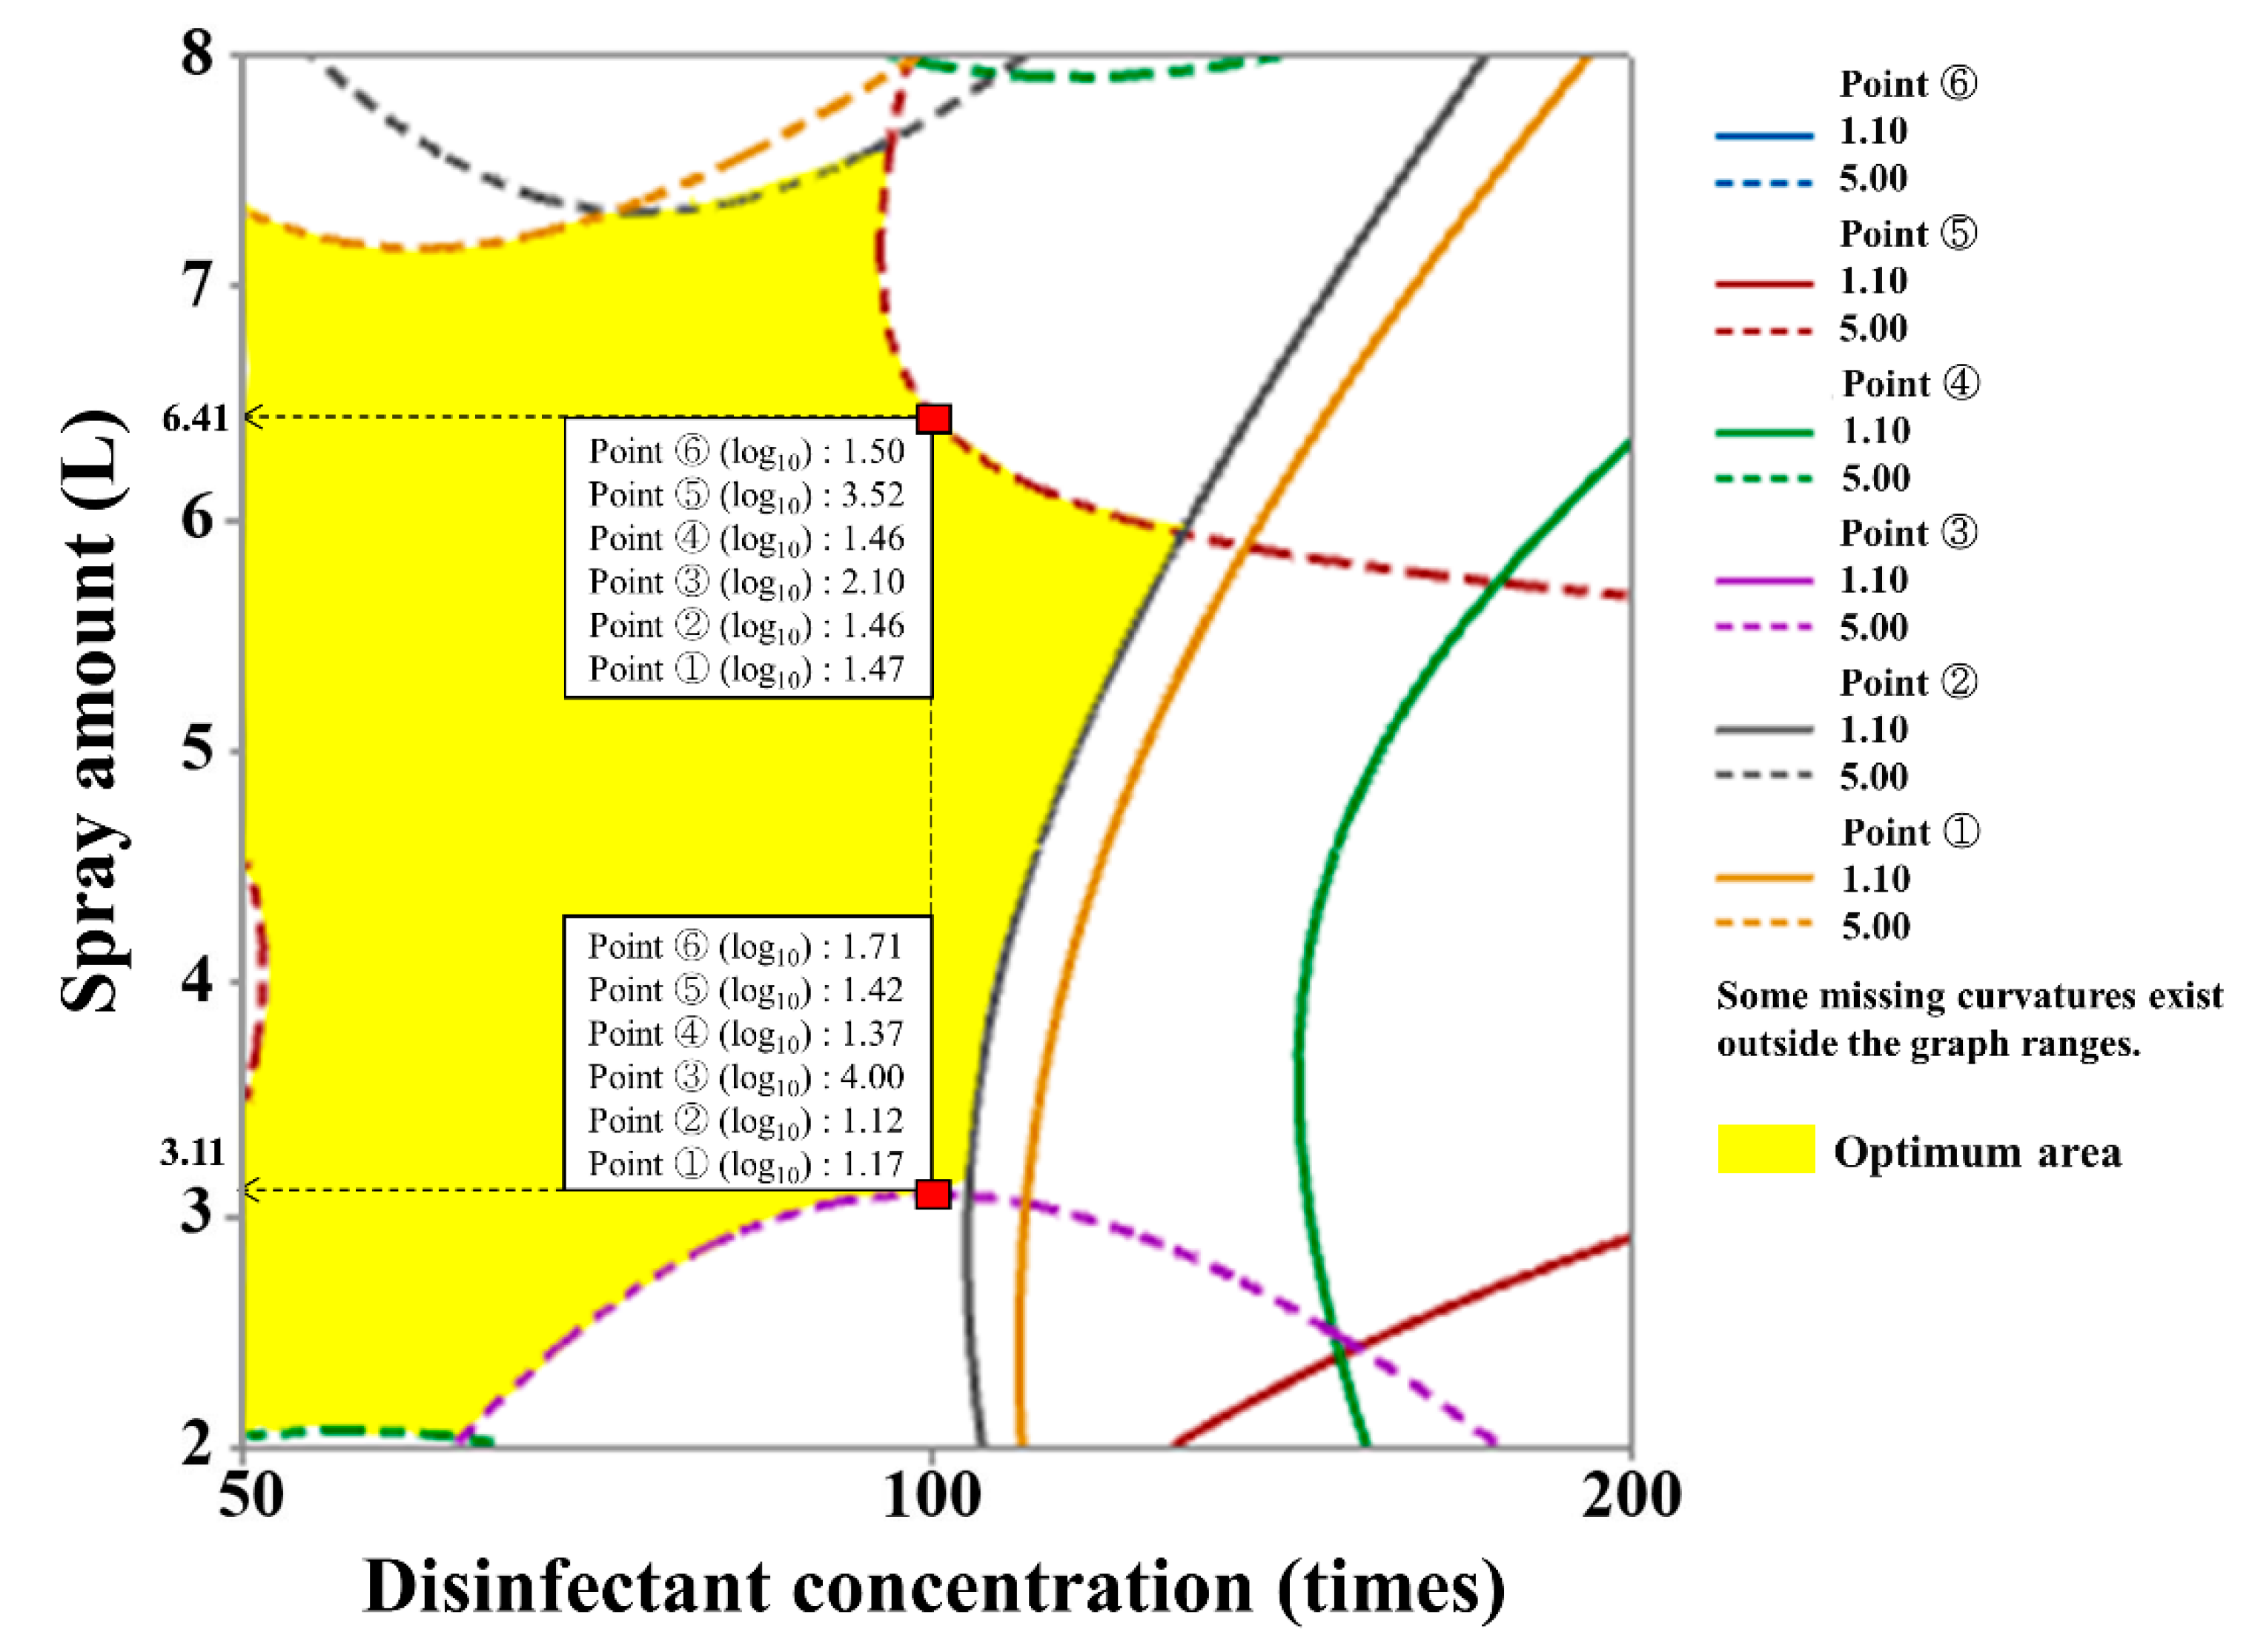
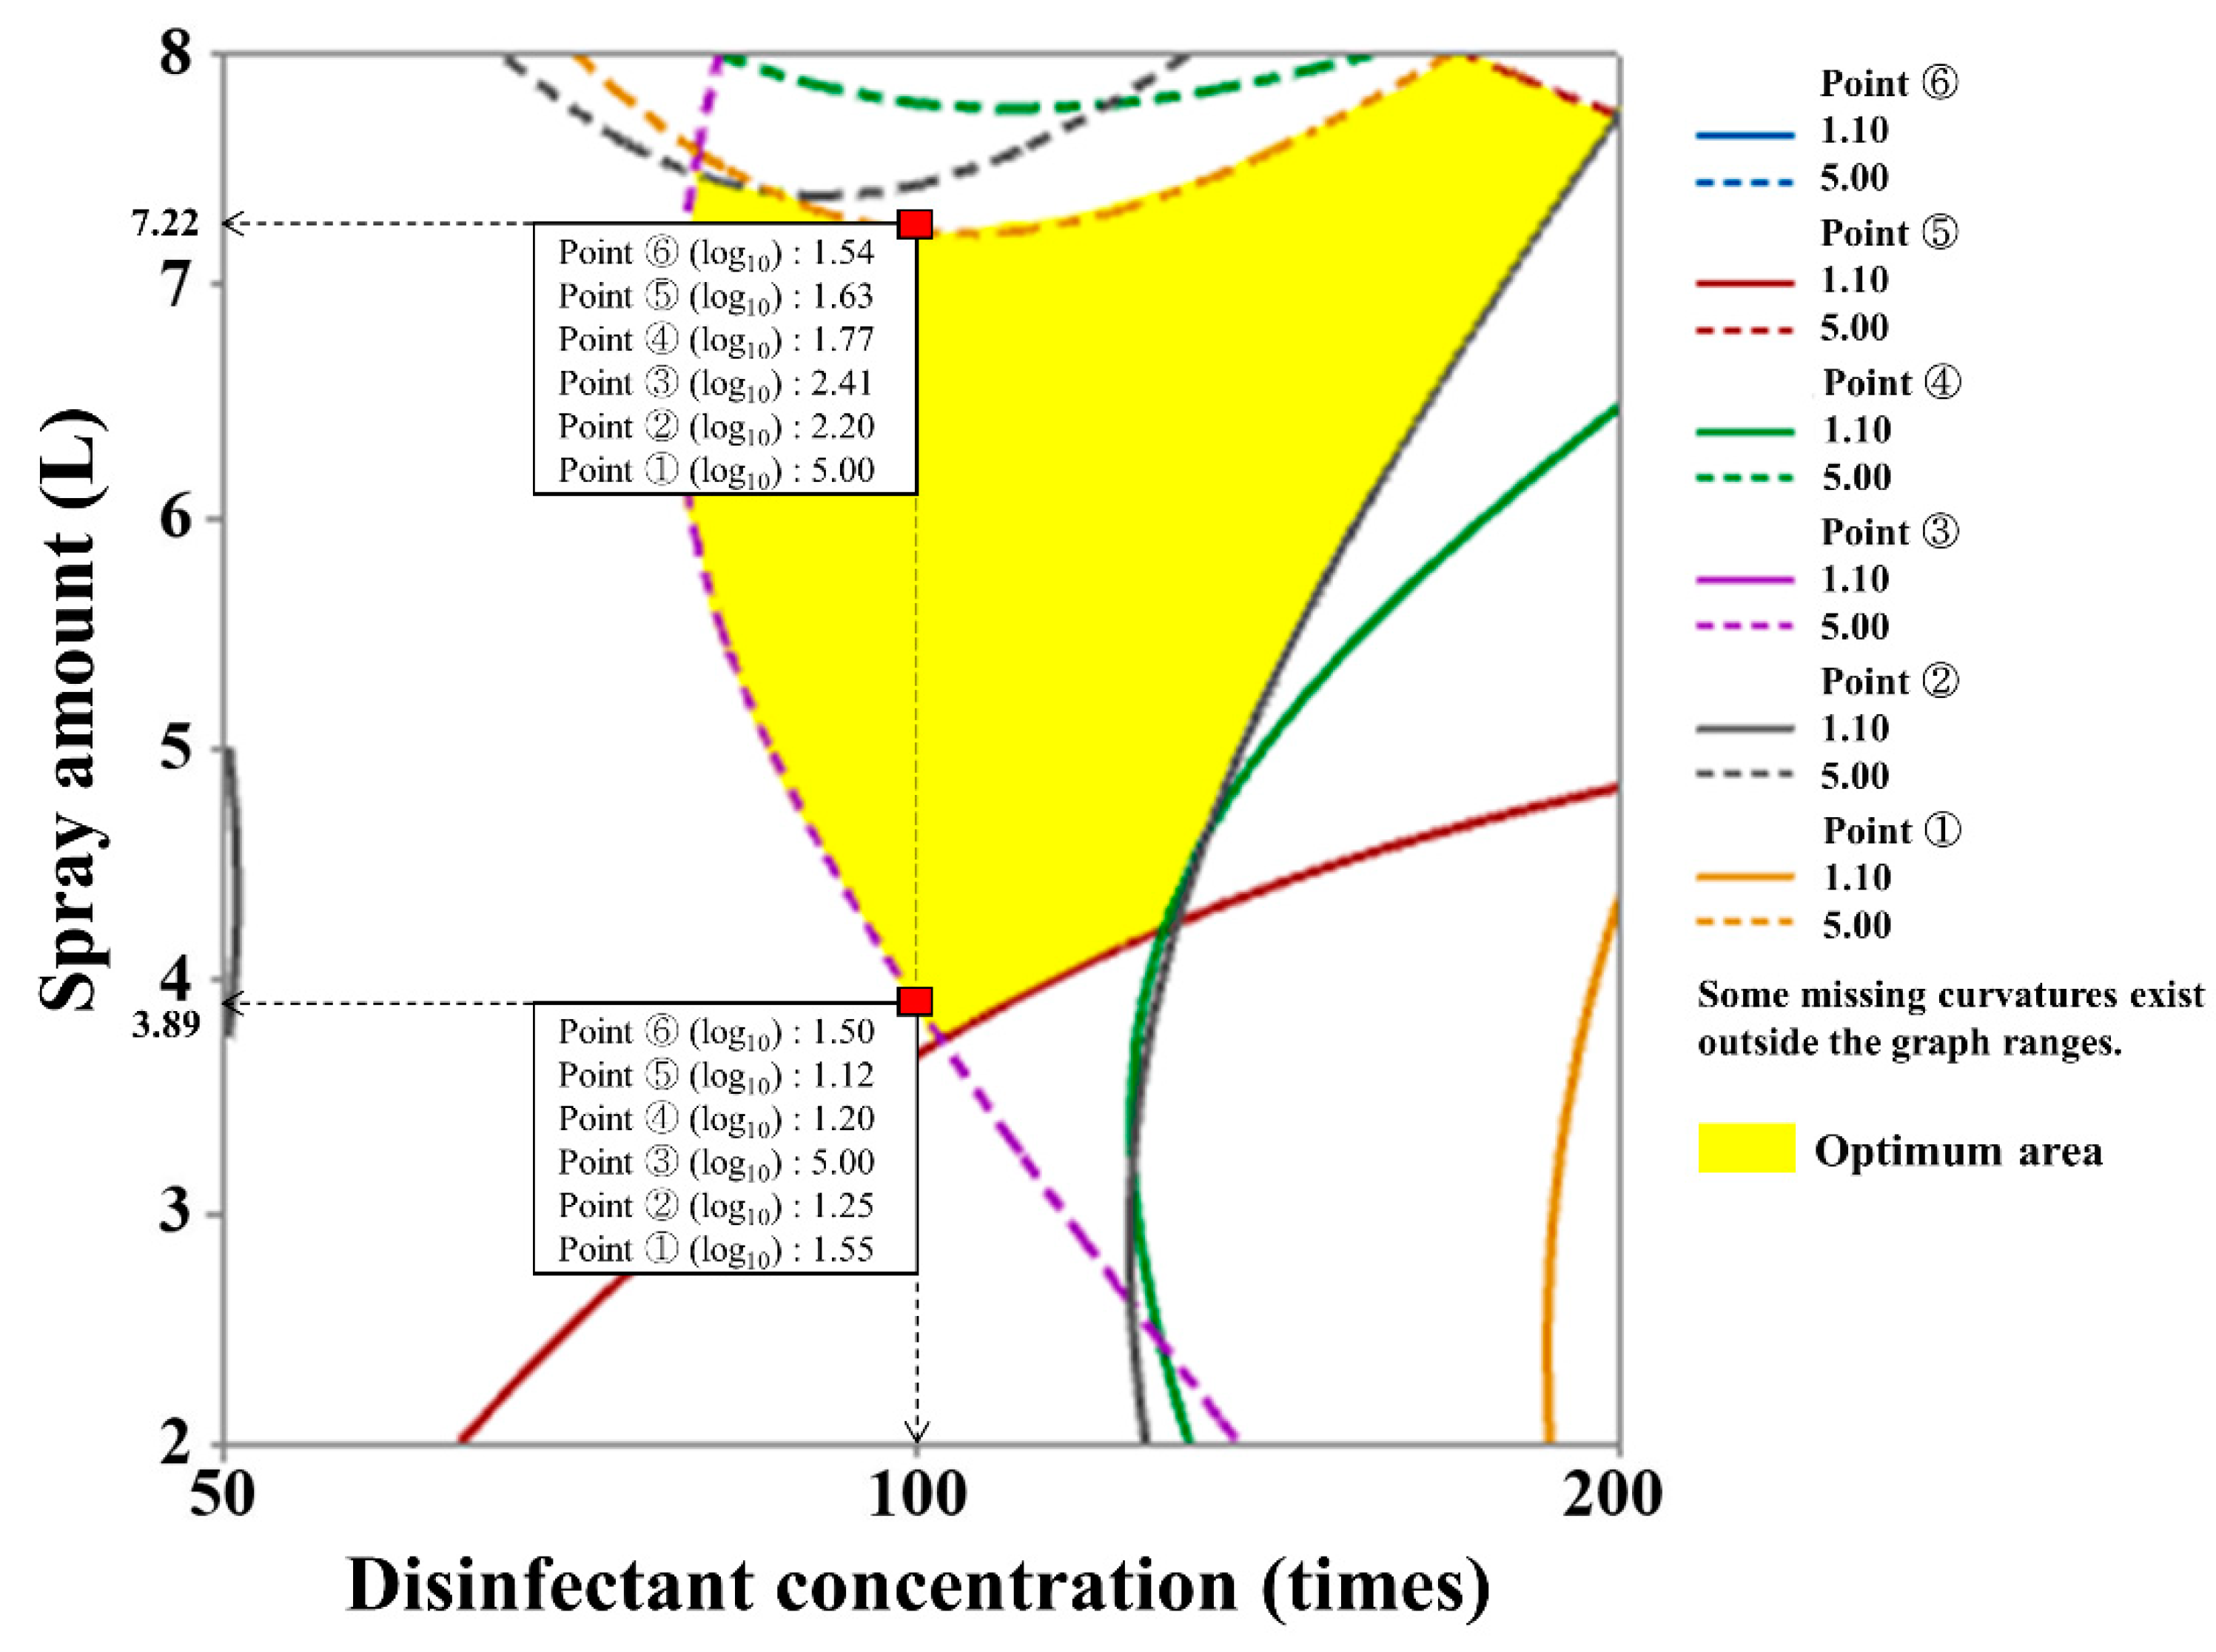
3.5. Optimum Operating Conditions for the ULV Sprayer

After studying the effects of the explanatory variables on the response variables, we optimized the six explanatory variables using the desirability function. We aimed to determine the optimum conditions that resulted in maximum bacteria disinfection efficiency in all areas. Moreover, workers cannot control the room size, as the disinfection space size is fixed. Therefore, we presented the optimum ranges for operating the ULV sprayer by room size to demonstrate conditions that can actually be controlled and used at the quarantine site. Figure 7, Figure 8 and Figure 9 depict the overlay plots of the effects of the disinfectant concentration and spray amount on the response variables at each room size. The yellowed area is the zone of the disinfection concentration and spray amount that demonstrated the optimal disinfection efficiencies at all locations. The different colors of curved plots show the disinfection efficiency in locations ①–⑥. We found the optimum usage conditions that predicted the total bacteria disinfection efficiency of >1.10 log10 reductions (92%) in all areas. As per the room size, the optimum conditions when using the recommended dilution factor of 100 were as follows: spray amount of 3.08–6.40 L in 160 m3, 3.78–7.22 L in 230 m3, and 5.68–8 L in 300 m3. Therefore, it can be concluded that the larger the room size, the higher the required spray amount for optimal disinfection efficiency when using the recommended disinfectant concentration.

4. Discussion

4.1. Efficacy of ULV Sprayer on Total Bacteria on Indoor Surfaces

In this study, the disinfection of bacteria on indoor surfaces using the ULV sprayer was shown to be effective. The disinfection efficiency of total bacteria using the ULV sprayer was 0.56–2.46 log10 reductions at all surfaces (Figure 5). Few studies have demonstrated the efficacy of microbial inactivation using foggers (or sprayers), including the ULV sprayer, and some controversy continued regarding their effectiveness. Roth and Michels (2005) found that spraying was ineffective in removing microbial pollutants outside direct spray zones [34]. Meanwhile, Clark et al. (2006) tested the efficacy of methicillin-resistant Staphylococcus aureus (MRSA) and Acinetobacter baumannii when decontaminating environmental surfaces using a Sterilox fogger. As a result, initial counts of approximately 109 CFU/mL for both microorganisms were reduced approximately 104-fold for MRSA and 105.8-fold for A. baumannii when using single fogging [35]. A recent study by Soohoo et al. (2020) also found a disinfection efficiency of 0.32 log10 reductions (52.14%) when they disinfected the meticillin-resistant Staphylococcus pseudintermedius (MRSP) using hydrogen peroxide and silver fogging systems [36]. Our study showed a high total bacteria inactivation efficiency of 0.56–2.46 log10 reductions (72.68–99.65%), compared to other studies.
The advantage of using a ULV sprayer over the existing method is that it allows disinfectant in small aerosol particles to reach the unreachable spaces by workers [12,13,14]. Our results show high efficiency values of 0.93 log10 and 1.42 log10, respectively, even on the ceiling and underneath the desk, which are hard-to-reach areas, after 90 min of disinfection (Figure 5). Previous studies have also reported that aerosol particles dispersed from the fogger stuck to various locations and increased disinfection efficiency. Dunowska et al. (2005) determined the disinfection efficacy of fogging Virkon S on the survival of Staphylococcus aureus and Salmonella enterica on different hospitals’ surfaces. As a result, the disinfection efficiency of Staphylococcus and Salmonella direct spray zones was high, at 3.40 and 4.92 logs direct spray zones, respectively, whereas that of outside direct spray zones showed a low reduction of 0.95 and 0.02 logs [15]. A study by Kishnan et al. (2012) found that the removal efficiency of dry fogging on adenovirus, vesicular stomatitis virus, S. aureus, E. coli, and B. atrophaeus spores in 29 different areas showed a 0.2–1.6 logs reduction [37]. Although the removal efficiency varied from place to place, the sprayed disinfectant aerosols reached all sites and showed a disinfection effect. This was true for the current study as well. The disinfection efficiency for removal of total bacteria was >0.70 log10 (80%) for not only ③ the wall in the direction of the spray but also ⑤ the ceiling, and ⑥ the bottom of the desk (Table 1). Similar results were observed even when the space size increased. Meanwhile, ⑤ the ceiling showed the lowest disinfection efficiency (0.93 log10) compared to other walls because the ceiling was far, approximately 1.8 m above the ULV installation position and 4–6 m forward from the ULV sprayer. The forward dispensing particles are sufficiently convective within a certain height. Still, they are considered to have a limited ability to reach the ceiling. This is consistent with our assumption that a non-directly dispensed direction from the wall would show relatively less efficiency. It is nevertheless worth noting that it showed a high efficiency of more than 0.7 log10.
Disinfectant microparticles sprayed from ULV interact with small particles such as aerosols, droplet nuclei, and air. The microparticles also combine with infectious agents or dust particles (chemical irritants or toxins) in the air to kill pathogens or make them heavy and sink [15]. In this study, the sprayed small particles (PM10, PM2.5, and PM1.0) stayed in the air for 90 min and then sank (Figure 4). In addition, the number of particles in the air and disinfection efficiency increased 30, 60, and 90 min after the ULV spray (Figure 5). A study conducted by Dunowska et al. (2005) also reported that as time passed from 30 min to 2 h after spraying, fogged disinfectants increased Salmonella and Staphylococcus disinfection efficiencies [15]. Therefore, we concluded that sprayed (or fogged) disinfectant aerosol adhered to the surface for approximately 30 min to 2 h while floating in the air, increasing the disinfection efficiency.

4.2. Optimal Usage Conditions of the ULV Sprayer Considering Factors Affecting Total Bacteria Inactivation

The disinfectant concentration, spray amount, and room size, factors that affected the inactivation of microorganisms, had an interaction effect on bacteria disinfection efficiency (Table 3). With regard to room size, the optimum conditions when using the recommended dilution factor of 100 were as follows: a spray amount of 3.08–6.40 L in 160 m3, 3.78–7.22 L in 230 m3, and 5.68–8 L in 300 m3 (Figure 7, Figure 8 and Figure 9). These conditions predicted the bacteria inactivation efficiency to be above 1.10 log10 (92%) at all surfaces. Among various factors, disinfectant concentration, spray amount, and space size are the main factors that affect disinfection efficiency, either individually or interactively. In general, there is an appropriate concentration for maximum disinfection efficiency. For example, ethanol is known to have maximum efficiency at 70% [38]. In studies using a disinfectant such as VirkonTM Micro, which was used in this experiment, the disinfection effect significantly increased as the concentration of disinfectant increased to 2 and 4% based on the recommended dilution factor of 1% (100 times). In contrast, the disinfection effect significantly decreased as the concentration of disinfectant decreased from 1 to 0.1 and 0.05% [25]. In addition, the increase in the amount of spraying increased disinfectant efficiency by increasing the contact time [20], which is consistent with the results of this study showing a positive correlation among the disinfectant concentration, spray amount, and disinfection efficiency (Table 1).
This study also identified the interactive effect of the factors on disinfection efficiency, unlike previous studies, which observed only the disinfection efficiency of individual factors. The result showed that the disinfectant concentration and spray amount had a significant interaction effect on the total disinfection efficiency under the assumption that space size cannot be changed during quarantine (Table 3). Meanwhile, when observing the total bacteria disinfection efficiency at locations ① to ⑥, the significance of the p-values of linear coefficients and the interaction coefficients were varied. It seemed to be because each area was affected by the direct/indirect spray zones and the distance away from the ULV sprayer. In particular, the effects were not observed well at ③, which showed the highest disinfection efficiency, because ③ was a direct spray zone, and the direct spray zone had the most significant impact on disinfection efficiency other than the three factors. However, the results in which the p-values of the coefficients of disinfection concentration, spray amount, and the interaction term were statistically significant at most locations were notable.
To the best of our knowledge, this is the first study that confirmed the disinfection efficiency of the ULV sprayer as a method for inactivating bacteria present on indoor surfaces, and found the optimum conditions using BBD. While the importance and urgency of indoor microbial disinfection have been publicly recognized, few studies have been conducted to quantitatively suggest conditions for optimal disinfection efficiency according to the size of the workspace. Thus, there is no specific guideline for this. This study modeled the response variable and explanatory variable as a second-order polynomial using BBD, one of the experimental design methods, and calculated and quantified the optimized value of the explanatory variable by the desirability function. As the room size increased, the minimum spray amount required was increased to achieve the best disinfection efficiency when using the recommended dilution factor of 100 times. It indicates that quarantine workers can obtain optimal disinfection efficiency when using the recommended disinfection concentration by disinfecting with the suggested spray amount from our results depending on the quarantine site’s room size. It is expected to prevent the overuse of disinfectants. The study results can be used as basic data for the effective control of indoor surface microbials using a ULV sprayer based on quantitative evidence.

5. Conclusions

In this study, we verified the disinfection efficiency of a ULV sprayer for the inactivation of bacteria present on indoor surfaces according to the disinfectant concentration, spray amount, and room size. We present the optimum conditions on the basis of the room size to achieve the target disinfection efficiency using a Box–Behnken design. The inactivation efficiency for total bacteria using a ULV sprayer was 0.56–2.46 log10 reductions, and it was high even on the ceiling and under the desk where it was hard to reach. The disinfectant concentration, spray amount, and room size had an interaction effect on the efficiency of bacterial disinfection. With regard to the room size, the optimum conditions were found to be a spray amount of 3.08–6.40 L in 160 m3, 3.78–7.22 L in 230 m3, and 5.68–8 L in 300 m3 when using dilution rates of 1:100, which is the recommended concentration. These conditions predicted a bacteria inactivation efficiency of above 1.10 log10 reductions (92%) for all surfaces. Our results can be used as basic data for efficient indoor bacterial disinfection using a ULV sprayer.

Author Contributions

Conceptualization, Y.-H.C., D.-A.H., and K.W.M.; methodology, Y.-H.C. and D.-A.H.; data curation, Y.-H.C., J.-Y.L., and J.Y.C.; formal analysis, Y.-H.C. and K.W.M.; writing—original draft preparation, Y.-H.C.; writing—review and editing, Y.-H.C., D.-A.H., and K.W.M. All authors have read and agreed to the published version of the manuscript.

Funding

This research received no external funding.

Institutional Review Board Statement

Not applicable.

Informed Consent Statement

Not applicable.

Data Availability Statement

All data and models generated during the study appear in the submitted article.

Acknowledgments

This work was supported by the National Research Foundation of Korea (NRF) grant funded by the Korea government (Ministry of Science and ICT) (No. NRF-2019R1F1A1064259).

Conflicts of Interest

The authors declare no conflict of interest.

References

  1. Yang, J.N.; Nam, I.; Yun, H.; Kim, J.; Oh, H.-J.; Lee, D.; Jeon, S.-M.; Yoo, S.-H.; Sohn, J.-R. Characteristics of indoor air quality at urban elementary schools in Seoul, Korea: Assessment of Effect of Surrounding Environments. Atmos. Pollut. Res. 2015, 6, 1113–1122. [Google Scholar] [CrossRef]
  2. Moon, K.W.; Huh, E.H.; Jeong, H.C. Seasonal evaluation of bioaerosols from indoor air of residential apartments within the metropolitan area in South Korea. Environ. Monit. Assess. 2014, 186, 2111–2120. [Google Scholar] [CrossRef]
  3. Brągoszewska, E.; Biedroń, I. Indoor air quality and potential health risk impacts of exposure to antibiotic resistant bacteria in an office rooms in Southern Poland. Int. J. Environ. Res. Public Health 2018, 15, 2604. [Google Scholar]
  4. Prussin, A.J., II; Garcia, E.B.; Marr, L.C. Total virus and bacteria concentrations in indoor and outdoor air. Environ. Sci. Technol. Lett. 2015, 2, 84. [Google Scholar] [CrossRef]
  5. Fu, X.; Norbäck, D.; Yuan, Q.; Li, Y.; Zhu, X.; Hashim, Z.; Ali, F.; Zheng, Y.W.; Lai, X.X.; Spangfort, M.D.; et al. Indoor microbiome, environmental characteristics and asthma among junior high school students in Johor Bahru, Malaysia. Environ. Int. 2020, 138, 105664. [Google Scholar] [CrossRef] [PubMed]
  6. Yang, J.; Kim, Y.K.; Kang, T.S.; Jee, Y.K.; Kim, Y.Y. Importance of indoor dust biological ultrafine particles in the pathogenesis of chronic inflammatory lung diseases. Environ. Health Toxicol. 2017, 32, e2017021. [Google Scholar] [CrossRef] [PubMed] [Green Version]
  7. Meadow, J.F.; Altrichter, A.E.; Kembel, S.W.; Moriyama, M.; O’Connor, T.K.; Womack, A.M.; Brown, G.Z.; Green, J.L.; Bohannan, B.J. Bacterial communities on classroom surfaces vary with human contact. Microbiome 2014, 2, 7. [Google Scholar] [CrossRef] [PubMed] [Green Version]
  8. Bradbeer, S.J.; Coughlan, N.E.; Cuthbert, R.N.; Crane, K.; Dick, J.T.A.; Caffrey, J.M.; Lucy, F.E.; Renals, T.; Davis, E.; Warren, D.A.; et al. The effectiveness of disinfectant and steam exposure treatments to prevent the spread of the highly invasive killer shrimp, Dikerogammarus villosus. Sci. Rep. 2020, 10, 1919. [Google Scholar] [CrossRef]
  9. Ríos-Castillo, A.G.; González-Rivas, F.; Rodríguez-Jerez, J.J. Bactericidal efficacy of hydrogen peroxide-based disinfectants against gram-positive and gram-negative bacteria on stainless steel surfaces. Int. J. Food Sci. 2017, 82, 2351–2356. [Google Scholar] [CrossRef]
  10. Tuladhar, E.; Hazeleger, W.C.; Koopmans, M.; Zwietering, M.H.; Beumer, R.R.; Duizer, E. Residual viral and bacterial contamination of surfaces after cleaning and disinfection. Appl. Environ. Microbiol. 2012, 78, 7769–7775. [Google Scholar] [CrossRef] [Green Version]
  11. Meade, E.; Garvey, M. Efficacy testing of novel chemical disinfectants on clinically relevant microbial pathogens. Am. J. Infect. Control 2018, 46, 44–49. [Google Scholar] [CrossRef]
  12. Nasr, G.G.; Whitehead, A.Y.; Yule, A.J. Fine sprays for disinfection within healthcare. Int. J. Multiphys. 2012, 6, 149–166. [Google Scholar] [CrossRef] [Green Version]
  13. Van Niekerk, J.M.; Mavuso, Z.S. Evaluation of ultra-low volume (ULV) fungicide applications for the control of diseases on avocado fruit–Results from the 2009/10 season. S. Afr. Avocado Grow. Assoc. Yearb. 2011, 34, 71–76. [Google Scholar]
  14. Farajollahi, A.; Healy, S.P.; Unlu, I.; Gaugler, R.; Fonseca, D.M. Effectiveness of ultra-low volume nighttime applications of an adulticide against diurnal Aedes albopictus, a critical vector of dengue and chikungunya viruses. PLoS ONE 2012, 7, e49181. [Google Scholar] [CrossRef] [PubMed] [Green Version]
  15. Dunowska, M.; Morley, P.S.; Hyatt, D.R. The effect of Virkon S fogging on survival of Salmonella enterica and Staphylococcus aureus on surfaces in a veterinary teaching hospital. Vet. Microbiol. 2005, 105, 281–289. [Google Scholar] [CrossRef]
  16. Zou, S.; Guo, J.; Gao, R.; Dong, L.; Zhou, J.; Zhang, Y.; Dong, J.; Bo, H.; Qin, K.; Shu, Y. Inactivation of the Novel Avian Influenza A (H7N9) virus under physical conditions or chemical agents treatment. Virol. J. 2013, 10, 289. [Google Scholar] [CrossRef] [PubMed] [Green Version]
  17. Rutala, W.A.; Weber, D.J. The Healthcare Infection Control Practices Advisory Committee (HICPAC). Guideline for Disinfection and Sterilization in Healthcare Facilities, 2008; C.D.C.: Atlanta, GA, USA, 2008.
  18. Gholami-ahangaran, M.; Shahzamani, S.; Yazdkhasti, M. Comparison of Virkon S® and formaldehyde on hatchability and survival rate of chicks in disinfection of fertile eggs. Rev. Méd. Vét. 2016, 167, 45–49. [Google Scholar]
  19. Joshi, S.D.; Memon, I.; Shaikh, T.; Khan, I.; Samanta, S. Evaluation study for determination of quantities of disinfectant solution used for fogging of clean rooms with respect to area volume. Int. J. Basic Appl. Res. 2019, 9, 507–512. [Google Scholar]
  20. World Health Organization (WHO). Cleaning and Disinfection of Environmental Surfaces in the Context of COVID-19; WHO: Geneva, Switzerland, 2020. [Google Scholar]
  21. Sousan, S.; Koehler, K.; Hallett, L.; Peters, T.M. Evaluation of the Alphasense optical particle counter (OPC-N2) and the Grimm portable aerosol spectrometer (PAS-1.108). Aerosol Sci. Technol. 2016, 50, 1352–1365. [Google Scholar] [CrossRef] [PubMed]
  22. Gołofit-Szymczak, M.; Stobnicka-Kupiec, A.; Górny, R.L. Impact of air-conditioning system disinfection on microbial contamination of passenger cars. Air Qual. Atmos. Health 2019, 12, 1127–1135. [Google Scholar] [CrossRef] [Green Version]
  23. Liu, X.; Wang, H.; Wang, B.; Pan, L. High-level extracellular protein expression in Bacillus subtilis by optimizing strong promoters based on the transcriptome of Bacillus subtilis and Bacillus megaterium. Protein Expr. Purif. 2018, 151, 72–77. [Google Scholar] [CrossRef]
  24. Sutton, S. Determination of inoculum for microbiological testing. J. GXP Compliance 2011, 15, 49. [Google Scholar]
  25. Rutala, W.A.; Gergen, M.F.; Weber, D.J. Efficacy of different cleaning and disinfection methods against Clostridium difficile spores: Importance of physical removal versus sporicidal inactivation. Infect. Control Hosp. Epidemiol. 2012, 33, 1255–1258. [Google Scholar] [CrossRef] [PubMed] [Green Version]
  26. Herńndez, A.; Martró, E.; Matas, L.; Martín, M.; Ausina, V. Assessment of in-vitro efficacy of 1% Virkon against bacteria, fungi, viruses and spores by means of AFNOR guidelines. J. Hosp. Infect. 2000, 46, 203–209. [Google Scholar]
  27. Jones, C.L. Guidelines for the assessment of viable fungal hygiene on indoor surfaces using RODAC petri plates. J. Bacteriol. Mycol. 2019, 7, 116–126. [Google Scholar]
  28. Islam, M.; Ikeguchi, A.; Naide, T. Concentrations of aerosol numbers and airborne bacteria, and temperature and relative humidity, and their interrelationships in a tie-stall dairy barn. Animals 2019, 9, 1023. [Google Scholar] [CrossRef] [Green Version]
  29. Baş, D.; Boyacı, I.H. Modeling and optimization I: Usability of response surface methodology. J. Food Eng. 2007, 78, 836–845. [Google Scholar] [CrossRef]
  30. Huh, D.A.; Chae, W.R.; Lim, H.L.; Kim, J.H.; Kim, Y.S.; Kim, Y.W.; Moon, K.W. Optimizing operating parameters of high-temperature steam for disinfecting total nematodes and bacteria in soil: Application of the Box-Behnken design. Int. J. Environ. Res. Public Health 2020, 17, 5029. [Google Scholar] [CrossRef]
  31. Biesta-Peters, E.G.; Reij, M.W.; Joosten, H.; Gorris, L.G.; Zwietering, M.H. Comparison of two optical-density-based methods and a plate count method for estimation of growth parameters of bacillus cereus. Appl. Environ. Microbiol. 2010, 76, 1399–1405. [Google Scholar] [CrossRef] [PubMed] [Green Version]
  32. Wu, L.Y.; Yick, K.; Ng, S.-P.; Yip, J. Application of the Box-Behnken design to the optimization of process parameters in foam cup molding. Expert Syst. Appl. 2012, 39, 8059–8065. [Google Scholar] [CrossRef]
  33. Khataee, A.R.Z.; Zarei, M.; Moradkhannejhad, L. Application of response surface methodology for optimization of azo dye removal by oxalate catalyzed photoelectro-fenton process using carbon nanotube-PTFE cathode. Desalination 2010, 258, 112–119. [Google Scholar] [CrossRef]
  34. Roth, K.; Michels, W. Inter-hospital trials to determine minimal cleaning performance according to the guideline by DGKH, DGSV and AKI. Zentr Steril. 2005, 13, 106–116. [Google Scholar]
  35. Clark, J.; Barrett, S.P.; Rogers, M.; Stapleton, R. Efficacy of super-oxidized water fogging in environmental decontamination. J. Hosp. Infect. 2006, 64, 386–390. [Google Scholar] [CrossRef] [PubMed]
  36. Soohoo, J.; Daniels, J.B.; Brault, S.A.; Rosychuk, R.A.; Schissler, J.R. Efficacy of three disinfectant formulations and a hydrogen peroxide/silver fogging system on surfaces experimentally inoculated with meticillin-resistant Staphylococcus pseudintermedius. Vet. Dermatol. 2020, 31, 350-e91. [Google Scholar] [CrossRef] [PubMed]
  37. Krishnan, J.; Fey, G.; Stansfield, C.; Landry, L.; Nguy, H.; Klassen, S.; Robertson, C. Evaluation of a dry fogging system for laboratory decontamination. Appl. Biosaf. 2012, 17, 132–141. [Google Scholar] [CrossRef]
  38. Møretrø, T.; Vestby, L.K.; Nesse, L.L.; Storheim, S.E.; Kotlarz, K.; Langsrud, S. Evaluation of efficacy of disinfectants against Salmonella from the feed industry. J. Appl. Microbiol. 2009, 106, 1005–1012. [Google Scholar] [CrossRef] [PubMed]
Figure 1. The ULV sprayer DH-FOG30′s picture and specification.
Applsci 11 03713 g001
Figure 2. Flow-chart of the experiments.
Applsci 11 03713 g002
Figure 3. Schematic diagram of locations where total bacteria was seeded in the classroom.
Applsci 11 03713 g003
Figure 4. Variation of three different sizes of PM fractions after spraying with ULV sprayer: (a) variation of PM10, PM2.5, and PM1.0 after dispensing using a ULV sprayer when the spray amount was 2 L in 230 m3, (b) variation of PM10, PM2.5, and PM1.0 after dispensing using a ULV sprayer when the spray amount was 5 L in 230 m3, and (c) variation of PM10, PM2.5, and PM1.0 after dispensing using a ULV sprayer when the spray amount was 8 L in 230 m3.
Applsci 11 03713 g004
Figure 5. Disinfection efficiency (log10 units) of total bacteria on indoor surfaces by locations and time after spraying.
Applsci 11 03713 g005
Figure 6. Response surface plots presenting the interaction effects of three variables on the average total bacteria disinfection efficiency: (a) surface plot showing the effect of disinfectant concentration and spray amount on the average disinfection efficiency, (b) surface plot showing the effect of disinfectant concentration and room size on the average disinfection efficiency, and (c) surface plot showing the effect of spray amount and room size on the average disinfection efficiency.
Applsci 11 03713 g006
Figure 7. Overlay plot of the disinfectant concentration and spray amount on the disinfection efficiency at each point when the room size is 160 m3.
Applsci 11 03713 g007
Figure 8. Overlay plot of the disinfectant concentration and spray amount on the disinfection efficiency at each point when the room size is 230 m3.
Applsci 11 03713 g008
Figure 9. Overlay plot of the disinfectant concentration and spray amount on the disinfection efficiency at each point when the room size is 300 m3.
Applsci 11 03713 g009
Table 1. Disinfection efficiency (log10 units) and standard deviation for total bacteria on indoor surfaces by the single treatment of disinfectant concentration, spray amount, and room size.
TreatmentValueLocations
111111
Disinfectant concentration (times) 2501.50 (0.006) *1.65 (0.004) *5.00 (0.000) *1.24 (0.010) *1.65 (0.004) *1.52 (0.002) *
1001.41 (0.017) *1.27 (0.010) *2.46 (0.002) *1.21 (0.009) *0.93 (0.039) *1.42 (0.008) *
2001.22 (0.032) *0.96 (0.032) *1.46 (0.014) *0.64 (0.023) *0.88 (0.029) *0.96 (0.013) *
Spray amount (L) 321.25 (0.012) *1.08 (0.012) *2.01 (0.004) *1.12 (0.025) *0.95 (0.036)1.23 (0.015) *
51.71 (0.020) *1.27 (0.010) *2.46 (0.002) *1.21 (0.015) *0.93 (0.012)1.42 (0.009) *
81.93 (0.008) *1.63 (0.012) *5.00 (0.000) *1.35 (0.012) *1.34 (0.009)1.90 (0.003) *
Room size (m3) 41601.29 (0.032) *5.00 (0.000) *1.72 (0.008)1.38 (0.015) *2.63 (0.001) *2.51 (0.002) *
2301.45 (0.013) *1.27 (0.008) *2.45 (0.002)1.21 (0.009) *0.93 (0.024) *1.42 (0.009) *
3001.45 (0.011) *0.68 (0.016) *1.46 (0.019)0.87 (0.025) *0.92 (0.016) *0.96 (0.008) *
1 Results are presented as CFU recovered per sample. The numbers are averages from duplicate cultures of triplicate experiments. 2 Experiments that verified the disinfection efficiency depending on the disinfection concentrations were conducted at 5 L of spray amount in a room size of 230 m3. 3 Experiments that verified the disinfection efficiency depending on spray amounts were conducted at 100 times of disinfection concentration in a room size of 230 m3. 4 Experiments that verified the disinfection efficiency depending on room size were conducted at 100 times of disinfection concentration and the spray amount of 5 L. * p < 0.01.
Table 2. Box–Behnken design with the experimental values and disinfection efficiency for the total bacteria in each experiment.
Run.VariablesTotal Bacteria DE 1 (%)
Disinfectant Concentration (Times)Spray Amount (L)Room Size (m3)222222Average
110021601.181.135.001.56 1.20 1.51 1.36
210081602.725.001.801.67 3.40 1.28 1.81
310052302.431.195.001.07 1.25 1.77 1.42
420082302.211.261.731.80 2.20 1.52 1.66
55053000.930.865.000.92 1.45 2.46 1.16
620051600.770.661.861.05 2.60 5.00 1.08
720022301.060.752.150.76 0.69 1.30 0.93
810023001.701.205.001.13 0.80 1.03 1.17
920053001.470.801.320.79 1.04 2.57 1.08
1010052301.611.352.261.35 1.25 1.56 1.47
115022301.501.115.001.69 1.35 1.49 1.46
1210052301.341.483.221.35 1.34 1.57 1.49
135082301.45 1.33 5.00 1.62 1.59 1.72 1.60
1410083001.68 1.93 2.21 1.99 2.23 2.21 1.99
155051601.74 1.41 3.10 1.22 1.92 1.95 1.63
1 DE: disinfection efficiency. 2 ①–⑥ refers to areas where the total bacteria were seeded.
Table 3. Analysis of the models and regression coefficients for the disinfection efficiency for total bacteria at all locations.
Sources 1222222Average
βSEp-ValueβSEp-ValueβSEp-ValueβSEp-ValueβSEp-ValueβSEp-ValueβSEp-Value
Model 0.004 0.003 0.162 0.045 0.002 0.011 <0.001
Lack-of-fit 0.895 0.387 0.064 0.397 0.073 0.218 0.135
Constants97.550.86<0.00195.241.10<0.00199.800.53<0.00194.221.59<0.00194.740.91<0.00197.620.54<0.00196.530.32<0.001
X1−1.160.530.079−3.860.670.002−1.090.330.020−2.700.970.039−2.340.560.009−0.20 0.330.567−1.890.19<0.001
X21.750.530.0213.490.670.004−0.430.330.247 2.810.970.0355.410.56<0.0011.220.330.0152.370.19<0.001
X30.780.530.200−0.460.670.526−0.300.330.404 −2.09 0.970.085−2.640.560.005−0.13 0.330.709−0.810.190.009
X1 2−3.670.770.005−7.110.990.001−0.730.480.188 −3.761.440.0470.18 0.820.8351.610.490.022−2.250.290.001
X2 22.100.770.0422.920.990.0320.290.480.576 3.701.440.050−1.98 0.820.060 −2.520.490.0040.750.290.047
X3 2−2.370.770.028−1.890.990.116−0.640.480.240 −1.24 1.440.4281.55 0.820.1170.34 0.490.521−0.71 0.290.056
X1∙X22.130.770.0352.290.950.062−0.290.460.550 4.041.380.0334.530.790.0020.14 0.470.7742.140.270.001
X1∙X35.890.770.0013.960.950.009−0.870.460.115 −0.28 1.380.848−1.61 0.790.096−0.26 0.470.6061.140.270.009
X2∙X3−1.620.770.081−0.600.950.5560.240.460.618 1.44 1.380.3452.210.790.0382.710.470.0020.730.270.045
R20.96410.96770.81860.90090.97430.94650.9884
Adj. R20.89950.90950.49220.72260.9280 0.85020.9674
Bold: p < 0.05. Adj.: adjusted. SE: standard error. 1 X1 = disinfectant concentration, X2 = spray amount, X3 = room size. 2 ①–⑥ refers to area where the total bacteria were seeded.
Publisher’s Note: MDPI stays neutral with regard to jurisdictional claims in published maps and institutional affiliations.

