
Abrasive Surface Finishing on SLM 316L Parts Fabricated with Recycled Powder

 ,
,  ,
,  ,
,  ,
,  and
and
Abstract
:1. Introduction
2. Experimental Procedure
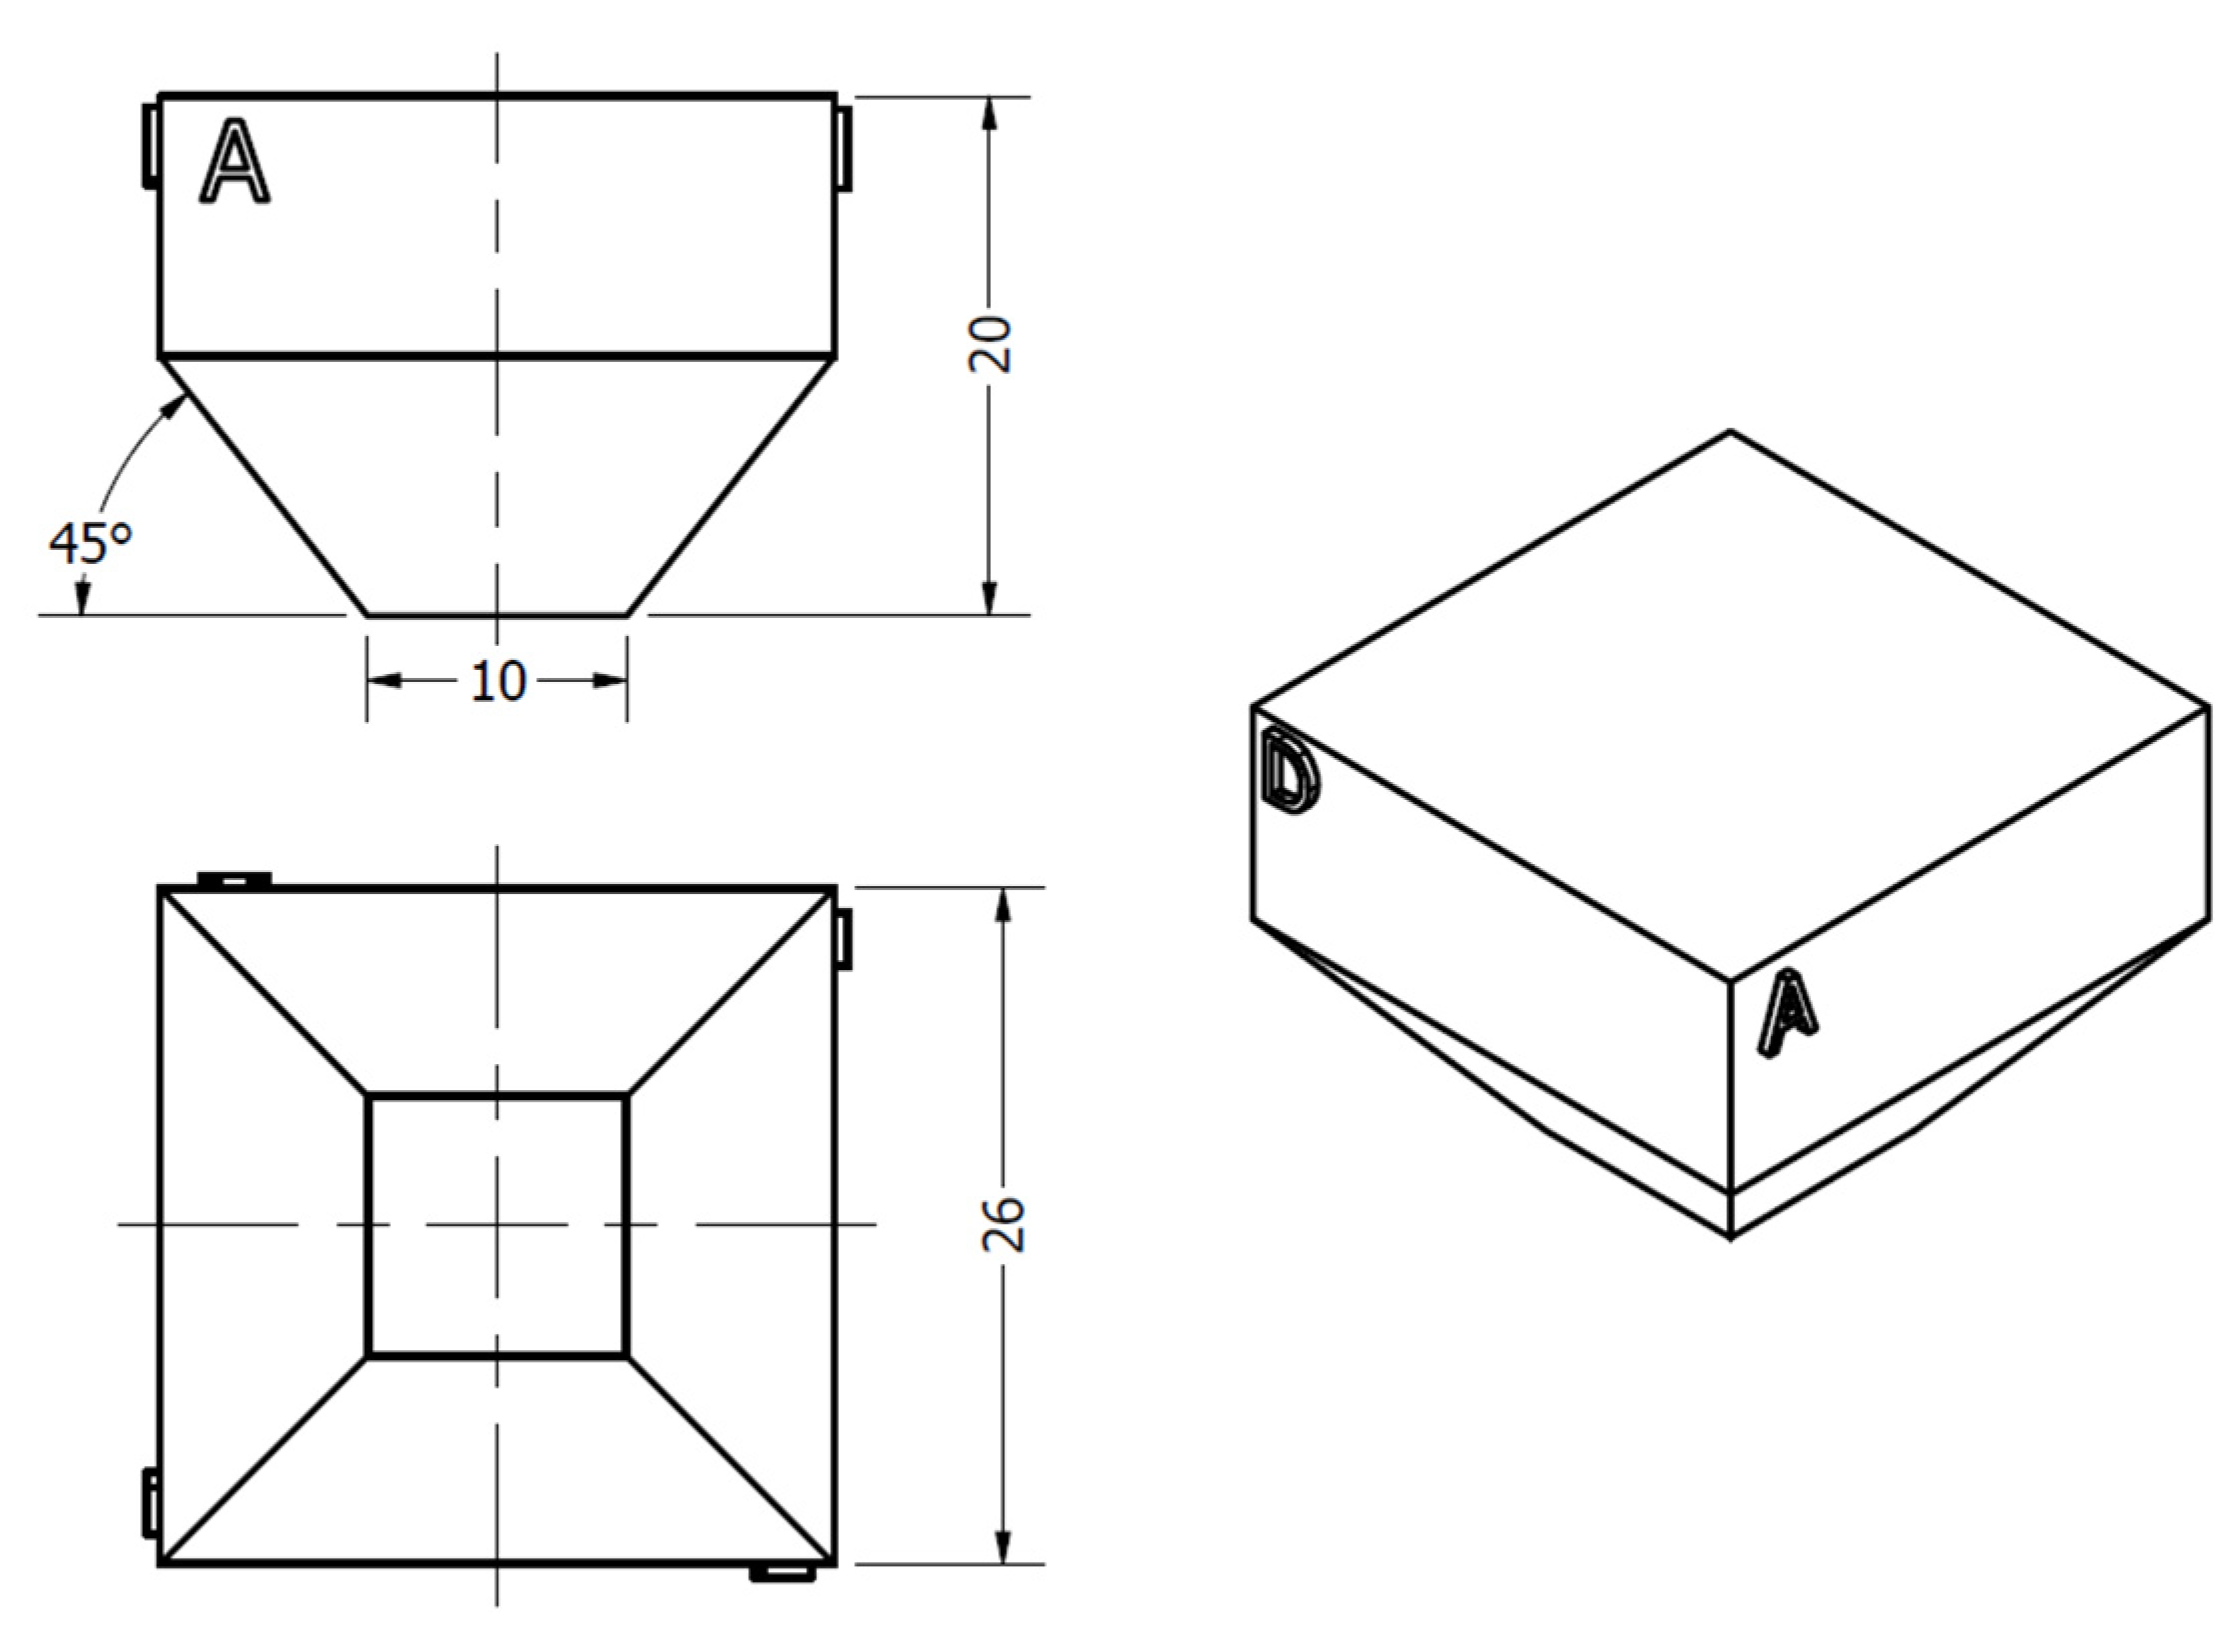
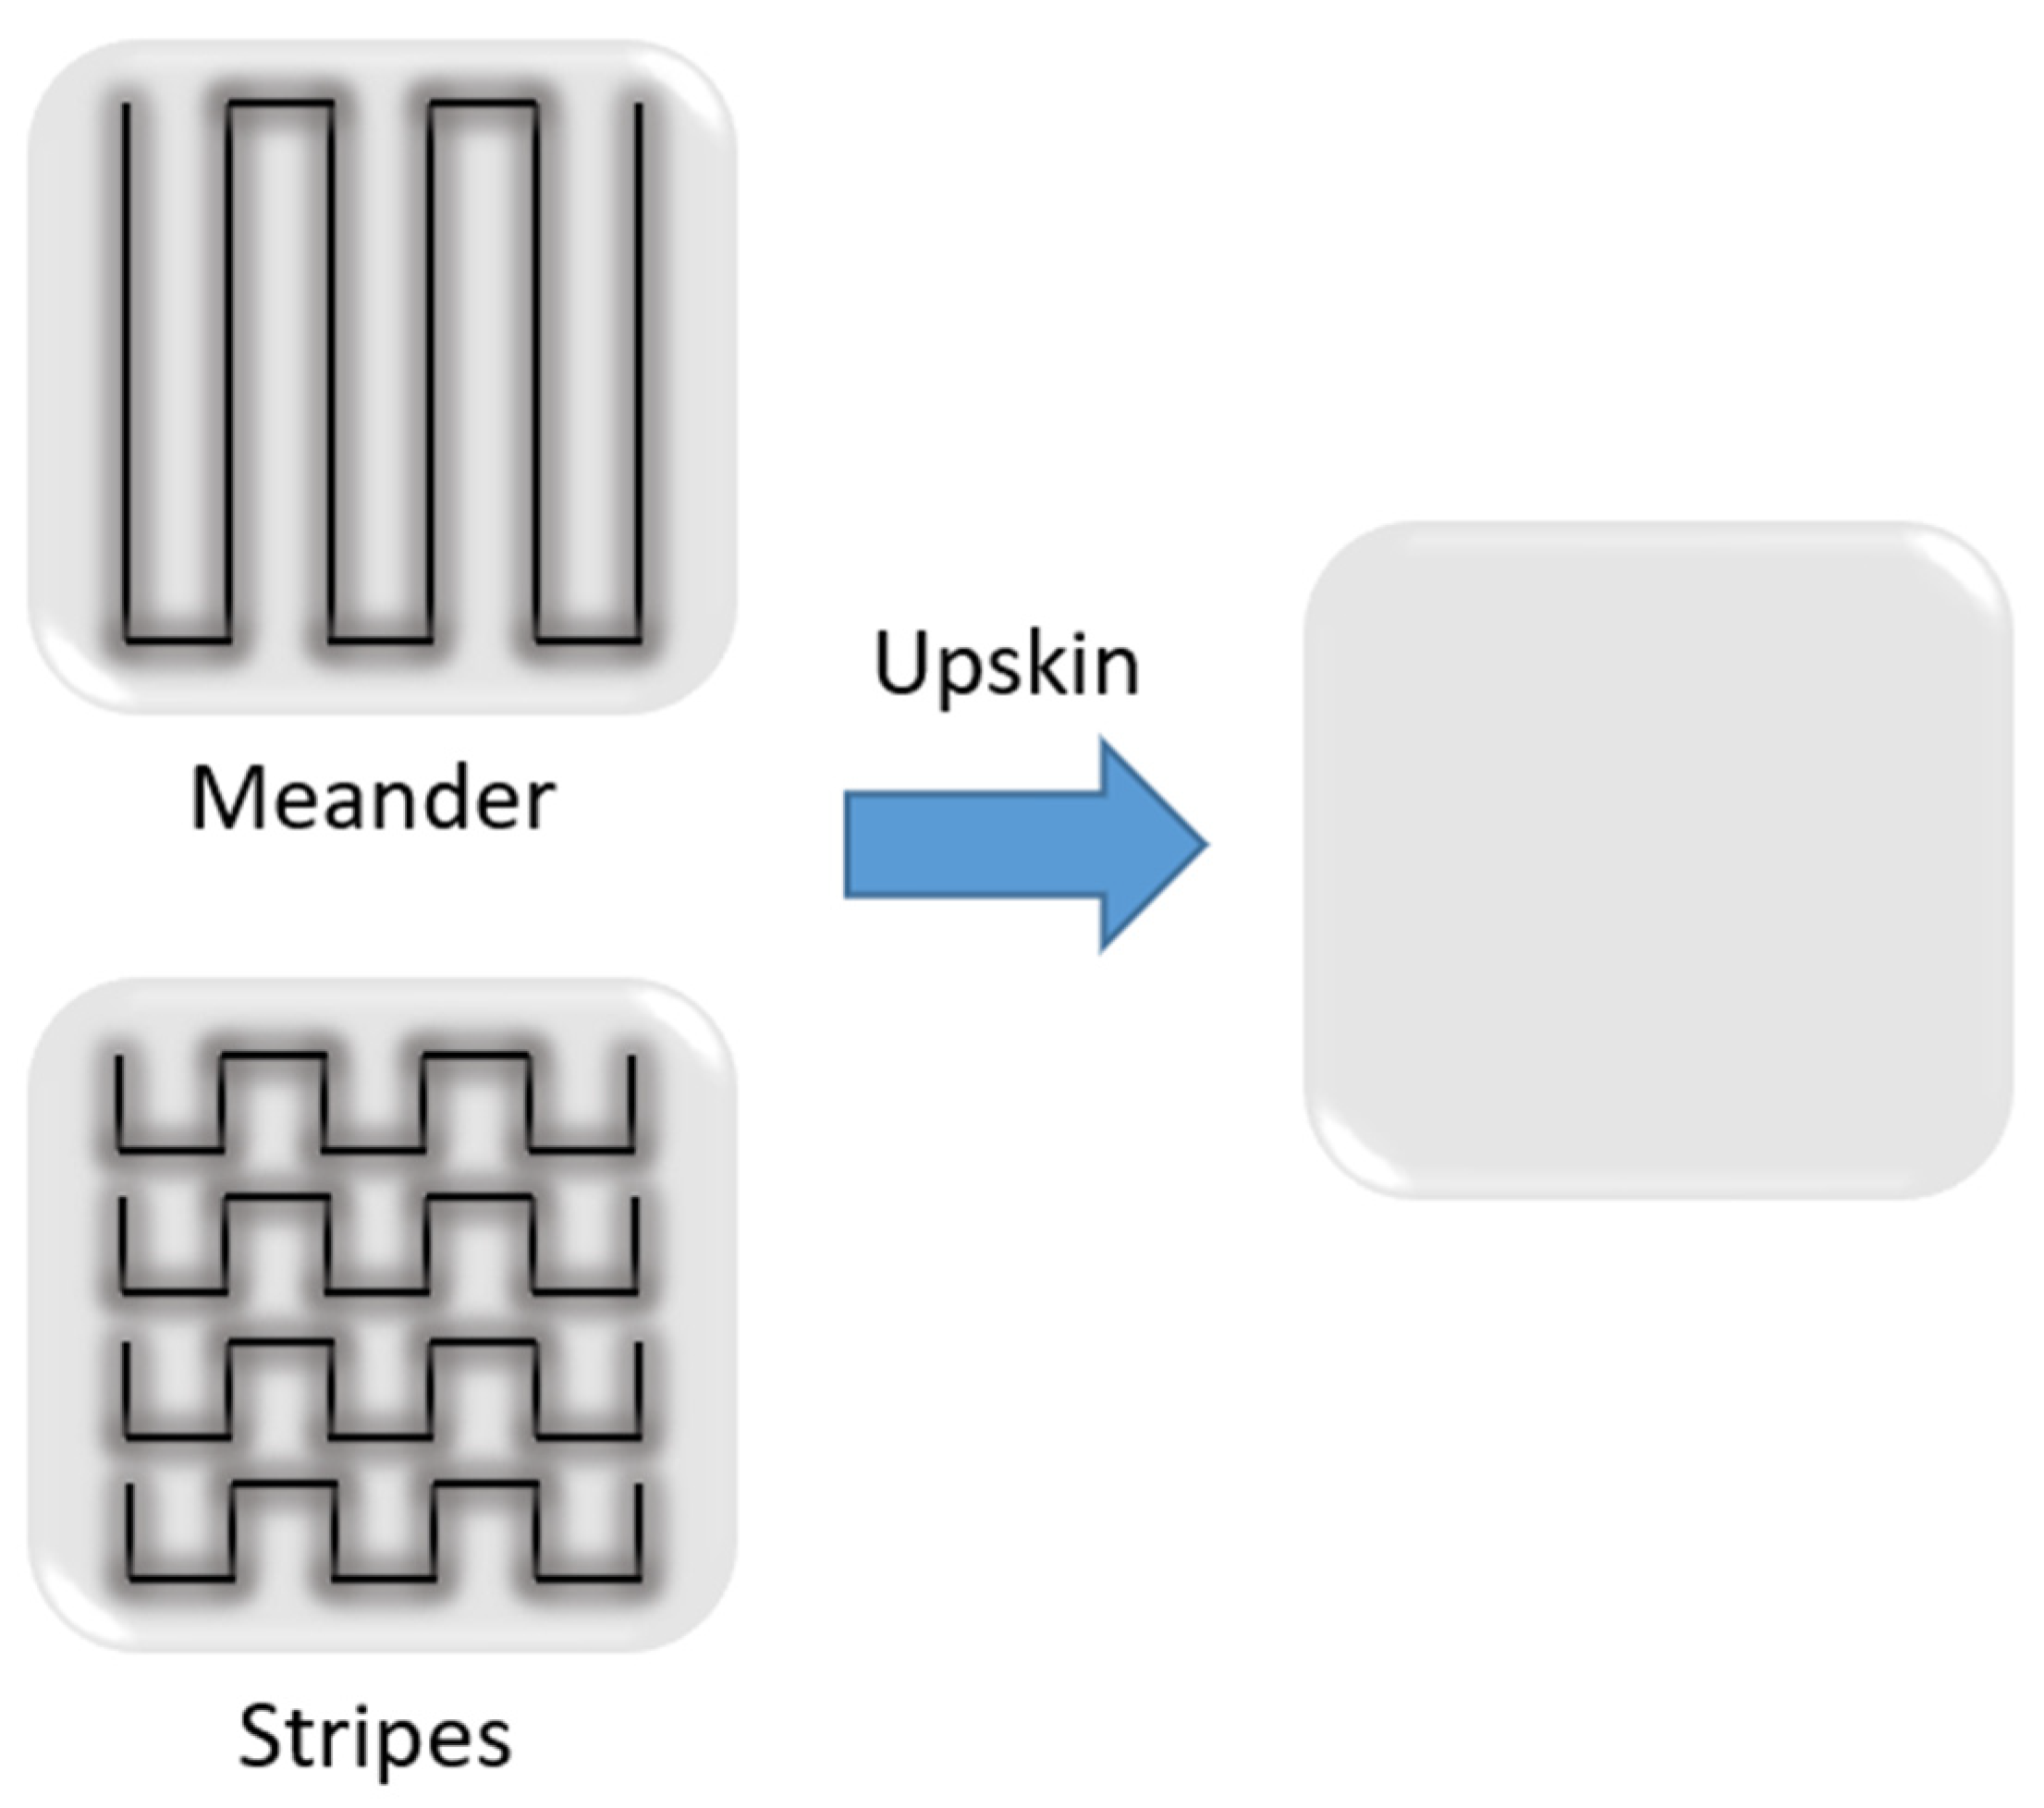
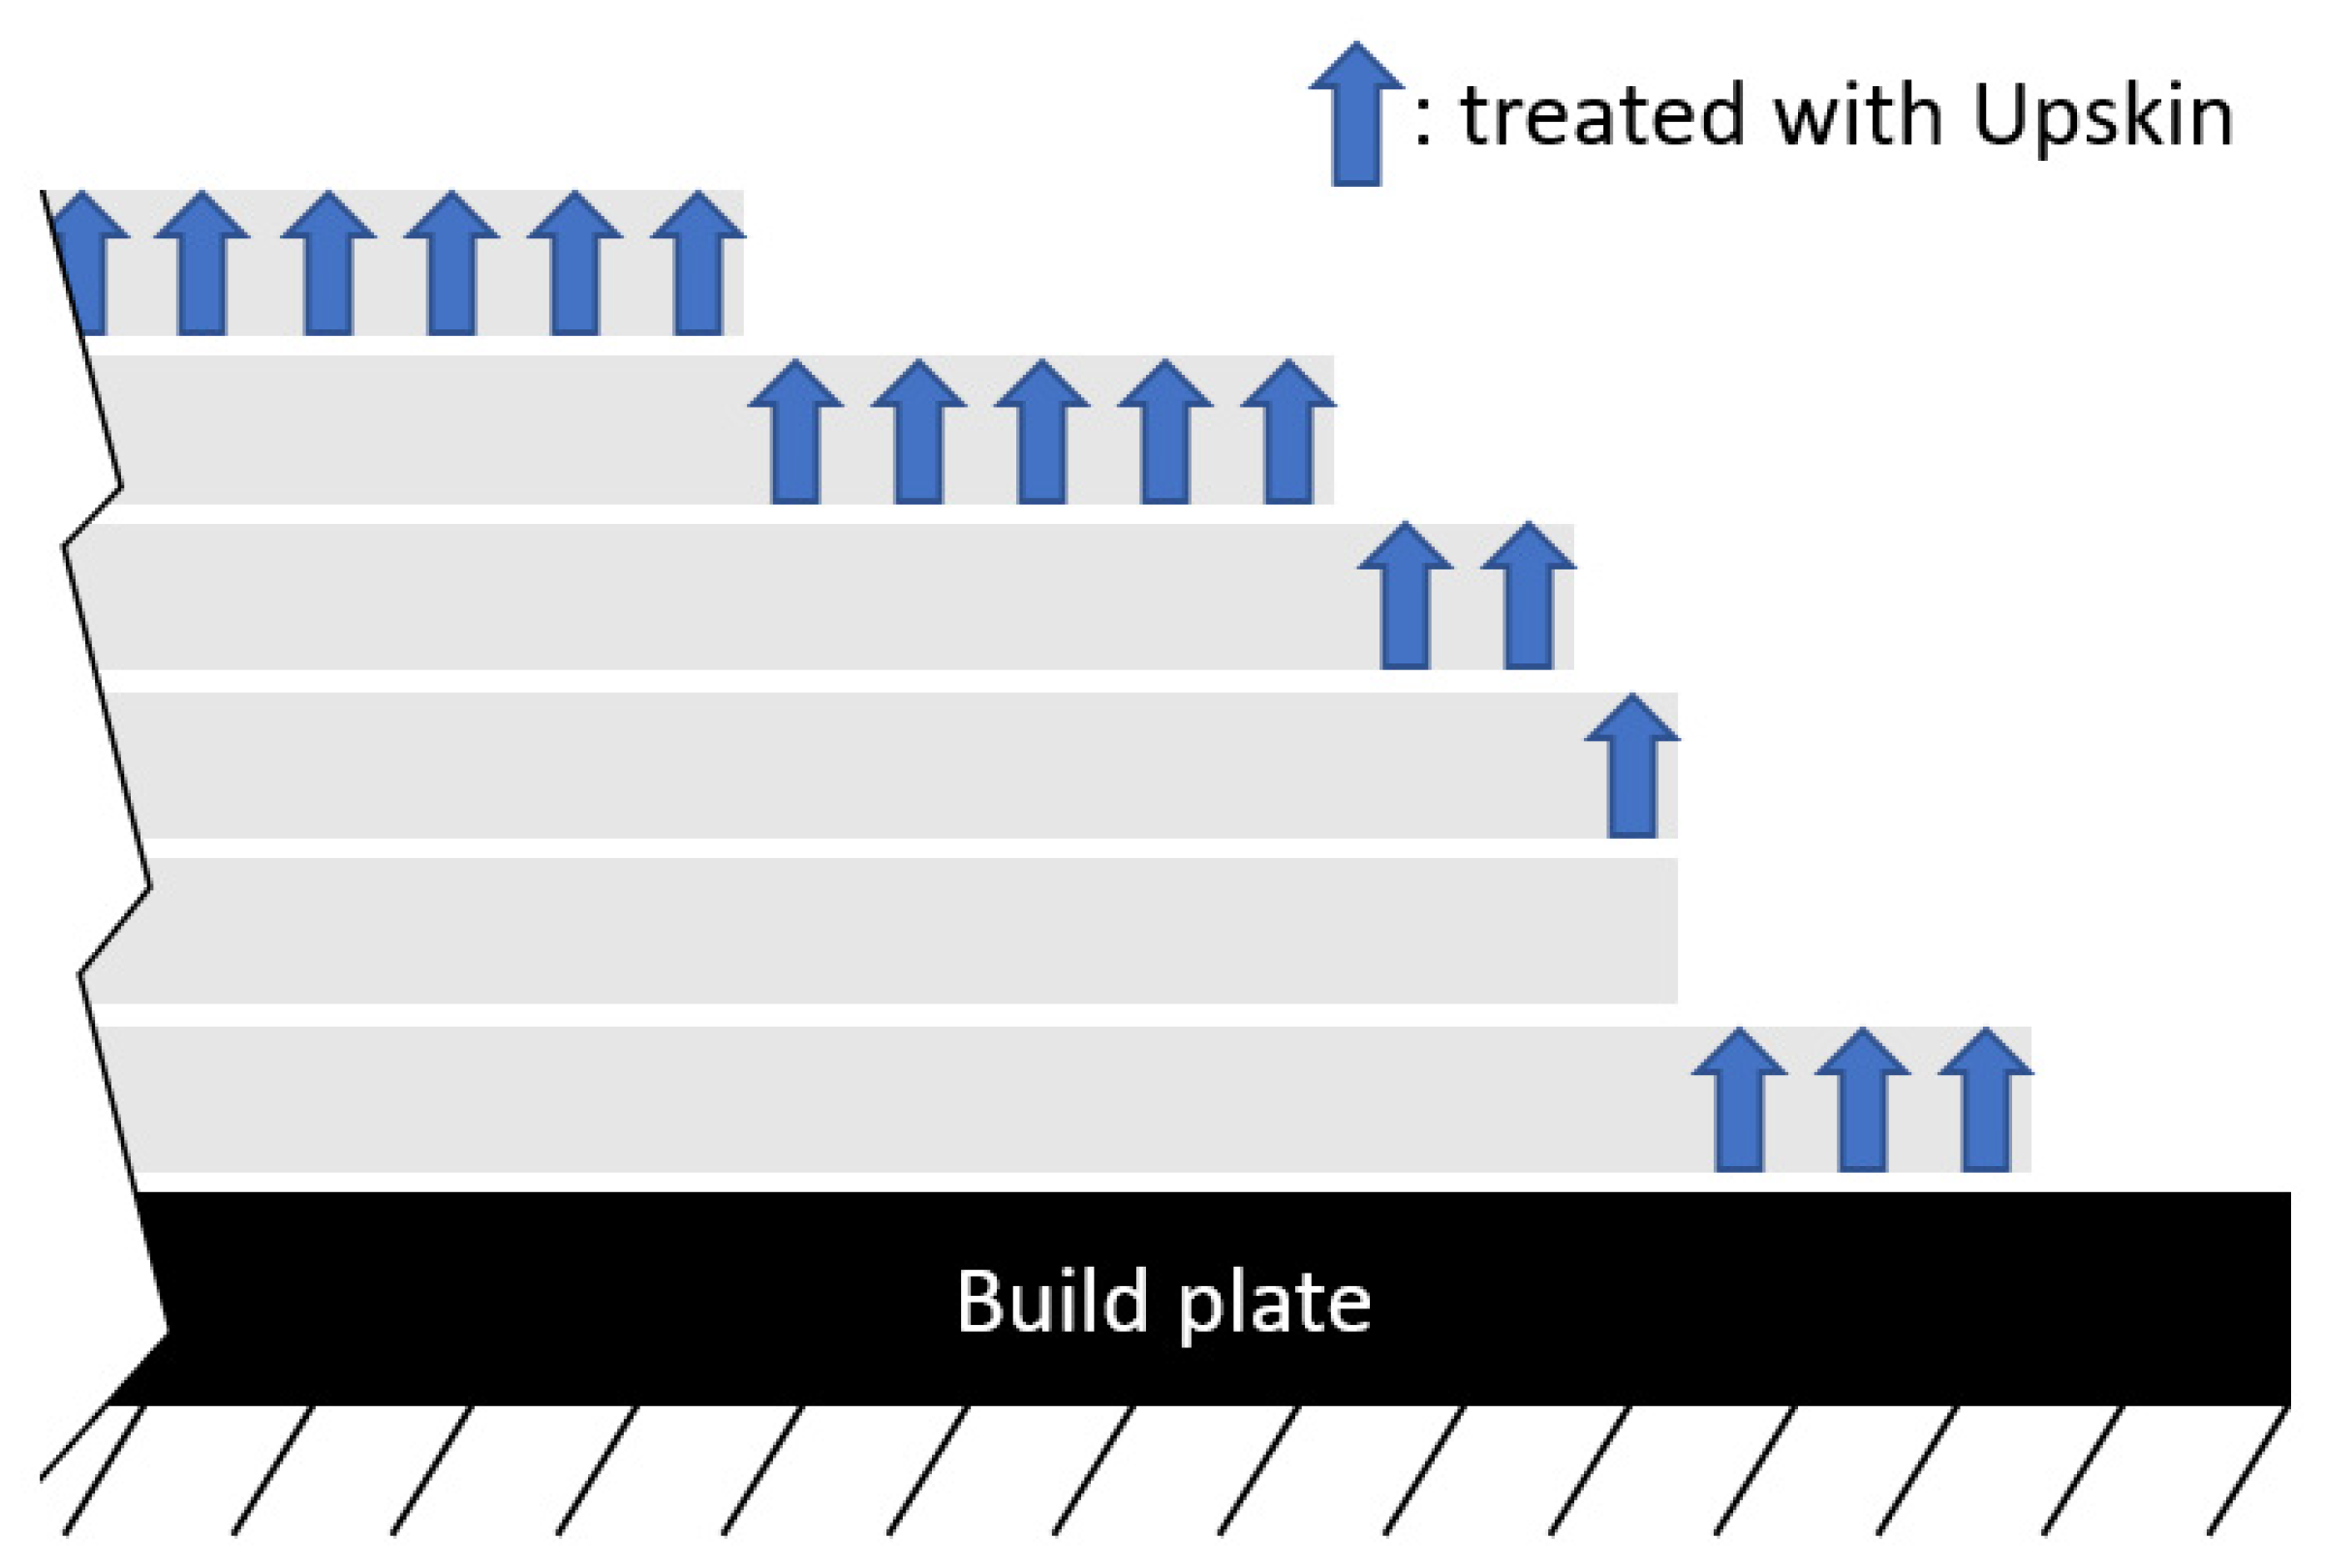
2.1. Specimen Design
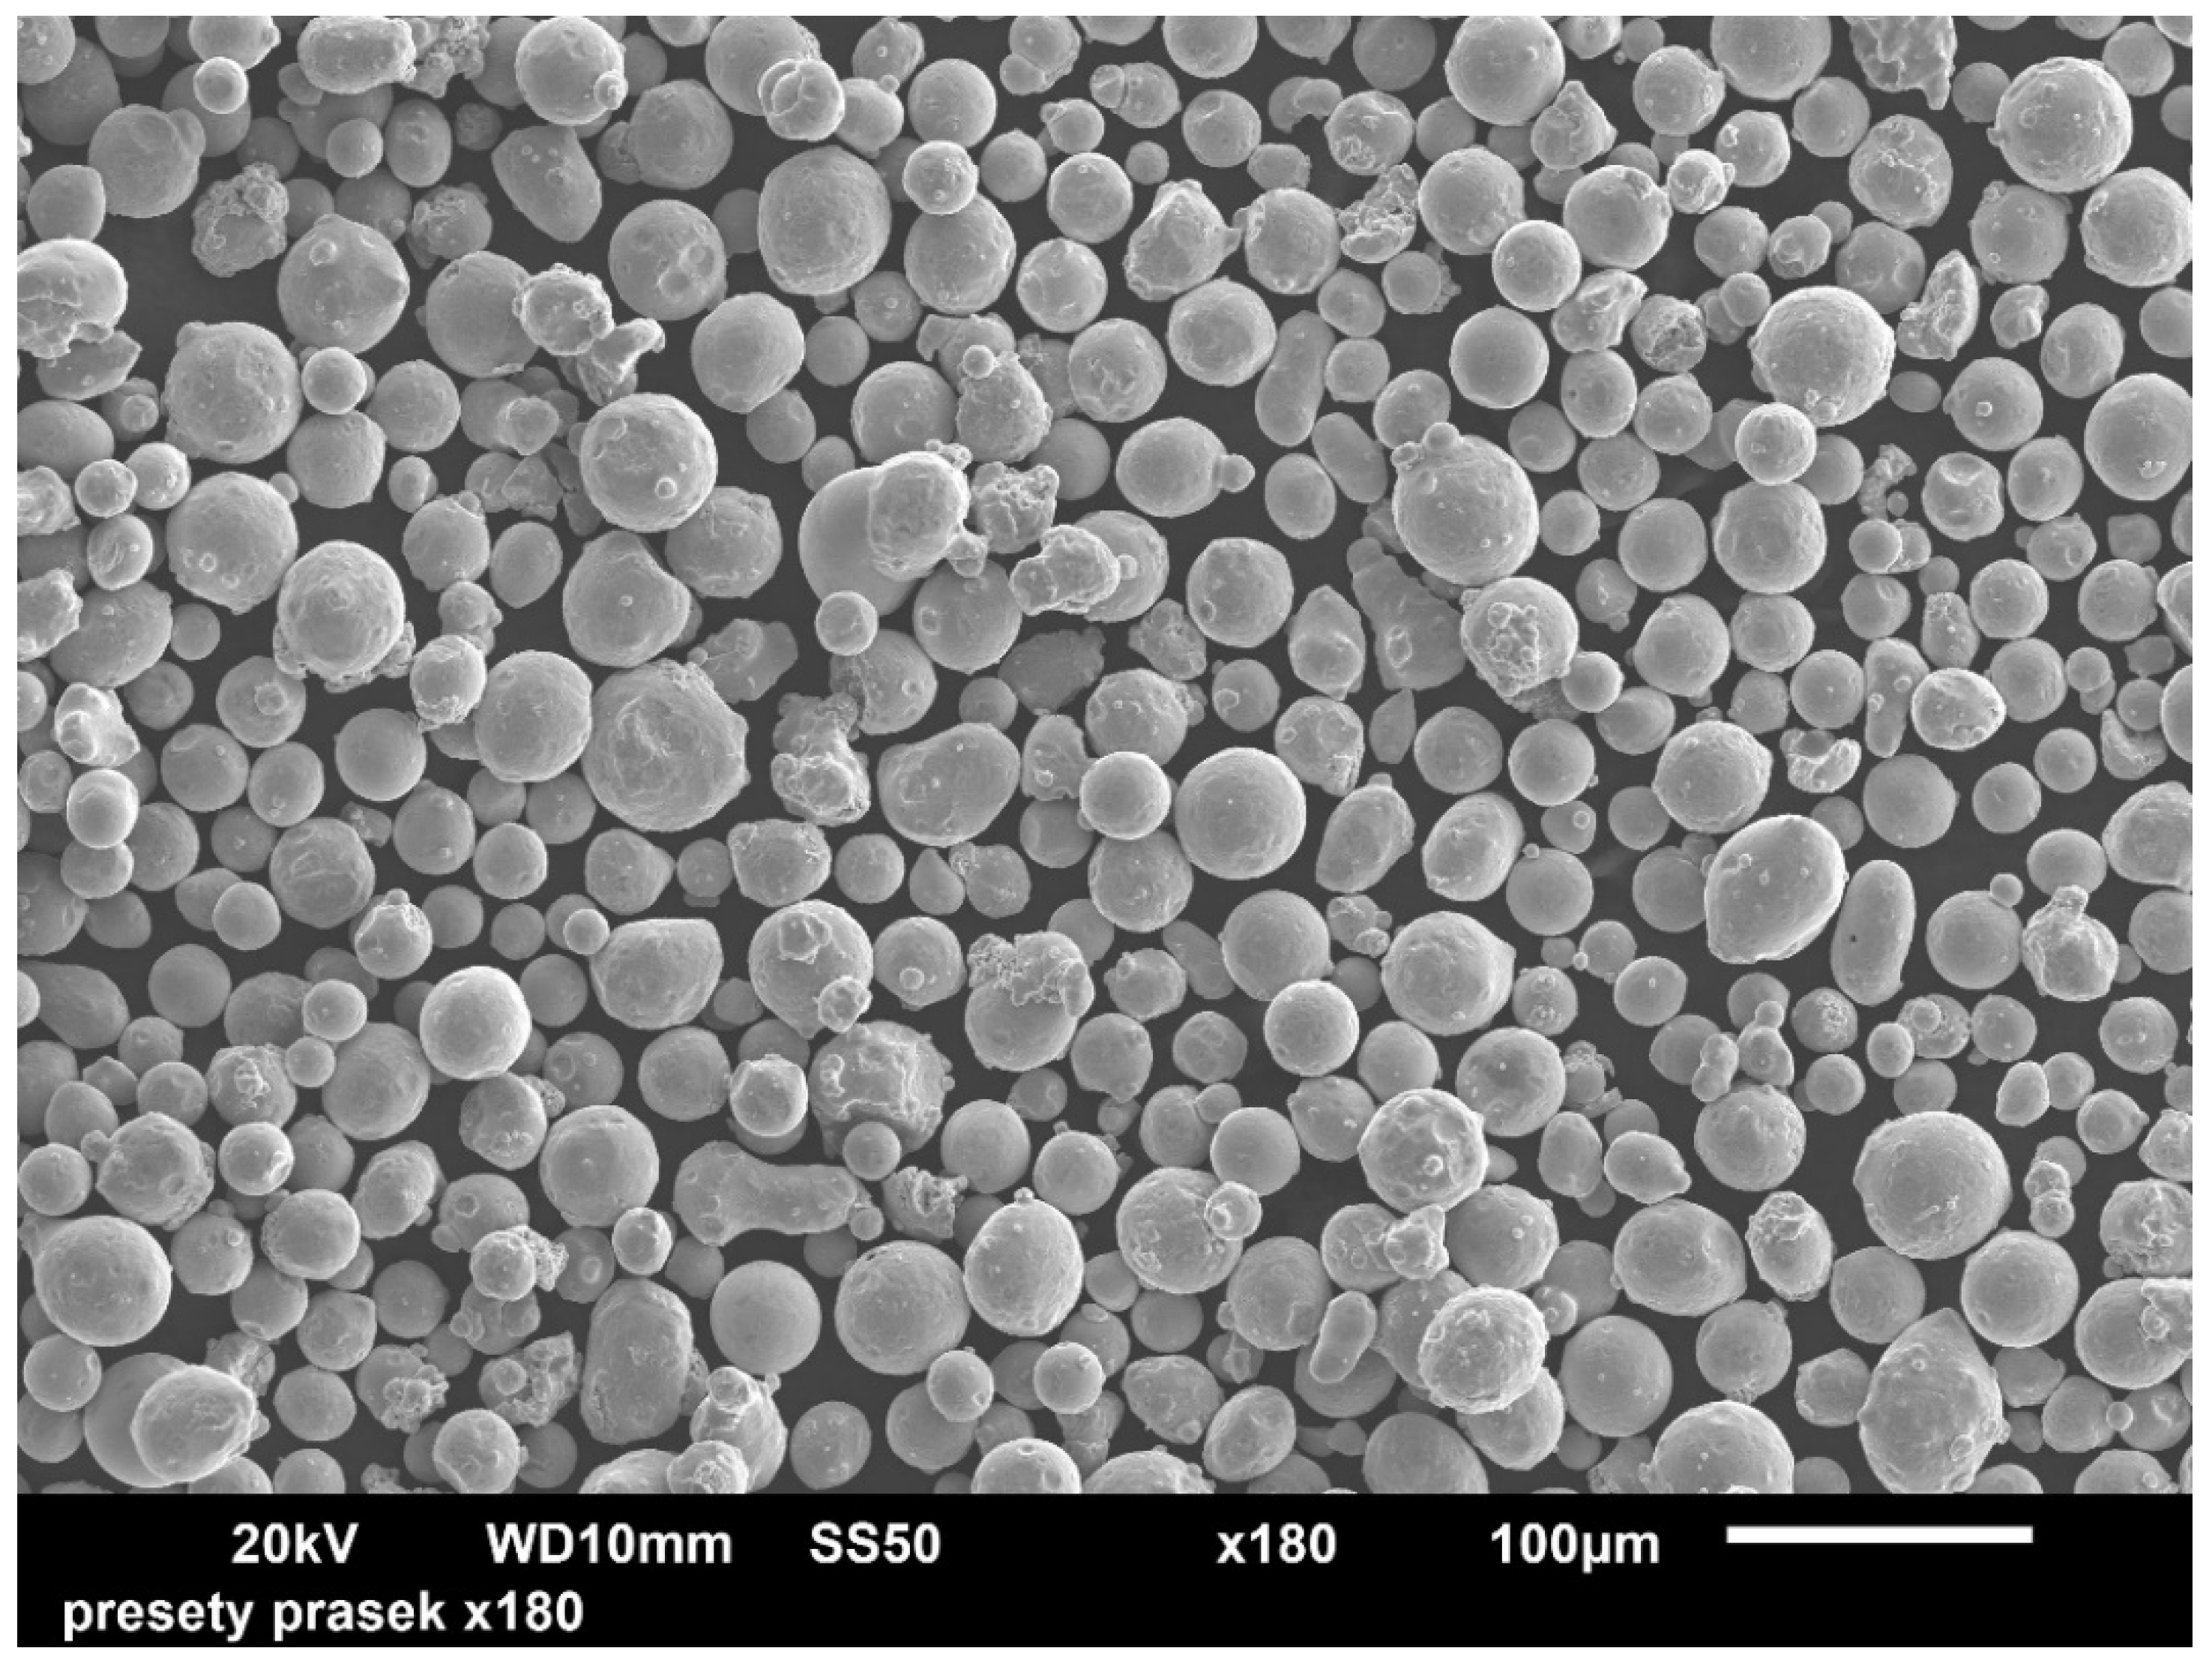
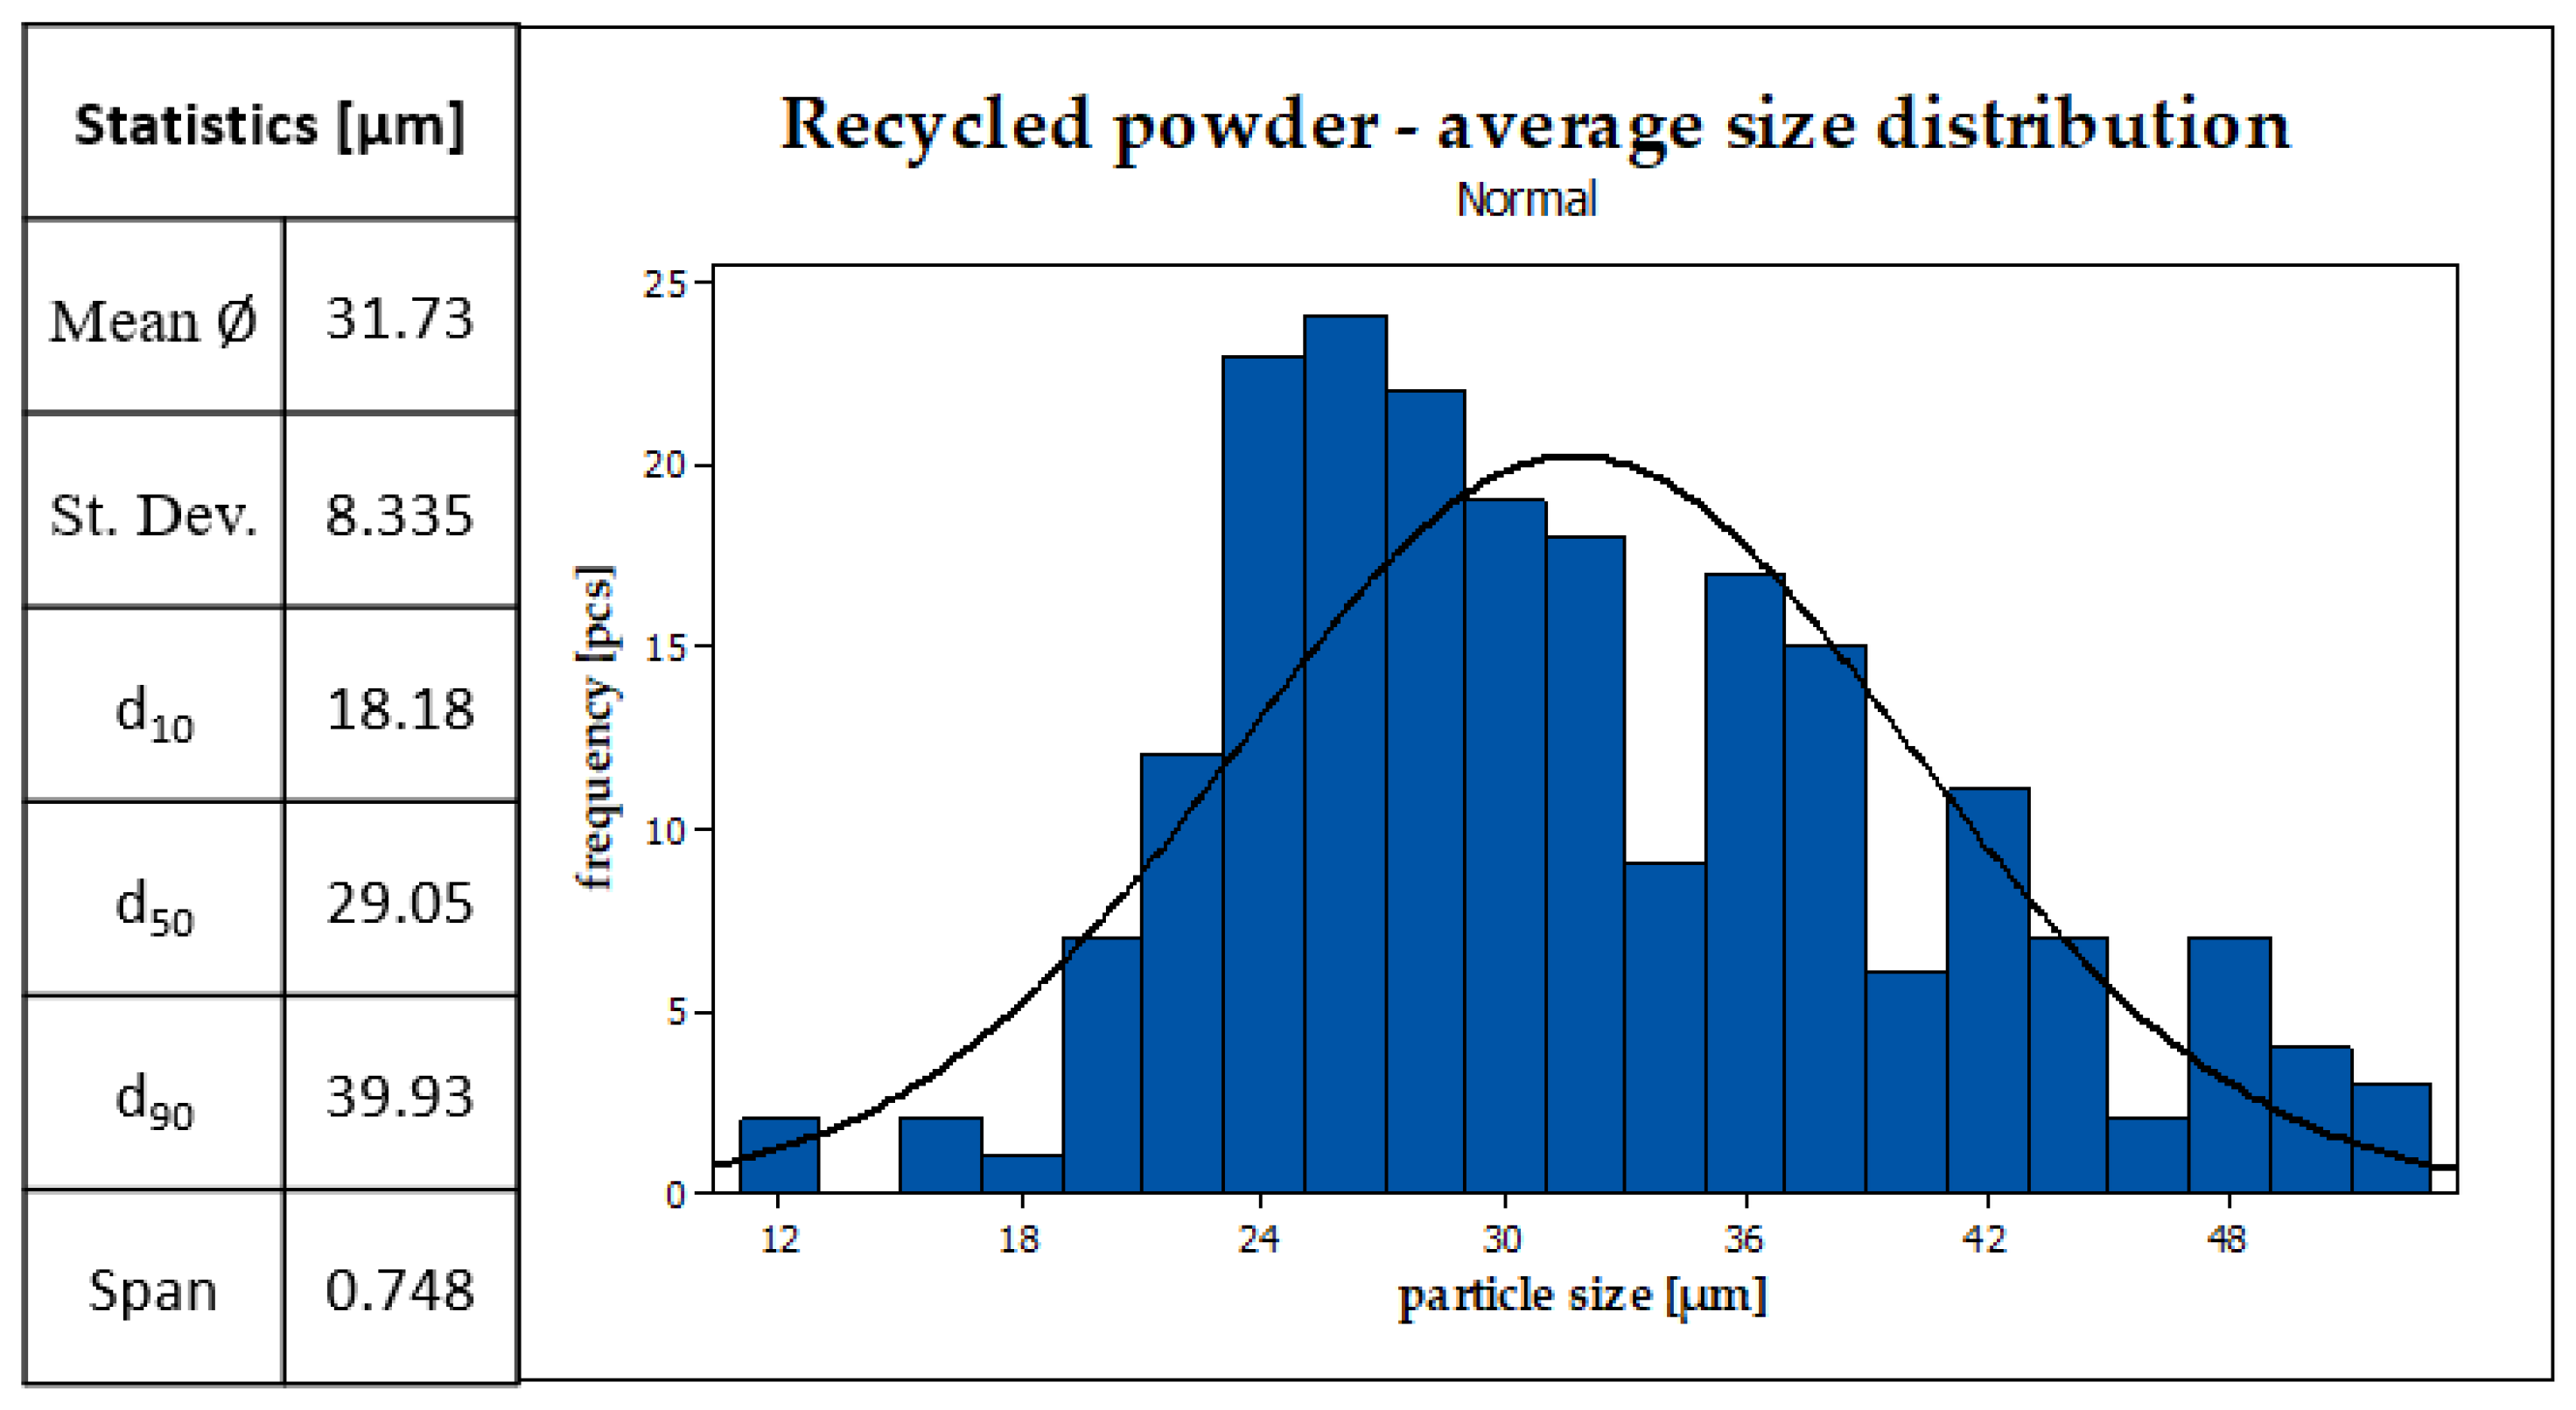
2.2. Recycled Powder Characteristics
2.3. Machine Setup and Important Notes
2.4. 2D and 3D Surface Roughness Measurement
3. Results and Discussion
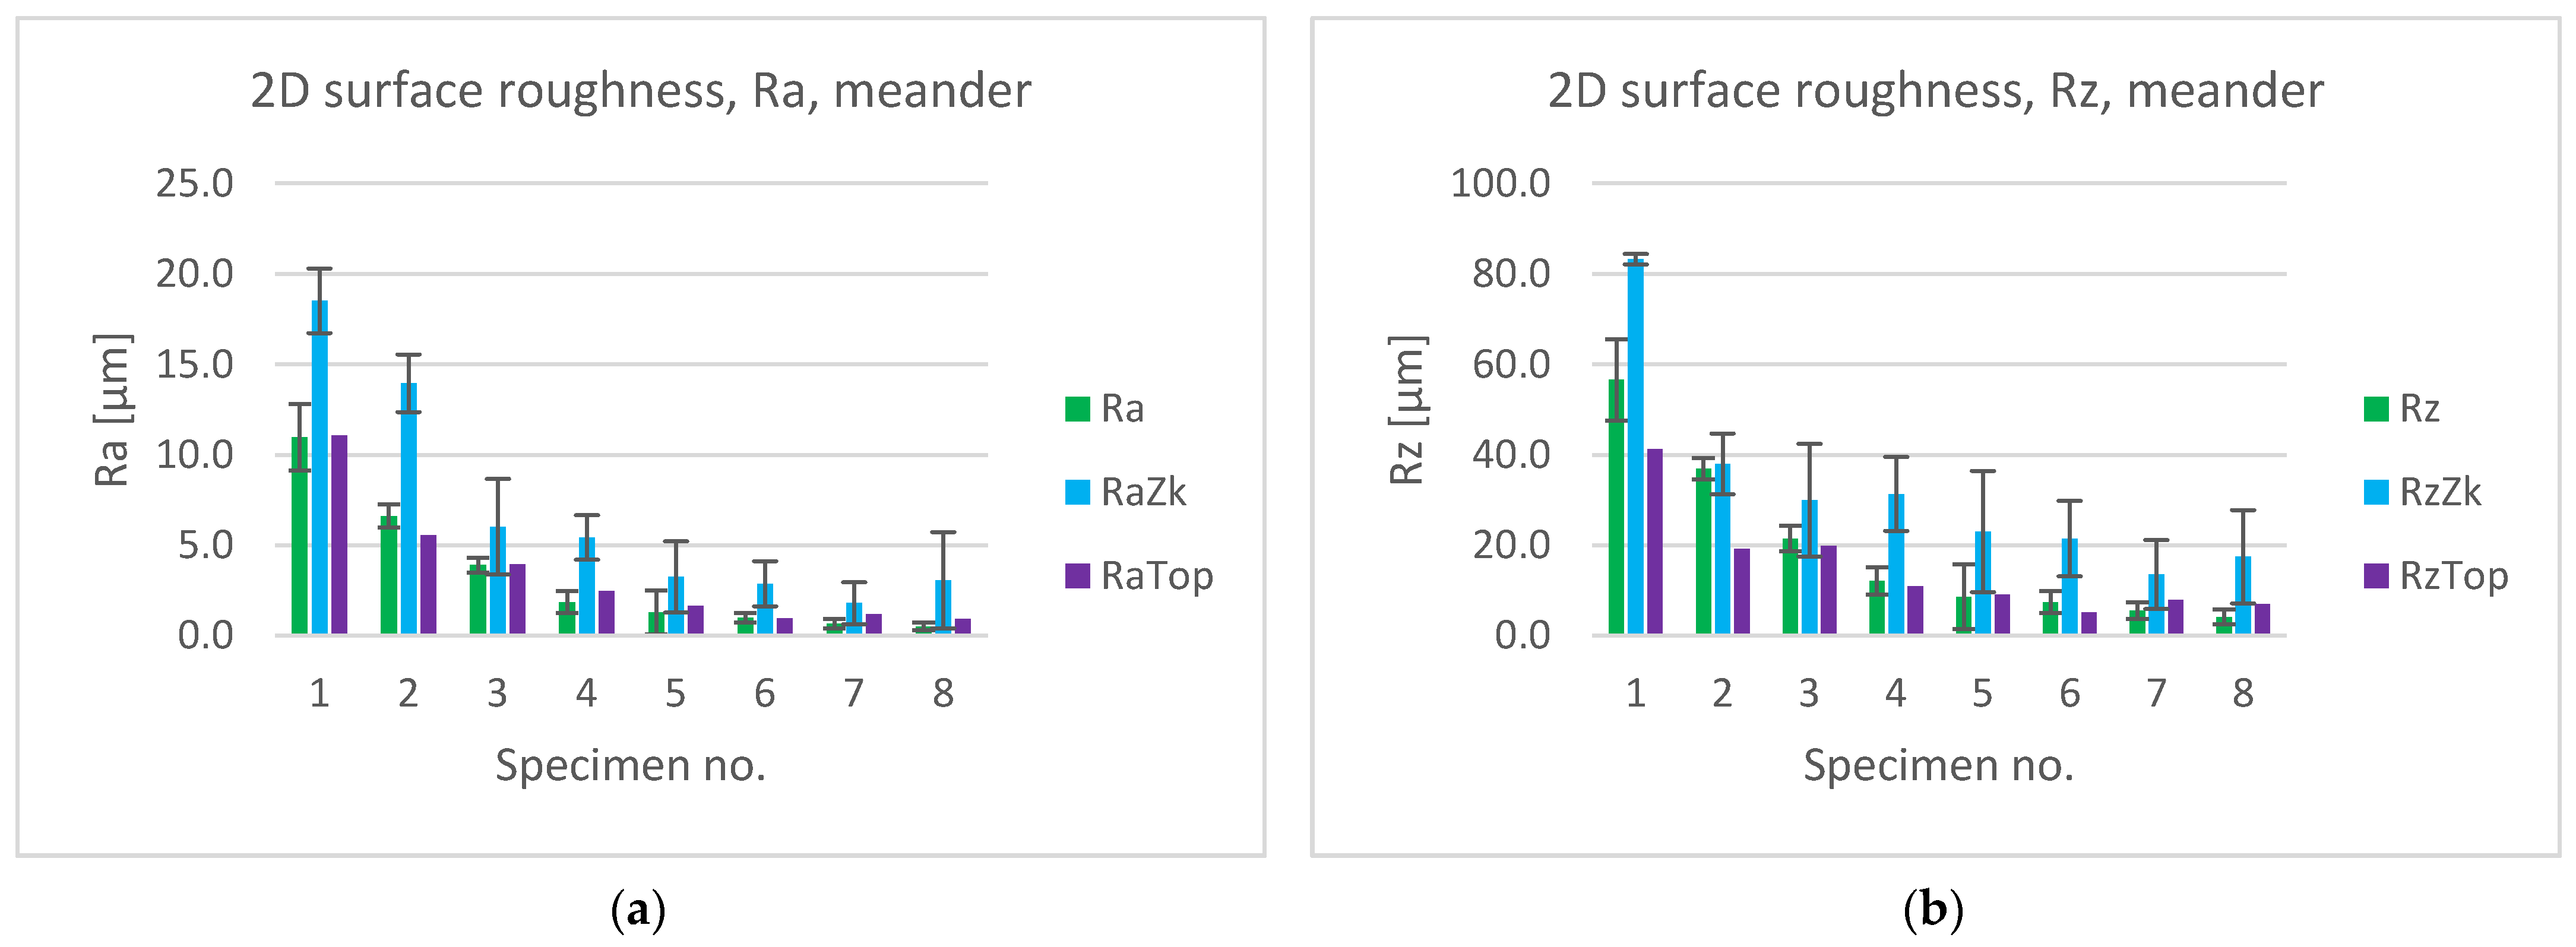
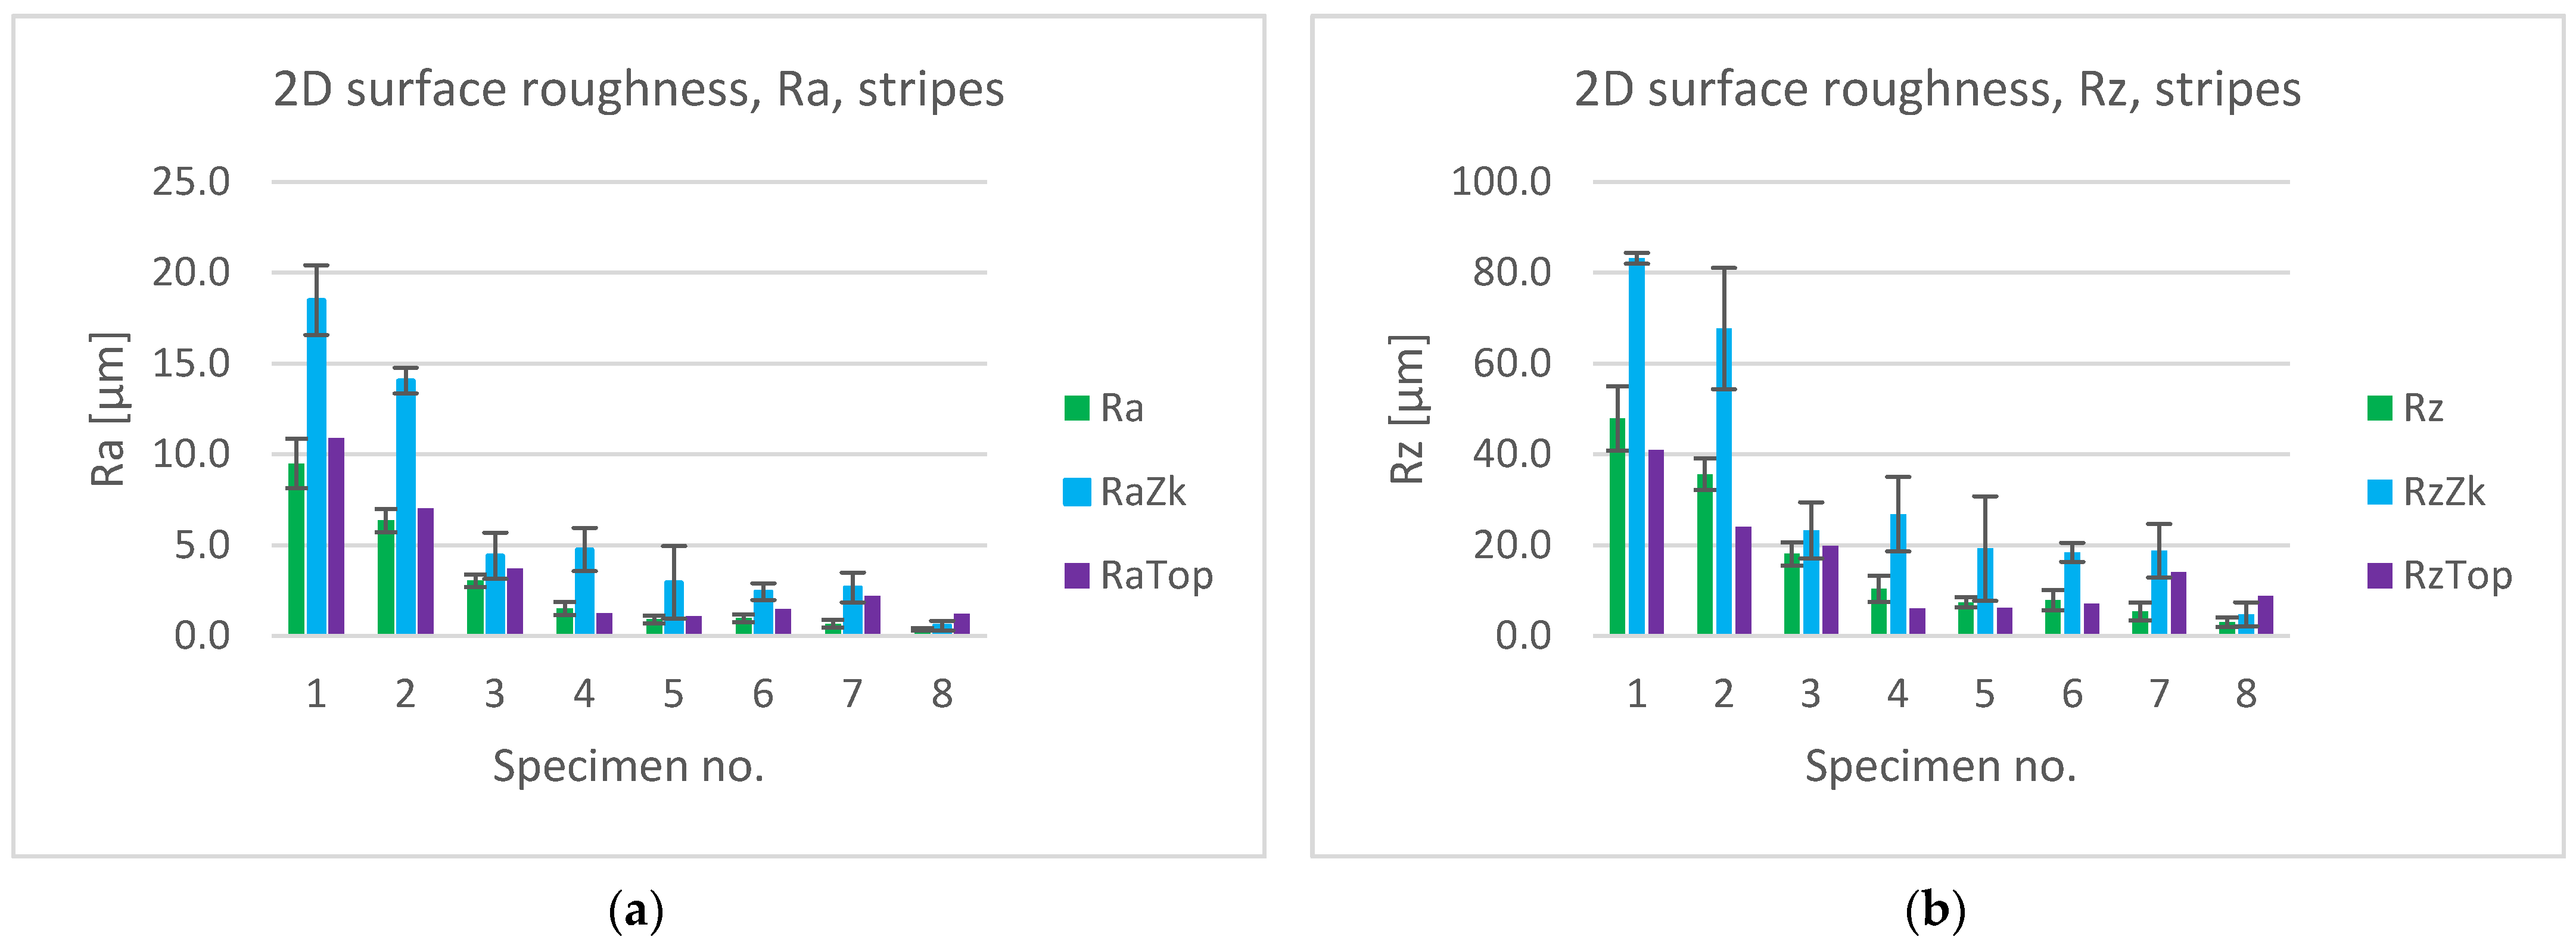
3.1. 2D Surface Roughness
3.1.1. Average of All Surfaces
3.1.2. Grouped Surfaces
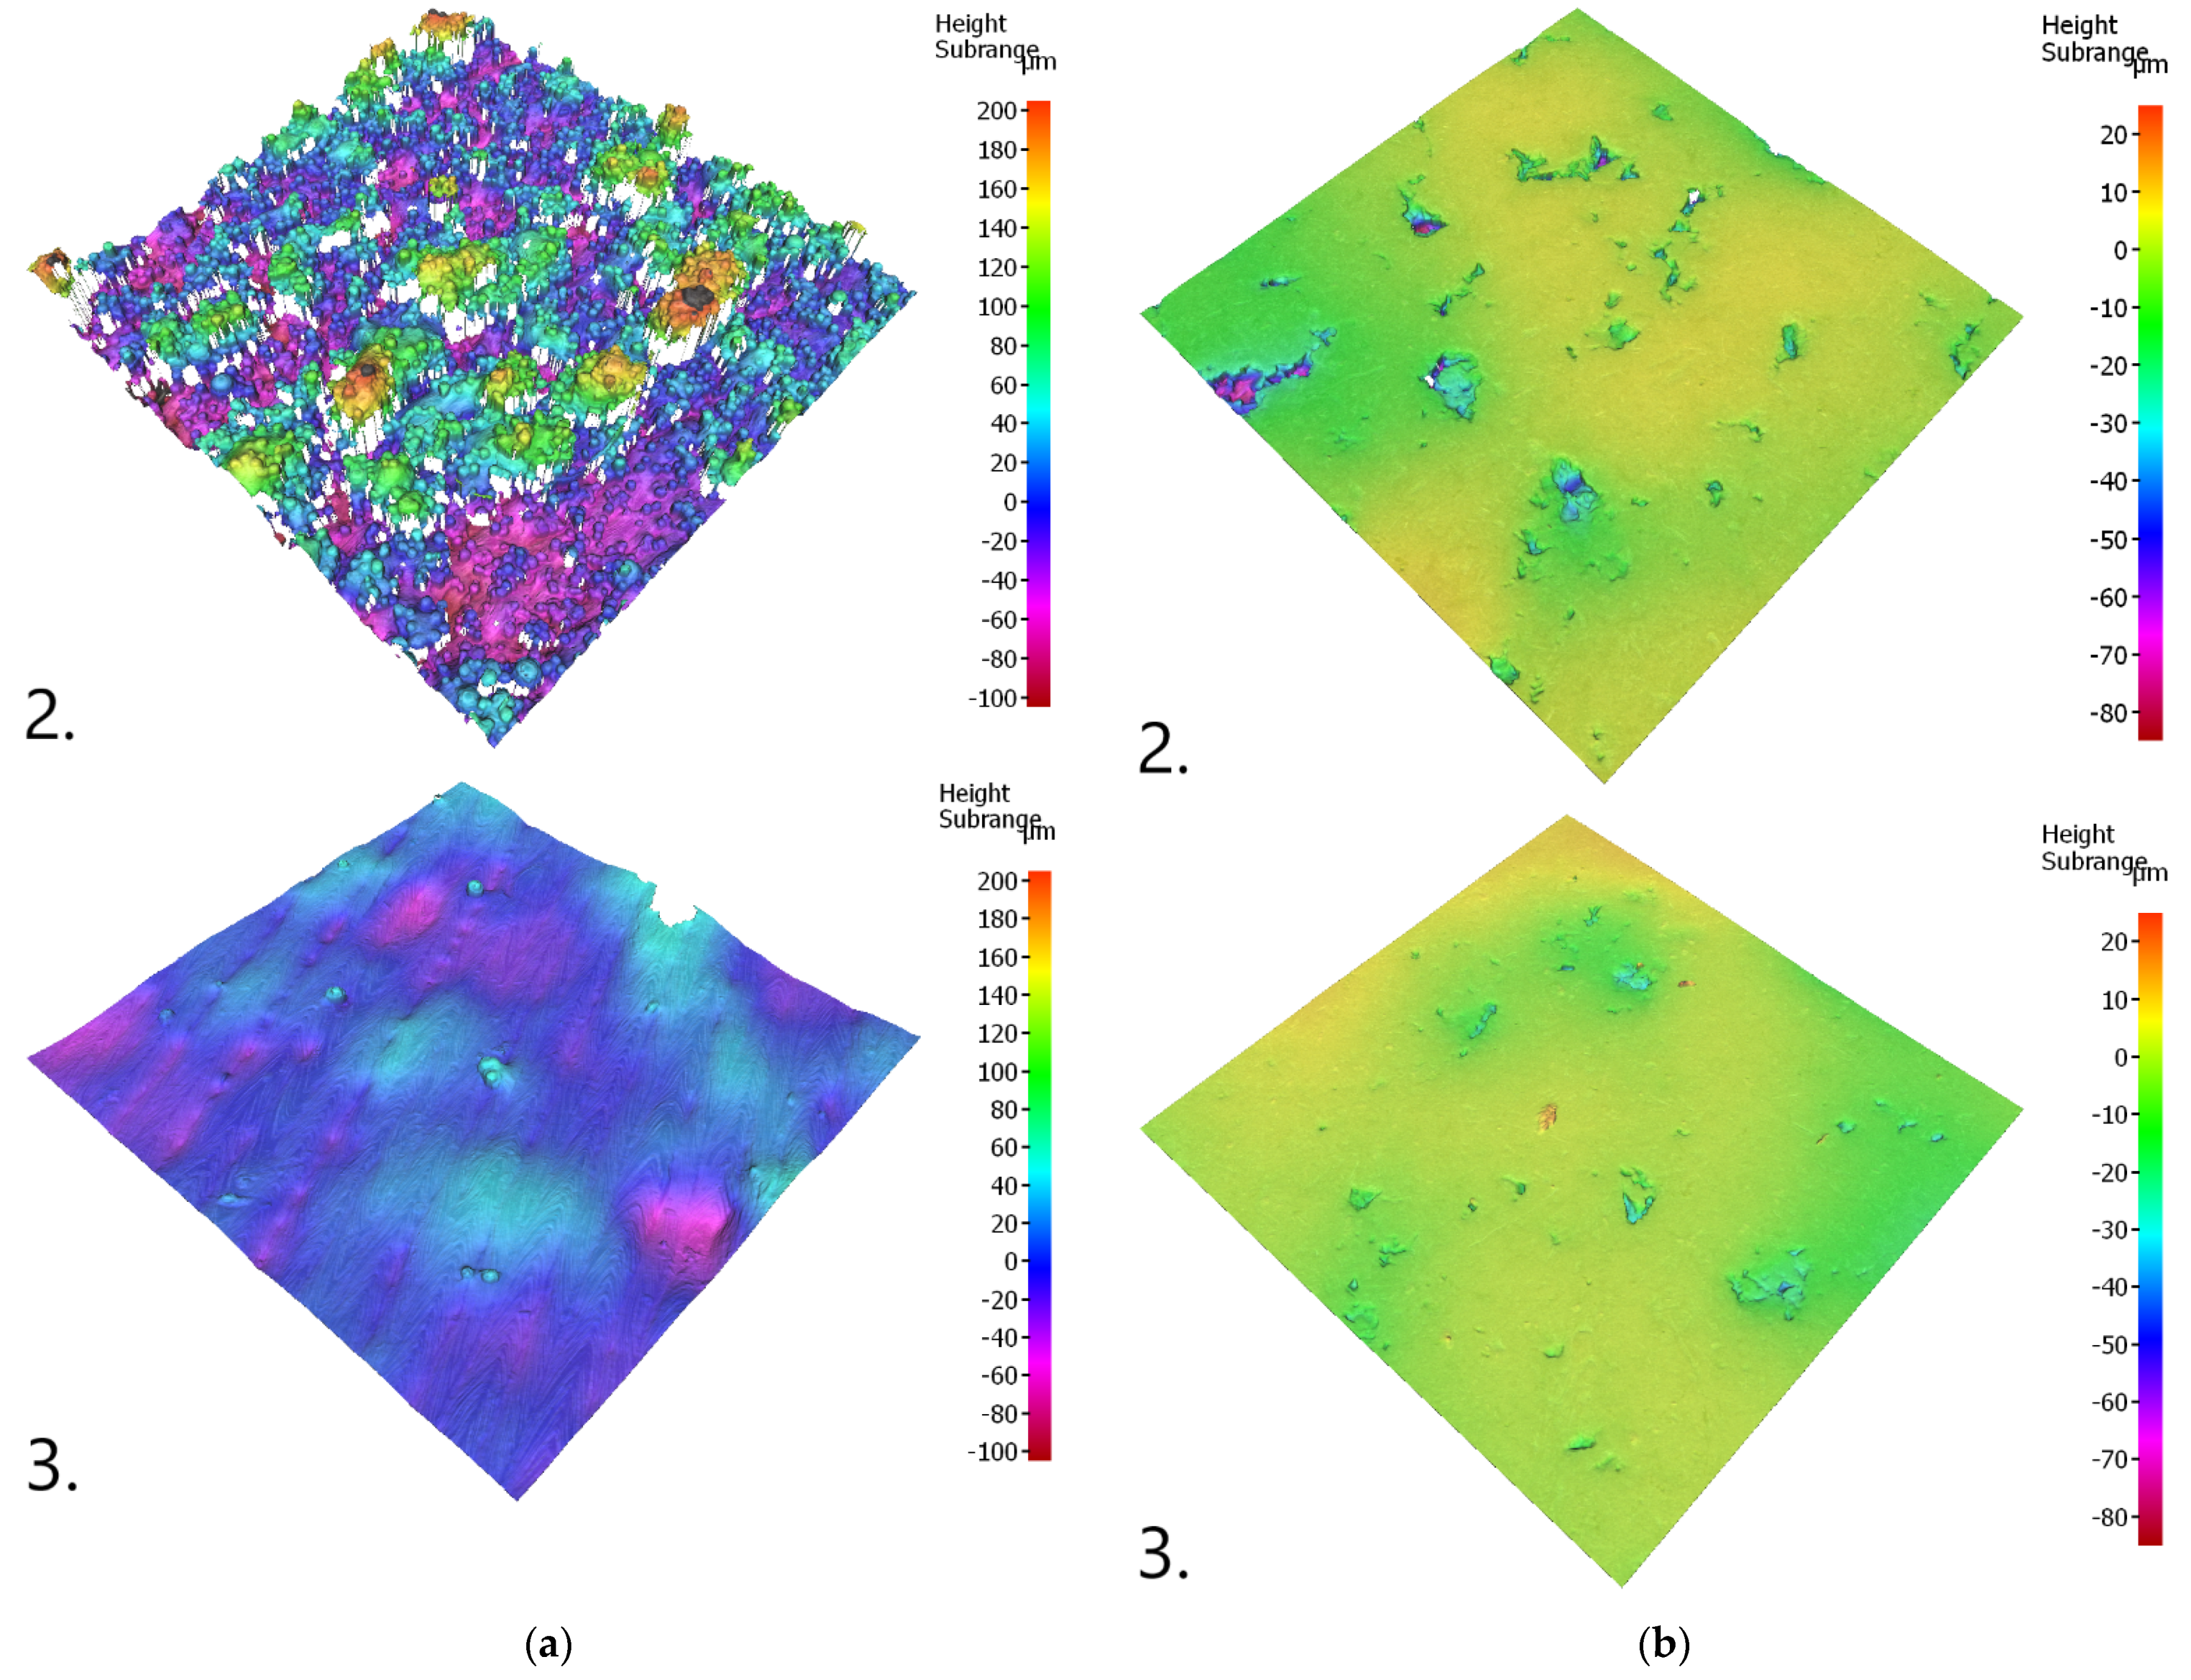
3.2. 3D Surface Roughness
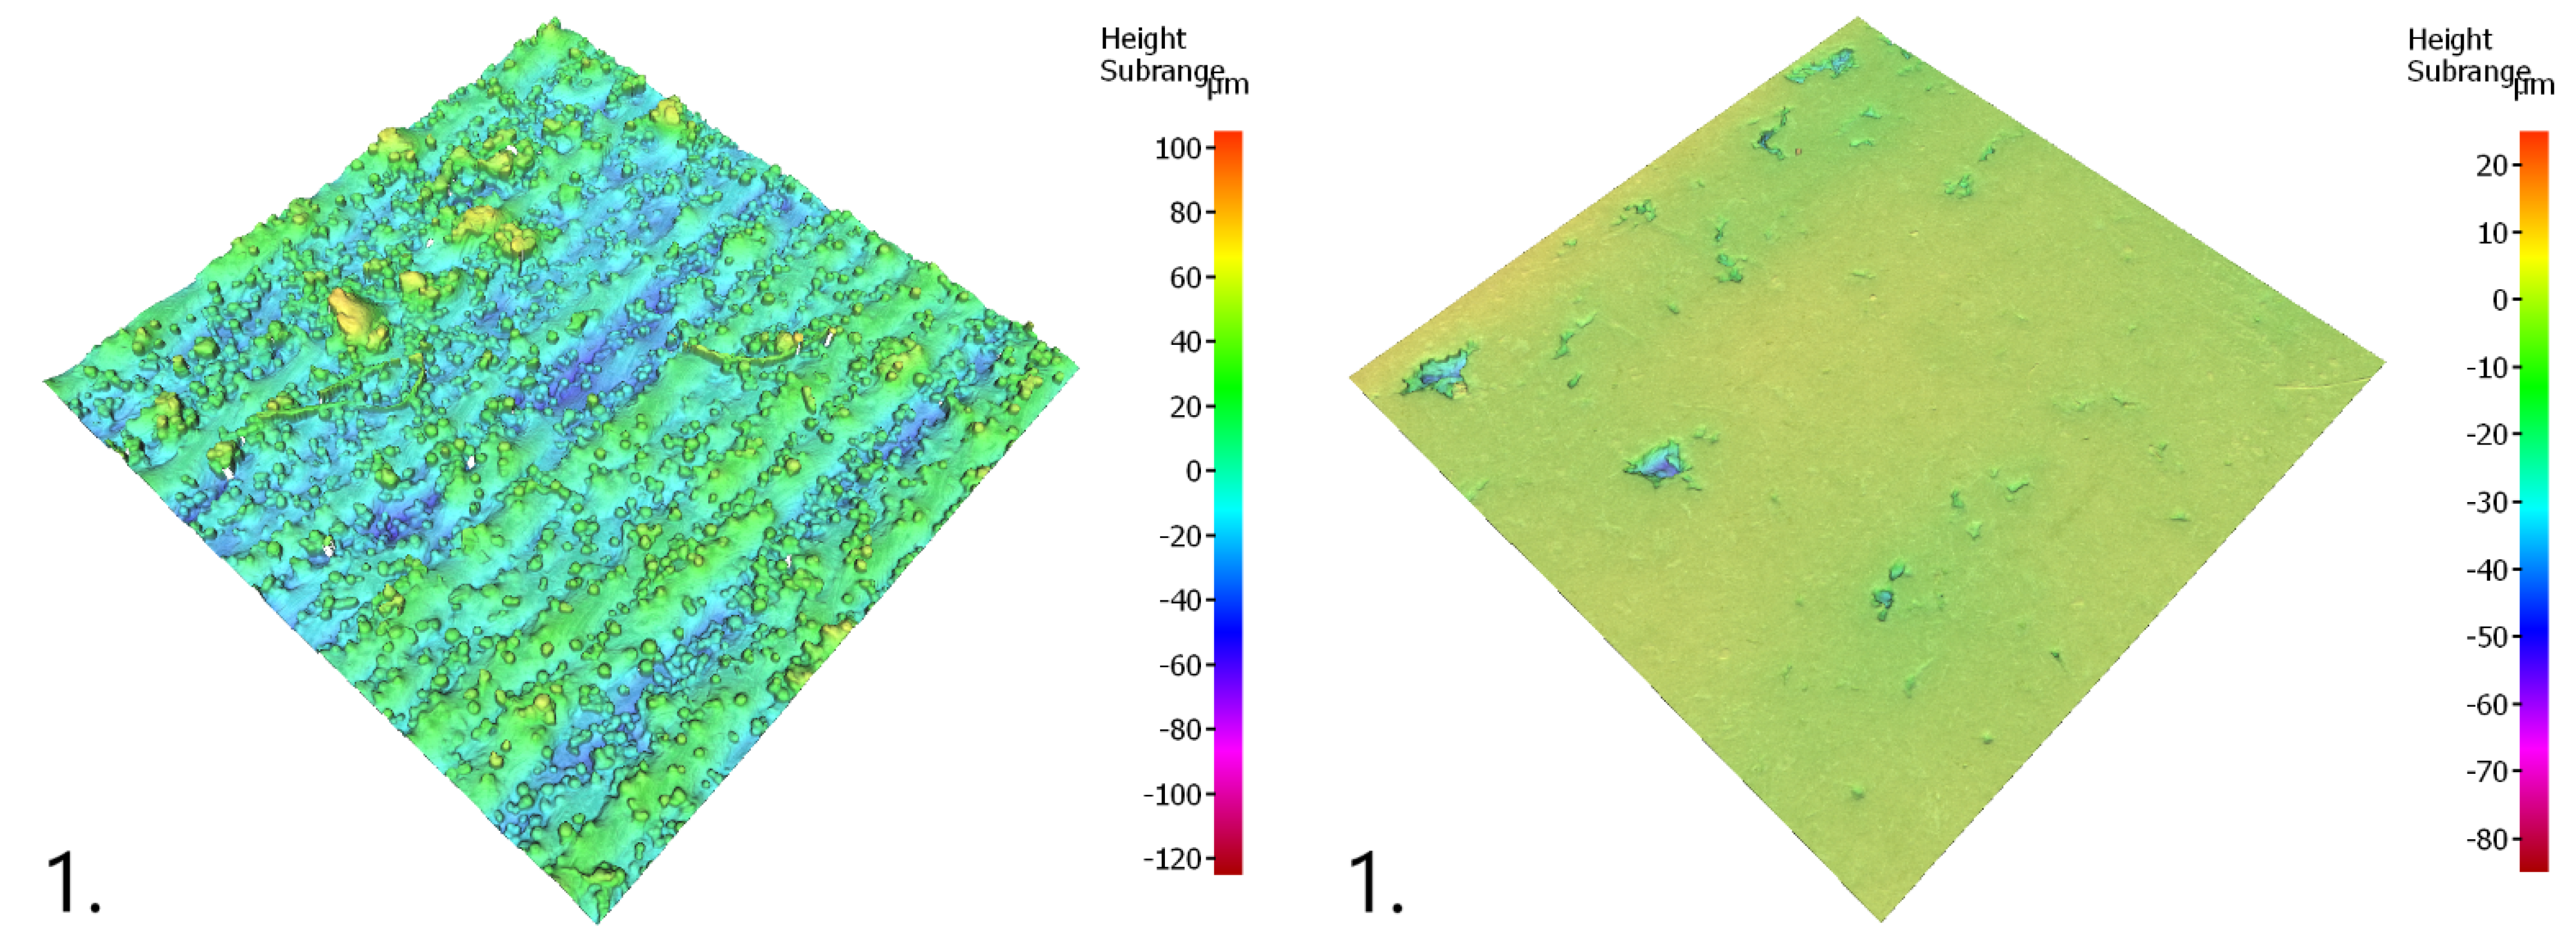
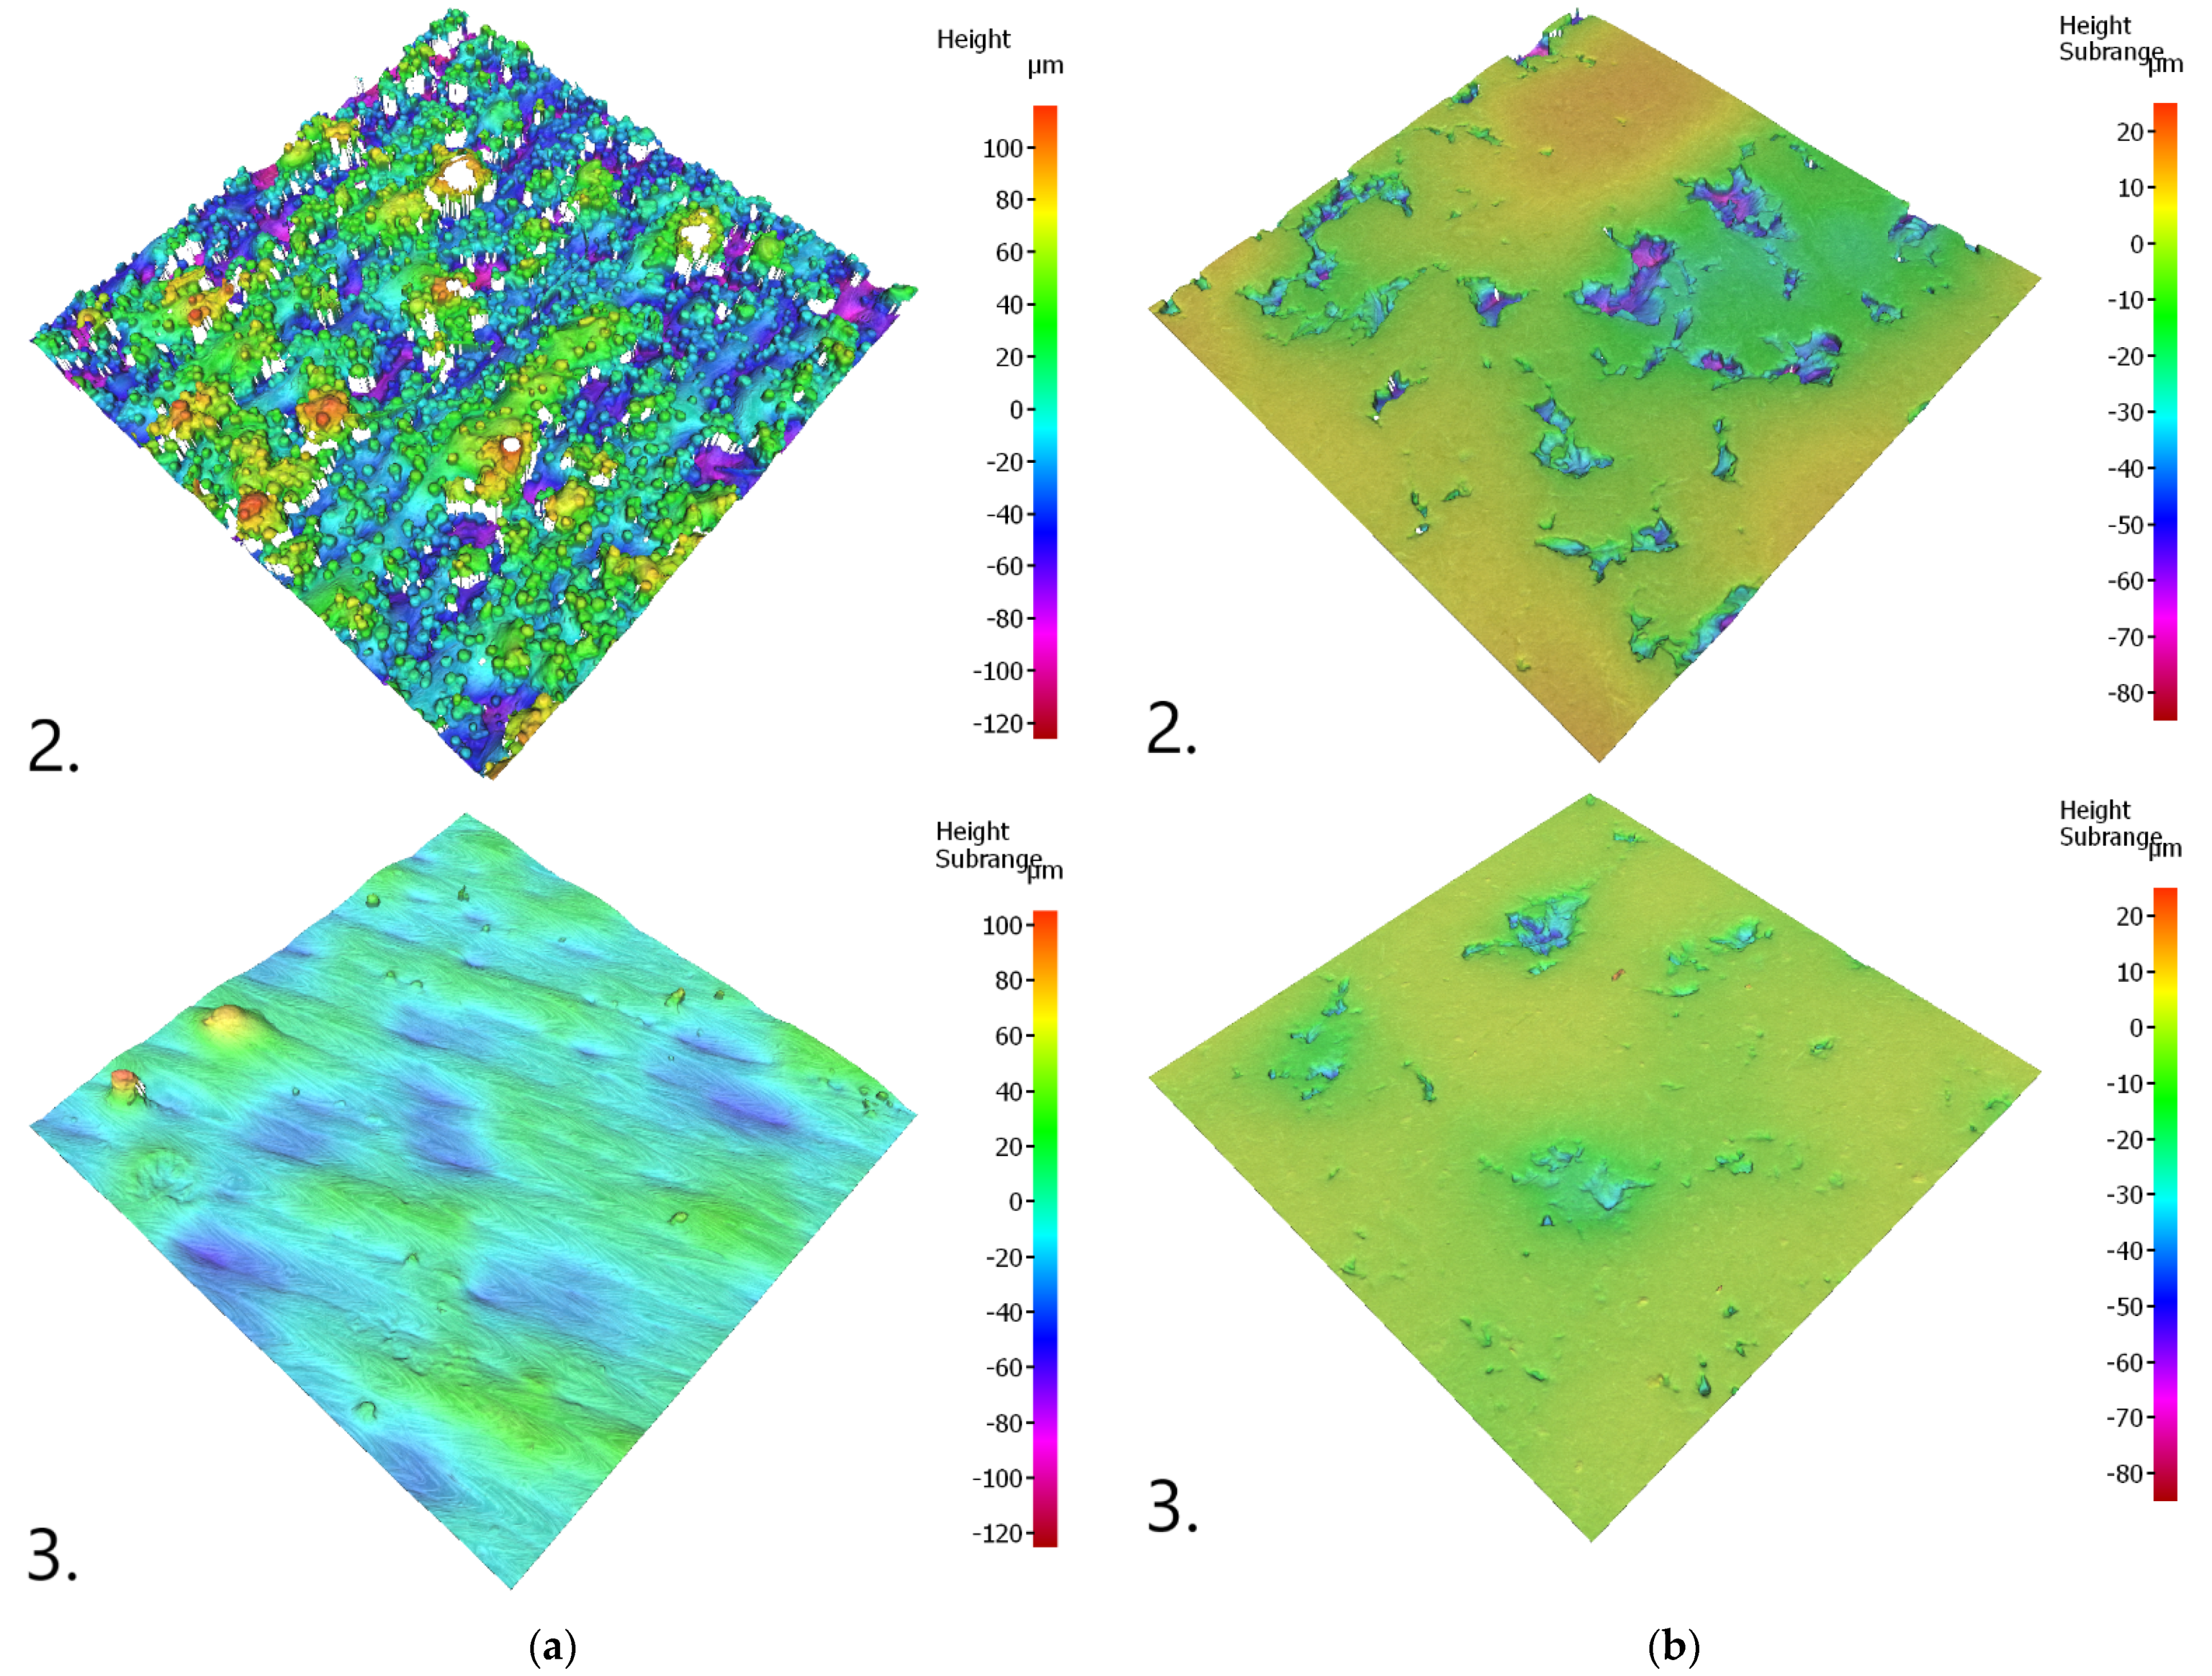
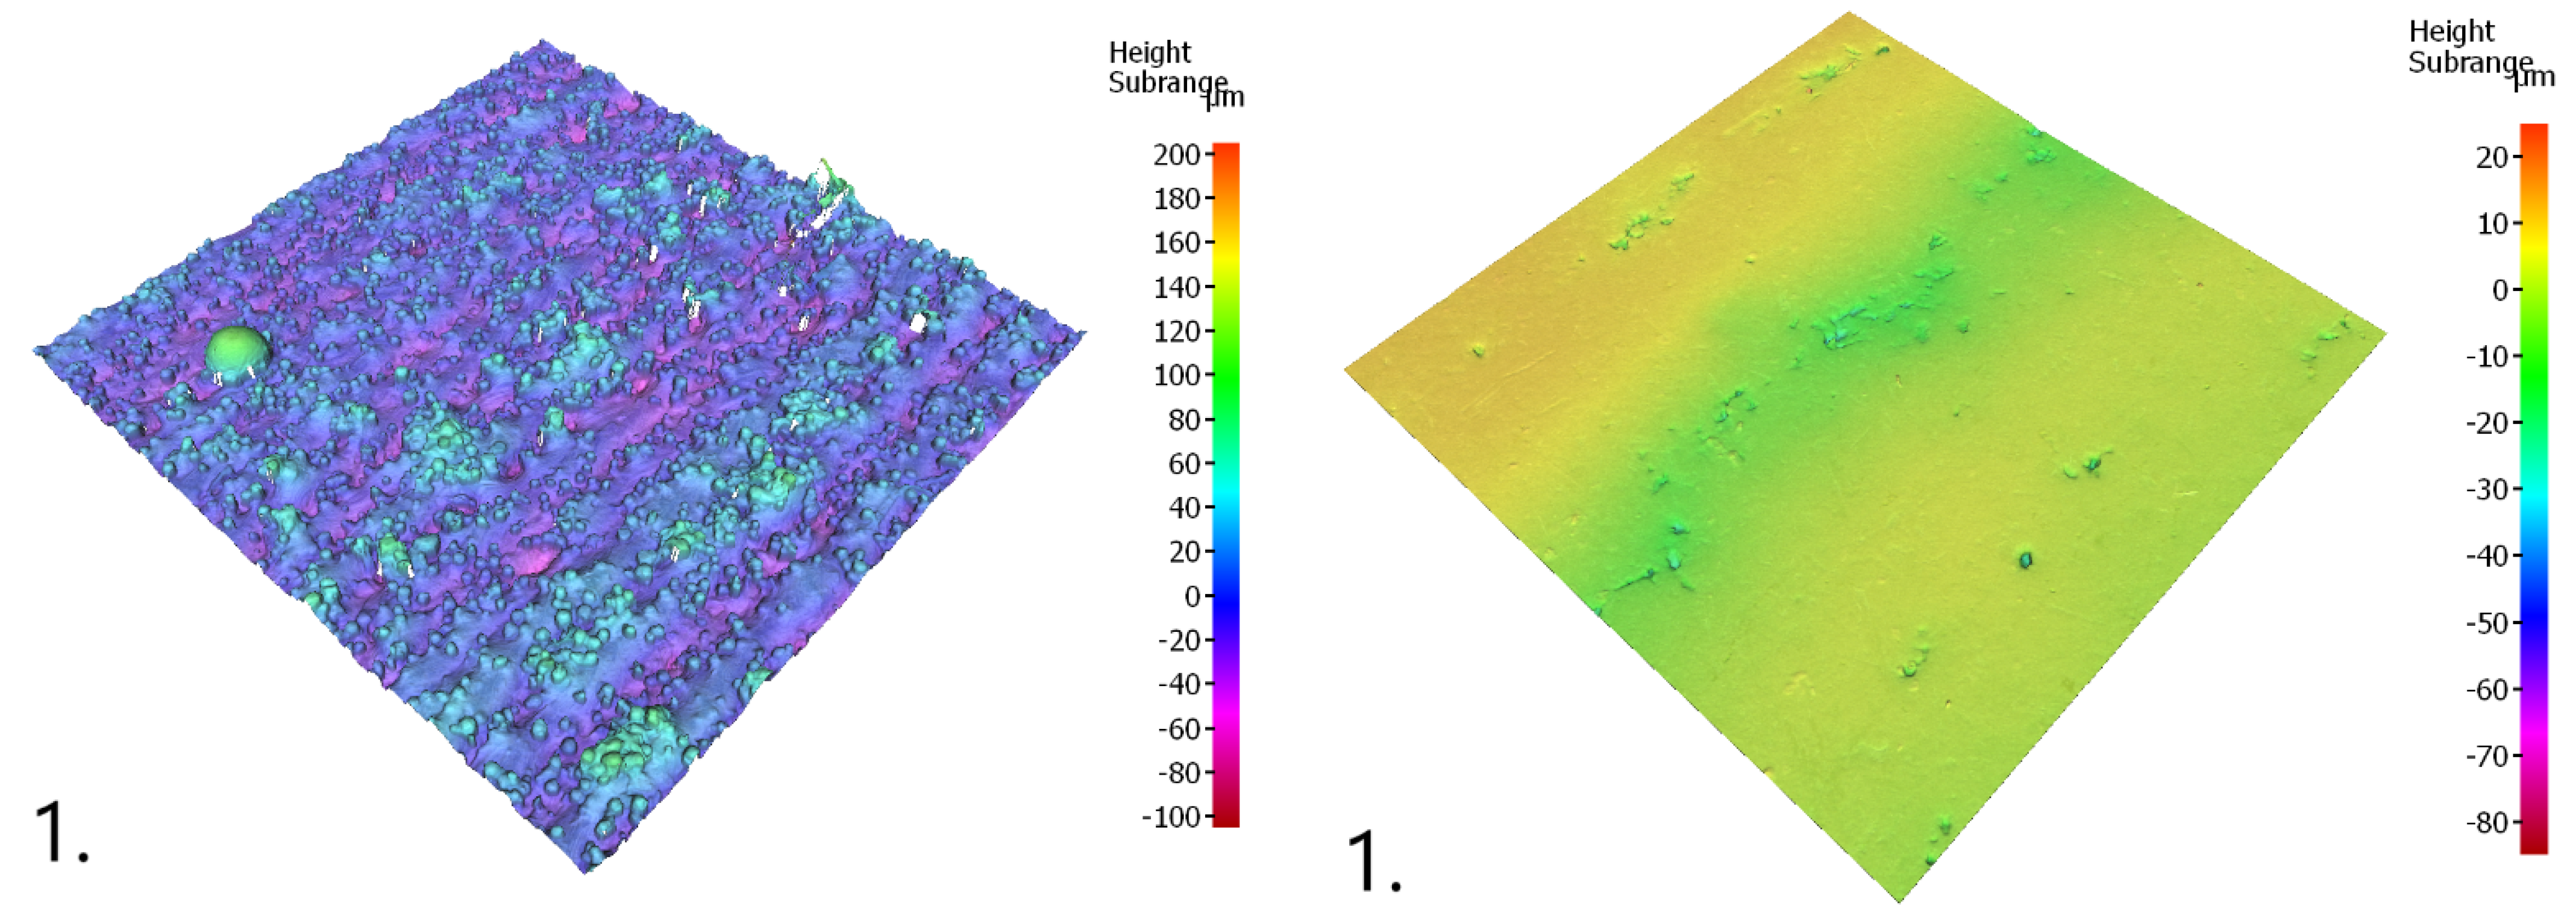
3.3. Macrostructure
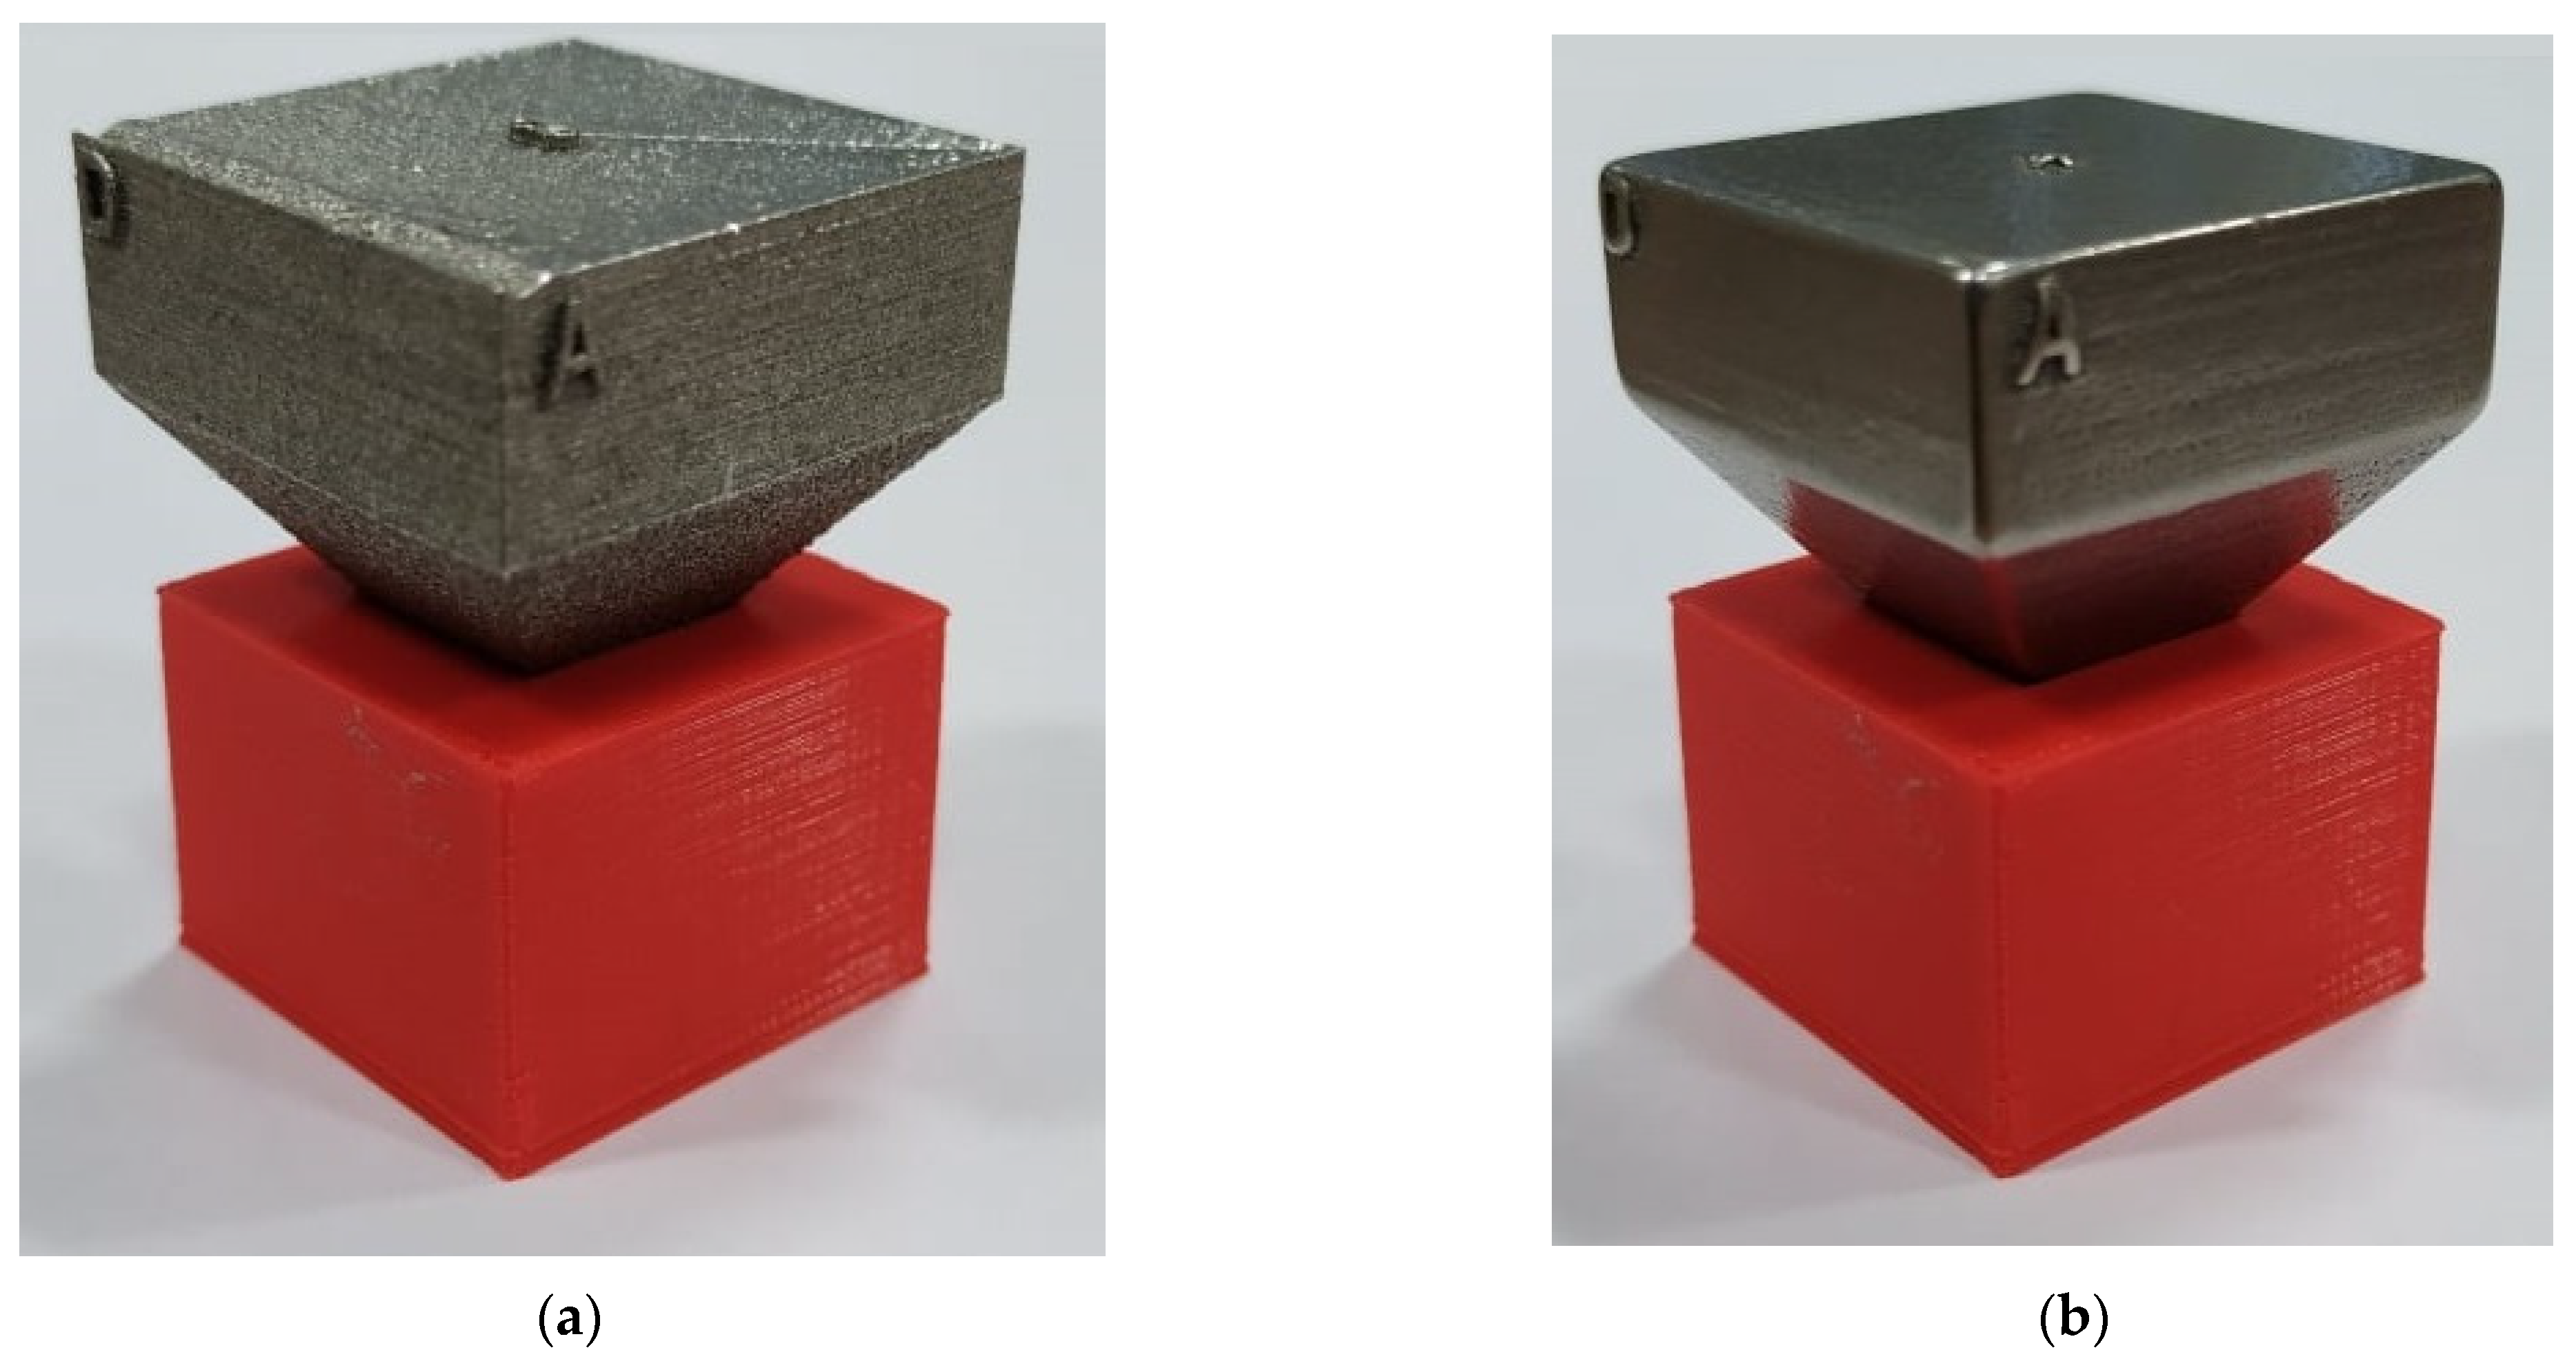
3.4. Real Scale Pictures
4. Conclusions
Author Contributions
Funding
Institutional Review Board Statement
Informed Consent Statement
Data Availability Statement
Conflicts of Interest
References
- Hunar, M.; Jancar, L.; Krzikalla, D.; Kaprinay, D.; Srnicek, D. Comprehensive View on Racing Car Upright Design and Manufacturing. Symmetry 2020, 12, 1020. [Google Scholar] [CrossRef]
- Xiao, Z.; Yang, Y.; Xiao, R.; Bai, Y.; Song, C.; Wang, D. Evaluation of topology-optimized lattice structures manufactured via selective laser melting. Mater. Des. 2018, 143, 27–37. [Google Scholar] [CrossRef]
- Marsalek, P.; Sotola, M.; Rybansky, D.; Repa, V.; Halama, R.; Fusek, M.; Prokop, J. Modeling and Testing of Flexible Structures with Selected Planar Patterns Used in Biomedical Applications. Materials 2020, 14, 140. [Google Scholar] [CrossRef] [PubMed]
- Pagáč, M.; Hajnyš, J.; Petrů, J.; Zlámal, T. Comparison of Hardness of Surface 316L Stainless Steel Made by Additive Technology and Cold Rolling. Mater. Sci. Forum 2018, 919, 84–91. [Google Scholar] [CrossRef]
- Liverani, E.; Toschi, S.; Ceschini, L.; Fortunato, A. Effect of selective laser melting (SLM) process parameters on microstructure and mechanical properties of 316L austenitic stainless steel. J. Mater. Process. Technol. 2017, 249, 255–263. [Google Scholar] [CrossRef]
- Yakout, M.; Elbestawi, M.; Veldhuis, S. Density and mechanical properties in selective laser melting of Invar 36 and stainless steel 316L. J. Mater. Process. Technol. 2019, 266, 397–420. [Google Scholar] [CrossRef]
- Hlinka, J.; Kraus, M.; Hajnys, J.; Pagac, M.; Petrů, J.; Brytan, Z.; Tański, T. Complex Corrosion Properties of AISI 316L Steel Prepared by 3D Printing Technology for Possible Implant Applications. Materials 2020, 13, 1527. [Google Scholar] [CrossRef] [PubMed] [Green Version]
- Chen, Z.; Wu, X.; Tomus, D.; Davies, C. Surface roughness of Selective Laser Melted Ti-6Al-4V alloy components. Addit. Manuf. 2018, 21, 91–103. [Google Scholar] [CrossRef]
- Mohammadian, N.; Turenne, S.; Brailovski, V. Surface finish control of additively-manufactured Inconel 625 components using combined chemical-abrasive flow polishing. J. Mater. Process. Technol. 2018, 252, 728–738. [Google Scholar] [CrossRef]
- Strano, G.; Hao, L.; Everson, R.; Evans, K. Surface roughness analysis, modelling and prediction in selective laser melting. J. Mater. Process. Technol. 2013, 213, 589–597. [Google Scholar] [CrossRef]
- Wang, D.; Liu, Y.; Yang, Y.; Xiao, D. Theoretical and experimental study on surface roughness of 316L stainless steel metal parts obtained through selective laser melting. Rapid Prototyp. J. 2016, 22, 706–716. [Google Scholar] [CrossRef]
- Leary, M. Surface Roughness Optimisation for Selective Laser Melting (SLM): Accommodating Relevant and Irrelevant Surfaces; RMIT University, Centre for Addictive Manufacturing: Melbourne, VIC, Australia, 2017; pp. 99–118. [Google Scholar]
- Vayssette, B.; Saintier, N.; Brugger, C.; Elmay, M.; Pessard, E. Surface roughness of Ti-6Al-4V parts obtained by SLM and EBM: Effect on the High Cycle Fatigue life. Procedia Eng. 2018, 213, 89–97. [Google Scholar] [CrossRef]
- Townsend, A.; Senin, N.; Blunt, L.; Leach, R.; Taylor, J. Surface texture metrology for metal additive manufacturing: A review. Precis. Eng. 2016, 46, 34–47. [Google Scholar] [CrossRef] [Green Version]
- Hajnys, J.; Pagac, M.; Mesicek, J.; Petru, J.; Spalek, F. Research of 316L Metallic Powder for Use in SLM 3D Printing. Adv. Mater. Sci. 2020, 20, 5–15. [Google Scholar] [CrossRef]
- Kozior, T.; Bochnia, J. The Influence of Printing Orientation on Surface Texture Parameters in Powder Bed Fusion Technology with 316L Steel. Micromachines 2020, 11, 639. [Google Scholar] [CrossRef] [PubMed]
- Yamaguchi, H.; Fergani, O.; Wu, P. Modification using magnetic field-assisted finishing of the surface roughness and residual stress of additively manufactured components. Cirp Ann. 2017, 66, 305–308. [Google Scholar] [CrossRef]
- Yadollahi, A.; Shamsaei, N. Additive manufacturing of fatigue resistant materials: Challenges and opportunities. Int. J. Fatigue 2017, 98, 14–31. [Google Scholar] [CrossRef] [Green Version]
- Tian, Y.; Gora, W.; Cabo, A.; Parimi, L.; Hand, D.; Tammas-Williams, S.; Prangnell, P. Material interactions in laser polishing powder bed additive manufactured Ti6Al4V components. Addit. Manuf. 2018, 20, 11–22. [Google Scholar] [CrossRef] [Green Version]
- Kaynak, Y.; Kitay, O. Porosity, Surface Quality, Microhardness and Microstructure of Selective Laser Melted 316L Stainless Steel Resulting from Finish Machining. J. Manuf. Mater. Process. 2018, 2, 36. [Google Scholar] [CrossRef] [Green Version]
- Du, W.; Bai, Q.; Zhang, B. A Novel Method for Additive/Subtractive Hybrid Manufacturing of Metallic Parts. Procedia Manuf. 2016, 5, 1018–1030. [Google Scholar] [CrossRef] [Green Version]
- Li, L.; Haghighi, A.; Yang, Y. A novel 6-axis hybrid additive-subtractive manufacturing process: Design and case studies. J. Manuf. Process. 2018, 33, 150–160. [Google Scholar] [CrossRef]
- Sun, Y.; Bailey, R.; Moroz, A. Surface finish and properties enhancement of selective laser melted 316L stainless steel by surface mechanical attrition treatment. Surf. Coat. Technol. 2019, 378, 124993. [Google Scholar] [CrossRef]
- Zhang, H.; Zhao, J.; Liu, J.; Qin, H.; Ren, Z.; Doll, G.; Dong, Y.; Ye, C. The effects of electrically-assisted ultrasonic nanocrystal surface modification on 3D-printed Ti-6Al-4V alloy. Addit. Manuf. 2018, 22, 60–68. [Google Scholar] [CrossRef]
- Bai, Y.; Zhao, C.; Yang, J.; Fuh, J.; Lu, W.; Weng, C.; Wang, H. Dry mechanical-electrochemical polishing of selective laser melted 316L stainless steel. Mater. Des. 2020, 193, 108840. [Google Scholar] [CrossRef]
- Sagbas, B. Post-Processing Effects on Surface Properties of Direct Metal Laser Sintered AlSi10Mg Parts. Met. Mater. Int. 2019, 26, 143–153. [Google Scholar] [CrossRef]
- Lichovník, J.; Mizera, O.; Sadílek, M.; Čepová, L.; Zelinka, J.; Čep, R. Influence of Tumbling Bodies on Surface Roughness and Geometric Deviations by Additive SLS technology. Manuf. Technol. 2020, 20, 342–346. [Google Scholar]
- Pagac, M.; Hajnys, J.; Petru, J.; ZLaMAL, T.; Sofer, M. The study of mechanical properties stainless steel 316L after production from metal powder with using additive technology and by method selective laser melting. Int. Conf. Metall. Mater. Conf. Proc. 2017, 2017-Jan, 962–967. [Google Scholar]
- Hajnys, J.; Pagac, M.; Kotera, O.; Petru, J.; Scholz, S. Influence of basic process parameters on mechanical and internal properties of 316L steel in SLM process for Renishaw AM400. MM Sci. J. 2019, 2790–2794. [Google Scholar] [CrossRef] [Green Version]
- Cegan, T.; Pagac, M.; Jurica, J.; Skotnicova, K.; Hajnys, J.; Horsak, L.; Soucek, K.; Krpec, P. Effect of Hot Isostatic Pressing on Porosity and Mechanical Properties of 316 L Stainless Steel Prepared by the Selective Laser Melting Method. Materials 2020, 13, 4377. [Google Scholar] [CrossRef]


| Parameter | Value |
|---|---|
| Laser power | 200 W |
| Hatch spacing | 0.11 mm |
| Scan speed | 650 mm/s |
| Preheat temperature | Ambient |
| Layer thickness | 50 µm |
| Increment rotation angle | 67° |
| Specimen No. | Scanning Strategy | Sandblasting | Tumbling | Total Time | Roughness | ||||||||
|---|---|---|---|---|---|---|---|---|---|---|---|---|---|
| Corundum | Steel | Ceramic | Plastic | Porcelain | Ra | Rz | |||||||
| Meander | Stripes | 50 [s] | 50 [s] | 120 [min] | 180 [min] | 240 [min] | 120 [min] | 120 [min] | [min] | [µm] | [µm] | ||
| 1 | X | 0 | 11.0 | 56.6 | |||||||||
| 2 | X | X | 1 | 6.6 | 37.0 | ||||||||
| 3 | X | X | X | 2 | 4.9 | 25.1 | |||||||
| 4 | X | X | X | X | 360 | 3.5 | 20.5 | ||||||
| 5 | X | X | X | X | 420 | 2.2 | 15.1 | ||||||
| 6 | X | X | X | X | 480 | 1.8 | 13.4 | ||||||
| 7 | X | X | X | X | X | 481 | 1.2 | 9.4 | |||||
| 8 | X | X | X | X | X | X | 482 | 1.7 | 10.4 | ||||
| 1 | X | 0 | 9.5 | 47.9 | |||||||||
| 2 | X | X | 1 | 6.4 | 35.6 | ||||||||
| 3 | X | X | X | 2 | 3.7 | 20.6 | |||||||
| 4 | X | X | X | X | 360 | 2.9 | 17.2 | ||||||
| 5 | X | X | X | X | 420 | 1.8 | 12.5 | ||||||
| 6 | X | X | X | X | 480 | 1.7 | 12.5 | ||||||
| 7 | X | X | X | X | X | 481 | 1.7 | 12.3 | |||||
| 8 | X | X | X | X | X | X | 482 | 0.5 | 4.4 | ||||
| Meander | 1 | 2 | 3 | 4 | 5 | 6 | 7 | 8 |
|---|---|---|---|---|---|---|---|---|
| Ra [µm] | 11.0 ± 1.8 | 6.6 ± 0.6 | 3.9 ± 0.4 | 1.9 ± 0.6 | 1.3 ± 1.2 | 1.0 ± 0.3 | 0.7 ± 0.3 | 0.5 ± 0.2 |
| RaZk [µm] | 18.5 ± 1.8 | 14.0 ± 1.6 | 6.0 ± 2.6 | 5.4 ± 1.2 | 3.3 ± 2.0 | 2.9 ± 1.2 | 1.8 ± 1.2 | 3.1 ± 2.7 |
| RaTop [µm] | 11.1 | 5.6 | 4.0 | 2.5 | 1.7 | 1.0 | 1.2 | 0.9 |
| Rz [µm] | 56.6 ± 9.0 | 37.0 ± 2.4 | 21.5 ± 2.8 | 12.1 ± 3.0 | 8.6 ± 7.2 | 7.4 ± 2.4 | 5.6 ± 1.9 | 4.1 ± 1.6 |
| Rzzk [µm] | 83.2 ± 1.1 | 38.0 ± 6.7 | 30.0 ± 12.5 | 31.4 ± 8.2 | 23.1 ± 13.4 | 21.5 ± 8.3 | 13.5 ± 7.6 | 17.5 ± 10.3 |
| RzTop [µm] | 41.3 | 19.2 | 19.8 | 11.0 | 9.1 | 5.2 | 7.9 | 7.1 |
| Stripes | 1 | 2 | 3 | 4 | 5 | 6 | 7 | 8 |
|---|---|---|---|---|---|---|---|---|
| Ra [µm] | 9.5 ± 1.4 | 6.4 ± 0.6 | 3.0 ± 0.3 | 1.5 ± 0.4 | 0.9 ± 0.2 | 1.0 ± 0.2 | 0.7 ± 0.2 | 0.4 ± 0.1 |
| RaZk [µm] | 18.5 ± 1.9 | 14.1 ± 0.7 | 4.4 ± 1.3 | 4.8 ± 1.2 | 2.9 ± 2.0 | 2.4 ± 0.5 | 2.7 ± 0.8 | 0.6 ± 0.3 |
| RaTop [µm] | 10.9 | 7.0 | 3.7 | 1.2 | 1.1 | 1.5 | 2.2 | 1.2 |
| Rz [µm] | 47.9 ± 7.0 | 35.6 ± 3.5 | 18.1 ± 2.5 | 10.3 ± 2.9 | 7.4 ± 1.1 | 7.9 ± 2.2 | 5.4 ± 2.0 | 3.0 ± 1.1 |
| RzZk [µm] | 83.2 ± 1.2 | 67.7 ± 13.4 | 23.2 ± 6.2 | 26.8 ± 8.2 | 19.2 ± 11.5 | 18.4 ± 2.1 | 18.7 ± 5.9 | 4.8 ± 2.6 |
| RzTop [µm] | 40.9 | 24.0 | 19.8 | 6.1 | 6.2 | 7.1 | 14.0 | 8.7 |
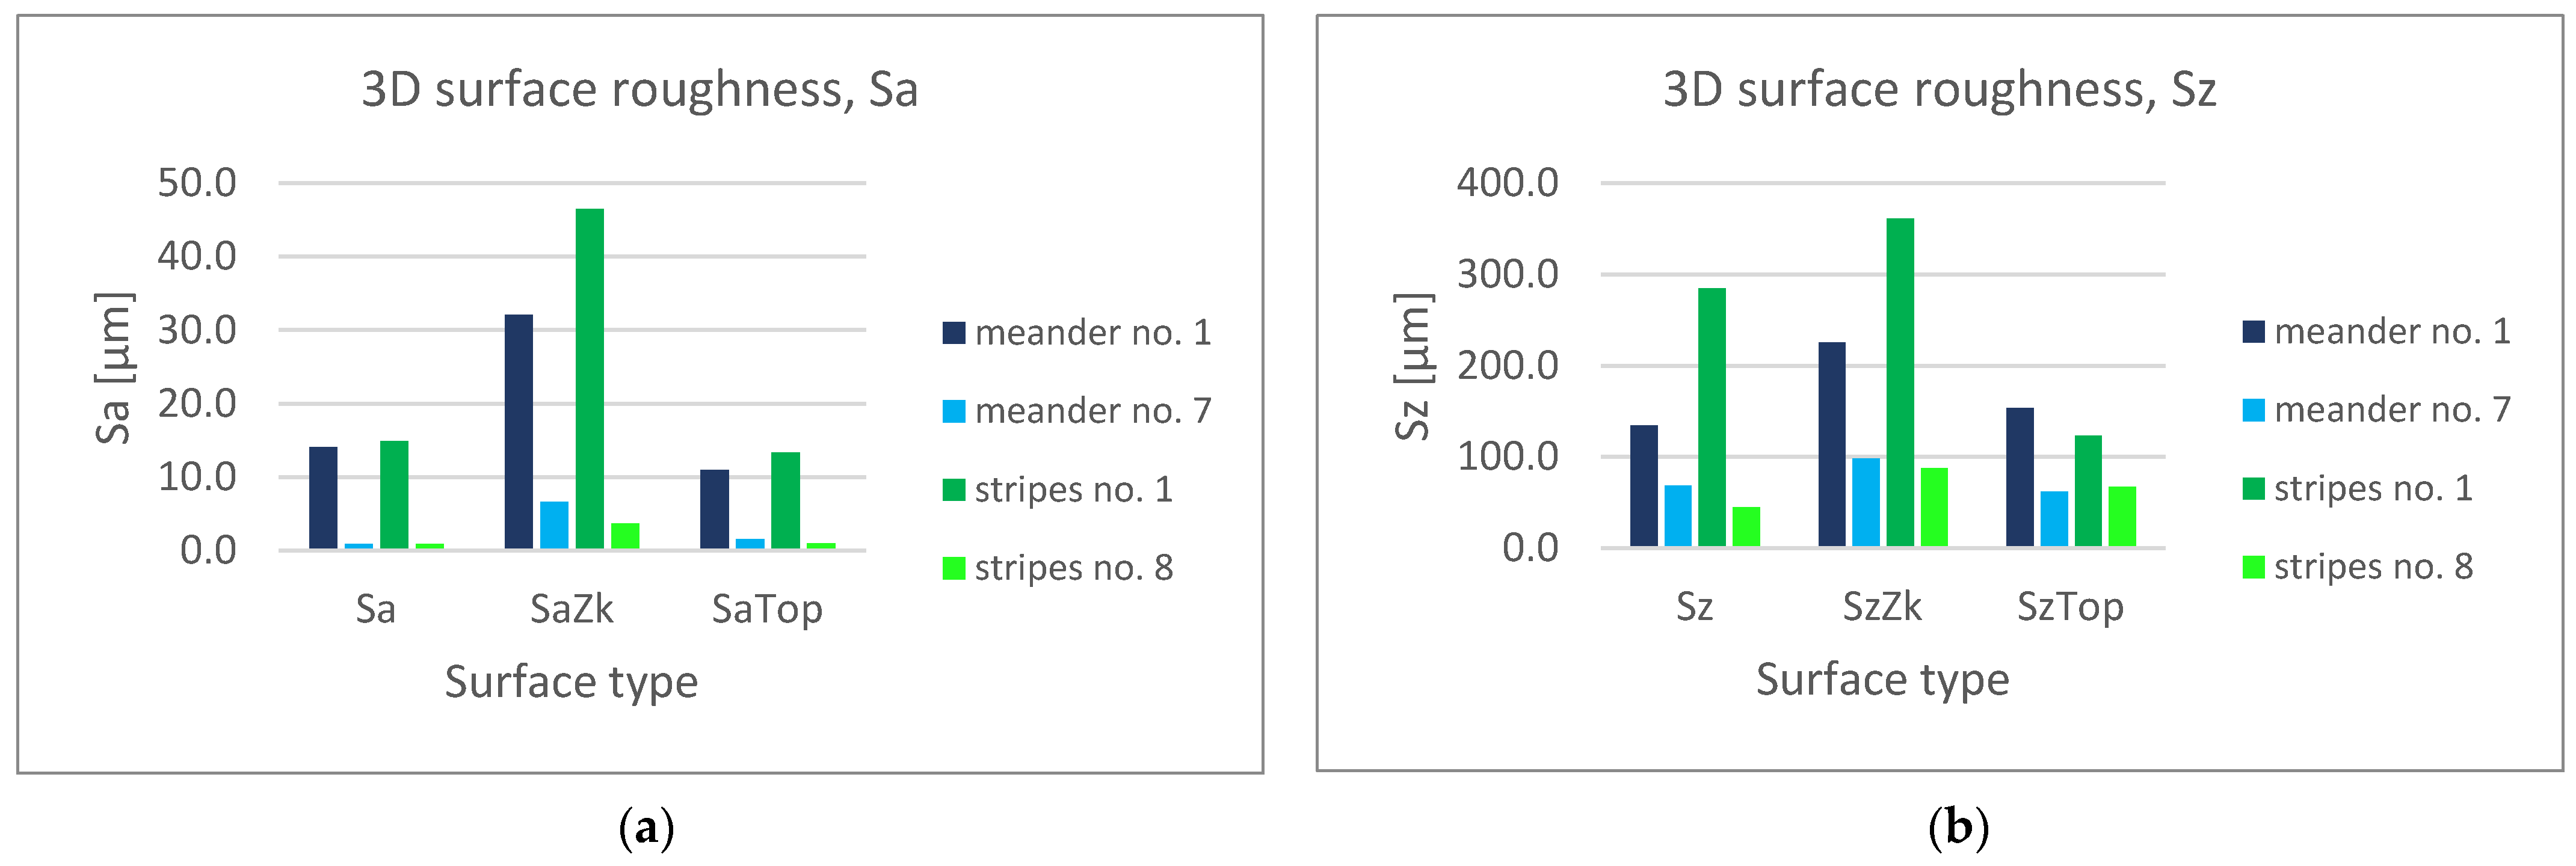
| Scanning Strategy | No. | Sa [µm] | SaZk [µm] | SaTop [µm] | Sz [µm] | SzZk [µm] | SzTop [µm] |
|---|---|---|---|---|---|---|---|
| Meander | 1 | 14.1 | 32.1 | 10.9 | 134.6 | 225.6 | 153.8 |
| 7 | 0.9 | 6.7 | 1.6 | 68.4 | 98.4 | 62.0 | |
| Stripes | 1 | 14.9 | 46.5 | 13.4 | 284.6 | 361.0 | 123.6 |
| 8 | 0.9 | 3.7 | 1.0 | 44.8 | 87.8 | 67.5 |
Publisher’s Note: MDPI stays neutral with regard to jurisdictional claims in published maps and institutional affiliations. |
© 2021 by the authors. Licensee MDPI, Basel, Switzerland. This article is an open access article distributed under the terms and conditions of the Creative Commons Attribution (CC BY) license (http://creativecommons.org/licenses/by/4.0/).
Share and Cite
Mesicek, J.; Ma, Q.-P.; Hajnys, J.; Zelinka, J.; Pagac, M.; Petru, J.; Mizera, O. Abrasive Surface Finishing on SLM 316L Parts Fabricated with Recycled Powder. Appl. Sci. 2021, 11, 2869. https://doi.org/10.3390/app11062869
Mesicek J, Ma Q-P, Hajnys J, Zelinka J, Pagac M, Petru J, Mizera O. Abrasive Surface Finishing on SLM 316L Parts Fabricated with Recycled Powder. Applied Sciences. 2021; 11(6):2869. https://doi.org/10.3390/app11062869
Chicago/Turabian StyleMesicek, Jakub, Quoc-Phu Ma, Jiri Hajnys, Jan Zelinka, Marek Pagac, Jana Petru, and Ondrej Mizera. 2021. "Abrasive Surface Finishing on SLM 316L Parts Fabricated with Recycled Powder" Applied Sciences 11, no. 6: 2869. https://doi.org/10.3390/app11062869