Article

The Triad Hsp60-miRNAs-Extracellular Vesicles in Brain Tumors: Assessing Its Components for Understanding Tumorigenesis and Monitoring Patients

by
Francesca Graziano
1,2,*,
Domenico Gerardo Iacopino
1,
Giacomo Cammarata
1,
Gianluca Scalia
2,
Claudia Campanella
3,
Antonino Giulio Giannone
4,
Rossana Porcasi
4,
Ada Maria Florena
4,
Everly Conway de Macario
5,
Alberto J.L. Macario
5,6,
Giovanni Federico Nicoletti
2 and
Celeste Caruso Bavisotto
3,6
1
Department of Biomedicine, Neurosciences and Advanced Diagnostics, Institute of Neurosurgery, University of Palermo, 90127 Palermo, Italy
2
Department of Neurosurgery, Highly Specialized Hospital and of National Importance “Garibaldi”, 95122 Catania, Italy
3
Department of Biomedicine, Neurosciences and Advanced Diagnostics, Section of Human Anatomy, University of Palermo, 90127 Palermo, Italy
4
Department of Health Promotion, Mother and Child Care, Internal Medicine and Medical Specialties—Pathologic Anatomy Unit, University of Palermo, 90100 Palermo, Italy
5
Department of Microbiology and Immunology, School of Medicine, University of Maryland at Baltimore—Institute of Marine and Environmental Technology (IMET), Baltimore, MD 21202, USA
6
Euro-Mediterranean Institute of Science and Technology (IEMEST), 90139 Palermo, Italy
*
Author to whom correspondence should be addressed.
Appl. Sci. 2021, 11(6), 2867; https://doi.org/10.3390/app11062867
Submission received: 21 February 2021 / Revised: 10 March 2021 / Accepted: 19 March 2021 / Published: 23 March 2021

Abstract

:
Brain tumors have a poor prognosis and progress must be made for developing efficacious treatments, but for this to occur their biology and interaction with the host must be elucidated beyond current knowledge. What has been learned from other tumors may be applied to study brain tumors, for example, the role of Hsp60, miRNAs, and extracellular vesicles (EVs) in the mechanisms of cell proliferation and dissemination, and resistance to immune attack and anticancer drugs. It has been established that Hsp60 increases in cancer cells, in which it occurs not only in the mitochondria but also in the cytosol and plasma-cell membrane and it is released in EVs into the extracellular space and in circulation. There is evidence suggesting that these EVs interact with cells near and far from their original cell and that this interaction has an impact on the functions of the target cell. It is assumed that this crosstalk between cancer and host cells favors carcinogenesis in various ways. We, therefore, propose to study the triad Hsp60-related miRNAs-EVs in brain tumors and have standardized methods for the purpose. These revealed that EVs with Hsp60 and related miRNAs increase in patients’ blood in a manner that reflects disease status. The means are now available to monitor brain tumor patients by measuring the triad and to dissect its effects on target cells in vitro, and in experimental models in vivo.

1. Introduction

Primary brain tumors are among the top 10 causes of cancer-related deaths [1]. Glioblastoma is a common malignant primary brain tumor, representing approximately 57% of all gliomas and 48% of all primary malignant tumors of the central nervous system (CNS) [2]. Because of the poor clinical outcomes, glioblastoma multiforme (GBM) is among the most challenging human tumors for patients and physician alike [3]. The possibility of long-term survival is remote and much of the focus and treatment decisions are based on cognitive and quality of life issues. The overall survival is usually around 9–12 months and the overall 5-year survival is less than 5% [4,5,6,7]. The dismal GBM clinical outcome, owing to highly infiltrative growth, intra-tumor heterogeneity, and high recurrence rates, has made it an urgent subject of cancer research for identification of novel factors associated with its development [8,9]. With the advancement in the knowledge of the molecular pathology of malignant gliomas, it is now evident that epigenetic abnormalities and variations in gene expression are closely related to the occurrence of these tumors and may provide key targets for developing novel means for diagnosis, assessing prognosis, and disease monitoring [8].
Meningiomas are also common primary intracranial tumors and, in most cases, they are histologically benign (WHO grade I). Due to a lack of prospective, randomized trials, standardized treatment guidelines are difficult to formulate. A gross total resection (GTR) remains the gold standard, though a complete removal is not always achievable. A significant subgroup of patients (WHO grades II and III) cannot be submitted to GTR, but less radical resection and postoperative adjuvant radiotherapy and systemic therapies are indicated. Thus, gliomas and meningiomas constitute a great challenge for physicians and a hopeless situation for many patients who are still awaiting the development of efficacious treatments.
In the last several years, cancerology has progressed along several lines, one of which is the understanding of the chaperone, or chaperoning system (CS) and its role in carcinogenesis. The CS of an organism is composed of the entire set of molecular chaperones, some of which are Heat Shock Proteins (Hsps), co-chaperones, chaperone co-factors, and chaperone interactors, and receptors [10]. The canonical function of the CS is maintenance of protein homeostasis and, in this, its main collaborators are the ubiquitin–proteasome system and the chaperone-mediated autophagy [11,12]. In addition, the CS has other functions that involve interaction with the immune system and pertain to carcinogenesis, and inflammatory and autoimmune conditions [13]. Therefore, a full understanding of the biology and pathology of a variety of cancers should include the study of the CS role in their initiation and progression, as well as in their regression when pertinent. It must be borne in mind that the CS has multiple components that interact with one another and with molecules widespread in the body, so a chaperone, for instance, can exit its cell of origin, reach the intercellular space, and enter in the circulating fluids’ lymph and blood, in which it can travel to its destination near or far. For instance, the chaperone Hsp60 is increased in some human brain cancers [14,15,16,17], and its depletion in in vivo models of GBM WHO grade IV tumors is associated with intracranial tumor regression [18]. Hsp60 levels are under the control of regulatory molecules, such as microRNAs (miRNAs) [19,20,21,22,23,24], which are noncoding small RNAs that play various roles in oncogenesis acting as oncogenes or tumor suppressors in certain tumors, including meningiomas and gliomas [25,26,27]. The Hsp60 chaperone in its physiological or pathological migrations travels alone or in extracellular vesicles (EVs), can interact with cells near and far from the cell of origin and may change their functions [28,29,30,31,32,33,34,35]. For these reasons, Hsp60 and other chaperones can be considered biomarkers potentially useful in diagnosis, and in assessing prognosis and response to treatment [36,37,38,39,40].
It is clear from the existing data that the triad Hsp60 and related miRNAs and EVs play critical roles in tumorigenesis and are promising biomarkers for monitoring patients. Based on this information and considering the need for precise diagnostic tools applicable to brain tumors, we have standardized a battery of techniques to measure the three biomarkers in liquid biopsies from patients with glioblastomas and meningiomas. The methods generate a set of complementary results that reveal patient status and clues on disease mechanisms. In this short report, we describe the methods and the kind of information they provide.

2. Materials and Methods

The procedures described are the result of various standardization efforts done over time to define the best parameters for each of them and are explained in detail for the benefit of future users in clinical pathology and research.

2.1. Samples

To test the standardized methods, a total of 34 patients with gliomas (n = 16) or meningioma (n = 18) were recruited within the period December 2016 to October 2018 (Table 1A,B). The project was approved by the Palermo Ethics Committee I (number 11\2018). Written informed consent was obtained from each subject. The study included only patients without a systemic infection or other tumors and capable of providing consent on their own. The GBM patients selected were only those desiring to participate in the study and in which a maximal safe tumor removal was deemed feasible considering neurological status, including neuroradiological imaging evaluation (Table 1A,B). Brain glial tumors with corpus callosum infiltration were excluded. For meningiomas, we included patients with primary diagnosis of meningiomas, without previous radiotherapy. All brain surgeries were performed by the same neurosurgical team, including the Neurosurgical Unit Chairman D.G.I., senior author of the manuscript and his collaborator F.G. Blood and pathological tissue samples were taken from each patient on the day of the surgery. For each patient, blood samples were collected at different time points, just before surgery (Before Surgery, BS), and at one week (After Surgery 1, AS1), and one month (After Surgery, AS2) after surgical tumor resection, and were processed for serum separation. A brain MRI post-gadolinium within 72 h (when feasible) and at one week, and at three months from discharge, was performed to verify tumor recurrence for correlation with the results of our analysis. Patients affected by GBM, after the definitive histopathological analysis, underwent the STUPP protocol therapy as usual [41,42]. Patients affected by brain meningiomas WHO GI or II after complete tumor removal were followed at our Outpatient Clinic. Patients affected by anaplastic meningiomas underwent oncological management and radiotherapy.

2.2. Histopathology

A basic tenet of our standardization strategy was the histological characterization of the brain tumors. These were classified following the guidelines of the WHO classification 2016.

2.3. Tissue Processing and Immunomorphological Analysis

The samples of pathological tissues were embedded in paraffin and used for immunohistochemistry. Hematoxylin-eosin (H&E) staining was applied for pathologic assessment. Immunohistochemistry was performed on 5 µm thick sections, which were dewaxed in xylene for 30 min at 60 °C and rehydrated at 23 °C by sequential immersion in a graded series of alcohols. For antigen retrieval, the sections were immersed for 8 min in sodium citrate buffer (pH 6) at 95 °C and, afterwards, immersed for 8 min in acetone at −20 °C to prevent the detachment of the sections from the slide. After washing the sections with phosphate buffer saline (pH 7.4), protein detection was performed by the streptavidin–biotin complex method, using a Histostain®-Plus Third Gen IHC Detection Kit (Life Technologies, Frederik, MD, USA; Cat. No. 85–9073). For the detection of Hsp60, mouse anti-Hsp60 monoclonal antibody (Sigma, St. Louis, MO, USA; catalogue No. H4149, dilution 1:200) was used by immunohistochemistry as previously described [43]. After deparaffinization, sections were treated with Peroxidase Blocking Reagent (Cell and Tissue Staining Kit, R&D Systems, Inc., Minneapolis, MN, USA) to inhibit endogenous peroxidase activity and with serum-blocking reagent D (Cell and Tissue Staining Kit) to block non-specific antigenic sites. Then, the sections were treated with avidin-blocking reagent following the kit instructions (Cell and Tissue Staining Kit), and incubated overnight at 4 °C with primary antibody, as pertinent. After washings, the sections were incubated with biotinylated secondary antibody (Cell and Tissue Staining Kit) for 60 min and, subsequently, with high-sensitivity streptavidin-conjugated HRP (HSS-HRP) in the dark for 5 min with the DAB chromogen. Nuclear counterstaining was carried out using hematoxylin (Hematoxylin REF 05-06012/L Bio-Optica, Milano, Italy). Finally, the slides were prepared for observation with coverslips, using a permanent mounting medium (Vecta Mount, Vector, H-5000).
The examination of the sections was performed with an optical microscope (Leica DM 5000 B) connected to a digital camera (Leica DC 300F), at a magnification of 400X and the percentage of positive cells was calculated in a high-power field (HPF) and repeated for 10 HPF. From these data, the total percentages of cells positive for Hsp60 were determined.

2.4. EV Isolation and Characterization

Blood samples were collected following a standard procedure as previously described [43,44]. EVs isolation from plasma was carried out by several steps of differential ultracentrifugation and by ultrafiltration. Briefly, 3 mL of plasma were centrifuged at 11,000× g for 30 min to remove cell debris. The supernatant was diluted with PBS, then filtered through a 0.2 µm filter (Millex GP, Millipore, Darmstadt, Germany), followed by a two-step ultracentrifugation at 110,000× g for 2 h to pellet the EVs. The EVs were then washed in cold PBS and resuspended in 100 µl of PBS for morphological evaluations or in 70 µl of RIPA (radioimmunoprecipitation assay) lysis buffer (0.3M NaCl, 0.1% SDS, 25 mm HEPES pH 7.5, 1.5 mm MgCl2, 0.2 mm EDTA, 1% Triton X-100, 0.5 mm DTT, 0.5% sodium deoxycholate) for Western blotting (WB) [44].
In order to estimate their morphology, EVs were examined with Transmission Electron Microscopy (TEM) (JEOL JEM 1220 TEM at 120 kV); Atomic Force Microscopy (AFM), using a multimode scanning probe microscope driven by a nanoscope V controller (Digital Instruments, Bruker, Kennewick, WA, USA); and Dynamic Light Scattering (DLS), using a Brookhaven Instrument BI200-SM goniometer; as previous described [43,44].
Western Blot was performed to detect the EVs markers Alix (mouse anti-Alix, 1A12 clone, Santa Cruz Biotechnology, Inc., Dallas, TX, USA); Hsp70/Hsc70 (mouse anti- Hsp70/Hsc70, W27 clone, Santa Cruz Biotechnology); and CD81 (mouse anti-CD81, B-11 clone, Santa Cruz Biotechnology) [43,44].

2.5. Western Blot

The EVs Hsp60 was assessed by WB, using equal amounts of protein (50 µg) for each sample, anti-Hsp60 monoclonal antibody (mouse anti-Hsp60, LK1 clone, Sigma, St. Louis, MO, USA), and horseradish peroxidase-conjugated sheep anti-mouse antibody (GE Healthcare Life Science, Milan, Italy). WBs were detected using the Amersham enhanced chemiluminescence substrate (GE Healthcare Life Science, Marlborough, MA, USA), following the manufacturer’s instructions. Densitometric analyses of WB were performed using the National Institutes of Health Image J analysis program (version 1.40. National Institutes of Health, Bethesda, MD, USA).

2.6. MicroRNAs Extraction and Real-Time PCR

Total RNA, including small RNA, was isolated from EVs using the miRNeasy Mini Kit® (Qiagen, Hilden, Germany, Cat No: 74104), following the manufacturer’s instructions. The online public miRNA bioinformatic program, TargetScan (http://www.targetscan.org/; last accessed on 6 August 2020), was used to predict miRNAs that can potentially bind to 3′UTR of human Hsp60 mRNA [45]. Next, measurement of miRNAs was performed with the miScript II RT Kit (Qiagen, Cat No: 218161) and the miScript SYBR Green PCR Kit (Qiagen). The reactions assessing the miRNAs levels were performed using the Rotor-gene™ 6000 Real-Time PCR Machine (Qiagen).
The target miRNA expression Ct (Cycle threshold) was normalized with the miR-16 Ct and the mean of Ct values of target and mean of Ct values of miR-16 were compared. The calculation was based on ΔΔCt (Livak method), and fold change values of all samples were calculated as compared to reference [46].

2.7. Statistics

All experimental results are presented as the mean ± S.E.M, with at least three independent replications. The statistically significant difference between groups was tested by one-way analysis of variance (ANOVA). Values of p ≤ 0.05 were considered statistically significant.

3. Results

The standardized methods described above were applied to the study of a small set of clinical samples, and the type of results they provide are reported below:

3.1. Patients Follow-Up

A total of 34 patients were studied, 14 with GBM, 1 with LLG (low-grade glioma), 1 with HGG (high-grade glioma) III and 18 with meningioma (Table 1A,B). Follow-up via blood sampling was completed in 31 patients. Three GBM and 1 meningioma patients died within the period of this investigation.

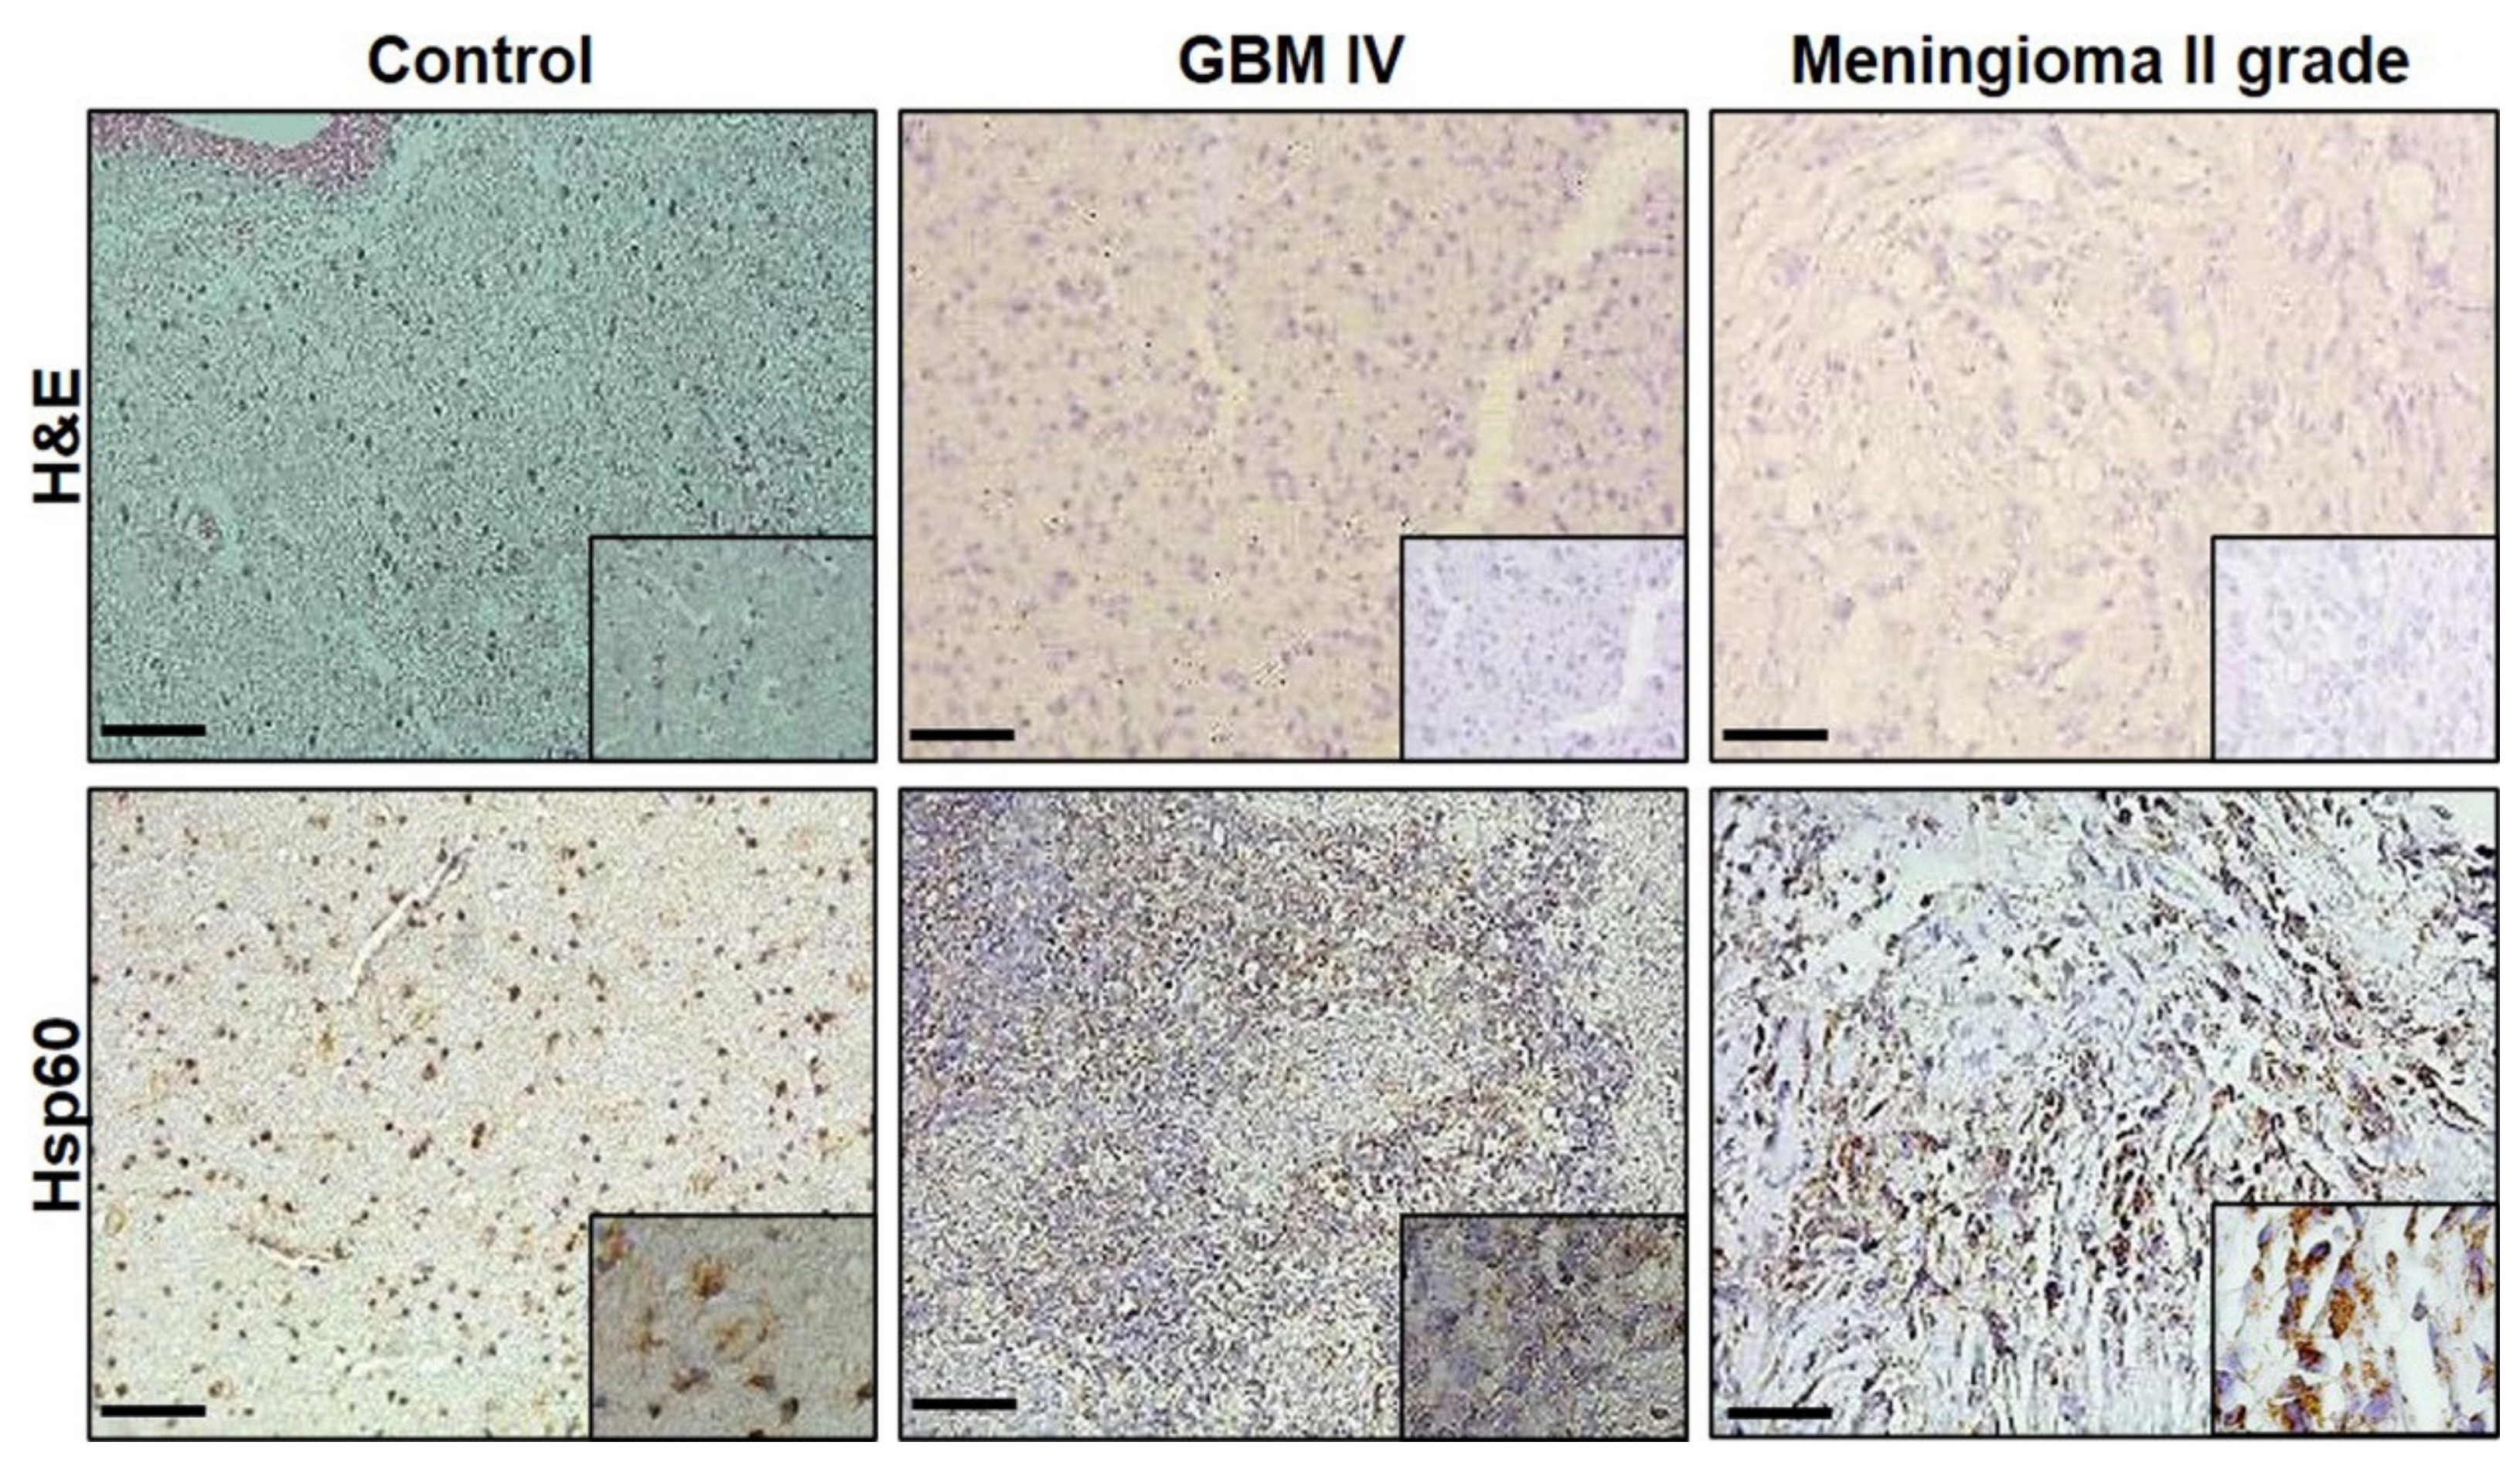
3.2. Immunomorphological Analysis

Hsp60 levels were assessed in healthy cortical brain tissue derived from autopsy, and in tumor biopsies of GBM and meningioma (Figure 1). As approved by the Palermo Ethics Committee 1, the healthy cortical brain tissue samples were taken from the histopathological archives of the University Hospital Forensic Medicine. Since the samples of healthy cortical brain tissue were obtained from the autopsy of subjects who had died of causes unrelated to brain disease, they were considered as the control group. The hematoxylin-eosin stain showed a high proliferation rate and the immunohistochemical reactions showed high levels of Hsp60 in tumor samples compared with controls. A strong, diffuse cytoplasmic positivity for the Hsp60 protein was present in 100% of the tumor specimens examined (Figure 1).

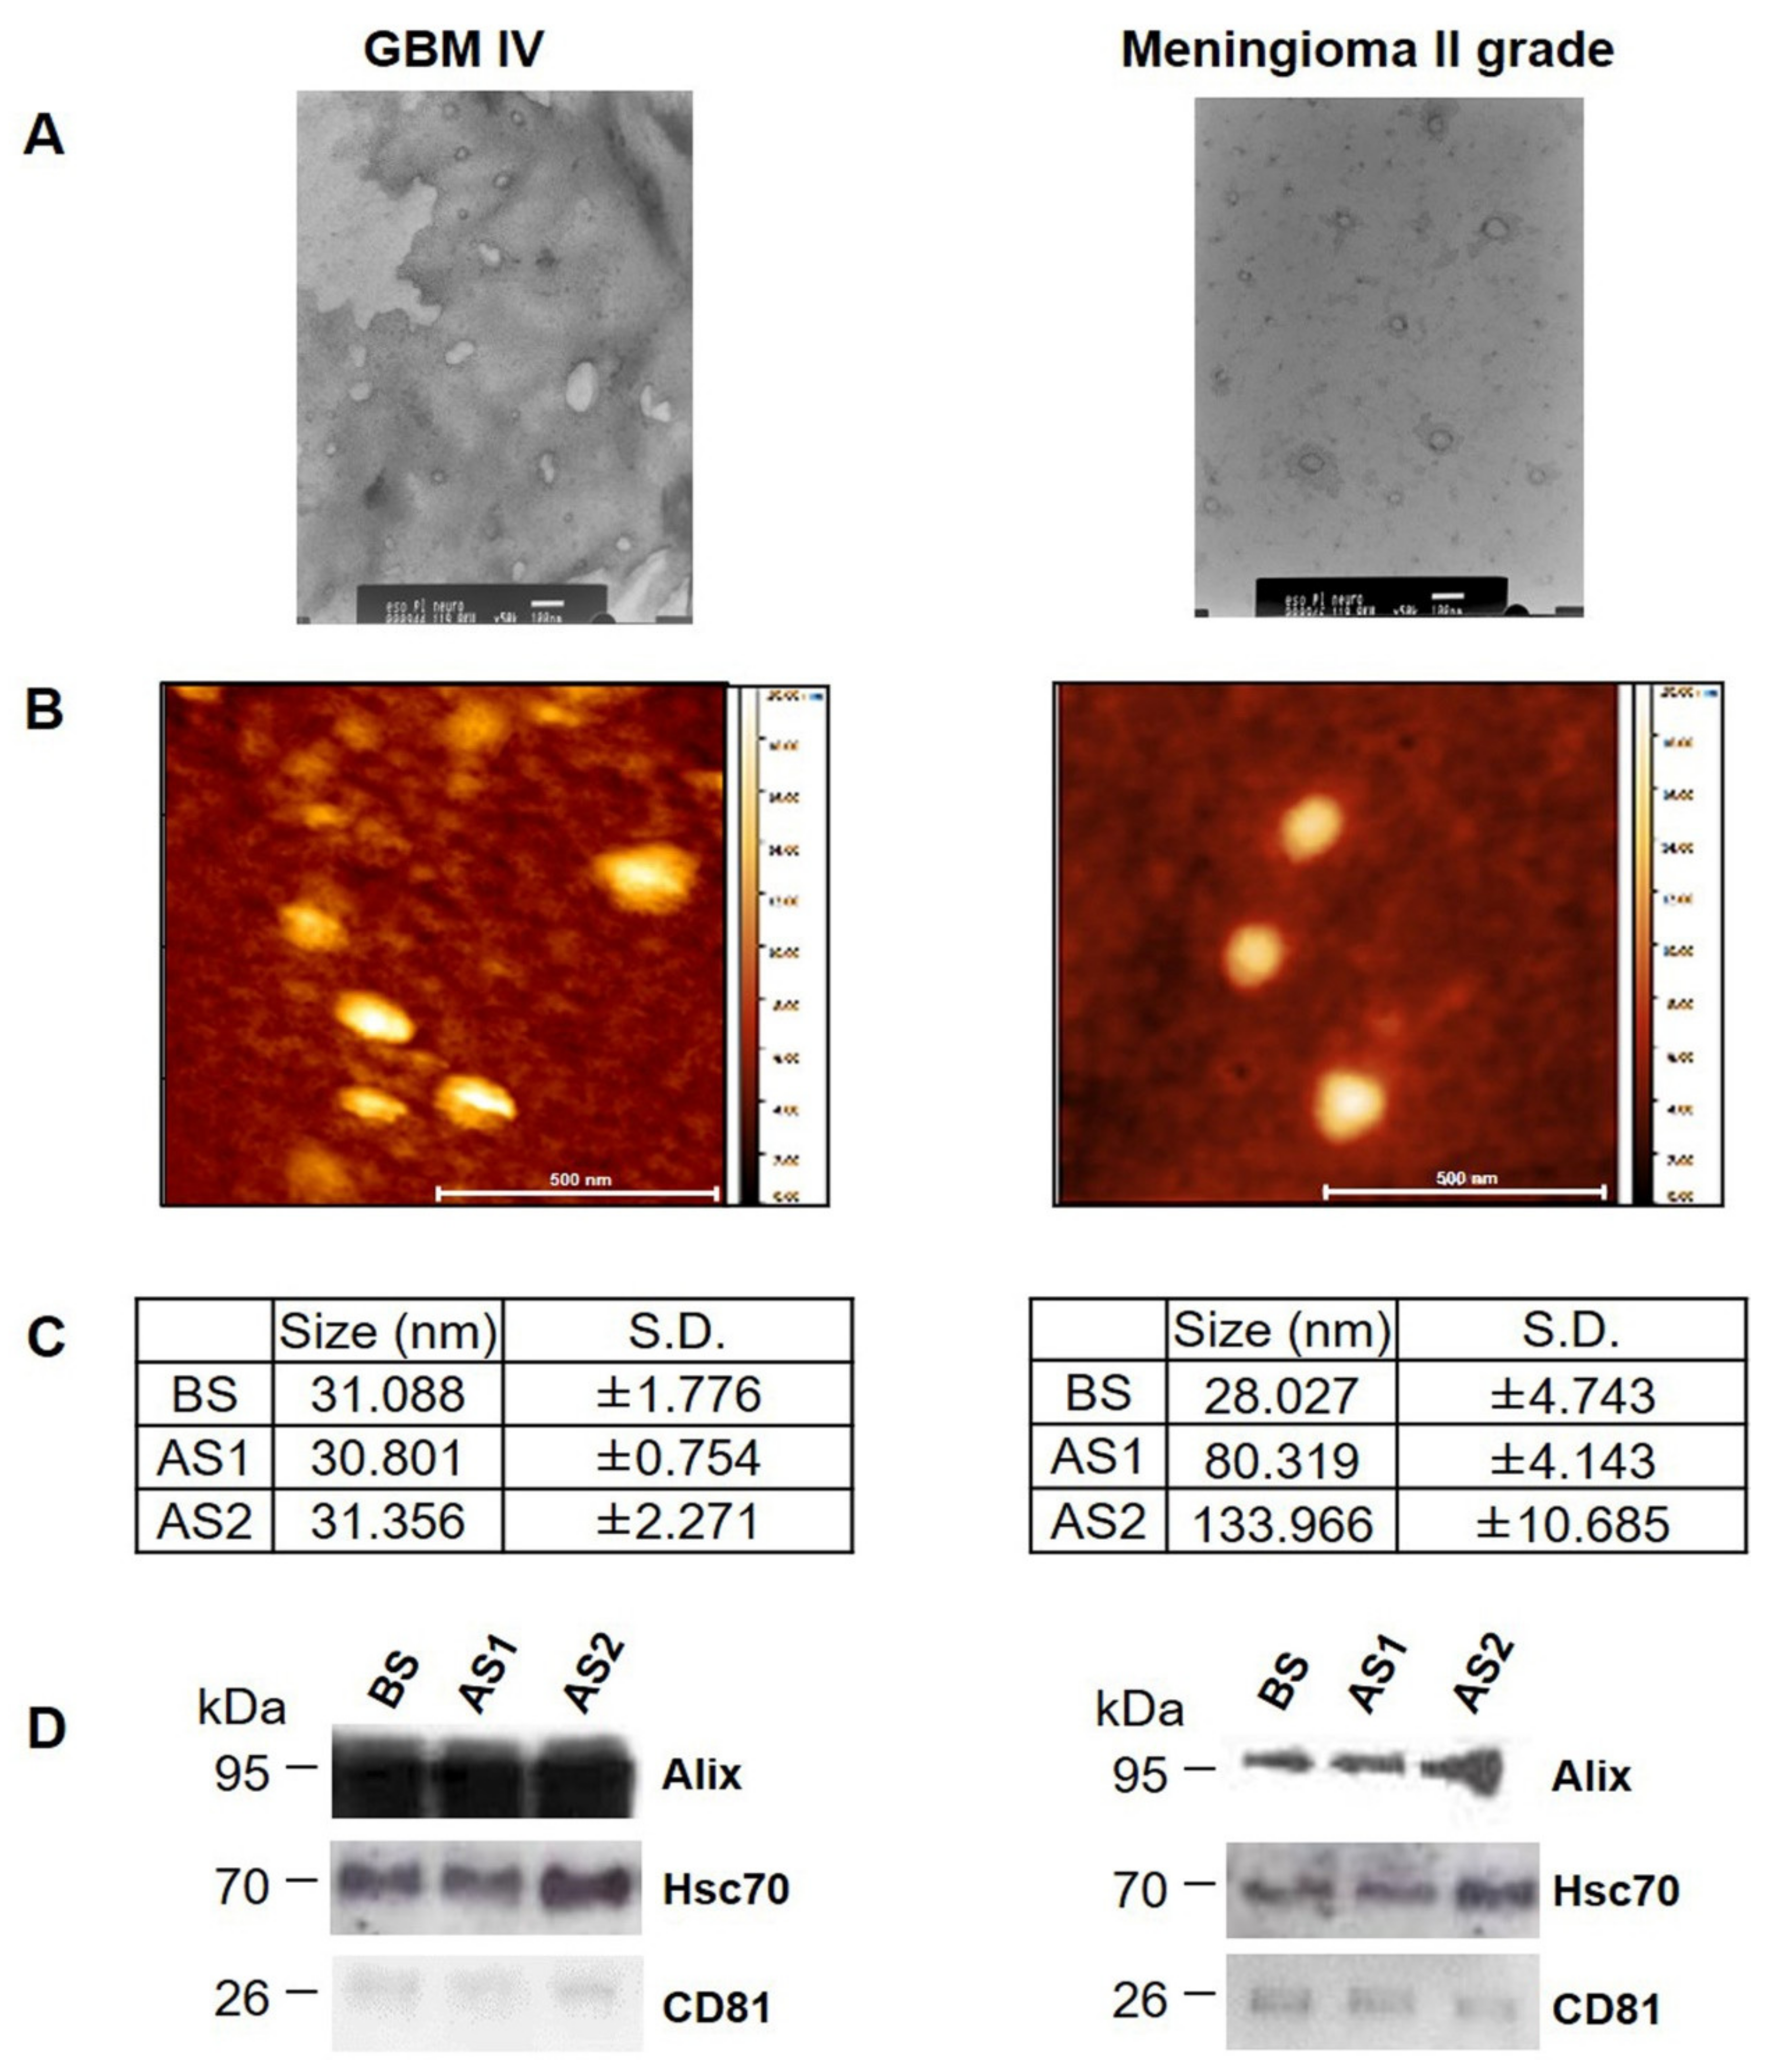
3.3. Characterization of EVs from GBM and Meningioma II Grade

EVs obtained from plasma of patients with GBM and meningioma G II, before and after surgery, were characterized by TEM, AFM, and DLS to assess size and morphology (Figure 2A–C); and by Western blot to determine the presence of the typical EV markers (protein Alix, Hsc70, and CD81) (Figure 2D). The results all agreed, demonstrating the identity of the EVs.

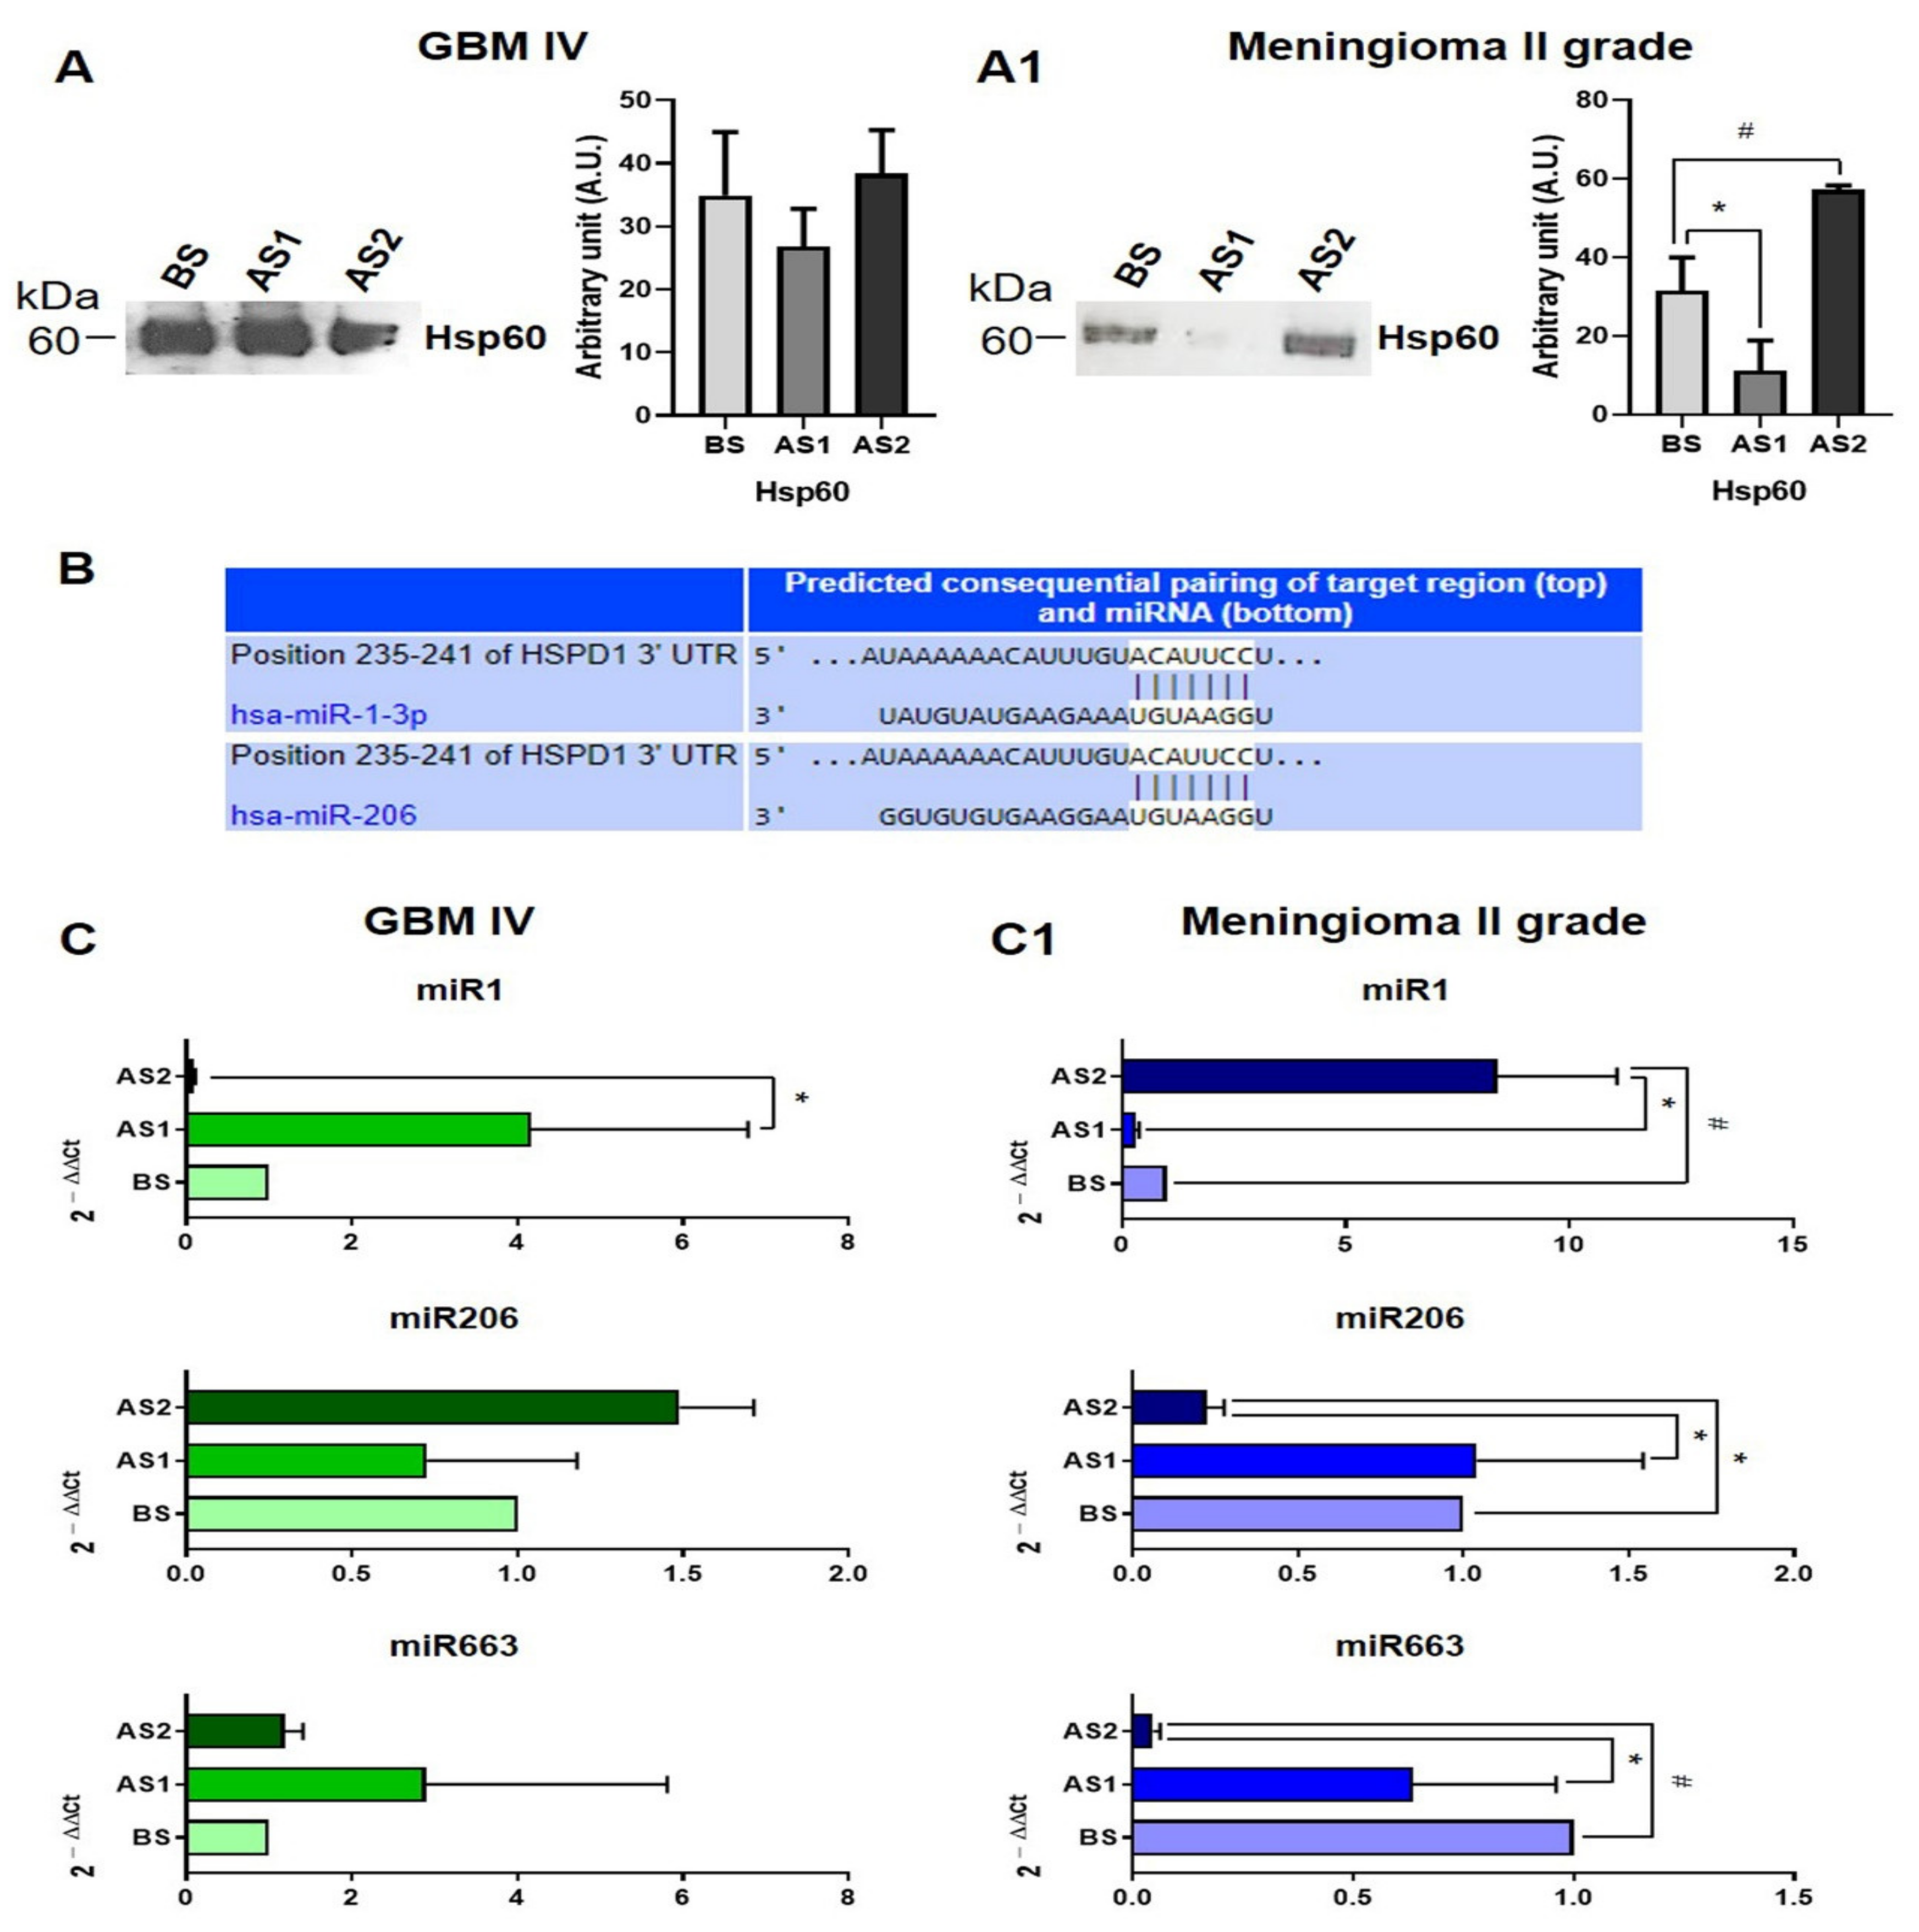
3.4. Hsp60 and Related miRNAs Levels in EVs

The levels of Hsp60 and related miRNAs were assessed in the EVs isolated from the plasma of patients before and at various times after surgery. Hsp60 levels in EVs from GBM patients were successfully measured in all the samples, with the results showing high levels throughout (Figure 3A). The Hsp60 levels in EVs isolated from plasma of patient with atypical meningiomas (WHO G II) were also successfully measured and the results showed that the methods applied can distinguish variations in the chaperonin levels in different patients/situations. For instance, 7 days after surgery, the Hsp60 levels were significantly lower than before surgery, and at 30 days after surgery, a significant increase could be detected (Figure 3A1).
TargetScan prediction revealed that the 3′ UTR of HSPD1 (the Hsp60 gene) contains a putative miR-1 and miR-206 binding site. Therefore, our attention was focused on miR-1 and miR-206 (Figure 3B), which are predicted to regulate Hsp60 expression [45] (confirmed by experimental data [20,21,22,23,24]), and miR-663, considered an in vivo GBM prognostic biomarker [47]. MiR-16 level was used for the normalization of all miRNAs levels (Table 2). The methods applied measured miRNAs successfully and the results indicated that they can detect their quantitative variations. For example, in GBM EVs, the levels of miR-206 and miR-663 did not change during the period tested, whereas the level of miR-1 was increased 30 days after surgery in comparison with the levels at 7 days after surgery (Figure 3C). Furthermore, in meningiomas, miR1, miR-206, and miR-663 showed different levels at the various time points tested. miR-1 levels were low at 7 days after surgery but were again high at 30 days. In contrast, MiR-206 and miR-663 were low at 30 days after surgery (Figure 3C1).

4. Discussion

Brain tumors have as a rule a poor prognosis and treatments are mostly of limited efficaciousness. Therefore, there is a desperate need for disease biomarkers and relevant methods that can offer insight into pathogenesis and be useful in theranostics [37,48]. To address this issue, in this work we focused on three elements pertinent to brain tumor biology, i.e., Hsp60, microRNAs that regulate Hsp60 expression [19,20,21,22,23,24], and EVs, and we standardized a battery of techniques for measuring these elements. The standardized methods provided quantitative and qualitative information on the three elements. For example, the methods were useful for determining morphology, size distribution, and the presence of specific EVs markers (Alix, Hsc70, and CD81) in the EVs isolated from plasma. The purified vesicles showed typical characteristics of small (<100 nm) and medium (<200 nm) size EVs [49]. The EVs isolated from the plasma of GBM patients were more homogeneous in size distribution during follow-up compared to EVs from atypical meningioma. This variation in size of EVs from plasma of patients with atypical meningioma could be due to disease progression, and is in line with the high variability in biochemical and biophysical properties of tumor cells-derived EVs [50,51,52,53]. The standardized methodology revealed quantitative variations of Hsp60 during time, for example, before and after ablative surgery, allowing surveyance of response to treatment.
A major limitation in brain tumor diagnosis stems from the impossibility of molecular profiling using tissue biopsies. A viable alternative is liquid biopsy, which can be obtained via a minimally invasive method such as drawing venous blood. This provides enough material for isolating EVs from plasma to measure their contents in Hsp60 and miRNAs. However, purification and characterization of EVs must be carefully done for the information to be of use to clinicians and surgeons, and to scientists willing to penetrate the secrets of the malignancy of some brain tumors. There are pitfalls that must be avoided that pertain to blood collection; plasma extraction; and specimen manipulation, storage, and testing, and these include type of anticoagulant, sample processing time and temperature, and number of freeze–thaw cycles, just to name a few. Various strict criteria should be met while assessing the physical and biochemical characteristics of EVs for the information obtained to be reliable and reproducible. Currently, the method we recommend for isolating EVs from plasma is ultracentrifugation, including density gradient-based ultracentrifugation. This approach, based on the density of the EVs, ensures a high level of purity, higher than the size-based methods, such as size-exclusion chromatography. Moreover, differential ultracentrifugation can be complemented with ultrafiltration steps to increase the yield, but this imposes a pre-established cutoff. These procedures allow the isolation of defined subpopulations of EVs, such as exosomes, excluding the EVs of larger size. However, the latter larger EVs can also provide useful biomarkers. The EVs population may be highly heterogeneous, depending on the type and/or the state of the cell from which the vesicles derive. Therefore, validation and standardization of the EVs isolation and characterization methods must be carefully done, before applying them to the management of brain tumors patients [49]. Furthermore, the EVs cargo includes a wide range of biomarkers that can be different between EVs subtypes, a diversity not yet fully characterized for all tumors and conditions [49].
In the present work, we propose a set of standardized methods that produce a plethora of complementary results, providing a quantitative picture of three key disease players, Hsp60 and related miRNAs and EVs that can easily be sampled by liquid biopsy (Figure 4). The methods are now available to study more samples from more patients to reveal the quantitative profiles of the triad components comparing results at various times after surgery with pre-operatory data. In this way, standard curves will be obtained for general application when the adequate number of cases has been tested.
A limitation of our study is that it focused on only one CS component, namely, Hsp60. Most likely other CS components such as chaperones of the Hsp70 and Hsp90 families and other chaperonins, e.g., CCT, also play a role in brain carcinogenesis. Our methodology can be applied to measure them with the pertinent adaptations, which should easily be implemented since they will consist mostly of the use of specific antibodies and primers.

Author Contributions

Conceptualization, methodology, software, validation, formal analysis investigation resources, data curation, writing—original draft preparation, writing—review and editing visualization supervision, project administration, funding acquisition: F.G., and C.C.B.; Project administration, funding acquisition, writing—review and editing, visualization supervision: D.G.I., C.C., G.F.N., E.C.d.M., and A.J.L.M.; Software, validation, formal analysis investigation resources: G.C., G.S., A.G.G., R.P., and A.M.F. All authors have read and agreed to the published version of the manuscript.

Funding

Part of this work was funded by the Italian National Operational Programme (PON) for Research and Competitiveness 2007–2013; grant awarded by the Italian Ministry of University and Research to the project titled “Cyber Brain—Polo di innovazione” (Project code: PONa3_00210, European Regional Development Fund). A.J.L.M. and E.C. de M. were partially supported by IMET. This is IMET contribution number IMET 21-005.

Institutional Review Board Statement

The study was conducted according to the guidelines of the Declaration of Helsinki, and approved by Palermo Ethics Committee I (number 11\2018).

Informed Consent Statement

Informed consent was obtained from all subjects involved in the study.

Acknowledgments

A.J.L.M. and E.C. de M. were partially supported by IMET. This is IMET contribution number IMET 21-005.

Conflicts of Interest

The authors report no conflict of interest.

References

  1. Ostrom, Q.T.; Cioffi, G.; Gittleman, H.; Patil, N.; Waite, K.; Kruchko, C.; Barnholtz-Sloan, J.S. CBTRUS statistical report: Primary brain and other central nervous system tumors diagnosed in the united states in 2012–2016. Neurooncology 2019, 21, v1–v100. [Google Scholar] [CrossRef] [PubMed]
  2. Tan, A.C.; Ashley, D.M.; López, G.Y.; Malinzak, M.; Friedman, H.S.; Khasraw, M. Management of glioblastoma: State of the art and future directions. CA A Cancer J. Clin. 2020, 70, 299–312. [Google Scholar] [CrossRef] [PubMed]
  3. Alifieris, C.; Trafalis, D.T. Glioblastoma multiforme: Pathogenesis and treatment. Pharmacol. Ther. 2015, 152, 63–82. [Google Scholar] [CrossRef] [PubMed]
  4. Ashby, L.S.; Ryken, T.C. Management of malignant glioma: Steady progress with multimodal approaches. Neurosurg. Focus 2006, 20, E3. Available online: https://pubmed.ncbi.nlm.nih.gov/16709034/ (accessed on 4 January 2021). [CrossRef] [PubMed]
  5. Ryken, T.C.; Frankel, B.; Julien, T.; Olson, J.J. Surgical management of newly diagnosed glioblastoma in adults: Role of cytoreductive surgery. J. Neuro-Oncology 2008, 89, 271–286. [Google Scholar] [CrossRef]
  6. Brancato, V.; Nuzzo, S.; Tramontano, L.; Condorelli, G.; Salvatore, M.; Cavaliere, C. Predicting survival in glioblastoma patients using diffusion MR imaging metrics—A systematic review. Cancers 2020, 12, 2858. [Google Scholar] [CrossRef]
  7. Montemurro, N.; Anania, Y.; Cagnazzo, F.; Perrini, P. Survival outcomes in patients with recurrent glioblastoma treated with Laser Interstitial Thermal Therapy (LITT): A systematic review. Clin. Neurol. Neurosurg. 2020, 195, 105942. [Google Scholar] [CrossRef] [PubMed]
  8. Zang, L.; Kondengaden, S.M.; Che, F.; Wang, L.; Heng, X. Potential epigenetic-based therapeutic targets for glioma. Front. Mol. Neurosci. 2018, 11, 408. [Google Scholar] [CrossRef]
  9. Liu, L.; Wang, G.; Wang, L.; Yu, C.; Li, M.; Song, S.; Hao, L.; Ma, L.; Zhang, Z. Computational identification and characterization of glioma candidate biomarkers through multi-omics integrative profiling. Biol. Direct 2020, 15, 1–14. [Google Scholar] [CrossRef]
  10. Macario, A.J.L.; Conway de Macario, E. Chaperone proteins and chaperonopathies. In Handbook of Stress; Stress Physiology, Biochemistry, and Pathology; Fink, G., Ed.; Elsevier/Academic Press: Cambridge, MA, USA, 2019; Volume 3, Chapter 12; pp. 135–152. [Google Scholar] [CrossRef]
  11. Kocaturk, N.M.; Gozuacik, D. Crosstalk between mammalian autophagy and the ubiquitin-proteasome system. Front. Cell Dev. Biol. 2018, 6, 128. [Google Scholar] [CrossRef]
  12. Tekirdag, K.; Cuervo, A.M. Chaperone-mediated autophagy and endosomal microautophagy: Jointed by a chaperone. J. Biol. Chem. 2018, 293, 5414–5424. [Google Scholar] [CrossRef] [PubMed] [Green Version]
  13. Macario, A.J.L.; Conway de Macario, E. Molecular mechanisms in chaperonopathies: Clues to understanding the histopathological abnormalities and developing novel therapies. J. Pathol. 2020, 250, 9–18. [Google Scholar] [CrossRef] [Green Version]
  14. Rappa, F.; Unti, E.; Baiamonte, P.; Cappello, F.; Scibetta, N. Different immunohistochemical levels of Hsp60 and Hsp70 in a subset of brain tumors and putative role of Hsp60 in neuroepithelial tumorigenesis. Eur. J. of Histochem. 2013, 57, 20. [Google Scholar] [CrossRef] [Green Version]
  15. Alexiou, G.A.; Vartholomatos, G.; Stefanaki, K.; Patereli, A.; Dova, L.; Karamoutsios, A.; Lallas, G.; Sfakianos, G.; Moschovi, M.; Prodromou, N. Expression of heat shock proteins in medulloblastoma. J. Neurosurgery Pediatr. 2013, 12, 452–457. [Google Scholar] [CrossRef] [PubMed]
  16. Caruso Bavisotto, C.; Marino Gammazza, A.; Lo Cascio, F.; Mocciaro, E.; Vitale, A.M.; Vergilio, G.; Pace, A.; Cappello, F.; Campanella, C.; Palumbo Piccionello, A. Curcumin affects HSP60 folding activity and levels in neuroblastoma cells. Int. J. Mol. Sci. 2020, 21, 661. [Google Scholar] [CrossRef] [Green Version]
  17. Alexiou, G.A.; Karamoutsios, A.; Lallas, G.; Ragos, V.; Goussia, A.; Kyritsis, A.P.; Voulgaris, S.; Vartholomatos, G. Expression of heat shock proteins in brain tumors. Turk. Neurosurg. 2014, 24, 745–749. [Google Scholar] [CrossRef] [Green Version]
  18. Tang, H.; Li, J.; Liu, X.; Wang, G.; Luo, M.; Deng, H. Down-regulation of HSP60 suppresses the proliferation of glioblastoma cells via the ROS/AMPK/mTOR pathway. Sci. Rep. 2016, 6, 28388. [Google Scholar] [CrossRef] [PubMed] [Green Version]
  19. Shan, Z.-X.; Lin, Q.-X.; Deng, C.-Y.; Zhu, J.-N.; Mai, L.-P.; Liu, J.-L.; Fu, Y.-H.; Liu, X.-Y.; Li, Y.-X.; Zhang, Y.-Y.; et al. miR-1/miR-206 regulate Hsp60 expression contributing to glucose-mediated apoptosis in cardiomyocytes. FEBS Lett. 2010, 584, 3592–3600. [Google Scholar] [CrossRef] [Green Version]
  20. Pan, Z.; Sun, X.; Ren, J.; Li, X.; Gao, X.; Lu, C.; Zhang, Y.; Sun, H.; Wang, Y.; Wang, H.; et al. miR-1 exacerbates cardiac ischemia-reperfusion injury in mouse models. PLoS ONE 2012, 7, e50515. [Google Scholar] [CrossRef]
  21. Neumann, E.; Brandenburger, T.; Santana-Varela, S.; Deenen, R.; Köhrer, K.; Bauer, I.; Hermanns, H.; Wood, J.N.; Zhao, J.; Werdehausen, R. MicroRNA-1-associated effects of neuron-specific brain-derived neurotrophic factor gene deletion in dorsal root ganglia. Mol. Cell. Neurosci. 2016, 75, 36–43. [Google Scholar] [CrossRef] [PubMed]
  22. Choghaei, E.; Khamisipour, G.; Falahati, M.; Naeimi, B.; Mossahebi-Mohammadi, M.; Tahmasebi, R.; Hasanpour, M.; Shamsian, S.; Hashemi, Z.S. Knockdown of microRNA-29a changes the expression of heat shock proteins in breast carcinoma MCF-7 cells. Oncol. Res. Featur. Preclin. Clin. Cancer Ther. 2016, 23, 69–78. [Google Scholar] [CrossRef] [Green Version]
  23. Hu, Y.; Chen, X.; Li, X.; Li, Z.; Diao, H.; Liu, L.; Zhang, J.; Ju, J.; Wen, L.; Liu, X.; et al. MicroRNA-1 downregulation induced by carvedilol protects cardiomyocytes against apoptosis by targeting heat shock protein 60. Mol. Med. Rep. 2019, 19, 3527–3536. [Google Scholar] [CrossRef]
  24. Wang, L.L.; Dong, J.J.; An, B.Z.; Liang, J.; Cai, K.R.; Jin, Z.S.; Jin, H.S.; Hu, J.P. HAS-MIR-17 increases the malignancy of gastric lymphoma by HSP60/TNFR2 pathway. J. Biol. Regul. Homeost. Agents 2020, 34, 1317–1324. [Google Scholar] [CrossRef]
  25. Cesarini, V.; Silvestris, D.A.; Tassinari, V.; Tomaselli, S.; Alon, S.; Eisenberg, E.; Locatelli, F.; Gallo, A. ADAR2/miR-589-3p axis controls glioblastoma cell migration/invasion. Nucleic Acids Res. 2018, 46, 2045–2059. [Google Scholar] [CrossRef]
  26. Banelli, B.; Forlani, A.; Allemanni, G.; Morabito, A.; Pistillo, M.P.; Romani, M. MicroRNA in glioblastoma: An overview. Int. J. Genom. 2017, 2017, 7639084. [Google Scholar] [CrossRef] [PubMed] [Green Version]
  27. Ludwig, N.; Kim, Y.-J.; Mueller, S.C.; Backes, C.; Werner, T.V.; Galata, V.; Sartorius, E.; Bohle, R.M.; Keller, A.; Meese, E. Posttranscriptional deregulation of signaling pathways in meningioma subtypes by differential expression of miRNAs. Neurooncology 2015, 17, 1250–1260. [Google Scholar] [CrossRef] [Green Version]
  28. Kol, A.; Lichtman, A.H.; Finberg, R.W.; Libby, P.; Kurt-Jones, E.A. Cutting Edge: Heat Shock Protein (HSP) 60 activates the innate immune response: CD14 is an essential receptor for HSP60 activation of mononuclear cells. J. Immunol. 2000, 164, 13–17. [Google Scholar] [CrossRef] [PubMed] [Green Version]
  29. Flohé, S.B.; Brüggemann, J.; Lendemans, S.; Nikulina, M.; Meierhoff, G.; Flohé, S.; Kolb, H. Human heat shock protein 60 induces maturation of dendritic cells versus a Th1-promoting phenotype. J. Immunol. 2003, 170, 2340–2348. [Google Scholar] [CrossRef] [PubMed] [Green Version]
  30. Gupta, S.; Knowlton, A.A. HSP60 trafficking in adult cardiac myocytes: Role of the exosomal pathway. Am. J. Physiol. Heart Circ. Physiol. 2007, 292, H3052–H3056. [Google Scholar] [CrossRef] [Green Version]
  31. Hayoun, D.; Kapp, T.; Edri-Brami, M.; Ventura, T.; Cohen, M.; Avidan, A.; Lichtenstein, R.G. HSP60 is transported through the secretory pathway of 3-MCA-induced fibrosarcoma tumour cells and undergoes N-glycosylation. FEBS J. 2012, 279, 2083–2095. [Google Scholar] [CrossRef] [Green Version]
  32. Campanella, C.; Bucchieri, F.; Merendino, A.M.; Fucarino, A.; Burgio, G.; Corona, D.F.V.; Barbieri, G.; David, S.; Farina, F.; Zummo, G.; et al. The odyssey of Hsp60 from tumor cells to other destinations includes plasma membrane-associated stages and golgi and exosomal protein-trafficking modalities. PLoS ONE 2012, 7, e42008. [Google Scholar] [CrossRef] [PubMed] [Green Version]
  33. Cruz Junho, C.V.; Trentin-Sonoda, M.; Alvim, J.M.; Gaisler-Silva, F.; Carneiro-Ramos, M.S. Ca2+/Calmodulin-dependent kinase II delta B is essential for cardiomyocyte hypertrophy and complement gene expression after LPS and HSP60 stimulation in vitro. Braz. J. Med Biol. Res. 2019, 52, e8732. [Google Scholar] [CrossRef] [PubMed] [Green Version]
  34. Cui, X.; Liu, Y.; Wang, S.; Zhao, N.; Qin, J.; Li, Y.; Fan, C.; Shan, Z.; Teng, W. Circulating exosomes activate dendritic cells and induce unbalanced CD4+ t cell differentiation in Hashimoto thyroiditis. J. Clin. Endocrinol. Metab. 2019, 104, 4607–4618. [Google Scholar] [CrossRef] [PubMed]
  35. Zabegina, L.; Nazarova, I.; Knyazeva, M.; Nikiforova, N.; Slyusarenko, M.; Titov, S.; Vasilyev, D.; Sleptzov, I.; Malek, A. miRNA let-7 from TPO(+) extracellular vesicles is a potential marker for a differential diagnosis of follicular thyroid nodules. Cells 2020, 9, 1917. [Google Scholar] [CrossRef]
  36. Graziano, F.; Caruso Bavisotto, C.; Marino Gammazza, A.; Rappa, F.; Conway de Macario, E.; Macario, A.J.L.; Cappello, F.; Campanella, C.; Maugeri, R.; Iacopino, D.G. Chaperonology: The third eye on brain gliomas. Brain Sci. 2018, 8, 110. [Google Scholar] [CrossRef] [PubMed] [Green Version]
  37. Caruso Bavisotto, C.; Graziano, F.; Rappa, F.; Marino Gammazza, A.; Logozzi, M.; Fais, S.; Maugeri, R.; Bucchieri, F.; Conway de Macario, E.; Macario, A.J.L.; et al. Exosomal chaperones and miRNAs in gliomagenesis: State-of-art and theranostics perspectives. Int. J. Mol. Sci. 2018, 19, 2626. [Google Scholar] [CrossRef] [Green Version]
  38. Campanella, C.; Caruso Bavisotto, C.; Marino Gammazza, A.; Nikolic, D.; Rappa, F.; David, S.; Cappello, F.; Bucchieri, F.; Fais, S. Exosomal heat shock proteins as new players in tumour cell-to-cell communication. J. Circ. Biomarkers 2014, 3, 4. [Google Scholar] [CrossRef] [Green Version]
  39. Caruso Bavisotto, C.; Cappello, F.; Macario, A.J.L.; Conway de Macario, E.; Logozzi, M.; Fais, S.; Campanella, C. Exosomal HSP60: A potentially useful biomarker for diagnosis, assessing prognosis, and monitoring response to treatment. Expert Rev. Mol. Diagn. 2017, 17, 815–822. [Google Scholar] [CrossRef]
  40. Caruso Bavisotto, C.; Marino Gammazza, A.; Rappa, F.; Fucarino, A.; Pitruzzella, A.; David, S.; Campanella, C. Exosomes: Can doctors still ignore their existence? EuroMediterr. Biomed. J. 2013, 8. [Google Scholar] [CrossRef]
  41. Stupp, R.; Mason, W.P.; van den Bent, M.J.; Weller, M.; Fisher, B.; Taphoorn, M.J.B.; Belanger, K.; Brandes, A.A.; Marosi, C.; Bogdahn, U.; et al. Radiotherapy plus concomitant and adjuvant temozolomide for glioblastoma. N. Engl. J. Med. 2005, 352, 987–996. [Google Scholar] [CrossRef] [PubMed]
  42. Stupp, R.; Hegi, M.E.; Mason, W.P.; Bent, M.J.V.D.; Taphoorn, M.J.B.; Janzer, R.C.; Ludwin, S.K.; Allgeier, A.; Fisher, B.; Belanger, K.; et al. Effects of radiotherapy with concomitant and adjuvant temozolomide versus radiotherapy alone on survival in glioblastoma in a randomised phase III study: 5-year analysis of the EORTC-NCIC trial. Lancet Oncol. 2009, 10, 459–466. [Google Scholar] [CrossRef]
  43. Caruso Bavisotto, C.; Cipolla, C.; Graceffa, G.; Barone, R.; Bucchieri, F.; Bulone, D.; Cabibi, D.; Campanella, C.; Marino Gammazza, A.; Pitruzzella, A.; et al. Immunomorphological pattern of molecular chaperones in normal and pathological thyroid tissues and circulating exosomes: Potential use in clinics. Int. J. Mol. Sci. 2019, 20, 4496. [Google Scholar] [CrossRef] [Green Version]
  44. Campanella, C.; Rappa, F.; Sciumè, C.; Marino Gammazza, A.; Barone, R.; Bucchieri, F.; David, S.; Curcurù, G.; Caruso Bavisotto, C.; Pitruzzella, A.; et al. Heat shock protein 60 levels in tissue and circulating exosomes in human large bowel cancer before and after ablative surgery. Cancer 2015, 121, 3230–3239. [Google Scholar] [CrossRef] [PubMed]
  45. TargetScan. TargetScanHuman 7.2 Predicted Targeting of Human HSPD1. Available online: http://www.targetscan.org/cgi-bin/targetscan/vert_72/view_gene.cgi?rs=ENST00000388968.3&taxid=9606&members=&showcnc=0&shownc=0&showncf1=&showncf2=&subset=1#miR-1-3p/206 (accessed on 6 August 2020).
  46. Schmittgen, T.D.; Livak, K.J. Analyzing real-time PCR data by the comparative CT method. Nat. Protoc. 2008, 3, 1101–1108. [Google Scholar] [CrossRef]
  47. Shi, Y.; Chen, C.; Yu, S.-Z.; Liu, Q.; Rao, J.; Zhang, H.-R.; Xiao, H.-L.; Fu, T.-W.; Long, H.; He, Z.-C.; et al. miR-663 suppresses oncogenic function of CXCR4 in glioblastoma. Clin. Cancer Res. 2015, 21, 4004–4013. [Google Scholar] [CrossRef] [Green Version]
  48. Lammers, T.; Aime, S.; Hennink, W.E.; Storm, G.; Kiessling, F. Theranostic Nanomedicine. Acc. Chem. Res. 2011, 44, 1029–1038. [Google Scholar] [CrossRef]
  49. Théry, C.; Witwer, K.W.; Aikawa, E.; Alcaraz, M.J.; Anderson, J.D.; Andriantsitohaina, R.; Antoniou, A.; Arab, T.; Archer, F.; Atkin-Smith, G.K.; et al. Minimal information for studies of extracellular vesicles 2018 (MISEV2018): A position statement of the International Society for Extracellular Vesicles and update of the MISEV2014 guidelines. J. Extracell. Vesicles 2018, 7, 1535750. [Google Scholar] [CrossRef] [PubMed] [Green Version]
  50. Shen, W.; Guo, K.; Adkins, G.B.; Jiang, Q.; Liu, Y.; Sedano, S.; Duan, Y.; Yan, W.; Wang, S.E.; Bergersen, K.; et al. A Single Extracellular Vesicle (EV) flow cytometry approach to reveal EV heterogeneity. Angew. Chem. Int. Ed. 2018, 57, 15675–15680. [Google Scholar] [CrossRef]
  51. Willms, E.; Cabañas, C.; Mäger, I.; Wood, M.J.A.; Vader, P. Extracellular vesicle heterogeneity: Subpopulations, isolation techniques, and diverse functions in cancer progression. Front. Immunol. 2018, 9, 738. [Google Scholar] [CrossRef] [PubMed] [Green Version]
  52. Caruso Bavisotto, C.; Scalia, F.; Marino Gammazza, A.; Carlisi, D.; Bucchieri, F.; Conway de Macario, E.; Macario, A.J.L.; Cappello, F.; Campanella, C. Extracellular vesicle-mediated cell–cell communication in the nervous system: Focus on neurological diseases. Int. J. Mol. Sci. 2019, 20, 434. [Google Scholar] [CrossRef] [PubMed] [Green Version]
  53. Colombo, M.; Moita, C.; Van Niel, G.; Kowal, J.; Vigneron, J.; Benaroch, P.; Manel, N.; Moita, L.F.; Théry, C.; Raposo, G. Analysis of ESCRT functions in exosome biogenesis, composition and secretion highlights the heterogeneity of extracellular vesicles. J. Cell Sci. 2013, 126, 5553–5565. [Google Scholar] [CrossRef] [PubMed] [Green Version]
Figure 1. Illustrative examples of the histological and immunohistochemical images provided by the methods used when applied to the study of control and tumor tissues. Top three panels. Hematoxylin-eosin (H&E)-stained tissue sections of Control, and GBM IV, and Meningioma II grade tissues. Bottom three panels. (Hsp60). Immunohistochemical demonstration of Hsp60 in Control, and GBM IV, and Meningioma II grade. Magnification of 200×; insert magnification of 400× Bar = 100 µm.
Applsci 11 02867 g001
Figure 2. EV characterization. Representative TEM (A) and AFM (B) images showing the typical characteristics of EVs isolated from the plasma of patients with GBM IV (left) and Meningioma II grade (right). (C) Table showing the size, measured by DLS, of the EVs isolated from blood of patients at different times of follow-up: BS, Before Surgery; AS1, 7 days After Surgery; AS2, 30 days After Surgery. (D) Evaluation by WB of EVs markers in the EVs from patients with GBM IV (left) and Meningioma II grade (right), at different times of follow-up.
Applsci 11 02867 g002
Figure 3. Measurement of Hsp60 and related miRNAs levels in EVs. Western blots and corresponding histograms showing the presence and levels of Hsp60 in EVs from patients with GBM IV (A) and in patients with meningioma II grade, at different times of follow-up (A1). BS, Before Surgery; AS1, 7 days After Surgery; AS2, 30 days After Surgery. Visible are the high levels of Hsp60 revealed by the standardized procedure in EVs from patients with GBM IV and from patients with meningioma II grade. In the latter, the method revealed differences of Hsp60 levels before and after surgery that were statistically significant (data are presented as the mean ± S.D. * p < 0.05; # p < 0.01). (B) Predicted miR-1 and miR-206 binding sites detected in the HSPD1 3′ UTR region by TargetScan and the underlined base pairs indicate the target region we adopted. (C) Examples of results of our measurements with real-time PCR of the levels of miR1, miR-206, and miR-663 in EVs isolated from blood of GBM IV and from meningioma II grade patients (C1) The data in the horizontal histograms were normalized with the reference genes, according to the Livak method (2−∆∆CT). Data are presented as the mean ± S.D. * p < 0.05; # p < 0.01.
Applsci 11 02867 g003
Figure 4. Drawing representing the hypothetical dynamics of Hsp60 from the tumor to the peripheral blood that could be investigated with the methodology described. Hsp60 and related miRNAs can be quantified with the methods used in this study in liquid biopsies containing EVs released by the tumor. This approach is doable in routine settings and would provide a wealth of information of practical and scientific interest that could help in finding ways to improve the management of patients with brain tumors.
Applsci 11 02867 g004
Table 1. (A) Key data on GMB patients and follow-up. (B) Key data on meningioma patients and follow-up.
(A)
Pt aSex/Age (years)Brain SiteHistopathology bFollow-Up
Molecular BS-AS1-AS2Clinical/Months
1M/65Left temporal-peritrigonalHGG GBM IV WHO NOS: GFAP+, IDH+, Synaptofisin-; Ki67+ <10%C14
2M/57Right frontalHGG GBM IV WHO NOS: p53+, GFAP+, CAM 5.2-; Ki67 > 60%C10
3M/60Left temporo-parietalLGG II WHO: GFAP+, Synaptofisin+, Ki67+ < 3%C12
4M/55Left fronto-temporalHGG GBM IV WHO NOS: GFAP++, PanCK+, Ki67+ > 30%C8
5F/65Right fronto-temporo-parietalHGG GBM IV WHO IDH mutant: Framments HGG: GFAP+, IDH+, p53+ > 3%; Ki67+ > 30%: Framments Anaplastic Astrocitoma: Ki67+ < 5%C9
6F/70Left fronto-temporal-peritrigonalHGG III WHO NOS: High differentiated elements: GFAP +, S-100+, synaptofisin +, rounded cells. CD57+, vimentin+, GFAP-, NSE-, synaptofisin- with Ki67 15%, CAM 5.2 -, PanCK -, p53 -, factor XIII -, desmin -, CD68 -, CD45 -I5;D
7F/58Right frontalHGG GBM IV NOS: GFAP+; S-100+; Synaptofisin-; NSE-; CD34-; Ki-67+: 30%C4; D
8M/60Left temporo-parietalHGG GBM IV NOS: GFAP (+/-), S100 (+), p53 (+/-), synaptofisin -, CD57 -, CD99 -, Cam 5.2-, bcatenin -, CD45-, Ki67 30%C12
9M/67Left frontalHGG GBM IV NOS: GFAP+, Synaptofisin-, NSE+/-, Vimentin +/-; Ki-67+: 30% S-100+C10
10F/56Right temporo-parietalHGG GBM IV IDH mutant: GFAP+, S100+, synaptofisin-, PanCK+, p53+, IDH+; Ki67 > 35%C14
11M/68Left frontalHGG GBM IV NOS: GFAP+, synaptofisin+, PanCK+, Ki67 30%I5; R
12F/58Left frontalHGG GBM IV NOS: GFAP+++; synaptofisin -; Ki67 + 25%I5
13M/63Right temporo-parietalHGG GBM IV NOS: LARGE CELLS GFAP+, S100+, PanCK+, p53+/-, synaptofisin-, c-myc-, CD45-, CD20-, CD57-, NSE-, CD99+/-, neurofilaments-. SMALL CELLS GFAP-, S100 -/+, PanCK-, p53+/-, synaptofisin-, c-myc-, CD45-, CD20-, CD57-, NSE-/+, CD99+/-, neurofilaments-C18
14M/72Right parietalHGG GBM IV IDH wild type: GFAP+, synaptofisin-, Ki-67+ 20%.C6; R
15M/59Left frontalHGG GBM IV IDH MUTANT: GFAP+, synaptofisin-, IDH +, CD34+, Ki67 30%C10
16M/64Left fronto-parietalHGG GBM IV NOS: GFAP+, CD34-, synaptofisin-, Ki67 30%C8; R
(B)
Pt aSex/Age (years)Anatomical SiteHistopathological Classification bFollow-Up
Molecular BS-AS1-AS2Clinical /Months
1M/60Right temporal convexityAngiomatous meningioma G IC14
2F/55Right convexity frontalFibrous meningioma G IC10
3M/60Left parietal convexityAtypical meningioma G IIC12
4F/54Fronto-basal/Olfactory grooveAngiomatous meningioma G IC8
5F/60Parafalcine parietal convexityTransitional meningioma G IC9
6F/70Temporal CPAMeningothelial meningioma G IC10
7M/60Right convexity frontalAtypical meningioma G IIC12
8M/68Occipital/TentorialTransitional meningioma G IC12
9F/62Left temporal convexityMeningothelial meningioma G IC10
10F/50Occipital-Foramen Magnum Fibrous meningioma G IC14
11M/72Left frontal convexityAtypical meningioma G IIC
12F/65Right temporal-sphenoid wingAtypical meningioma G IIC5
13M/68Fronto-basal/PlanumTransitional meningioma G IC18
14M/71Parafalcine frontoparietal convexityAtypical meningiomas G IIC12; D
15F/59Skull base/olfactory grooveAtypical meningioma G IIC10
16M/67Parafalicine left parietal convexityAtypical meningioma G IIC8
17F/48Temporal-CPAFibrous meningioma G IC12
18M/69Right frontal convexityMeningothelial meningioma G IC10
(A) a Abbreviations: GBM, glioblastoma multiforme; Pt, patient; HGG, high-grade glioma; LGG, low-grade glioma; M, male; F, female; C, complete; I, incomplete; D, Death; R, recurrence; NOS, not otherwise specified; GFAP, Glial fibrillary acidic protein; IDH, Isocitrate-dehydrogenases; PanCK, Protein kinase; NSE, Neuron-Specific Enolase; BS time 0- before surgery; AS1 time 1- at 1 week from surgery; AS2 time II- at one month from surgery (see text for details). b According to WHO 2016 guidelines. (B) a Abbreviations. Pt, patient; M, male; F, female; G, grade; CPA, cerebellopontine angle; C, complete; D, death; BS time 0- before surgery; AS1 time 1- at 1 week from surgery; AS2 time II- at one month from surgery (see text for details). b According to WHO 2016 guidelines.
Table 2. Primers used for real-time PCR.
NameSequence
Hs_miR-1_25′-UGGAAUGUAAAGAAGUAUGUAU
Hs_miR-206_15′-UGGAAUGUAAGGAAGUGUGUGG
Hs_miR-663b_25′-GGUGGCCCGGCCGUGCCUGAGG
Hs_miR-165′-AGCAGCACGUAAAUAUUGGCG
Publisher’s Note: MDPI stays neutral with regard to jurisdictional claims in published maps and institutional affiliations.

