Article

Marine Gas Hydrate Geohazard Assessment on the European Continental Margins. The Impact of Critical Knowledge Gaps

by
Ricardo León
*,
Miguel Llorente
and
Carmen Julia Giménez-Moreno
Geological Survey of Spain (IGME), Department of Research and Prospective Geoscience, Rios Rosas 23, 28003 Madrid, Spain
*
Author to whom correspondence should be addressed.
Appl. Sci. 2021, 11(6), 2865; https://doi.org/10.3390/app11062865
Submission received: 2 March 2021 / Revised: 16 March 2021 / Accepted: 19 March 2021 / Published: 23 March 2021
(This article belongs to the Special Issue Geohazards: Risk Assessment, Mitigation and Prevention)

Abstract

:

Featured Application

Results can be used by policy makers and companies for planning seafloor activities. The susceptibility assessment and the analysis of its reliability can be applied in other regional works of geohazard assessment.

Abstract

This paper presents a geohazard assessment along the European continental margins and adjacent areas. This assessment is understood in the framework of the seafloor’s susceptibility to (i.e., likelihood of) being affected by the presence of hydrate deposits and the subsequent hazardous dissociation processes (liquefaction, explosion, collapse, crater-like depressions or submarine landslides). Geological and geophysical evidence and indicators of marine gas hydrates in the theoretical gas hydrate stability zone (GHSZ) were taken into account as the main factors controlling the susceptibility calculation. Svalbald, the Barents Sea, the mid-Norwegian margin-northwest British Islands, the Gulf of Cádiz, the eastern Mediterranean and the Black Sea have the highest susceptibility. Seafloor areas outside the theoretical GHSZ were excluded from this geohazard assessment. The uncertainty analysis of the susceptibility inference shows extensive seafloor areas with no data and a very low density of data that are defined as critical knowledge gaps.

1. Introduction

Marine gas hydrates are crystalline solids forming ice-like marine deposits. They are composed of water molecules surrounding light hydrocarbon gases, such as methane (the most common), ethane and propane, in cage-like lattices [1]. They are common in shallow marine sediments (<1000 m bsf) below 350 mwd under high pressure, relatively low temperature and high hydrocarbon gas saturation in pore water conditions [2,3,4]. Bacterial methanogenesis, thermogenesis [5] and serpentinised oceanic crust [6,7] are the main source of CH4 in continental margin sediment.
Marine gas hydrate is considered an important geohazard feature [8]. Three main environmental parameters control the nucleation and dissociation of marine methane hydrates: seafloor temperature, geothermal gradient and pressure [4]. Depressurization due to drops in sea level and warming of bottom water is the natural main scenario where hydrate dissociation can take place, driving large-scale natural gas release with potentially profound impacts, generating landslides, pockmarks, collapses, seafloor explosions and gas release [3,9]. These processes have also been hypothesized in the geological record [10]. However, under stable pressure/temperature conditions inside the gas hydrate stability zone (GHSZ), hydrocarbon seepage (such as pockmarks and gas flares) is likely to occur along fluid migration pathways of deep hydrocarbon reservoirs [11]. Nevertheless, these pressure-temperature conditions of shallow sediments may be modified by human activity on deep-water infrastructure such as wellheads, pipelines, production facilities, seabed anchors, cable touchdown areas on the seabed and catenaries in the water column [12].
Geological event inventories are a useful tool for regional risk analysis [13]. Global gas hydrate inventories have been used to make predictions about global hydrate volumes [14,15] and related risks [16], and to make impact projections based on future warm scenarios [17]. In the near future, marine gas hydrates will become a severe geohazard because of the unfavourable consequences of global warming on the marine gas hydrate stability field [11,17]. They will thus trigger seafloor instabilities in gas hydrate areas that are currently stable [17], discharging marine methane from shallow near-shore environments (0–50 m) to the atmosphere [18], lowering pH and causing geochemical changes in the water column due to aerobic oxidation [19]. However, moderate methane submarine emissions are absorbed by fragile chemosynthetic ecosystems that prosper in the vicinity of venting gas seeps [20,21]
Evidence of marine methane hydrates has been reported in eight main regions along the European continental margins, and in adjacent areas such as offshore Greenland and Svalbard, the Norwegian margin, offshore the northern British Islands, the southern Iberian and northwest African margins (the Gulf of Cádiz and Alborán Sea), and the Black, Marmara and eastern Mediterranean seas [22]. However, hydrate-related data (geological, geophysical and oceanographic) are not homogeneously covered in the whole extent of the European continental margins. This issue is especially important for obtaining hydrate-related predictions (e.g., creating a predictive—and quick—static and continuous model for the hydrate stability field along the whole of the European continental margins).
This paper presents, for the first time on the whole of the European margins and adjacent areas, a geohazard assessment (susceptibility analysis) of the presence of marine gas hydrates. It also assesses the main knowledge gaps of hydrate-related information with a pan-European scope, and analyses their impact on the uncertainty of susceptibility inference. Susceptibility is understood as the likelihood of the seafloor to be affected by the presence of hydrate deposits.

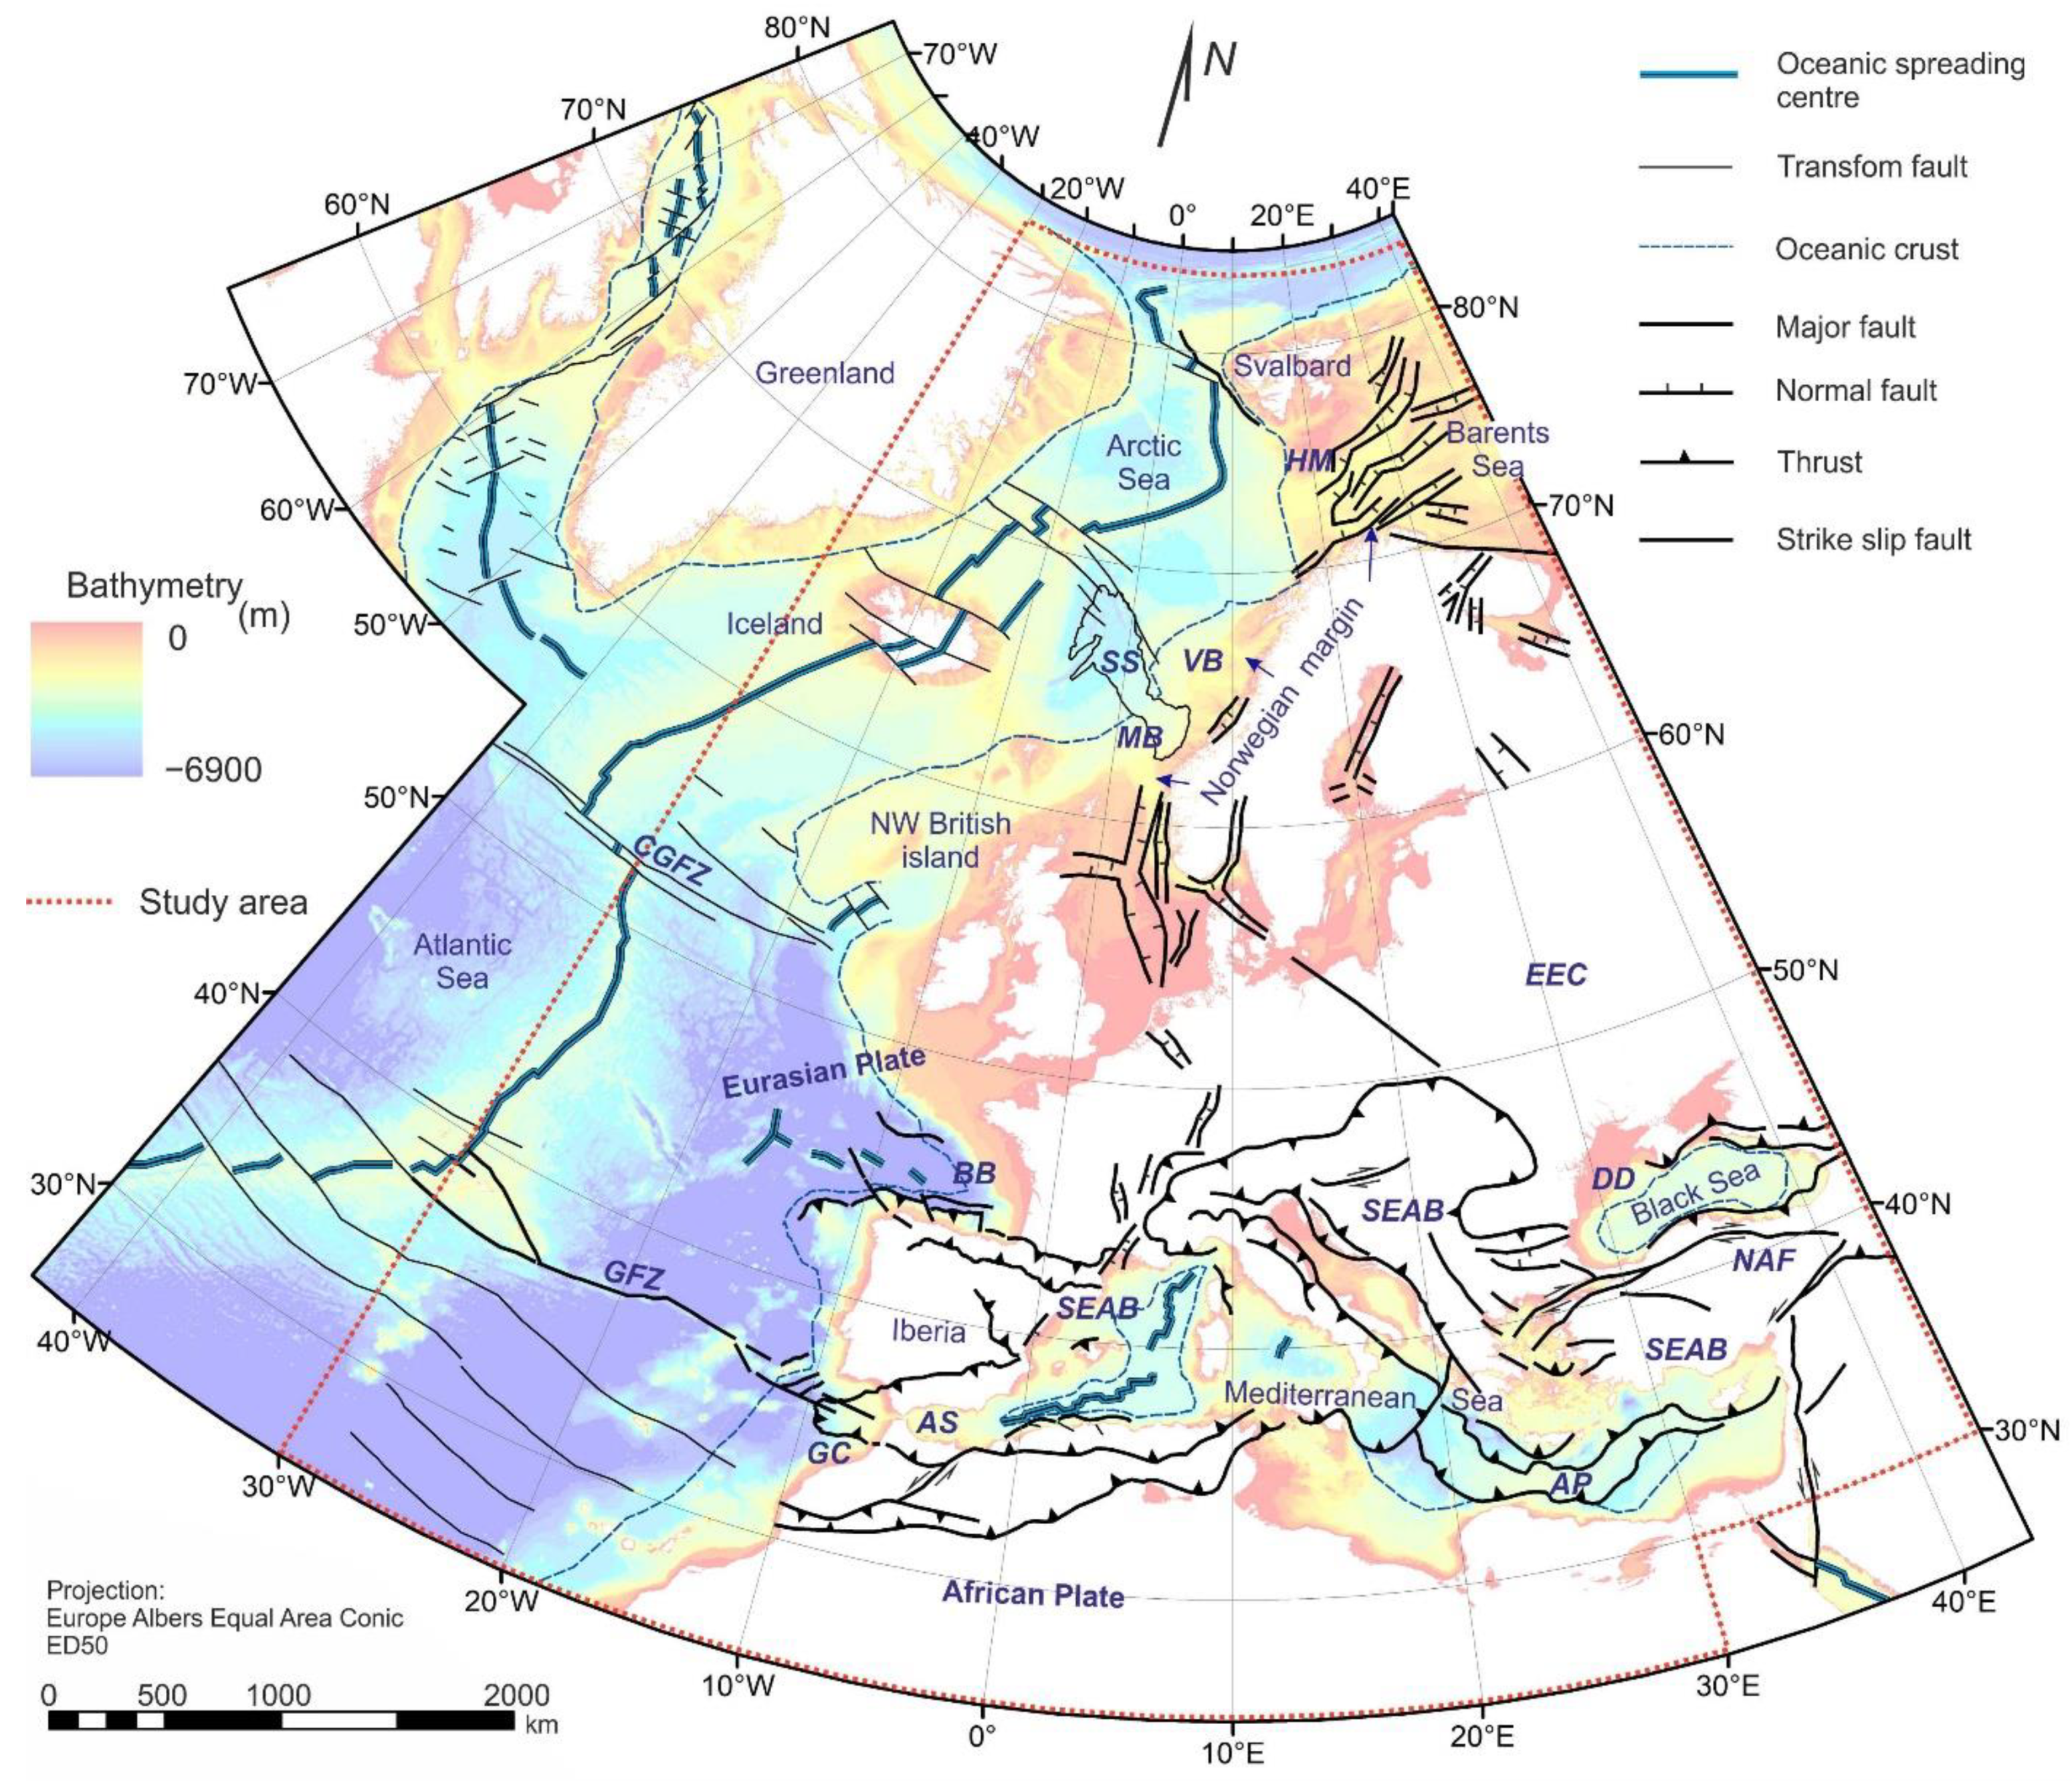
2. Geological Setting

The study area offers a wide view of the European margins from Macaronesia (SW corner: 24°15′ N; 36°10′ W) to the Black Sea and the Barents Sea (NE corner: 60°40′ E, 90° N). This hydrate framework covers three great domains on the European continental margins: the Arctic, the northeast Atlantic Sea and the south European Alpine Belt (Figure 1).
Hydrate systems in the Arctic province are located on the west Greenland, Svalbard and western Barents Sea margins. The east Greenland and west Svalbard margins were created during the Cretaceous to Paleogene continental rifting [23]. East Greenland is bordered by a wide continental shelf and deep basins. Gas seepage, bottom-simulating reflector (BSR) levels and pore water anomalies related to offshore Mesozoic sedimentary basins have been reported, associated with thermogenic gas migration along fractures [24]. The west Svalbard margin is composed of glacigenic debris flows, turbidites, hemipelagic sediments and contourites [25], where gas flares, seepages and BSR levels take place [26]. Hydrates are mainly represented in mud volcanoes in south Svalbard (e.g., Håkon–Mosby mud volcano—HM in Figure 1; [27]). Hydrocarbon gases are mainly thermogenic and locally biogenic [28], but abiogenic [29] contributions have been reported.
The Barents Sea and northern Norwegian margins are composed of a complex structure of sedimentary basins (e.g., Møre and Vøring; MB and VB in Figure 1, respectively) and structural highs resulting from the Cenozoic rifting [30]. The sedimentary basins are filled mainly with fine-grained hemipelagic sediments (Miocene–Pliocene) and glacigenic debris flows and contourites (Plio-Pleistocene) [31]. The Storegga Slide (SS in Figure 1) affected a huge sediment volume (mainly of the Møre Basin) as a response to climatic variability, 8200 ya [32]. In the Barents Sea, hydrate indicators are mainly BSR levels, gas chimneys and seepage pipes associated with vertical fluid flow systems and shallow gas.
However, no hydrates have been obtained. The nature of gases is mostly thermogenic, migrating through faults and fractures [35]. On the mid-Norwegian margin, hydrate samples were recovered during the TTR-16 cruise [36], and the indicators are BSR levels, bright spots, gas chimneys and pockmarks [37], all of them circumscribed to the header of the Storegga Slide. Here, gases have a microbial origin with thermogenic components [38].
The northwest British Islands margins (Figure 1) are composed of basins with thick Cenozoic series [39]. Several seepages and gas chimneys are present on the upper slope, controlled by unconformities and fractures and sourced from the Upper Carboniferous and Middle and Upper Jurassic successions [40]. No hydrates have been recovered.
The hydrate province of the south European Alpine Belt (SEAB in Figure 1) is located on the southern Iberian and northwest African margins, in the eastern Mediterranean and in the Black Sea. These areas are located in the context of the Alpine orogeny, owing to the convergence between the African and Eurasian plates [41]. On the southern Iberian and northwest African margins and in the Gulf of Cádiz and Alborán Sea (GC and AS in Figure 1), hydrate samples have been recovered in mud volcanoes [42,43], associated with other hydrocarbon fluid flow structures such as pockmarks and hydrocarbon-derived authigenic carbonate (HDAC) [44]. This fluid flow is controlled by fractures linked to a deep-rooted mud diapirism in the allochthonous unit of the Gulf of Cádiz (AUGC in Figure 1; [45]). Hydrocarbon gases have three origins: thermogenic, mixed thermogenic/biogenic on the subsurface [46] and abiogenic [7].
In the eastern Mediterranean Sea, the main seabed fluid flow areas are the accretionary complex and the Nile delta (AP and ND in Figure 1, respectively), where multiple mud volcanoes, pockmark fields and broad degassing areas with chemosynthetic fauna and authigenic carbonates are present [47]. Hydrates have only been observed in mud volcanoes along the accretionary complex [48]. The potential sources for hydrocarbon are related to late Messinian and Miocene to recent sapropels [49]. In mud volcanoes, gas has a thermogenic signature, while in pockmarks, the signature is predominantly microbial methane [50]. In the Marmara Sea (MS in Figure 1), a pull-apart basin onshore of the North Anatolian Fault (NAF in Figure 1) [51], hydrates of thermogenic origin related to seismic indicators (e.g., bright spots and transparent and chaotic zones) [52], gas flares, mud volcanoes and pockmarks [53] have been acquired.
The Black Sea (2212 mwd) is an extensional, mostly anoxic back-arc basin that contains the largest hydrogen sulphide and methane reservoirs in the world [22]. It is composed of two sub-basins, the eastern and western ones [54]. The evidence and indicators of marine gas hydrates are BSR levels, seismic blanking, bright reflections, pockmarks and mud volcanoes. The northwestern part is dominated by organic-rich delta fan complexes (the Danube [DD in Figure 1] and Dniepr rivers), where gas flares (microbial origin) and BSR levels have been observed linked to their canyon and levee systems [55]. Gas hydrates have been recovered in mud volcanoes related to gas chimneys, active faulting and diapirism in deep areas of the western basin, as well as in shallow (upper-middle slope) areas in the southern and eastern parts [55,56]. In these areas, gas shows a mixed thermogenic and microbial composition in the subsurface.

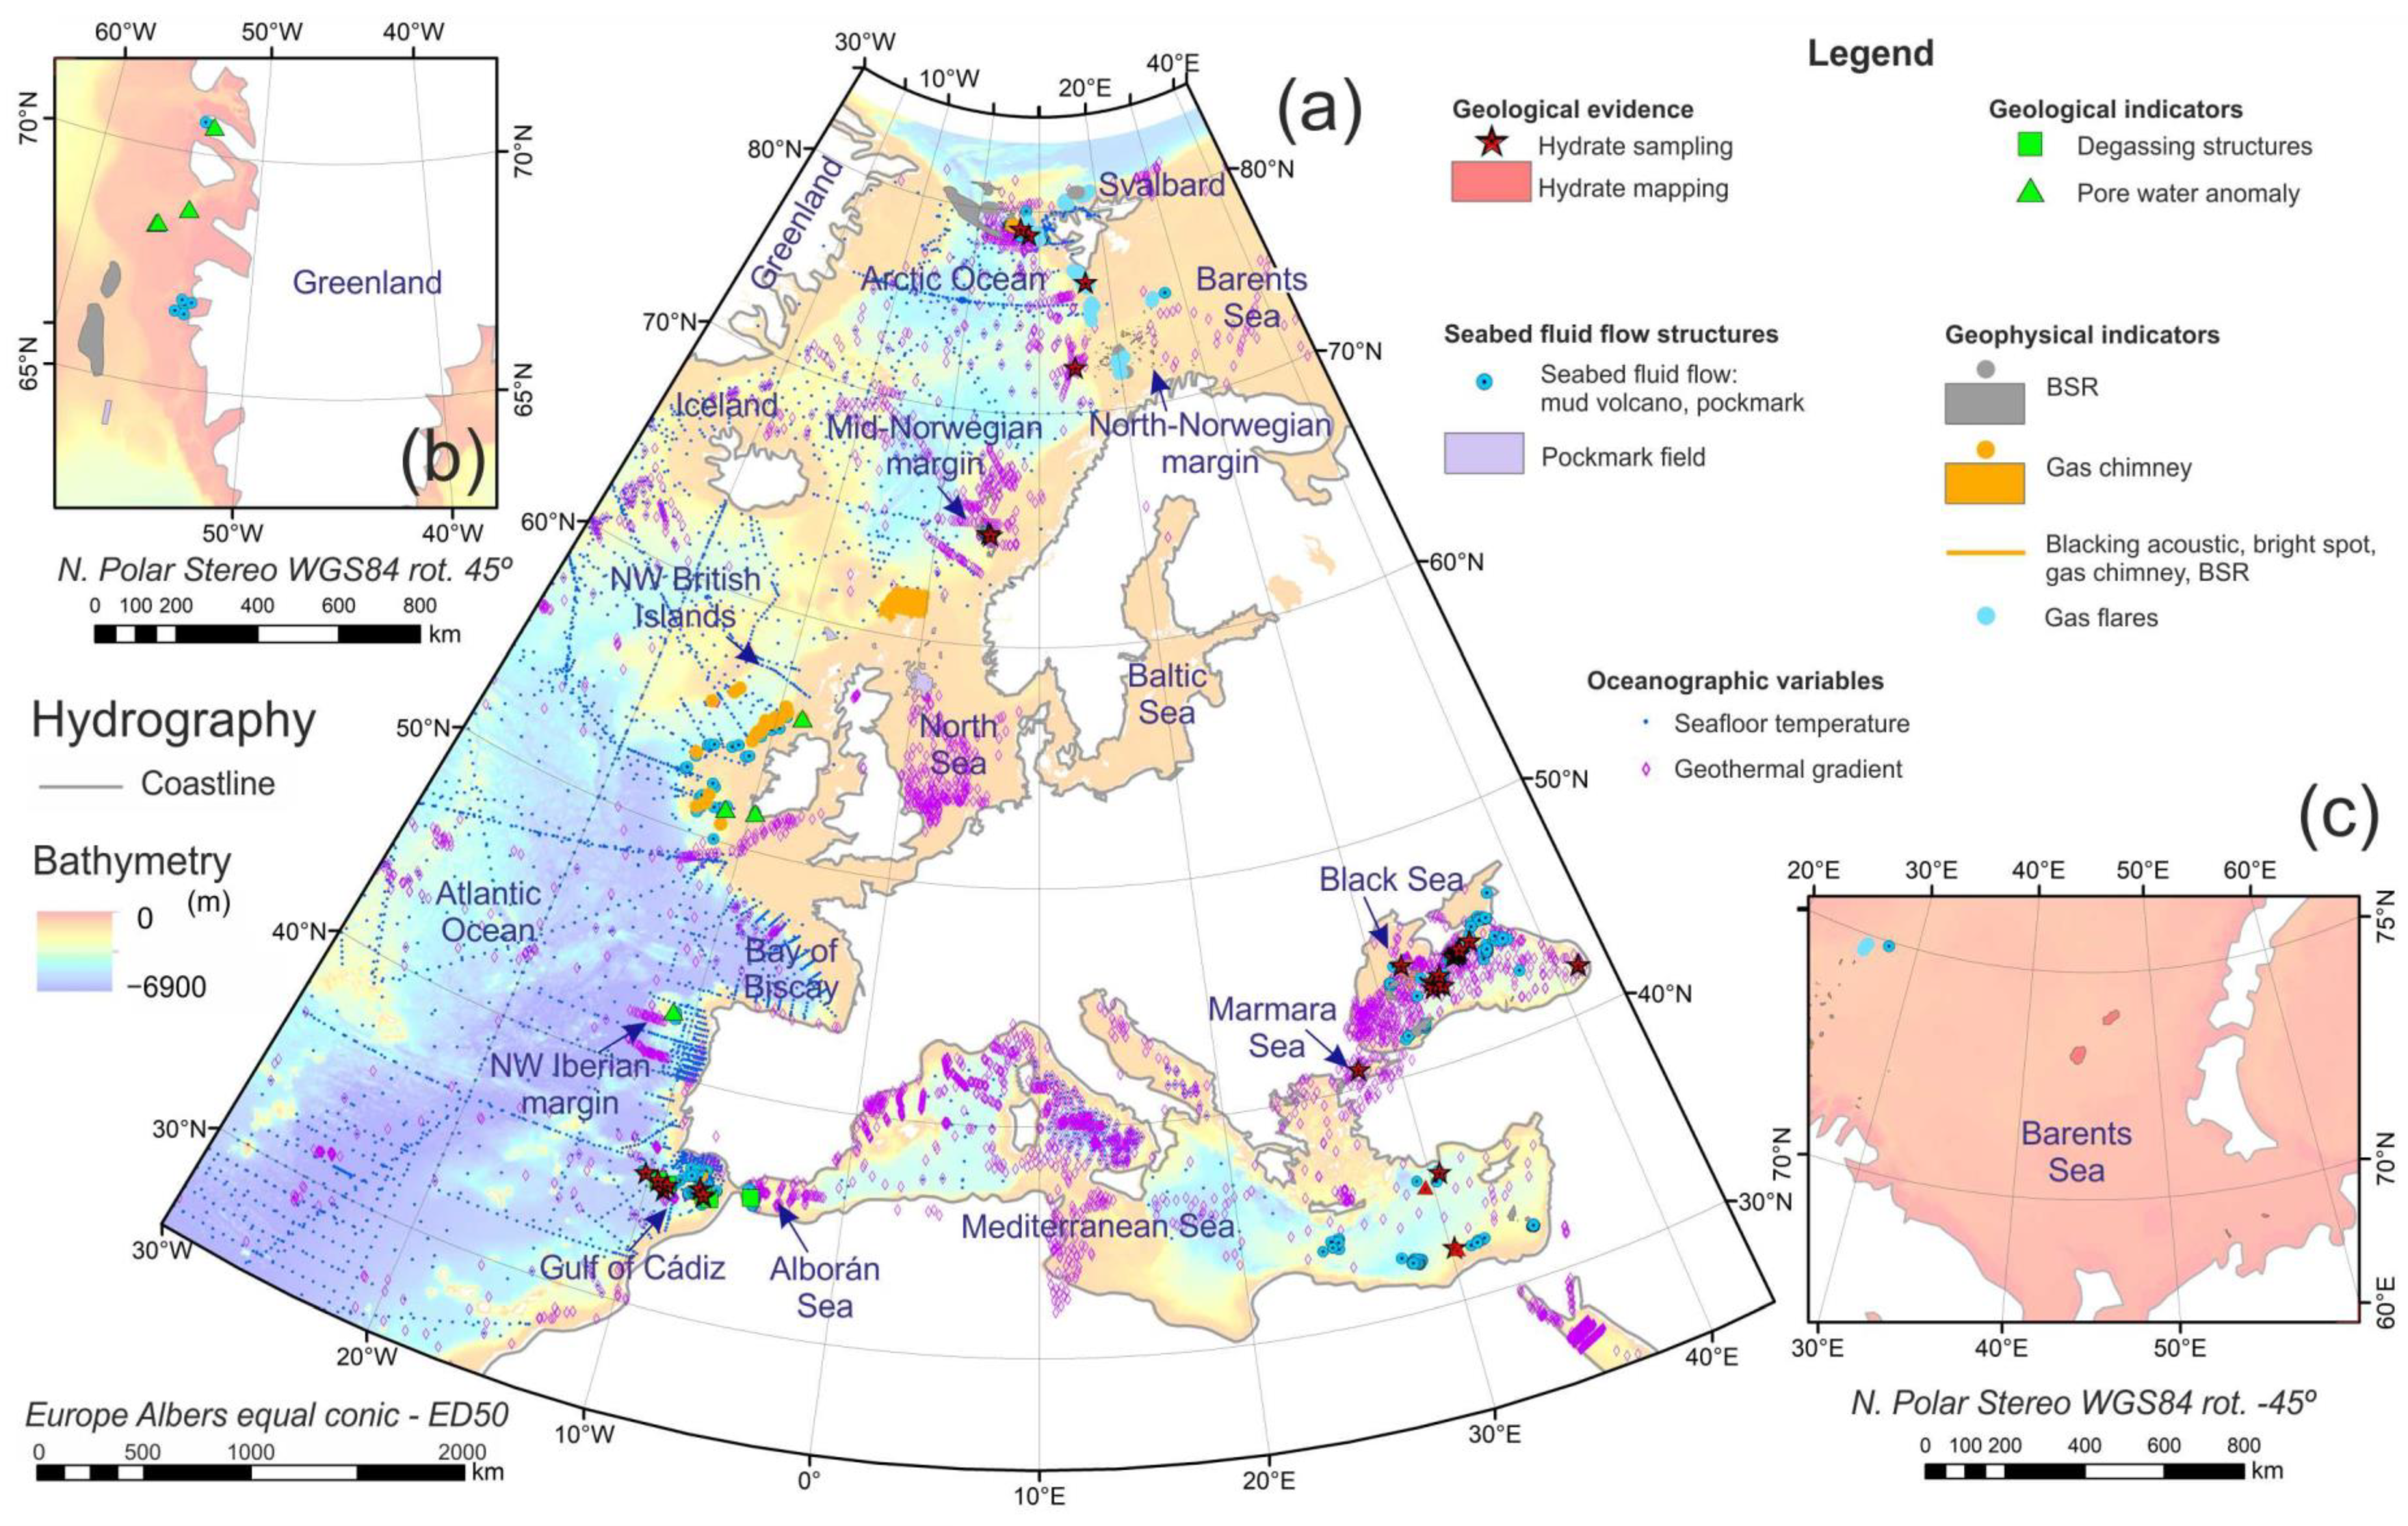
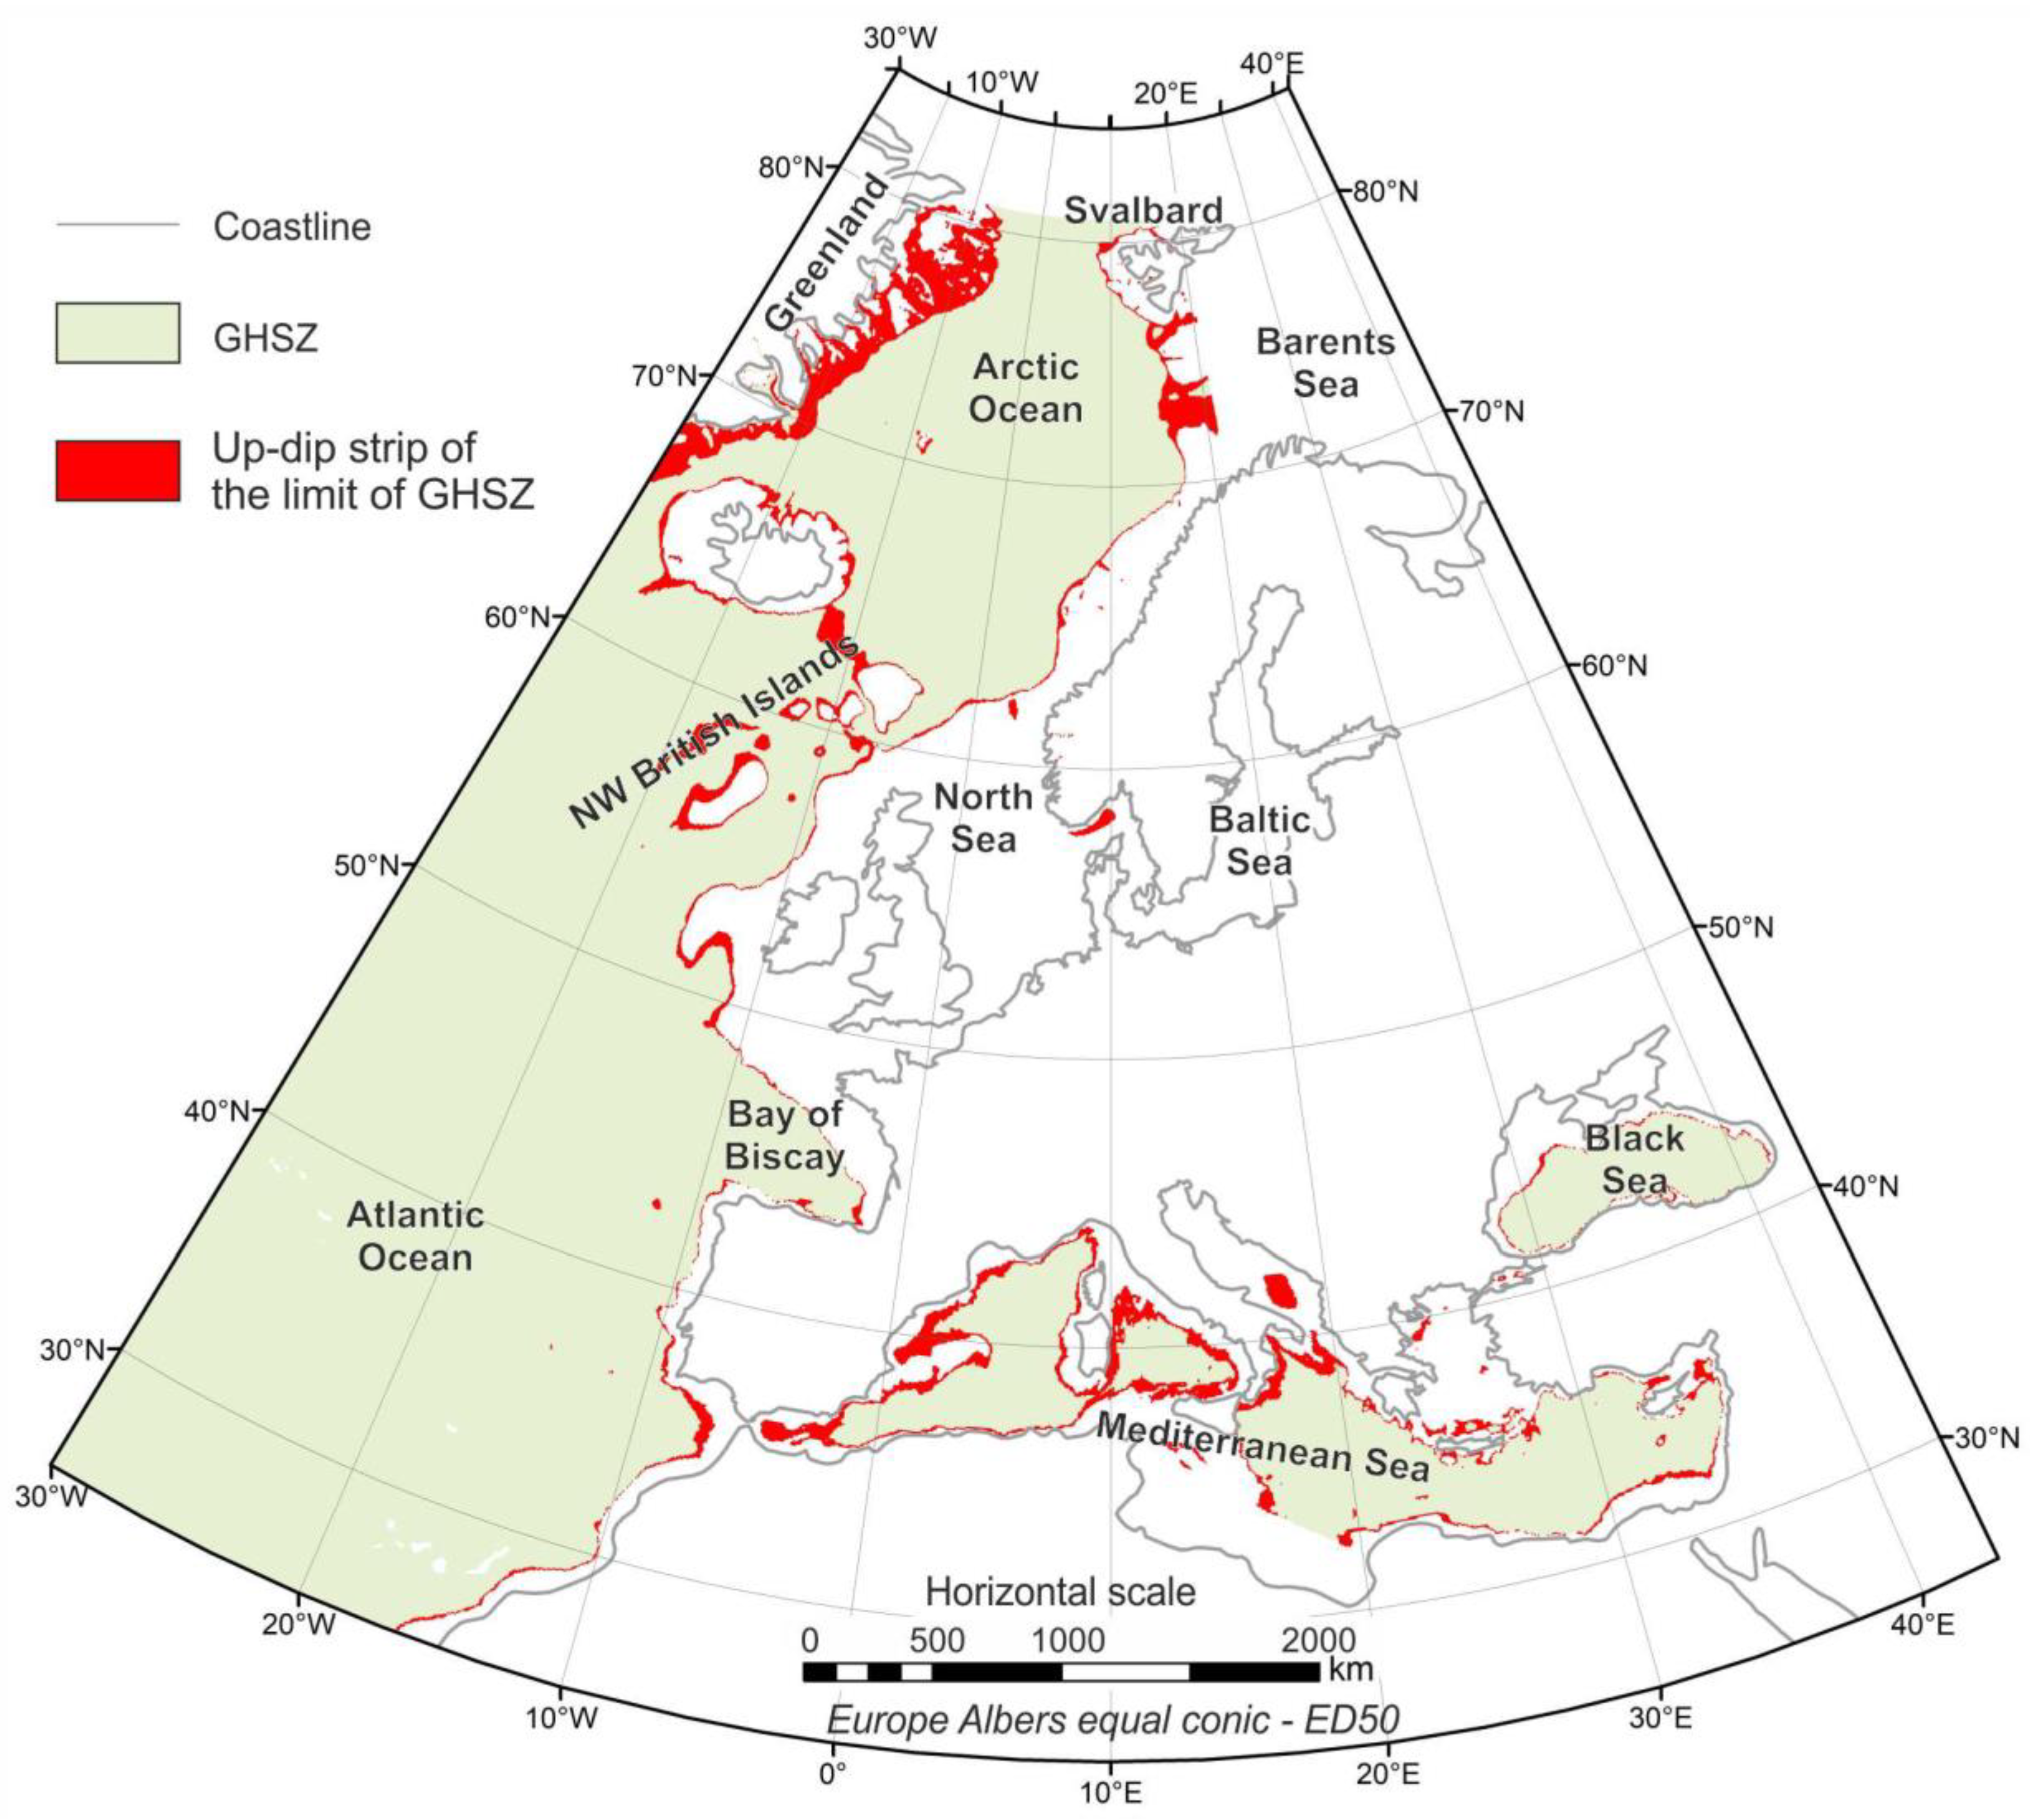
3. Data Source and Methods

This study used the hydrate-related GIS database of the GARAH project 731166, GeoERA-GE-1, H2020 Environment (https://geoera.eu/projects/garah4/; accessed on 20 December 2020). This GIS database (GARAHydrates; [57]) is INSPIRE-compliant and stores hydrate-related geological, geophysical and oceanographic information (Figure 2). It is the result of a data collection from two main groups of data: (i) data of a pan-European scope from free public databases and project results, such as EMODnet, PERGAMON and MIGRATE; and (ii) data of a regional scope from scientific organizations. The source of the data, owner and person/institution of contact is stored in each database record.
The majority of the geological and geophysical evidence and indicators of marine gas hydrates of GARAHydrates came from the results of Work Package 1 of the MIGRATE COST action—ES1405 (https://www.migrate-cost.eu/; data given by MIGRATE COST Action to GARAH project on 31 January 2019) led by the University of Southampton and the National Oceanographic Centre, in which 21 organizations from 15 countries were involved. The MIGRATE database contains 1892 records (vector and raster) and stores information regarding direct and indirect evidence of gas hydrates. The data on direct evidence of gas hydrates are from samples described in publications. The data on indirect evidence include seismic indicators such as BSR levels and areas, gas chimneys, high reflectivity areas and velocity anomalies. Other gas hydrate information includes seabed features (gas seepages areas), heat flow data, sediment thickness models, pore water anomalies, theoretical models of the base of the GHSZ, and relief and bathymetry models.
EMODnet Geology marine minerals (https://www.emodnet-geology.eu/map-viewer/?p=marine_minerals; accessed on 1 January 2019) supplied 28 records in polygon shapefile format regarding marine gas hydrate evidence in the Gulf of Cádiz, the Barents Sea and the Black Sea. The PERGAMON database was developed by the geological surveys of Spain (IGME) and Ireland (GSI) in 2011 and 2012 in the framework of the PERGAMON COST action—ES0902 (https://www.cost.eu/actions/ES0902/; data given by PERGAMON Cost Action to GARAH project on 1 January 2019). This database supplied seafloor temperature data and theoretical models of the thickness of the GHSZ in the Arctic Sea.
The geothermal gradient data were obtained from the global heat flow database of the International Heat Flow Commission (website: http://engineering.und.edu/geology-and-geological-engineering/globe-heat-flow-database/index.cfm; accessed on 31 March 2020). The data were downloaded with the ODV application (https://odv.awi.de/; accessed on 1 February 2019). Seafloor temperature is a composite dataset developed by the Geological Survey of Spain (IGME) using CTD data downloaded from the World Ocean Database (https://www.ncei.noaa.gov/products/world-ocean-database; accessed on 1 February 2019) and the British Oceanographic Data Centre (https://www.bodc.ac.uk/; data given by British Geological Survey to GARAH project on 30 November 2018). Finally, bathymetry was obtained from three sources: the EMODnet Bathymetry portal (https://www.emodnet-bathymetry.eu/; accessed on 31 March 2020), IBCAO (https://www.gebco.net/data_and_products/gridded_bathymetry_data/arctic_ocean/; accessed on 1 February 2019) and GEBCO (https://www.gebco.net/; accessed on 31 March 2020).
Several records were added or updated using regional data from scientific organizations: (i) British Geological Survey (BGS) technical reports for geophysical indicators in the north of the British Islands [58,59,60]; (ii) the BGS 250k map series/MCA Civil Hydrography Prog data for pockmark mapping; (iii) marine gas hydrate evidence in the Black Sea from SRDE-Geoinform of Ukraine; and (iv) regional models of the base of the GHSZ for CH4 and/or CO2 in the Biscay Bay from the Bureau de Recherches Géologiques et Minières (BRGM).
The thickness of the GHSZ was taken from Núñez-Varela [61]. The hydrate stability field has been calculated with the CSMHYD program [62] for a standard composition of biogenic gas [63] and a salinity assumption of 36 psi for all the study area.

4. Results

4.1. Hydrate-Related Information Stored in GARAHydrates

The hydrate-related information is structured in four levels inside GARAHydrates: (i) geological and geochemical evidence and indicators, (ii) geophysical indicators, (iii) seabed fluid flow structures, and (iv) oceanographic variables (Figure 2). Four types of items describe the information: location items, property metadata, geo-descriptors and references/comments (Table 1). Location items describe the geographical location (coordinates, geological setting, etc.). Property-reference metadata store the owner of the data and contact information. Geo-descriptors describe the geological, geochemical and geophysical characteristics of the evidence or indicator. Finally, references/comments store bibliographic references and other comments of interest of each item of evidence or indicator.
The level of information “geological and geochemical evidence and indicators” stores evidence (e.g., crystals of gas hydrates) and indicators (e.g., degassing structures and pore water anomalies) of gas hydrates acquired by direct sampling. The level “geophysical indicators” stores seismic or electric features of gas hydrate presence in the sediment column, such as high resistivity, BSR levels, bright spots, acoustic blanking facies and gas chimneys. The level “seabed fluid flow structures” stores structures related to fluid migration in areas where evidence or indicators of marine gas hydrates have been observed. Finally, the level “oceanographic variables” stores information about seafloor temperature, geothermal gradient and bathymetry.
More than 136,000 records of hydrate samples, seismic indicators and seabed fluid flow structures have been stored (Table 2). In west Greenland, no hydrates were recovered; there are only six indirect items of evidence or indicators, such as pore water anomalies of chloride. However, BSR levels (~9400 km2) and gas flares and seepages (~3500 km2) have been mapped. West Greenland–Svalbard–Barents Sea is, together with the Black Sea, one of the most extensive hydrate regions in the study area, with more than 2100 km2 and 26,300 km2 of mapped hydrates and BSR levels (58), respectively, as well as numerous gas flares and seepages. Although the mid-Norwegian margin is a very localized hydrate region, it is the only site where hydrates have been recovered on the northwest Atlantic European margins. Here, gas hydrates are linked to the old slumped slope (Storegga), BSR levels and seepage area. On the southern Iberian and northwest African margins and in the Mediterranean Sea, hydrates have only been recovered on mud volcanoes (in the Gulf of Cádiz and eastern Mediterranean Sea). A high number of hydrate samples have been recovered in these regions as a result of many oceanographic cruises by scientific groups. The Black Sea is the hydrate region that has most gas hydrate surfaces mapped (more than 3650 km2), with more than 80 mud volcanoes on the seafloor, 91% of them inside the GHSZ.
Finally, three information layers are stored in the oceanographic variable group: seafloor temperature (5896 records), geothermal gradient (4332 records) and bathymetry (composite raster dataset with a cell size ~100 × 100 m).

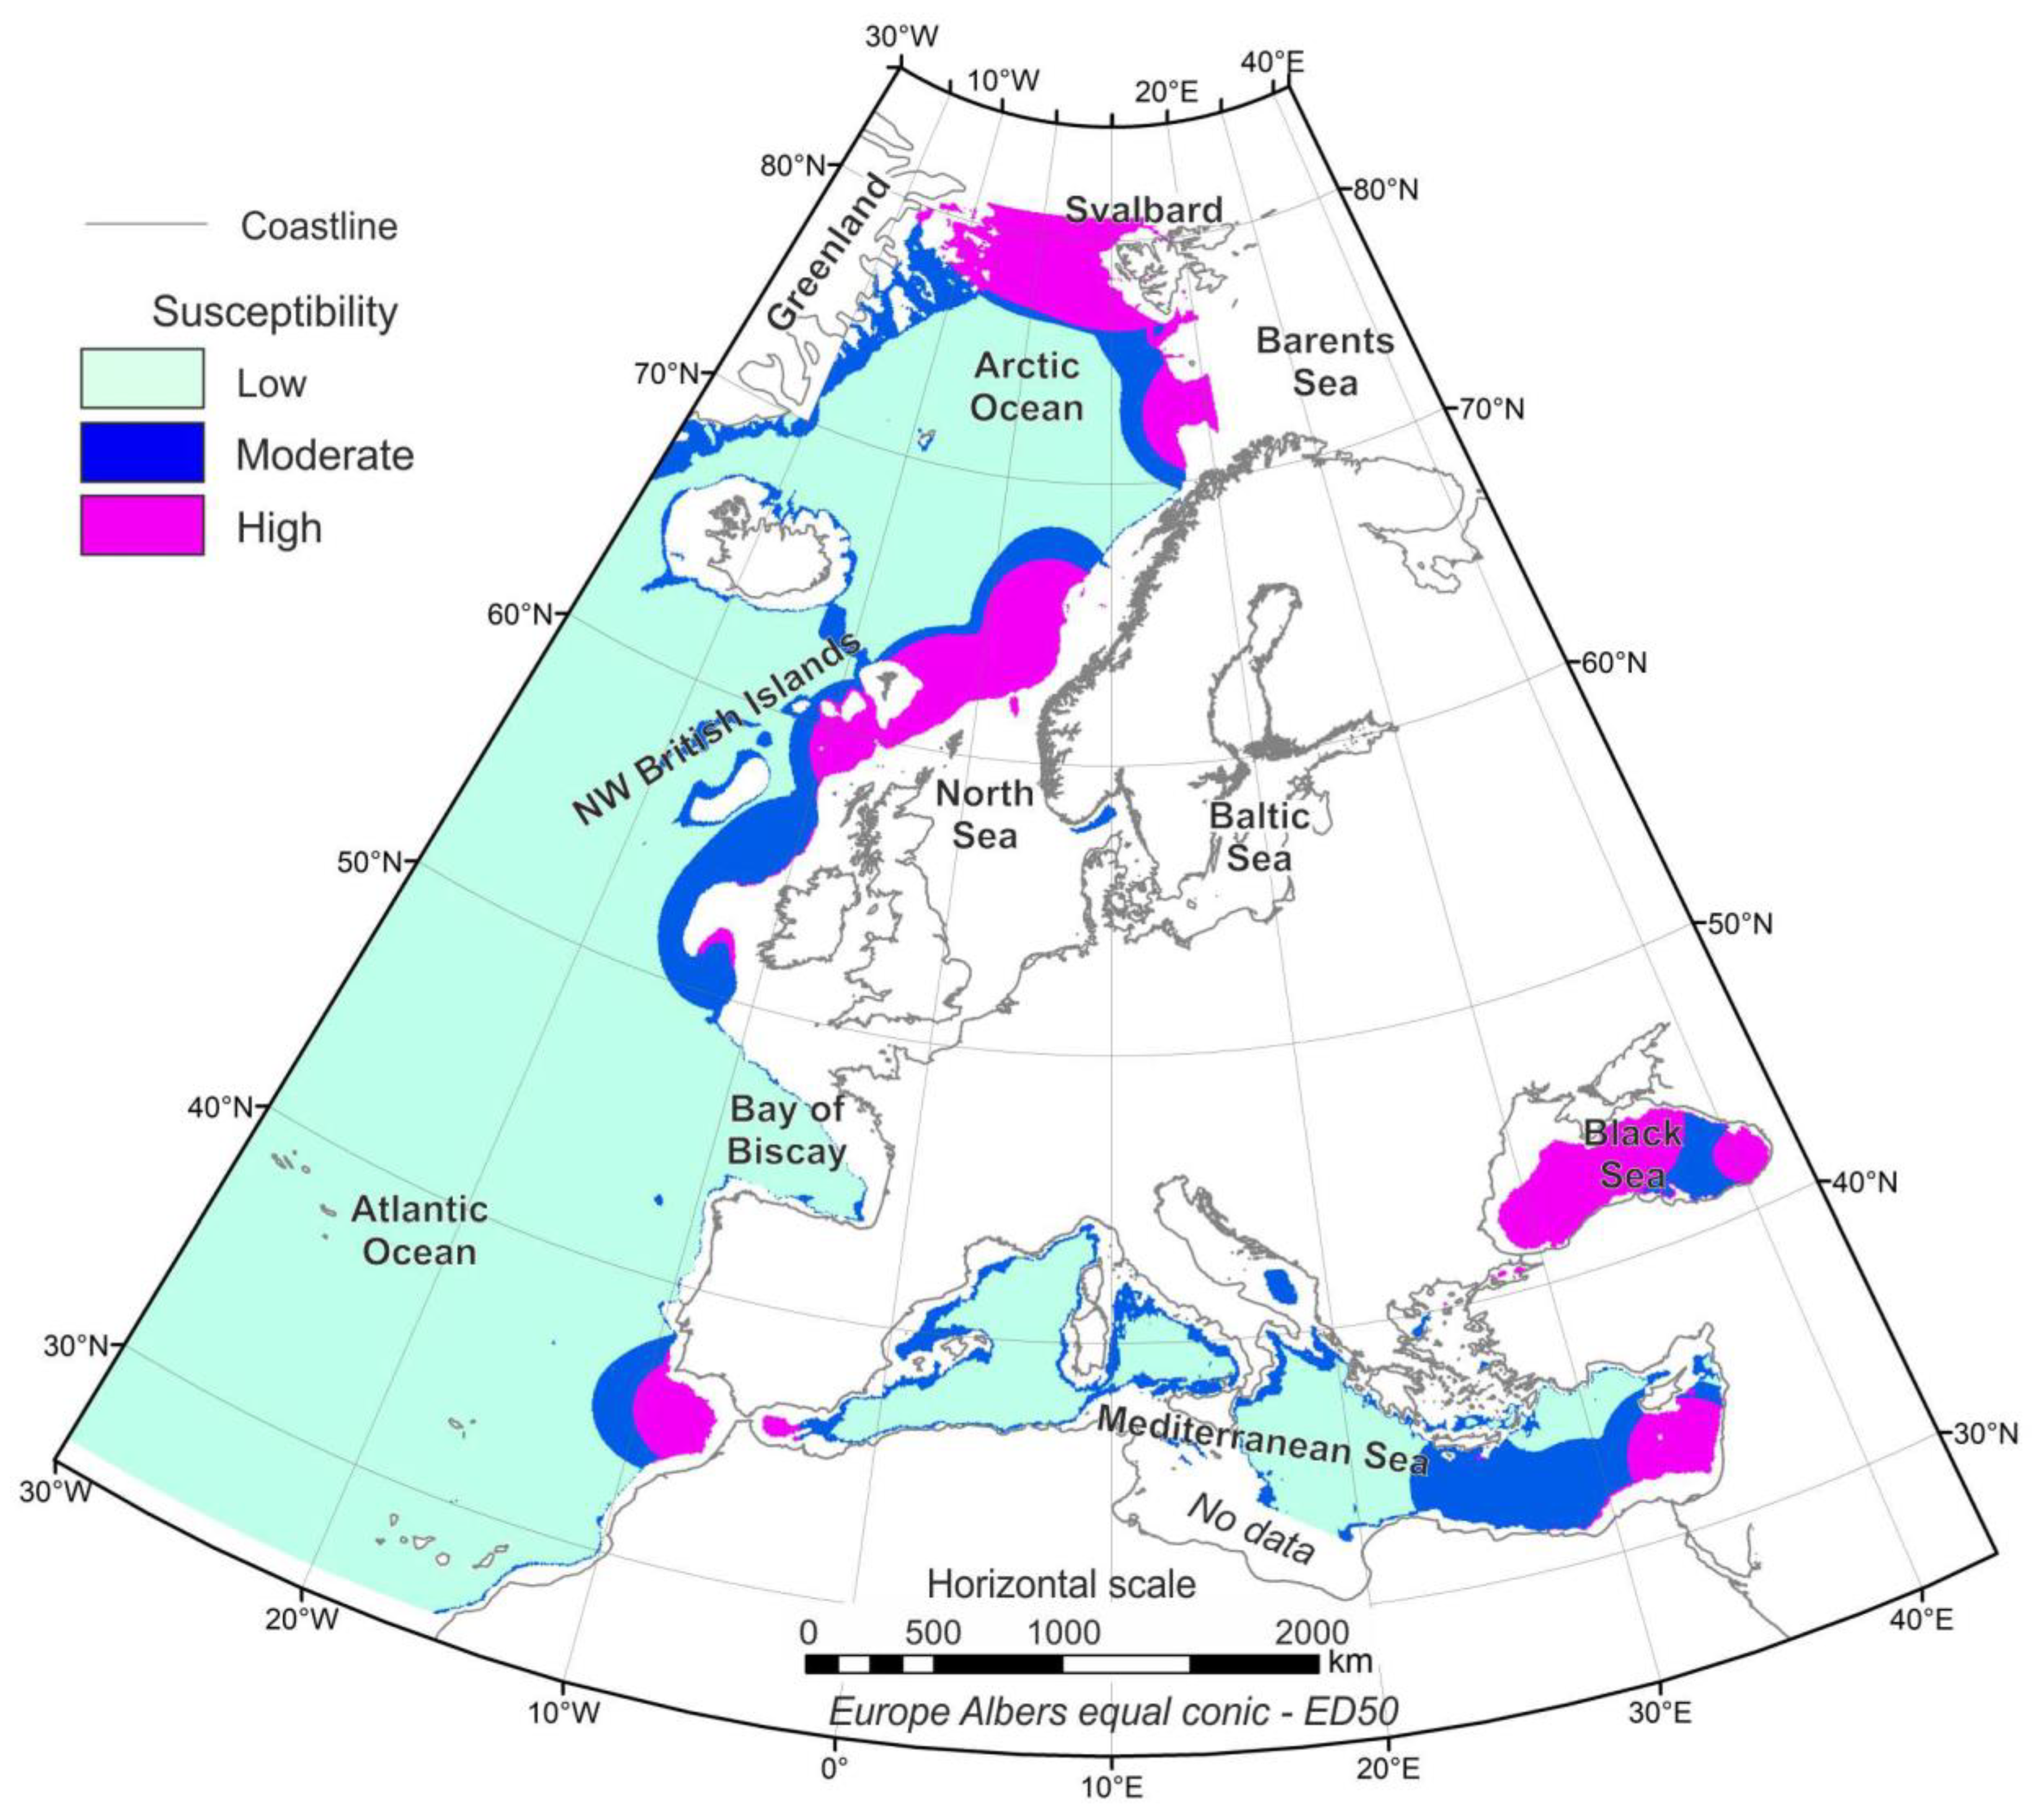
4.2. Susceptibility Assessment

The presence of gas hydrates in marine sediments is a geohazard that has not yet been evaluated in the whole of the European continental margins. This work uses the database of marine gas hydrate evidence and indicators developed in the GARAH project to make a pan-European assessment of hydrate presence on its continental margins. This assessment was carried out in two steps: analysis and weighting of factors and susceptibility calculation.

4.2.1. Analysis and Weighting of Factors

Several factors were taken into account in this assessment: marine gas hydrate evidence, seismic indicators, seabed fluid flow structures and thickness of the GHSZ.
Evidence of marine gas hydrates is the ground truth of where hydrate exists in the seafloor and/or sub-seafloor. This layer establishes seafloor areas with a moderate–high likelihood of occurrence of dissociation processes in the seafloor or sub-seafloor. The magnitude of the processes will depend on the quantity of hydrate in the sedimentary column and its type within the sediment (massive, in layers, disseminated, etc.).
Seismic indicators show seafloor areas where hydrates could exist. Marine gas hydrates have not been recovered, but there is a moderate to high likelihood of them occurring. In areas where marine gas hydrates have been recovered by direct sampling (geological evidence), seismic indicators allow hydrate occurrence to be inferred.
Seafloor geological structures related to hydrocarbon fluid migration, such as pockmarks, gas flares, mud volcanoes and HDAC are directly linked to deep hydrocarbon reservoirs. The occurrence of these structures reveals a free fluid leakage from the sedimentary structure to the water column. These processes can occur inside the GHSZ, in some cases due to preferential fluid migration from deep reservoirs, and in other cases, as a result of hydrate dissociation processes. This layer of information will thus establish a wide spectrum of the susceptibility of presence of marine gas hydrates and their hazardousness. It will range from low or void in areas outside the GHSZ to moderate to high in areas inside the GHSZ.
The thickness of the GHSZ establishes the theoretical seafloor area where the occurrence of hydrates is physically possible under optimal gas saturation and salinity conditions. Seafloor areas inside the GHSZ will be considered potential areas to be affected by dissociation processes. In addition, the intersection between the base of the GHSZ and the seafloor will be considered a potential strip of the high likelihood of fluid leakage and dissociation processes. The three oceanographic variables taken into account in the thickness calculation were seafloor temperature, geothermal gradient and bathymetry.
Each geological and geophysical item of evidence and indicator was weighted according to the confidence/certainty of finding hydrates at the site. The maximum weight (or confidence) was given to recovered samples of gas hydrates or evidence of hydrate dissociation, such as degassing or liquidation structures in gravity cores. Seismic indicators of the presence of gas hydrates or hydrocarbon seabed fluid flow such as BSRs, acoustic blanking, amplitude anomalies and the presence of geological structures of seabed fluid flow in the vicinity of the GHSZ were weighted with a lower value, between 0.8 and 0.9, based on expert criteria (Table 3).
Regarding the theoretical GHSZ, the seafloor was weighted in three categories. Seafloor areas outside the theoretical GHSZ were excluded as not likely to be affected by hydrate dissociation processes. On the other hand, any location inside the GHSZ was selected as theoretically likely to suffer dissociation processes. A strip at the up-dip limit of the GHSZ (50 m in thickness) was a critical area for these dissociation processes (Figure 3).

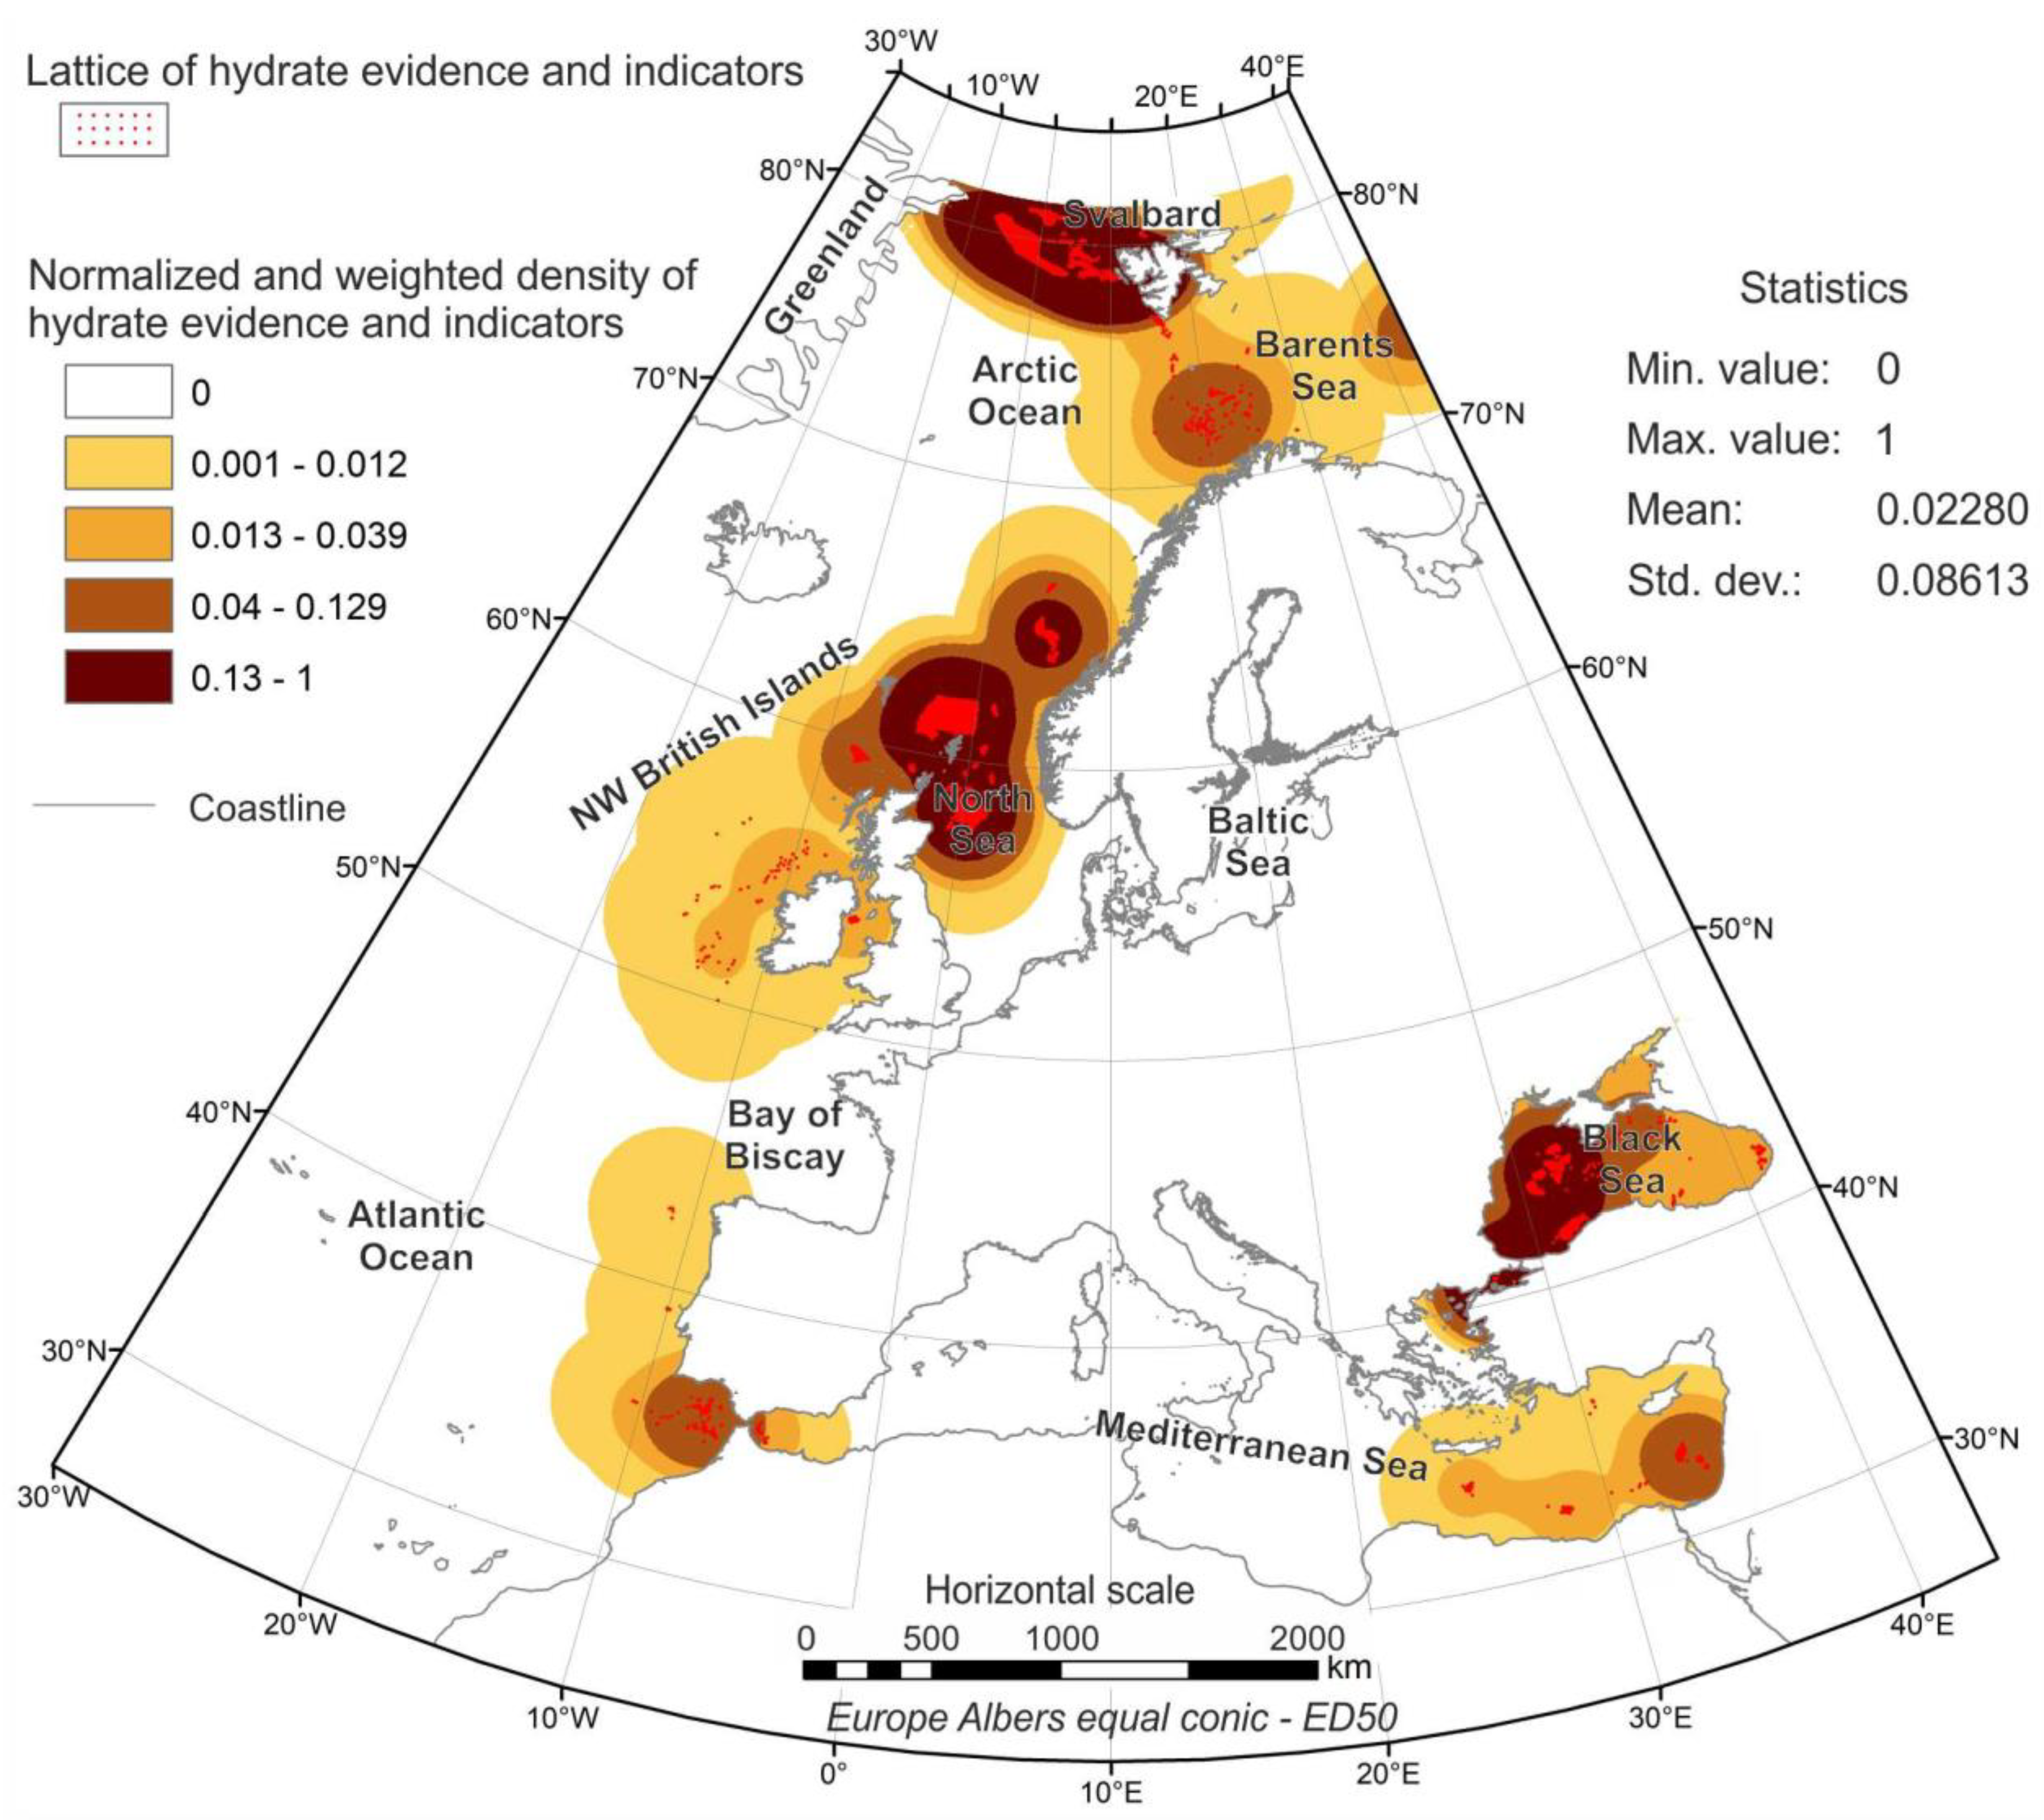
4.2.2. Susceptibility Calculation

The proposed methodology analyses the geological hazard by means of the susceptibility assessment. The term ‘‘susceptibility’’ is employed here to define the likelihood of occurrence of hydrates in the sediment column, and subsequently the likelihood of them being affected by dissociation processes resulting from natural or human-induced activities (liquefaction, explosions, collapse, crater-like depressions or submarine landslides). Susceptibility assessment is applied as the first step in a pan-European risk assessment, owing in particular to (i) the regional scope of the assessment (the European continental margins and adjacent areas) and (ii) the current state of European gas hydrate-related information characterized by intensively studied areas with a high density of high-quality data and wide areas of critical knowledge gaps with no data.
The baseline scenario (the initial hypothesis) is that gas hydrate occurrence is only possible in seafloor areas where pressure (bathymetry) and seafloor temperature conditions are inside the theoretical GHSZ. In this zone, the occurrence of gas hydrates is directly related to the presence of evidence (direct samples of hydrates) or indicators of it (e.g., pore water and velocity anomalies, BSRs and gas chimneys), as well as the occurrence of hydrocarbon fluid flow structures. Finally, the likelihood of the seafloor being affected by gas hydrate dissociation processes will be great at the base of the GHSZ and in the vicinity of gas hydrate evidence and indicators.
In order to prove this initial hypothesis, a susceptibility assessment was carried out through map algebra in a GIS environment from a density map of evidence and indicators and the pan-European map of the GHSZ on the seafloor.
The first step for the development of the density map was to create a lattice of evidence and indicators at a resolution of the work scale (5 × 5 km), which will be the final resolution of the susceptibility assessment map. In this lattice, each geographical feature of evidence and indicators was weighted according to Table 3.
A hypothesis was then established that considered the database of ground evidence for sites that have been sampled, but occurrences of gas hydrates might not be restricted to these point locations. If a given pixel were located between a ground evidence and an indicator, the likeliness of that pixel containing gas hydrates would be greater than that of a pixel located far from either. Given the discrete nature of the features described within the database and the relative concept of this likeliness, a regionalization technique was applied following a smoothed saturated algorithm of kernel density. Here, the weighting of the features represents an abstract concept of the confidence of having gas hydrates. This technique consists of a kernel density estimation, which fits a smoothly tapered surface to each point or polyline. The search radius (default option) was calculated on the basis of the spatial configuration and the number of input points. This approach corrects for spatial outliers (input points that are very far from the rest), so they will not make the search radius unreasonably large. These values of the weighted density map were then normalized from zero to one (Figure 4) to remove the per area output of the model, providing a relative likeliness of between 0 and 1, where 0 means that there is very little (but not no) confidence of finding significant amounts of gas hydrates at that location and 1 means that there is certainty of finding gas hydrates at that location.
Regarding the weighted map of the theoretical GHSZ (Figure 3), the up-dip limit of the GHSZ in the vicinity of the low-latitude volcanic islands in the Atlantic Ocean (i.e., the Azores, Madeira and the Canary Islands) was not taken into account because of the absence of hydrocarbon reservoirs at these geological sites. Finally, this map was weighted in relation to the mean value of the normalized density map of evidence and indicators (mean = 0.00228; Figure 4). Thus, according to its likelihood of being affected by dissociation processes, the GHSZ on the seafloor was weighted using expert criteria. The strip of up-dip of the GHSZ was weighted with 0.00228 and the rest of the GHSZ with 0.00114 (half the likelihood). Seafloor areas outside the GHSZ were given a value of zero.
The susceptibility assessment was performed by map algebra, taking into account the control maps of density of hydrate evidence and indicators and the weighted map of the GHSZ on the seafloor. Specifically, the final map (Figure 5) was conceived as a segmentation in three levels by quantiles resulting from the addition of the above control maps:
S c = δ e i + G H S Z w
where Sc is the susceptibility map; δei is the normalized weighted density map of hydrate evidence and indicators; and GHSZw is the weighted map of the GHSZ on the seafloor. The final Sc value was masked with the positive values of the GHSZ map. Seafloor areas outside the GHSZ have a susceptibility value of zero.
Susceptibility values were segmented into three levels by quantiles: low from 0.009 to 0.0129, middle from 0.0129 to 0.0325 and high from 0.0325 to 1.009. The susceptibility assessment shows seven areas with high values: Svalbard, the northern Norwegian margin—Barents Sea, the continental slope of the mid-Norwegian margin and the North Sea, the Gulf of Cádiz, the eastern Mediterranean and the Black Sea. Moderate values are located on the west Greenland continental shelf, near the northwest British Islands and on the continental slope of the western and northern Mediterranean Sea.

5. Discussion

This section analyses the pan-European database of susceptibility of presence of marine gas hydrates from a geohazard point of view, considering the impact of spatial data distribution on the uncertainty value and on the identification of critical knowledge gaps.

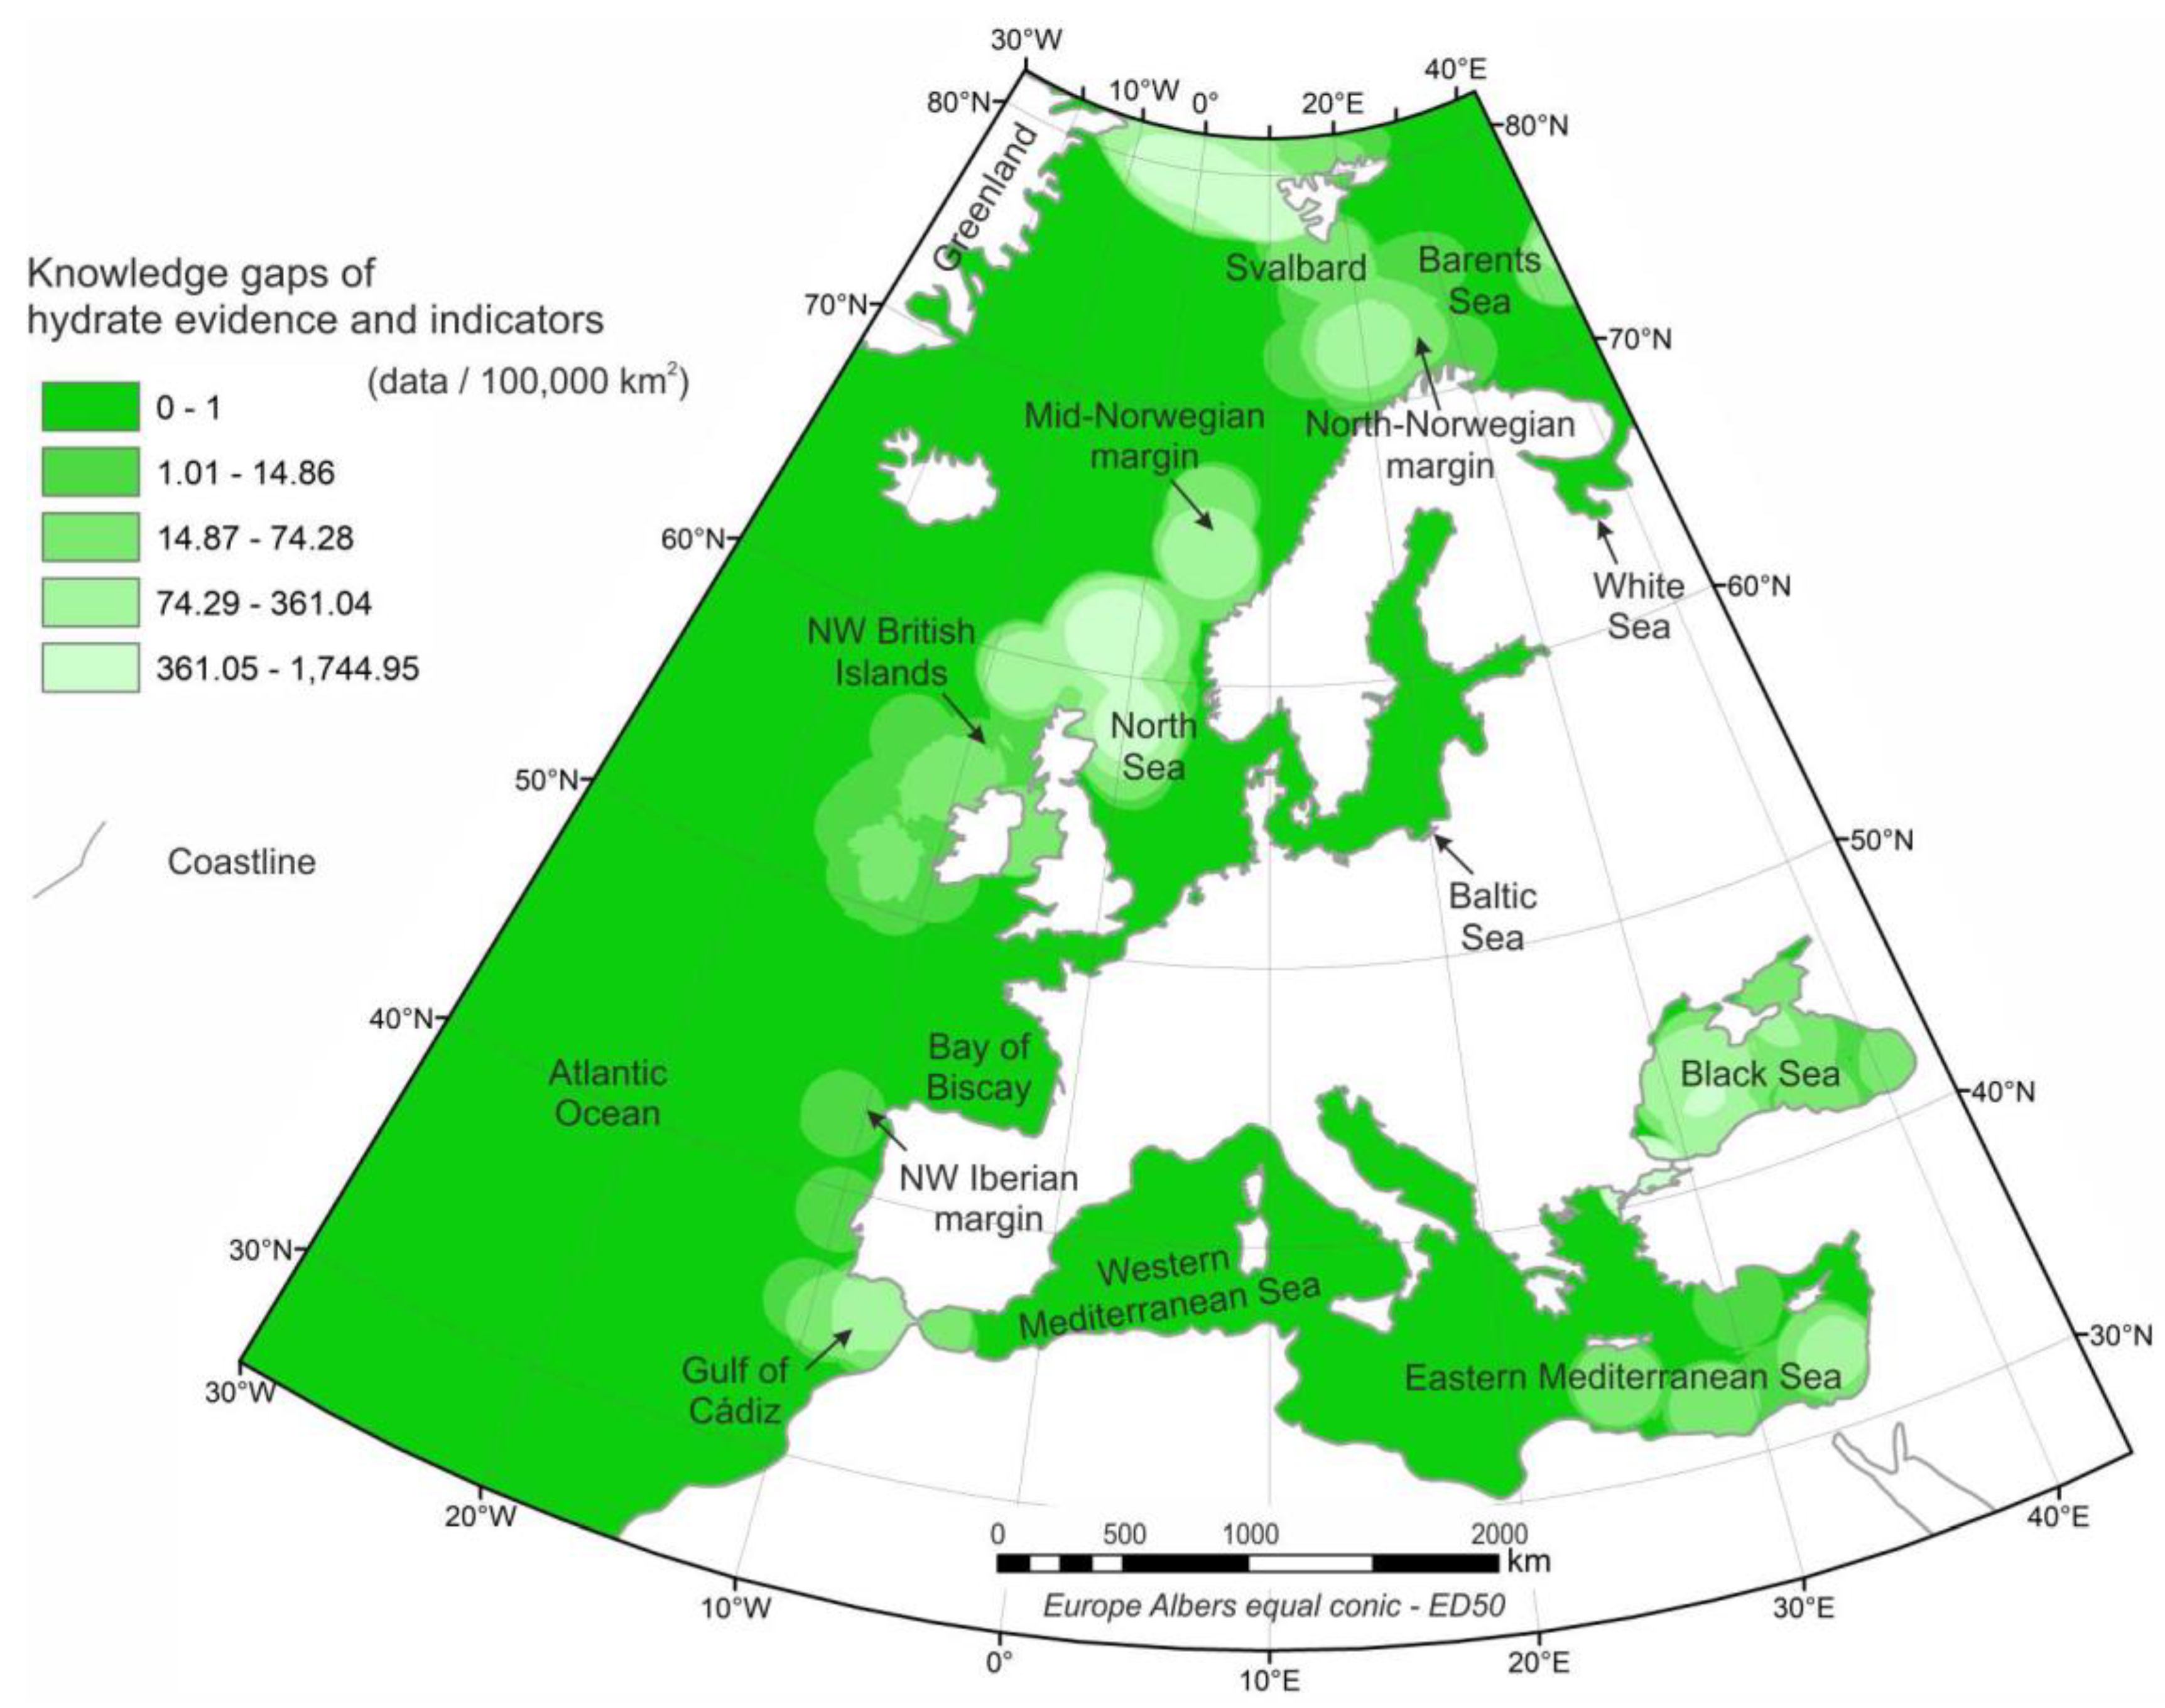
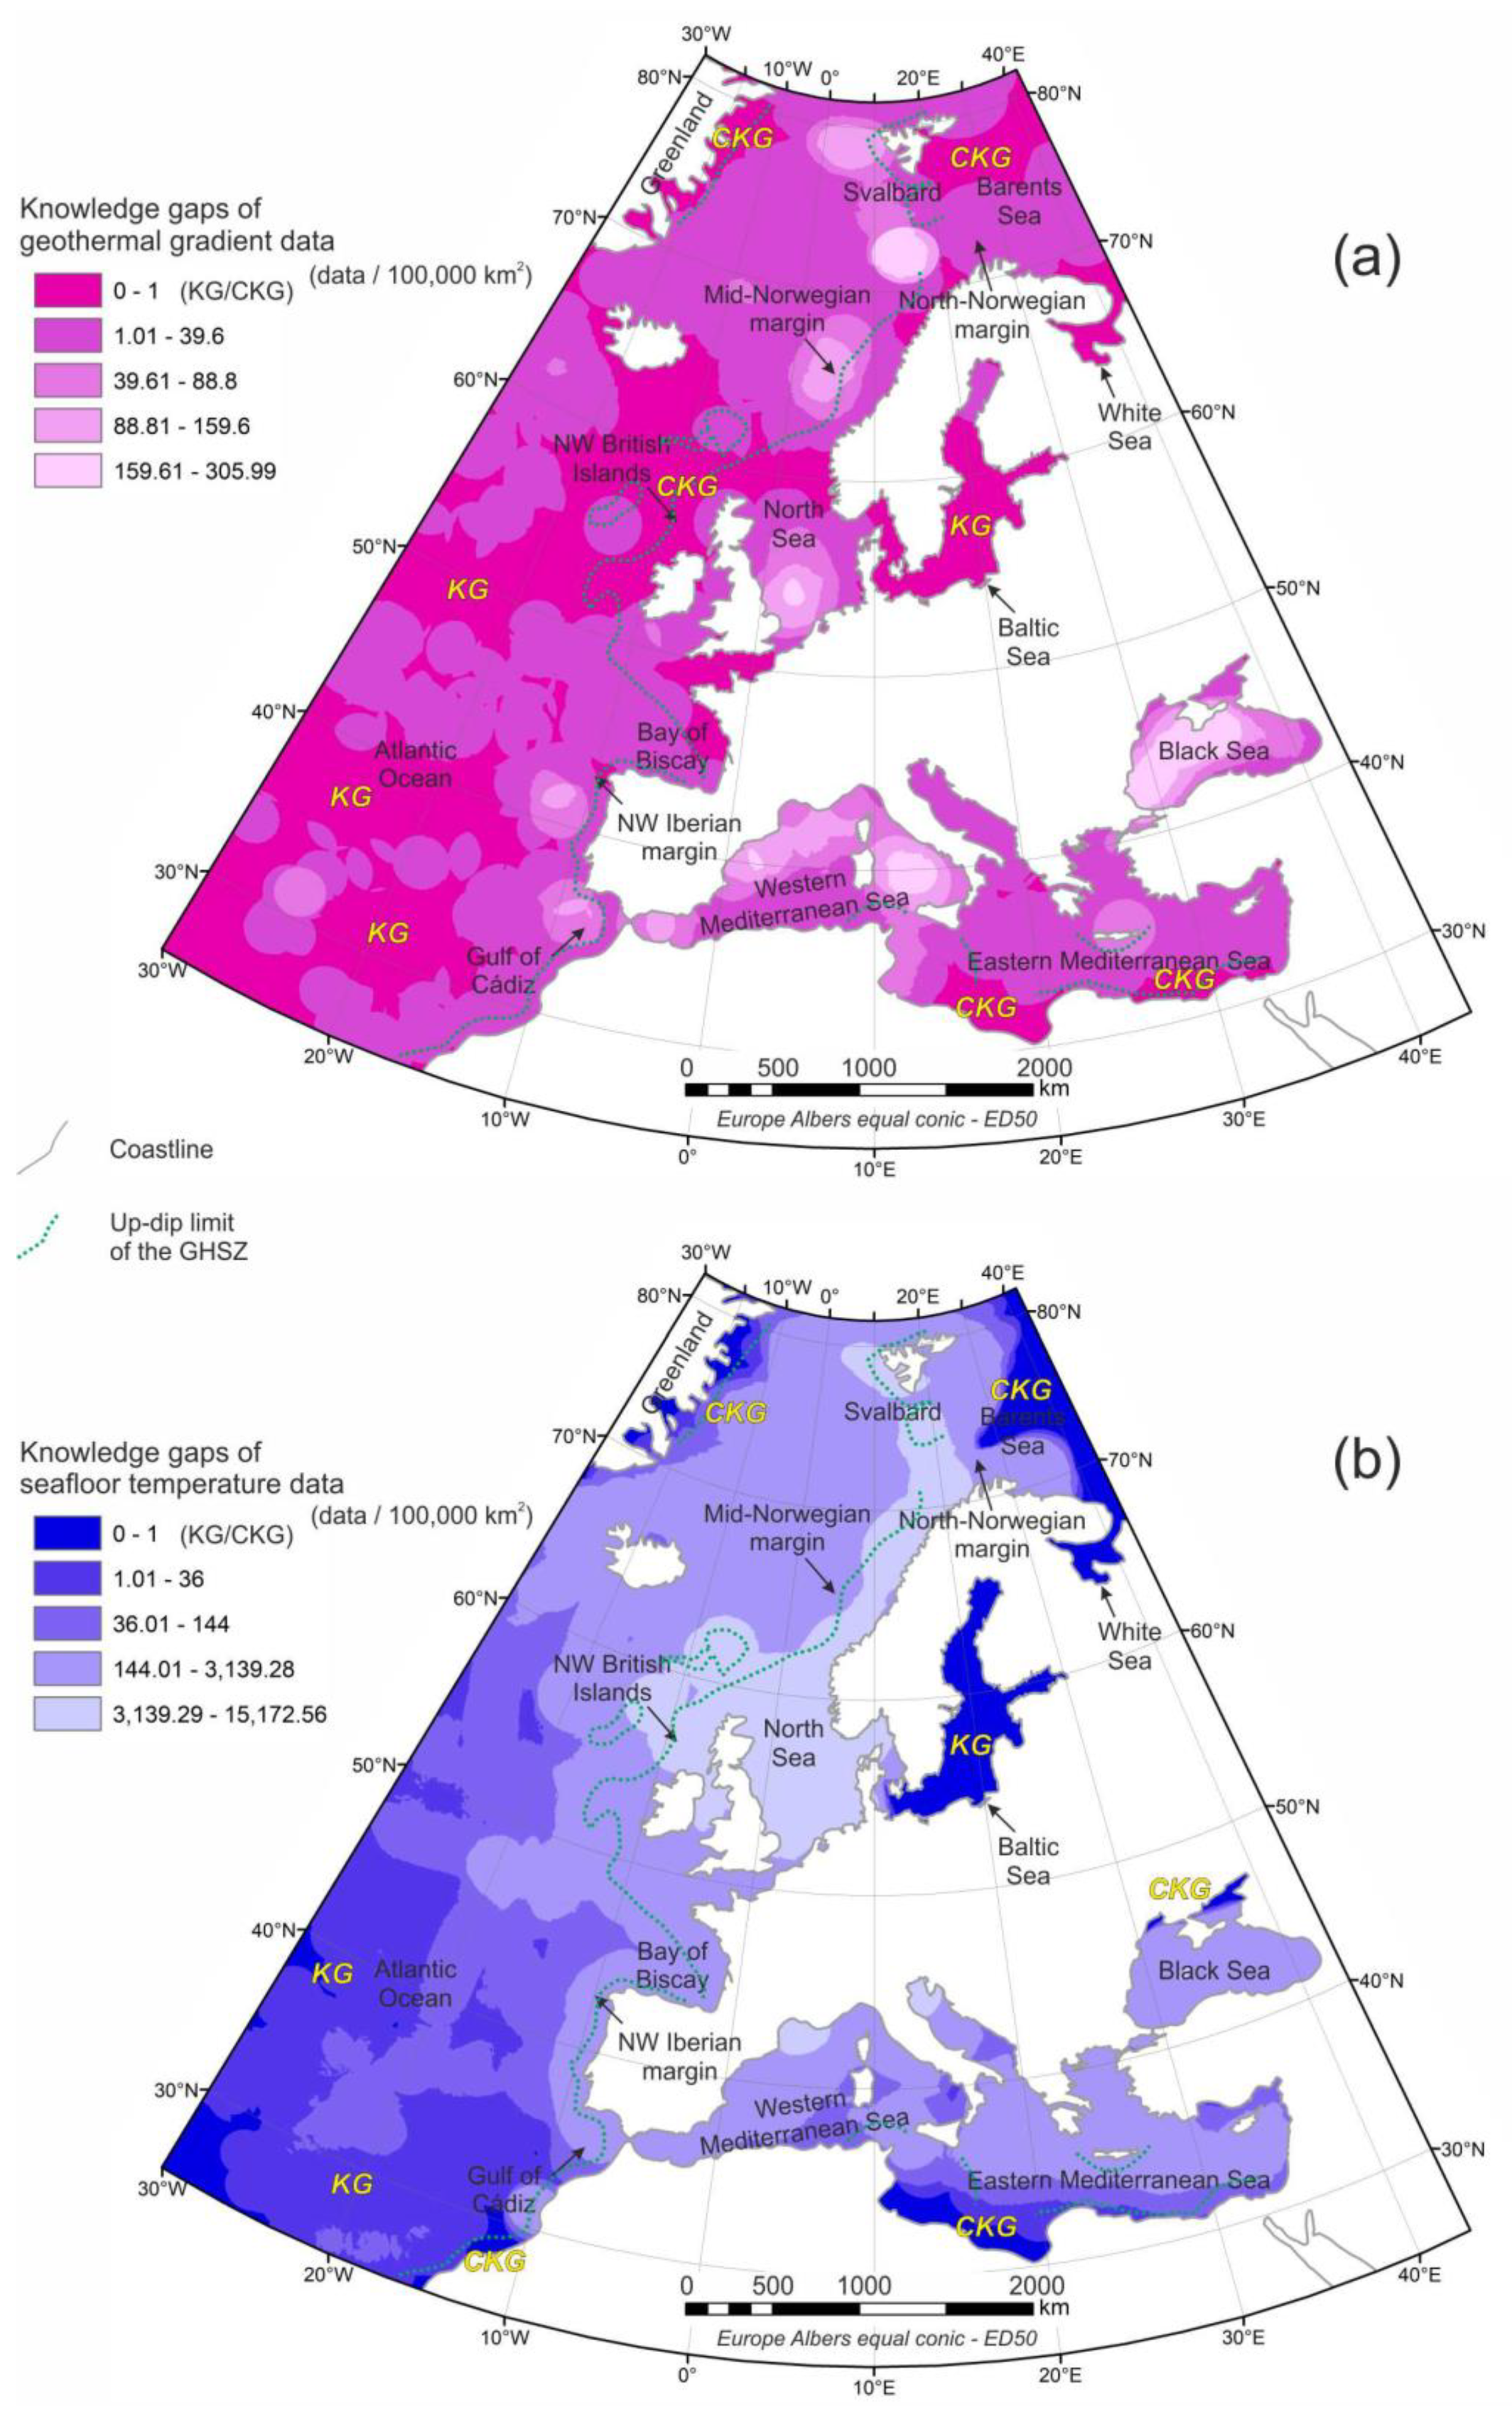
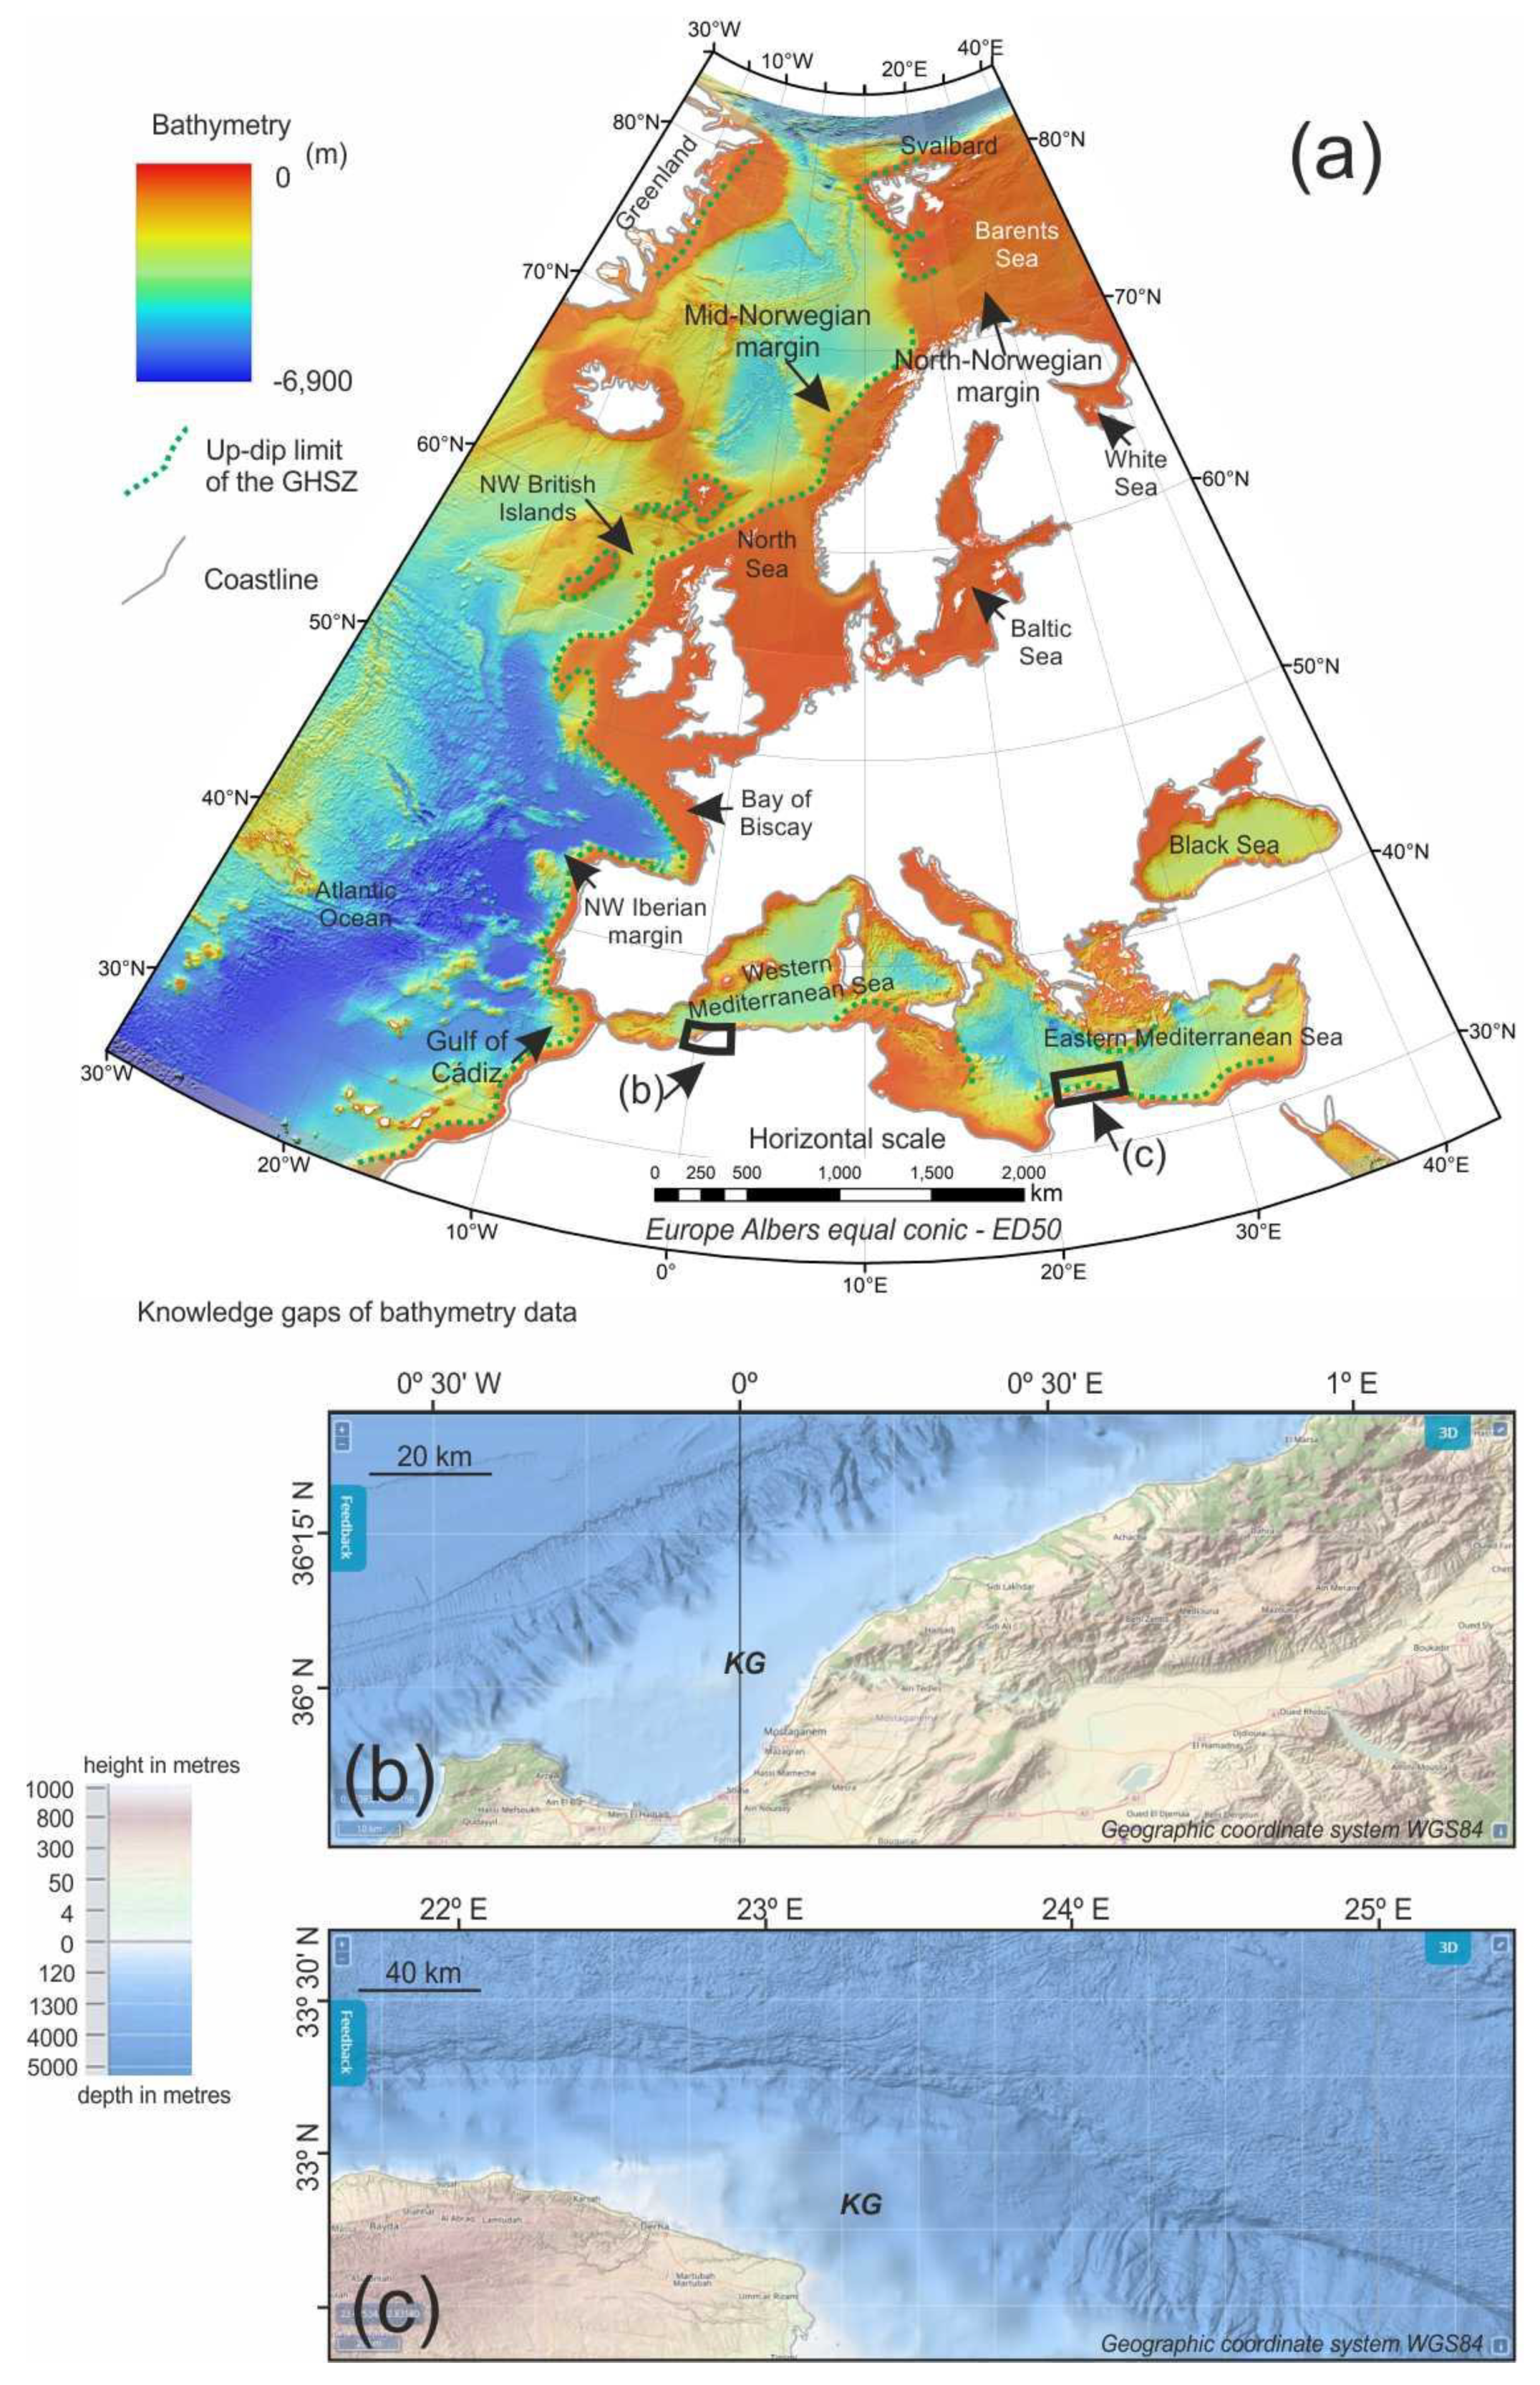
5.1. Hydrate-Related Knowledge Gaps

Nucleation and dissociation of marine methane hydrates are directly controlled by the presence of hydrocarbon gas solubility in the sediment pore water and three environmental parameters: seafloor temperature, geothermal gradient and pressure (water depth) [3]. However, free public information about these key parameters shows a non-homogeneous continuity along the European continental margins. This issue is especially critical for understanding the behaviour of the GHSZ or making predictions or calculations on it. In particular, it is essential for assessments related to geohazards and risks, assessments of the abundance of sediment-hosted gas hydrates, and assessments of the role of CO2-rich hydrates in the geological storage of CO2. The issue is also of broad interest to the scientific community: petroleum geologists, biologists and ecologist working on vulnerable ecosystems, researchers on natural hazards and tsunamis, civil engineers and policy makers.
We therefore assessed the critical knowledge gaps in the geological and geophysical evidence and indicators and the oceanographic variables taken into account in the calculation of the GHSZ thickness. This assessment was carried out along density maps of seafloor temperature, geothermal gradient and hydrate evidence and indicators. Owing to the regional (pan-European) scope, an area unit was established at a sedimentary basin scale of 100,000 km2 (a searching radius of ca. 178.4 km) and a surface resolution of 5 km × 5 km.
Evidence of marine methane hydrates has been reported in eight main regions along the European continental margins (Figure 2): offshore Greenland and Svalbard, the Norwegian margin, offshore the northern British Islands, the southern Iberian and northwest African margins (the Gulf of Cádiz and Alborán Sea), and the Black, Marmara and eastern Mediterranean seas. These areas show a high density of high-quality data resulting from several scientific oceanographic cruises and an intensive scientific survey. Outside the limits of these areas, the lack of evidence and indicators is obvious. In our opinion, the reliability of this lack of evidence is controversial (Figure 6). Although the majority of European continental margins have been prospected for the oil industry, some deep ocean basin areas have not. Therefore, some areas with a lack of evidence (possibly located in deep ocean basins) could be treated as information gaps resulting from a lack of prospection or scientific fluid flow research.
Seafloor temperature and marine geothermal data have a heterogeneous distribution. Marine geothermal data appear to be concentrated with high density in some of the above-mentioned eight main regions with hydrate evidence surveyed by scientific cruises (Figure 7a). On the other hand, seafloor temperature data, the most sensitive variable in the theoretical calculation of the base of the GHSZ [63], are especially concentrated in the Black Sea and on the eastern Atlantic continental shelf (Figure 7b). For the two above datasets, areas with less than 1 record per 100,000 km2 were selected as knowledge gaps (KG in Figure 7). These knowledge gaps are especially critical (i) in areas where direct hydrate samples have been recovered, (ii) in the vicinity of the up-dip limit of the GHSZ, and (iii) in areas where seabed fluid flow structures have been detected. The critical knowledge gaps for geothermal gradient data are east of Greenland, Svalbard─Barents Sea, the White Sea, northwest of the British Islands and the southeastern Mediterranean Sea; and for seafloor temperature they are east Greenland, the western Barents and White seas, the northern Black Sea and the southeastern Mediterranean Sea (north of Libya). In addition, because of the critical need to understand geothermal gradient in areas that have a relatively high spatial variance, high-resolution coverage is critical, in particular in order to assess the potential for uncertainty predictions for similar areas with no data.
In general, the public bathymetry data collected (EMODnet Bathymetry and IBCAO) have a quite acceptable quality and have been very useful for the objectives of this hydrate-related pan-European study. The original grid has a cell size of 100 × 100 m and the inference was calculated with a cell size of 5 × 5 km.
The EMODnet Bathymetry dataset has a quality value stored for each pixel/bathymetry datum calculated from derived bathymetric parameters: minimum water depth in metres to the lowest astronomical tide (LAT), average water depth in metres to the LAT, maximum water depth in metres to the LAT, standard deviation of water depth in metres, number of values used for interpolation over the grid cell, the interpolation flag (identification of extrapolated cells), average water depth smoothed by means of a spline function in metres to the LAT, an indicator of the offsets between the average and smoothed water depth as a % of the water depth, and a reference to the prevailing source of data with metadata. Unfortunately, this information (per pixel) is not available on the web portal. Consequently, quantifiable targets for calculating knowledge gaps are not available. However, through a visual analysis, areas with poor accuracy or lack of data were selected, especially on the North African Mediterranean margins (e.g., north of Libya). These areas were classified as bathymetry knowledge gaps (KG in Figure 8b,c). However, owing to the resolution of the inference (5 × 5 km), no critical gaps were determined for the bathymetric data.

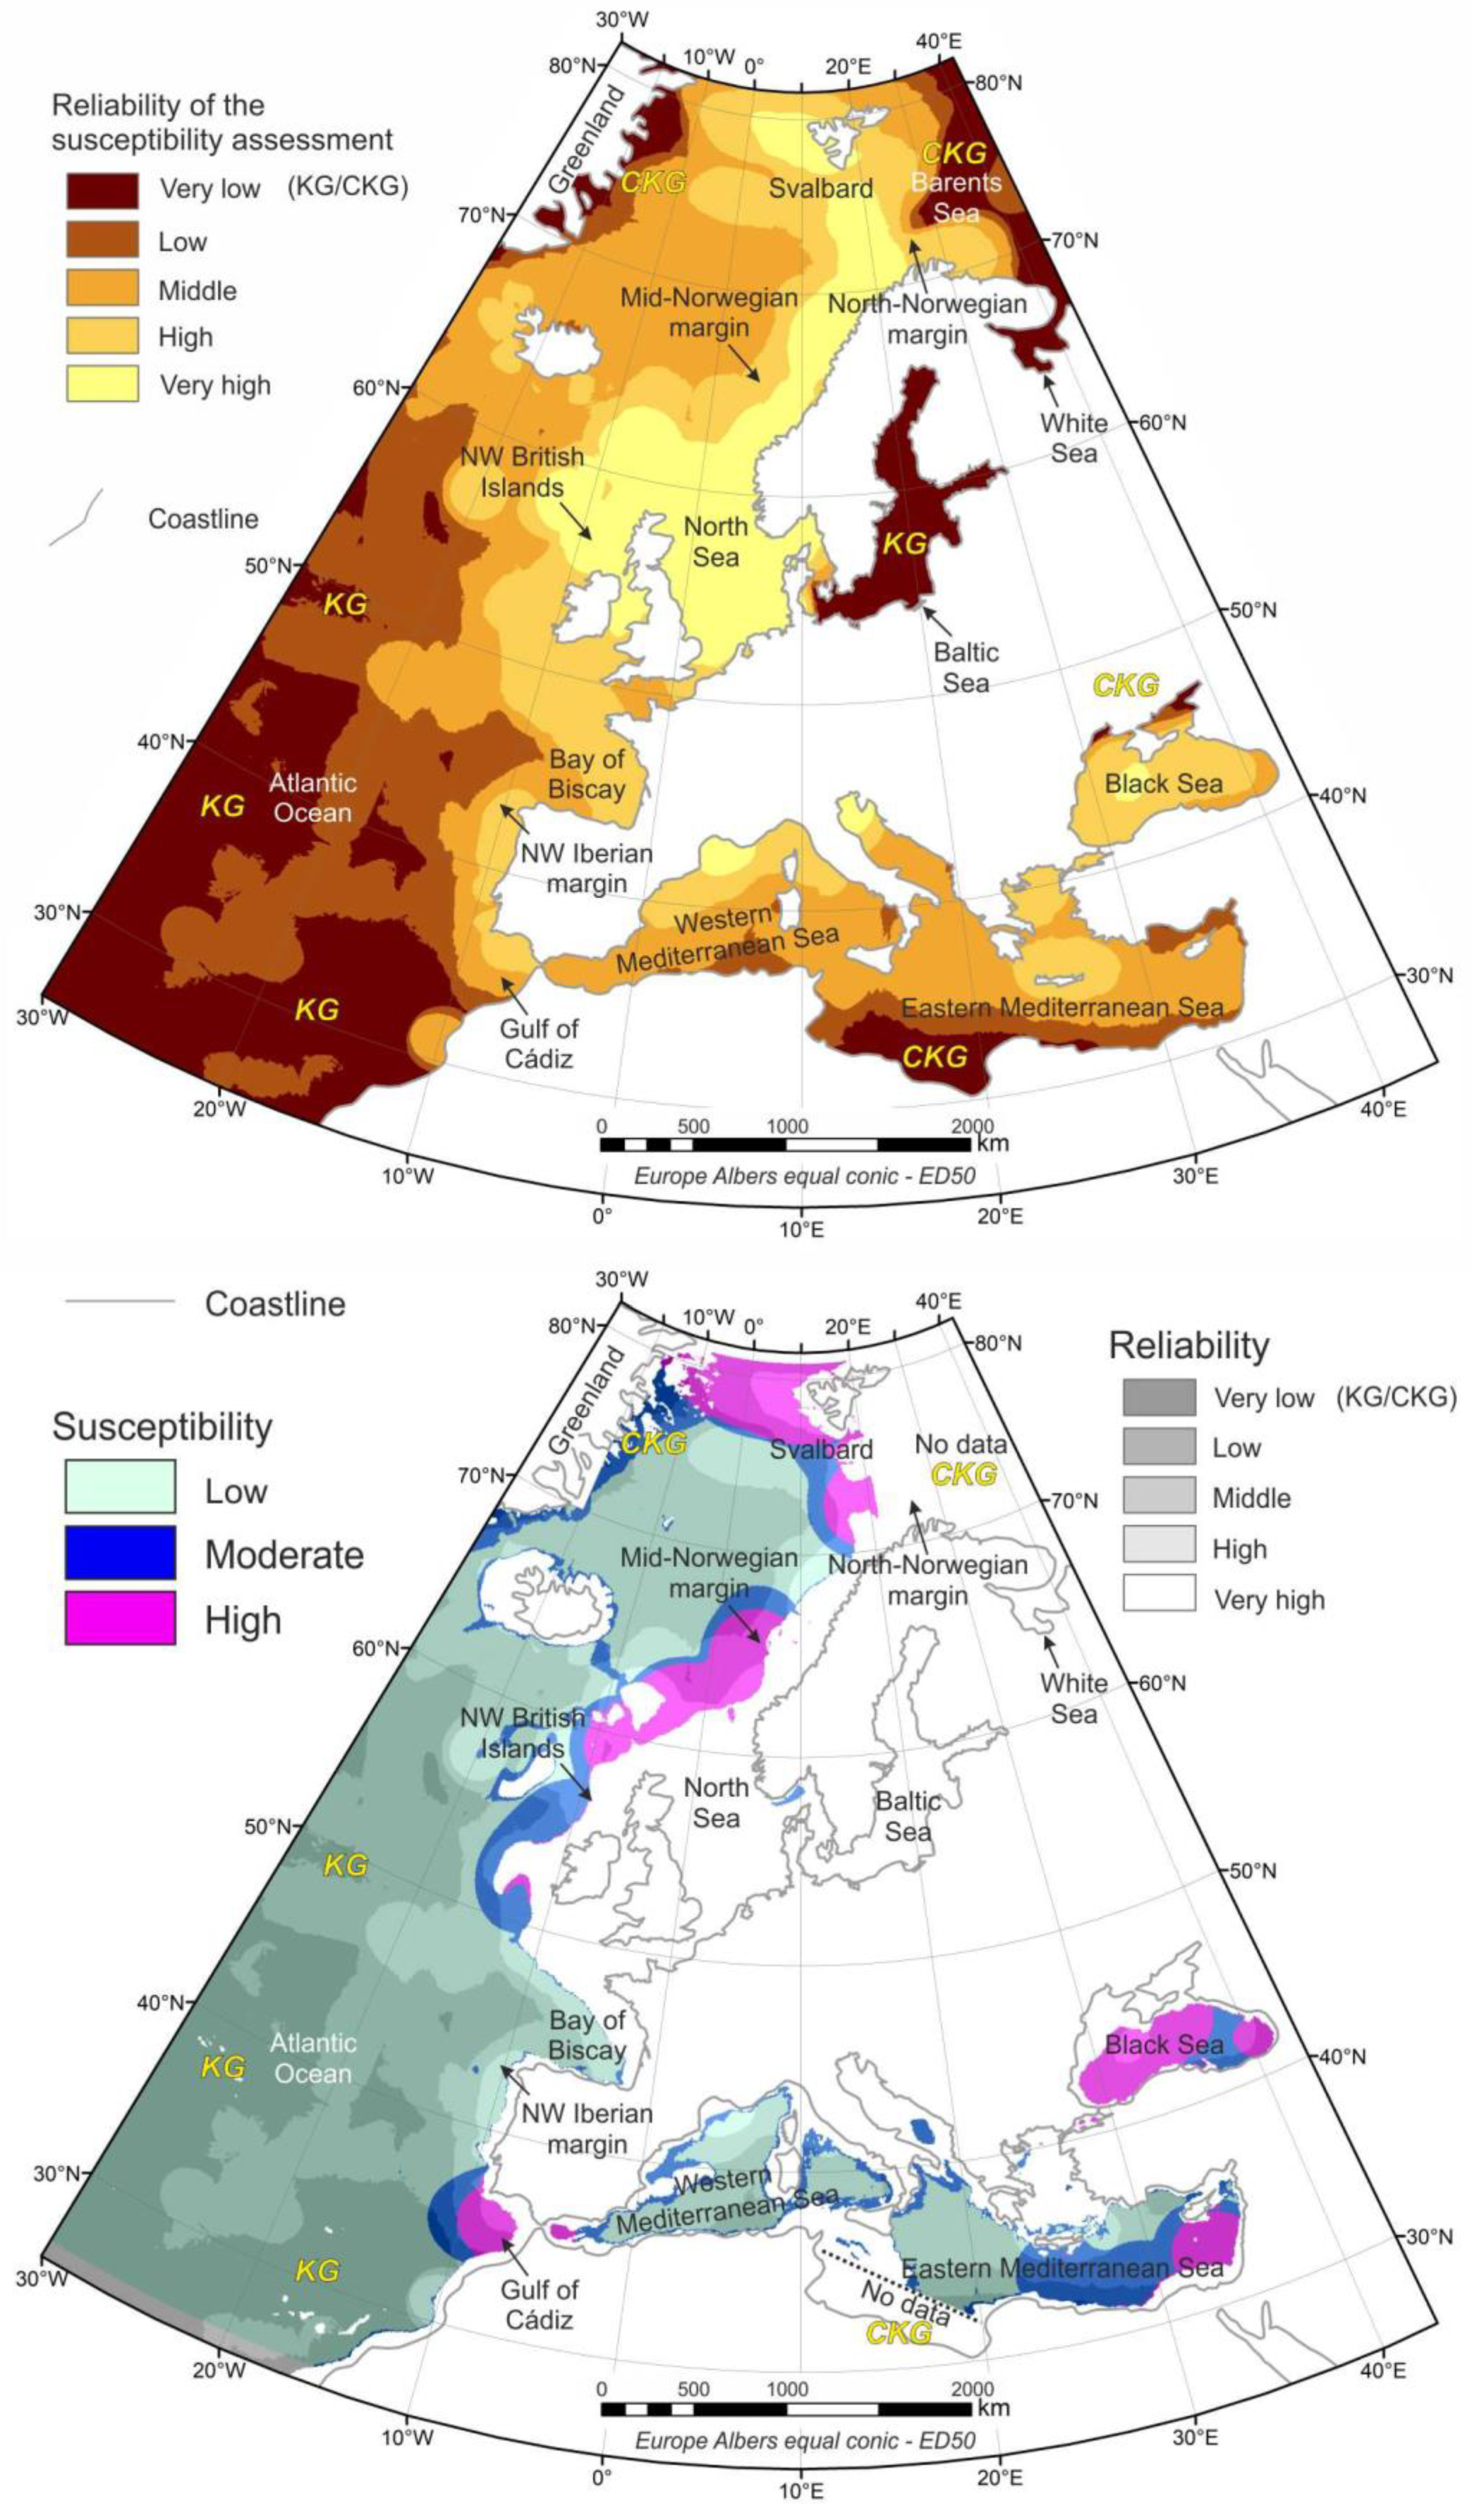
5.2. Reliability of the Susceptibility Assessment

In areas where hydrate evidence and indicators have been reported, the assumption of a salinity of 36 psi for the theoretical GHSZ calculated by Núñez-Varela [61] along the study area involves an error in the thickness calculation of ±2–10 m in the Arctic region (33–35 psi), ±5 m in the Mediterranean Sea (38 psi) and ±30 m in the Black Sea (17 psi) [64]. Nevertheless, considering the regional scale of the susceptibility assessment (cell size of 5 × 5 km), these errors are acceptable in the thickness calculation because they lay inside the vertical precision of the assessment. The error made by the difference in salinity in the theoretical GHSZ is lower than the vertical precision of this calculation due to the variation of the bathymetry each 5 km along the continental slope. In particular, ±15–120 m in the Arctic region, and ±100–200 m in both the Mediterranean and Black Sea. Regarding the Black Sea, although errors coming from salinity are still acceptable, the susceptibility resulting should be taken with caution, as values could be higher.
In order to assess the reliability of the susceptibility inference, a qualitative value of uncertainty (very high, high, middle, low and very low) was established as a function of the data density taken into account in the susceptibility calculation (Figure 9). The reliability ( u ) is thus equal to the sum of the density maps of geothermal gradient ( ρ g r ), seafloor temperature ( ρ s t ) and hydrate evidence and indicators ( ρ h y ):
u =   ρ g r + ρ s t + ρ h y
Five levels of reliability were established. The reliability is considered “very low” with values from 0 to 36 data per 100,000 km2, approximately less than ca. 1 datum per 50 km in mean; and “low”, “middle”, “high” and “very high” from 36 to 144, from 144 to 648, from 648 to 3149, and from 3149 to 15,218 data per 100,000 km2, respectively. These levels were defined by the geometrical segmentation of u -value, except “very low” and “low”, which were defined by expert criteria. Very low reliability areas were catalogued as global knowledge gaps (KG in Figure 9) that are critical (CKG) in the vicinity of the up-dip limit of the GHSZ and hydrocarbon seabed fluid flow structures.
Areas located in the proximity of the continental shelf and intensively surveyed by oceanographic cruises show the most reliable results in the susceptibility assessment. By contrast, areas distant from the coastline (e.g., the mid-Atlantic Ocean) and areas that are inaccessible because of the presence of icebergs (e.g., east Greenland) or political issues (e.g., north of Libya) have very high uncertainty.

5.3. Spatial Significance of the Susceptibility Assessment and the Impact of Knowledge gaps

Owing to the methodology applied, the hydrate evidence knowledge gaps are directly related to low values of susceptibility. These knowledge gaps may have two possible causes: (i) the catalogue is incomplete, these areas have been poorly surveyed, no records have been recovered, but hydrates may exist and subsequently a high susceptibility may be potentially latent; and (ii) there are no data because there is no evidence of hydrates. In order to solve this uncertainty, two concepts are added in the susceptibility assessment: the up-dip limit of the GHSZ and the presence of hydrocarbon seabed fluid flow structures. Particularly, examples of this situation are the east Greenland shelf, the Irish margin, the western Iberian margin and the western Mediterranean Sea, where no hydrates have been recovered but hydrocarbon seabed fluid flow structures and seismic indicators (e.g., on the Irish margin) have been observed.
High susceptibility values are located in areas with a high density of evidence and indicators. The majority of gas hydrate evidence stored in the database was recovered in focused seabed fluid flow structures such as mud volcanoes or pockmarks. This is especially significant on the southern European margins in the Gulf of Cádiz and the eastern Mediterranean and Black seas. In these cases, gas hydrates are circumscribed to the feeder systems of the hydrocarbon fluid migration structures, which, subject to certain exceptions, do not exceed 0.1 to 1 km and 4 km in diameter for pockmarks and mud volcanoes, respectively. In these areas, there is therefore no continuous spatial variation in the presence of hydrates. Gas hydrates appear with a located distribution (nugget effect?) and focused inside the hydrocarbon fluid flow structures where fluid migration is mainly controlled by faults [45,65]. However, the presence of hydrocarbon fluid flow structures shows a continuous spatial variation in fluid leakage areas. In these areas, the density map shows areas where hydrate-bearing fluid flow structures are more probable and, subsequently, the likelihood of the seafloor suffering gas hydrate dissociation processes as a result of natural or human activities could also be high. Finally, although the susceptibility could be high in mud volcano fields, for instance, the real risk or magnitude of dissociation processes will be low because of the typology or internal structure of hydrates inside the sediment. In mud volcanoes, hydrates constitute small (millimetres or centimetres) crystals or aggregates, and their real volume is low.
Moderate susceptibility values seem to be controlled by the GHSZ and in particular by the optimal theoretical environmental conditions for hydrate presence on the continental shelves of the Arctic region and Mediterranean Sea. In our opinion, the presence of moderate values on the eastern continental shelf of Greenland and their absence on the western Norwegian shelf is directly related to the presence of cooler bottom water masses on the eastern continental shelf of Greenland and the subsequent influence on the theoretical GHSZ. Although no hydrates have been recovered in the Mediterranean Sea, owing to the particular seafloor temperature/pressure conditions (bathymetry) on the continental slope, this area has a slightly elevated likelihood of occurrence of hydrate dissociation processes in the hypothetical presence of hydrocarbon gases in the sediment column.
The future global warming scenario projected by the scientific community [66,67,68] increases the susceptibility assessed by the direct effect on the gas hydrate stability of the ocean temperature increase [69] and the isostatic rebound in polar and sub-polar areas [9]. This direct effect (seafloor temperature increase and effective seafloor pressure decrease) will have a high impact on the eastern Greenland shelf, the northwest Norwegian margin, Svalbard and the Barents Sea, and subsequently the susceptibility in these areas will increase greatly. Furthermore, future changes in the thermohaline circulation [67,68] could have dramatic effects at high latitudes on the seafloor temperature and subsequently on hydrate stability.

6. Conclusions

Geological and geophysical evidence and indicators of the presence of marine gas hydrates and the oceanographic variables controlling the GHSZ show a heterogeneous distribution and knowledge gaps (areas with <1 records per 100 km2) along the European continental margins. Some of these knowledge gaps have been classified as critical: (i) for geothermal gradient, data on the east of Greenland, Svalbard, the northern Norwegian margin, the southern Barents Sea and the White Sea, the north of the British Islands, the Gulf of Cádiz, the Bay of Biscay, the north-western Iberian margin and the southwestern Mediterranean Sea; and (ii) for seafloor temperature, data on east of Greenland, the western Barents Sea and White Sea, the northern Black Sea and the south-eastern Mediterranean Sea.
The susceptibility assessment of occurrence of hydrate dissociation processes on the seafloor shows high values in Svalbard, the northern Norwegian margin—Barents Sea, the continental slope of the mid-Norwegian margin and the North Sea, the Gulf of Cádiz and the eastern Mediterranean and the Black Sea. Moderate values are observed on the continental shelf of western Greenland, the northwest of the British Islands and the continental slope of the western and northern Mediterranean Sea.

Author Contributions

Conceptualization and writing—original draft preparation, R.L. and C.J.G.-M.; methodology, validation, formal analysis and writing—review and editing, R.L., M.L. and C.J.G.-M. All authors have read and agreed to the published version of the manuscript.

Funding

This research was funded by the European Union’s Horizon 2020 research and innovation programme under grant agreement No 731166, GARAH project (GeoERA- GeoE.171.002 GE-1), EMODnet Bathymetry—High Resolution Seabed Mapping (EASME/EMFF/2018/007).

Data Availability Statement

Data used in this paper are available in a public and permanent repository (https://data.mendeley.com/datasets/vbt6hspgpn/draft?preview=1, (accessed on 20 March 2020)) with doi:10.17632/vbt6hspgpn.1.

Acknowledgments

We thank C. Guardiola, A. Lounds, the WP3 team of the GARAH project (P. Mata, C. Rochelle, A. Burnol, T. Nielsen, J. Hopper, I. Reguera, M. Stewart, S. Cervel and U. Larsen), and the MIGRATE COST Action coordination and WP1 teams (K. Wallmann, S. Bünz, T. Minshull, H. Marín-Moreno, J. Schicks., J. Bialas, G. Cifci, M. Giustiniani, J. Hopper, V. Magalhaes, Y. Makovsky, M.D. Max, T. Nielsen, S. Okay, I. Ostrovsky, N. O’Neill, A. Plaza-Faverola, C. Rochelle, S. Roy, K. Schwalenberg, K. Senger, S. Vadakkepuliyambatta, A. Vasilev).

Conflicts of Interest

The authors declare no conflict of interest. The funders had no role in the design of the study; in the collection, analysis or interpretation of data; in the writing of the manuscript; or in the decision to publish the results.

References

  1. Paull, C.K.; Dallimore, S.R.; Caress, D.W.; Gwiazda, R.; Melling, H.; Riedel, M.; Jin, Y.K.; Hong, J.K.; Kim, Y.-G.; Graves, D.; et al. Active mud volcanoes on the continental slope of the Canadian Beaufort Sea. Geochem. Geophys. Geosystems 2015, 16, 3160–3181. [Google Scholar] [CrossRef]
  2. Boswell, R.; Yamamoto, K.; Lee, S.-R.; Collett, T.; Kumar, P.; Dallimore, S. Chapter 8—Methane Hydrates. In Future Energy, 2nd ed.; Letcher, T.M., Ed.; Elsevier: Boston, MA, USA, 2014; pp. 159–178. ISBN 978-0-08-099424-6. [Google Scholar]
  3. Sloan, E.D. Fundamental principles and applications of natural gas hydrates. Nature 2003, 426, 353–359. [Google Scholar] [CrossRef]
  4. You, K.; Flemings, P.B.; Malinverno, A.; Collett, T.S.; Darnell, K. Mechanisms of Methane Hydrate Formation in Geological Systems. Rev. Geophys. 2019, 57, 1146–1196. [Google Scholar] [CrossRef]
  5. Dickens, G.R. The potential volume of oceanic methane hydrates with variable external conditions. Org. Geochem. 2001, 32, 1179–1193. [Google Scholar] [CrossRef]
  6. Fryer, P.; Wheat, C.G.; Mottl, M.J. Mariana blueschist mud volcanism: Implications for conditions within the subduction zone. Geology 1999, 27, 103–106. [Google Scholar] [CrossRef]
  7. Hensen, C.; Scholz, F.; Nuzzo, M.; Valadares, V.; Gràcia, E.; Terrinha, P.; Liebetrau, V.; Kaul, N.; Silva, S.; Martínez-Loriente, S.; et al. Strike-slip faults mediate the rise of crustal-derived fluids and mud volcanism in the deep sea. Geology 2015, 43, 339–342. [Google Scholar] [CrossRef] [Green Version]
  8. Ruppel, C.D.; Kessler, J.D. The interaction of climate change and methane hydrates. Rev. Geophys. 2017, 55, 126–168. [Google Scholar] [CrossRef]
  9. Wallmann, K.; Riedel, M.; Hong, W.L.; Patton, H.; Hubbard, A.; Pape, T.; Hsu, C.W.; Schmidt, C.; Johnson, J.E.; Torres, M.E.; et al. Gas hydrate dissociation off Svalbard induced by isostatic rebound rather than global warming. Nat. Commun. 2018, 9, 83. [Google Scholar] [CrossRef]
  10. Argentino, C.; Conti, S.; Fioroni, C.; Fontana, D. Evidences for Paleo-Gas Hydrate Occurrence: What We Can Infer for the Miocene of the Northern Apennines (Italy). Geosciences 2019, 9, 134. [Google Scholar] [CrossRef] [Green Version]
  11. Serov, P.; Vadakkepuliyambatta, S.; Mienert, J.; Patton, H.; Portnov, A.; Silyakova, A.; Panieri, G.; Carroll, M.L.; Carroll, J.; Andreassen, K.; et al. Postglacial response of Arctic Ocean gas hydrates to climatic amelioration. Proc. Natl. Acad. Sci. USA 2017, 114, 6215–6220. [Google Scholar] [CrossRef] [PubMed] [Green Version]
  12. McConnell, D.R.; Zhang, Z.; Boswell, R. Review of progress in evaluating gas hydrate drilling hazards. Mar. Pet. Geol. 2012, 34, 209–223. [Google Scholar] [CrossRef]
  13. Hervás, J.; Bobrowsky, P. Mapping: Inventories, Susceptibility, Hazard and Risk. In Landslides—Disaster Risk Reduction; Sassa, K., Canuti, P., Eds.; Springer: Berlin/Heidelberg, Germany, 2009; pp. 321–349. ISBN 978-3-540-69970-5. [Google Scholar]
  14. Kvenvolden, K.A.; Lorenson, T.D. The Global Occurrence of Natural Gas Hydrate. In Natural Gas Hydrates: Occurrence, Distribution, and Detection; American Geophysical Union (AGU): Washington, DC, USA, 2001; pp. 3–18. ISBN 978-1-118-66841-2. [Google Scholar]
  15. Wallmann, K.; Pinero, E.; Burwicz, E.; Haeckel, M.; Hensen, C.; Dale, A.; Ruepke, L. The Global Inventory of Methane Hydrate in Marine Sediments: A Theoretical Approach. Energies 2012, 5, 2449–2498. [Google Scholar] [CrossRef]
  16. Liu, F.; Che, Y.; Xu, S.; Chen, Q.; Tan, L. Managing Information of Gas Hydrate Reservoirs of the South China Sea in an Integrated GIS Database. In Proceedings of the GeoShanghai 2018 International Conference: Geoenvironment and Geohazard; Farid, A., Chen, H., Eds.; Springer: Singapore, 2018; pp. 37–44. [Google Scholar]
  17. Maslin, M.; Owen, M.; Betts, R.; Day, S.; Dunkley Jones, T.; Ridgwell, A. Gas hydrates: Past and future geohazard? Philos. Trans. R. Soc. Math. Phys. Eng. Sci. 2010, 368, 2369–2393. [Google Scholar] [CrossRef] [PubMed]
  18. Weber, T.; Wiseman, N.A.; Kock, A. Global ocean methane emissions dominated by shallow coastal waters. Nat. Commun. 2019, 10, 4584. [Google Scholar] [CrossRef] [PubMed]
  19. Reeburgh, W.S. Oceanic Methane Biogeochemistry. Chem. Rev. 2007, 107, 486–513. [Google Scholar] [CrossRef] [PubMed] [Green Version]
  20. Bernardino, A.F.; Levin, L.A.; Thurber, A.R.; Smith, C.R. Comparative Composition, Diversity and Trophic Ecology of Sediment Macrofauna at Vents, Seeps and Organic Falls. PLoS ONE 2012, 7, e33515. [Google Scholar] [CrossRef] [Green Version]
  21. Ristova, P.P.; Wenzhöfer, F.; Ramette, A.; Felden, J.; Boetius, A. Spatial scales of bacterial community diversity at cold seeps (Eastern Mediterranean Sea). ISME J. 2015, 9, 1306–1318. [Google Scholar] [CrossRef] [Green Version]
  22. Minshull, T.A.; Marín-Moreno, H.; Betlem, P.; Bialas, J.; Bünz, S.; Burwicz, E.; Cameselle, A.L.; Cifci, G.; Giustiniani, M.; Hillman, J.I.T.; et al. Hydrate occurrence in Europe: A review of available evidence. Mar. Pet. Geol. 2020, 111, 735–764. [Google Scholar] [CrossRef]
  23. Oakey, G.N.; Chalmers, J.A. A new model for the Paleogene motion of Greenland relative to North America: Plate reconstructions of the Davis Strait and Nares Strait regions between Canada and Greenland. J. Geophys. Res. Solid Earth 2012, 117. [Google Scholar] [CrossRef]
  24. Nielsen, T.; Laier, T.; Kuijpers, A.; Rasmussen, T.L.; Mikkelsen, N.E.; Nørgård-Pedersen, N. Fluid flow and methane occurrences in the Disko Bugt area offshore West Greenland: Indications for gas hydrates? Geo-Mar. Lett. 2014, 34, 511–523. [Google Scholar] [CrossRef] [Green Version]
  25. Mattingsdal, R.; Knies, J.; Andreassen, K.; Fabian, K.; Husum, K.; Grøsfjeld, K.; De Schepper, S. A new 6 Myr stratigraphic framework for the Atlantic–Arctic Gateway. Quat. Sci. Rev. 2014, 92, 170–178. [Google Scholar] [CrossRef]
  26. Dumke, I.; Burwicz, E.B.; Berndt, C.; Klaeschen, D.; Feseker, T.; Geissler, W.H.; Sarkar, S. Gas hydrate distribution and hydrocarbon maturation north of the Knipovich Ridge, western Svalbard margin. J. Geophys. Res. Solid Earth 2016, 121, 1405–1424. [Google Scholar] [CrossRef] [Green Version]
  27. Vogt, P.R.; Cherkashev, G.A.; Ginsburg, G.D.; Ivanov, M.K.; Crane, K.; Lein, A.; Sundvor, E.; Pimenov, N.; Egorov, A.V. EOS, Transaction, American Geophysican Union-Wiley Online Library; Wiley: Hoboken, NJ, USA, 1997; pp. 556–557. [Google Scholar]
  28. Plaza-Faverola, A.; Vadakkepuliyambatta, S.; Hong, W.-L.; Mienert, J.; Bünz, S.; Chand, S.; Greinert, J. Bottom-simulating reflector dynamics at Arctic thermogenic gas provinces: An example from Vestnesa Ridge, offshore west Svalbard. J. Geophys. Res. Solid Earth 2017, 122, 4089–4105. [Google Scholar] [CrossRef] [Green Version]
  29. Johnson, J.E.; Mienert, J.; Plaza-Faverola, A.; Vadakkepuliyambatta, S.; Knies, J.; Bünz, S.; Andreassen, K.; Ferré, B. Abiotic methane from ultraslow-spreading ridges can charge Arctic gas hydrates. Geology 2015, 43, 371–374. [Google Scholar] [CrossRef] [Green Version]
  30. Doré, A.G. Barents Sea Geology, Petroleum Resources and Commercial Potential. Arctic 1995, 48, 207–221. [Google Scholar] [CrossRef]
  31. Rise, L.; Ottesen, D.; Berg, K.; Lundin, E. Large-scale development of the mid-Norwegian margin during the last 3 million years. In Ormen Lange—An Integrated Study for Safe Field Development in the Storegga Submarine Area; Solheim, A., Bryn, P., Berg, K., Sejrup, H.P., Mienert, J., Eds.; Elsevier: Oxford, UK, 2005; pp. 33–44. ISBN 978-0-08-044694-3. [Google Scholar]
  32. Bryn, P.; Berg, K.; Forsberg, C.F.; Solheim, A.; Kvalstad, T.J. Explaining the Storegga Slide. Mar. Pet. Geol. 2005, 22, 11–19. [Google Scholar] [CrossRef]
  33. Asch, K. The 1:5 Million International Map of Europe and Adjacent Areas—IGME 5000 2005, Bundesanstalt für Geowissenschaften und Rohstoffe (BGR). Available online: https://download.bgr.de/bgr/Geologie/IGME5000/pdf/igme5000.zip (accessed on 20 March 2020).
  34. Woudloper. Tectonic Map of Southern Europe, North Africa and the Middle East, Showing Tectonic Structures of the Western Alpine Mountain Belt. 2009. Available online: https://commons.wikimedia.org/wiki/File:Tectonic_map_Mediterranean_EN.svg (accessed on 20 March 2020).
  35. Tasianas, A.; Bünz, S.; Bellwald, B.; Hammer, Ø.; Planke, S.; Lebedeva-Ivanova, N.; Krassakis, P. High-resolution 3D seismic study of pockmarks and shallow fluid flow systems at the Snøhvit hydrocarbon field in the SW Barents Sea. Mar. Geol. 2018, 403, 247–261. [Google Scholar] [CrossRef]
  36. Akhmetzhanov, A.M.; Kenyon, N.H.; Ivanov, M.K.; Westbrook, G.; Mazzini, A. Deep-Water Depositional Systems and Cold Seeps of the Western Mediterranean, Gulf of Cadiz and Norwegian Continental Margins; Preliminary results of investigations during the TTR-16 cruise of RV Professor Logachev, May–July 2006; United Nations Educational, Scientific and Cultural Organisation: Paris, France, 2008. [Google Scholar]
  37. Bünz, S.; Mienert, J.; Berndt, C. Geological controls on the Storegga gas-hydrate system of the mid-Norwegian continental margin. Earth Planet. Sci. Lett. 2003, 209, 291–307. [Google Scholar] [CrossRef]
  38. Vaular, E.N.; Barth, T.; Haflidason, H. The geochemical characteristics of the hydrate-bound gases from the Nyegga pockmark field, Norwegian Sea. Org. Geochem. 2010, 41, 437–444. [Google Scholar] [CrossRef] [Green Version]
  39. Shannon, P.M.; Moore, J.G.; Jacob, A.W.B.; Makris, J. Cretaceous and Tertiary basin development west of Ireland. Geol. Soc. Lond. Pet. Geol. Conf. Ser. 1993, 4, 1057–1066. [Google Scholar] [CrossRef]
  40. Rensbergen, P.V.; Rabaute, A.; Colpaert, A.; Ghislain, T.S.; Mathijs, M.; Bruggeman, A. Fluid migration and fluid seepage in the Connemara Field, Porcupine Basin interpreted from industrial 3D seismic and well data combined with high-resolution site survey data. Int. J. Earth Sci. 2007, 96, 185–197. [Google Scholar] [CrossRef]
  41. Moores, E.M.; Fairbridge, R.W. (Eds.) Encyclopedia of European and Asian Regional Geology; Encyclopedia of Earth Sciences Series; Springer: Dordrecht, The Netherlands, 1997; ISBN 978-0-412-74040-4. [Google Scholar]
  42. Kenyon, N.H.; Ivanov, M.K.; Akhmetzhanov, A.M.; Akhmanov, G.G. Interdisciplinary Approaches to Geoscience on the North East Atlantic Margin and Mid-Atlantic Ridge: Preliminary Results of Investigations During the TTR-10 Cruise of RV Professor Logachev, July–September 2000; IOC Technical Series; Unesco, United Nations Educational: Paris, France, 2001. [Google Scholar]
  43. Kenyon, N.H.; Ivanov, M.K.; Akhmetzhanov, A.M.; Akhmanov, G.G. Multidisciplinary Study of Geological Processes on the North East Atlantic and Western Mediterranean Margins: Preliminary Results of Geological and Geophysical Investigations During the TTR-9 Cruise of R/V Professor Logachev June–July, 1999; IOC Technical Series; Unesco, United Nations Educational: Paris, France, 2000. [Google Scholar]
  44. León, R.; Somoza, L.; Medialdea, T.; Maestro, A.; Díaz-del-Río, V.; Fernández-Puga, M. del C. Classification of sea-floor features associated with methane seeps along the Gulf of Cádiz continental margin. Deep Sea Res. Part II Top. Stud. Oceanogr. 2006, 53, 1464–1481. [Google Scholar] [CrossRef]
  45. Medialdea, T.; Somoza, L.; Pinheiro, L.M.; Fernández-Puga, M.C.; Vázquez, J.T.; León, R.; Ivanov, M.K.; Magalhaes, V.; Díaz-del-Río, V.; Vegas, R. Tectonics and mud volcano development in the Gulf of Cádiz. Mar. Geol. 2009, 261, 48–63. [Google Scholar] [CrossRef] [Green Version]
  46. Stadnitskaia, A.; Ivanov, M.K.; Blinova, V.; Kreulen, R.; van Weering, T.C.E. Molecular and carbon isotopic variability of hydrocarbon gases from mud volcanoes in the Gulf of Cadiz, NE Atlantic. Mar. Pet. Geol. 2006, 23, 281–296. [Google Scholar] [CrossRef]
  47. Mascle, J.; Mary, F.; Praeg, D.; Brosolo, L.; Camera, L.; Ceramicola, S.; Dupré, S. Distribution and geological control of mud volcanoes and other fluid/free gas seepage features in the Mediterranean Sea and nearby Gulf of Cadiz. Geo-Mar. Lett. 2014, 34, 89–110. [Google Scholar] [CrossRef]
  48. De Lange, G.J.; Brumsack, H.-J. The occurrence of gas hydrates in Eastern Mediterranean mud dome structures as indicated by pore-water composition. Geol. Soc. Lond. Spec. Publ. 1998, 137, 167–175. [Google Scholar] [CrossRef]
  49. Merey, Ş.; Longinos, S.N. Does the Mediterranean Sea have potential for producing gas hydrates? J. Nat. Gas Sci. Eng. 2018, 55, 113–134. [Google Scholar] [CrossRef]
  50. Römer, M.; Sahling, H.; Pape, T.; dos Santos Ferreira, C.; Wenzhöfer, F.; Boetius, A.; Bohrmann, G. Methane fluxes and carbonate deposits at a cold seep area of the Central Nile Deep Sea Fan, Eastern Mediterranean Sea. Mar. Geol. 2014, 347, 27–42. [Google Scholar] [CrossRef]
  51. Armijo, R.; Meyer, B.; Hubert, A.; Barka, A. Westward propagation of the North Anatolian fault into the northern Aegean: Timing and kinematics. Geology 1999, 27, 267–270. [Google Scholar] [CrossRef]
  52. Bourry, C.; Chazallon, B.; Charlou, J.L.; Pierre Donval, J.; Ruffine, L.; Henry, P.; Geli, L.; Çagatay, M.N.; İnan, S.; Moreau, M. Free gas and gas hydrates from the Sea of Marmara, Turkey: Chemical and structural characterization. Chem. Geol. 2009, 264, 197–206. [Google Scholar] [CrossRef] [Green Version]
  53. Sarıtaş, H.; Çifçi, G.; Géli, L.; Thomas, Y.; Marsset, B.; Henry, P.; Grall, C.; Rochat, A. Gas occurrence and shallow conduit systems in the Western Sea of Marmara: A review and new acoustic evidence. Geo-Mar. Lett. 2018, 38, 385–402. [Google Scholar] [CrossRef] [Green Version]
  54. Nikishin, A.M.; Okay, A.I.; Tüysüz, O.; Demirer, A.; Amelin, N.; Petrov, E. The Black Sea basins structure and history: New model based on new deep penetration regional seismic data. Part 1: Basins structure and fill. Mar. Pet. Geol. 2015, 59, 638–655. [Google Scholar] [CrossRef]
  55. Egorov, V.N.; Artemov, Y.G.; Gulin, S.B.; Gennadiy, P.G. Methane seeps in the Black Sea: Discovery, quantification and environmental assessment. J. Black SeaMediterranean Environ. 2011, 17, 171–185. [Google Scholar]
  56. Shnyukov, E.; Yanko-Hombach, V. Mud Volcanoes of the Black Sea Region and Their Environmental Significance.; Springer Nature: Cham, Switzerland, 2020; ISBN 978-3-030-40315-7. [Google Scholar]
  57. Leon, R.; Rochelle, C.; Burnol, A.; Gimenez-Moreno, C.J.; Nielsen, T.; Hopper, J.; Reguera, I.; Mata, P.; Stewart, M.; Cervel, S. A pan-European GIS focused on gas hydrates: A research base-line in geohazards and geological storage of CO2. In Proceedings of the Copernicus Meetings, EGU General Assembly 2020, Online, 4–8 May 2020. EGU2020-4861. [Google Scholar] [CrossRef]
  58. Holmes, R. Estimated Base of Methane Hydrate and Observations from Analogue Air-Gun Profiles West of Shetland; British Geological Survey Technical Report WB/97/5C; British Geological Survey: Edinburgh, UK, 1997. [Google Scholar]
  59. Holmes, R.; Finlayson, K.; Griffiths, M.A.; Andresen, P.C. Regional Shallow Gas Study West of Shetland; Report 95276/BGS Technical Report WB/96/45C; Hydrosearch Associates Ltd.; British Geological Survey: Edinburgh, UK, 1996. [Google Scholar]
  60. Long, D. Hydrates and Potential Existence in the Faeroe-Shetland Channel; BGS Technical Report WB/96/34C; British Geological Survey: Edinburgh, UK, 1996. [Google Scholar]
  61. Núñez-Varela, E. Cálculo del campo teórico de la zona de estabilidad de los hidratos de gas natural biogénico en los márgenes continentales europeos. Open_igme 2020, VII, 85. [Google Scholar]
  62. Sloan, E.D. Clathrate Hydrates of Natural Gases, 2nd ed.; Dekker: New York, NY, USA, 1998. [Google Scholar]
  63. León, R.; Somoza, L.; Giménez-Moreno, C.J.; Dabrio, C.J.; Ercilla, G.; Praeg, D.; Díaz-del-Río, V.; Gómez-Delgado, M. A predictive numerical model for potential mapping of the gas hydrate stability zone in the Gulf of Cadiz. Mar. Pet. Geol. 2009, 26, 1564–1579. [Google Scholar] [CrossRef] [Green Version]
  64. Sloan, E.D.; Koh, C.A. Clathrate Hydrates of Natural Gases; CRC Press, Taylor & Francis Group: Boca Raton, FL, USA; London, UK; New York, NY, USA, 2007; ISBN 978-1-4200-0849-4. [Google Scholar]
  65. Argentino, C.; Conti, S.; Crutchley, G.J.; Fioroni, C.; Fontana, D.; Johnson, J.E. Methane-derived authigenic carbonates on accretionary ridges: Miocene case studies in the northern Apennines (Italy) compared with modern submarine counterparts. Mar. Pet. Geol. 2019, 102, 860–872. [Google Scholar] [CrossRef]
  66. Gillett, N.P. Weighting climate model projections using observational constraints. Philos. Trans. R. Soc. Math. Phys. Eng. Sci. 2015, 373, 20140425. [Google Scholar] [CrossRef] [PubMed] [Green Version]
  67. Schmittner, A.; Latif, M.; Schneider, B. Model projections of the North Atlantic thermohaline circulation for the 21st century assessed by observations. Geophys. Res. Lett. 2005, 32. [Google Scholar] [CrossRef] [Green Version]
  68. Vellinga, M.; Wood, R.A. Global Climatic Impacts of a Collapse of the Atlantic Thermohaline Circulation. Clim. Change 2002, 54, 251–267. [Google Scholar] [CrossRef]
  69. Ketzer, M.; Praeg, D.; Rodrigues, L.F.; Augustin, A.; Pivel, M.A.G.; Rahmati-Abkenar, M.; Miller, D.J.; Viana, A.R.; Cupertino, J.A. Gas hydrate dissociation linked to contemporary ocean warming in the southern hemisphere. Nat. Commun. 2020, 11, 3788. [Google Scholar] [CrossRef]
Figure 1. Main tectonic structures and geological domains on the European continental margins and adjacent areas. Location of the study area. HM, Håkon–Mosby mud volcano; VB, Vøring Basin; MB, Møre Basin; SS, Storegga Slide; CGFZ, Charlie–Gibbs fracture zone; EEC, East European craton; Biscay Bay; GFZ, Gloria Fracture Zone; GC, Gulf of Cádiz; AS, Alborán Sea; SAEB, south European Alpine Belt, NAF, North Anatolian Fault; DD, Danube delta fan. (Taken from [23,33,34]).
Applsci 11 02865 g001
Figure 2. Geological, geophysical and oceanographic data sets used in the present paper. Marine gas hydrate evidence and indicators, and oceanographic variables stored in the GARAHydrates data base. (a) Study area. (b) West Greenland. (c) Barents Sea.
Applsci 11 02865 g002
Figure 3. Theoretical up-dip limit of the GHSZ in the study area (modified from Núñez-Varela, 2020). In the volcanic area of Macaronesia (the Canary and Madeira islands), the up-dip limit has been eliminated because of the absence of hydrocarbon reservoirs on the flanks of the islands.
Applsci 11 02865 g003
Figure 4. Normalized (zero to one) and weighted density map of hydrate evidence and indicators. Lattice of hydrate evidence and indicators overlapped, red dots. Density map developed with the “kernel density” algorithm of ArcGIS®. Parameters: population field, weight (taken from Table 3); cell size, 5000; method, geodesic.
Applsci 11 02865 g004
Figure 5. Susceptibility assessment of the seafloor to the presence of hydrates on the European continental margins and adjacent areas.
Applsci 11 02865 g005
Figure 6. Knowledge gap assessment of hydrate evidence and indicators. Density map developed with the “point density” algorithm of ArcGIS®. Pixel value, number of items of evidence and indicators of hydrates per 100,000 km2. Parameters: population field, none; cell size, 5000; radius, 178,415 metres; areal units, square kilometres; method, geodesic.
Applsci 11 02865 g006
Figure 7. (a) Knowledge gap analysis of geothermal gradient data. KG, knowledge gap of geothermal gradient data; CKG, critical knowledge gap of geothermal gradient data. (b) Knowledge gap analysis of seafloor temperature data. KG, knowledge gap of seafloor temperature data; CKG, critical knowledge gap of seafloor temperature data. Density maps developed with the “point density” algorithm of ArcGIS®. Pixel value, number of data per 100,000 km2. Parameters: population field, none; cell size, 5000; radius, 178,415 metres; areal units, square kilometres; method, geodesic.
Applsci 11 02865 g007
Figure 8. Knowledge gaps of bathymetry data. (a) EMODnet Bathymetry mosaic in the study area (cell size ca. 200 × 200 m). (b) Detail of knowledge gap on the Algerian margin. (c) Detail of knowledge gap on the Libyan margin. Details downloaded from the EMODnet Bathymetry web portal (https://portal.emodnet-bathymetry.eu/; accessed on 1 January 2021).
Applsci 11 02865 g008
Figure 9. Reliability of the susceptibility assessment of hydrate presence on the European continental margins. (a) Reliability prediction in the inference of the susceptibility of the seafloor to the presence of hydrates. KG, global knowledge gap; CKG, global critical knowledge gap. (b) Reliability and susceptibility assessments overposted.
Applsci 11 02865 g009
Table 1. Description of the attributes (items) of the GARAHydrates GIS database. NN, not null; LV, list of values.
Set of ItemsField NameDescription
Principal keyID_IndiNaUnique identification code for each record
Location itemsLat_DDLatitude in decimal degrees (WGS84)
Long_DDLongitude in decimal degrees (WGS84)
WaterDepthSeafloor depth (metres water depth)
GeoSettinGeographical/geological Setting—list of values
LocalSiteLocal site where the evidence is located
Property metadataData_SourcInstitution/company if owner of data. Project, database or publication where data were collected
CruiseOceanographic cruise where data were recovered or observed
CNameContact name
EmailContact Email
Geo-descriptorsE_IE = direct evidence; I = indirect indicator—constraints: NN
FF_TypeType of evidence or indicator—constraints: NN; LV: FF_Type
DescriptiDescription of the evidence—free text
Sedi_TypeSediment type—LV
D_Indi_mtpDepth of the top of the evidence below seabed in metres
D_Indi_mbtDepth of the bottom of the evidence below seabed in metres
SizeSize (volume, km2, tons, etc.)
References
and
comments
DOIDOI of main data publication
ReferenceReferences to data. Author, Year and Title. Link to PDF in data repository
CommentsComments—free text
Table 2. Geological and geophysical evidence and indicators of marine gas hydrates stored in GARAHydrates.
Geological SettingsGeological EvidenceGeophysical Indicators
HydratesDegassing StructuresPore Water AnomaliesBSRsHigh Res.Gas ChimneysAcoustic BlankingGas FlaresSeabed Structures
SamplesKm2/Levels Loc. SitesKm2/Levels Loc. SitesKm2/Levels Pocks-Seeps Loc. SitesPocks-Seeps km2/LevelsMud Volcanoes
West Greenland 6 9410/2 5 3565/12 mud diapir
East Greenland—
Svalbald—Barents Sea
42163/4 E. Barents S. 1426,316/58 163110/95 651007 1
Mid-Norwegian margin6 4278/9 76
northeast Atlantic 8139 24 139 3658,273/42
Southern Iberian and northwest African margins22 Gulf of Cádiz 10 1 7 4 44233/1 Alborán63
Eastern Mediterranean Sea2 2360/4 24 59
Marmara Sea1 512 2
Black Sea233655/7 1515,058/144 31 102
Table 3. Weights given to each hydrate-related item of evidence or indicator for the development of the density map of evidence/indicators.
Evidence and IndicatorDescriptionWeight
Gas hydrate samplesCrystals or aggregates of gas hydrates observed in gravity cores.1
Degassing structuresBubbles and/or vacuoles (porosity) in sediment liquefactions observed in gravity core samples.1
Pore water anomaliesChemical and isotopic pore water anomalies that are caused by hydrate dissociation (e.g., downward chlorinity decrease combined with δ18O increase).0.9
BSRsOnly bottom-simulating reflectors generated by the impedance contrast between the gas-hydrated sediment above and a free gas layer below. Opal BSRs are excluded.0.9
High resistivityAnomalous high electrical resistivity in logs due to the presence of massive hydrates.0.9
Velocity anomaliesAnomalous seismic propagation velocity in the sediment due to the presence of both gas hydrates and free gas.0.8
Acoustic blanking faciesZones devoid of reflections in seismic profiles because of the presence of free gas in the sediment.0.8
Dim spotsLocal low-amplitude seismic attribute anomalies that may indicate the presence of hydrocarbons.0.8
Bright spotsSeismic amplitude or high-amplitude anomalies that may indicate the presence of hydrocarbons.0.8
Gas chimneysAreas of poor data quality or push-downs caused by subsurface leakage of gas from a poorly sealed hydrocarbon accumulation.0.8
Seabed featuresGeomorphological features related to seabed fluid flow.0.8
Gas seepage: pockmarks, mud volcanoes, gryphonsSteady or episodic, slow or rapid, visible or invisible flow of gaseous hydrocarbons from subsurface sources to the Earth’s surface. Pockmarks are craters in the seabed caused by fluids erupting and streaming through the sediments. Mud volcanoes are positive cone-shaped reliefs created by the extrusion of mud, water and gases, mainly hydrocarbon fluids.0.8
Mud diapirsPositive, cone-shaped reliefs created by intrusion inside the sediment column of mud, water and gases, mainly hydrocarbon fluids.0.8
HDACHydrocarbon-derived authigenic carbonate formed as a consequence of the anaerobic oxidation of methane by consortia of microbes.0.8
Gas flaresAcoustic artefacts in the water column caused by gas bubbles.0.8
Publisher’s Note: MDPI stays neutral with regard to jurisdictional claims in published maps and institutional affiliations.

