
Comparison of Endurance Time Prediction of Biceps Brachii Using Logarithmic Parameters of a Surface Electromyogram during Low-Moderate Level Isotonic Contractions

 ,
,
Abstract
:1. Introduction
2. Materials and Methods
2.1. Subjects
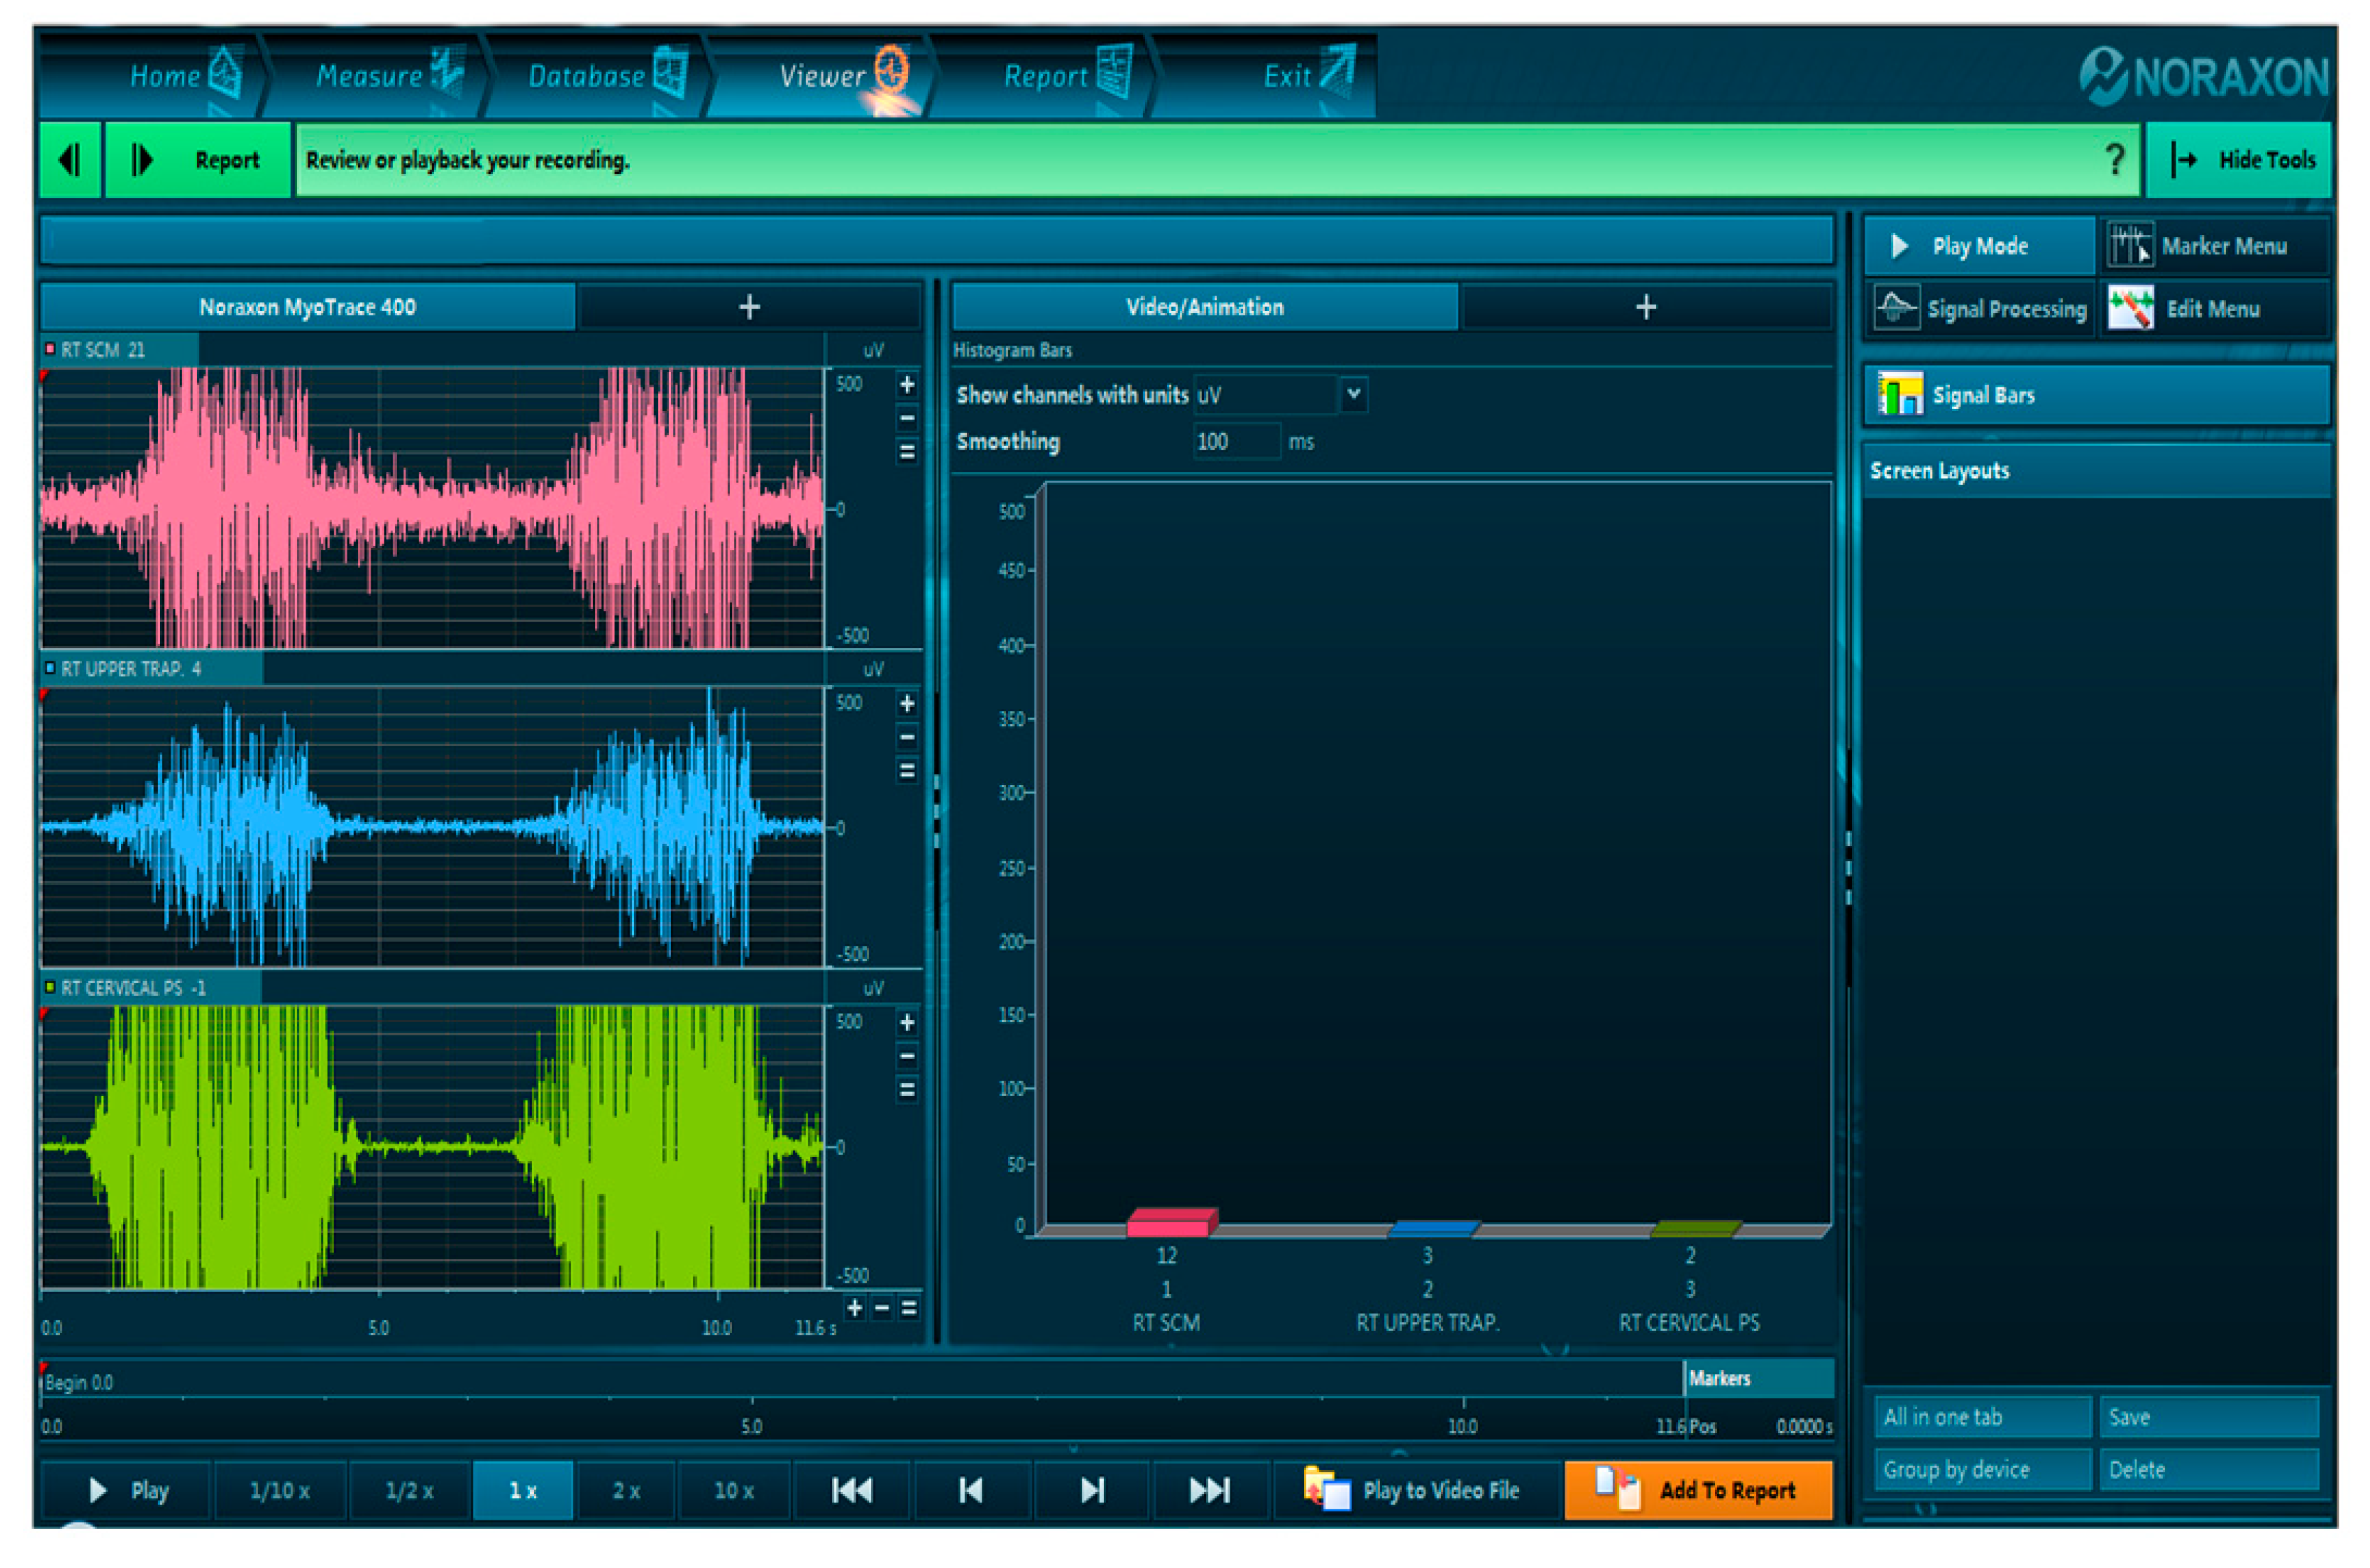
2.2. Apparatus
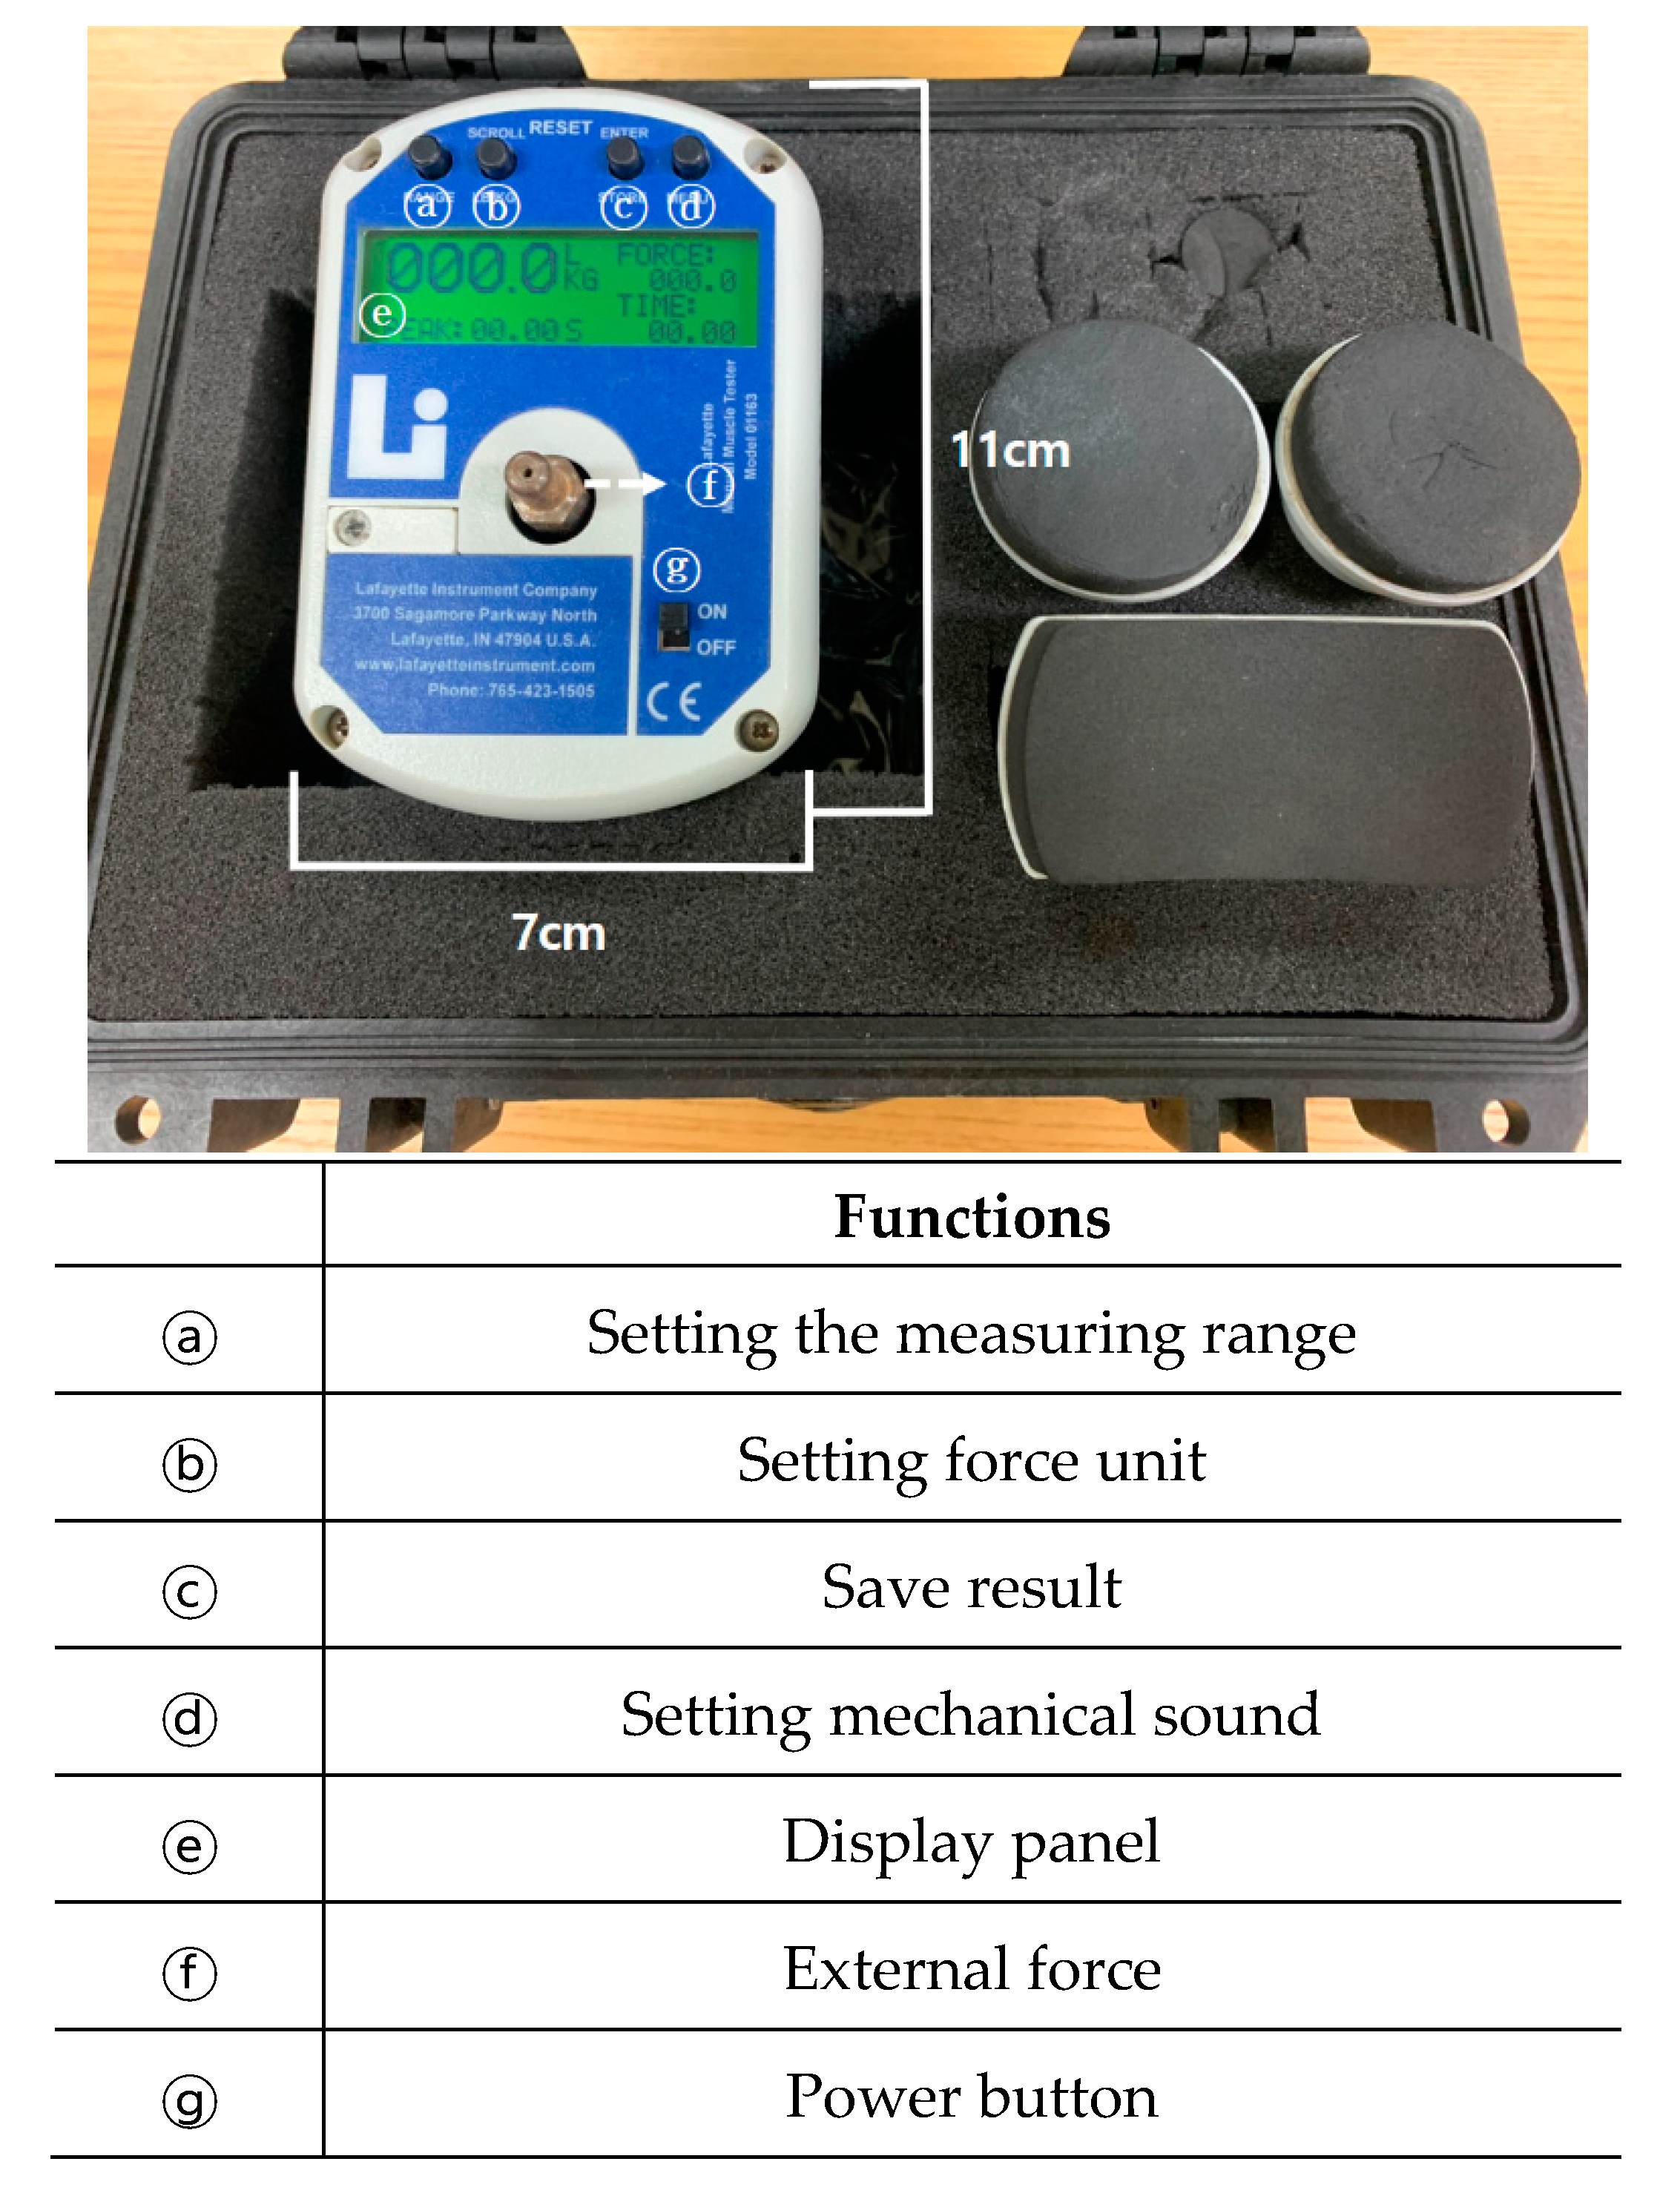
2.2.1. MMT
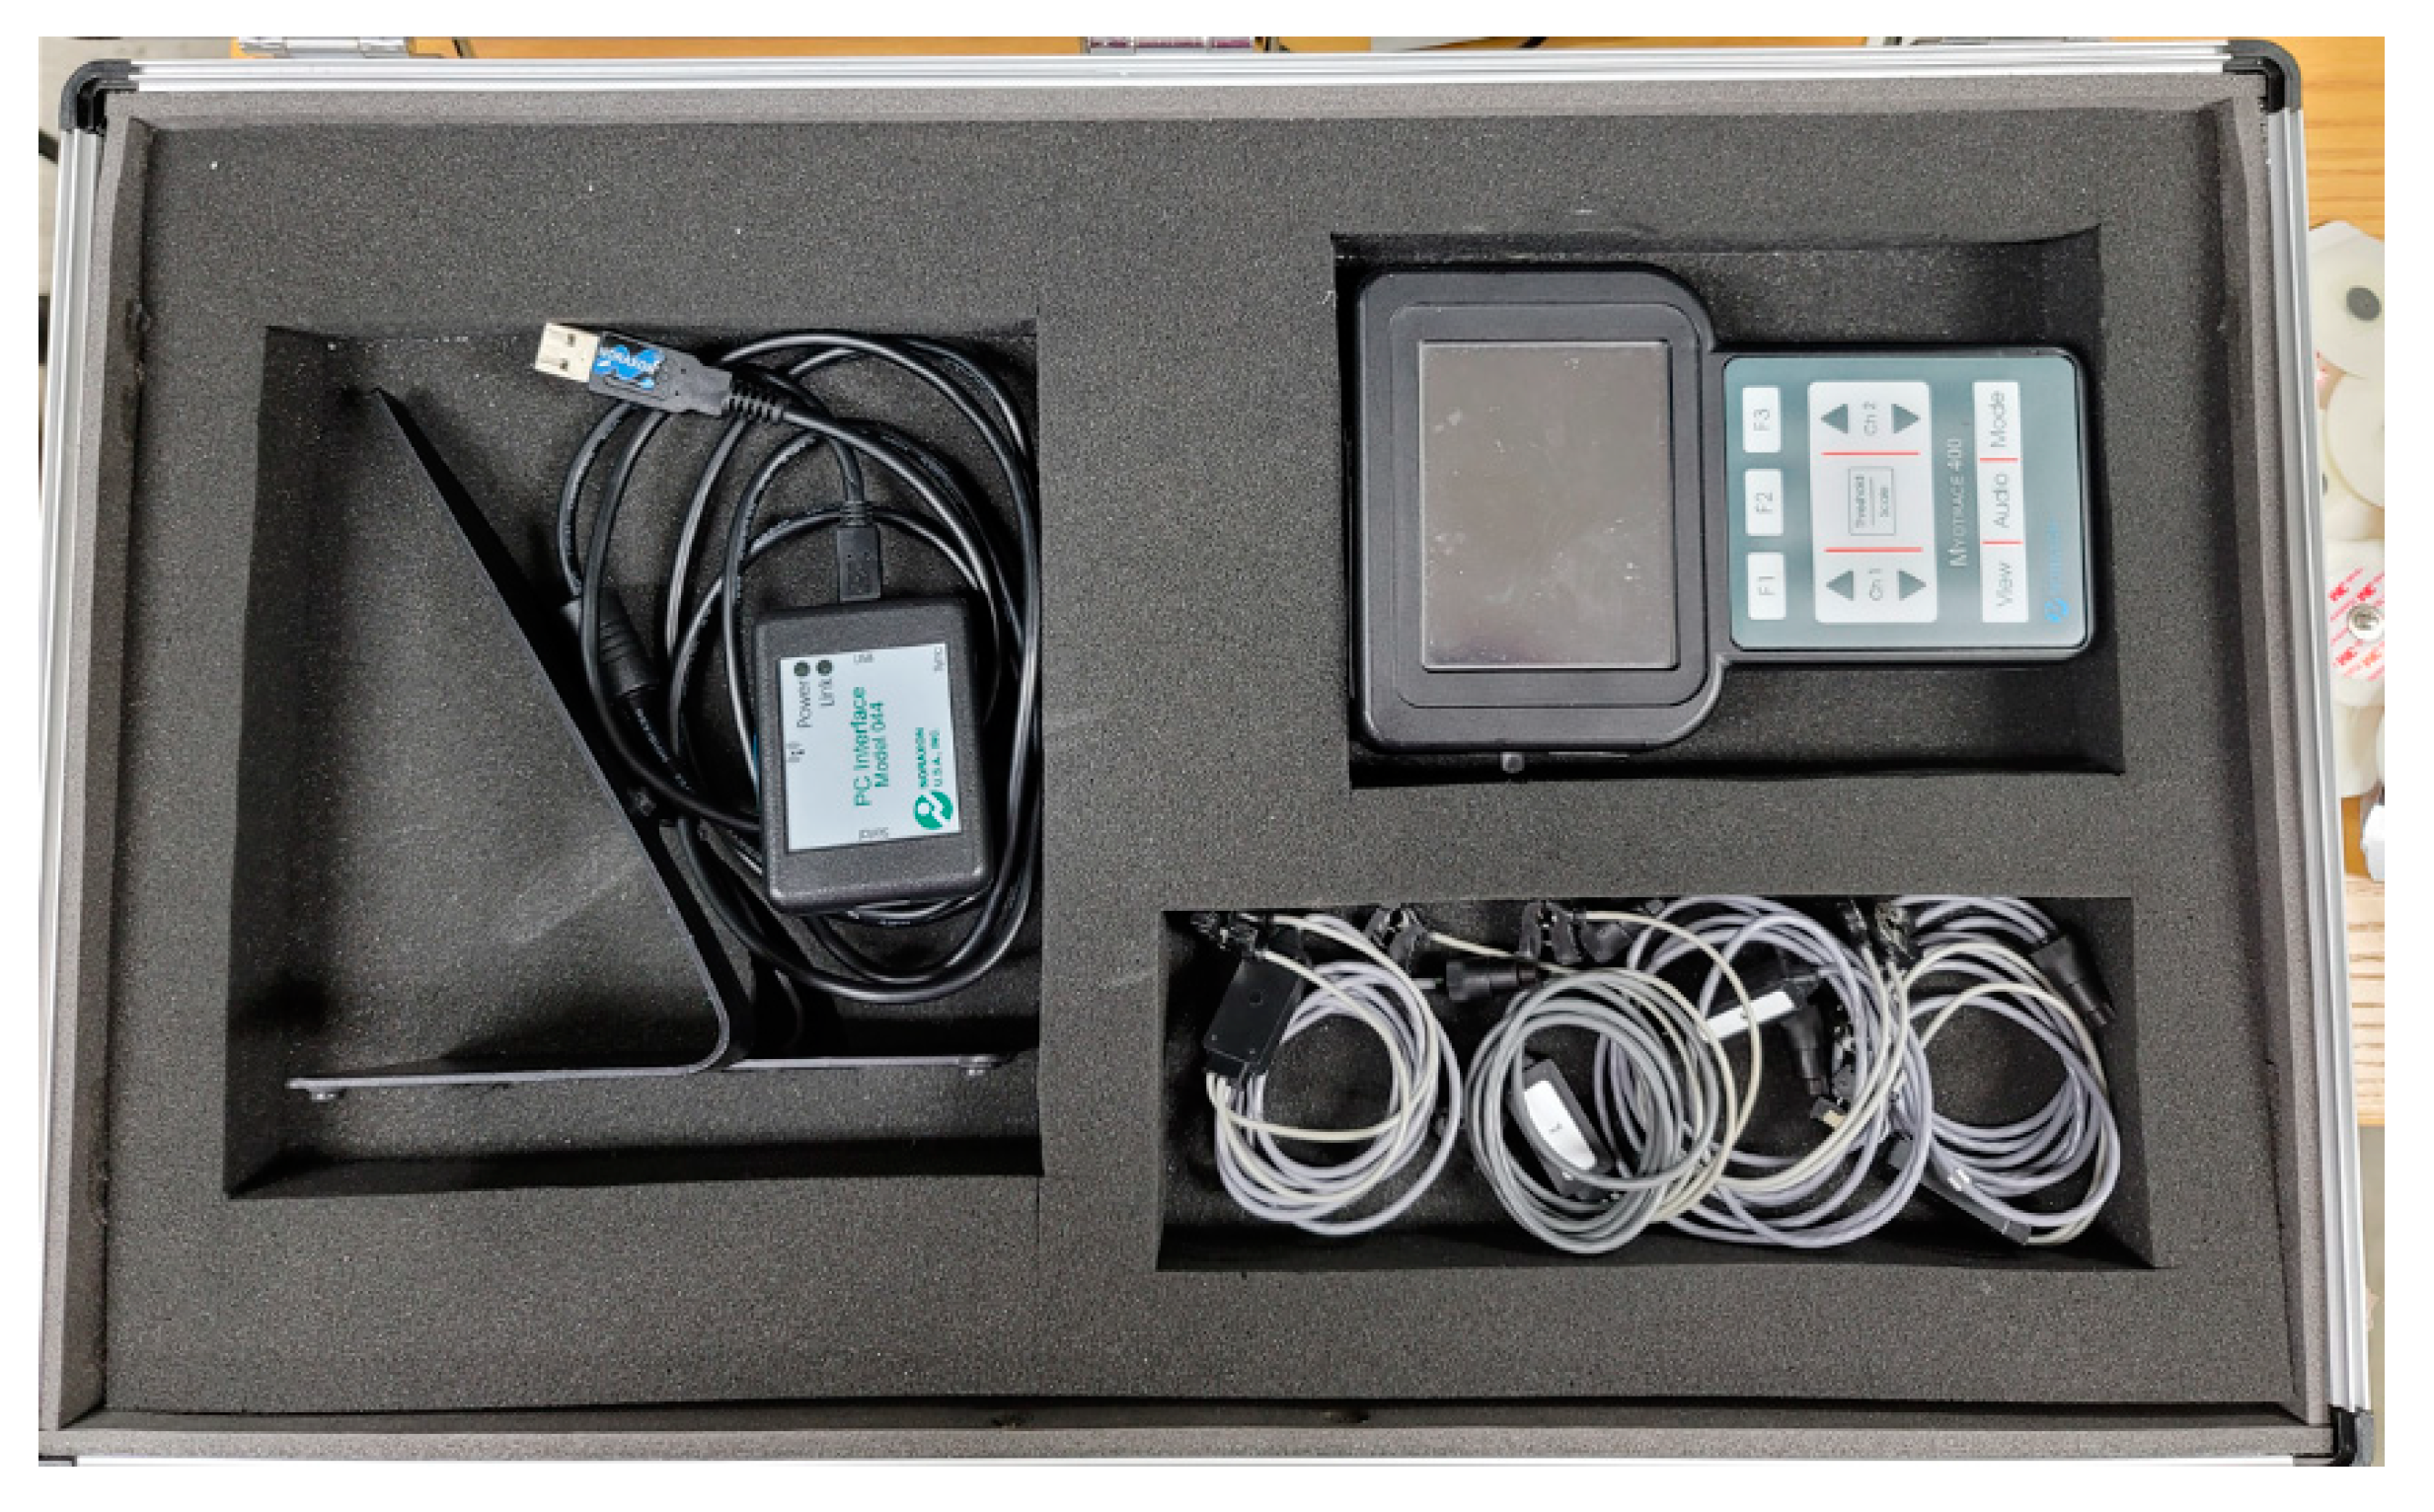
2.2.2. Electromyography (EMG)
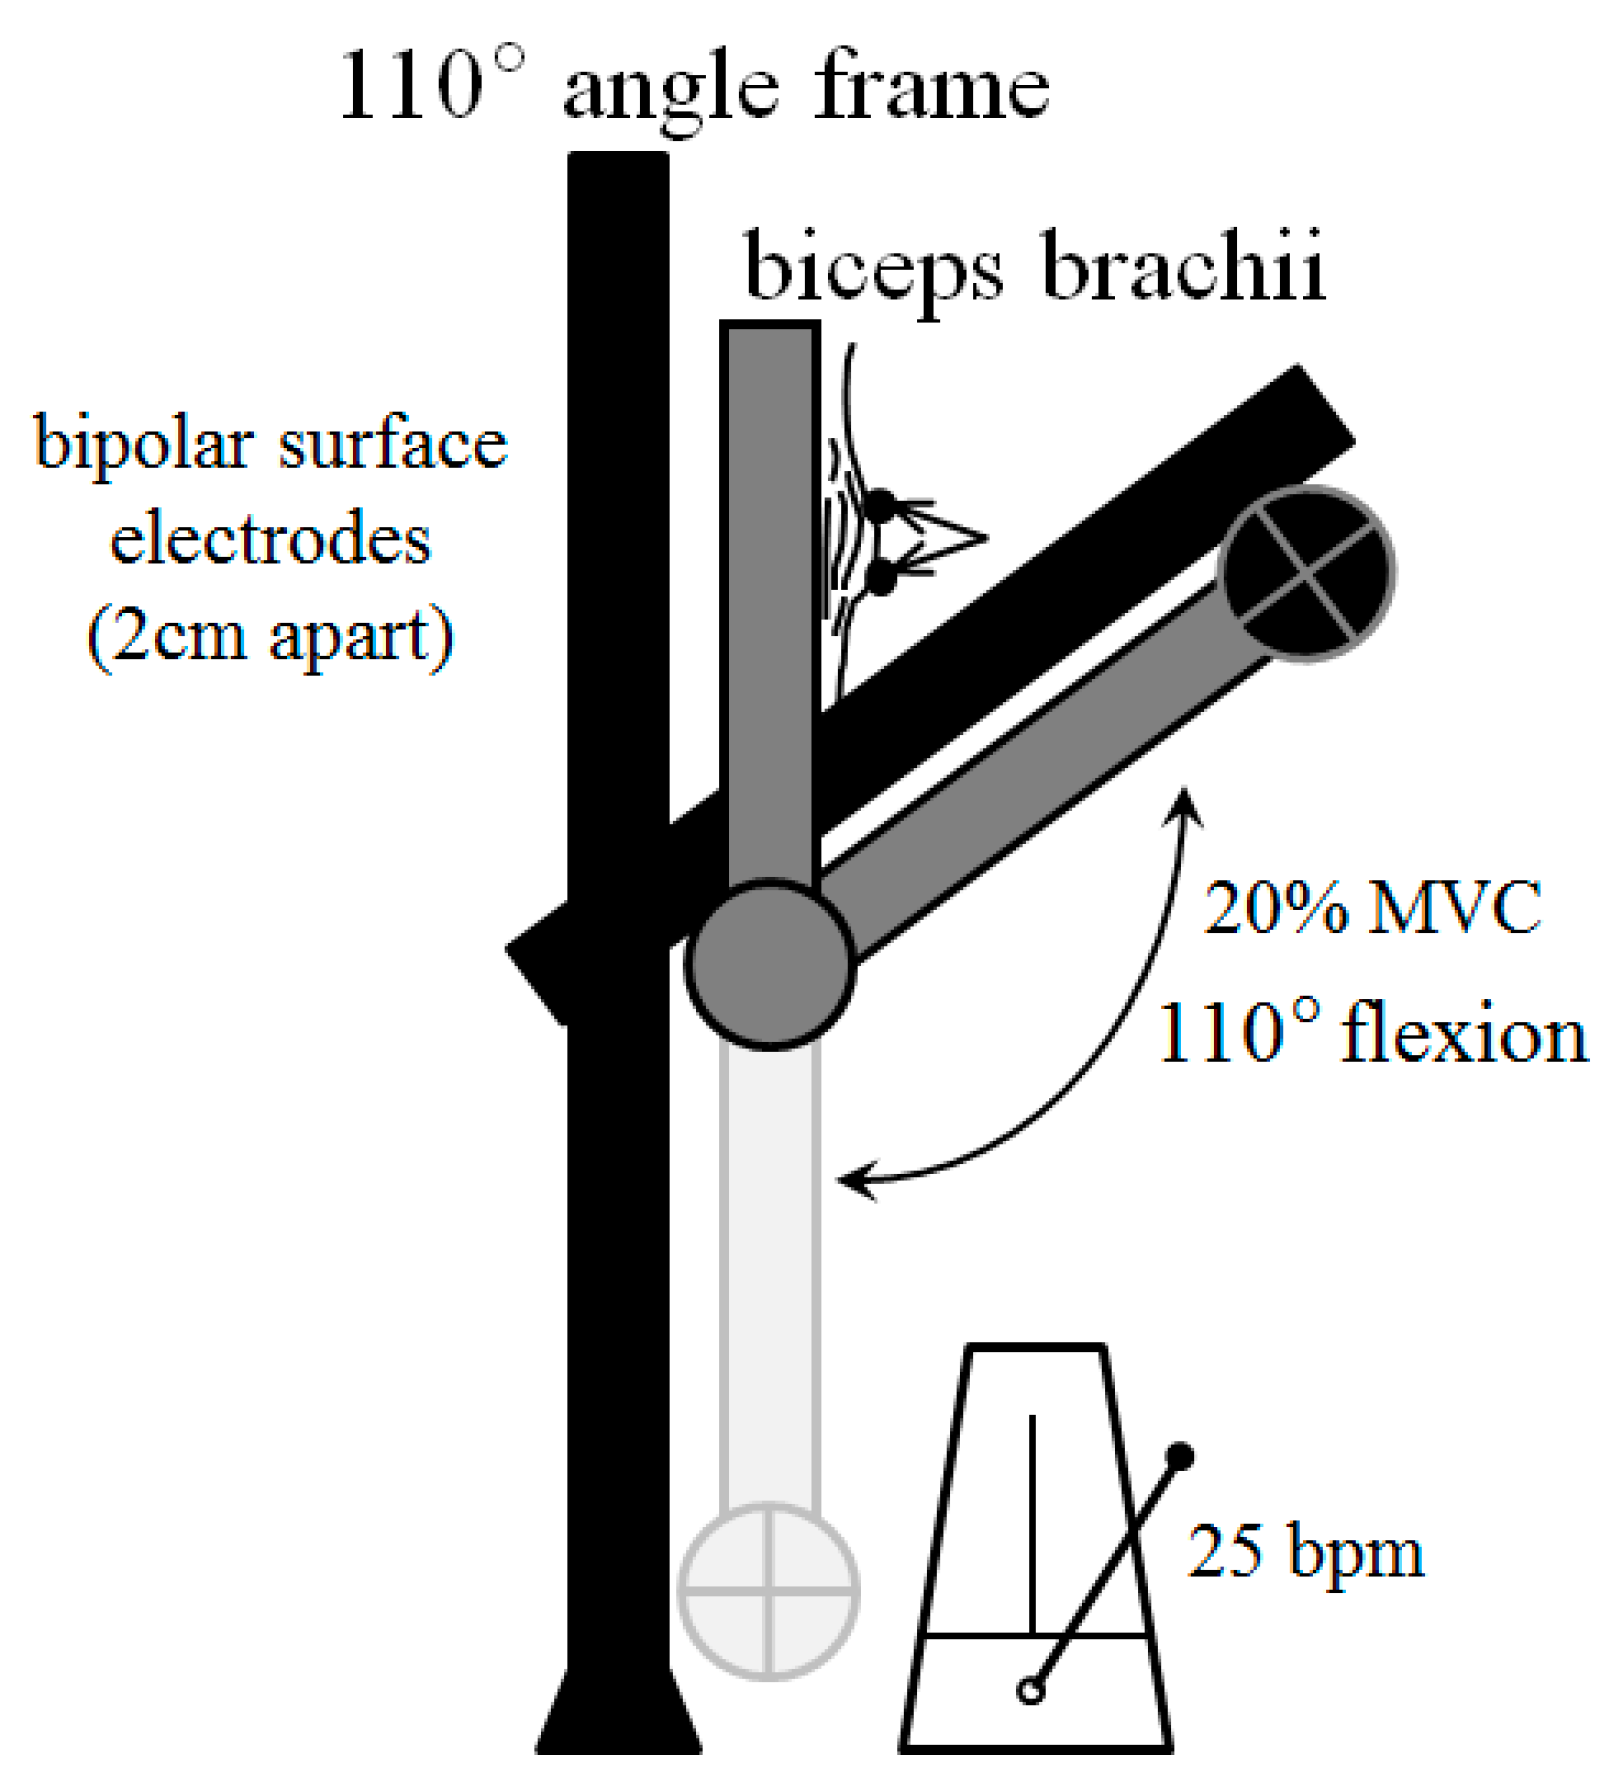
2.3. Experimental Protocol
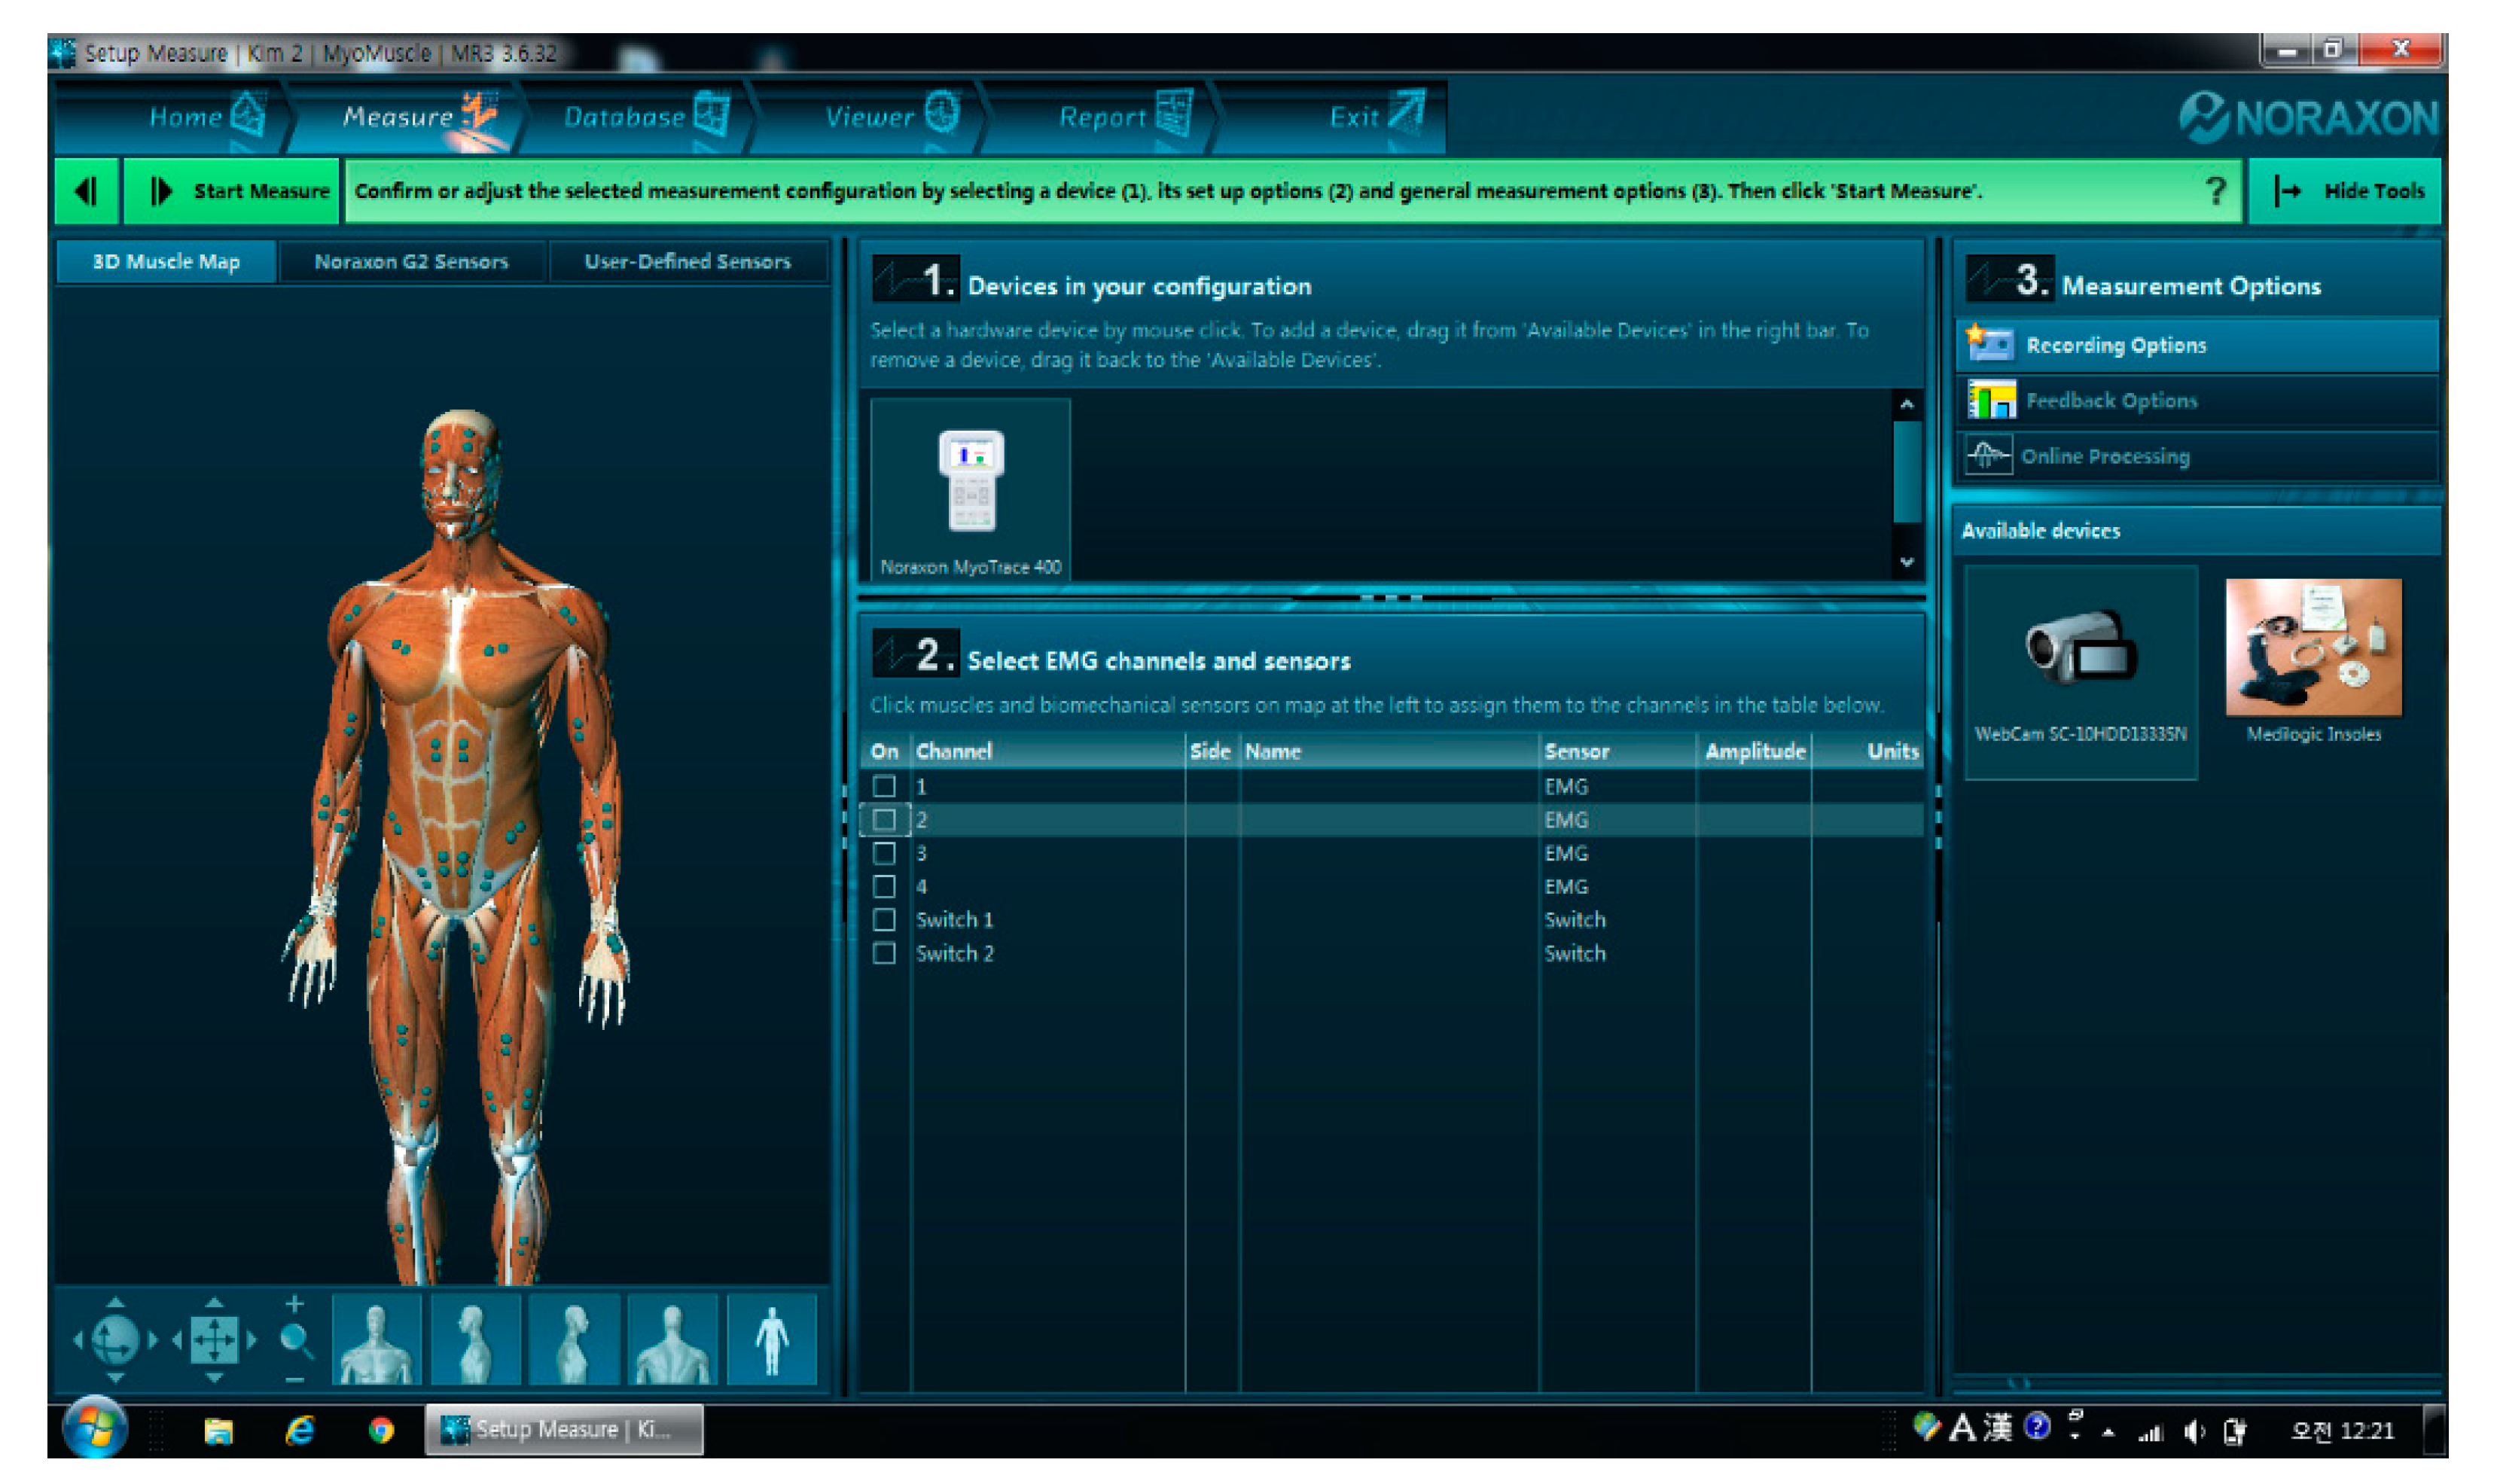
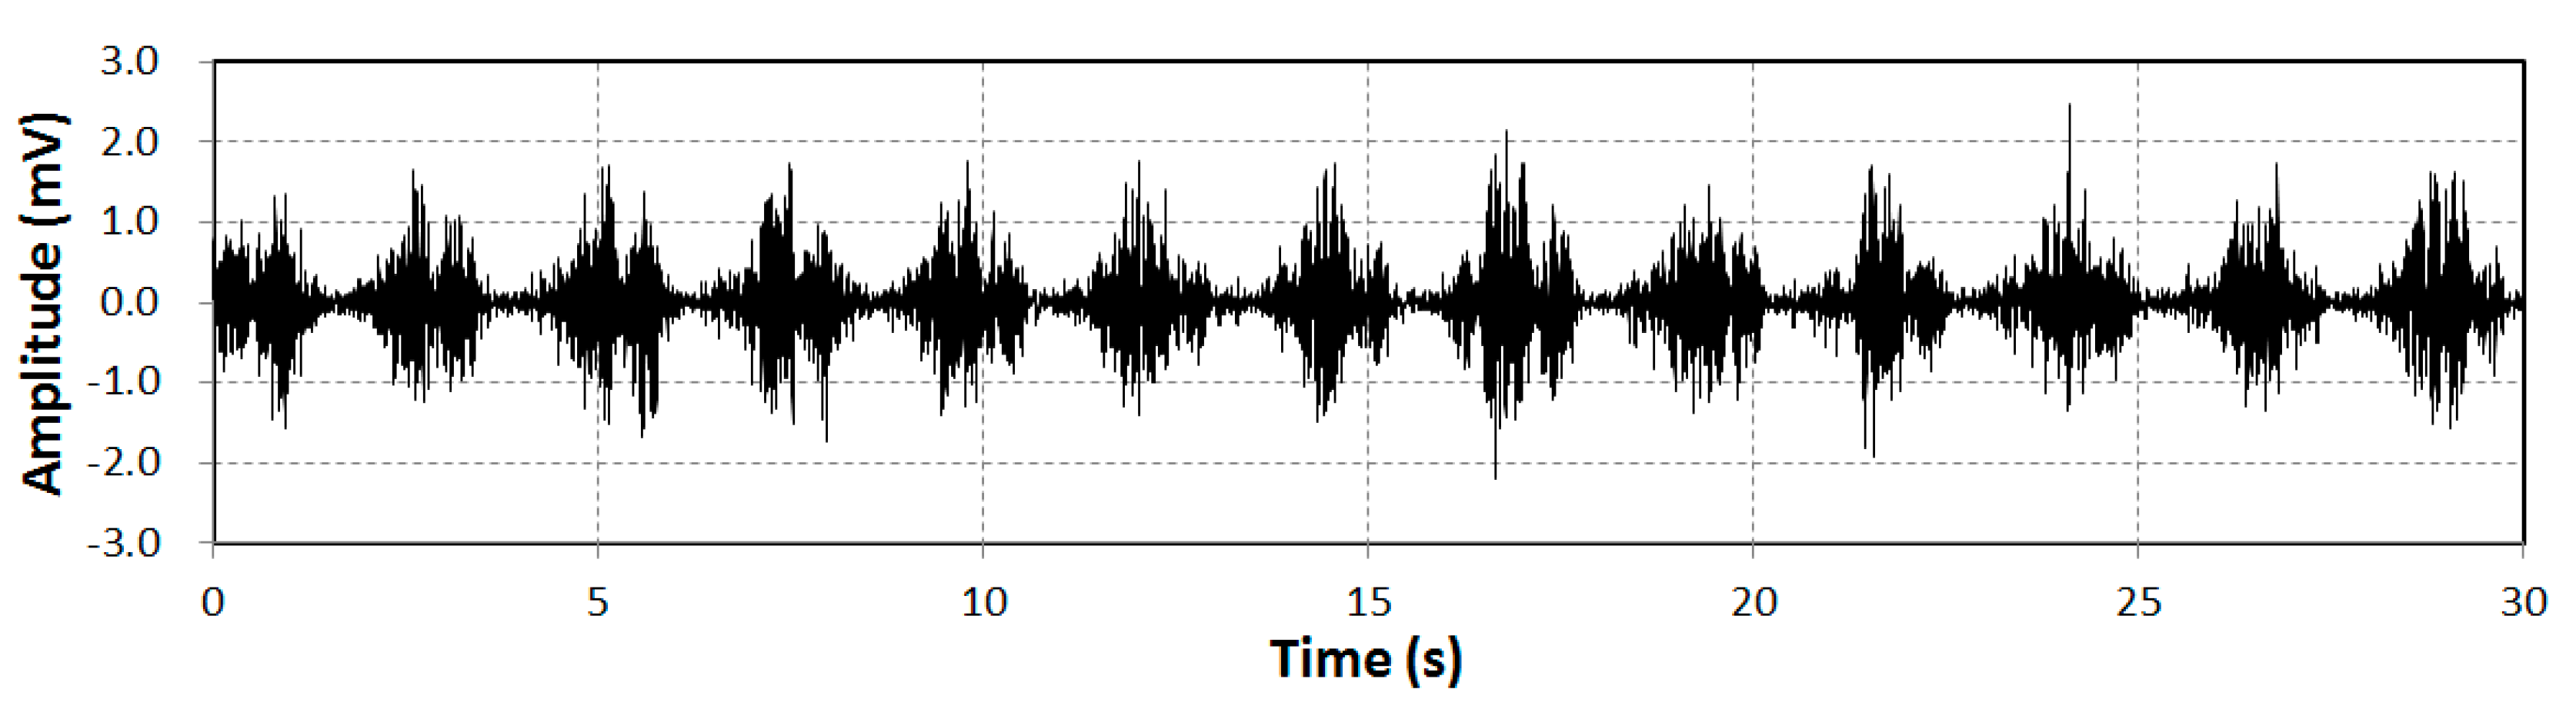
2.4. Surface EMG Signal Acquisition
2.5. Mathematical Models
2.6. Data Analysis
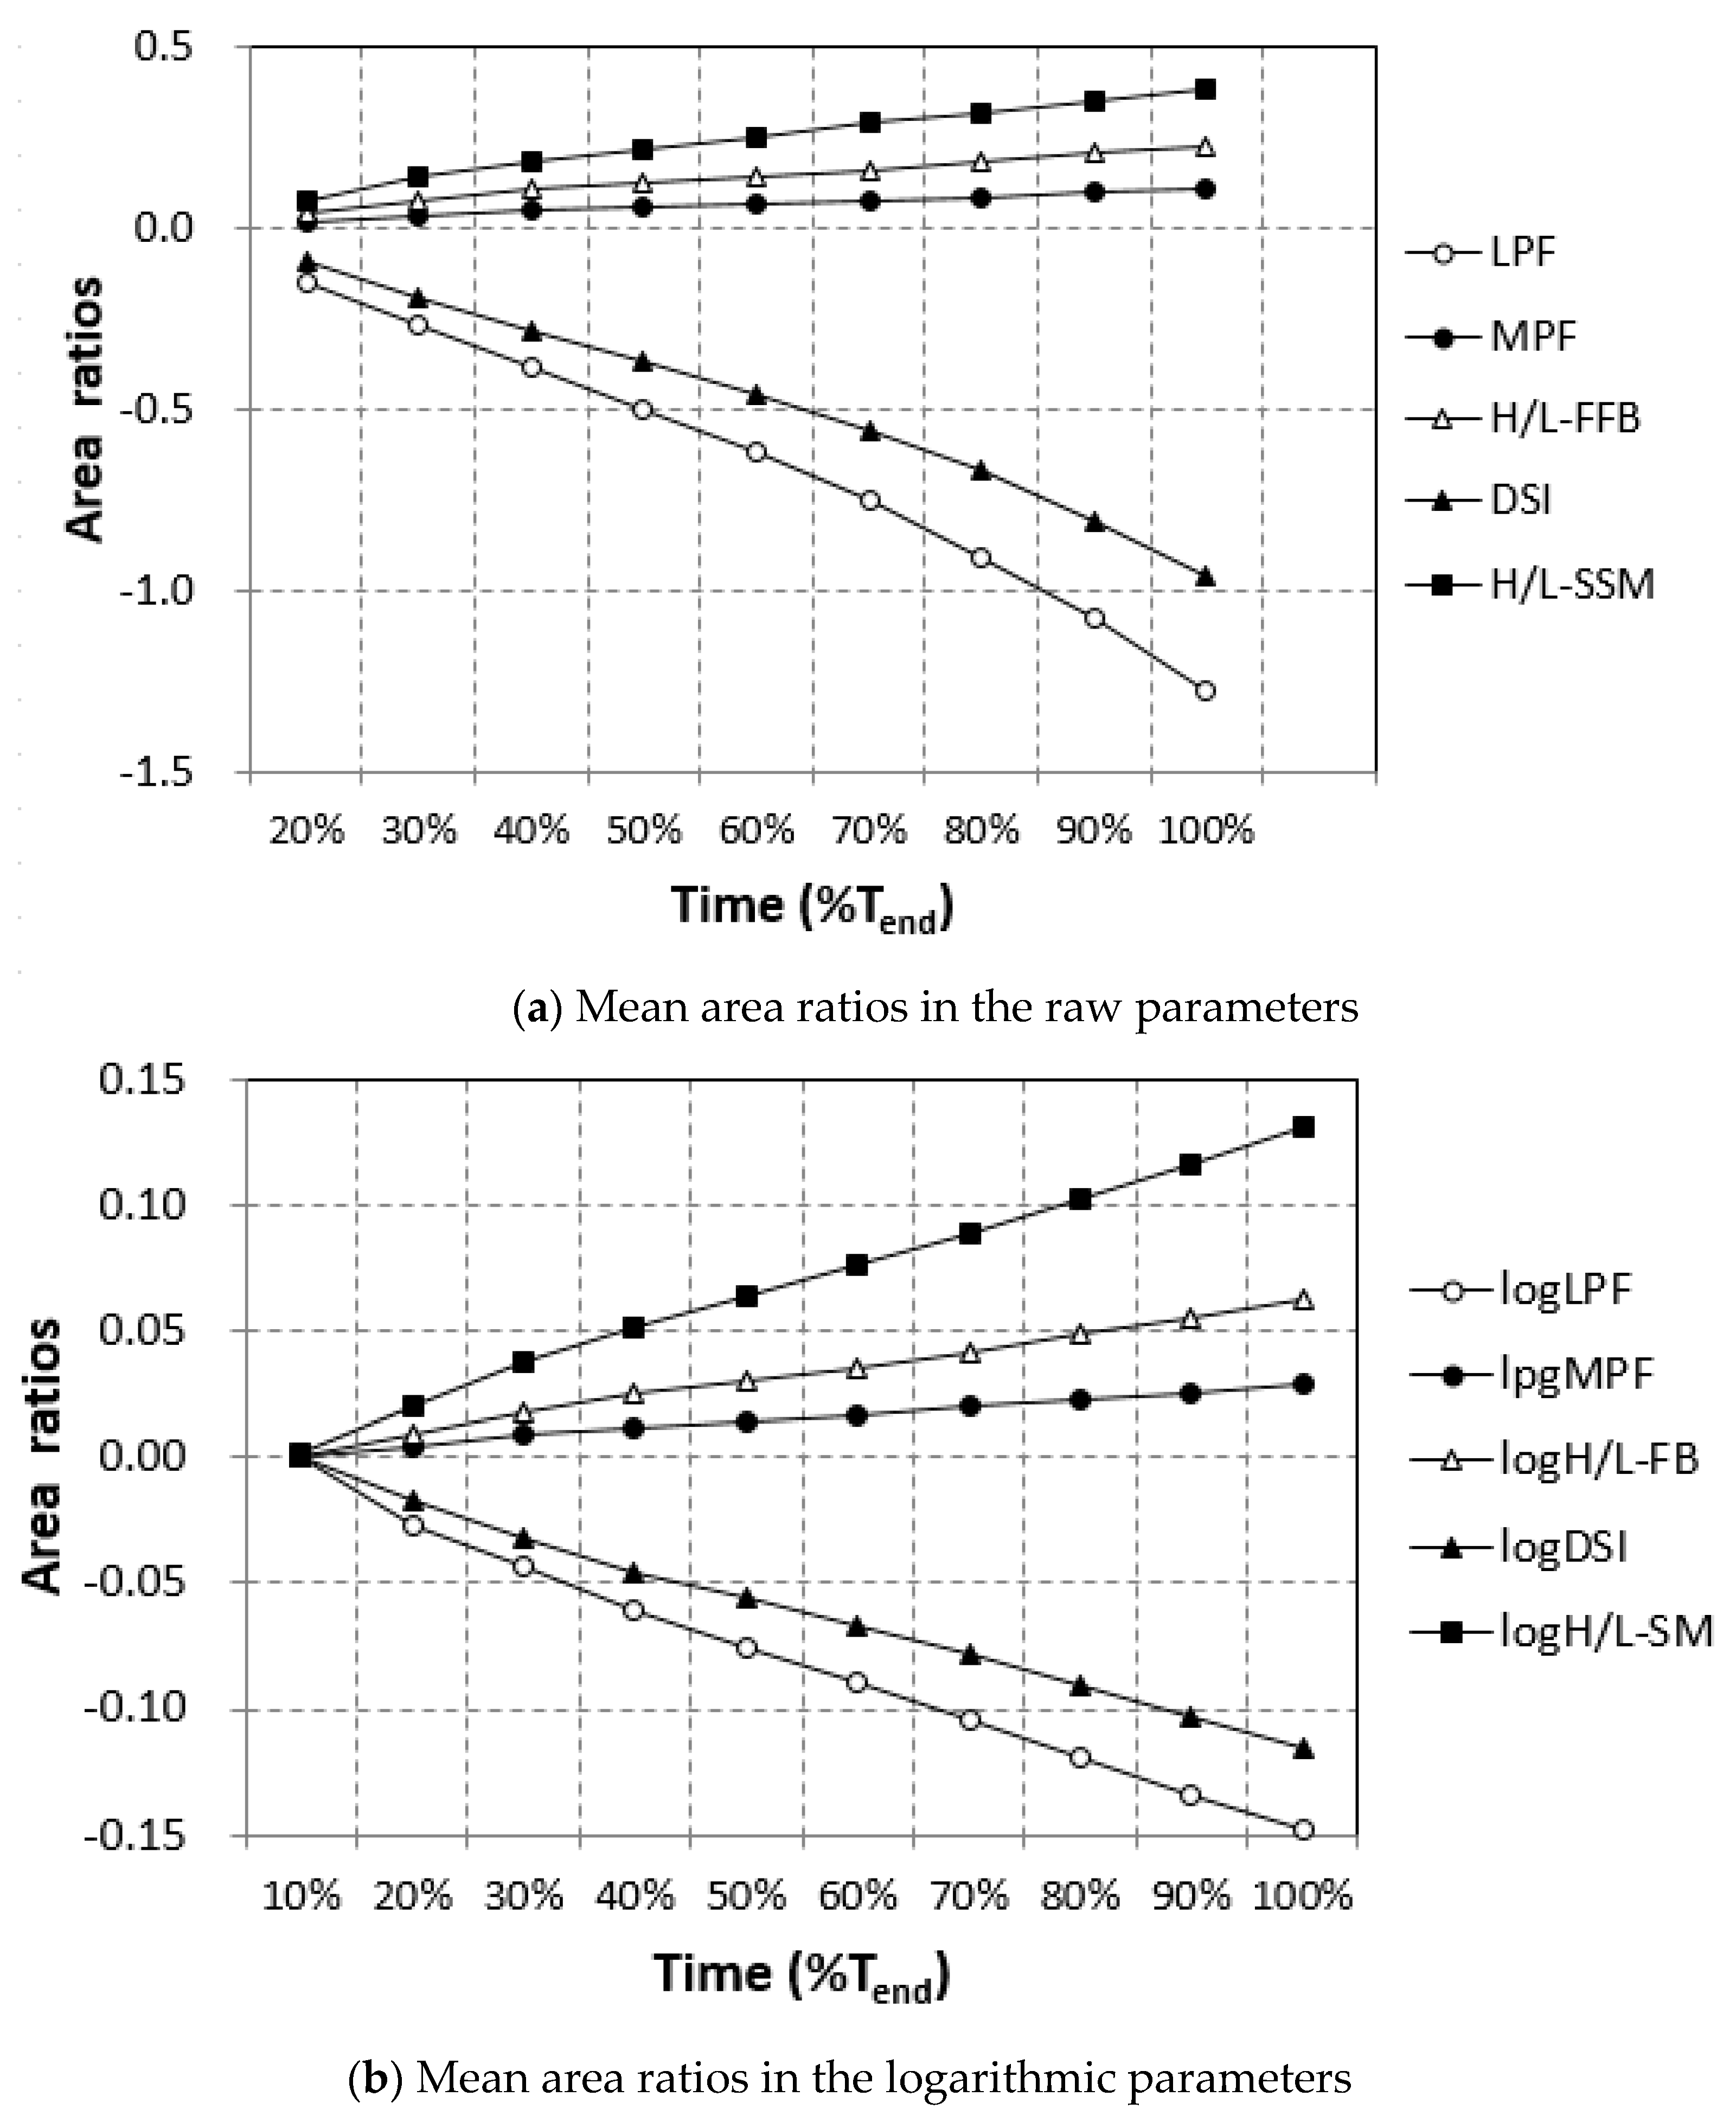
- The area ratios in the five raw parameters
- The area ratios in the five logarithmic parameters
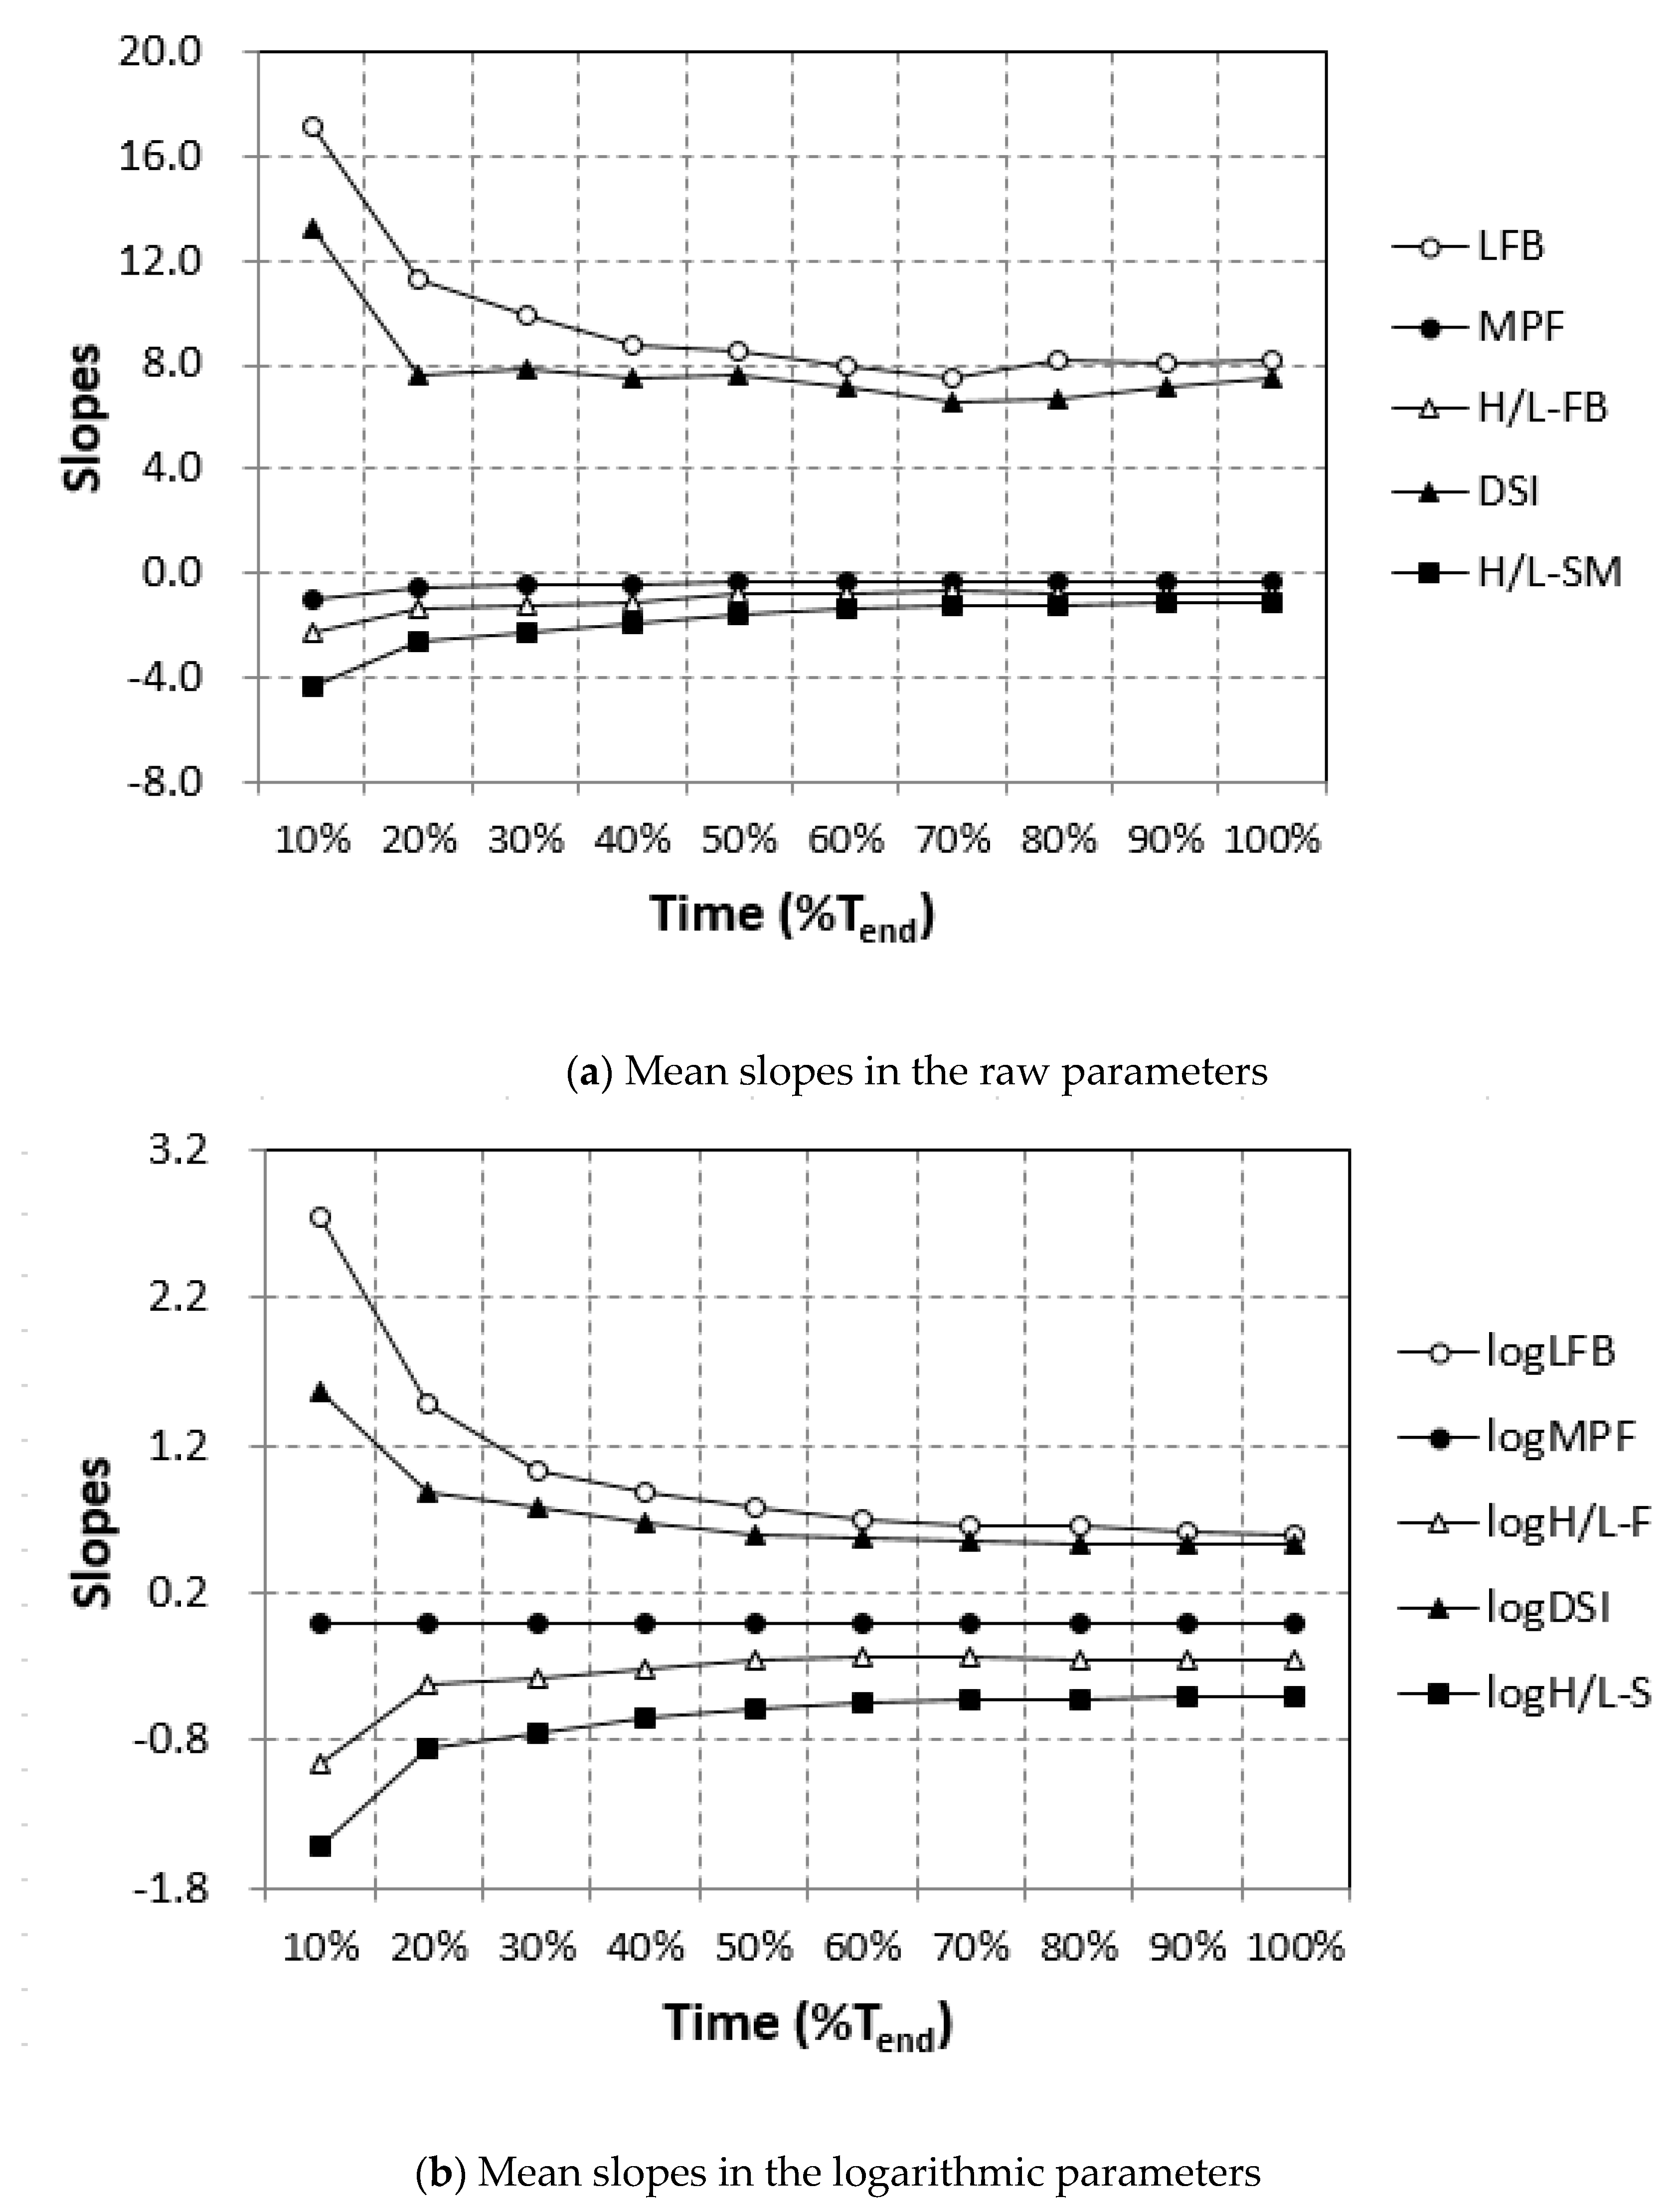
- The slopes in the five raw parameters
- The slopes in the five logarithmic parameters
3. Results
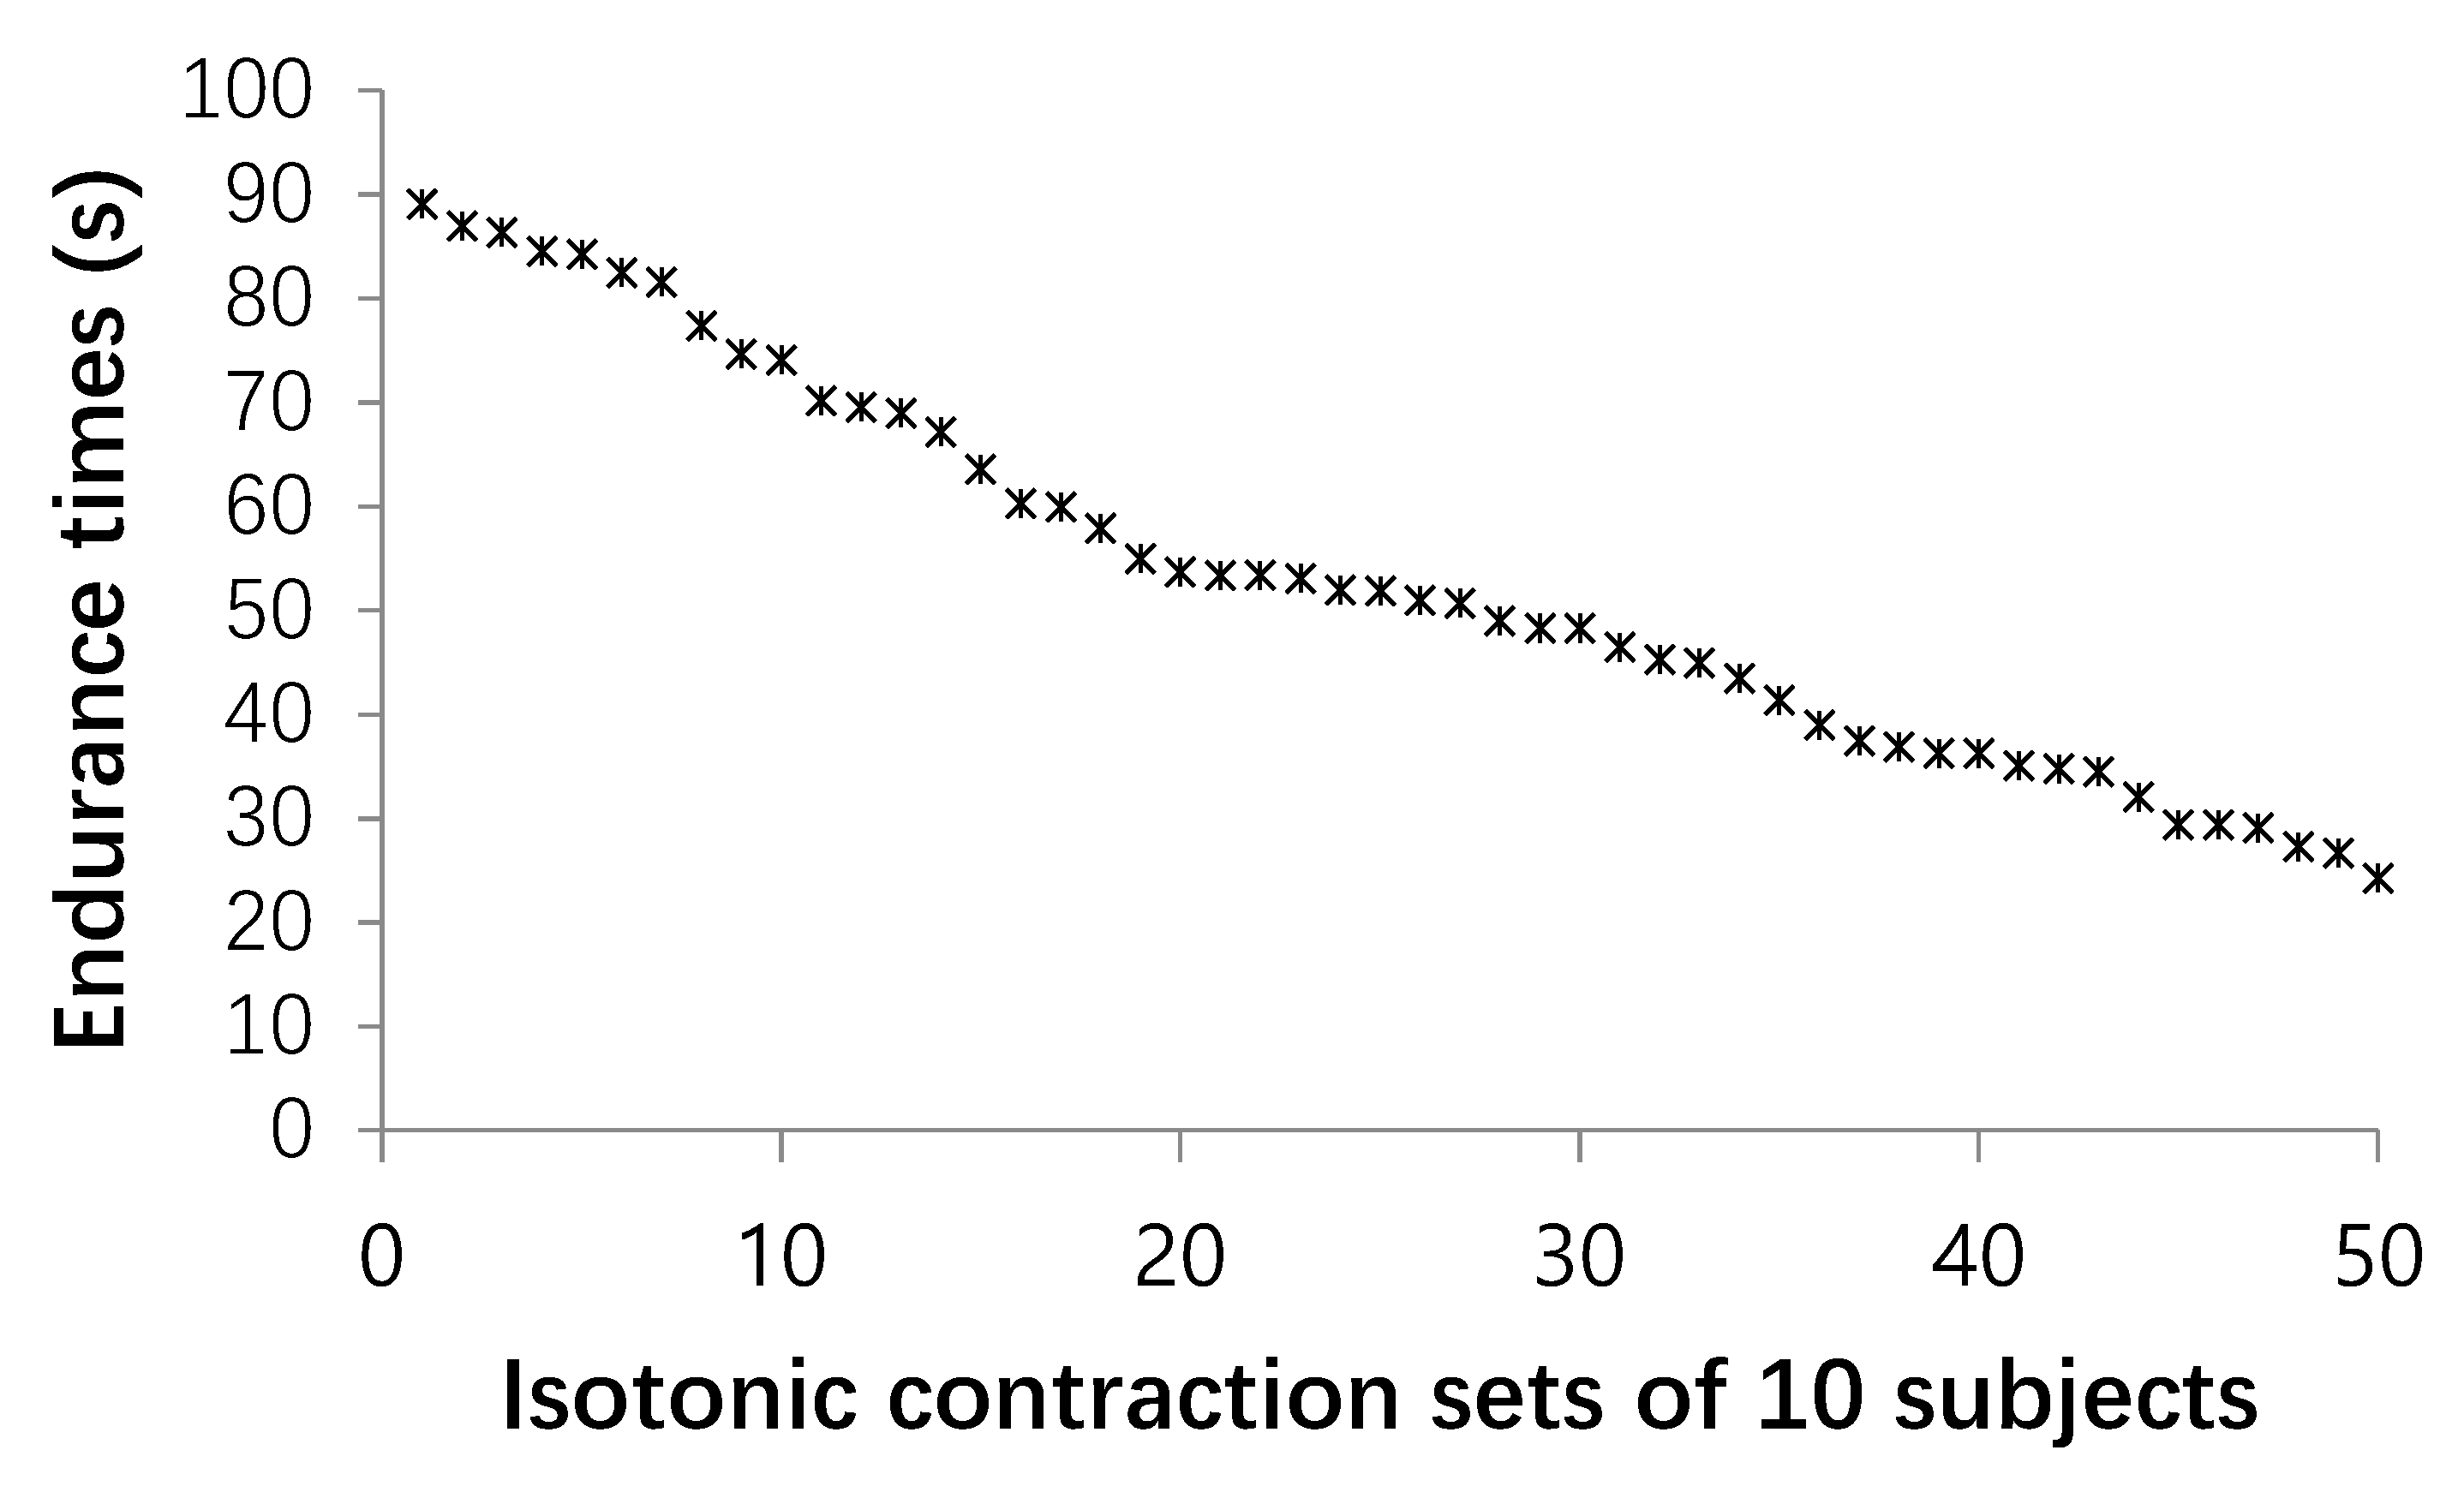
3.1. MVC and Tend
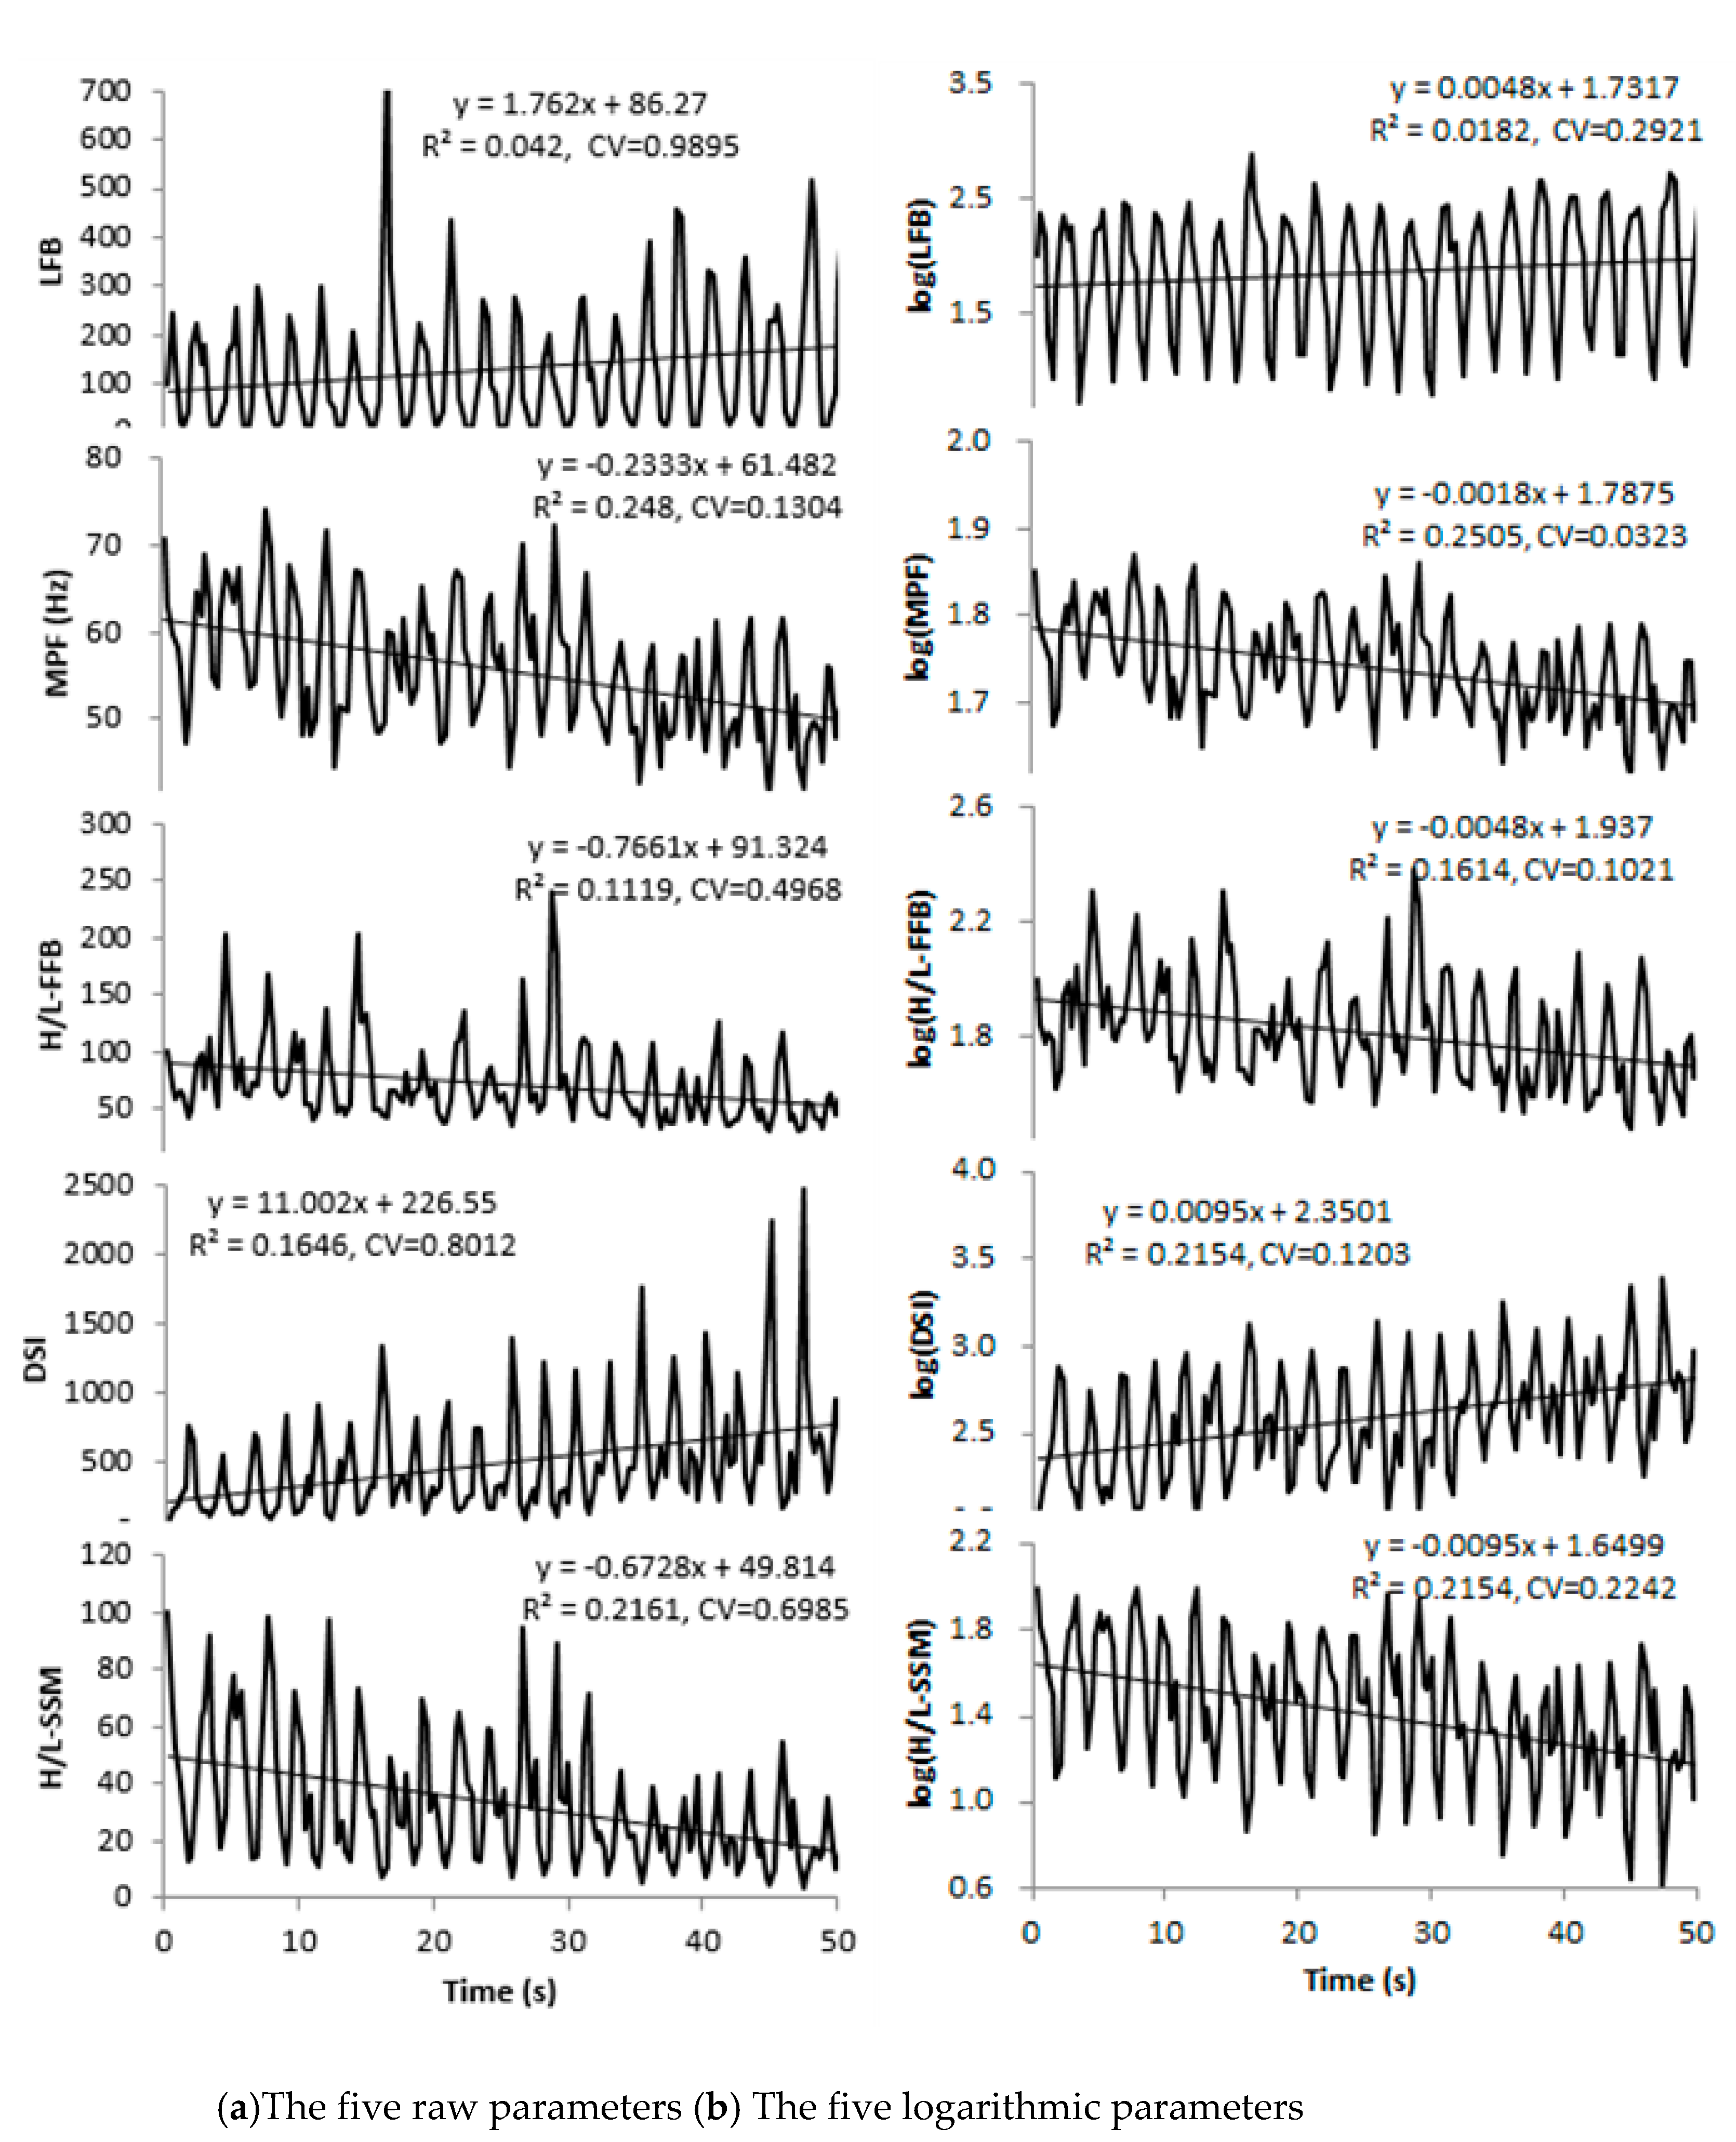
3.2. Changes in sEMG Parameters and Predictors
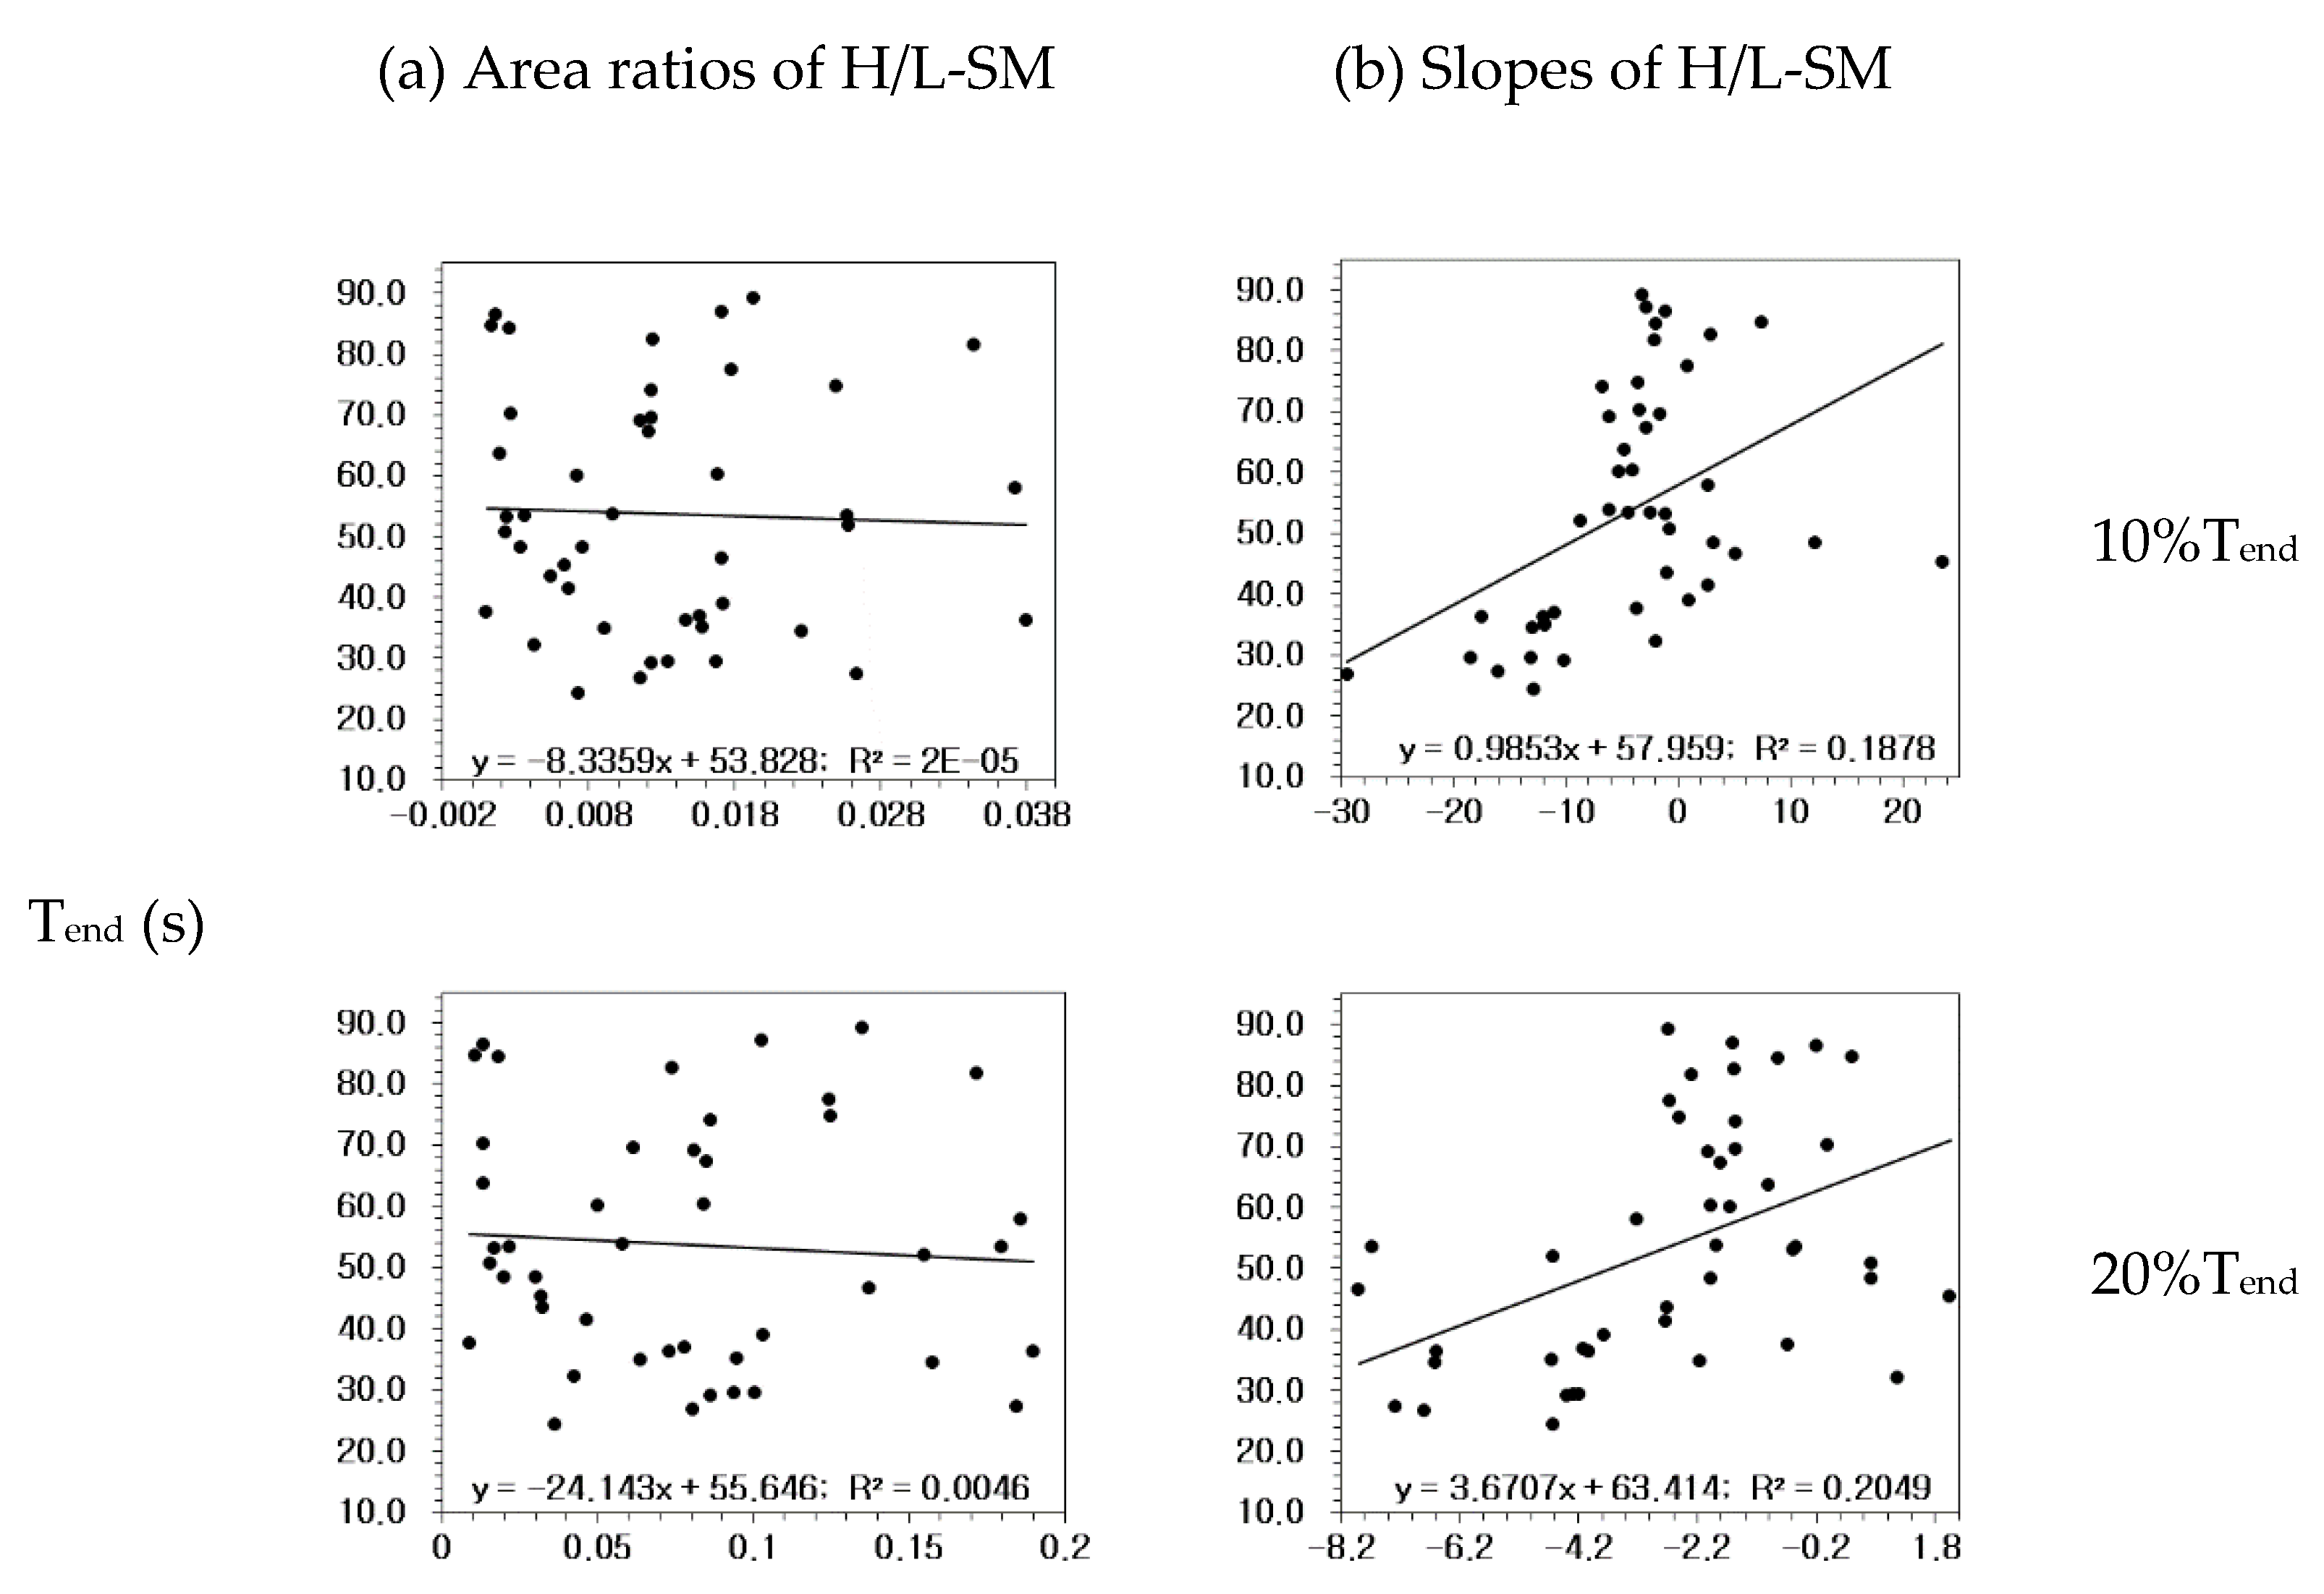
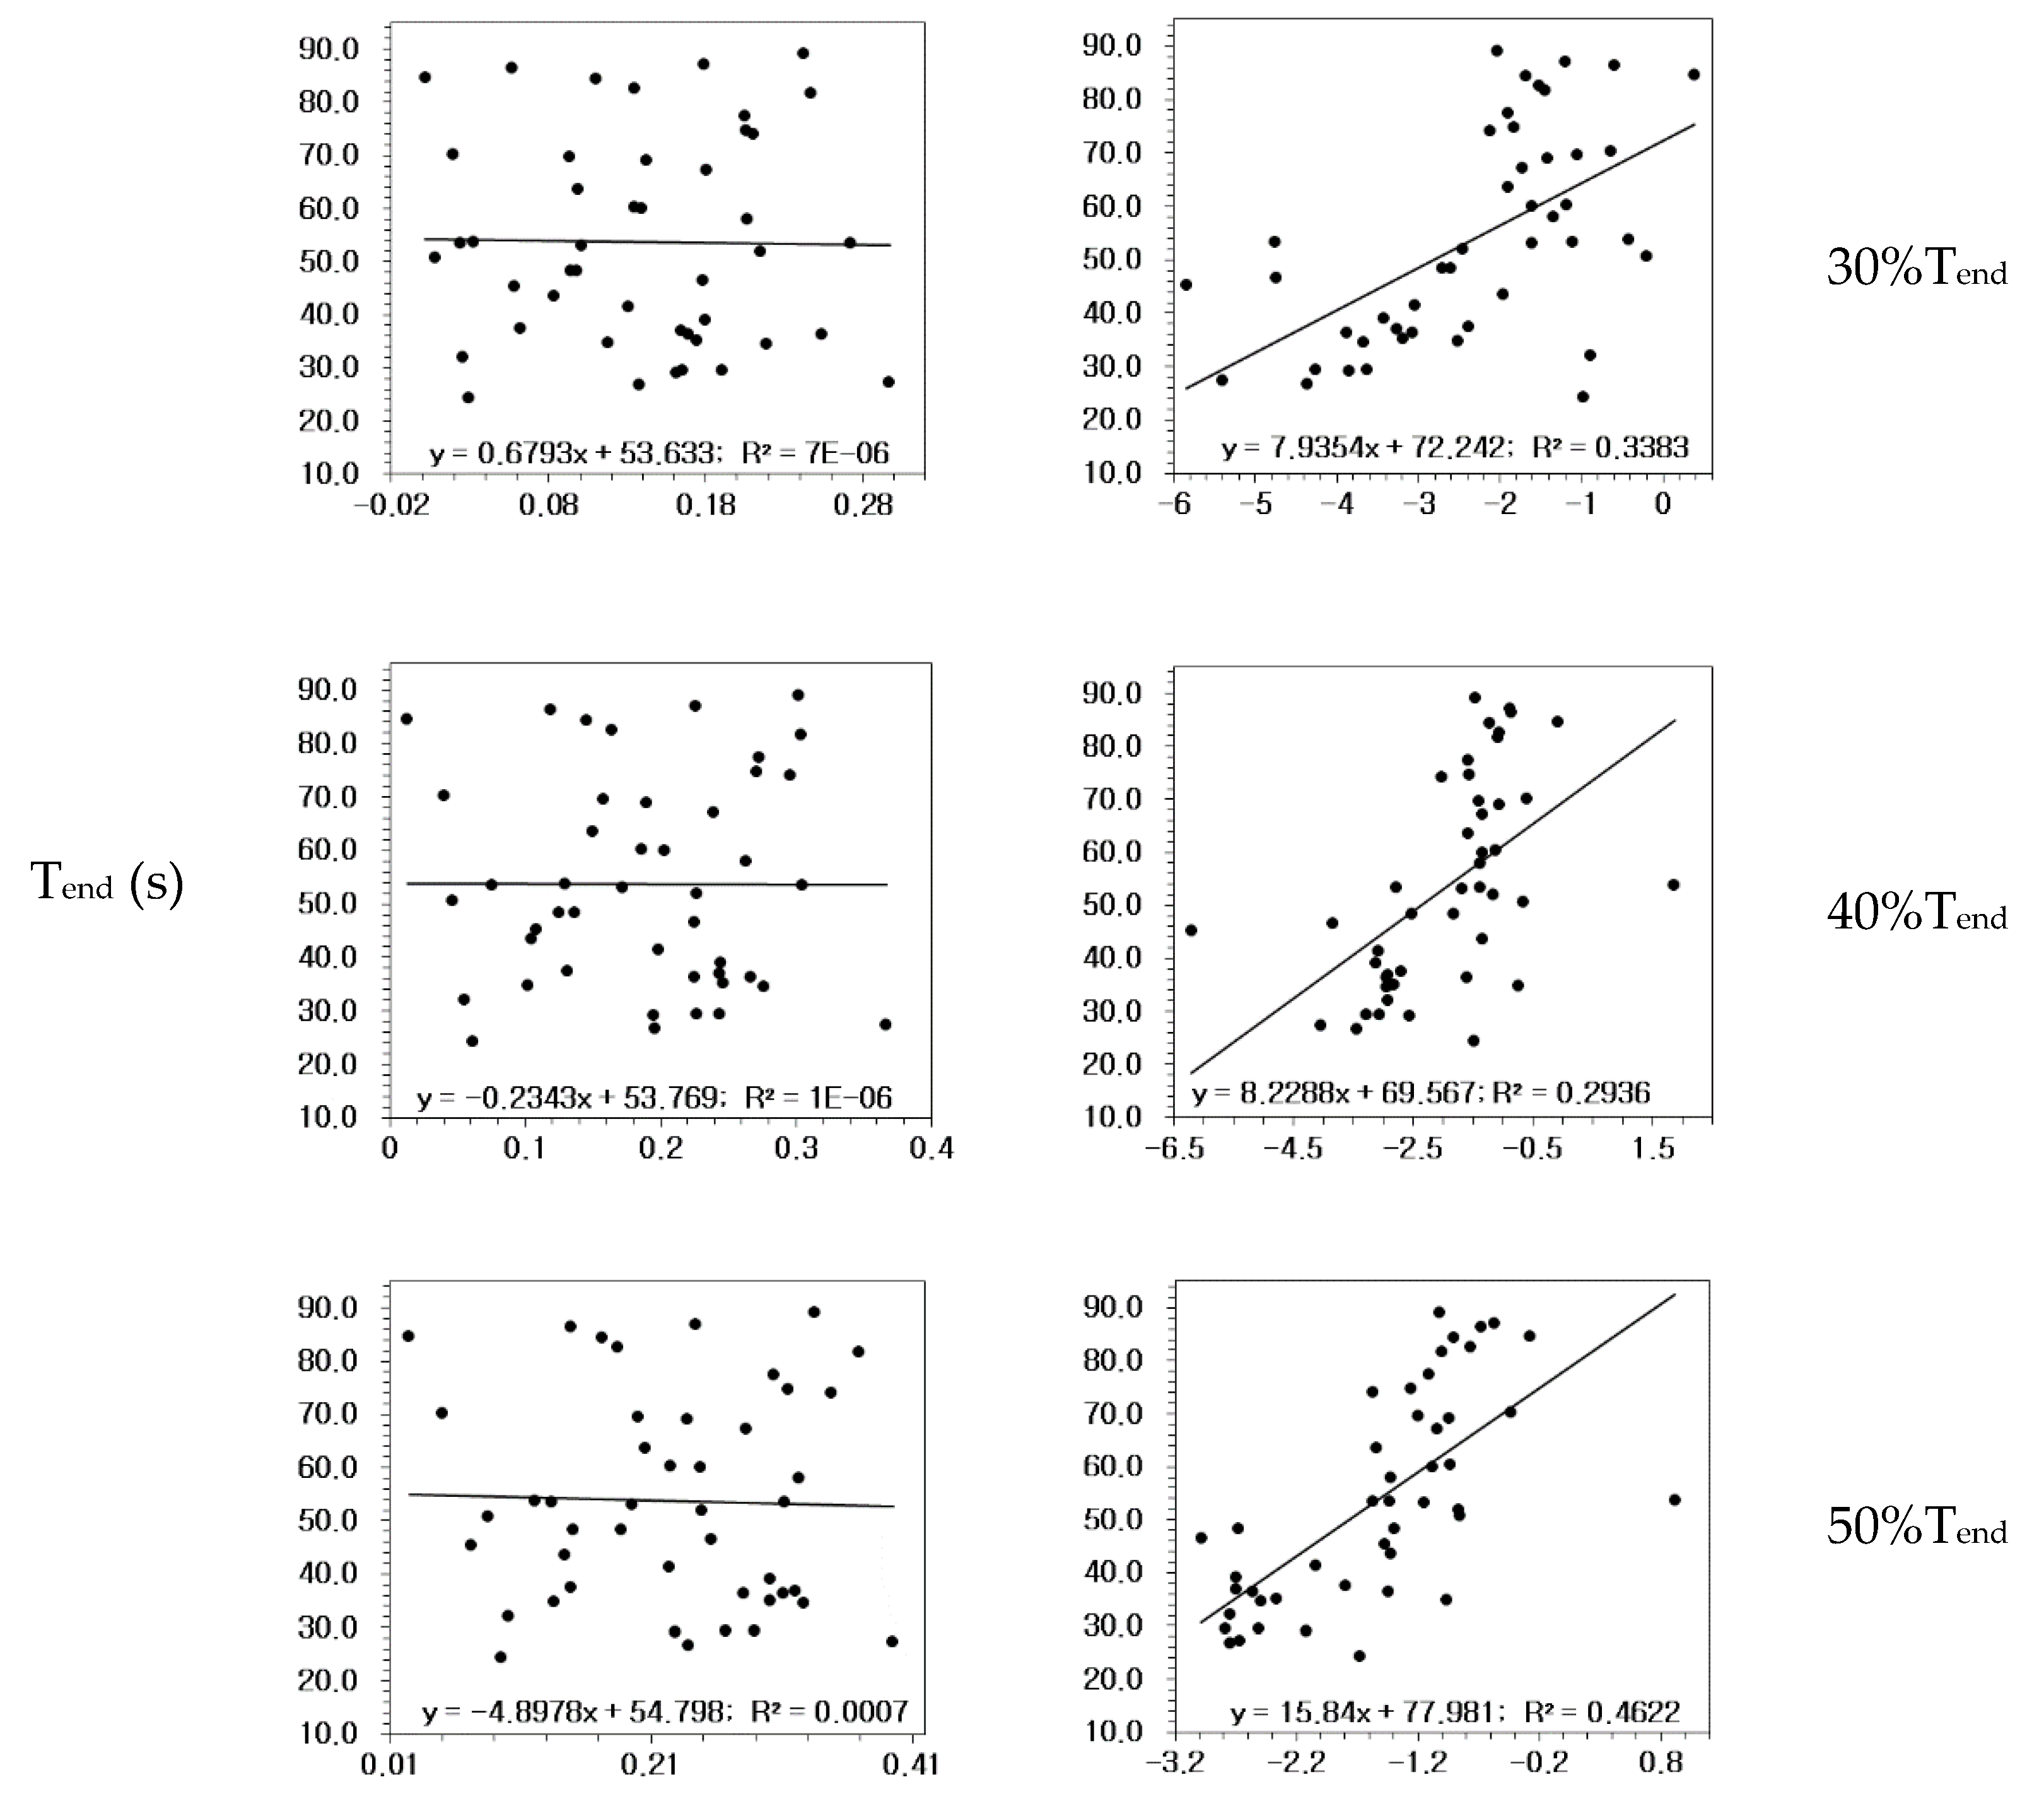
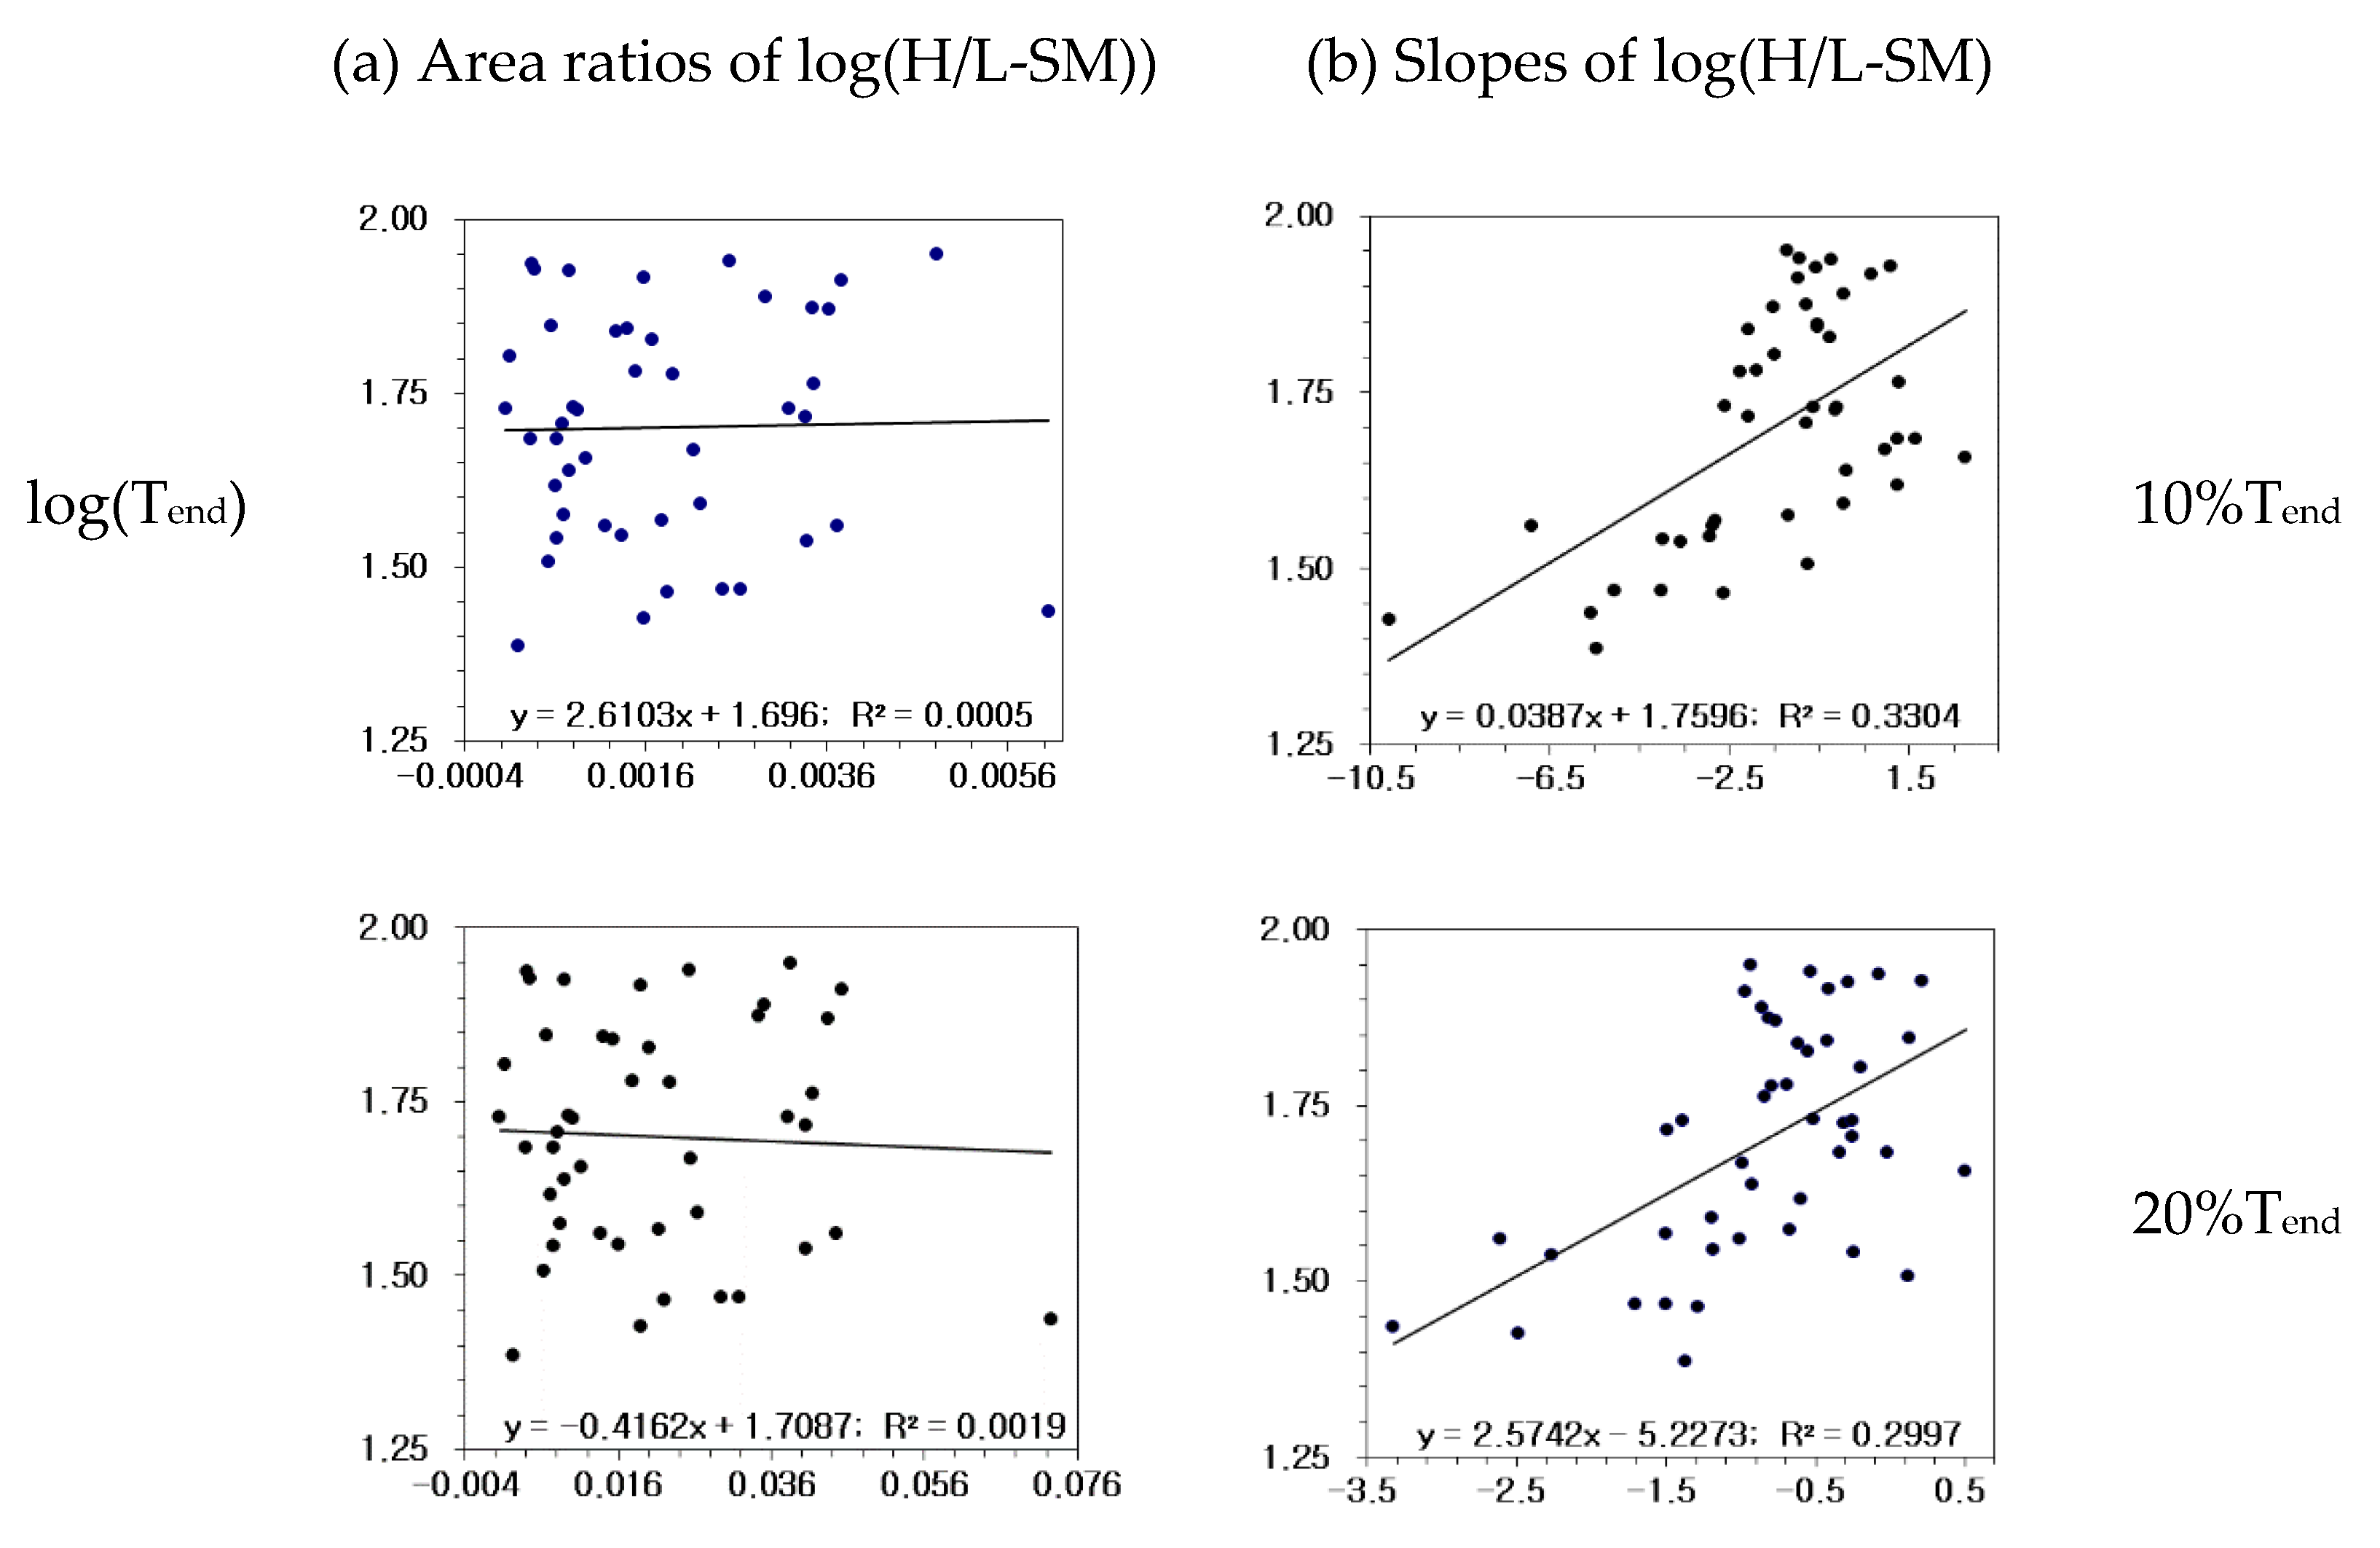
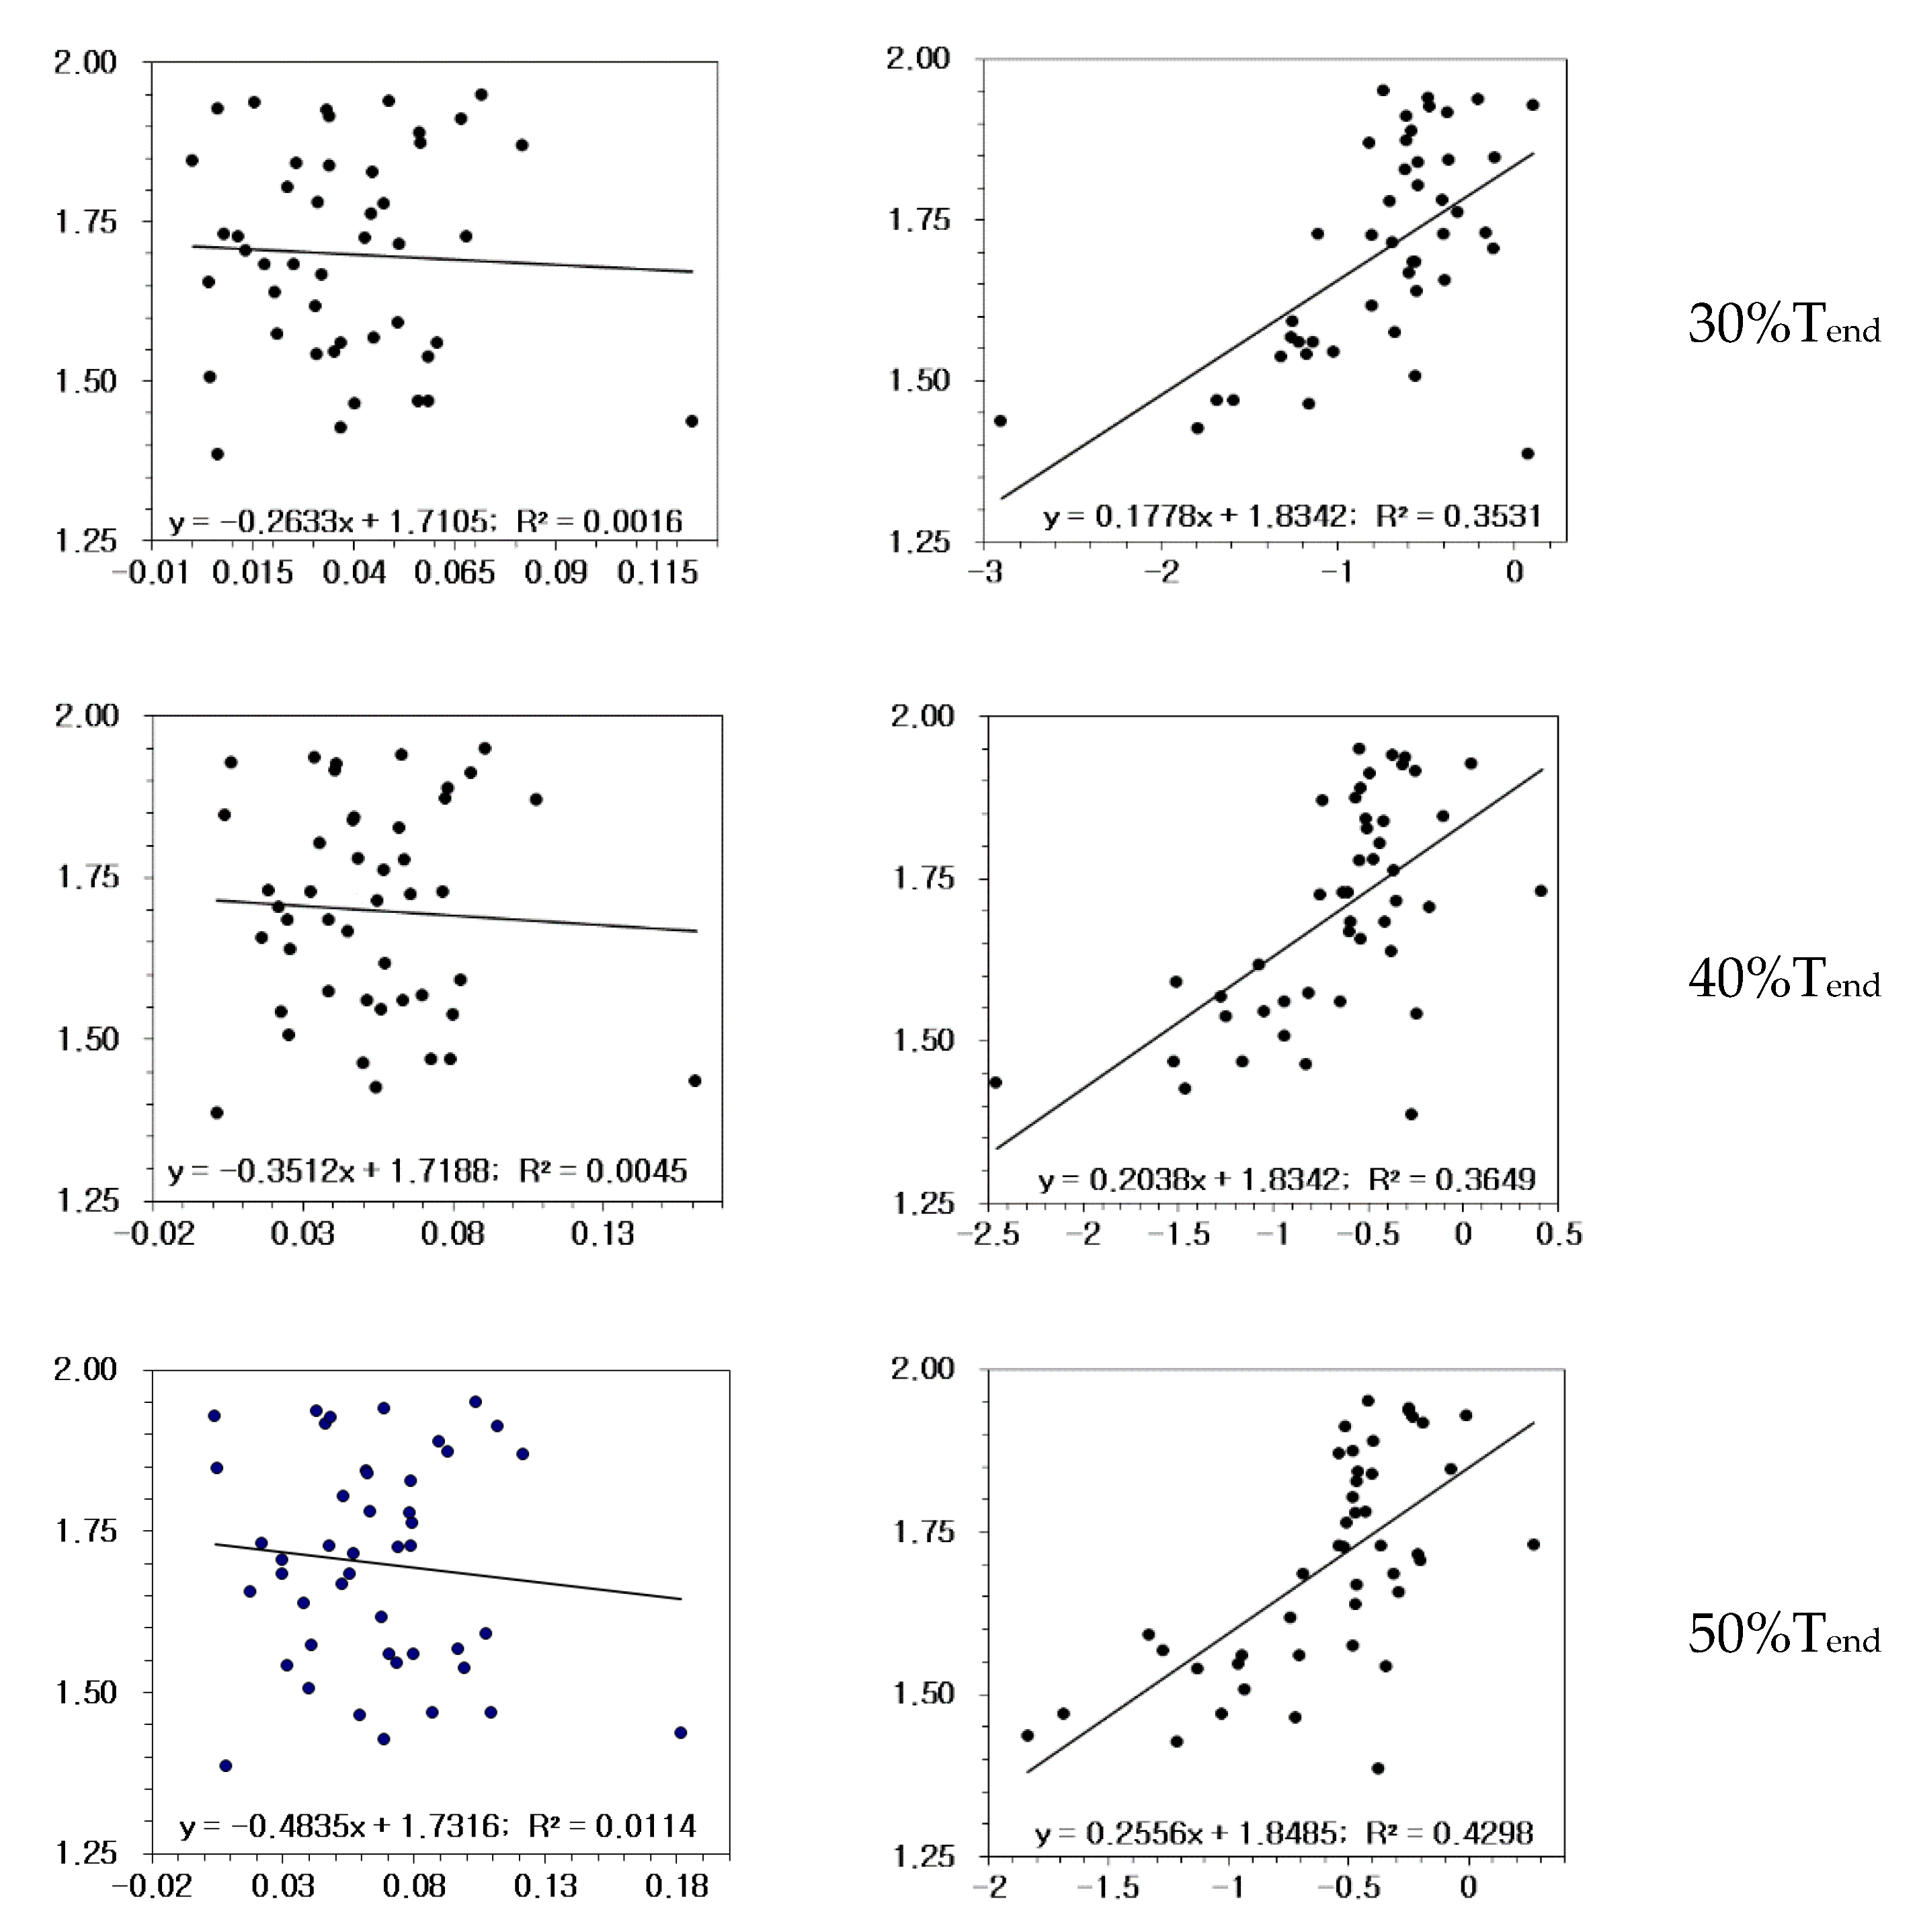
3.3. Relationships between Tend and Predictors
4. Discussion
4.1. Changes in sEMG Parameters
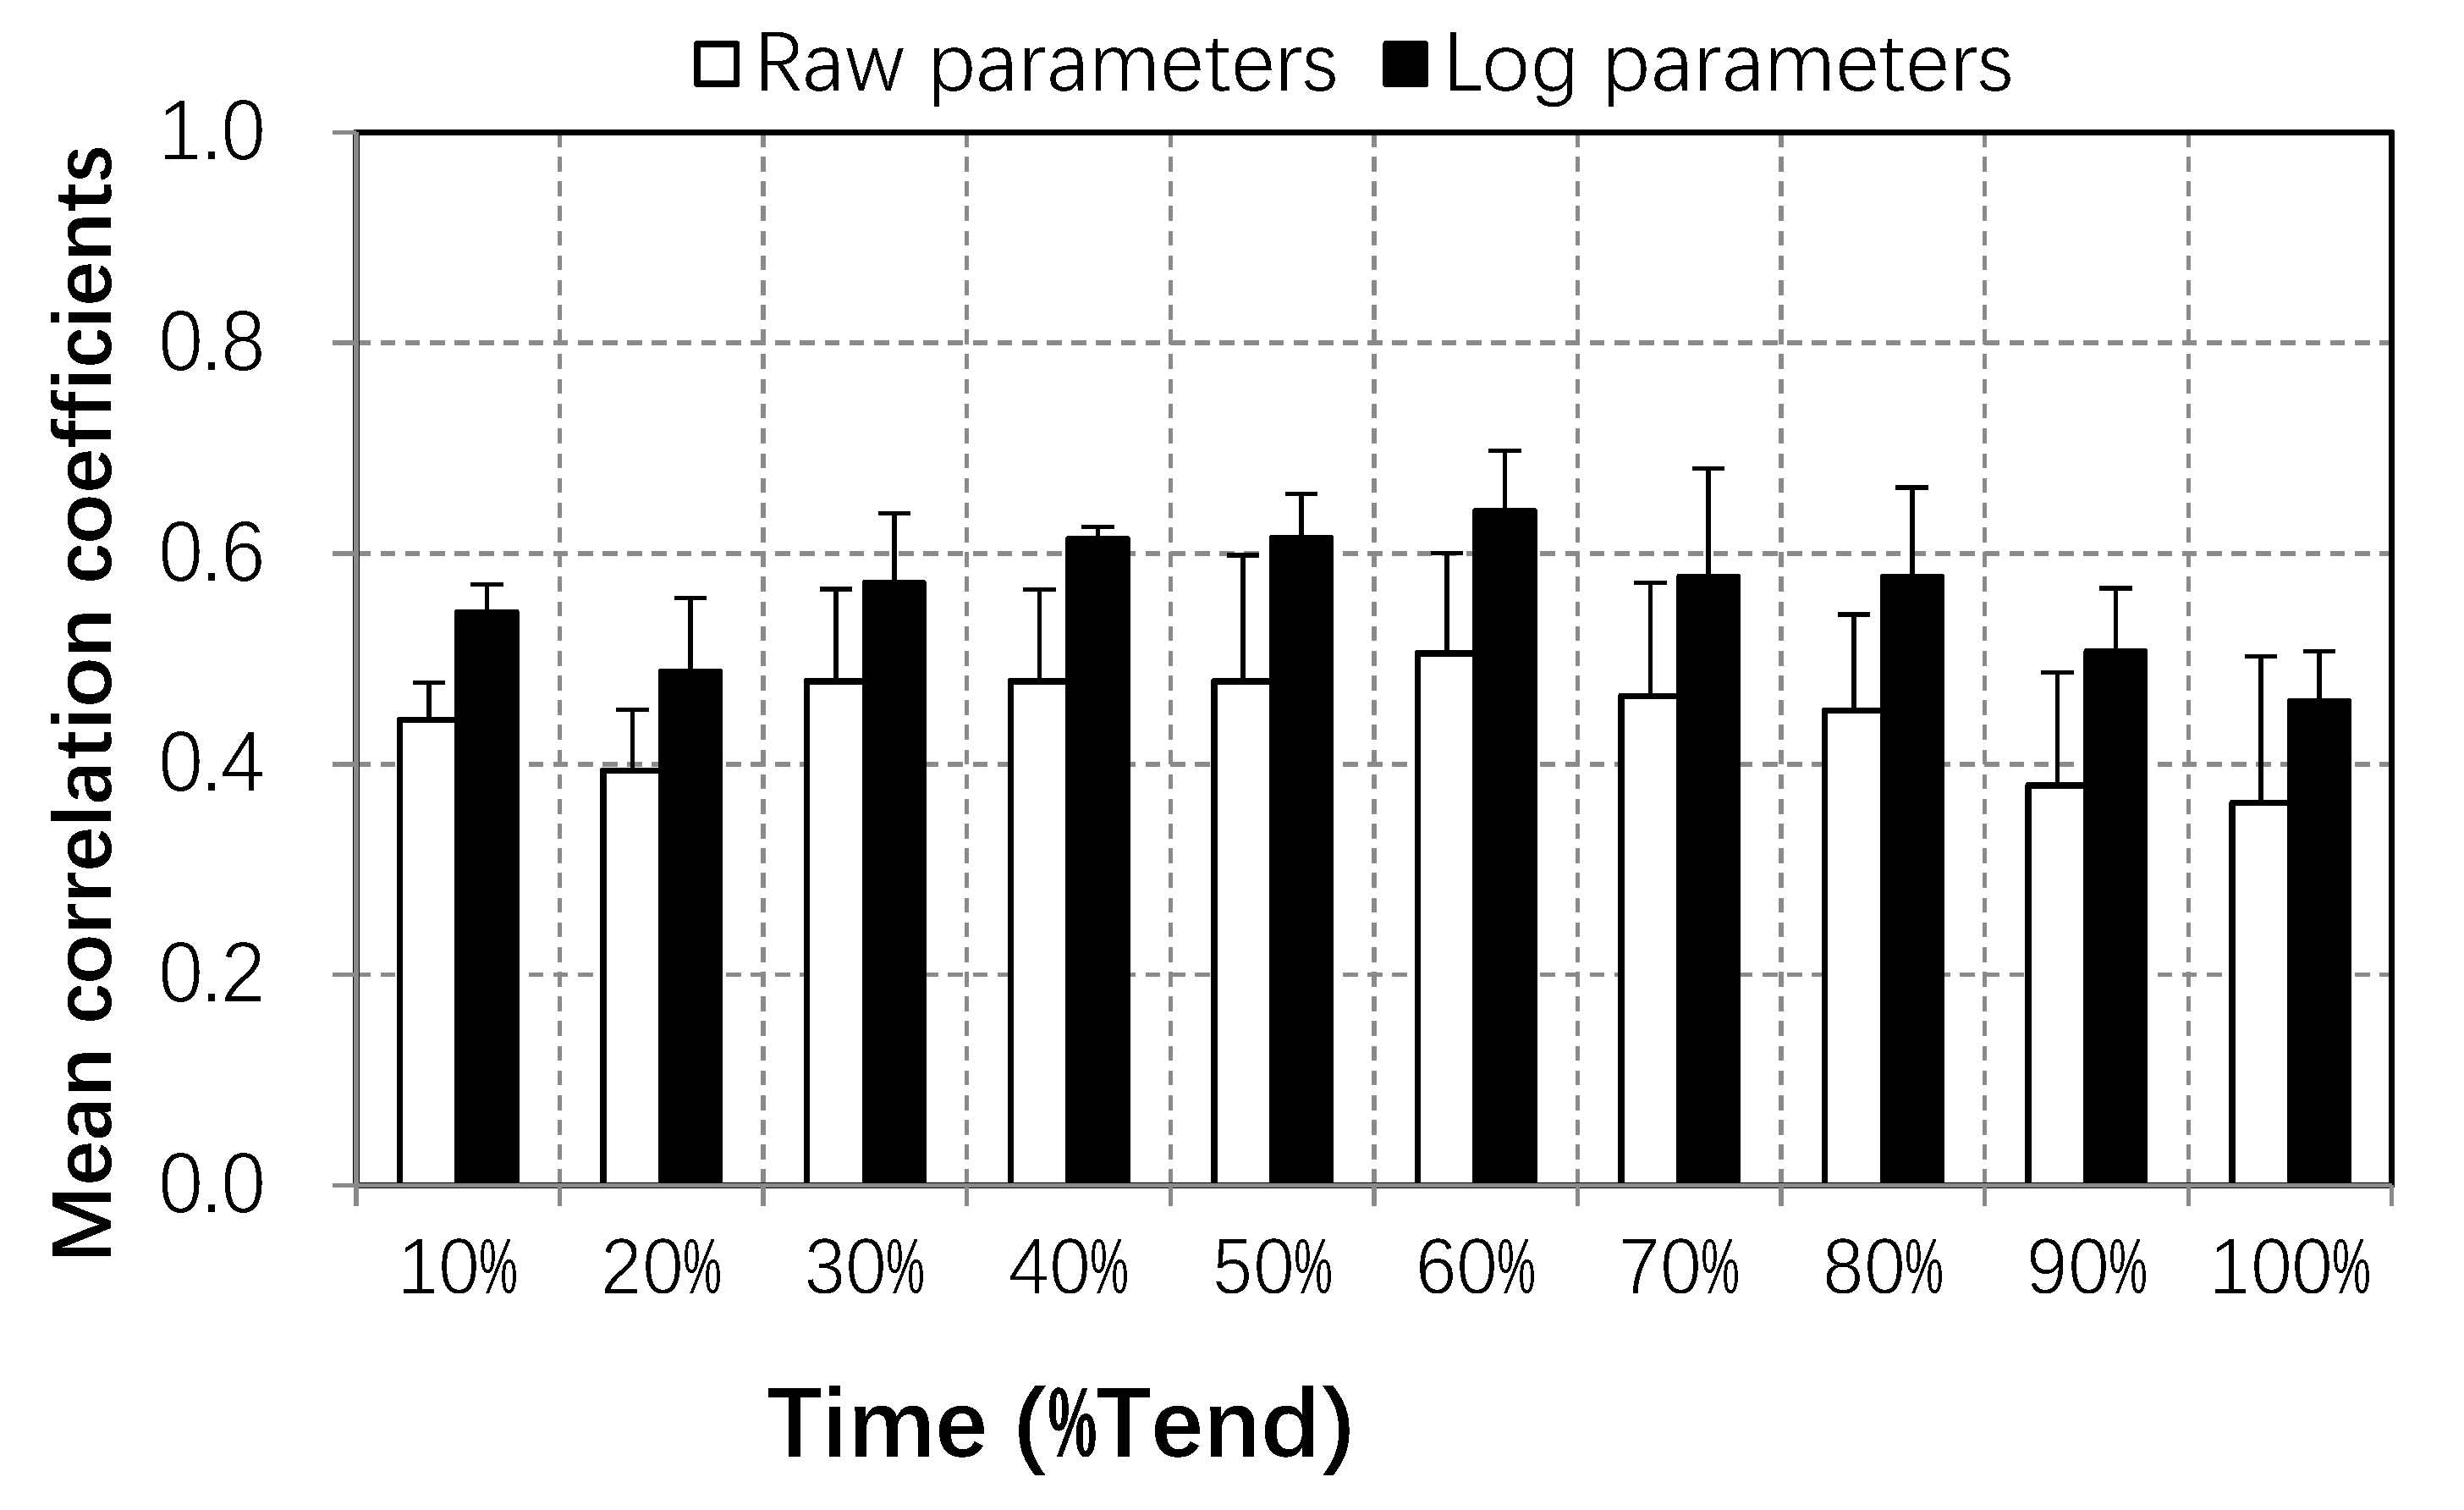
4.2. Comparison of Relationships
4.3. Limitations
5. Conclusions
- (1)
- The linear regressive slope was a more suitable predictor of Tend than the area ratio.
- (2)
- Significant correlations using the logarithmic parameters were about 26.3% higher than those using the raw ones.
- (3)
- Significant correlations larger than 0.5 were found between log(Tend) and the slopes of logH/L-SM over a duration time of every 10% of Tend.
Author Contributions
Funding
Institutional Review Board Statement
Informed Consent Statement
Data Availability Statement
Conflicts of Interest
References
- Merletti, R.; Parker, P. Electromyography: Physiology, Engineering and Non-Invasive Applications; Wiley-IEEE Press: New York, NY, USA, 2004; ISBN 978-0-471-67580-8. [Google Scholar]
- Wan, J.-J.; Qin, Z.; Wang, P.-Y.; Sun, Y.; Liu, X. Muscle fatigue: General understanding and treatment. Exp. Mol. Med. 2017, 49, e384. [Google Scholar] [CrossRef]
- Merletti, R.; Muceli, S. Tutorial. Surface EMG detection in space and time: Best practices. J. Electromyogr. Kinesiol. 2019, 49, 102363. [Google Scholar] [CrossRef] [PubMed]
- Bigland-Ritchie, B.; Donovan, E.; Roussos, C. Conduction velocity and EMG power spectrum changes in fatigue of sustained maximal efforts. J. Appl. Physiol. 1981, 51, 1300–1305. [Google Scholar] [CrossRef] [PubMed]
- Gandevia, S.C. Spinal and Supraspinal Factors in Human Muscle Fatigue. Physiol. Rev. 2001, 81, 1725–1789. [Google Scholar] [CrossRef]
- Bazzucchi, I.; Marchetti, M.; Rosponi, A.; Fattorini, L.; Castellano, V.; Sbriccoli, P.; Felici, F. Differences in the force/endurance relationship between young and older men. Graefe’s Arch. Clin. Exp. Ophthalmol. 2004, 93, 390–397. [Google Scholar] [CrossRef] [PubMed]
- Enoka, R.M.; Stuart, D.G. Neurobiology of muscle fatigue. J. Appl. Physiol. 1992, 72, 1631–1648. [Google Scholar] [CrossRef] [PubMed]
- Maïsetti, O.; Guével, A.; Legros, P.; Hogrel, J.Y. Prediction of endurance capacity of quadriceps muscles inhumans using surface electromyogram spectrum analysis during submaximal voluntary isometric Contraction. Eur. J. Appl. Physiol. 2002, 87, 509–519. [Google Scholar] [PubMed]
- Petrofsky, J.S.; Glaser, R.M.; Phillips, C.A.; Lind, A.R.; Williams, C. Evaluation of the amplitude and frequency components of the surface EMG as an index of muscle fatigue. Ergonomics 1982, 25, 213–223. [Google Scholar] [CrossRef]
- Basmajian, J.; De Luca, C.J. Muscle Alive; Their Functions Revealed by Electromyography, 5th ed.; Williams and Wilkins: Baltimore, MD, USA, 1985. [Google Scholar]
- Duchêne, J.; Goubel, F. EMG spectral shift as an indicator of fatigability in an heterogeneous muscle group. Eur. J. Appl. Physiol. Occup. Physiol. 1990, 61, 81–87. [Google Scholar] [CrossRef]
- Potvin, J.R. Effect of Muscle Kinematics on surface EMG Amplitude and Frequency during Fatiguing Dynamic Contrac-tions. J. Appl. Physiol. 1997, 82, 144–151. [Google Scholar] [CrossRef] [PubMed]
- Merletti, R.; Lo Conte, L.; Orizio, C. Indices of muscle fatigue. J. Electromyogr. Kinesiol. 1991, 1, 22–33. [Google Scholar] [CrossRef]
- De Luca, C.J. The Use of Surface Electromyography in Biomechanics. J. Appl. Biomech. 1997, 13, 135–163. [Google Scholar] [CrossRef] [Green Version]
- Badier, M.; Guillot, C.; Burnet, H.; Jammes, Y. EMG power spectrum of respiratory and skeletal muscles during static contraction in healthy man. Muscle Nerve 1993, 16, 601–609. [Google Scholar] [CrossRef]
- Hanayama, K. Recovery of Conduction Velocity of Muscle Fiber Action Potential after Strenuous Isometric Contraction. Jpn. J. Physiol. 1994, 44, 75–88. [Google Scholar] [CrossRef] [PubMed]
- Mannion, A.F.; Dolan, P. Electromyographic Median Frequency Changes During Isometric Contraction of the Back Extensors to Fatigue. Spine 1994, 19, 1223–1229. [Google Scholar] [CrossRef]
- Dollan, P.; Mannio, A.F.; Adam, M.A. Fatigue of the erector spinae muscles. A quantative assessment using frequency banding of the surface electromyography signal. Spine 1995, 20, 149–159. [Google Scholar] [CrossRef]
- Merletti, R.; Roy, S. Myoelectric and Mechanical Manifestations of Muscle Fatigue in Voluntary Contractions. J. Orthop. Sports Phys. Ther. 1996, 24, 342–353. [Google Scholar] [CrossRef] [Green Version]
- Van Dieёn, J.H.; Heijblom, P.; Bunkens, H. Extrapolation of Time Series of EMG Power Spectrum Parameters in Isometric Endurance Tests of Trunk Extensor Muscles. J. Electromyogr. Kinesiol. 1998, 8, 35–44. [Google Scholar] [CrossRef]
- Lee, K.Y.; Lee, S.; Choi, A.R.; Choi, C.-H.; Mun, J.H. Endurance time prediction of biceps brachii muscle using Dimitrov spectral index of surface electromyogram during isotonic contractions. Int. J. Precis. Eng. Manuf. 2011, 12, 711–717. [Google Scholar] [CrossRef]
- Dimitrov, G.V.; Arabadzhiev, T.I.; Mileva, K.N.; Bowtell, J.L.; Crichton, N.; Dimitrova, N.A. Muscle Fatigue during Dynamic Contractions Assessed by New Spectral Indices. Med. Sci. Sports Exerc. 2006, 38, 1971–1979. [Google Scholar] [CrossRef]
- Lee, S.; Jang, J.; Cho, C.; Kim, D.; Moon, G.; Kim, B.; Choi, A.; Lee, K. Endurance capacity of the biceps brachaii using the high-to-low ratio between two signal spectral moments of surface EMG signals during isotonic contractions. J. Electr. Eng. Technol. 2017, 12, 1641–1648. [Google Scholar]
- Lindstrom, L.; Kadefors, R.; Petersén, I. An electromyographic index for localized muscle fatigue. J. Appl. Physiol. 1977, 43, 750–754. [Google Scholar] [CrossRef]
- Stulen, F.B.; De Luca, C.J. Frequency Parameters of the Myoelectric Signal as a Measure of Muscle Conduction Velocity. IEEE Trans. Biomed. Eng. 1981, 28, 515–523. [Google Scholar] [CrossRef] [Green Version]
- Moxham, J.; Edward, R.H.; Aubier, M.; De Troy, A.; Farkas, G.; Macklem, P.T.; Rousses, C. Changes in EMG Power Spectrum (high-to-low ratio) with Force Fatigue in Humans. J. Appl. Physiol. 1982, 53, 1094–1099. [Google Scholar] [CrossRef]
- Dunchene, J.; Goubel, F. Surface electromyogram during voluntary contraction: Processing tools and relation to physio-logical events. Clitical Rev. Biomed. Eng. 1993, 21, 313–397. [Google Scholar]
- González-Izal, M.; Malanda, A.; Navarro-Amézqueta, I.; Gorostiaga, E.M.; Mallor, F.; Ibañez, J.; Izquierdo, M. EMG spectral indices and muscle power fatigue during dynamic contractions. J. Electromyogr. Kinesiol. 2010, 20, 233–240. [Google Scholar] [CrossRef] [PubMed]
- Lee, S.; Choi, A.; Kim, S.; Won, J.; Lee, K. Comparison of EMG activity using spectrum indices from biceps femoris muscle during treadmill walking. Int. J. Adv. Sci. Technol. 2019, 28, 33–39. [Google Scholar]
- Yassierli, Y.; Nussbaum, M.A. Logarithmic Power-Frequency: An Alternative Method for Emg-Based Fatigue Assessment. Hum. Fact. Ergon. Soc. Annu. Meet. Proc. 2003, 47, 1184–1188. [Google Scholar] [CrossRef]
- Nussbaum, M.A. Utility of traditional and alternative EMG-based measures of fatigue during low-moderate level isometric efforts. J. Electromyogr. Kinesiol. 2008, 18, 44–53. [Google Scholar] [CrossRef]
- Abbaspour, S.; Lindén, M.; GholamHosseini, H.; Naber, A.; Ortiz-Catalan, M. Evaluation of surface EMG-based recognition algorithms for decoding hand movements. Med. Biol. Eng. Comput. 2020, 58, 83–100. [Google Scholar] [CrossRef] [Green Version]
- Hermens, H.J.; Freriks, B.; Disselhorst-Klug, C.; Rau, G. Development of recommendations for SEMG sensors and sensor placement procedures. J. Electromyogr. Kinesiol. 2000, 10, 361–374. [Google Scholar] [CrossRef]
- Lim, S.K. An electromyographic analysis of muscle activation in the latissimus dorsi, pectoralis major, deltoid, trapezius, and biceps brachii muscles according to the type of lat pull down exercise. Off. J. Korean Acad. Kinesiol. 2017, 19, 55–62. [Google Scholar]
- Allison, G.T.; Fujiwara, T. The relationship between EMG median frequency and low frequency band amplitude chages at different levels of muscle capacity. Clin. Biomech. 2002, 17, 464–469. [Google Scholar] [CrossRef]
- Feng, C.; Wang, H.; Lu, N.; Tu, X.M. Log transformation: Application and interpretation in biomedical research. Stat. Med. 2012, 32, 230–239. [Google Scholar] [CrossRef] [PubMed]
- Krishnamoorthy, K.; Lee, M. Improved tests for the equality of normal coefficients of variation. Comput. Stat. 2014, 29, 215–232. [Google Scholar] [CrossRef]
- Boyas, S.; Maïsetti, O.; Guével, A. Changes in sEMG parameters among trunk and thigh muscles during a fatiguing bilat-eral isometric multi-joint task in trained and untrained participants. J. Electromyogr. Kinesiol. 2009, 19, 259–268. [Google Scholar] [CrossRef]
- Masuda, K.; Masuda, T.; Sadoyama, T.; Inaki, M.; Katsuta, S. Changes in Surface EMG Parameters during Static and Dy-namic Fatiguing Contractions. J. Electromyogr. Kinesiol. 1999, 9, 39–46. [Google Scholar] [CrossRef]
- Fallentin, N.; Simonsen, E.B. Motor unit recruitment during prolonged isometric contractions. Graefe’s Arch. Clin. Exp. Ophthalmol. 1993, 67, 335–341. [Google Scholar] [CrossRef]
- Farina, D. Interpretation of the Surface Electromyogram in Dynamic Contractions. Exerc. Sport Sci. Rev. 2006, 34, 121–127. [Google Scholar] [CrossRef]
- González-Izal, M.; Rodríguez-Carreño, I.; Mallor-Giménez, F.; Malanda, A.; Izquierdo, M. New Wavelet Indices to Assess Muscle Fatigue during Dynamic Contractions. World Acad. Sci. Eng. Technol. 2009, 55, 480–485. [Google Scholar]
- MacIssac, D.; Parker, P.A.; Scott, R.N. The Short time Fourier Transform and Muscle Fatigue Assessment in Dynamic Con-tractions. J. Electromyogr. Kinesiol. 2001, 11, 439–449. [Google Scholar] [CrossRef]
- Dimitrova, N.A.; Arabadzhiev, T.I.; Hogrel, J.-Y.; Dimitrov, G.V. Fatigue analysis of interference EMG signals obtained from biceps brachii during isometric voluntary contraction at various force levels. J. Electromyogr. Kinesiol. 2009, 19, 252–258. [Google Scholar] [CrossRef]
- Coorevits, P.; Danneels, L.; Cambier, D.; Ramon, H.; Druyts, H.; Karlsson, J.S.; De Moor, G.; Vanderstraeten, G. Test–retest reliability of wavelet—And Fourier based EMG (instantaneous) median frequencies in the evaluation of back and hip muscle fatigue during isometric back extensions. J. Electromyogr. Kinesiol. 2008, 18, 798–806. [Google Scholar] [CrossRef] [PubMed]


| Variable | Mean | Standard Deviation |
|---|---|---|
| Age (yrs) | 26.0 | 2.7 |
| Height (cm) | 165.4 | 6.2 |
| Weight (kg) | 63.7 | 12.5 |
| - | LFB | MPF | H/L-FB | DSI | H/L-SM |
|---|---|---|---|---|---|
| Raw | 0.27 ± 0.51 | 0.19 ± 0.11 | 0.20 ± 0.15 | 0.26 ± 0.24 | 0.20 ± 0.18 |
| Logarithm | 0.12 ± 0.04 | 0.17 ± 0.13 | 0.12 ± 0.05 | 0.14 ± 0.08 | 0.17 ± 0.09 |
| (a) Mean area ratios in the raw parameters | |||||||||||
| %Tend | 10% | 20% | 30% | 40% | 50% | 60% | 70% | 80% | 90% | 100% | |
| LFB | Mean | 0.00 | −0.15 | −0.27 | −0.39 | −0.50 | −0.62 | −0.75 | −0.91 | −1.07 | −1.27 |
| S.D. | 0.00 | 0.17 | 0.23 | 0.26 | 0.31 | 0.36 | 0.41 | 0.48 | 0.57 | 0.71 | |
| MPF | Mean | 0.00 | 0.02 | 0.03 | 0.05 | 0.05 | 0.06 | 0.08 | 0.09 | 0.10 | 0.11 |
| S.D. | 0.00 | 0.02 | 0.03 | 0.03 | 0.04 | 0.04 | 0.04 | 0.04 | 0.04 | 0.04 | |
| H/L-FB | Mean | 0.00 | 0.04 | 0.08 | 0.10 | 0.12 | 0.14 | 0.16 | 0.18 | 0.21 | 0.23 |
| S.D. | 0.00 | 0.07 | 0.09 | 0.09 | 0.10 | 0.10 | 0.11 | 0.11 | 0.11 | 0.10 | |
| DSI | Mean | 0.00 | −0.09 | −0.19 | −0.28 | −0.37 | −0.46 | −0.56 | −0.67 | −0.81 | −0.96 |
| S.D. | 0.00 | 0.10 | 0.16 | 0.24 | 0.33 | 0.34 | 0.36 | 0.38 | 0.46 | 0.49 | |
| H/L-SM | Mean | 0.00 | 0.07 | 0.14 | 0.18 | 0.22 | 0.25 | 0.29 | 0.32 | 0.35 | 0.38 |
| S.D. | 0.00 | 0.06 | 0.08 | 0.10 | 0.10 | 0.11 | 0.11 | 0.12 | 0.11 | 0.11 | |
| (b) Mean area ratios in the logarithmic parameters | |||||||||||
| %Tend | 10% | 20% | 30% | 40% | 50% | 60% | 70% | 80% | 90% | 100% | |
| logLFB | Mean | 0.00 | −0.03 | −0.04 | −0.06 | −0.08 | −0.09 | −0.10 | −0.12 | −0.13 | −0.15 |
| S.D. | 0.00 | 0.03 | 0.04 | 0.04 | 0.05 | 0.05 | 0.05 | 0.05 | 0.05 | 0.06 | |
| logMPF | Mean | 0.000 | 0.004 | 0.009 | 0.012 | 0.014 | 0.017 | 0.020 | 0.023 | 0.026 | 0.029 |
| S.D. | 0.000 | 0.006 | 0.008 | 0.009 | 0.011 | 0.011 | 0.011 | 0.011 | 0.012 | 0.012 | |
| logH/L-FB | Mean | 0.00 | 0.01 | 0.02 | 0.02 | 0.03 | 0.03 | 0.04 | 0.05 | 0.06 | 0.06 |
| S.D. | 0.00 | 0.02 | 0.02 | 0.02 | 0.02 | 0.03 | 0.03 | 0.03 | 0.03 | 0.03 | |
| logDSI | Mean | 0.00 | −0.02 | −0.03 | −0.05 | −0.06 | −0.07 | −0.08 | −0.09 | −0.10 | −0.12 |
| S.D. | 0.00 | 0.01 | 0.02 | 0.03 | 0.03 | 0.03 | 0.04 | 0.04 | 0.04 | 0.04 | |
| logH/L-SM | Mean | 0.00 | 0.02 | 0.04 | 0.05 | 0.06 | 0.08 | 0.09 | 0.10 | 0.12 | 0.13 |
| S.D. | 0.00 | 0.02 | 0.02 | 0.03 | 0.04 | 0.04 | 0.04 | 0.04 | 0.04 | 0.05 | |
| (a) Mean slopes in the raw parameters | |||||||||||
| %Tend | 10 | 20 | 30 | 40 | 50 | 60 | 70 | 80 | 90 | 100 | |
| LFB | Mean | 17.09 | 11.25 | 9.90 | 8.79 | 8.48 | 7.99 | 7.54 | 8.18 | 8.10 | 8.21 |
| S.D. | 28.55 | 14.74 | 13.83 | 13.15 | 11.72 | 11.01 | 8.70 | 9.46 | 8.90 | 8.02 | |
| MPF | Mean | −1.02 | −0.55 | −0.49 | −0.39 | −0.32 | −0.30 | −0.29 | −0.28 | −0.28 | −0.27 |
| S.D. | 1.82 | 0.63 | 0.39 | 0.31 | 0.27 | 0.22 | 0.18 | 0.16 | 0.15 | 0.13 | |
| H/L-FB | Mean | −2.27 | −1.35 | −1.25 | −1.11 | −0.83 | −0.73 | −0.72 | −0.76 | −0.76 | −0.76 |
| S.D. | 8.36 | 2.48 | 1.20 | 0.78 | 0.67 | 0.58 | 0.52 | 0.49 | 0.46 | 0.40 | |
| DSI | Mean | 13.24 | 7.65 | 7.82 | 7.51 | 7.62 | 7.09 | 6.55 | 6.67 | 7.17 | 7.45 |
| S.D. | 20.77 | 8.53 | 10.01 | 11.32 | 12.19 | 7.77 | 5.28 | 4.89 | 5.80 | 5.21 | |
| H/L-SM | Mean | −4.30 | −2.64 | −2.33 | −1.93 | −1.53 | −1.39 | −1.30 | −1.23 | −1.17 | −1.12 |
| S.D. | 8.63 | 2.42 | 1.44 | 1.29 | 0.84 | 0.78 | 0.71 | 0.65 | 0.61 | 0.58 | |
| (b) Mean slopes in the logarithmic parameters | |||||||||||
| %Tend | 10% | 20% | 30% | 40% | 50% | 60% | 70% | 80% | 90% | 100% | |
| logLFB | Mean | 2.74 | 1.48 | 1.04 | 0.88 | 0.77 | 0.69 | 0.66 | 0.65 | 0.61 | 0.59 |
| S.D. | 5.70 | 2.01 | 1.10 | 0.74 | 0.69 | 0.52 | 0.44 | 0.37 | 0.30 | 0.25 | |
| logMPF | Mean | −0.007 | −0.004 | −0.004 | −0.003 | −0.002 | −0.002 | −0.002 | −0.002 | −0.002 | −0.002 |
| S.D. | 0.013 | 0.005 | 0.003 | 0.003 | 0.002 | 0.002 | 0.001 | 0.001 | 0.001 | 0.001 | |
| logH/L-FB | Mean | −0.95 | −0.43 | −0.38 | −0.32 | −0.26 | −0.23 | −0.24 | −0.25 | −0.26 | −0.26 |
| S.D. | 2.59 | 0.79 | 0.39 | 0.25 | 0.20 | 0.18 | 0.17 | 0.17 | 0.16 | 0.14 | |
| logDSI | Mean | 1.57 | 0.88 | 0.78 | 0.68 | 0.60 | 0.57 | 0.54 | 0.54 | 0.53 | 0.53 |
| S.D. | 2.39 | 0.77 | 0.54 | 0.49 | 0.44 | 0.39 | 0.34 | 0.32 | 0.30 | 0.26 | |
| logH/L-SM | Mean | −1.52 | −0.85 | −0.75 | −0.66 | −0.58 | −0.54 | −0.52 | −0.52 | −0.51 | −0.51 |
| S.D. | 2.44 | 0.77 | 0.55 | 0.49 | 0.42 | 0.36 | 0.30 | 0.27 | 0.25 | 0.21 | |
| (a) Raw parameter slopes v.s. Tend | |||||||||||
| %Tend | 10 | 20 | 30 | 40 | 50 | 60 | 70 | 80 | 90 | 100 | Mean |
| LFB | n.s. | n.s. | n.s. | n.s. | n.s. | n.s. | n.s. | n.s. | 0.44 a | 0.60 b | n.s. |
| MPF | n.s. | n.s. | n.s. | n.s. | n.s. | n.s. | n.s. | n.s. | n.s. | n.s. | n.s. |
| H/L-FB | n.s. | n.s. | n.s. | n.s. | n.s. | n.s. | n.s. | n.s. | n.s. | n.s. | n.s. |
| DSI | n.s. | n.s. | n.s. | n.s. | n.s. | n.s. | n.s. | n.s. | n.s. | n.s. | n.s. |
| H/L-SM | n.s. | n.s. | n.s. | n.s. | n.s. | n.s. | n.s. | n.s. | n.s. | n.s. | n.s. |
| Mean | n.s. | n.s. | n.s. | n.s. | n.s. | n.s. | n.s. | n.s. | n.s. | n.s. | n.s. |
| (b) Logarithmic parameter slopes v.s. log(Tend) | |||||||||||
| %Tend | 10 | 20 | 30 | 40 | 50 | 60 | 70 | 80 | 90 | 100 | Mean |
| logLFB | n.s. | n.s. | n.s. | n.s. | n.s. | n.s. | n.s. | n.s. | n.s. | n.s. | n.s. |
| logMPF | n.s. | n.s. | n.s. | n.s. | n.s. | n.s. | n.s. | n.s. | n.s. | n.s. | n.s. |
| logH/L-FB | n.s. | n.s. | n.s. | n.s. | n.s. | n.s. | n.s. | n.s. | n.s. | n.s. | n.s. |
| logDSI | n.s. | n.s. | n.s. | n.s. | n.s. | n.s. | n.s. | n.s. | n.s. | n.s. | n.s. |
| logH/L-SM | n.s. | n.s. | n.s. | n.s. | n.s. | n.s. | n.s. | n.s. | n.s. | n.s. | n.s. |
| Mean | n.s. | n.s. | n.s. | n.s. | n.s. | n.s. | n.s. | n.s. | n.s. | n.s. | n.s. |
| (a) Raw parameters slopes v.s. Tend | |||||||||||
| %Tend | 10 | 20 | 30 | 40 | 50 | 60 | 70 | 80 | 90 | 100 | Mean |
| LFB | 0.42 a | 0.34 a | 0.36 a | 0.31 a | 0.31 a | n.s. | n.s. | n.s. | n.s. | n.s. | n.s. |
| MPF | 0.50 b | 0.43 a | 0.58 b | 0.56 b | 0.54 b | 0.60 b | 0.59 b | 0.60 b | 0.53 b | 0.50 b | 0.54 |
| H/L-FB | 0.42 a | 0.32 a | 0.44 a | 0.59 b | 0.45 a | 0.48 a | 0.38 a | 0.45 a | 0.48 a | 0.49 a | 0.45 |
| DSI | 0.43 a | 0.42 a | 0.42 a | 0.39 a | 0.41 a | 0.52 b | 0.53 b | 0.47 a | 0.32 a | n.s. | 0.41 |
| H/L-SM | 0.43 a | 0.45 a | 0.58 b | 0.54 b | 0.68 b | 0.69 b | 0.63 b | 0.64 b | 0.56 b | 0.47 a | 0.57 |
| Mean | 0.44 | 0.39 | 0.48 | 0.48 | 0.48 | 0.51 | 0.46 | 0.45 | 0.38 | n.s. | 0.44 |
| (b) Logarithmic parameters slopes v.s. log(Tend) | |||||||||||
| %Tend | 10 | 20 | 30 | 40 | 50 | 60 | 70 | 80 | 90 | 100 | Mean |
| logLFB | 0.49 a | 0.48 a | 0.57 b | 0.69 b | 0.62 b | 0.65 b | 0.65 b | 0.64 b | 0.55 b | 0.47 a | 0.58 |
| logMPF | 0.57 b | 0.49 a | 0.62 b | 0.58 b | 0.57 b | 0.63 b | 0.57 b | 0.56 b | 0.45 a | 0.40 a | 0.54 |
| logH/L-FB | 0.52 b | 0.39 a | 0.47 a | 0.59 b | 0.59 b | 0.57 b | 0.41 a | 0.45 a | 0.45 a | 0.46 a | 0.49 |
| logDSI | 0.57 b | 0.53 b | 0.60 b | 0.60 b | 0.64 b | 0.66 b | 0.60 b | 0.58 b | 0.51 b | 0.45 a | 0.58 |
| logH/L-SM | 0.57 b | 0.55 b | 0.59 b | 0.60 b | 0.66 b | 0.70 b | 0.66 b | 0.65 b | 0.57 b | 0.51 b | 0.61 |
| Mean | 0.54 | 0.49 | 0.57 | 0.61 | 0.61 | 0.64 | 0.58 | 0.58 | 0.51 | 0.46 | 0.56 |
Publisher’s Note: MDPI stays neutral with regard to jurisdictional claims in published maps and institutional affiliations. |
© 2021 by the authors. Licensee MDPI, Basel, Switzerland. This article is an open access article distributed under the terms and conditions of the Creative Commons Attribution (CC BY) license (http://creativecommons.org/licenses/by/4.0/).
Share and Cite
Cho, C.-o.; Jeong, J.-H.; Kim, Y.-j.; Jang, J.H.; Lee, S.-S.; Lee, K.-y. Comparison of Endurance Time Prediction of Biceps Brachii Using Logarithmic Parameters of a Surface Electromyogram during Low-Moderate Level Isotonic Contractions. Appl. Sci. 2021, 11, 2861. https://doi.org/10.3390/app11062861
Cho C-o, Jeong J-H, Kim Y-j, Jang JH, Lee S-S, Lee K-y. Comparison of Endurance Time Prediction of Biceps Brachii Using Logarithmic Parameters of a Surface Electromyogram during Low-Moderate Level Isotonic Contractions. Applied Sciences. 2021; 11(6):2861. https://doi.org/10.3390/app11062861
Chicago/Turabian StyleCho, Chang-ok, Jin-Hyoung Jeong, Yun-jeong Kim, Jee Hun Jang, Sang-Sik Lee, and Ki-young Lee. 2021. "Comparison of Endurance Time Prediction of Biceps Brachii Using Logarithmic Parameters of a Surface Electromyogram during Low-Moderate Level Isotonic Contractions" Applied Sciences 11, no. 6: 2861. https://doi.org/10.3390/app11062861