1. Introduction
Nowadays, the problems related to electrical energy are emerging worldwide and all countries are facing challenges, whether for its management, operation, production, or even transport. Fossil fuels are the major source of energy production. Therefore, electric-powered vehicles are a promising alternative to fossil-fuel-powered vehicles, in the automotive industry. Electric vehicles (EVs) include battery electric vehicles and plug-in hybrid electric vehicles, and they have been the center of attraction due to their environmental and health benefits.
The prevalence of EVs has increased recently, as sales have increased from 2.1 million to reach 7.2 million EVs globally in 2019, registering a 40% year-on-year increase [
1]. China, the United States, and Europe dominate the EV stock market [
1]. The growth of EV stock requires the new installation of charging stations, described as EV equipment supply, to respond to the charging demands of EVs. In 2019, 7.3 million chargers were deployed worldwide, where 90% of these chargers were private chargers, according to International Energy Agency [
1].
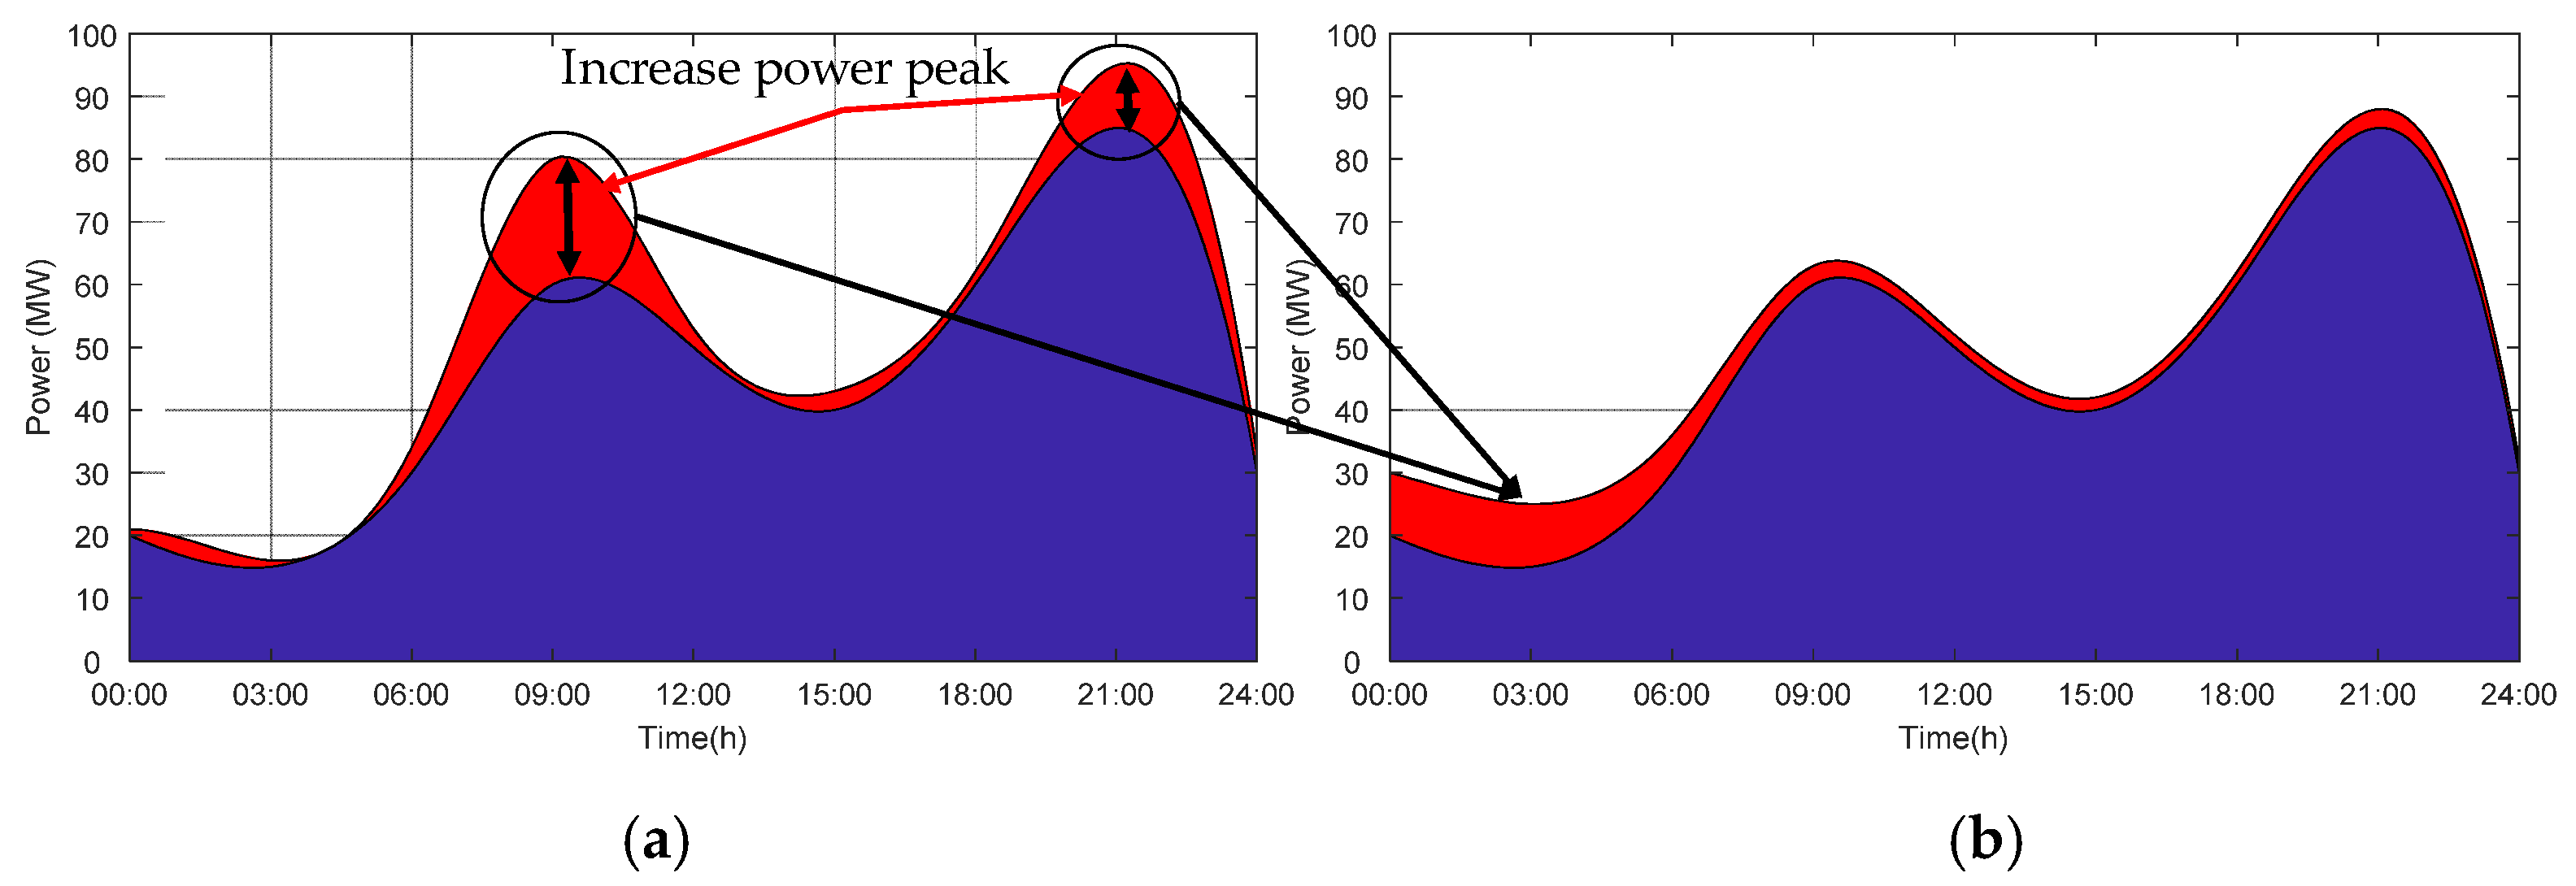
Nevertheless, the charging of EVs will become a serious issue and will increase the burden on the public grid, as EV stock continues to grow and expand. The charging of EVs during the day will increase the peak load, as shown in
Figure 1a. However, EVs are considered a flexible load unlike uncontrollable loads; therefore, the charging of EVs can be controlled and shifted to other times to prevent the peak load by implementing a smart charging framework, for example, overnight charging as shown in
Figure 1b. However, this can constrain EV users, whose behavior is hard to predict and control.
To overcome this constraint, the EVs can charge with photovoltaic (PV) energy which is a reliable and effective option, to reduce the burden on the public grid [
2]. Thus, while the EVs are being charged with green energy [
3,
4], the EV market will be encouraged since EVs contribute to minimizing the impact of transportation on the environment [
3,
5,
6].
Different charging/discharging frameworks of EVs exist [
7]:
Uncontrolled charging: the EV starts charging immediately until its battery is fully charged or the EV user unplugs their vehicle [
8]. This framework can be expressed as uncoordinated charging or immediate charging where the EV is charged at maximum power with no restrictions [
9,
10]. In this framework, there is not any interaction between the EV users and the electrical grid. This is the worst scenario since it charges the EV with the maximum power to be fully charged in the shortest time imposing difficulties on the grid and peak load [
11].
Delayed charging: when the park time (time duration for an EV parked in a station) is longer than the actual required time of charging, therefore, the EV charging can be delayed taking into account the time of use price and can be charged during the low-cost and off-peak energy period [
8,
9].
Average charging: the EV is charged at constant power depending on the park time in which the EV is able to meet the requested state of charge (SOC) or full SOC, where it is not necessary to charge with full power [
9,
10,
11].
Smart charging: the EV users provide the public grid with information regarding the park time and the requested charge that must be supplied before leaving the station. Therefore, renewable energies are used first to supply the load then the public grid will control and shape the EV charging profiles and minimize the charging costs [
8].
Smart discharging: known as vehicle-to-grid, the EVs act as stationary storage allowing to discharge power back to the public grid [
8]. This will improve the electrical grid efficiency and reliability.
Delayed charging can be considered as a smart charging framework, since it changes the charging start time, charging end time, and charging power, yet most importantly delivering the requested energy to the EV. Additionally, the average charging can be considered as an uncoordinated charging framework, since it starts charging immediately when the EV is plugged-in but with limited power [
11]. The delayed charging profile is similar to the uncontrolled charging profile but the peak load is shifted to overnight/dawn (around 5:00 a.m. and 9:00 a.m.). Whereas, in average charging, the profile is flattened instead of having a peak [
9].
Uncoordinated charging of EVs may increase the peak load, imposing a heavy burden on the public grid leading to more losses. Therefore, through smart charging or coordinated charging, EVs can be an asset for the grid by helping to increase penetration of renewable energies, balancing the energy system, and improving the efficiency of the system while satisfying EV user demands [
12]. Coordinated charging is classified into two types, time coordinated charging and power coordinated charging as in [
13]. In time coordinated charging, the number of EVs that can charge is controlled to ensure the total load demand is within the available power for EV charging. Whereas, in power coordinated charging, the power of EV charging is controlled to ensure the total load demand is within the available power for EV charging.
The most important parameters in EV modeling are the charging/discharging rate, initial SOC, battery capacity, charge depleting distance, and user behavior, which is hard to predict in advance. In addition, the arrival time at the charging station, the departure time, and the driving distance of the EV are variables, depending on user habits. They can, however, be assumed and follow probability distribution functions [
10,
14]. For this purpose, probability distribution functions are generated to determine the arrival time at the charging station, the departure time, and the driving distance of the EV. Then, the energy needed to fully charge the EV is calculated and the total charging time of the EV is the energy needed to fully charge the EV over the charging rate [
10,
14,
15].
Since the EV market is growing vastly, many research studies are expanding, in this field, especially regarding the charging process for EVs. A home-scale EV charging station based on natural gas has been proposed in [
16]. They have compared, environmentally and financially, their scheme with a conventional vehicle, fossil fuel-based, having the same characteristics and with an EV charged directly from the public grid. They have shown that with the EV charged with natural gas, no fossil fuel is required, it has zero carbon emissions, and the EV charged by natural gas or electricity is cheaper than oil/petrol over a year. In [
17], the minimum size and cost of a charging station for EV fleets has been studied in two urban areas in Europe, as well as the impact of the charging station on the electrical grid in terms of power and energy demand. Their analysis has identified some policies and highlighted that the critical barrier for charging station deployment in urban areas could be the time required to implement charging stations. In [
18], the authors have proposed an EV charging control scheme from the grid operator perspective rather than the EV user. They have proposed a method to change indirectly the route of the EV using dynamic pricing to improve the system operation, keep the voltage stable, and meet charging demands. The optimal operation of a DC microgrid-based EV charging station using mixed-integer linear programming has been studied in [
19]. The operation aimed to optimize the daily operating cost, based on PV production forecast and EV needs. In [
20], the authors have studied a bi-level planning model of charging stations, by establishing a travel pattern model based on a Monte Carlo simulation and driving data of EVs. They aimed at satisfying the needs of EV users and minimizing the total social cost. The authors of [
21] have designed the aspects and presented the practical implementation of a solar-assisted EV charging station. A smart charging strategy has been presented in [
22] for a plug-in EV network that provides different charging options; battery swapping facilities at the charging station, AC level 2 charging, and DC fast charging. The strategy aimed at finding the optimal charging station considering the minimum driving time, charging cost, and charging time. In [
23], the authors have evaluated the factors affecting the EV charging demand and predicted the charging demand of various EVs under different circumstances; such factors are driver behavior, electricity pricing, location of charging stations, social characteristics of the EV user, and economic elements. Their results contributed to identifying optimal locations for charging stations to maximize their utilization. The authors of [
24] have analyzed competitive interactions for different EV charging stations with renewable energy sources using a game-theoretical analysis. The objective is to maximize the revenue of each EV charging station, subject to physical constraints. Their results have shown that EV charging stations equipped with renewable energy sources decrease the electricity price and increase the revenue of the EV charging station. An EV charging station based on PV sources, stationary storage, diesel generator, and a public grid connection has been implemented in [
25]; so it can operate in three modes: grid-connected, islanded operation, and diesel generator set connected. Their test results have proved the capability of the EV charging station under different conditions. In [
26], a real-time rule-based algorithm has been proposed for the operation of a DC microgrid-based EV charging station with imposing charging power limit depending on power availability. They have focused on the management strategy for the EV charging station, highlighting the interaction with EV users. Their results have proved the feasibility of the intelligent management proposed, including EV shedding and EV restoration priority, and its efficiency in considering user choices.
In [
27], the authors have proposed an optimization problem to reduce the stress on the grid and to reduce the cost of consumed energy. They have proposed a model predictive to forecast EV’s power demand. They have proposed to charge the EVs by PV, storage, and grid instead of directly feeding the EVs from the grid. In [
28], the authors have investigated peak load reduction using PV, storage, and a vehicle-to-grid strategy for EVs. They have focused on increasing the capacity of the storage to decrease the grid dependency. The authors of [
29] have investigated the charging of EVs using PV energy in the workplace. They have studied the optimal sizing of storage to make the charging station grid-independent. However, these articles did not propose different charging modes for the EVs, they have focused on reducing peak load demand or reducing the cost of energy consumed by the grid rather than increasing the PV benefits for the EV users. Moreover, the energy distribution system and energy distribution for each EV are not depicted in these papers.
However, to the extent of our knowledge, the previously cited references have not discussed the preliminary requirements and feasibility conditions for an EV charging station, while satisfying EV user needs and the factors that can influence their choice to increase PV benefits and lower their charging cost from the public grid.
In previous studies, home charging represents 75% of EV charging time, the longest duration of vehicle dwelling time, and workplace charging represents 14% of EV charging time. These two locations have the largest opportunity for charging [
9]. EV users tend to charge their EV based on their convenient time and place rather than what the public grid operators prefer and when the electricity price is cheap to prevent negative impact on the public grid [
11].
In this paper, the goal is to define the preliminary requirements and feasibility conditions for PV-powered EV charging stations in an urban area and to emphasize the importance of a business model that can influence the EV users’ behavior. The main contributions of this work are:
A PV-powered EV charging station model is proposed, which consists of PV sources, stationary storage system, public grid connection, and EVs. This model satisfies the EV user demands while improving PV-benefits for EVs.
A proper power flow management is proposed for the PV-powered EV charging station. The priority order is PV sources, stationary storage, and lastly, the public grid connection for charging EVs. In addition, PV sources inject power first to the stationary storage and then to the public grid; in the case of PV excess energy.
An EVs energy distribution method is proposed to calculate the portion of consumed energy for each EV from each power source. In addition, energy system distribution is calculated to specify the portion of energy charged/injected into the power source and energy discharged/supplied from the power source.
This paper is organized as follows,
Section 2 describes the charging infrastructures for an electric vehicle,
Section 3 presents the driving characteristics and charging load profiles,
Section 4 presents the PV-powered EV charging stations simulation results and discussion, and
Section 5 concludes this paper with perspectives.
2. Charging Infrastructures for Electric Vehicle
The charging infrastructures rely on the relations between driving needs, charging equipment usage, EV stock, and technical capabilities. Population density, driving range, and charging behavior are specific factors that have direct implications on the geographical location of the EV supply equipment and on the charging rates, for electric low-duty vehicles. Two charging modes, slow and fast charging [
30,
31], are presented in this paper, which denotes the charging rate for an EV.
Slow charging is mostly rated at 3 kW, but in reality, it is ranged between 1.8 kW and 6 kW. Charging time depends on the charging rate and the EV energy capacity, thus, a full charge takes 6–12 h for 3 kW. Slow chargers are common for most EVs, they can be found everywhere, e.g., at home, workplace, and public places. EV users tend to charge at home overnight for long charging.
Fast charging is typically rated from 7 kW up to 22 kW (single or three-phase 32A), where charging an EV with 40 kWh capacity takes 4–6 h with 7 kW and 1–2 h with 22 kW. The majority of fast chargers provide AC charging, however, some infrastructures are equipped with 25 kW DC chargers with CHAdeMO connectors. Fast chargers can be found in public places, such as shopping centers, car parks, workplaces, supermarkets, train stations, and airport parking.
The sizing and characteristics of PV-powered EV charging stations depend on the PV installation (parking shade or building-integrated PV), solar irradiation potential, stationary storage, and the adopted business model. The viability of well-designed PV-powered EV charging stations depends on social acceptance, PV benefits, and the business model.
Private chargers stand for 90% of global EV chargers in 2019, as profitability, convenience, and various supports and incentives are the main motivations of the universality of private chargers [
32]. The preferred locations are home and private workplaces to charge the EV. The infrastructure for home charging is a compatible electric socket and charger plug, which already exists in homes. Nearly 60% of EV users have access to private chargers in China based on The China EV Charging Infrastructure Promotion Agency recent report in 2019 [
31]. The EVs consume approximately 75% of energy from private charging at home and at the workplace, in the United States, United Kingdom, and the European Union [
33].
4. PV-Powered EV Charging Stations Power Flow Management
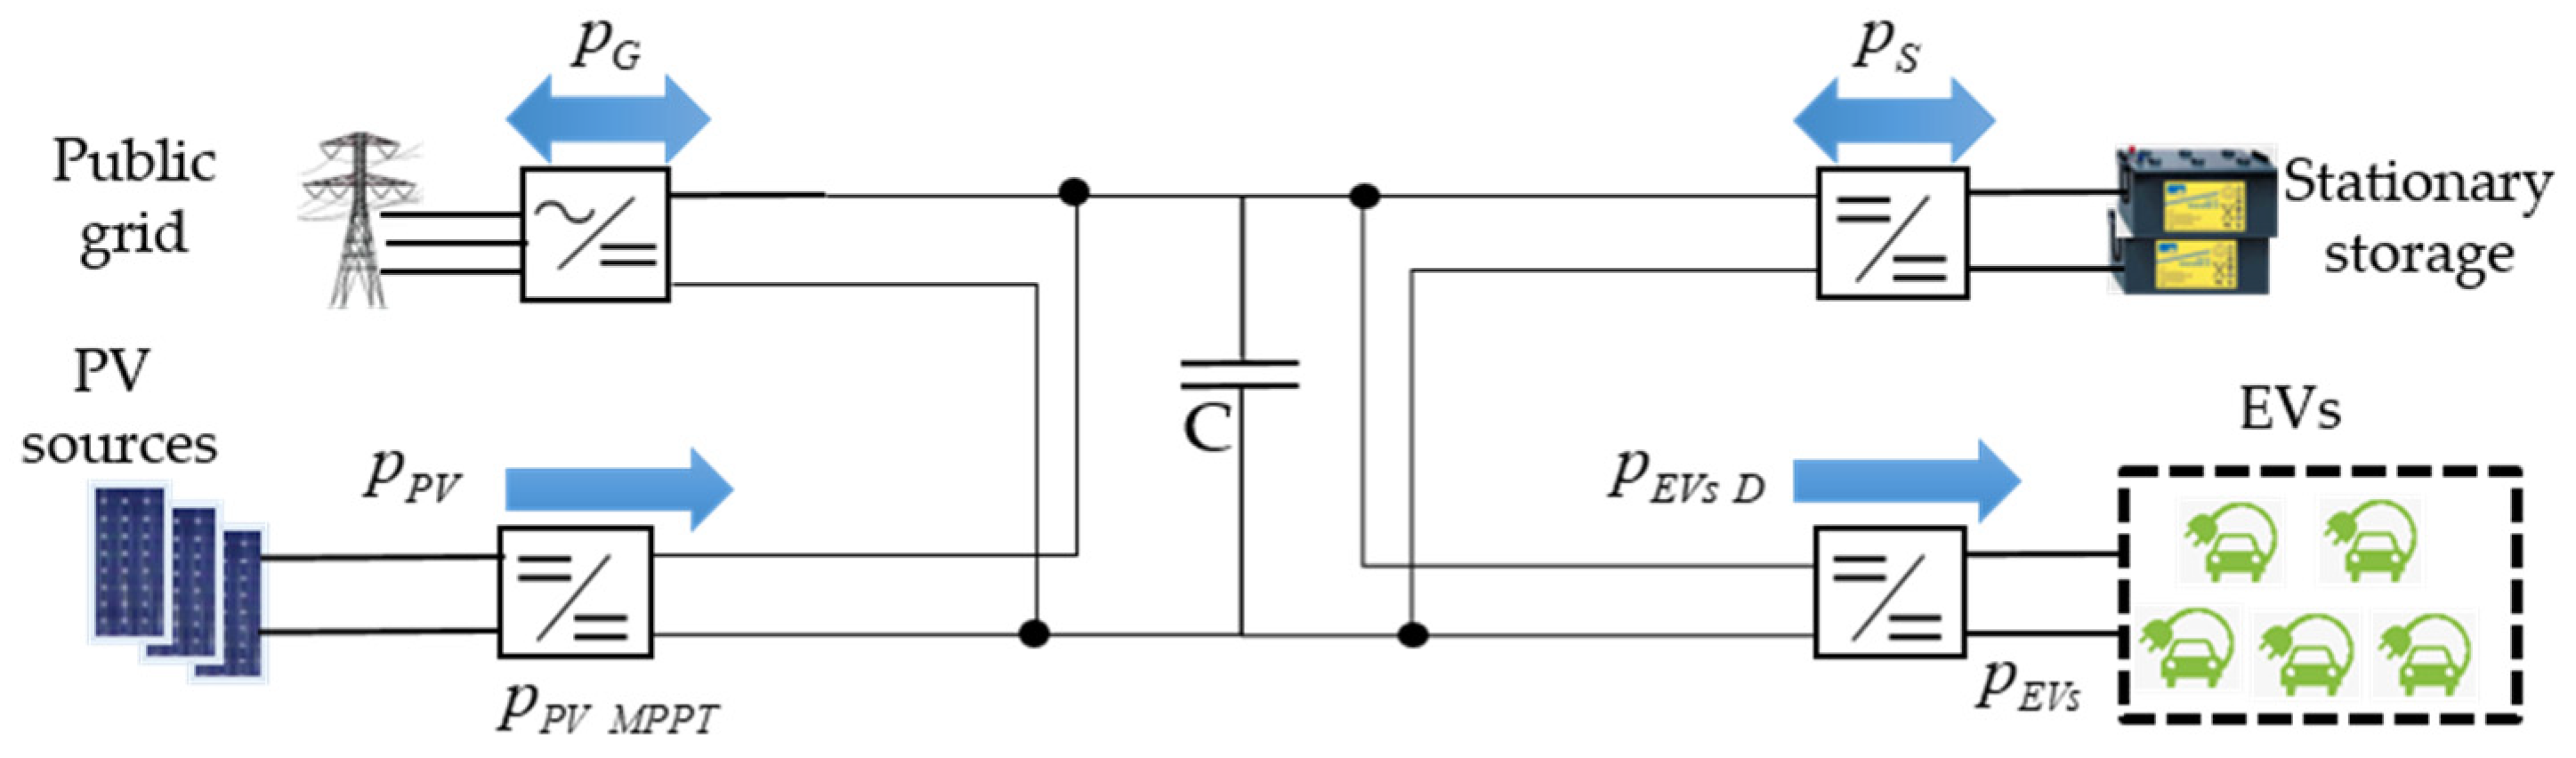
The EV charging station considered in this paper is PV-powered including stationary storage and public grid connection, modeled using MATLAB/Simulink R2015b as illustrated in
Figure 3.
Where
is the PV power in maximum power point tracking (MPPT) mode,
is the PV power,
is the public grid power,
is the stationary storage power,
the EVs total demand power, and
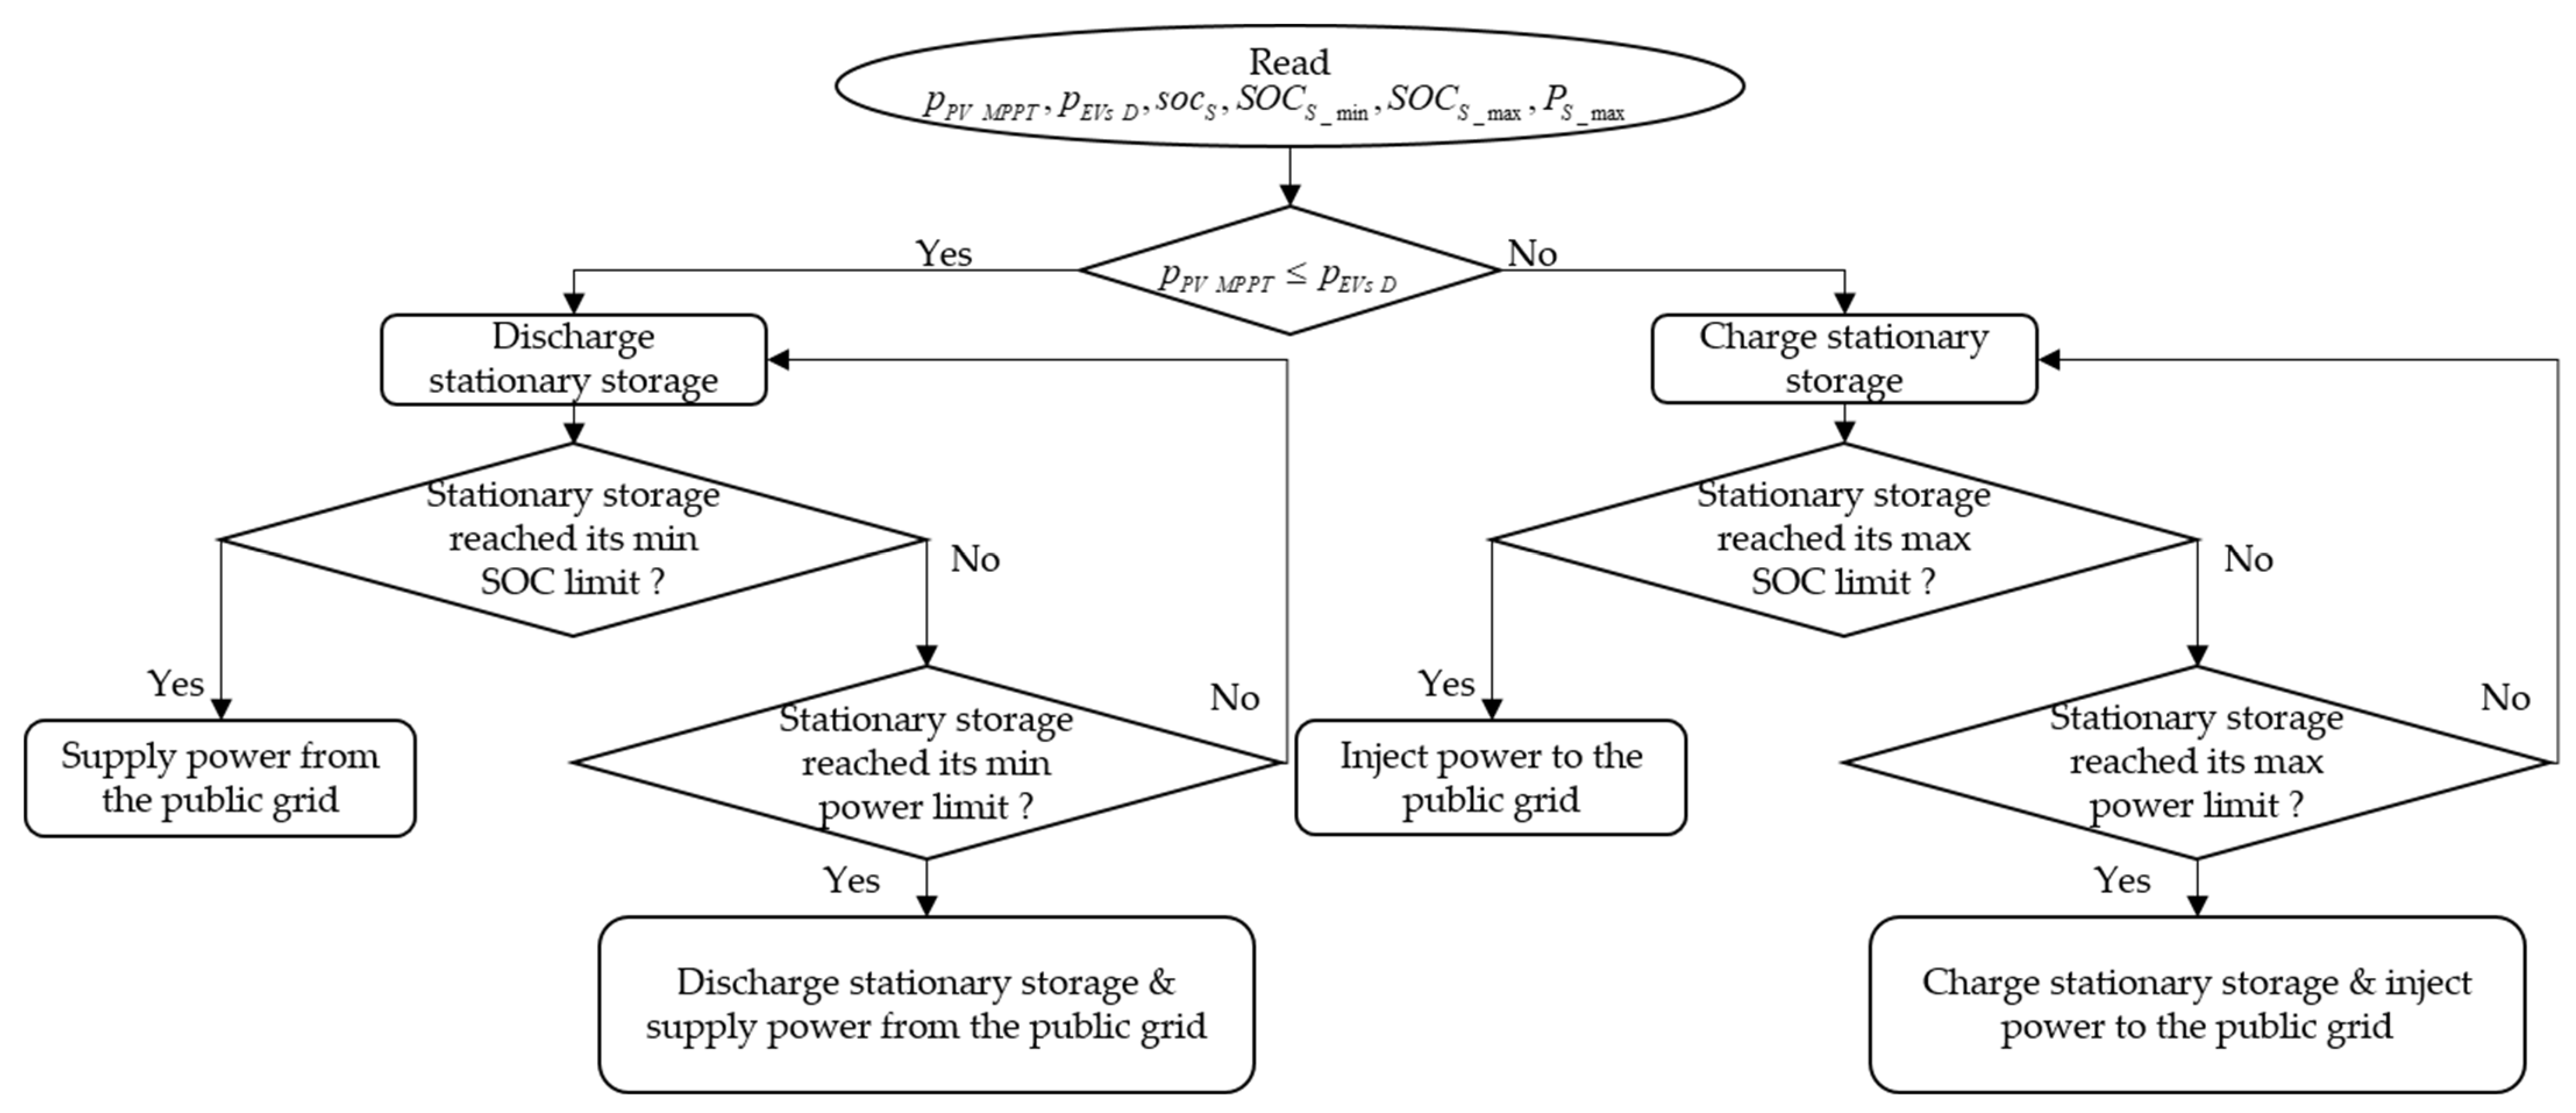
is the total EVs power. The public grid can absorb or supply power. The capacitor C represents a common DC bus, where the components of the charging station are coupled through their dedicated converters. PV sources are connected to the DC bus through the DC/DC converter to extract the MPPT power. The stationary storage is needed to construct the DC microgrid and it is connected through a reversible DC/DC converter. The DC load, represented by the EVs’ batteries, is connected through the DC/DC converter. The public grid connection is required to ensure power at all times and mitigate the power difference between the power production and the load demand; it is connected through a three-phase bidirectional AC/DC converter. The stationary storage is charged by PV sources only and can discharge power to the DC common bus. The energy management strategy, as shown in
Figure 4, follows the priorities: PV is the first energy source to charge EVs, then stationary storage is the second energy source, and the public grid is the last energy source to charge EVs. Stationary storage is charged with excess energy produced by PV sources and the public grid by excessive energy from PV sources when the stationary storage reaches its maximum limits (power or state of charge).
The design of the PV-powered charging station is based on a DC microgrid, as shown in
Figure 3. Therefore, it is required to keep the power balance [
35] given by (1):
where
,
,
, and
are continuous time, initial time instant, time interval between two samples, and time instant at the end of time operation respectively.
The PV power is calculated in MPPT mode,
, [
36] as given by (2) and (3):
where
is the PV power under standard test conditions (STC),
is the solar irradiation,
is the power temperature coefficient,
is the PV cell temperature,
is the number of PV panels,
is the ambient temperature,
is the nominal operating cell temperature,
is the fixed air temperature, and
is the fixed solar irradiation for testing.
A simplified state of charge of the stationary storage [
37],
, is used as in (4) for its simplicity, where self-discharge and temperature are not taken into account, and the over-charging/discharging protections [
35] are expressed by (5) and (6):
where
is the initial
,
is the energy capacity (kWh) of the stationary storage,
,
are
maximum and minimum limits, and
is the stationary storage power limit.
Regarding the EV battery, its dynamic state of charge,
, is given by (7):
where
is the index of the EV,
is the state of charge of
vehicle,
is arrival state of charge of
vehicle,
is the EVs total number,
is the EV charging power of
vehicle,
is the energy capacity of
vehicle,
and
are the arrival and departure time of
vehicle respectively.
The EVs are charged using the PV energy, stationary storage energy, and grid energy. The distribution of these energies is calculated as follow by (8)–(10) respectively:
where
,
, and
are the PV energy, stationary storage energy, and public grid energy respectively consumed by
vehicle during the charging period.
5. PV-Powered EV Charging Station Simulation Results and Analyses
This paper presents two case studies for the PV-powered charging stations: PV parking shade for one private charger and PV parking shade for nine chargers at the workplace. The two cases were simulated under the same solar irradiation profile. Regarding the EVs, lithium-ion batteries were considered and it was assumed they have the same battery capacity of 50 kWh, while the driving characteristics and charging profiles covered a daily needed charge of 2–6 kWh, as described in
Section 3, but they are not exclusive.
For all scenarios, the following assumptions were considered:
Charging station location is in Compiegne, France, where the yearly average solar irradiation is not very high;
PV panel is Sunpower SPR X21-345 with 21% efficiency under STC;
Mounting position is fixed and optimized as follows: slope angle 38° and azimuth angle −2°;
System loss was estimated at 14% system loss;
Lead-acid batteries were considered for the stationary storage and its limits were chosen as 20% and 80% for and respectively.
With the objective of determining preliminary requirements and feasibility conditions of PV-powered EV charging stations that may bring some PV benefits, the following subsections present and analyze several scenarios as well as simulation results.
5.1. Case 1—Private Charging Station: PV Parking Shade for One Private Charger
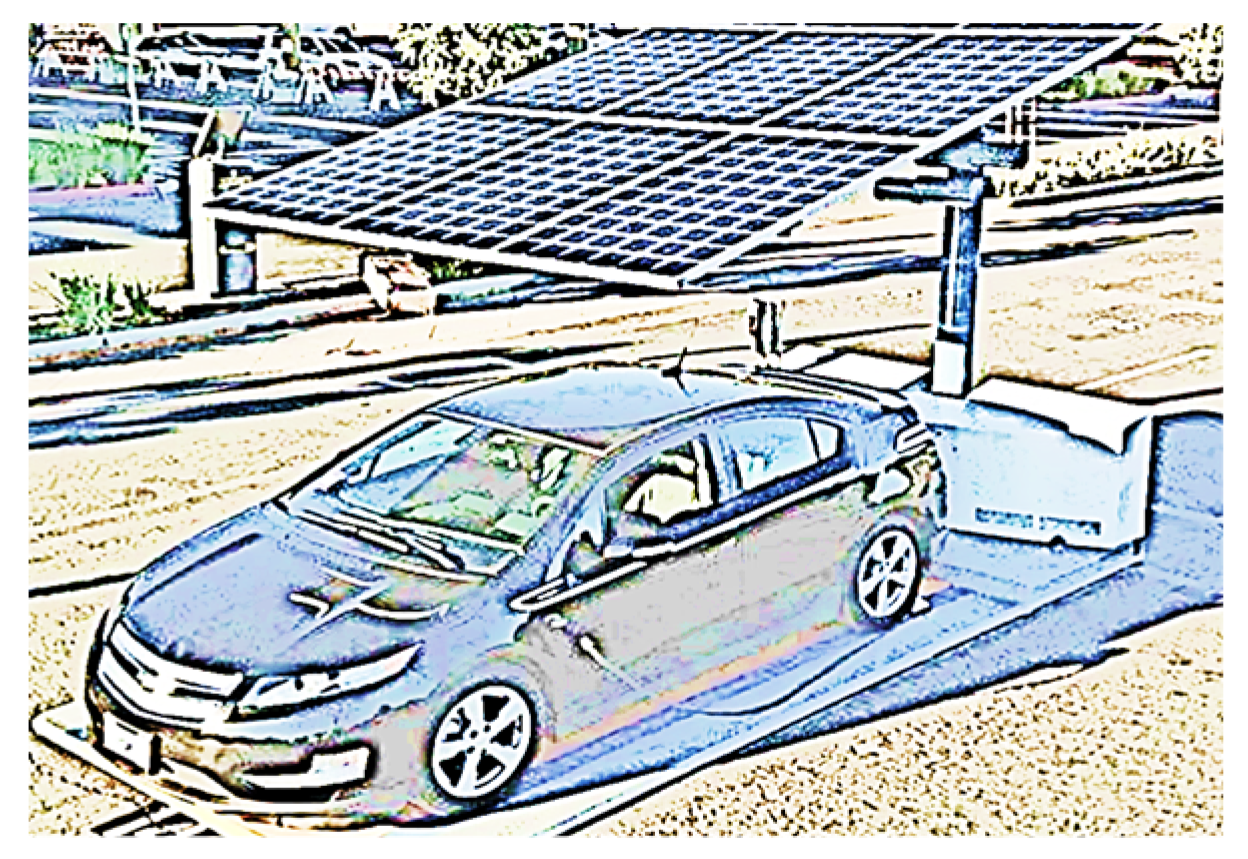
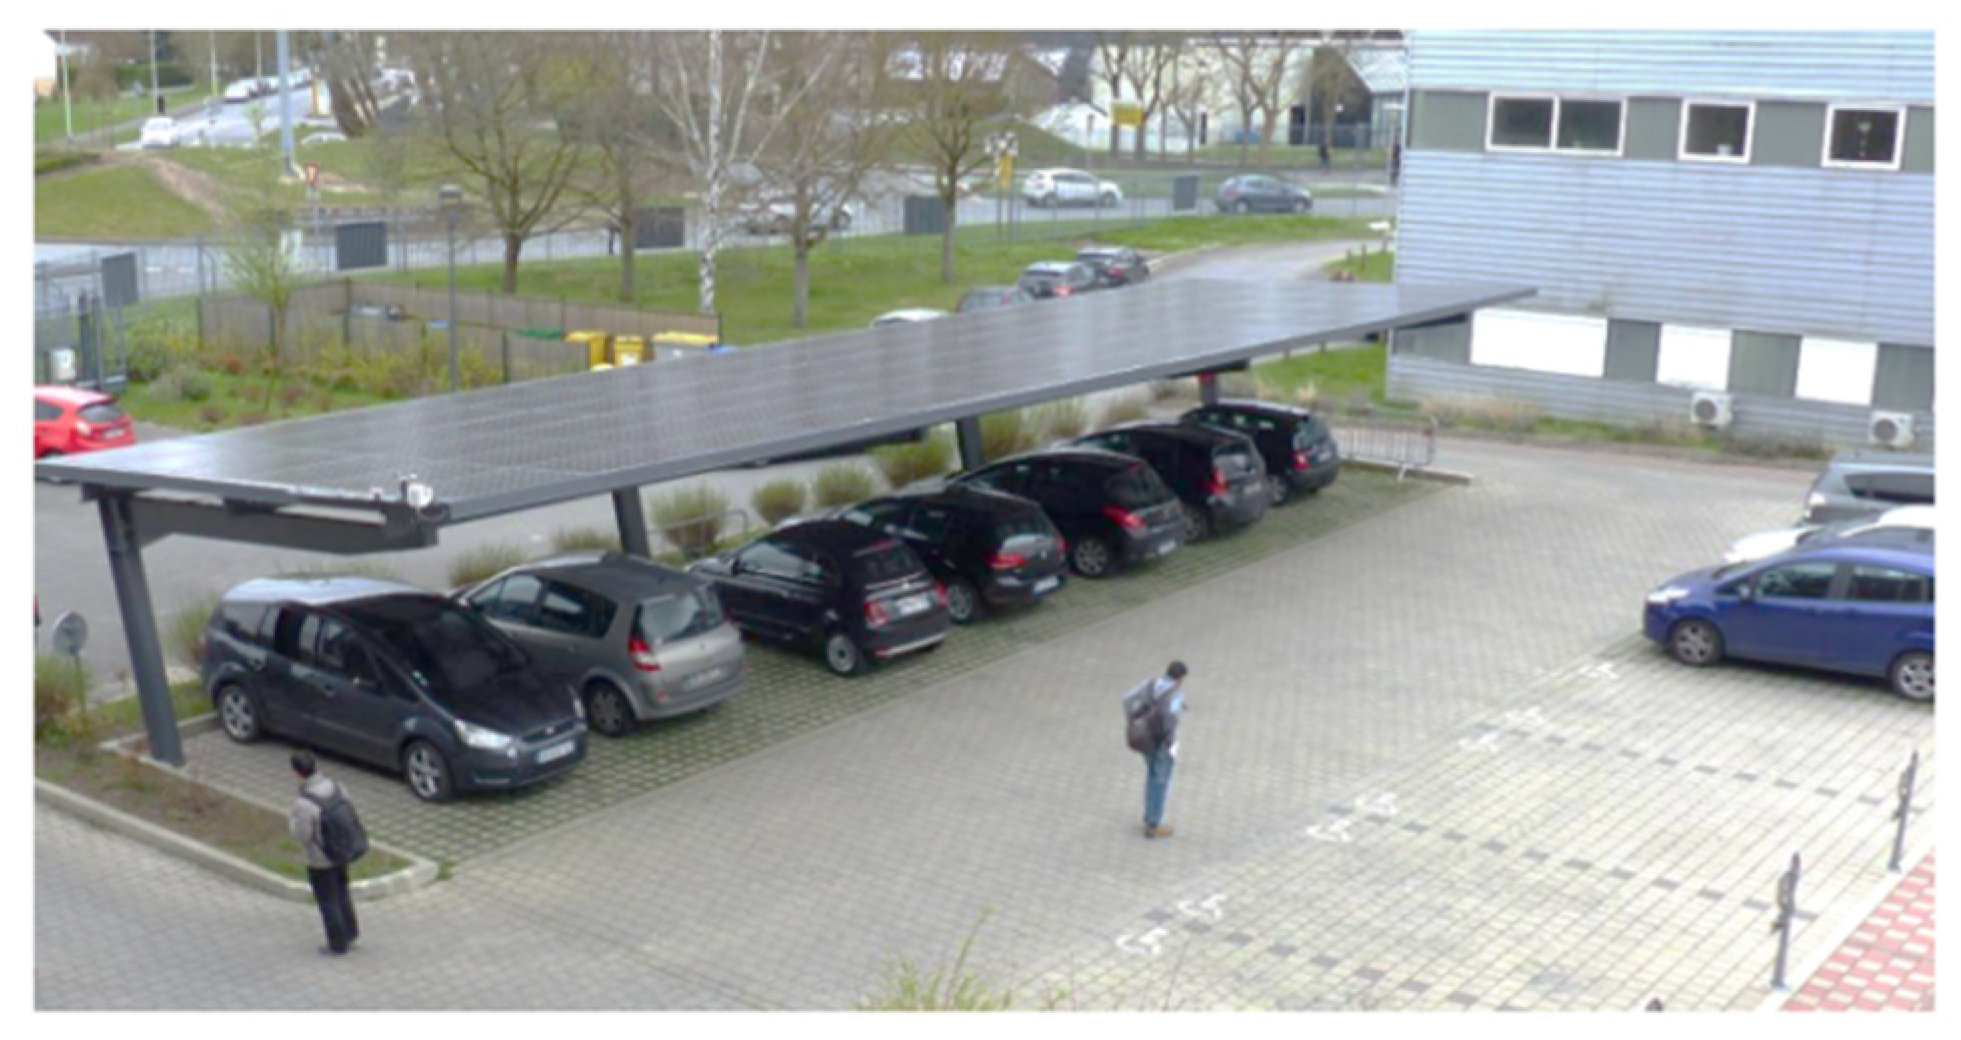
Case 1 considered a PV parking shade of nine PV panels, i.e., 3.1 kWp, like the example illustrated in
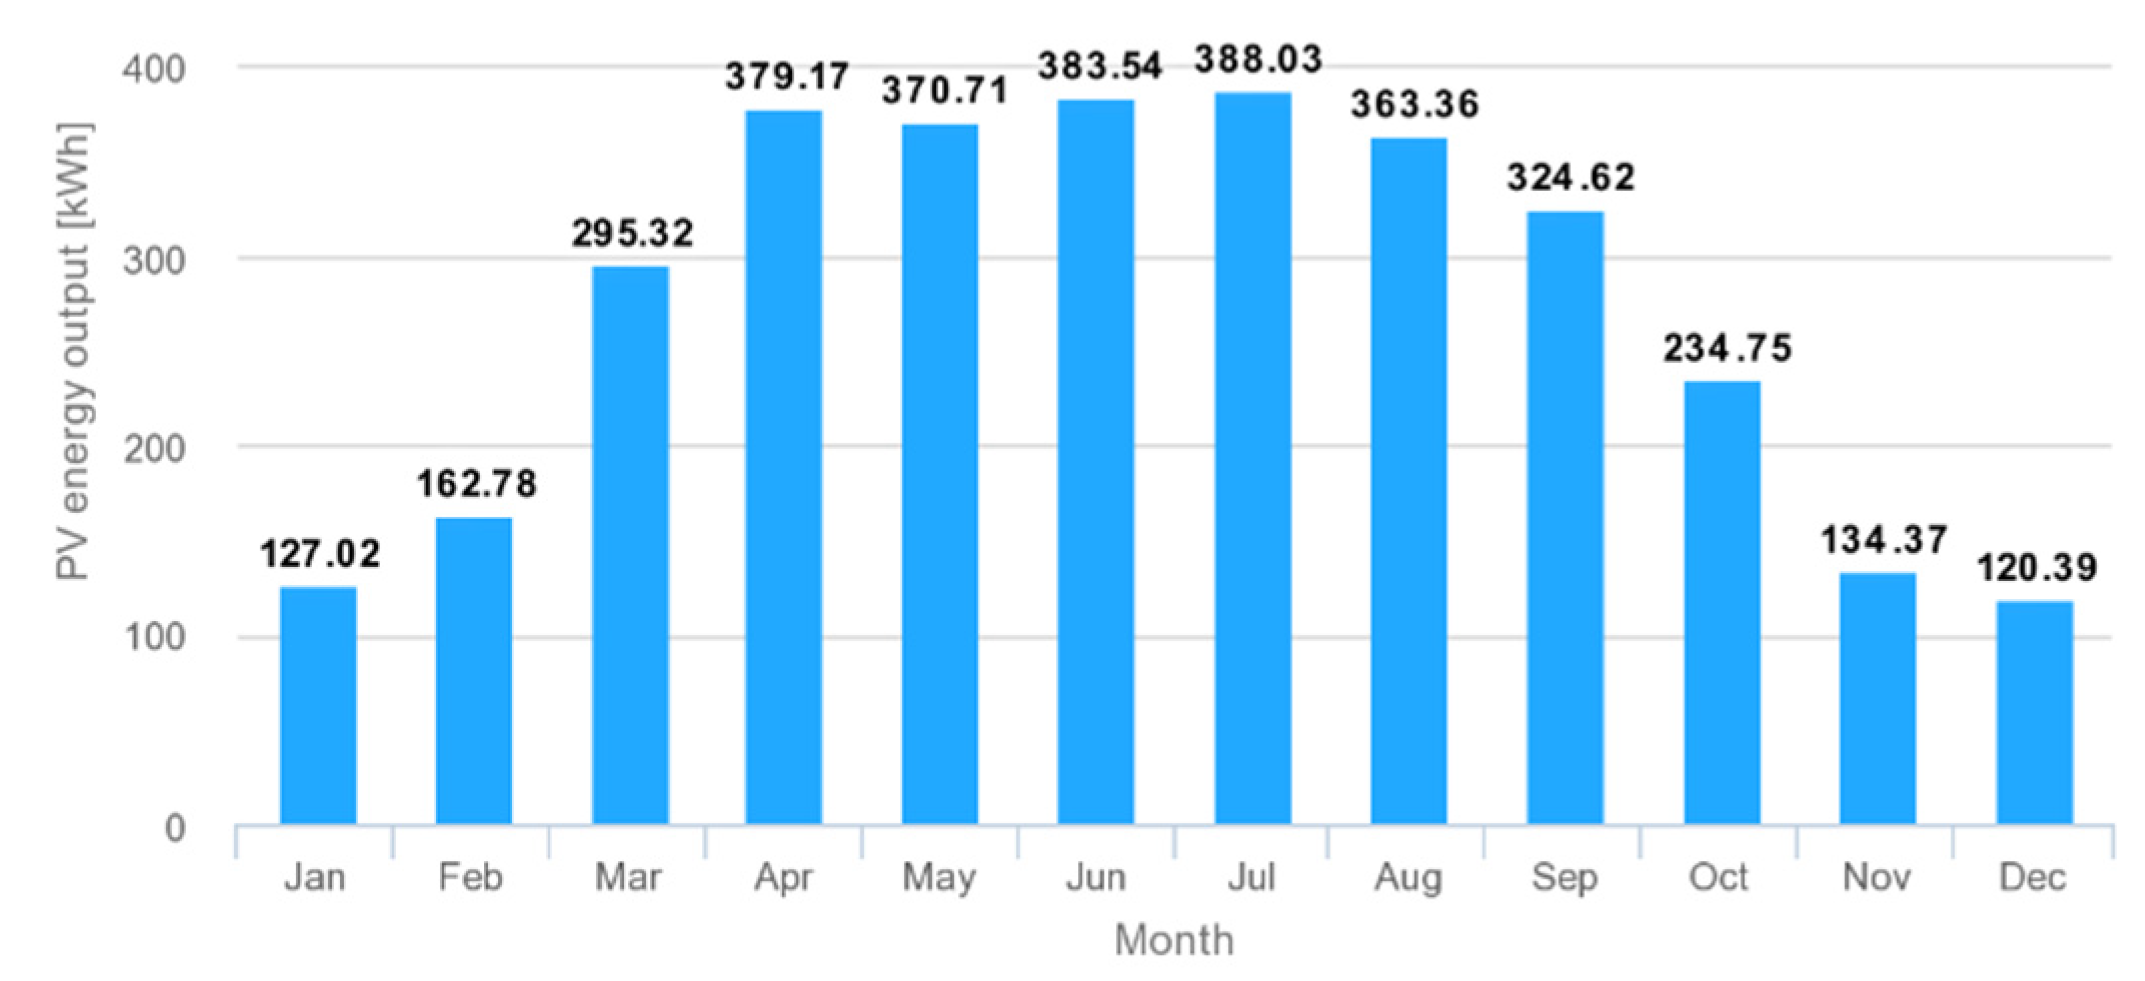
Figure 5. In this case, the lowest monthly PV production is in December, as shown in
Figure 6, with an average daily of 3.88 kWh. To reach 2–6 kWh, stationary storage and public grid connection are required for complementary energy. PV can either charge directly the EV or the stationary storage during the day and thereafter, the stationary storage can charge the EV during the evening/night. For this case, the public grid power limit was set to 9 kVA, the stationary storage capacity and its power limit were chosen 4 kWh and 5 kW respectively.
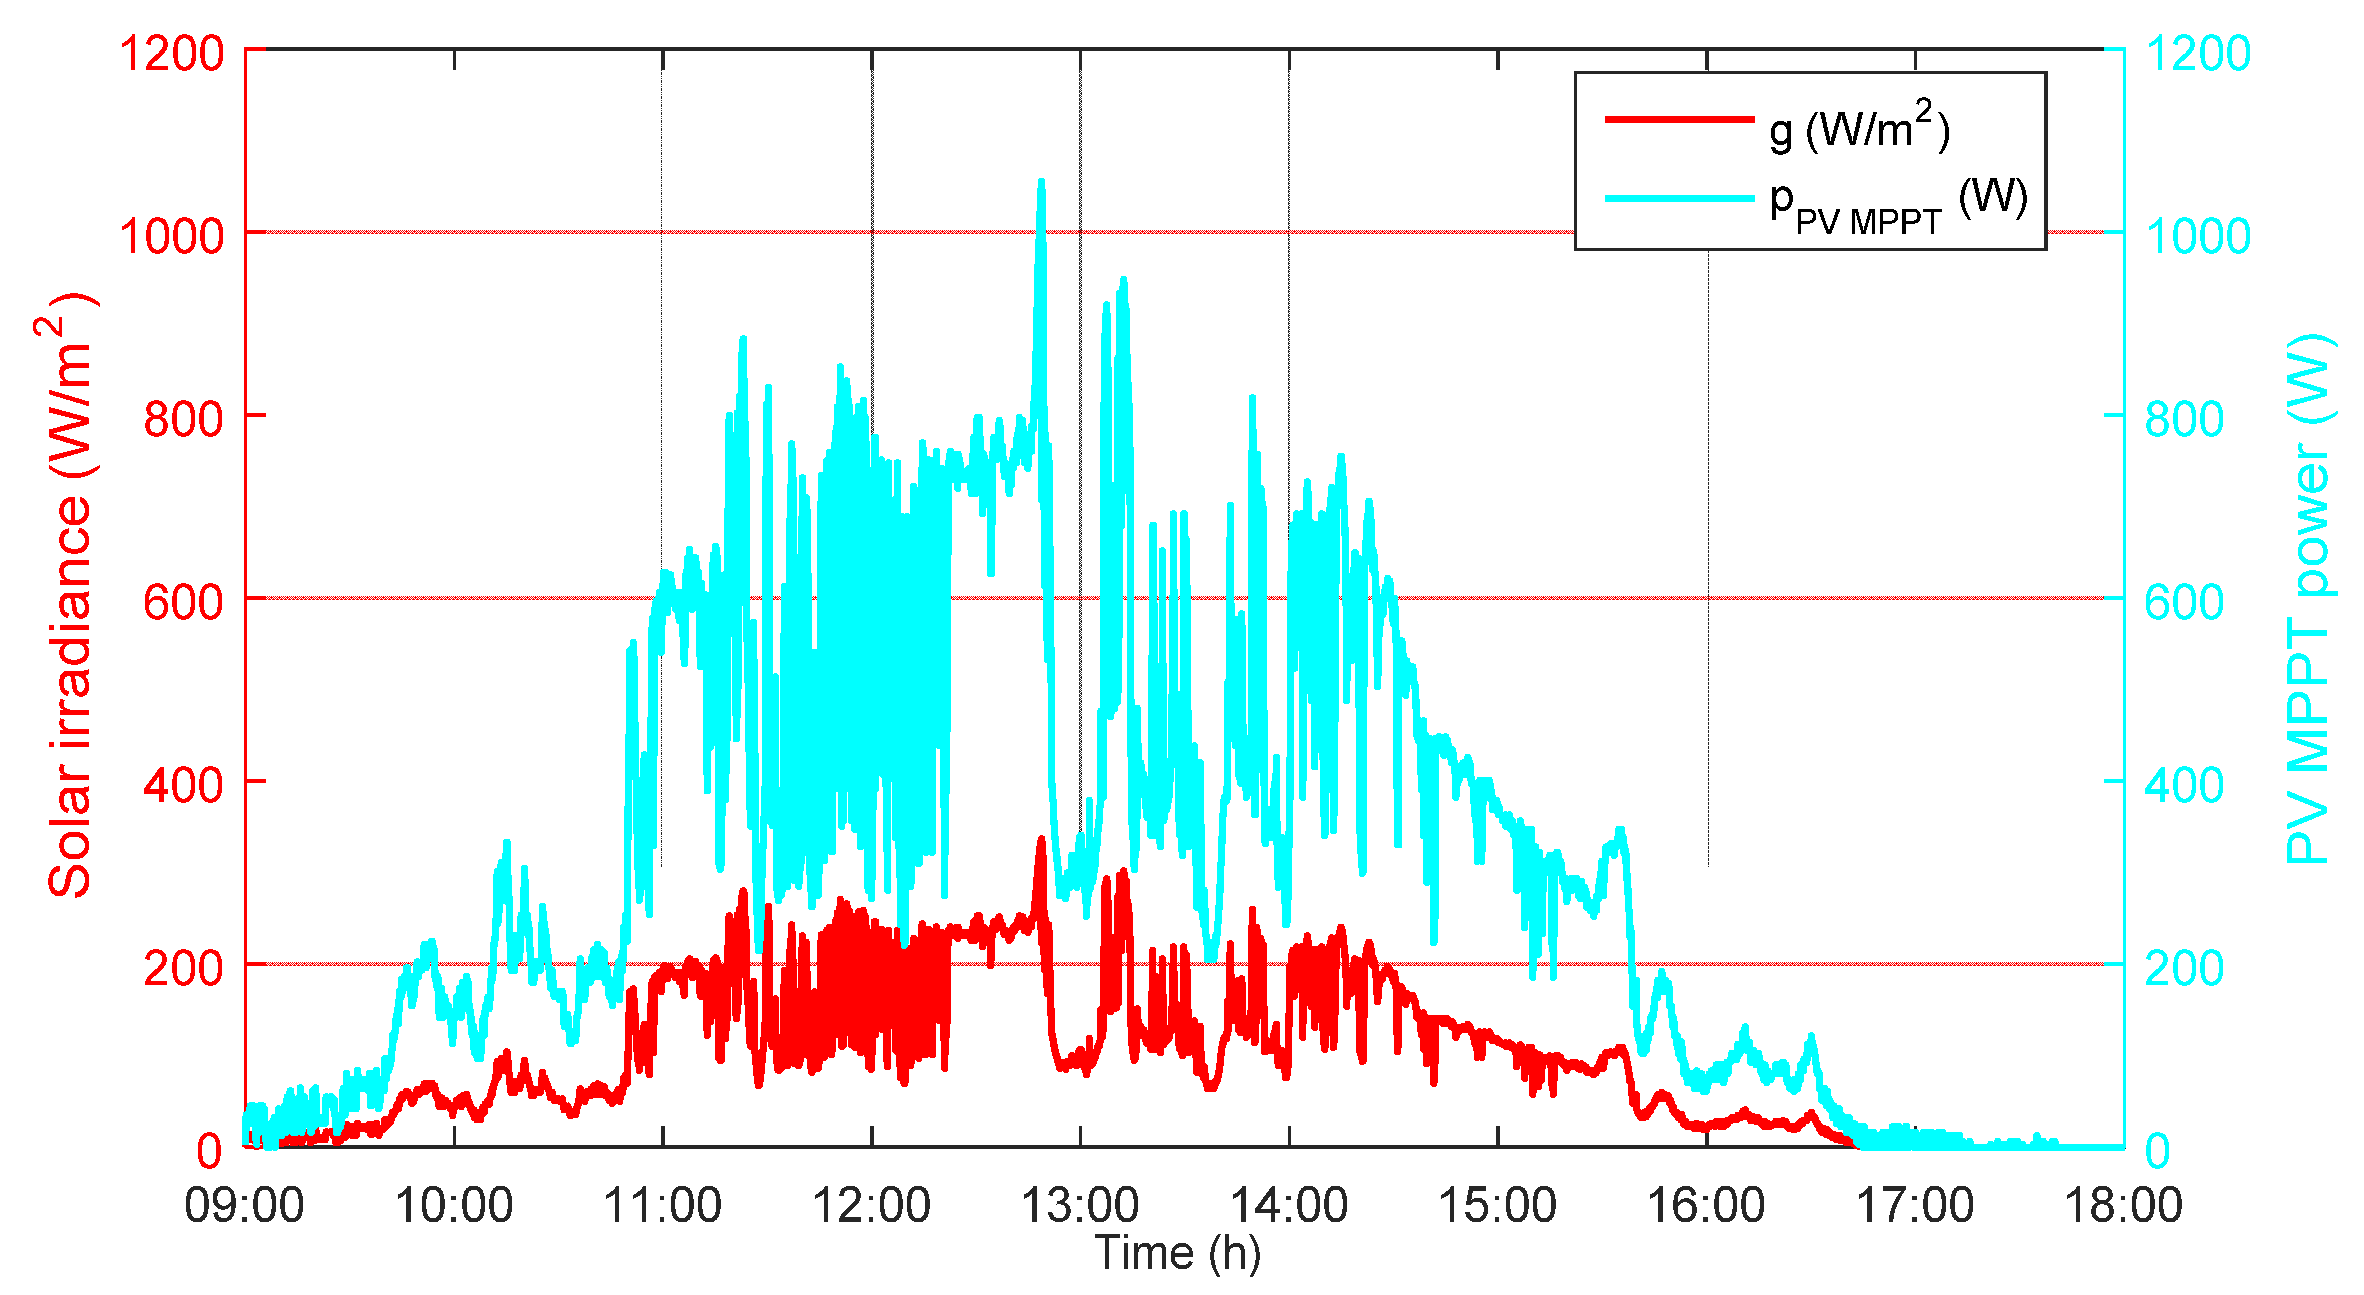
Figure 7 shows the solar irradiation
(W/m
2) and
for 24 December 2019 in Compiegne.
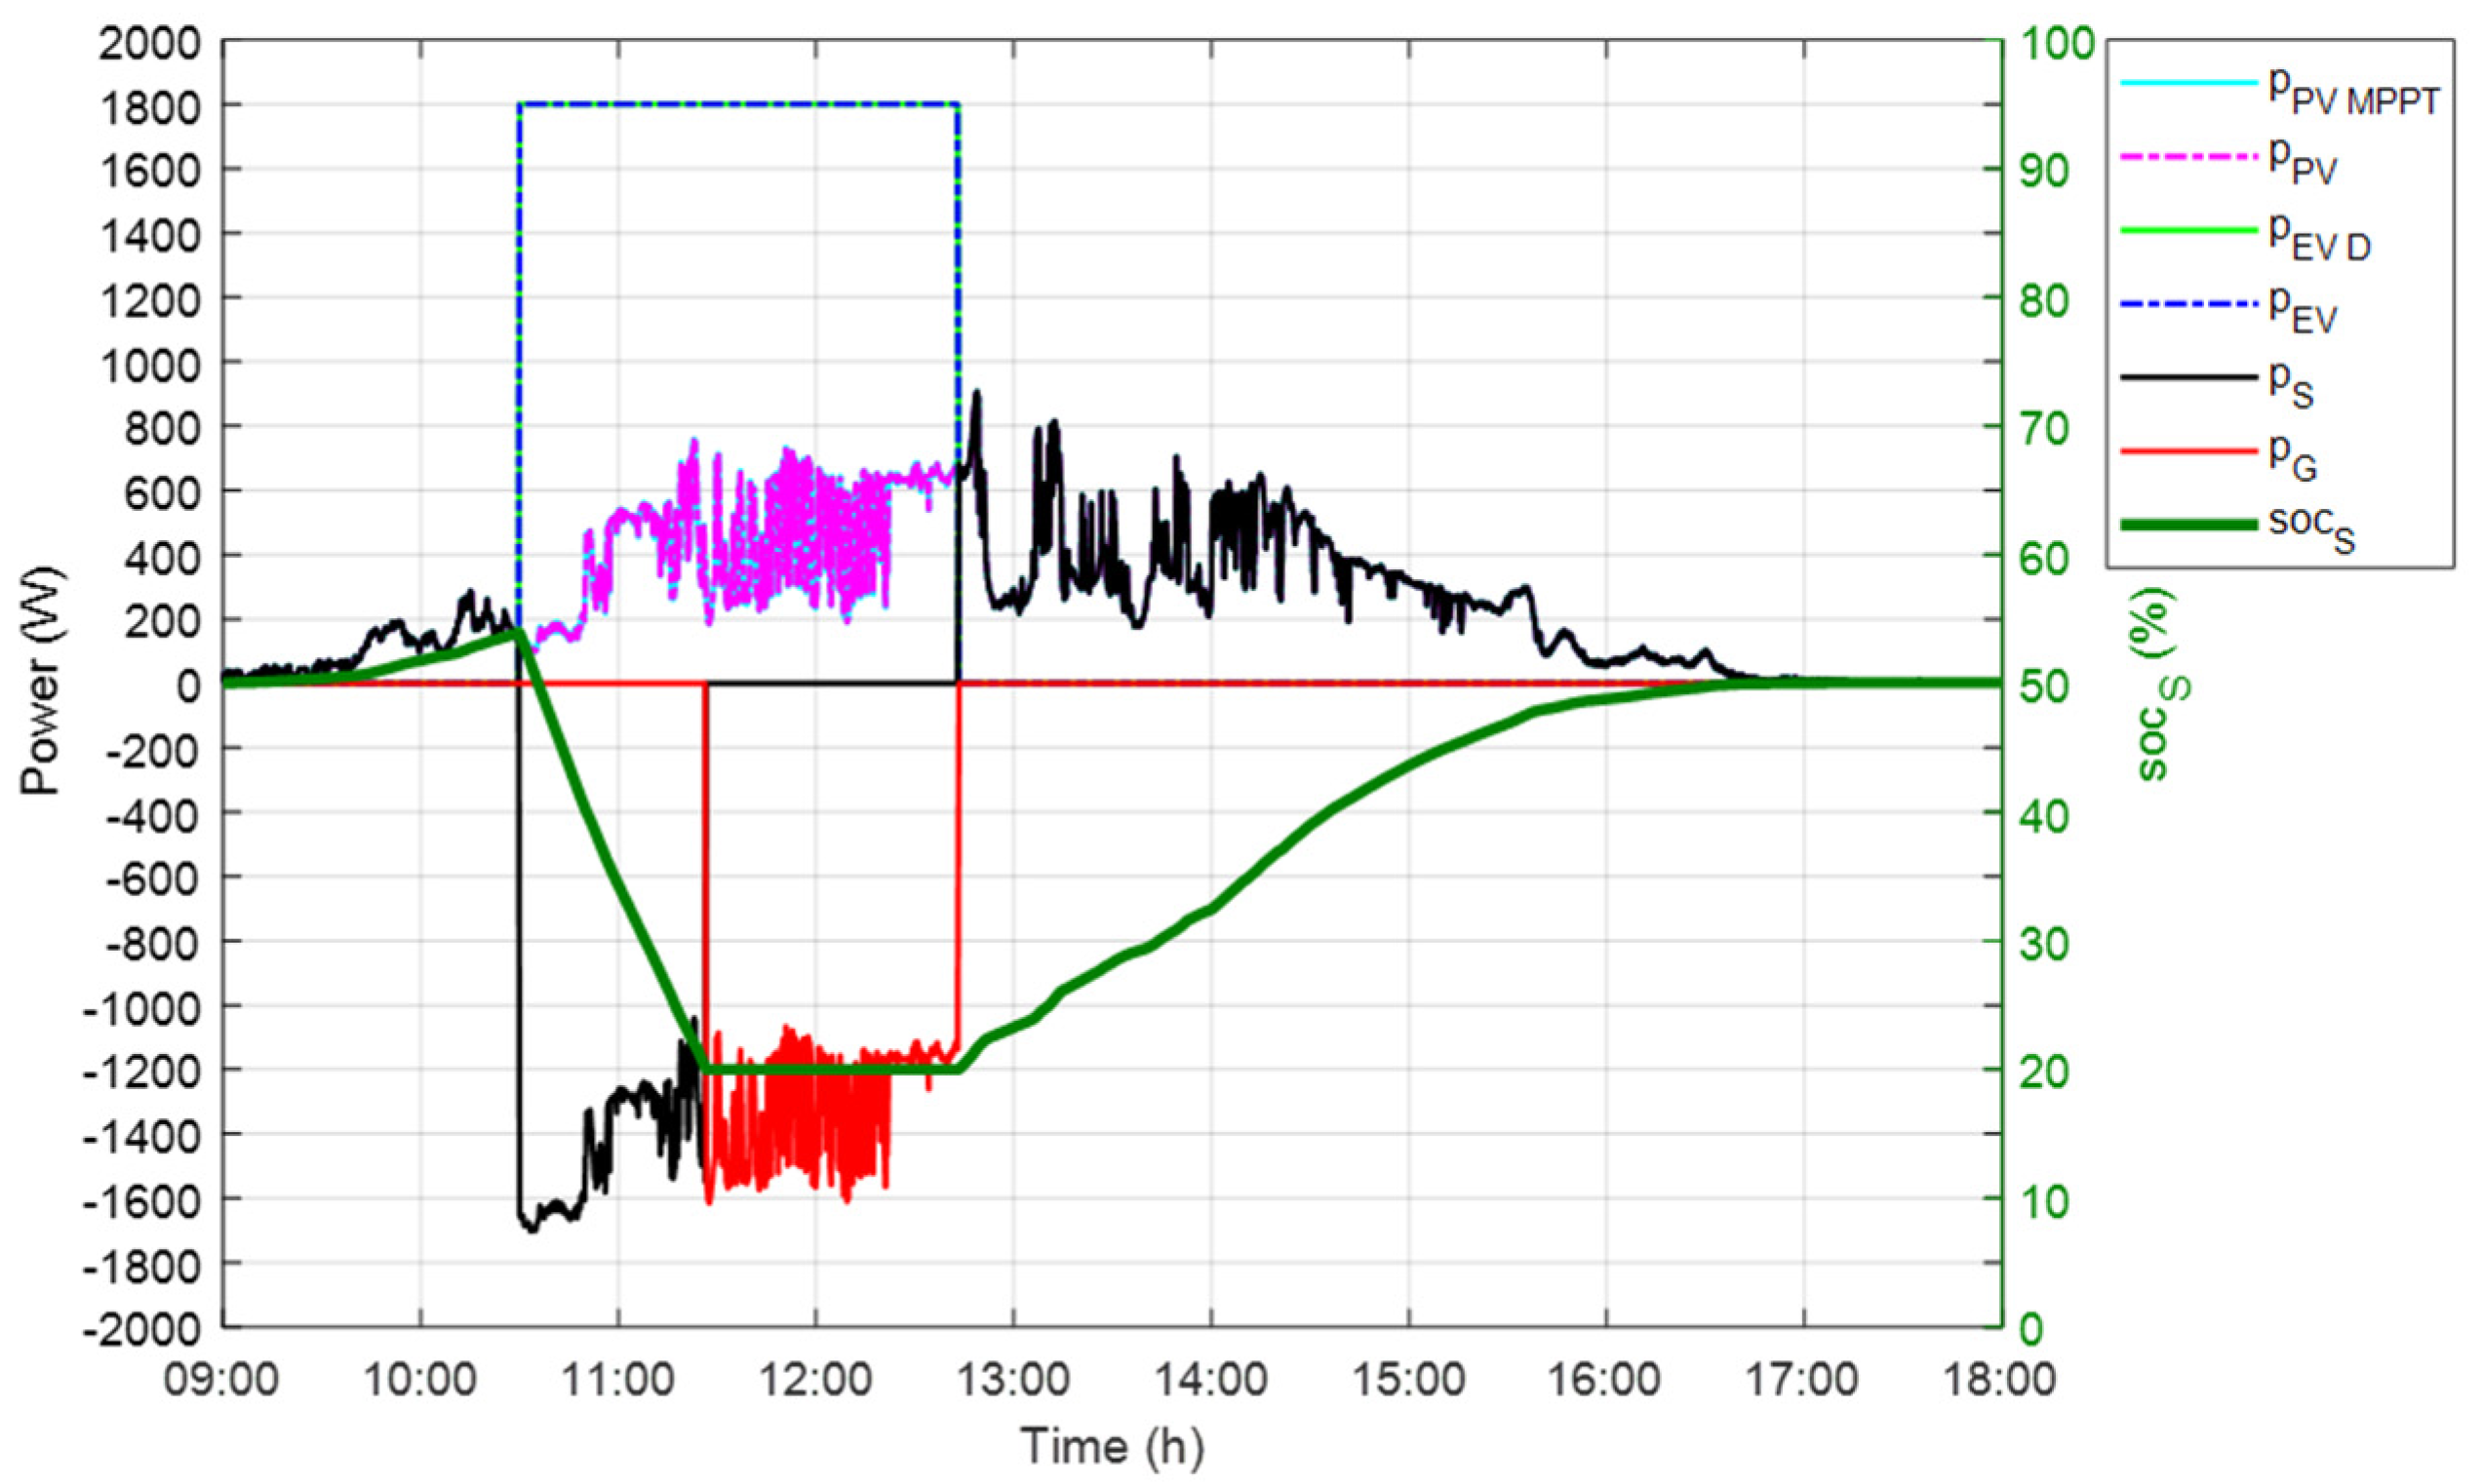
5.1.1. Scenario 1a
The hypotheses for the scenario 1a are shown in
Table 1.
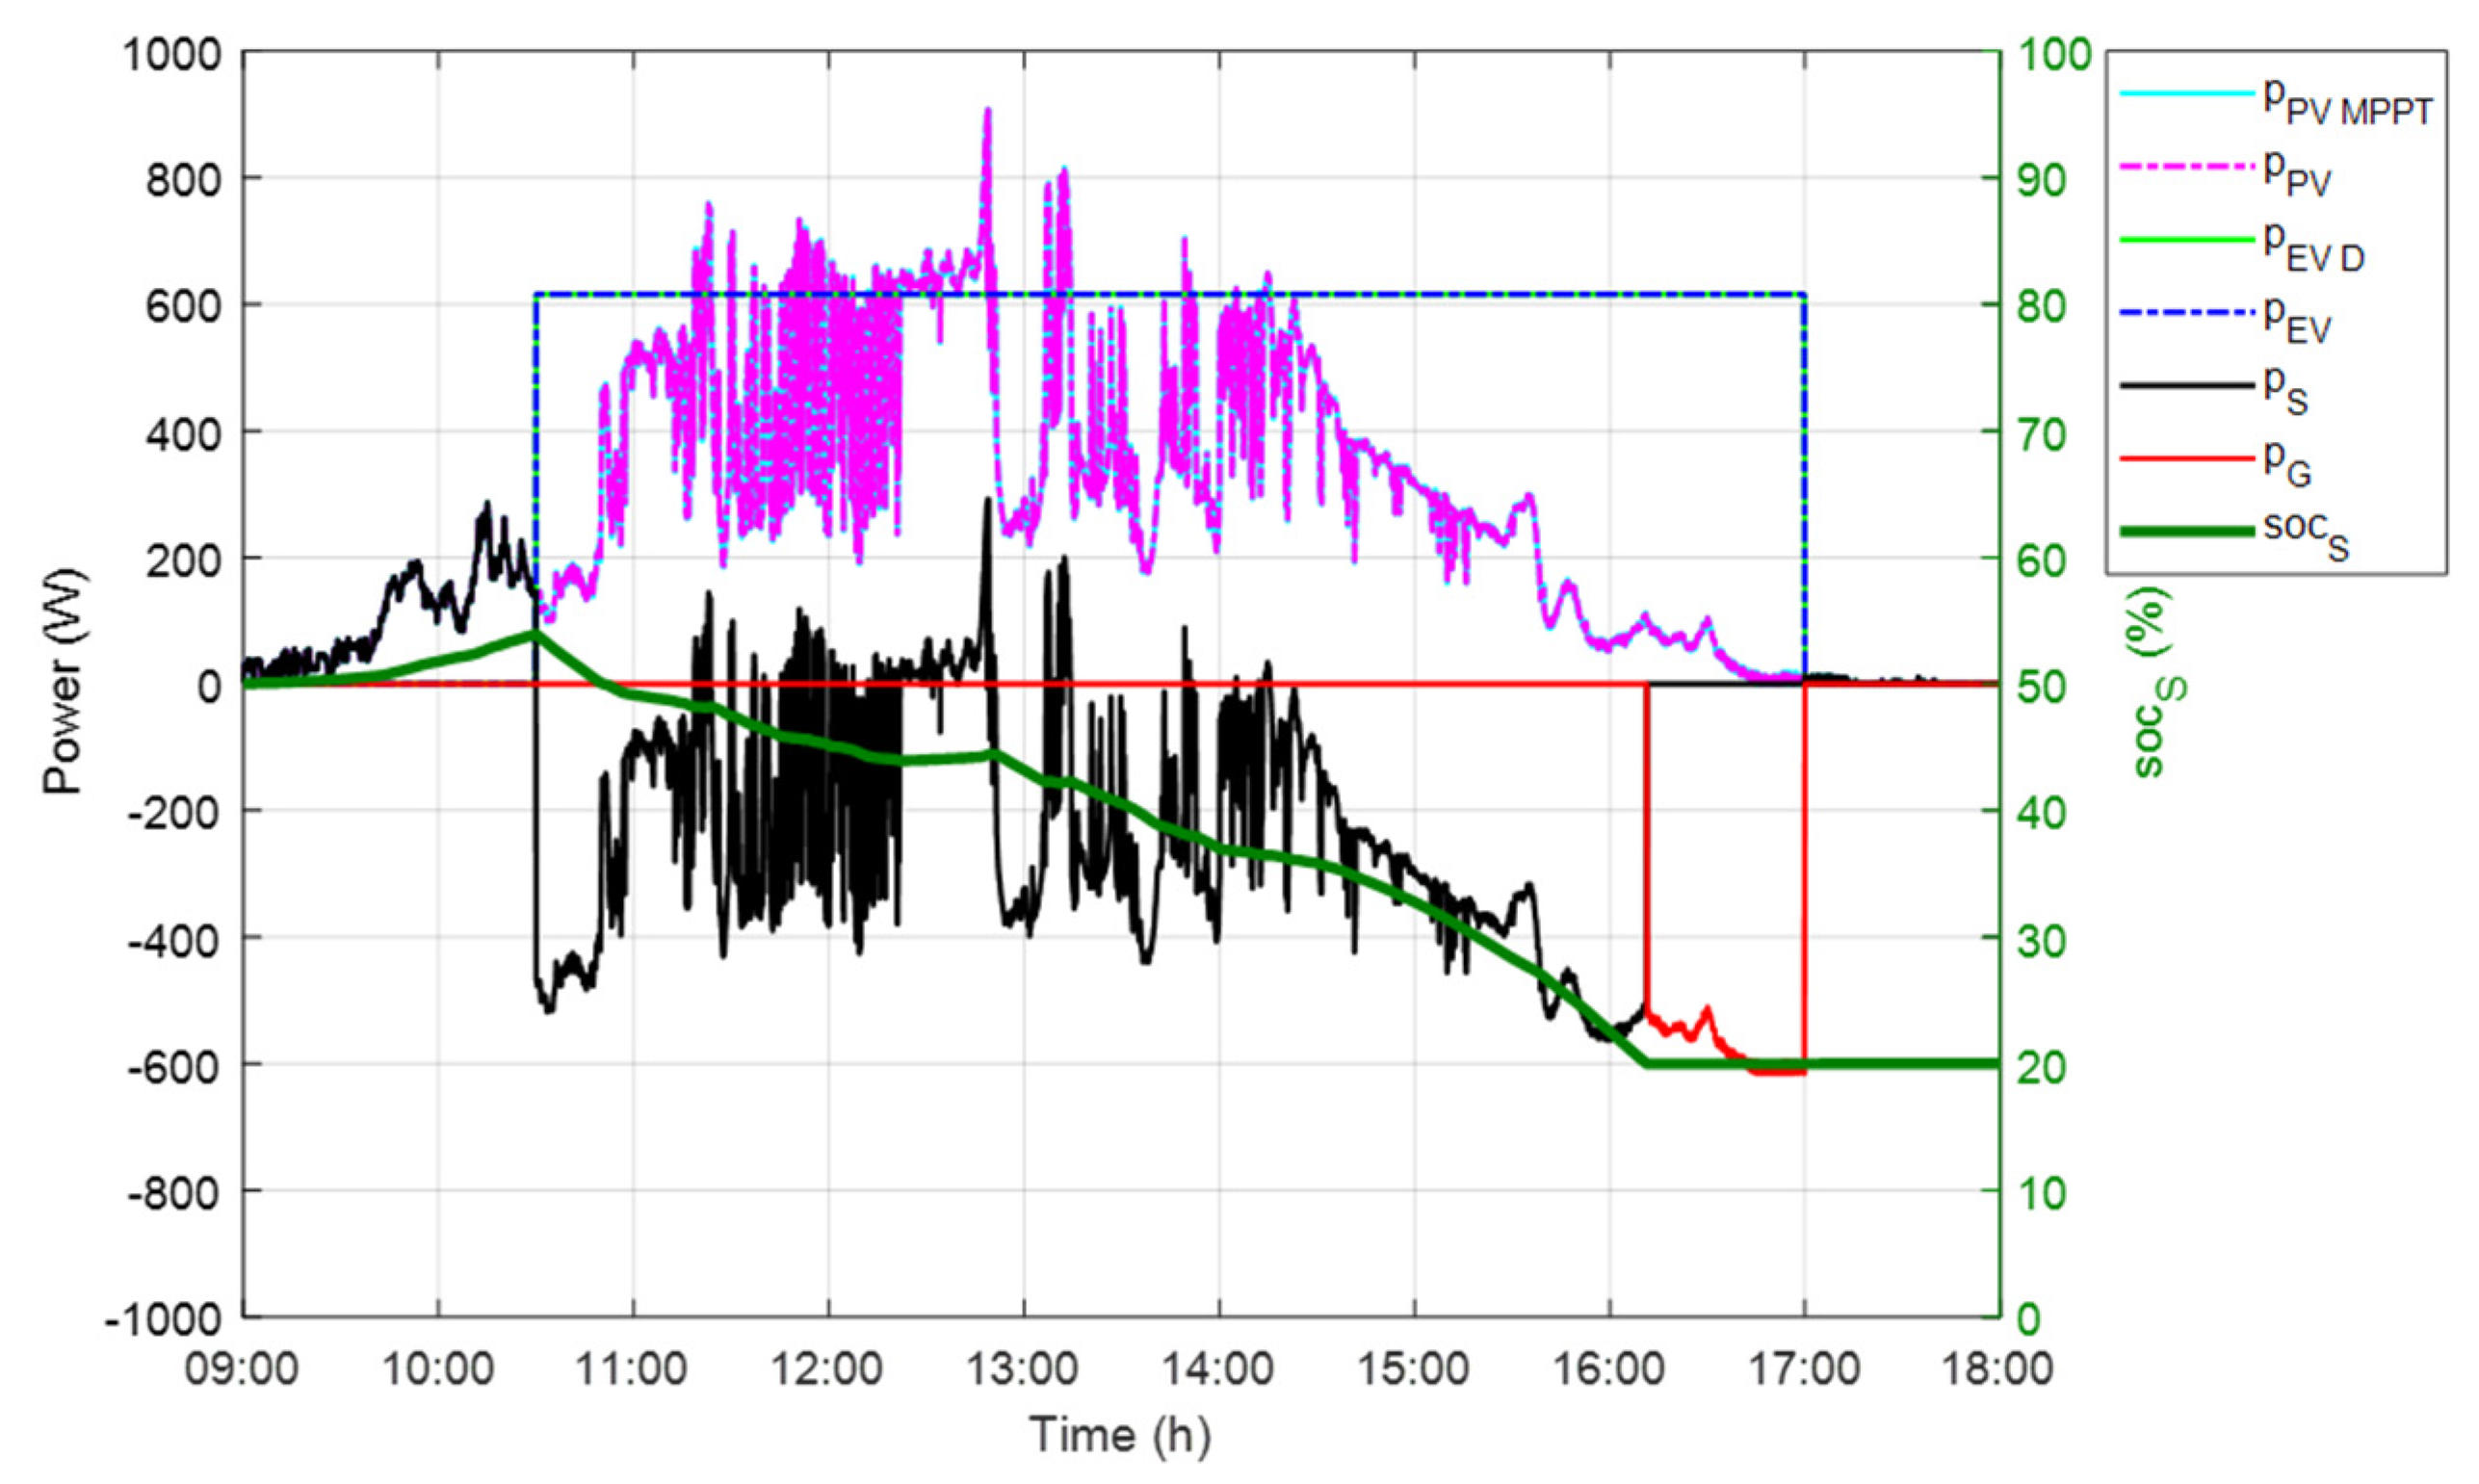
Figure 8 shows the system power flows and the stationary storage SOC evolution.
As PV power was insufficient to fully charge the EV with a constant power of 1.8 kW, the stationary storage charges the EV until it becomes empty, reaching its capacity limit around 11:30, and then the public grid supplies the EV from 11:30 until EV departure. In this scenario, PV energy is not invested well since it charges the EV for a period and the rest of the time, charges the stationary storage. Therefore, scenario 1b proposes a known parking time for the EV to see the impact of PV energy on the EV charging.
5.1.2. Scenario 1b
The hypotheses for scenario 1b is shown in
Table 2. The parking time is the time when the EV is in the charging station.
Based on the hypotheses presented in
Table 2, including the parking time as a known variable, the charging power
is calculated based on Equation (7).
Figure 9 shows the system power flows and the stationary storage SOC evolution.
As the parking time is known and longer than in scenario 1a, the recharging portion from PV has increased, and the stationary storage lasts longer, preventing its fast discharge, thus the dependency on the public grid has reduced. The stationary storage becomes empty, reaching its capacity limit around 16:10 and then the public grid supplies the EV, from 16:10 until EV departure.
5.1.3. Scenario 1a Versus Scenario 1b
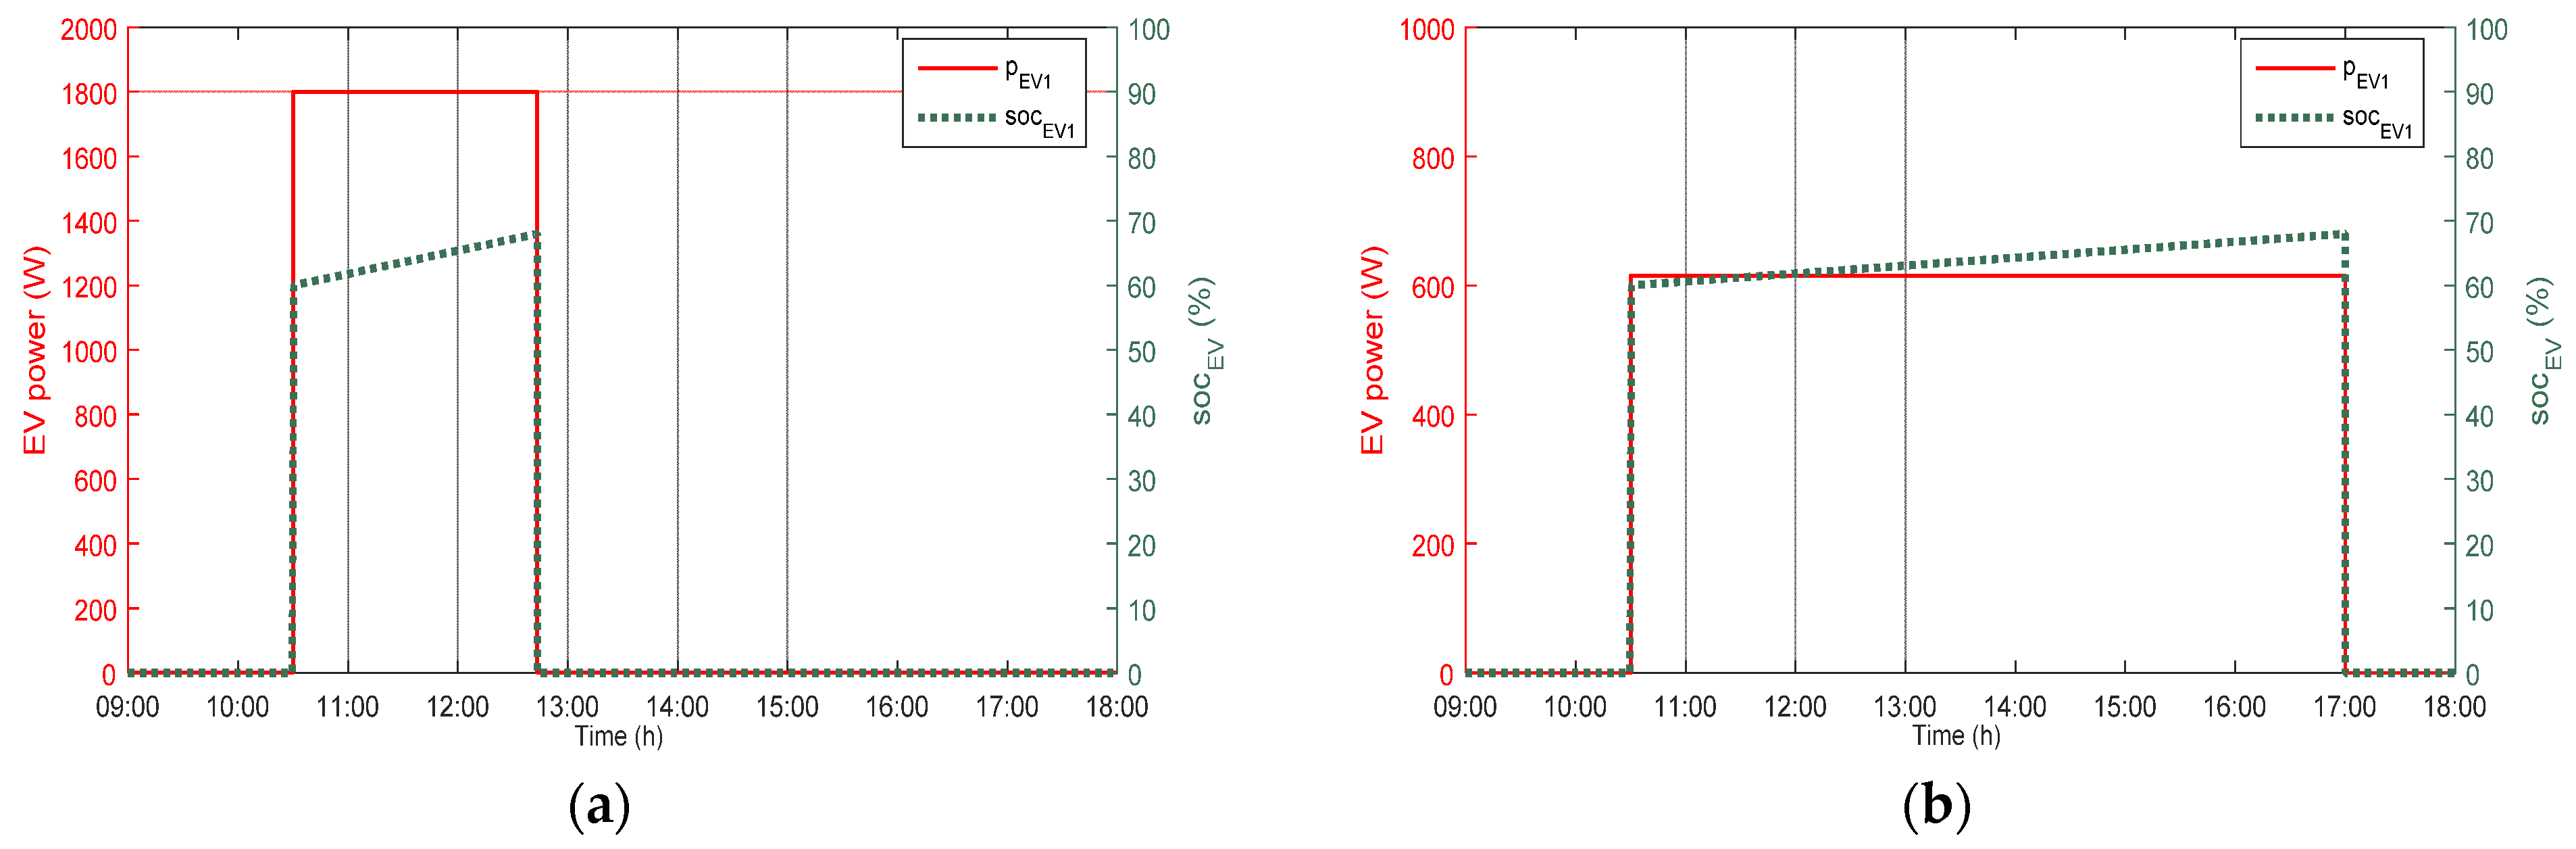
Figure 10 shows the EV charging power and EV SOC evolution for the two scenarios (a) and (b). It shows that the desired SOC at departure for the EV is respected in the two scenarios, while for scenario 1b the charging power is lower than in scenario 1a and the charging period is longer as well.
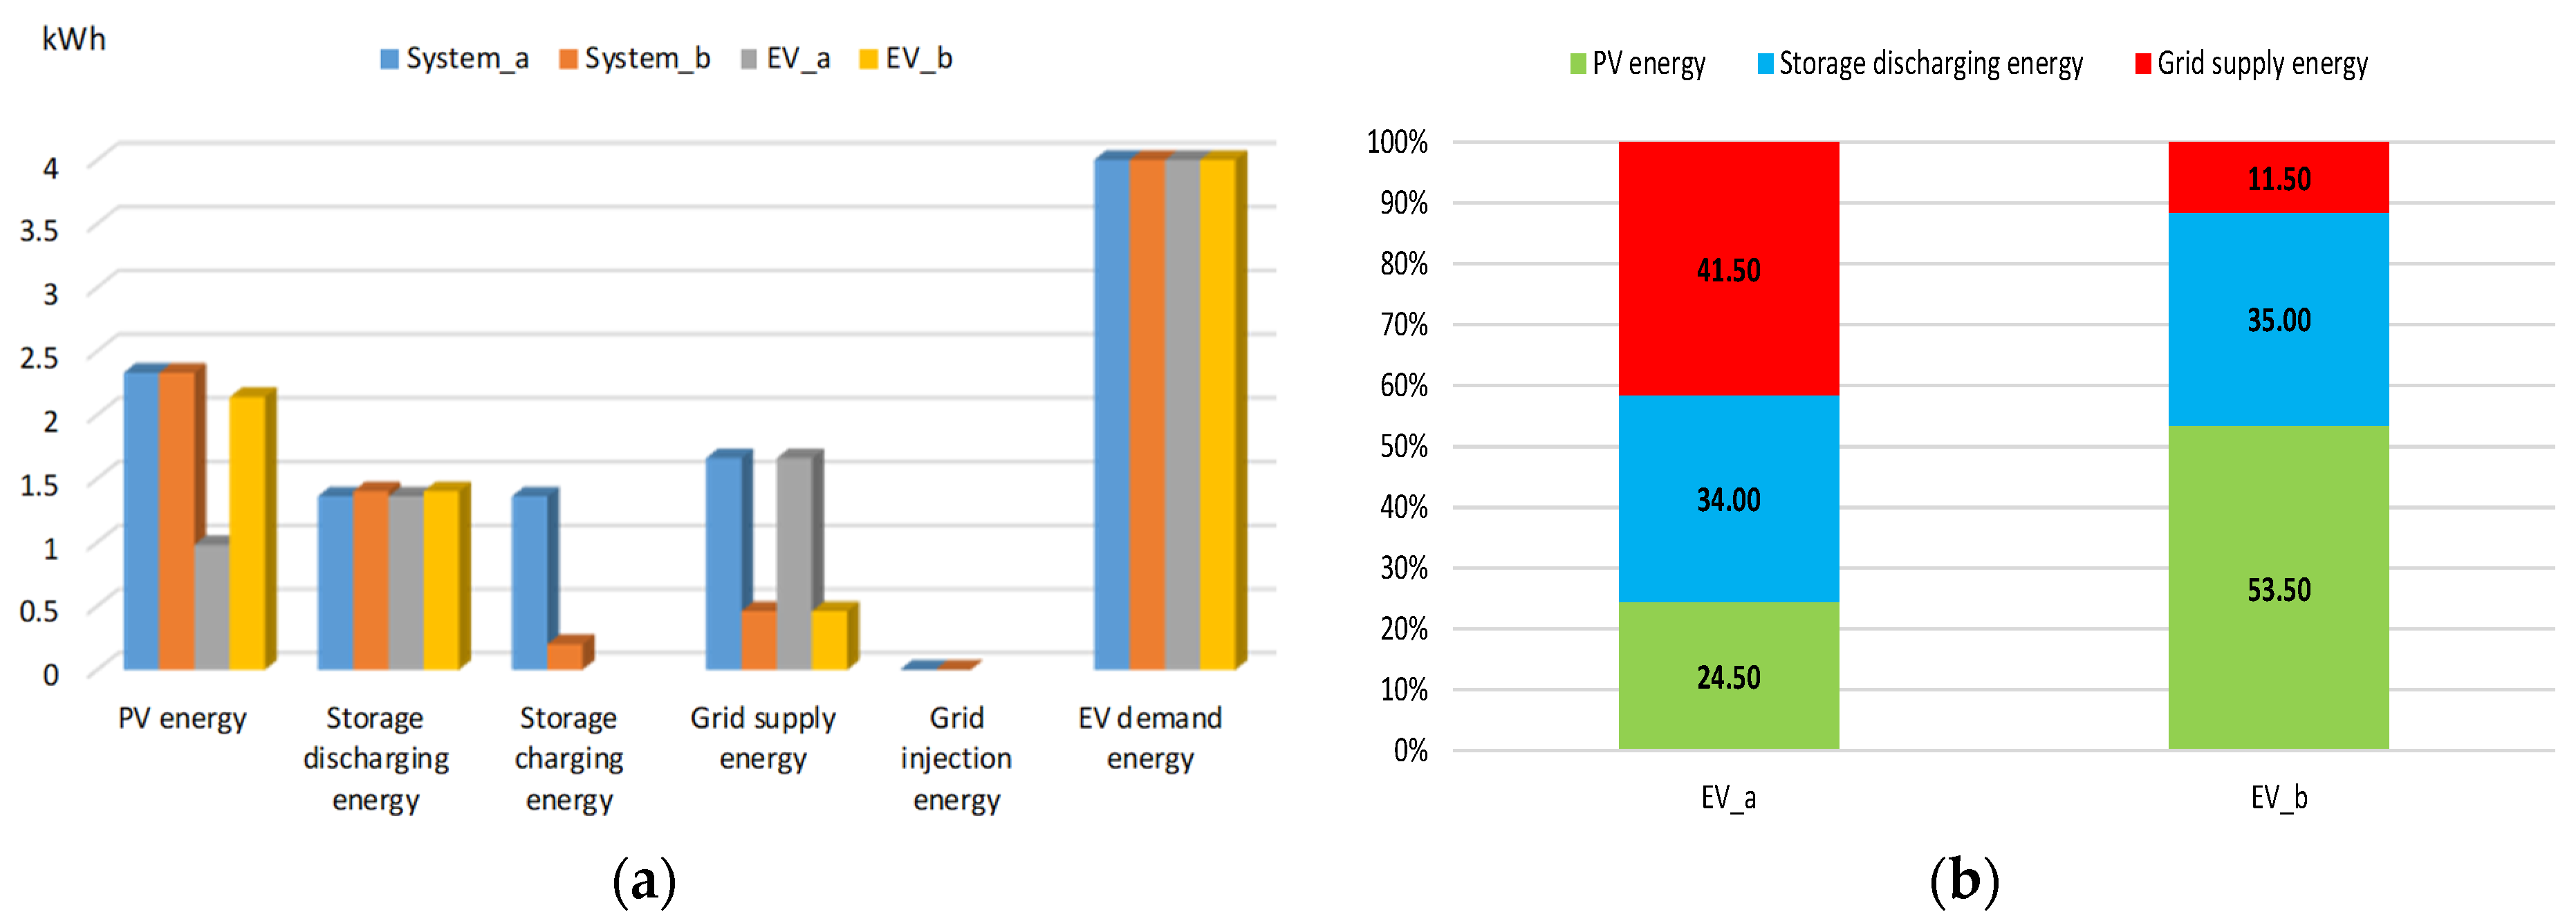
Figure 11 shows a comparison between the two scenarios and the superiority of scenario 1b, where the EV is charged with more than 50% of PV and only 11.50% of public grid power, whereas, in scenario 1a, the EV is charged with 24.50% of PV and more than 40% of public grid power.
In conclusion, when the park time is known and long, PV benefits increase for the EV charging and the dependency on the public grid is reduced.
5.2. Case 2—Publicly Accessible Charging Station: PV Parking Shade with Nine Spots and Nine Chargers
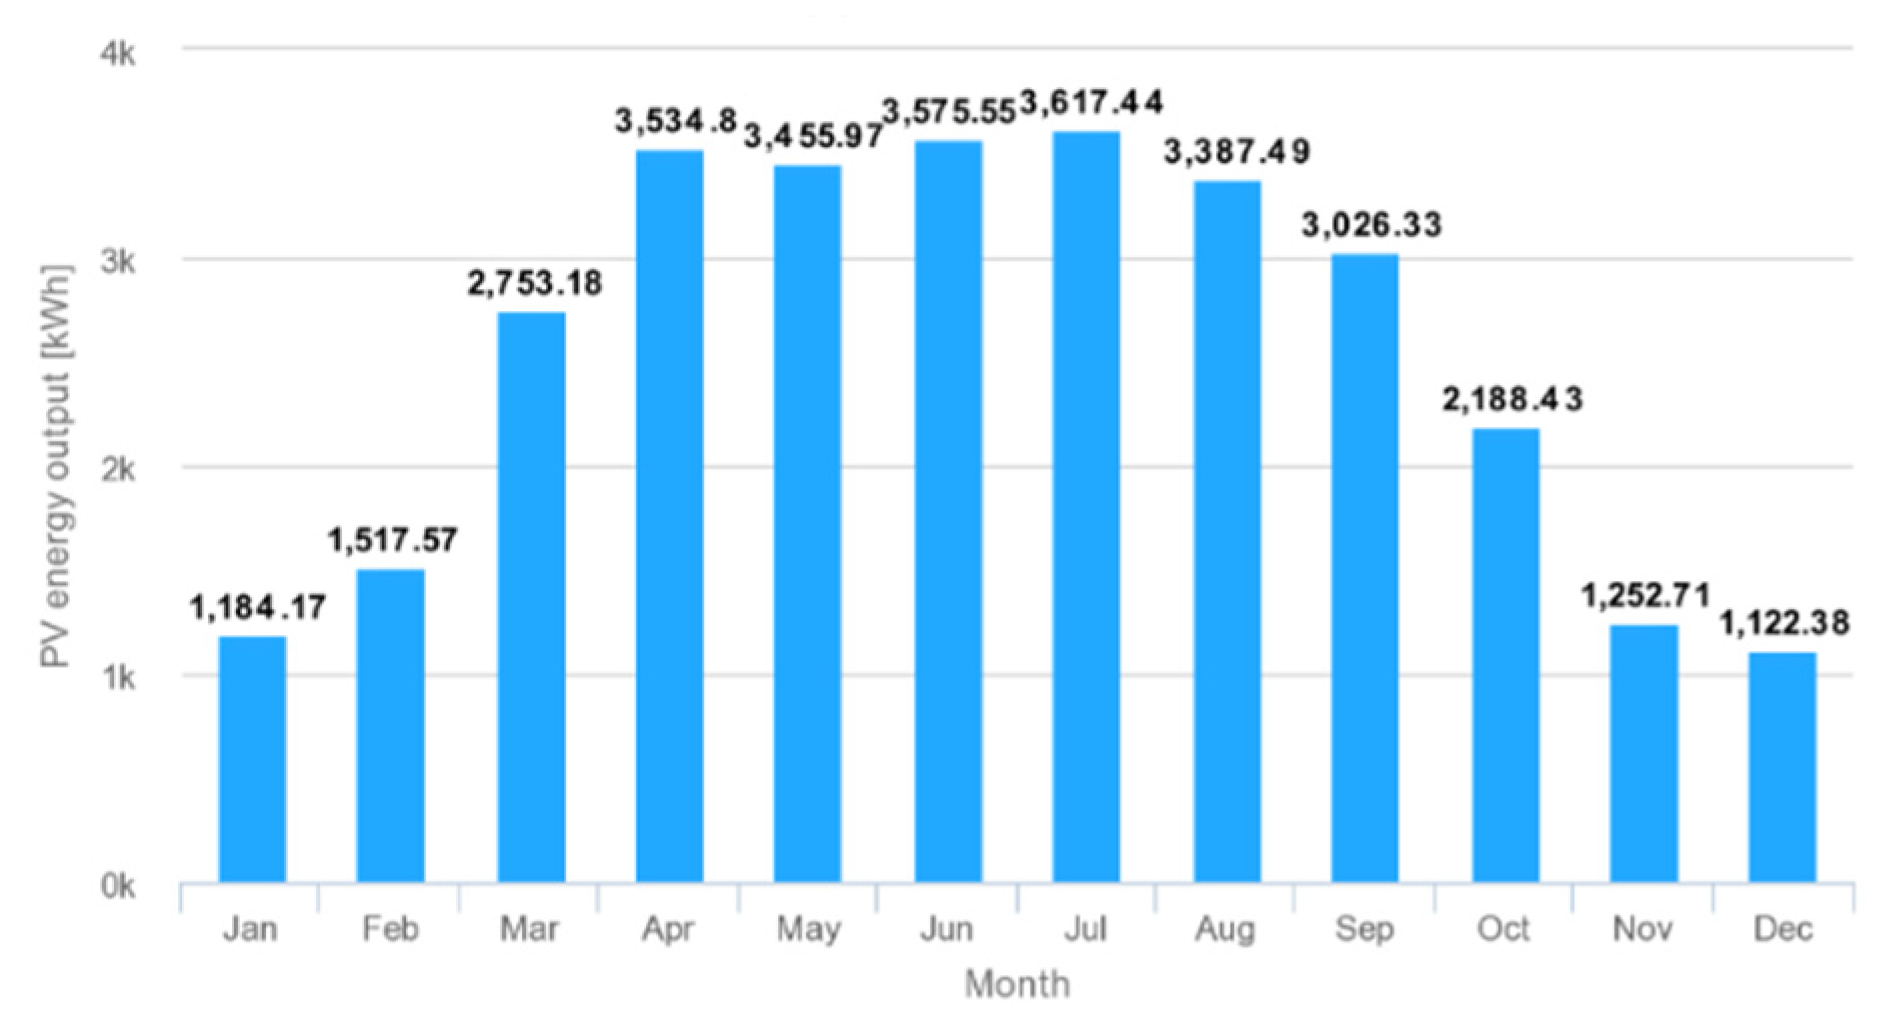
Figure 12 shows the installation of the PV parking shade, which consisted of 84 PV panels in the Innovation Center of the Université de Technologie de Compiègne, i.e., 29.8 kWp. The stationary storage system has the characteristics of 185 Ah, 96 V giving an energy capacity of 17.76 kWh, and the storage power limit was chosen at 7 kW to not exceed the maximum charging power in slow mode. However, no public grid power limit was set in this case. The lowest monthly PV production is in December, as shown in
Figure 13, with an average daily of 36.22 kWh. If the nine EVs are connected, then one EV may receive 4.02 kWh, which represents the average energy needed to charge an EV with a daily trip of 20–40 km.
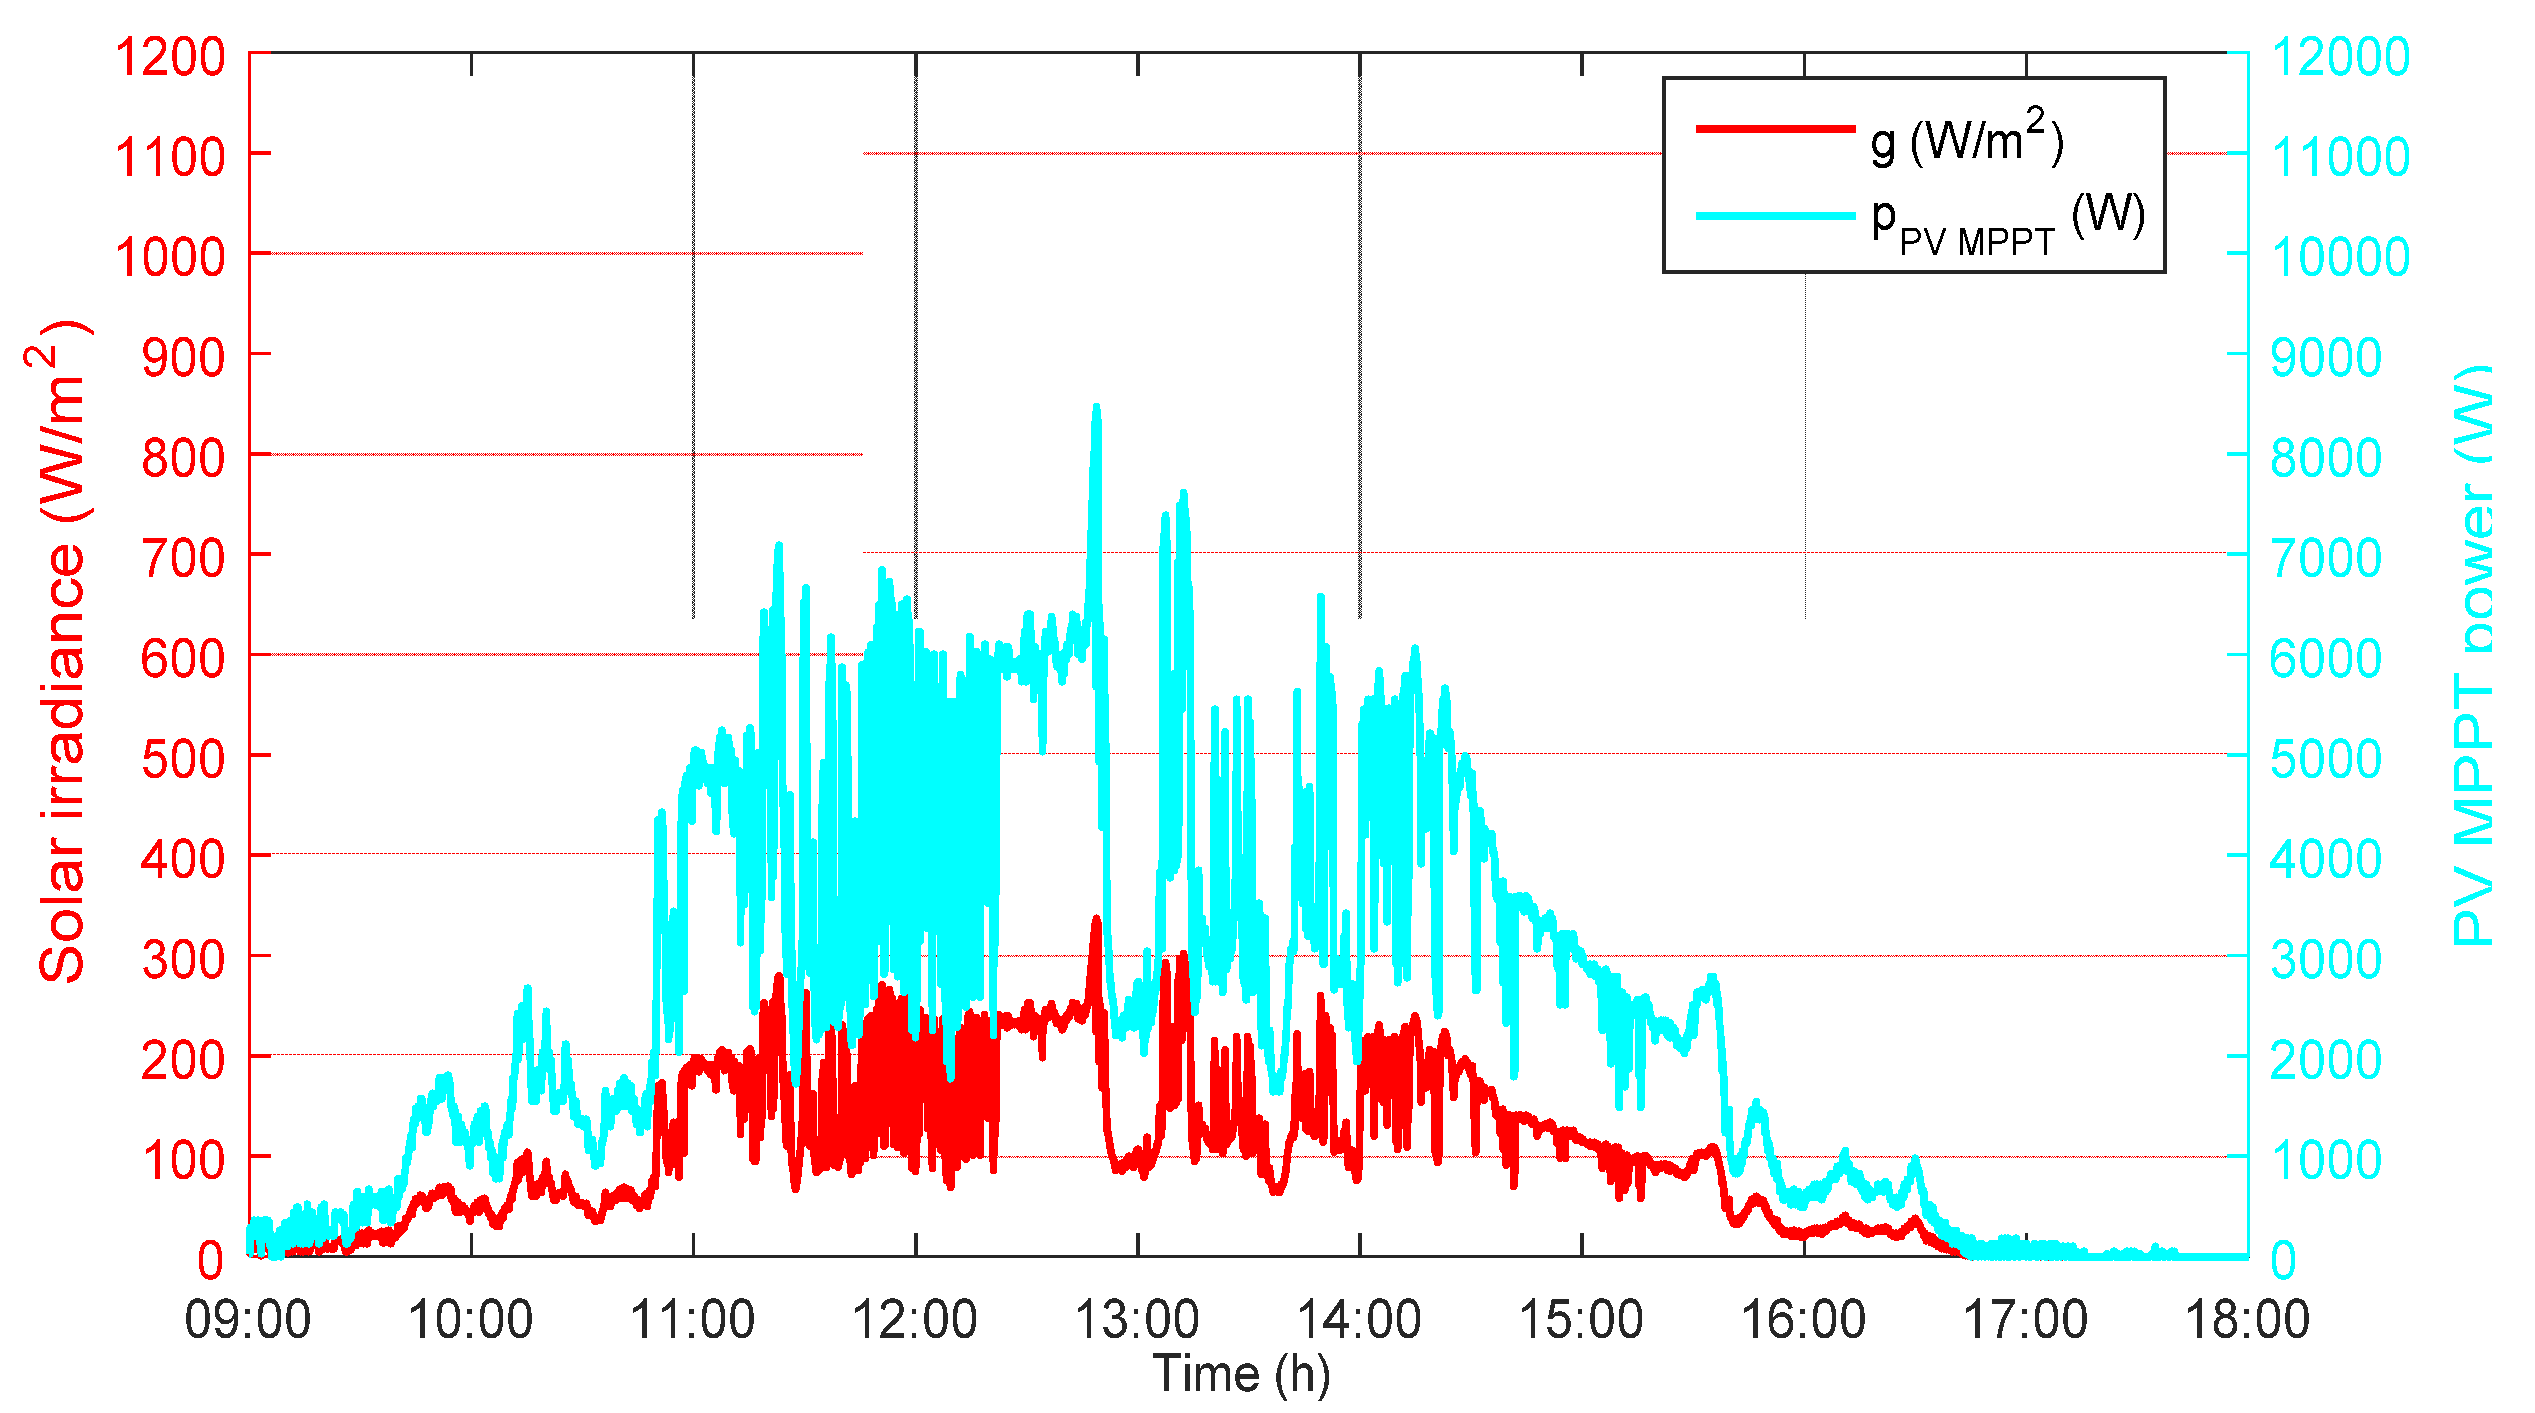
Figure 14 shows the solar irradiation
(W/m
2) and
for 24 December 2019 in Compiegne.
Different scenarios and simulation results are considered and analyzed to define the preliminary requirements and feasibility conditions for a PV-powered EV charging station with PV benefits increased in the following subsections.
5.2.1. Scenario 2a
The hypotheses for the scenario 2a are shown in
Table 3.
The total EVs demand energy is 21 kWh.
Figure 15 shows the system power flows and the stationary storage SOC evolution. PV and stationary storage share power to charge the EVs, without the need for the public grid supply. When the PV production is higher than the EV’s demand power, PV charges the stationary storage so it can supply further power afterward.
5.2.2. Scenario 2b
The hypotheses for the scenario 2b are shown in
Table 4.
Then, the total EVs demand energy is 21 kWh.
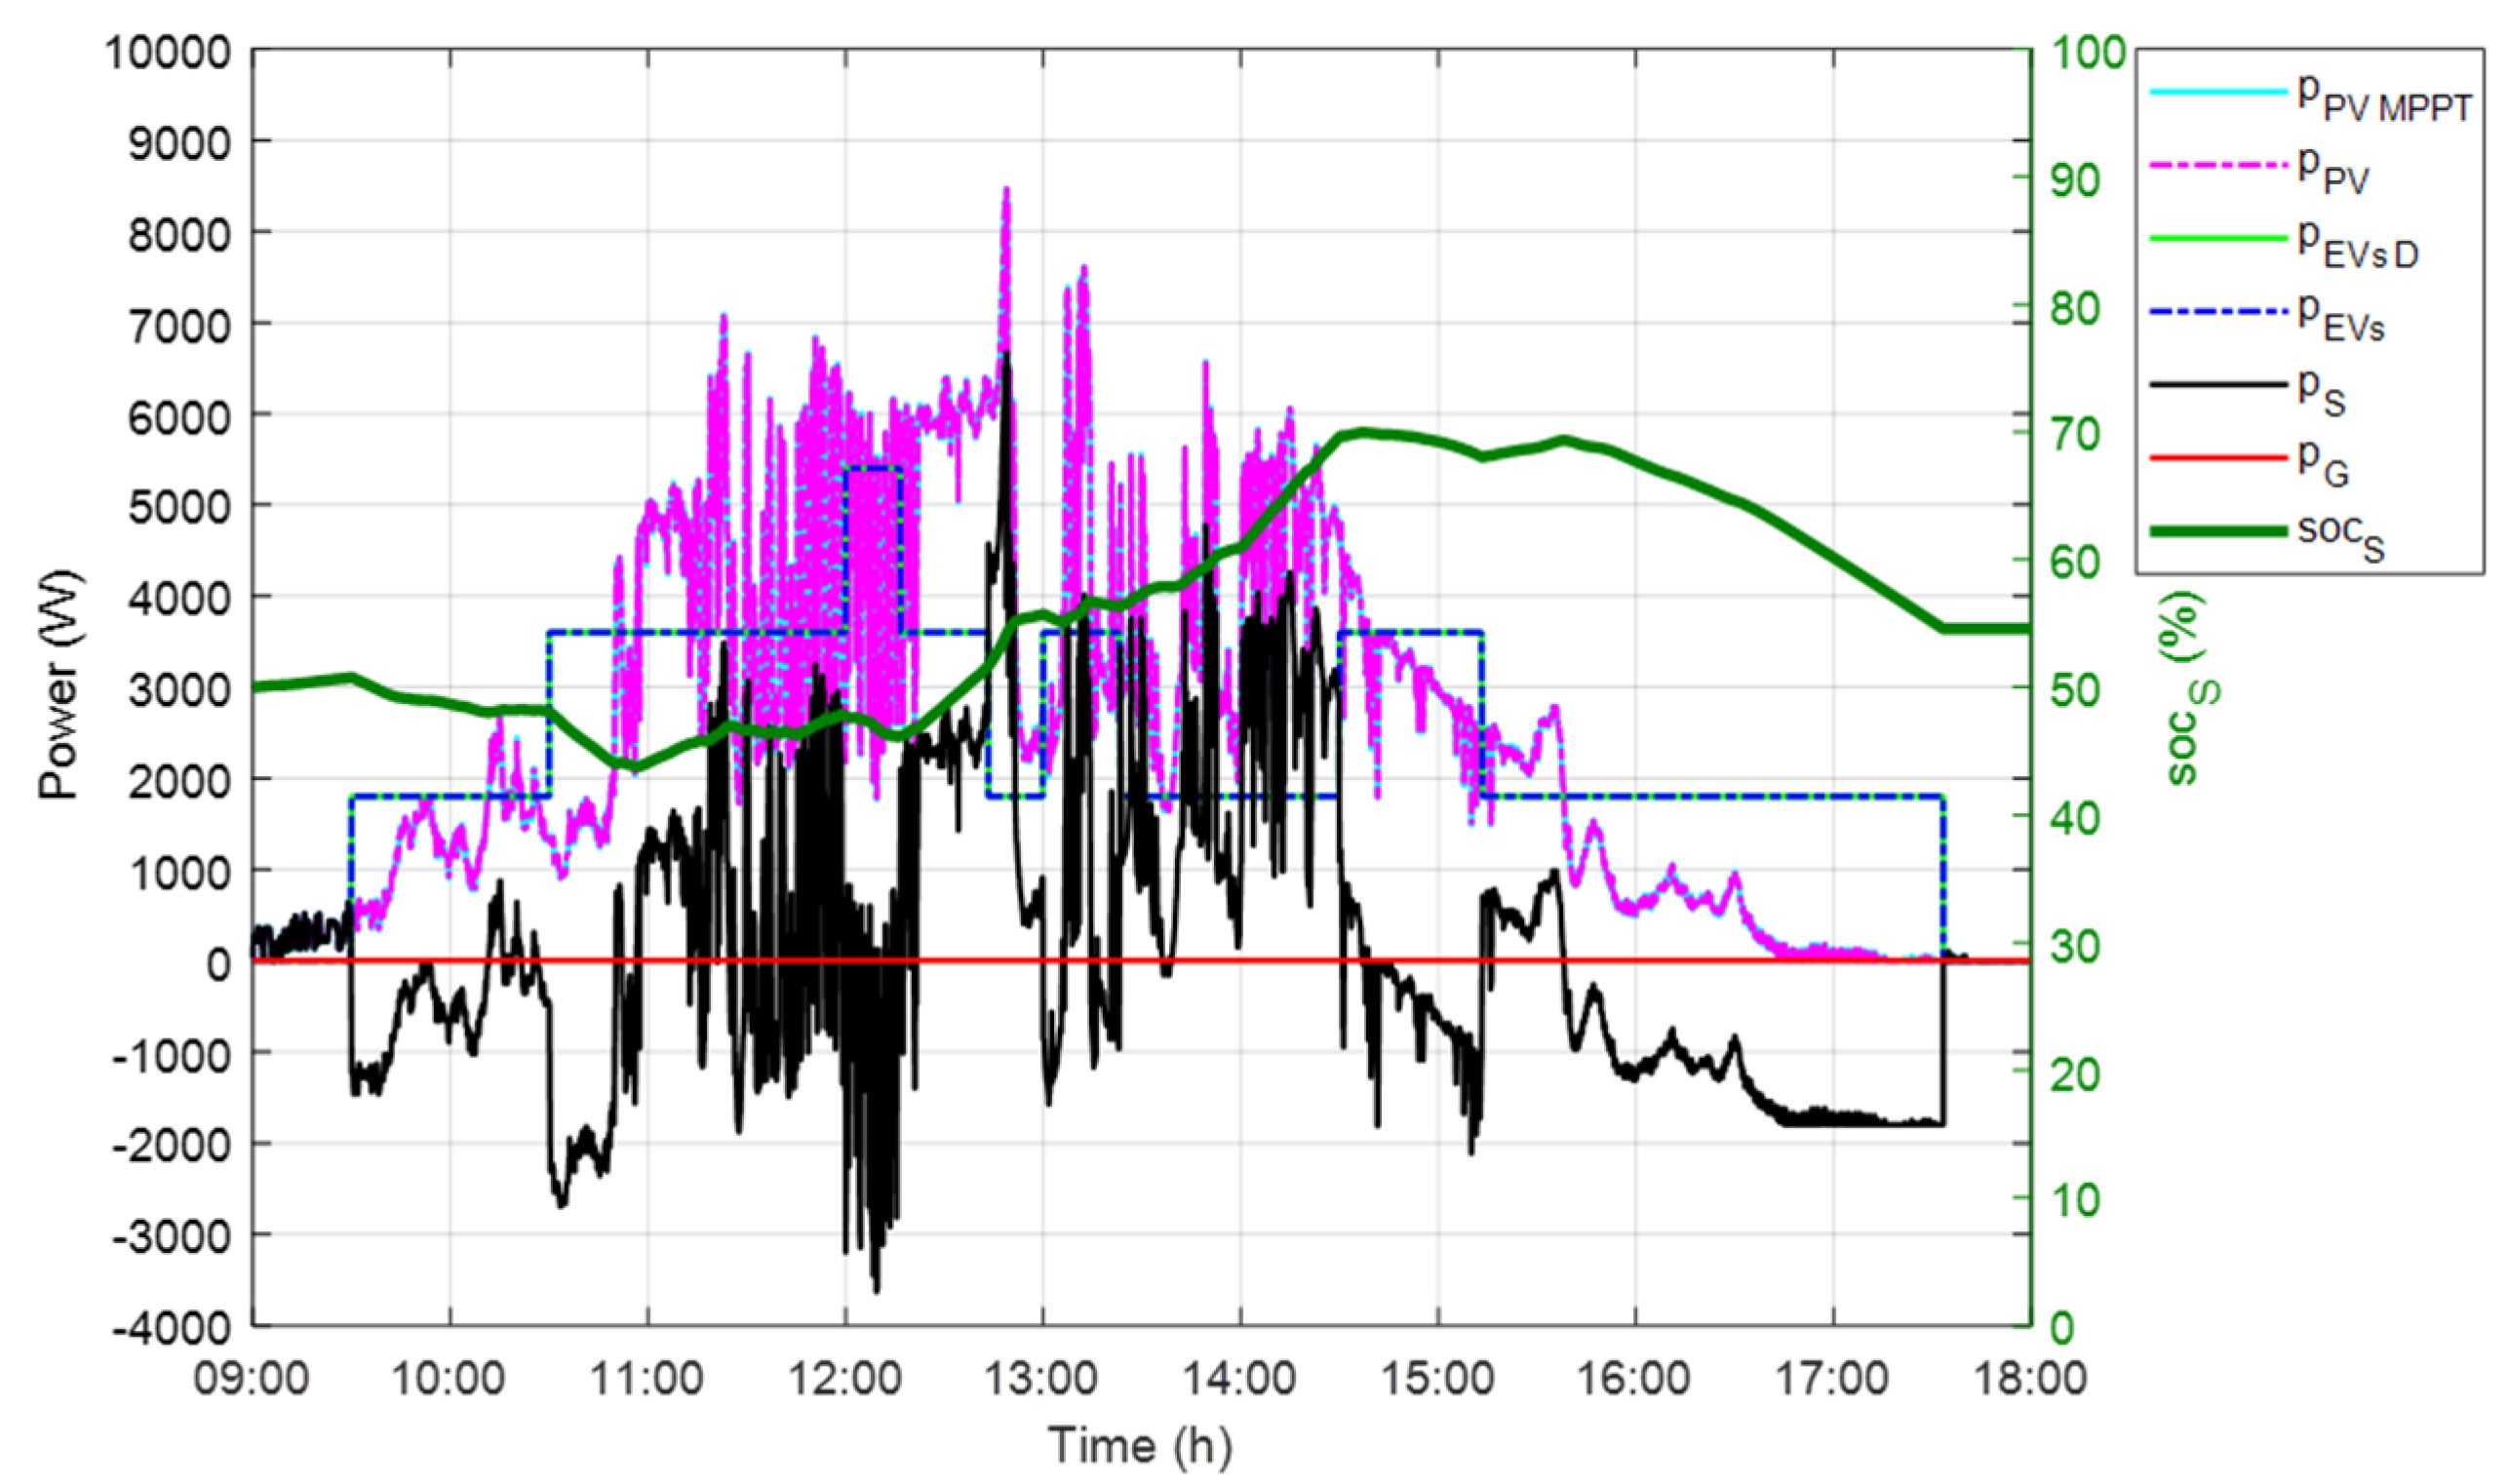
Figure 16 shows the system power flows and the stationary storage SOC evolution.
PV and stationary storage share power to charge the EVs, without the need for the public grid supply. When the PV production is higher than the EV’s demand power, PV charges the stationary storage so it can supply further power afterward. The stationary storage becomes full, reaching its maximum capacity around 12:50, therefore, PV injects power into the public grid. The EVs charging power and EVs SOC evolution for the two scenarios 2a and 2b are shown in
Figure 17.
A comparison between the two scenarios is shown in
Figure 18. All EVs are charged mainly with PV energy, except for the last EV, i.e., EV5, where it comes in the late afternoon and the PV production is low. As the charging mode is slow for all EVs, the public grid is not required.
In conclusion, scenario 2b may be superior to scenario 2a and may improve the PV benefits for the EVs when the park time is known and longer than the time actually needed for charging in scenario 2a. It should be noted that when the park time is longer, some EVs charge simultaneously so the PV production is shared between them thus reducing the portion of PV energy.
These two scenarios are focused on slow charging mode only. The next scenarios will consider slow and fast charging mode and more than 10% of energy charge to analyze the impact of fast charging on the EVs and their PV benefits.
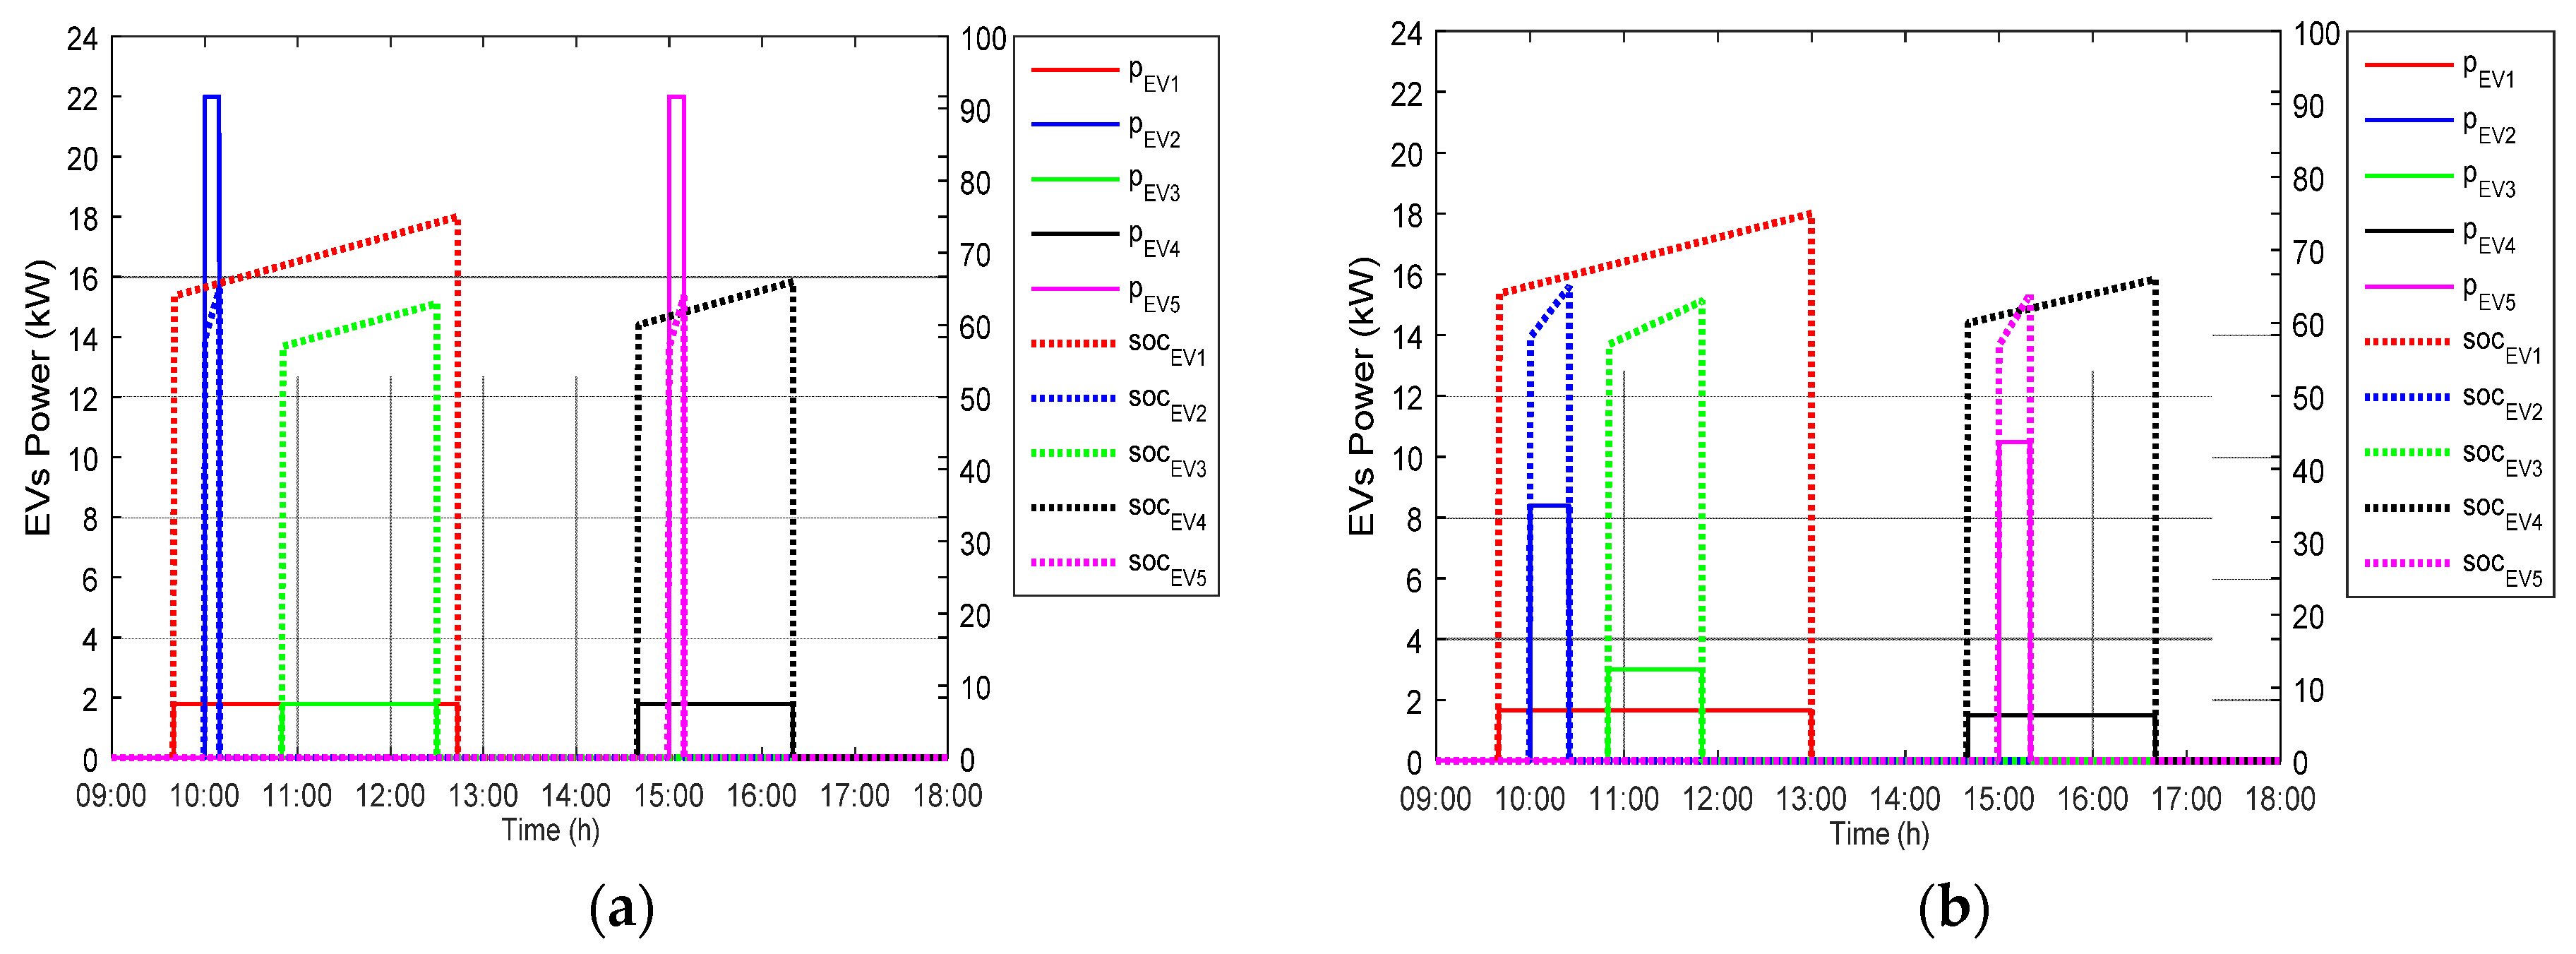
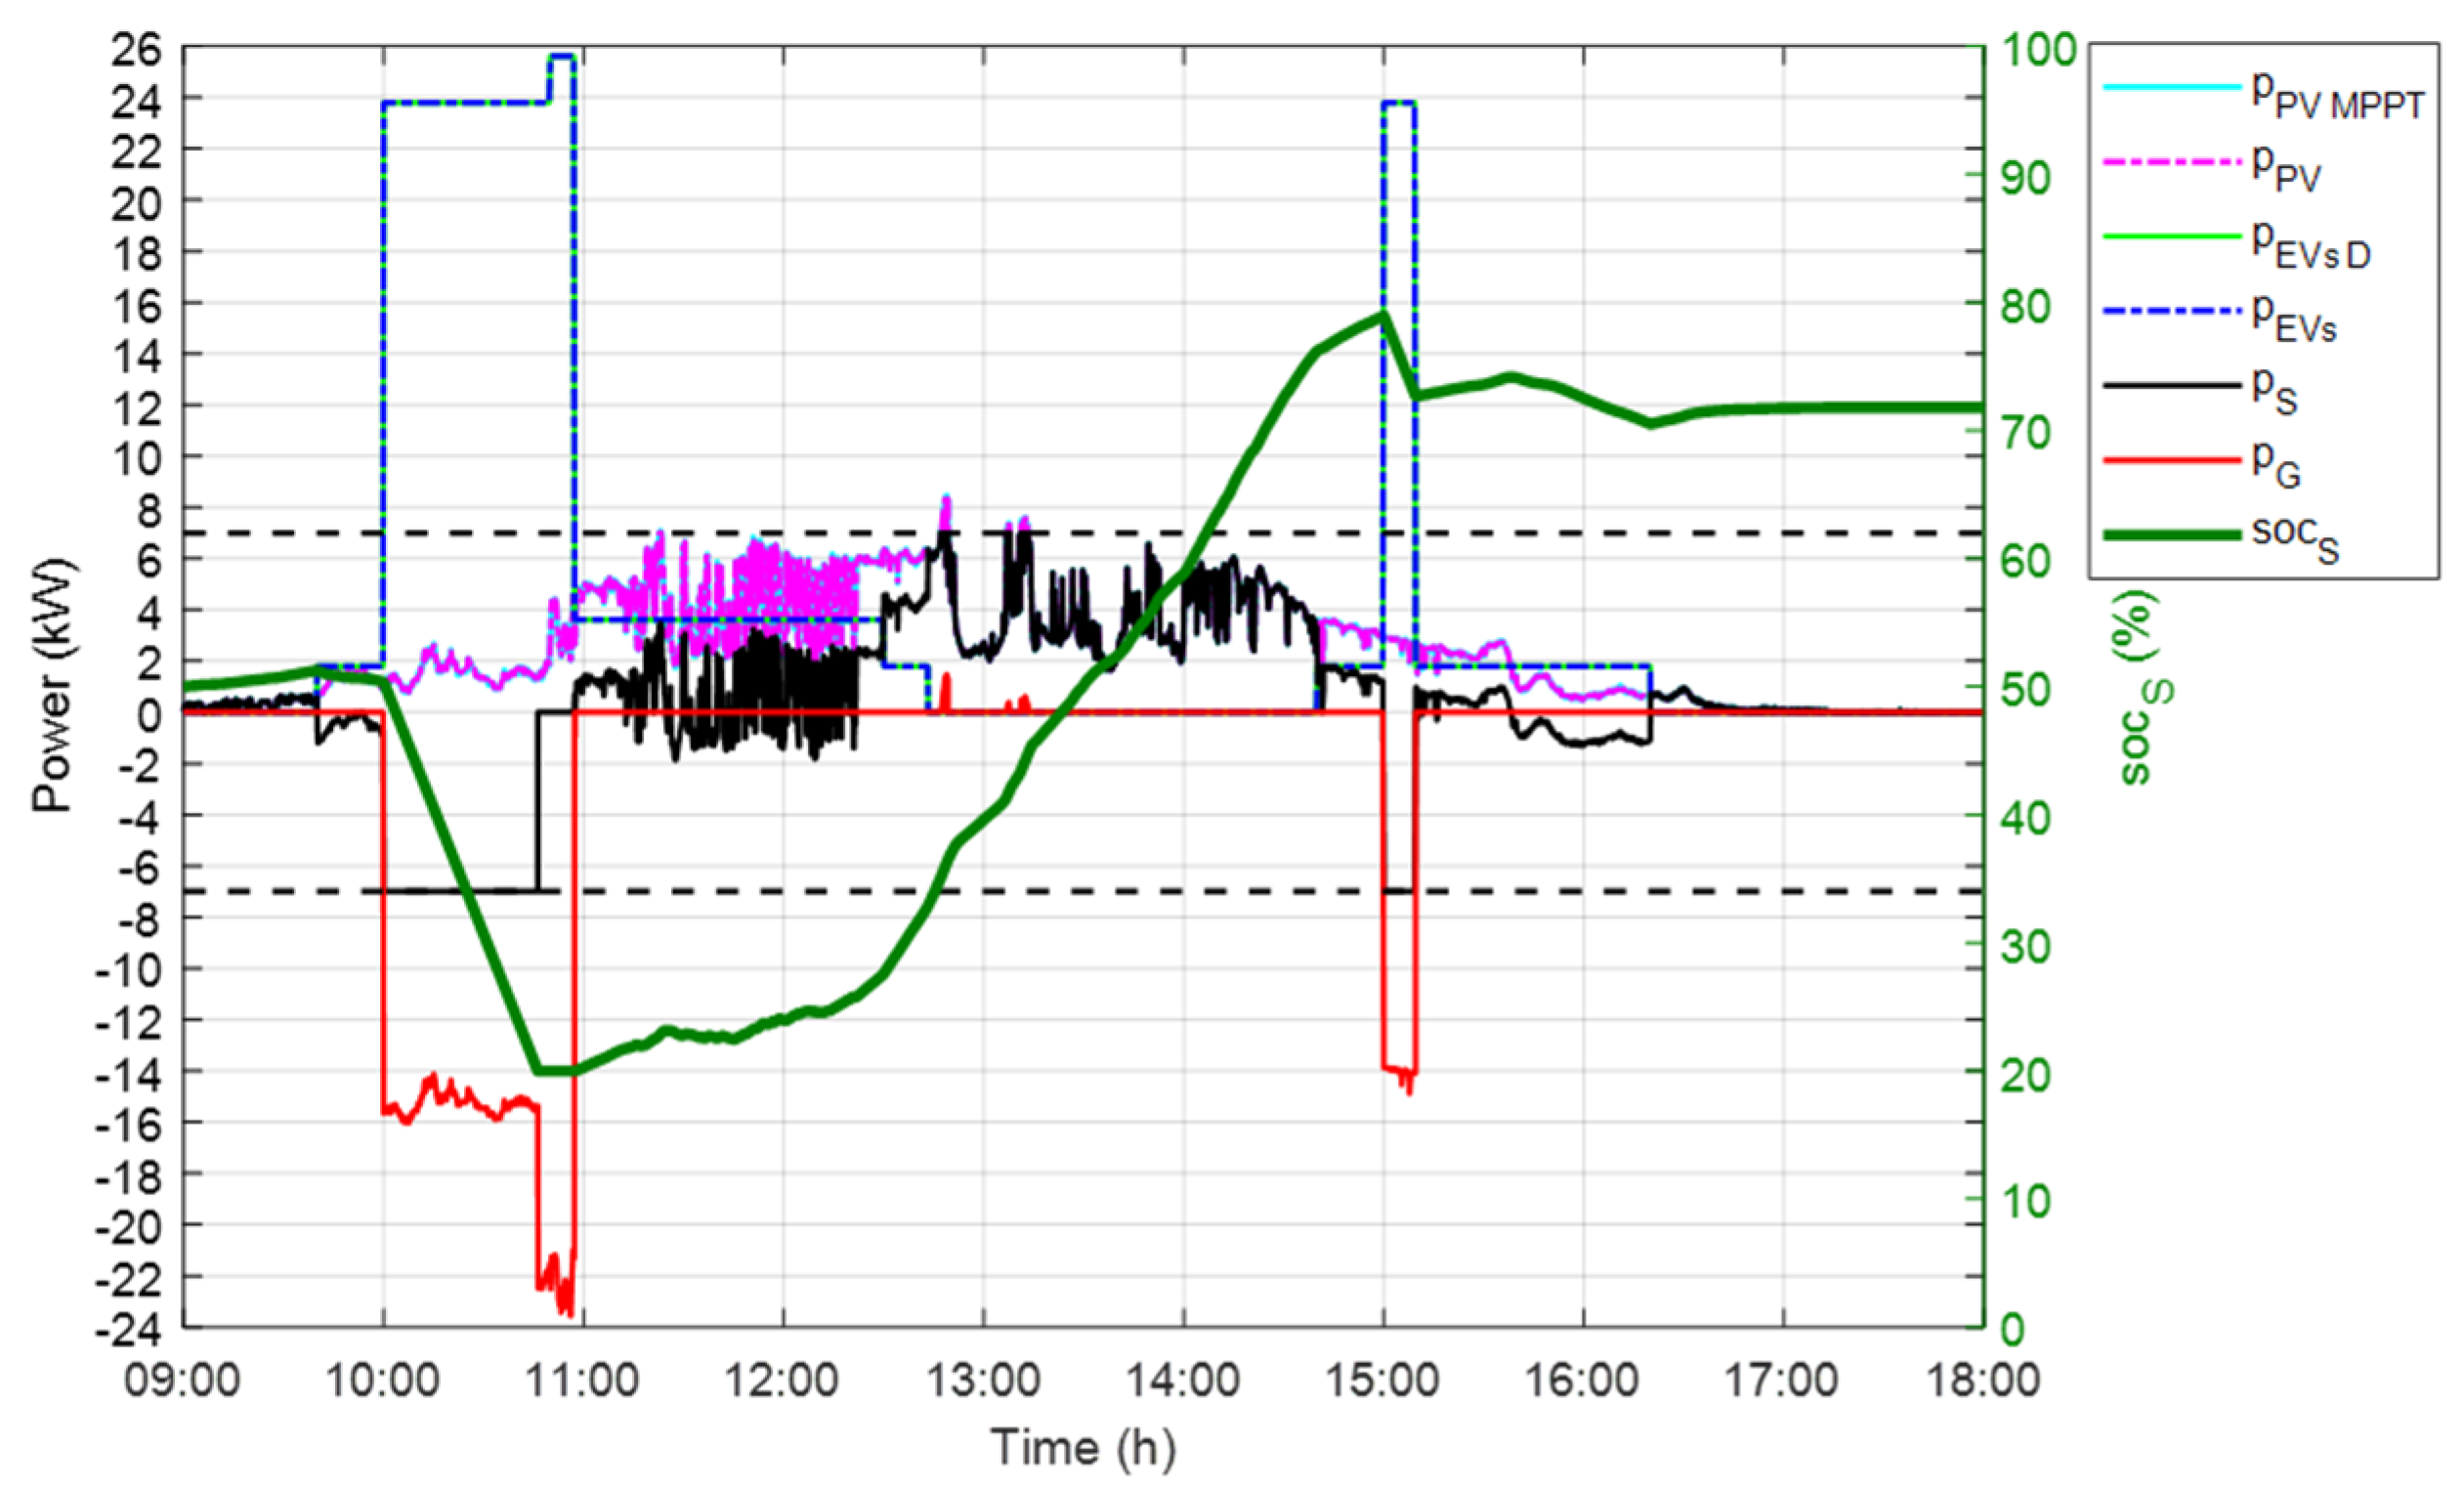
5.2.3. Scenario 2c
The hypotheses for the scenario 2c are shown in
Table 5.
The total EVs energy demand is 18.50 kWh.
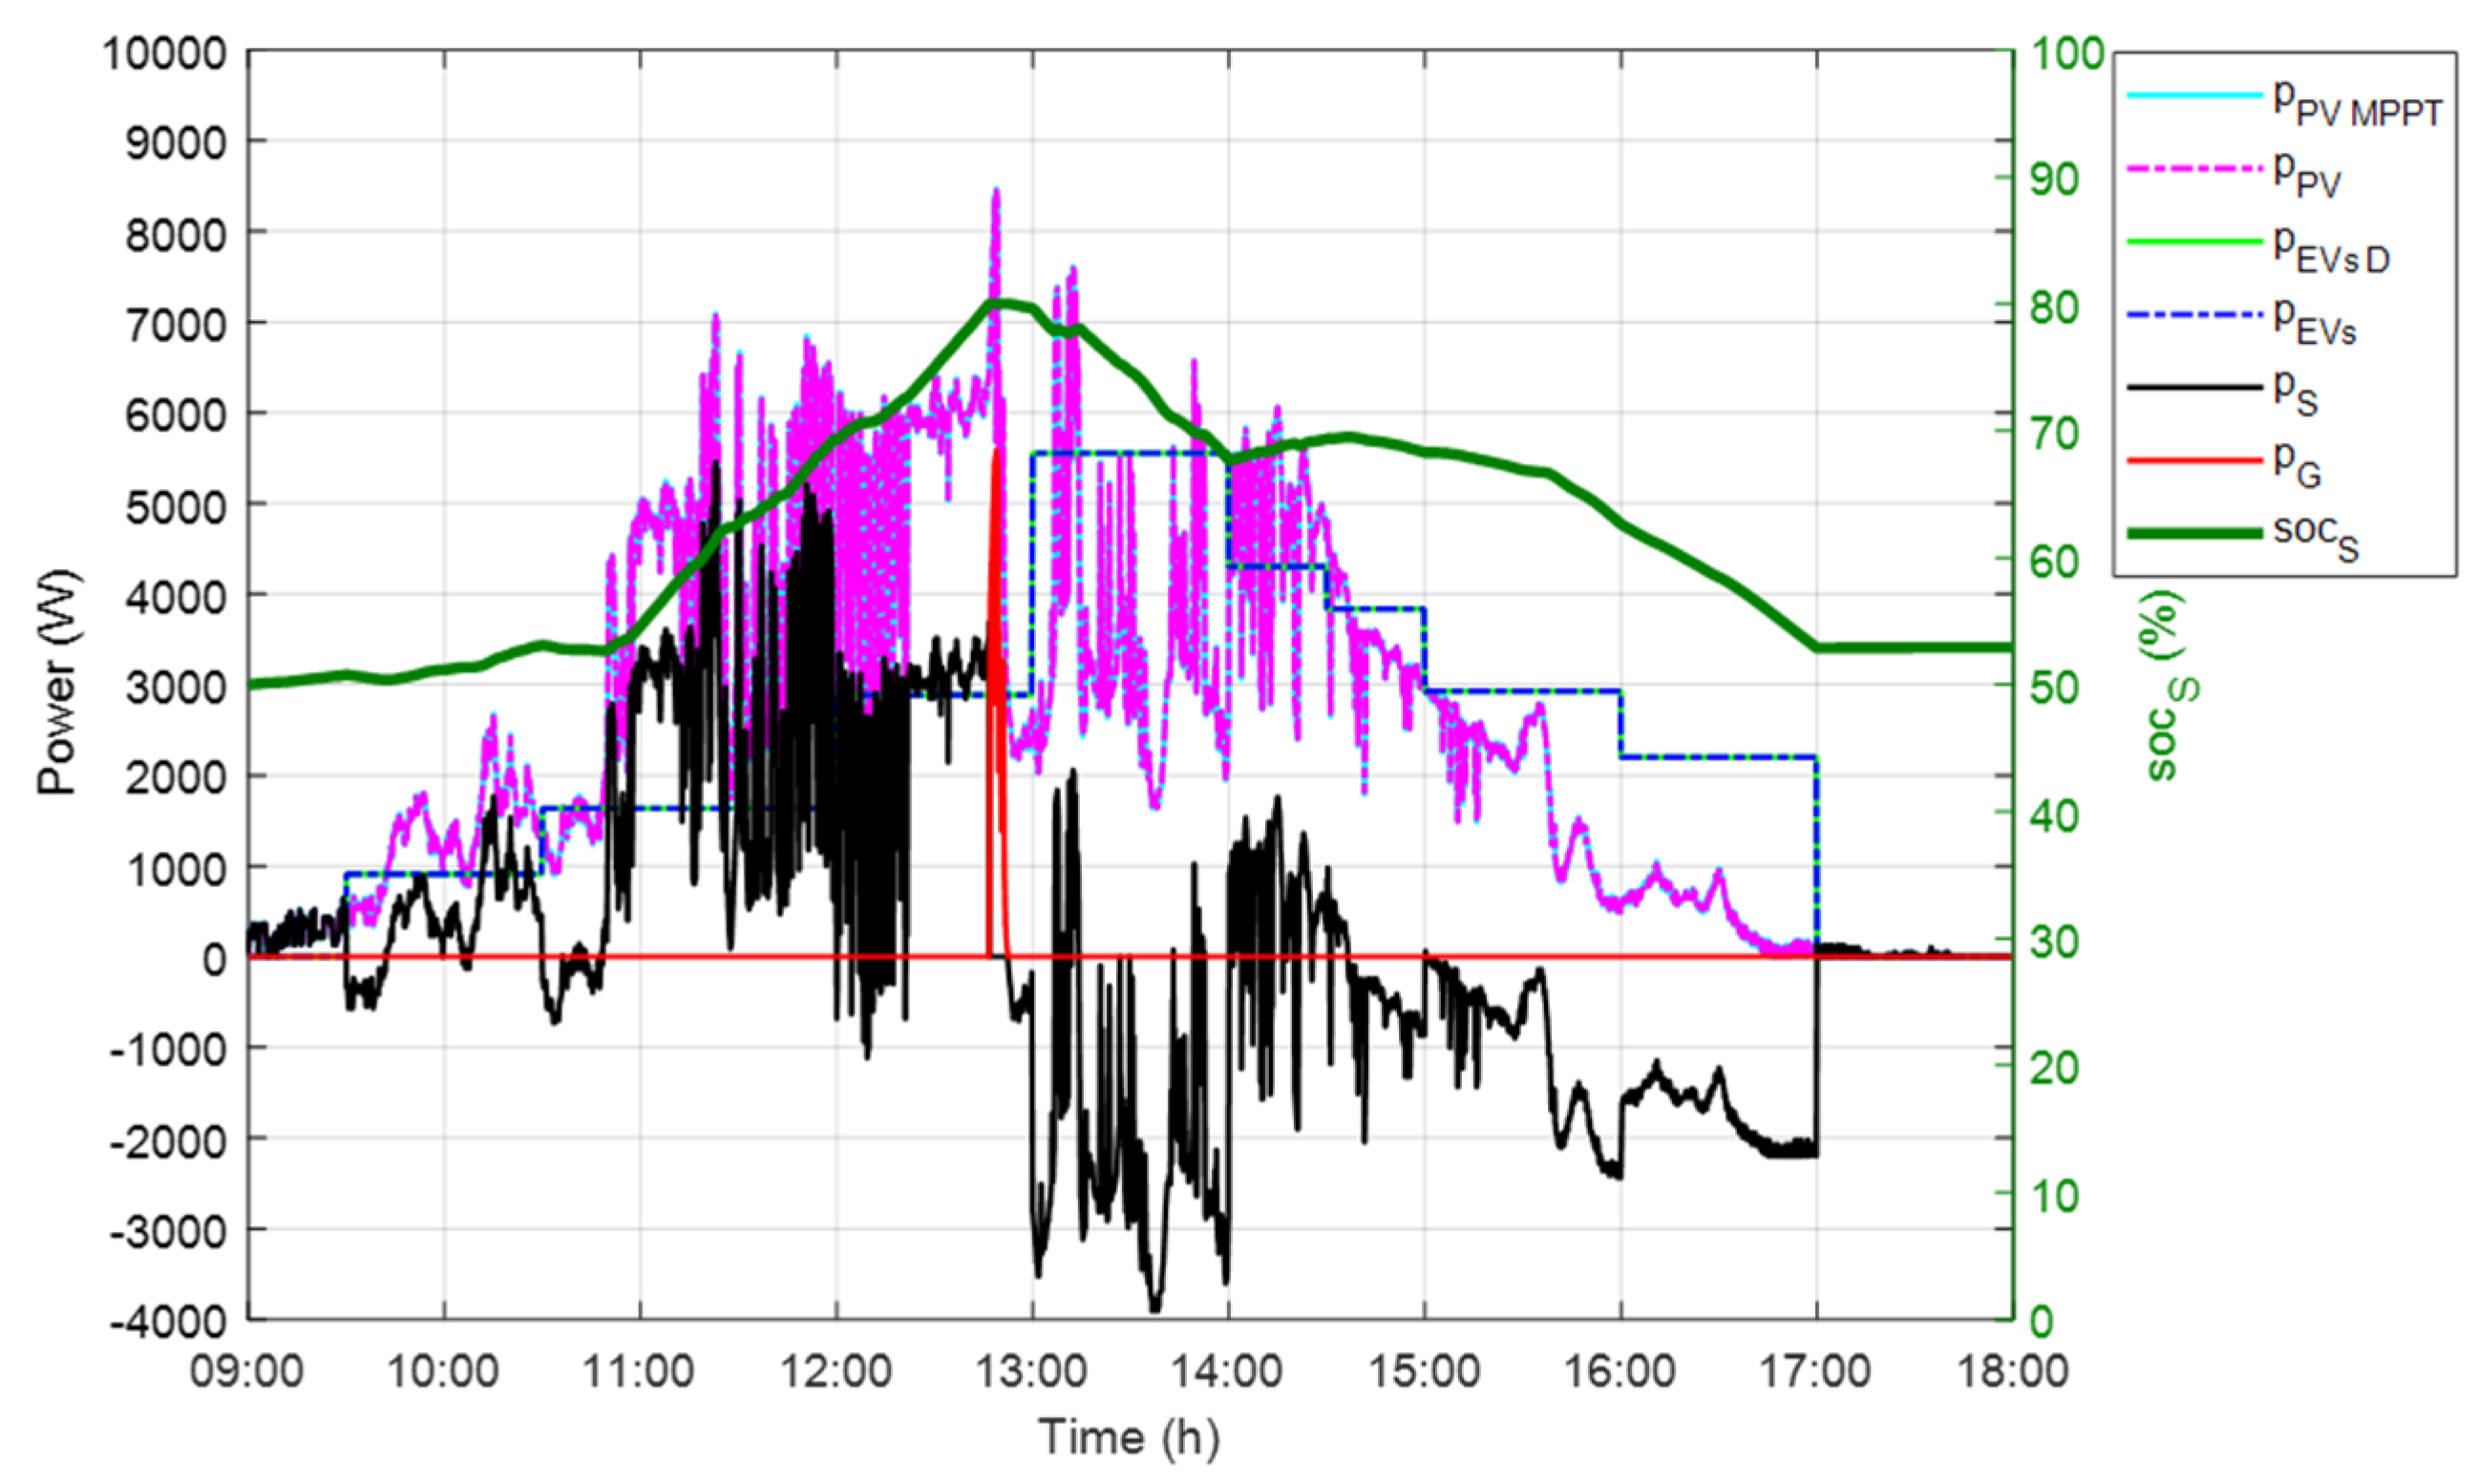
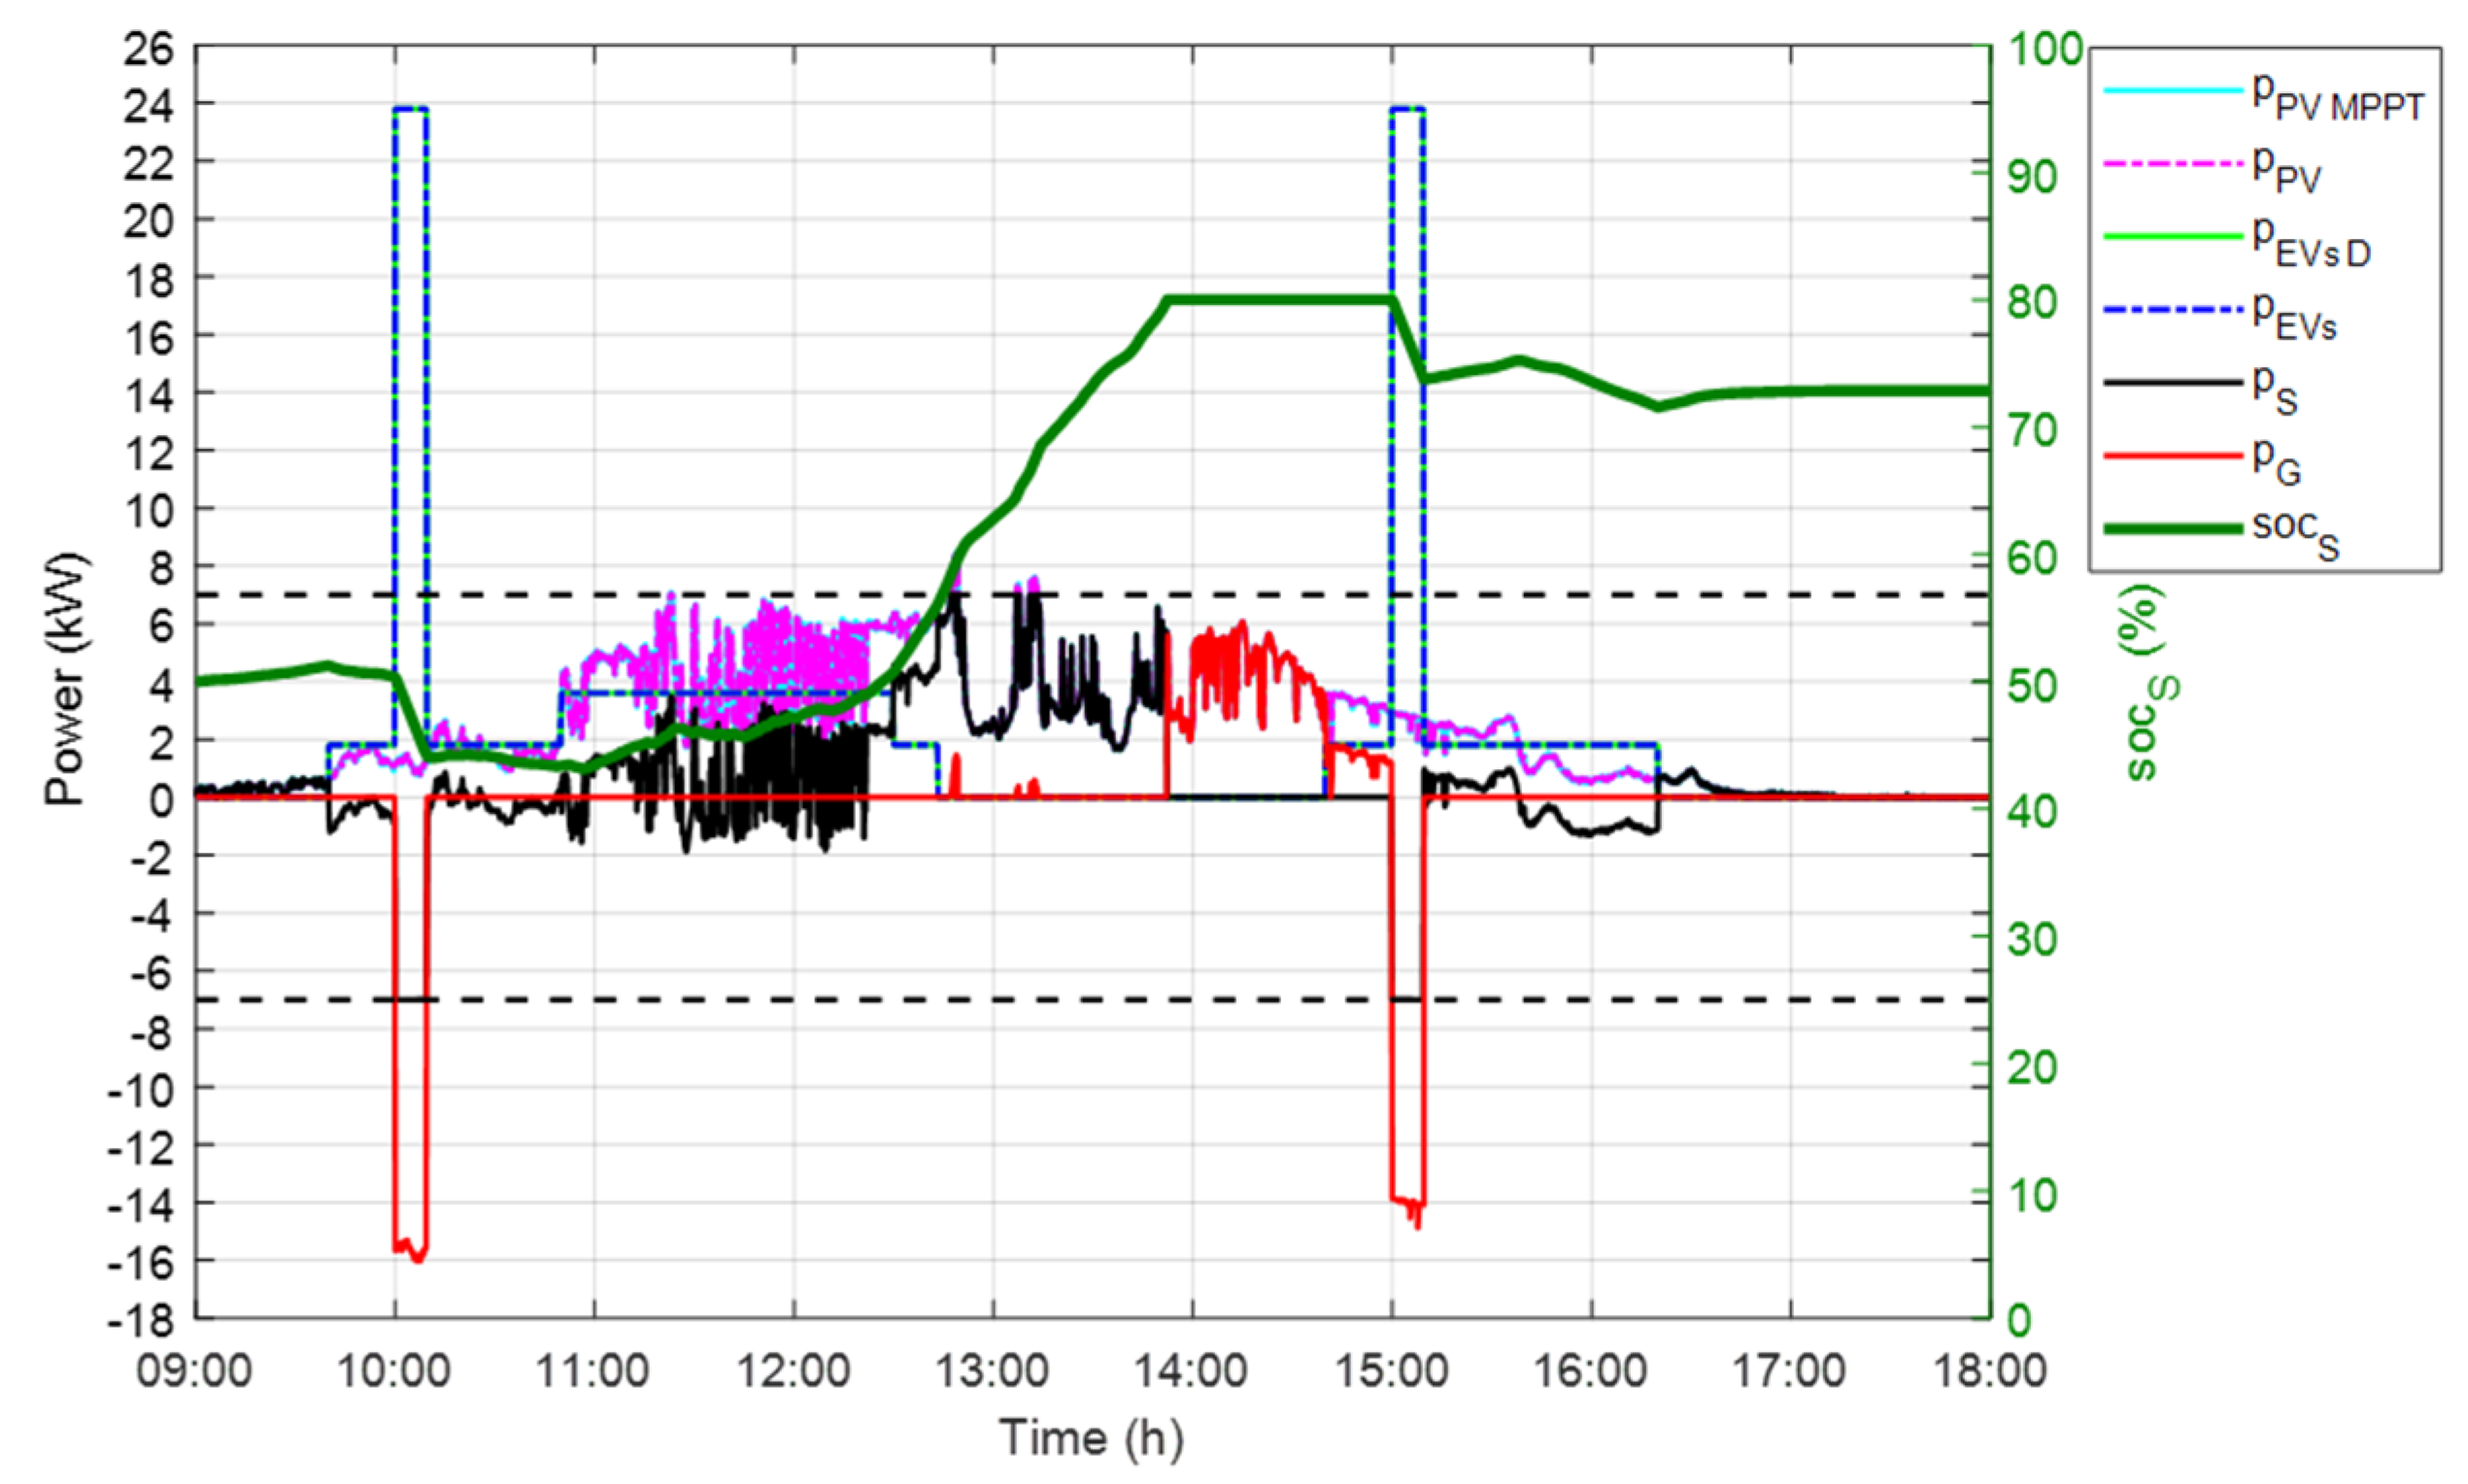
Figure 19 shows the system power flows and the stationary storage SOC evolution.
PV and stationary storage share power to charge the EVs in slow mode. However, when an EV comes to charge in fast mode and the stationary storage has reached the power limit of 7 kW, the public grid supplies the EVs, at 10:00–10:10 and 15:00–15:10. When the PV production is higher than the EV’s power demand, PV charges the stationary storage so it can supply further power afterward. Moreover, PV injects power into the public grid, when the stationary storage reaches its capacity limit, a SOC of 80% around 13:50–15:00, and when it reaches the power limit, around 12:50 and 13:10.
5.2.4. Scenario 2d
The hypotheses for the scenario 2d are shown in
Table 6.
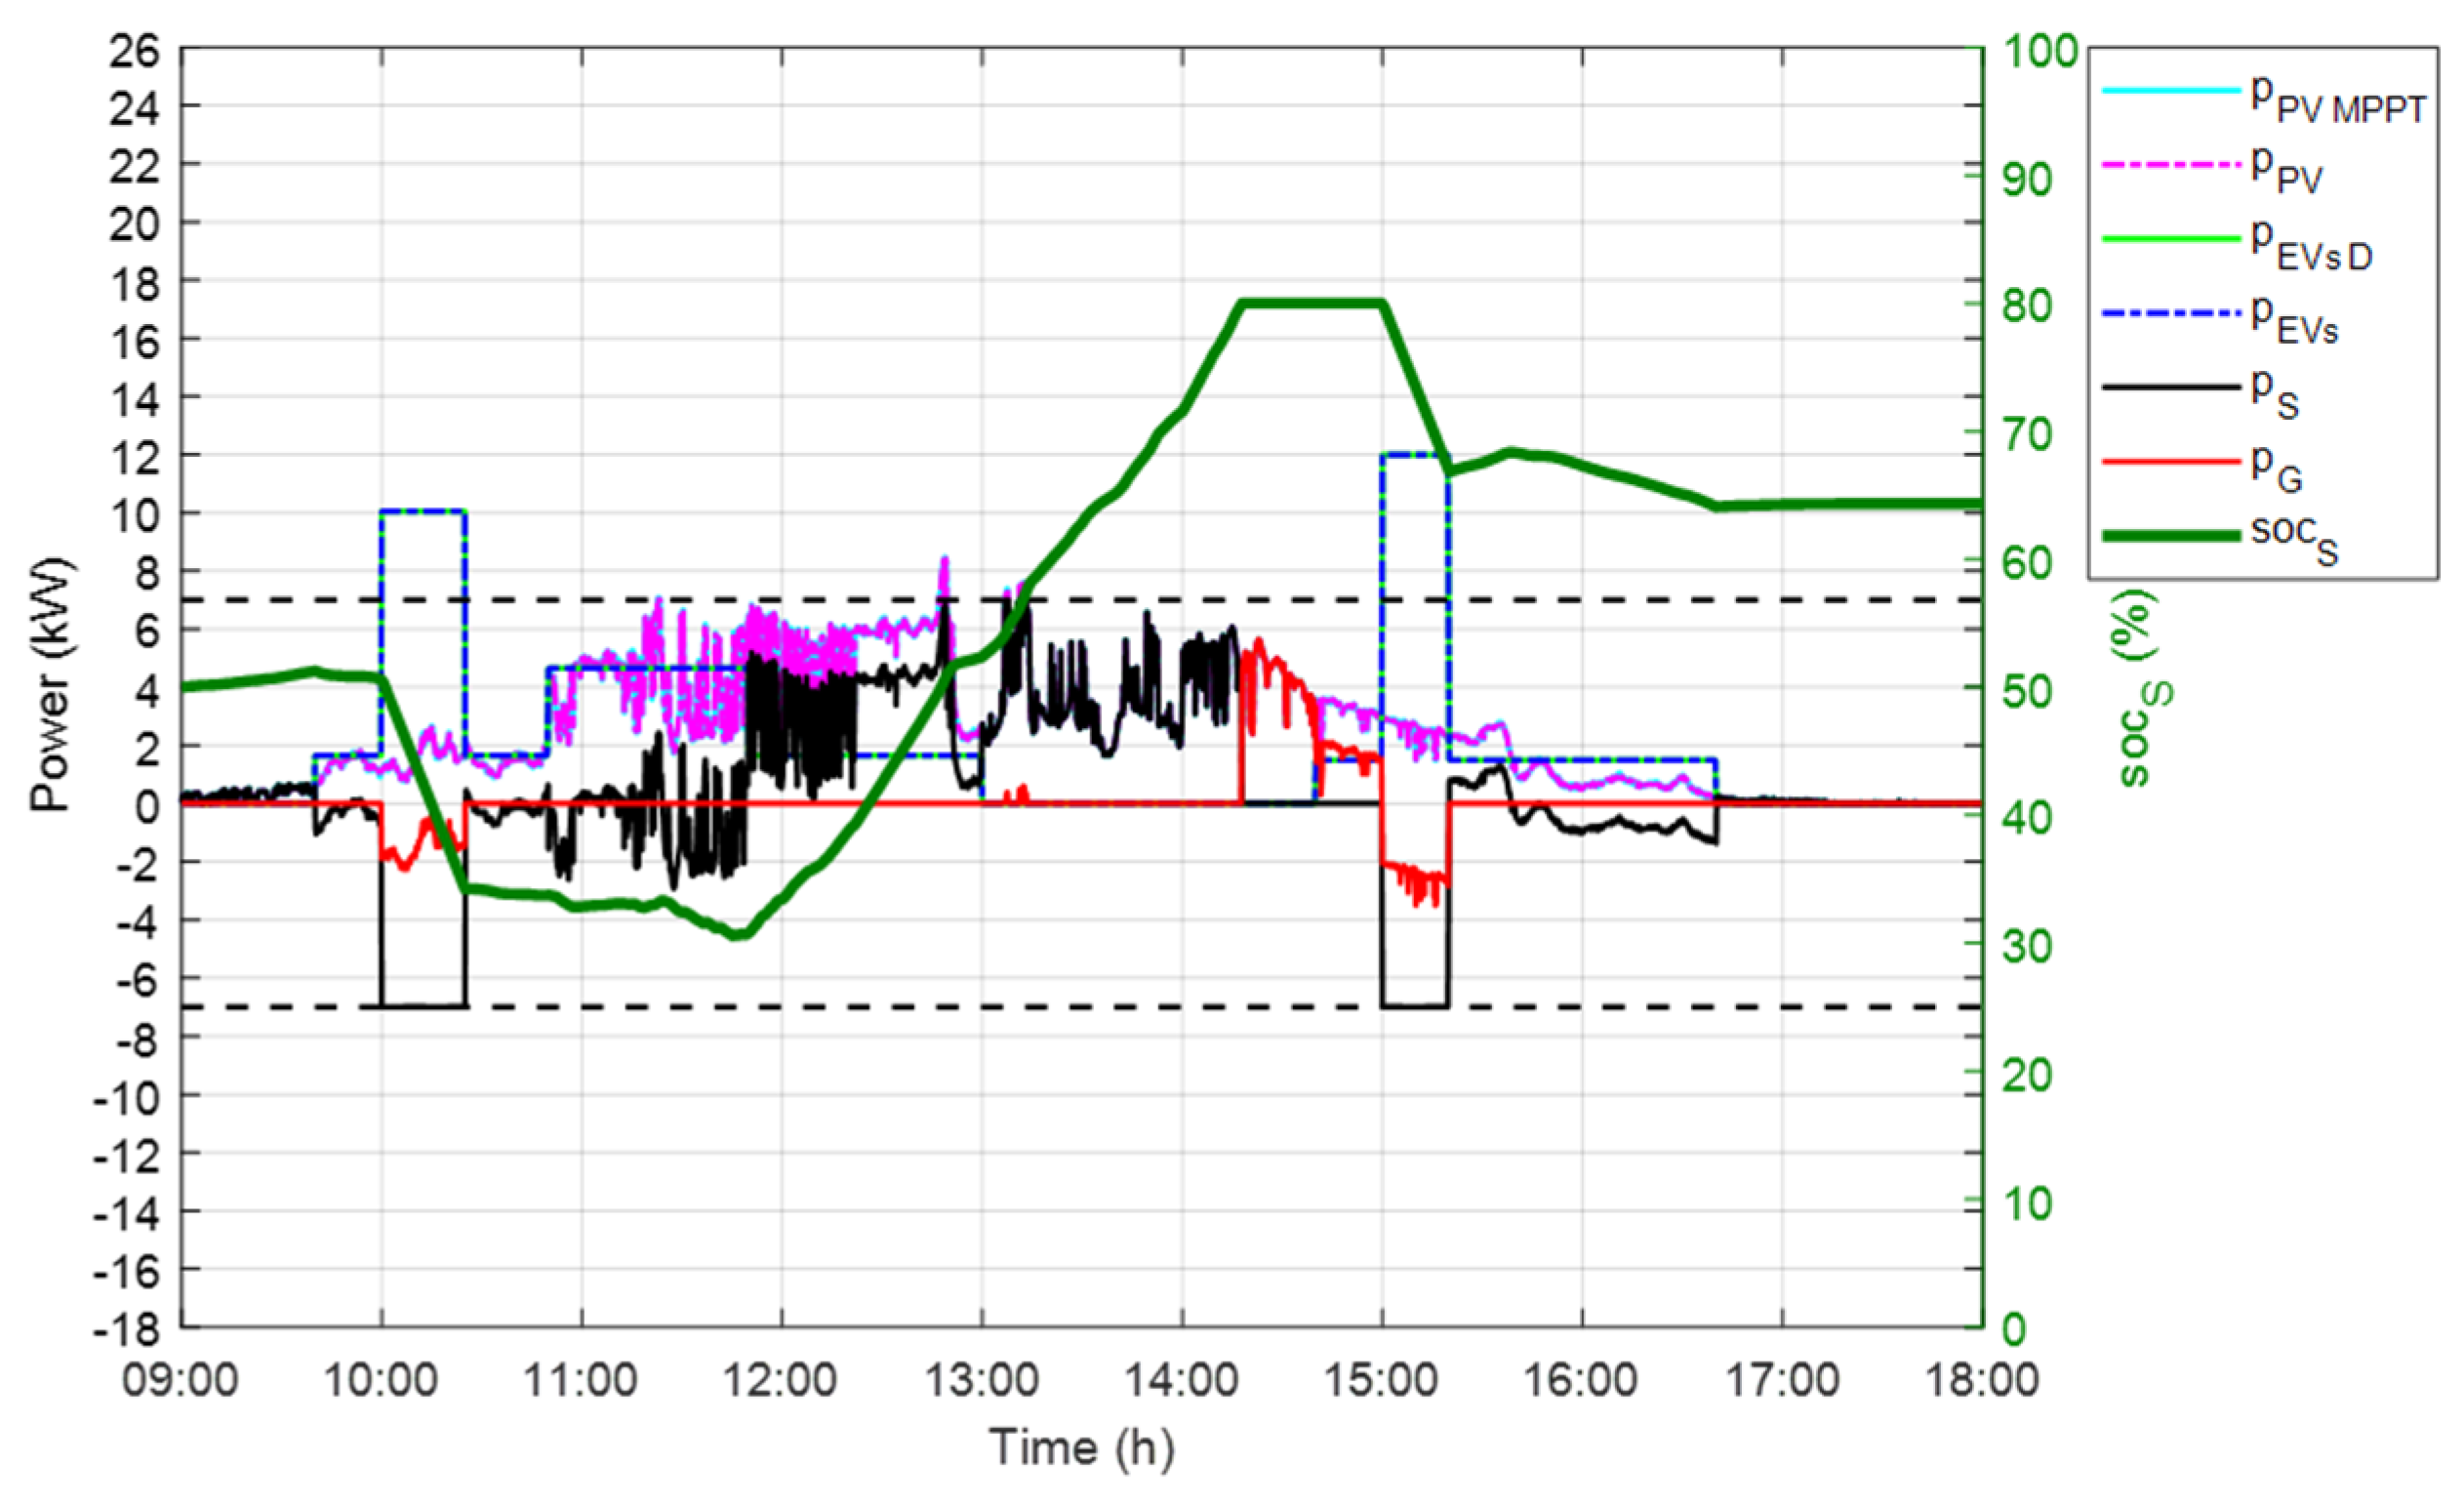
The total EV’s energy demand is 18.50 kWh.
Figure 20 shows the system power flows and the stationary storage SOC evolution. The stationary storage is charged only by PV energy, therefore, its power must be limited to not exceed the slow charging power of 7 kW.
PV and stationary storage share power to charge the EVs in slow mode. However, when an EV comes to charge in fast mode and the stationary storage has reached the power limit of 7 kW, the grid supplies the EVs, at 10:00–10:10 and 15:00–15:10. When the PV production is higher than the EV’s power demand, PV charges the stationary storage so it can supply further power afterward. Moreover, PV injects power into the grid when stationary storage reaches its capacity limit, SOC of 80% around 14:10–15:00, and when stationary storage reaches the power limit, around 13:10.
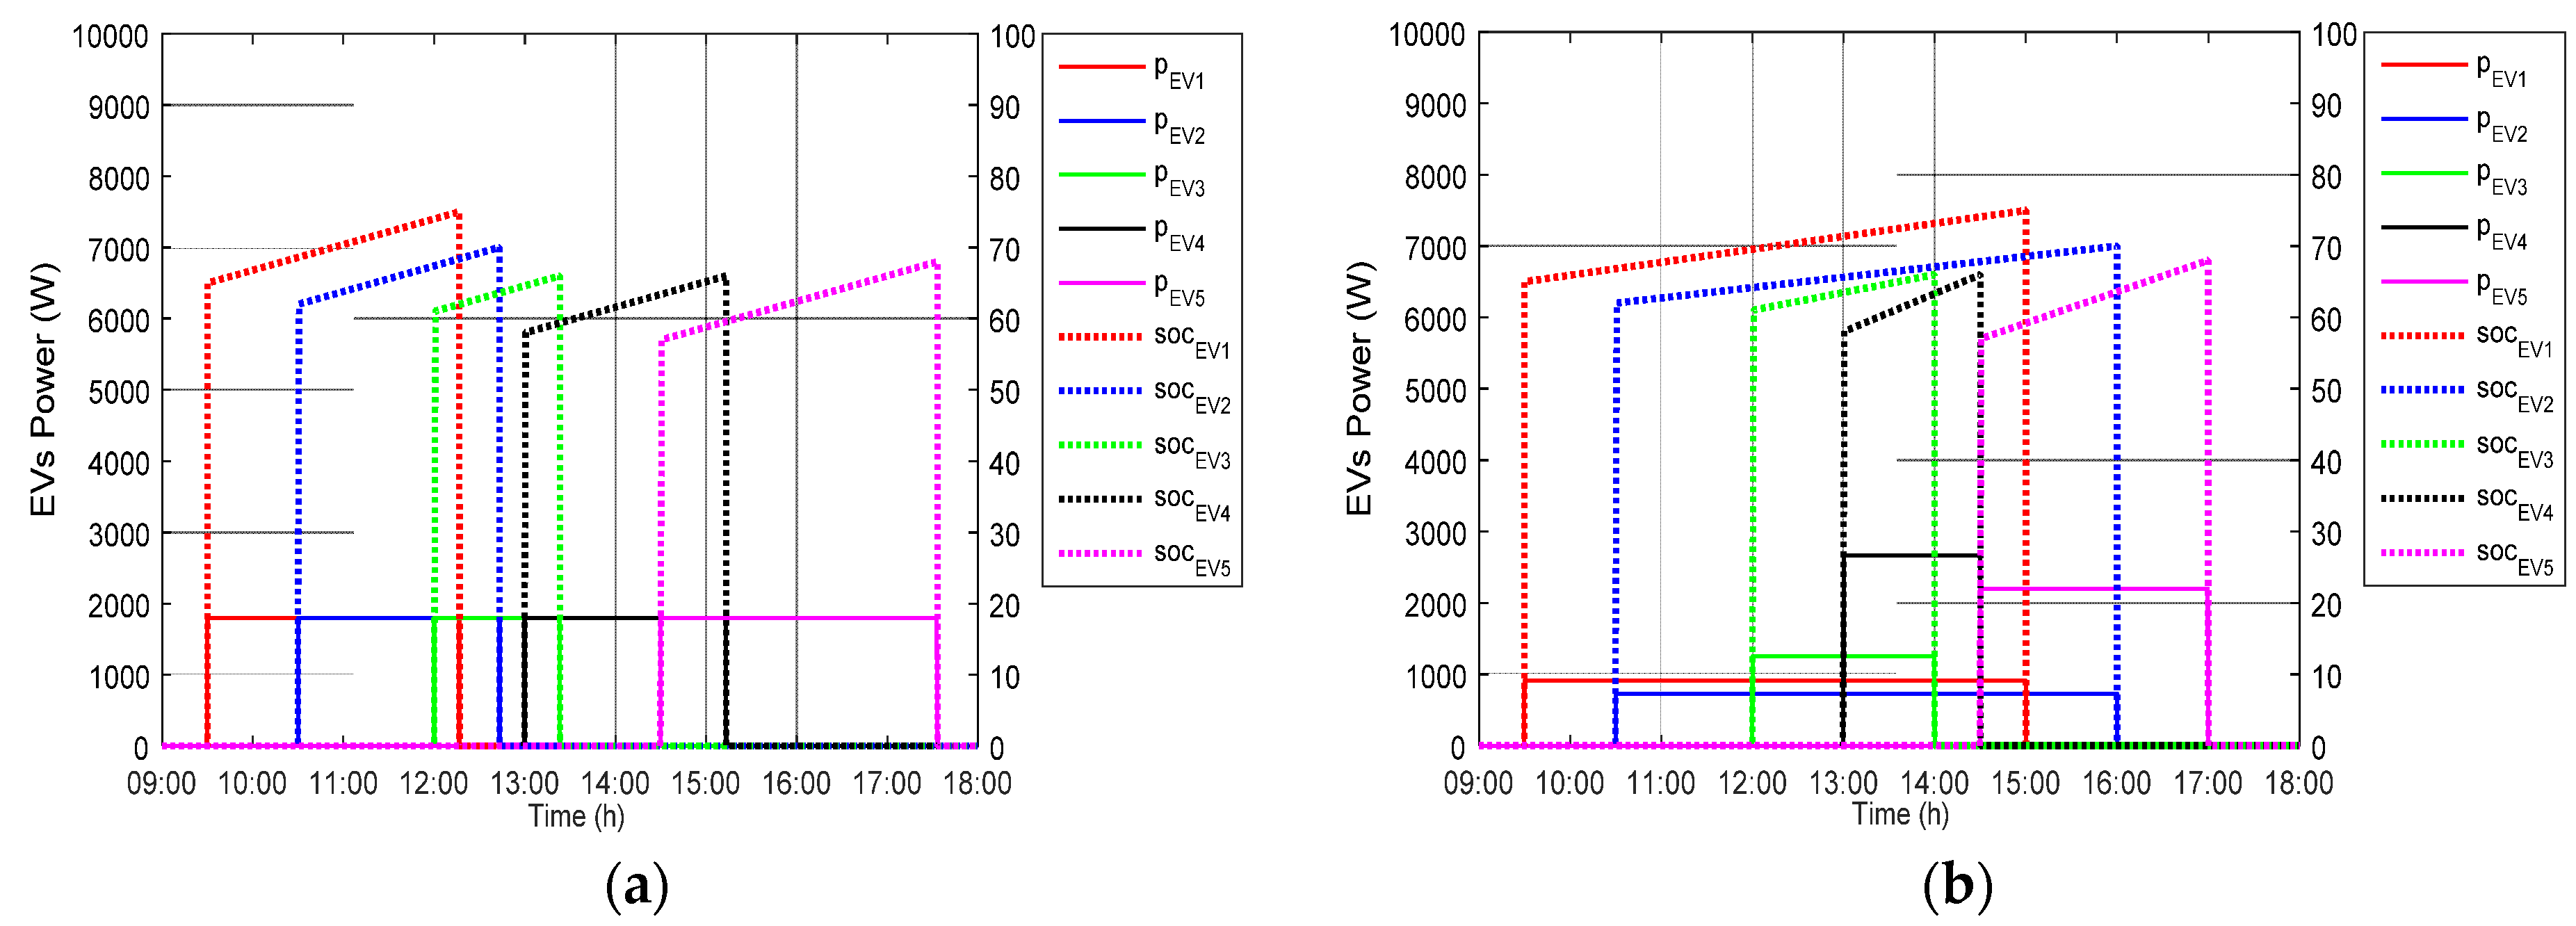
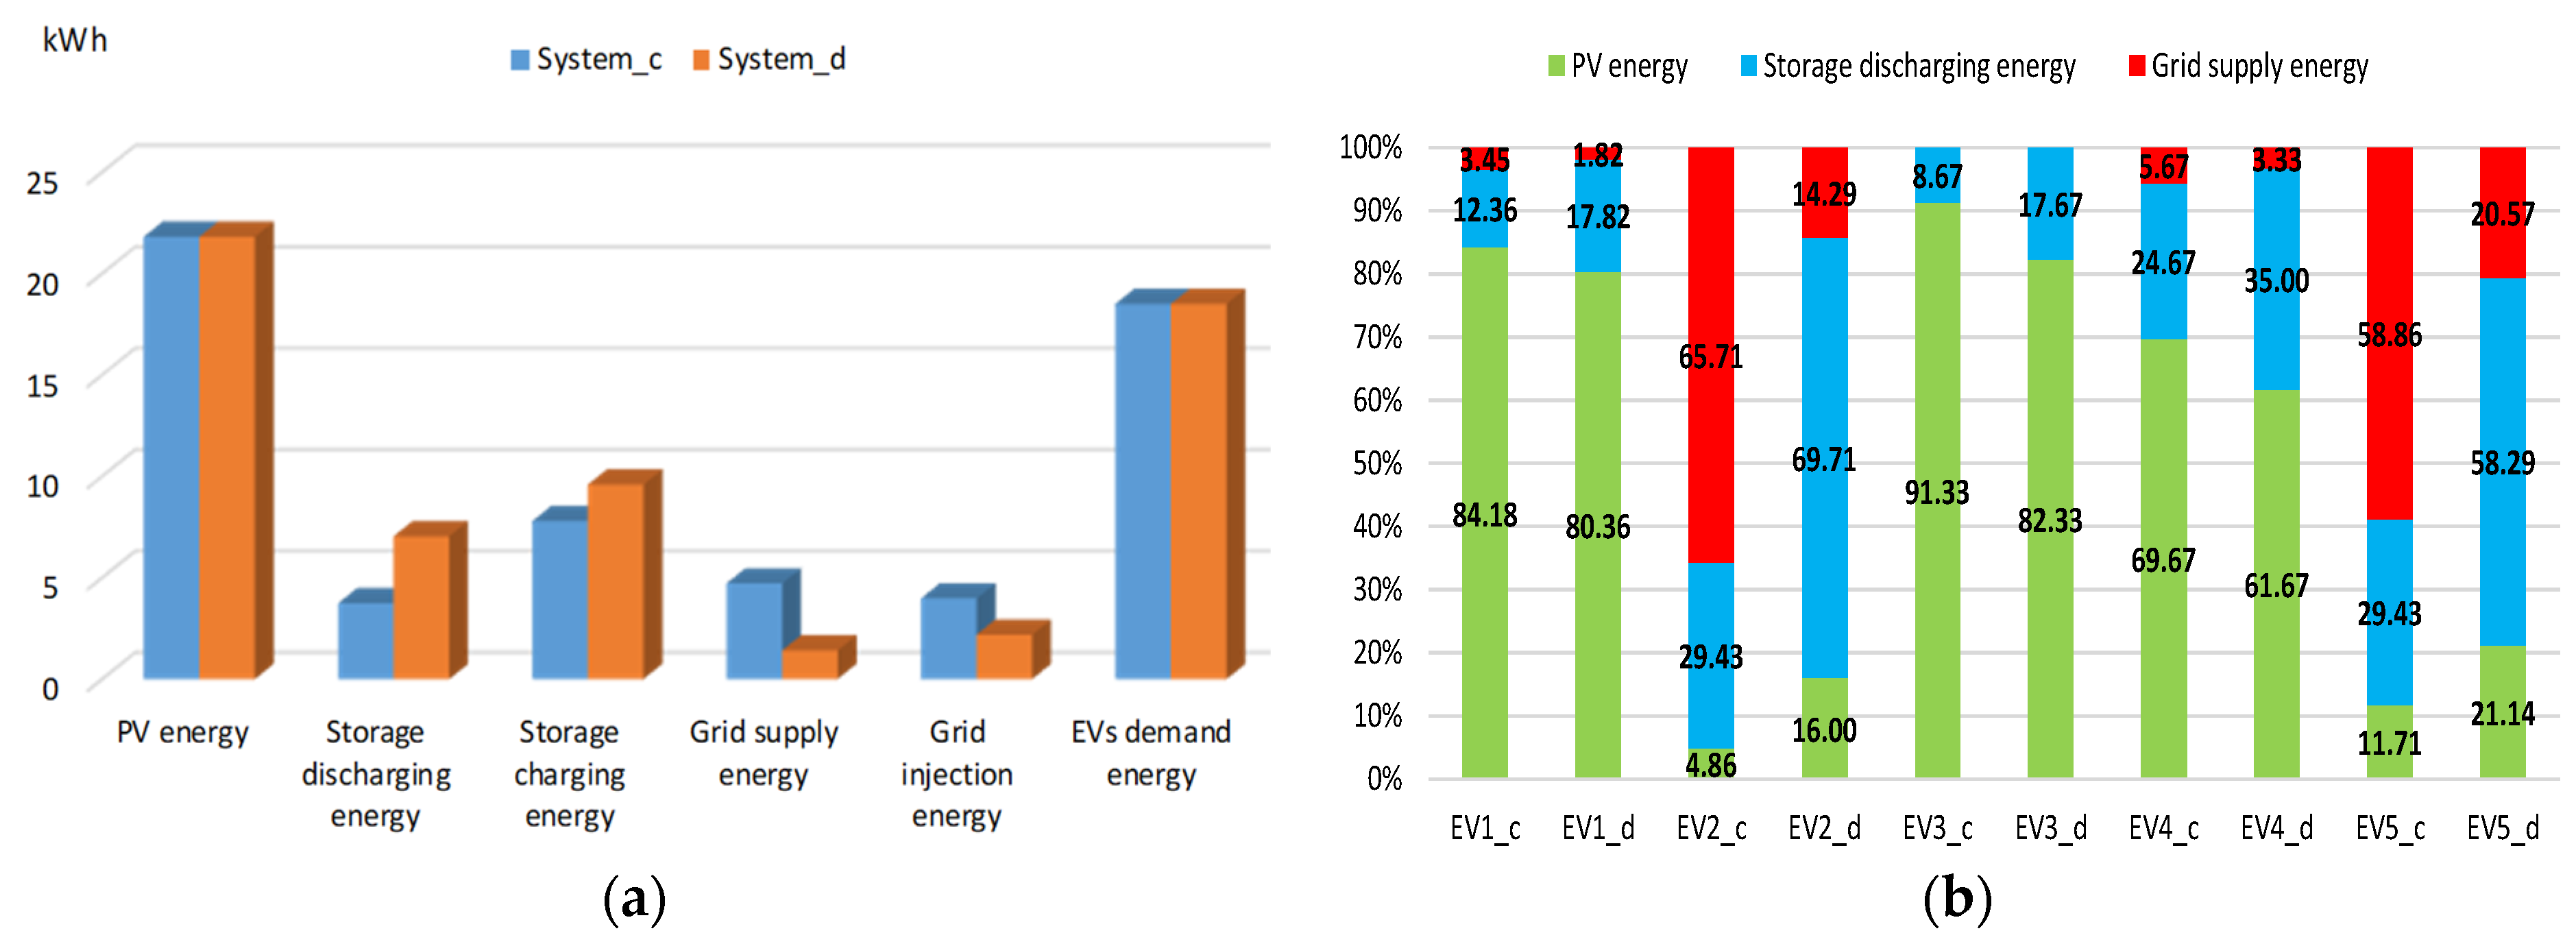
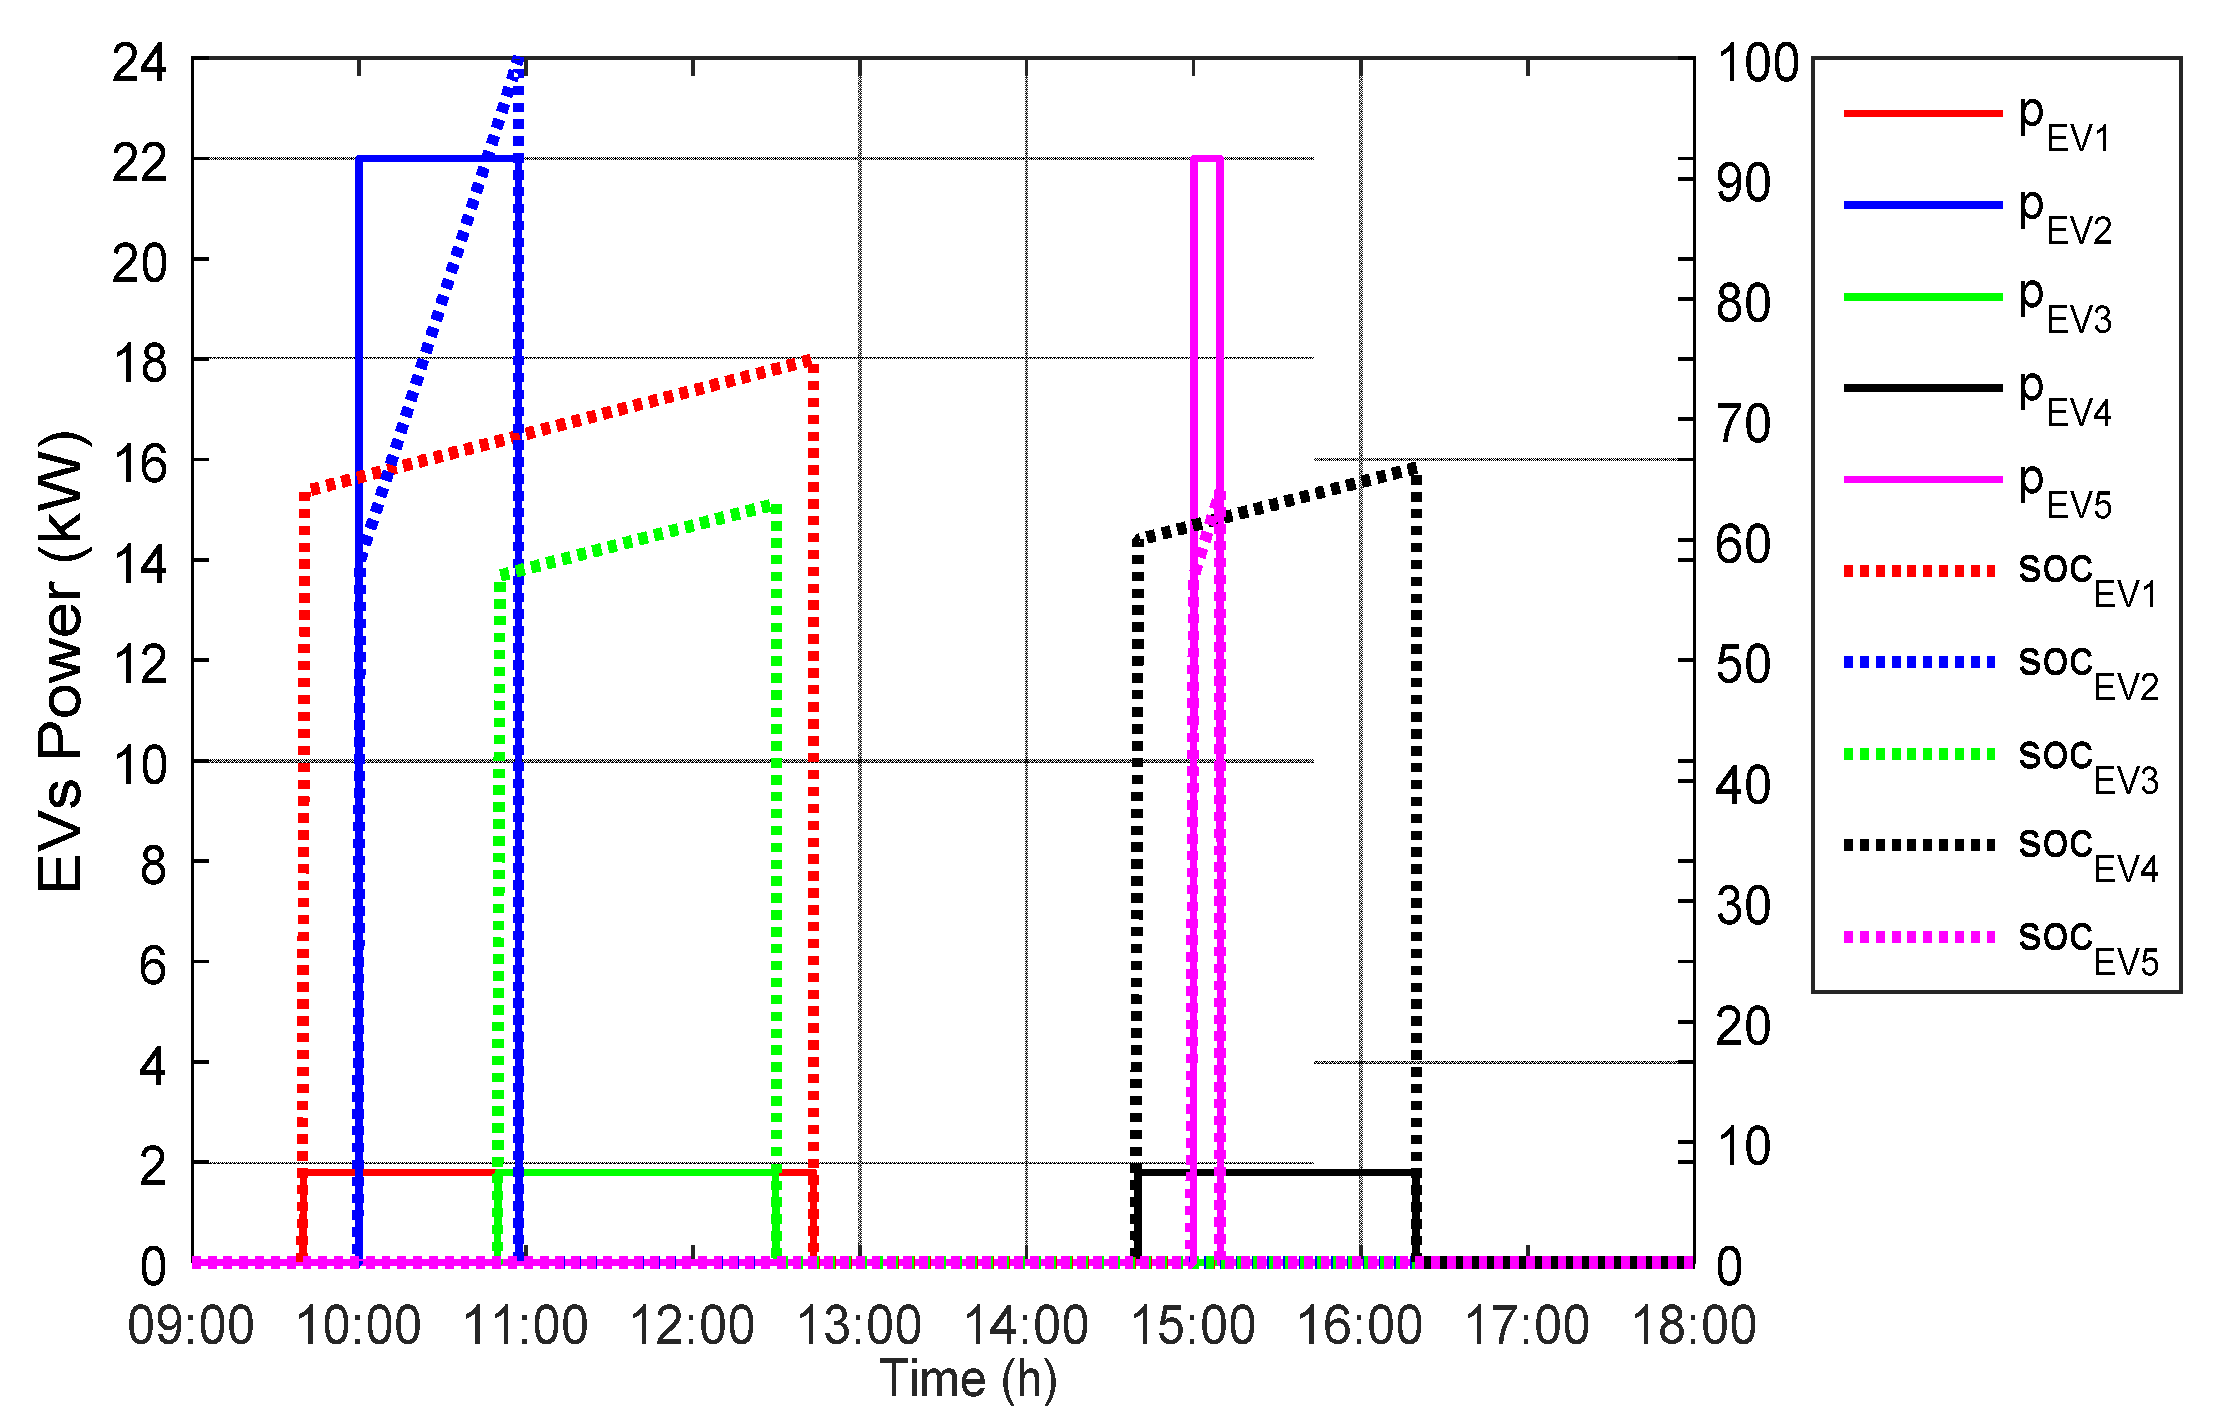
The EVs charging power and EVs SOC evolution for the two scenarios 2c and 2d are shown in
Figure 21.
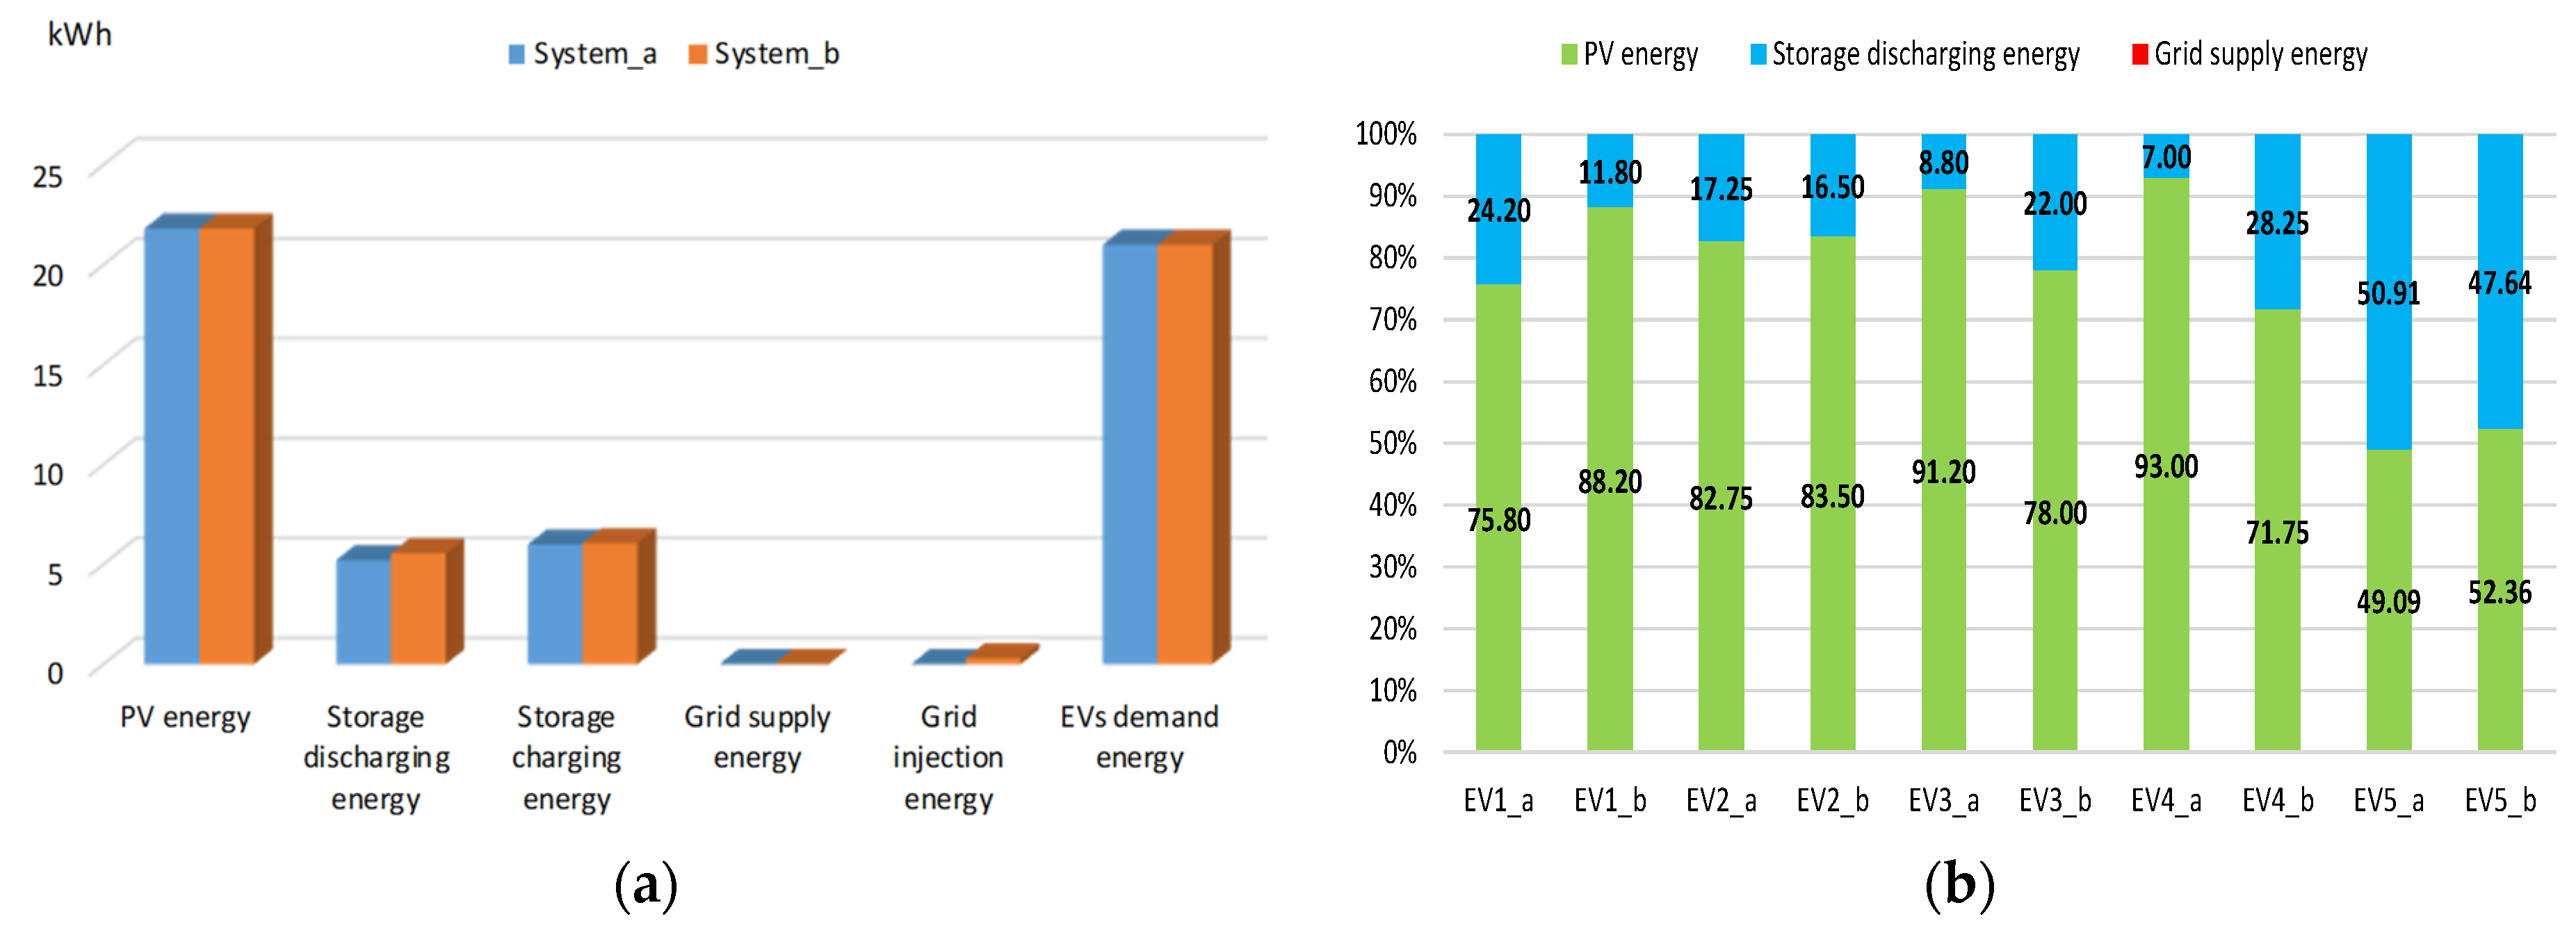
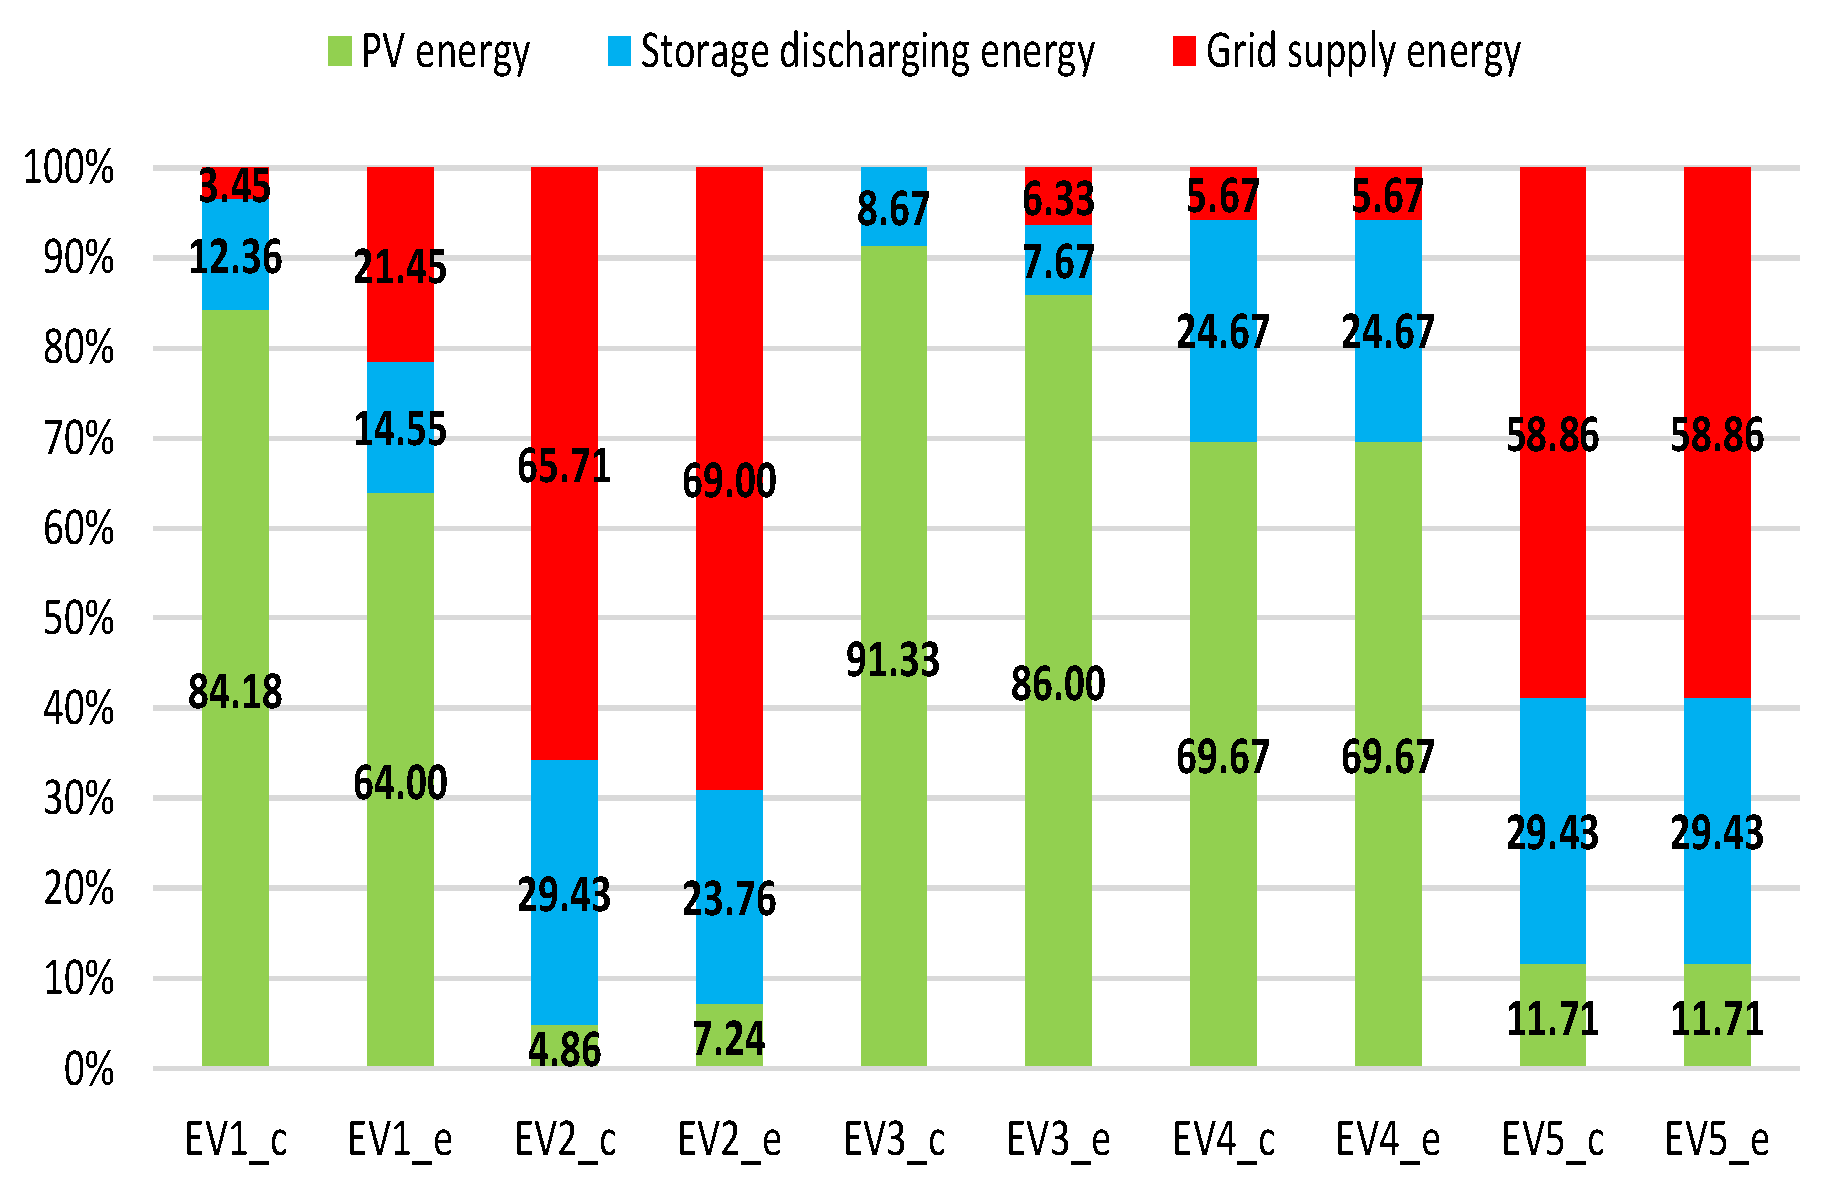
Figure 22 shows a comparison between the two scenarios. All EVs in slow mode are charged mainly with PV energy, except for EV4, where it comes in the late afternoon and the PV production is low. Whereas, EV2 and EV5 in fast mode are charged mainly with the public grid and a small portion with PV. Moreover, EV2 and EV5, since they charge in fast mode, will affect negatively EV1 and EV4 respectively.
In conclusion, scenario 2d shows that EV2 and EV5 consume more PV energy than in scenario 2c and the public grid dependency has been reduced. This shows that the variable charging power based on time duration availability can improve the PV benefits and the EVs can depend more on PV and less on the public grid. The stationary storage could be emptied quickly, if its power is not limited, since for EVs charging in fast mode their charging power could reach up to 22 kW. Thus, in scenario 2c, EV2 and EV5 charge with a greater percentage of public grid energy. However, since the stationary storage is charged by PV sources only, as mentioned earlier, this could prove the superiority of scenario 2d over scenario 2c, as the PV energy and stationary storage energy combined are higher than scenario 2c, as shown in
Figure 22d.
5.2.5. Scenario 2e
The hypotheses for scenario 2e are shown in
Table 7.
The total EVs demand energy is 36 kWh.
Figure 23 shows the system power flows and the stationary storage SOC evolution.
PV and stationary storage share power to charge the EVs in slow mode. However, when an EV comes to charge in fast mode and the stationary storage has reached the power limit of 7 kW, the grid supplies the EVs at 10:00–10:50 and 15:00–15:10. At 10:50, the stationary storage has reached its capacity limit, SOC of 20%, so the public grid supplies more power to the EVs since PV production is insufficient. When the PV production is higher than the EV’s power demand, PV charges the stationary storage so it can supply further power afterward. Moreover, PV injects power into the grid when stationary storage has reached the power limit, around 12:50 and 13:10.
The EVs charging power and EVs SOC evolution for scenarios 2e is shown in
Figure 24.
Figure 25 shows a comparison between the two scenarios. The difference in scenario 2e with scenario 2c is that EV2 wanted to charge 42% of its battery capacity in fast mode. Therefore, EV2 is charged mainly with the public grid and a small portion with PV. Moreover, EV2 will affect negatively EV1 and EV3 and, therefore, the PV benefits for EV1 and EV3 have reduced since EV2 charges in fast mode for around 1 h and the three EVs charge simultaneously for a while.
In conclusion, scenario 2e shows how fast charging mode affects negatively the other EVs currently in charge and their dependency on the public grid. The stationary storage could be emptied quickly, if its power is not limited, since for EVs charging in fast mode their charging power could reach up to 22 kW. In contrast to scenario 2d, in scenario 2e, EV2 charges with 22 kW, and the requested SOC at departure is 100%. Therefore, the percentage of stationary storage energy remains low. So, the main issue for PV-powered EV charging stations, is how to increase PV penetration for EVs charging? In what conditions? What is the appropriate sizing of the system?
5.3. Discussion
In scenario 1, only one EV is charged in slow mode with a private charger. It is shown that the known park time could bring PV benefits and reduce public grid dependency, which will decrease the charging price for the EV user. In Scenario 2, there are five EVs that are charged with public chargers. Regarding scenario 2a versus 2b, where all EVs are charged in slow mode, it is shown that scenario 2b may be superior to scenario 2a, where PV benefits are greater since the park time is known for each EV. Regarding scenario 2c versus 2d, where three EVs are charged in slow mode and two EVs are charged in fast mode, it is shown that EVs charged in fast mode depend mainly on the public grid and stationary storage energy while EVs charged in slow mode depend on PV energy. However, when the park time is known and longer than the time actually needed to charge, PV benefits could increase and public grid dependency could be reduced. Regarding scenario 2e, the same conditions as for scenario 2c are applied but EV2 requests full charge (100%) in fast mode. It is shown that EV2 affects negatively EV1 and EV3 since they coincide some of the time, this will reduce PV benefits for EV1 and EV3. Moreover, EV2 is largely dependent on the public grid and stationary storage energy. The stationary storage power is limited to 7 kW, so it will not be emptied quickly if some EVs want to charge in fast mode.
The simulation results show, for fast charging mode, that EVs depend mainly on public grid energy. Moreover, the public grid energy tariff is dynamic in reality and it is high in peak times. Therefore, EV users who want to charge in fast mode are supposedly willing to pay higher bills. However, knowing that charging the EV in fast mode is costly, EV users will tend to change their behavior and choose to charge in slow mode since it is cheaper. Hence, an economic model is necessary for the PV-powered charging station to optimize the EV charging power, have the best power distribution for energy sources, and have the lowest cost for charging EVs, which is the key factor to influence EV users.
Nevertheless, uncertainties always exist in the real world. However, in the present study, the uncertainty of the demand profile by EVs is always ensured by first, the stationary storage and then by the public grid when there is uncertainty in PV generation to ensure power at all times. Regarding the EV’s capacity, it is assumed that all EVs are the same. For EV’s SOC and operating schedules, these are taken as hypotheses, where they represent the data and choices of EV users that they choose through the human-system interface. The demand profile of EVs is hard to predict as it depends on various factors (type of user, charging preference, and energy demand). Therefore, the arrival time of the EV, SOC of the EV at arrival, and its requested SOC at departure are assumed arbitrarily but cover many cases.
Finally, to increase PV benefits, the preliminary requirements and feasibility conditions for a PV-powered charging station may be summarized as follows:
Moreover, PV power generation depends on the geographical location and weather conditions, as solar irradiation and the temperature of the PV modules. Proper sizing of the stationary storage is required. A user interface is required to facilitate the interaction between the EV users and the charging station and to take into consideration EV user choices. The parking time, which is the time availability of the EV in the charging station, is better to be known and longer to increase PV benefits. The system limitations could be presented as low PV energy production throughout the year due to geographical location for the scenarios taken into study. The stationary storage physical limits and proper sizing must be studied and well adjusted to fit the charging station dimensions. However, the public grid can always provide energy or can buy energy when there is an excess of PV production as for case 2 where no grid limits have been imposed.
6. Conclusions
This study focuses on the preliminary requirements, feasibility conditions, and business model of PV-powered EV charging stations in an urban area. The simulation results show that the EV charging demand are not constrained; the EV user can charge from slow to fast mode, and no restrictions for EV battery capacity (). However, the PV benefits have increased when the average daily urban/peri-urban trip of 20–40 km is considered, with an EV consumption of 10–15 kWh/km, which gives the daily charge needed of 2–6 kWh. In addition, the maximum PV benefits are proved for the daily EV charging instead of weekly and when the park time is known.
For the requirement and feasibility conditions, two charging modes are possible; slow mode up to 7 kW based mainly on PV energy and storage and EV filling capacity up to 6 kWh, fast mode from 7 kW and up to 22 kW based mainly on public grid energy. Proper sizing of the stationary storage system is required and social acceptance relative to longer charging duration for slow mode and higher charging price for fast mode, so a business model is important.
The two main concerns, highlighted in the case studies, are the control-command of the system, i.e., PV-powered EV charging station based on stationary storage and public grid, and the business model that is able to influence consumer behavior through price charging.
Future studies will concentrate on defining the proper size of the stationary storage, adjust its physical limits based on the charging station dimension, and propose a business model with appropriate price charging for EV users. Then, validate the simulation with real-time experimental tests. In addition, a human-system interface has to be built according to the PV-powered charging station definition and requirements. Furthermore, defining the barriers, solutions for PV-powered EV charging stations, and a survey on social acceptance must be conducted, and proposing new services vehicle-to-everything (V2X) associated with PV-powered EV charging stations.


