1. Introduction
Due to the advantages of no noise, low environmental pollution, high efficiency of energy use, and simple structure, electric vehicles (EVs) have received widespread attention [
1,
2]. With the development and popularization of EVs, large-scale EVs will be connected to the public grid for charging in the future [
3,
4]. The EV distribution in time and space has great randomness and uncertainty [
5,
6], thus, a large number of random and unmanaged EVs having access to the public grid will inevitably have a serious impact on the public grid: load growth, increased difficulty in public grid operation control, and a large number of power distribution network upgrades [
7,
8]. Therefore, how to coordinately control the energy flow between EVs and the public grid is a key issue.
In order to reduce the peak loads, the paper [
9] proposes a real-time dynamic pricing model for EVs charging/discharging service and building energy management. In practice, many EVs are traveling on the road for only 4–5% of the day, while they are parked for the rest of the time [
10]. Research on bidirectional on-board chargers makes electric vehicle (EV) discharge possible [
11]. EVs can discharge into the public grid during its “peak” periods and can be charged during its “valley” periods to achieve the purpose of peak shaving and valley filling [
12]. When EVs need an energy supply, they are connected to the public grid as charging loads; when EVs are idle, i.e., EVs are seen as distributed power sources, EV battery energy can be injected into the public grid. This is the vehicle-to-grid (V2G) operation. Thus, V2G technology makes it possible for EVs to have a mobile battery function [
13]. Moreover, compared with common loads, EVs have greater flexibility and dispatchability. When reasonable scheduling strategies for V2G technology are designed, and the charging/discharging behavior of EVs is planned, EV charging costs will be reduced, most importantly, the load curve of the public grid will be improved. The paper [
14] proposes a time-based charging group dispatching approach to schedule the charging of numerous EVs, which enables EVs to play an important role in peak shaving and valley filling, meanwhile solving the stability problem of the microgrid system brought by the penetration of renewable energy. EV batteries and related power electronics can be used to mitigate photovoltaic (PV) sources’ impact and support the public grid with appropriate control strategies. The paper [
15] develops a controllable charge/discharge pattern to optimize the limitation of EV battery capacity and the impacts of PV sources. Most importantly, EVs can provide instant power, which is much faster than starting a standby power source. So, V2G technology enables EVs to act as emergency power sources in the event of a power outage [
16,
17]. V2G can bring economic benefits to EV users, offset part of the EV costs, promote communication between the public grid and EVs, meanwhile, protect the environment, and solve the shortage of fossil energy. V2G services are important for reducing environmental pollution, mainly referring to the emission of greenhouse gases such as CO2 [
18].
With the continuous development of renewable energy, such as PV sources, more and more renewable energy is being integrated into the power system in large quantities. Considering the intermittency and distribution of PV sources, microgrids are proposed to achieve small-scale renewable energy penetration while reducing the public grid stress [
19,
20]. Surveys show that most EV users can accept the intelligent EV charging station based on a microgrid [
21,
22]. The paper [
23] proposes the model for an EV charging station. However, the above microgrid models and simulations do not consider V2G. Traditional V2G technology mainly refers to EVs directly connected to the public grid for energy exchange. Generally, two types of control exist in systems: centralized control and decentralized control [
24]. The former has high construction costs, while the latter has the problem of difficult control. Therefore, the V2G based on a direct current (DC) microgrid control mode is proposed, which makes EVs connect to the public grid through a DC microgrid, moreover, it effectively integrates renewable energy, whilst meanwhile saving the cost of buying electricity from the public grid. V2G based on the microgrid is used for multi-objective optimization coordination between EVs and the public grid to minimize grid load fluctuation, maximize renewable energy utilization, and maximize the benefits for the EV users [
25]. The paper [
26] proposed a centralized model to co-optimize the transformer loss-of-life with benefits for EV users on charging/discharging management. As an optimal energy cost solution, cyber insurance was introduced to guarantee the best price for charging/discharging, which is effective not only in dealing with cyber risks but also in maximizing revenue for EV users [
10]. The paper [
27] develops a model predictive control-based approach to address joint EV charging scheduling and power control to minimize both EV charging cost and energy generation cost in meeting both residence and EV power demands.
A DC microgrid with integrated V2G has also been examined in other papers [
28,
29]. The paper [
28] proposes an optimal day-ahead operation planning procedure that aims to minimize microgrid operation daily costs, according to suitable load demand and source availability forecast without involving MATLAB/SIMULINK modeling. The review paper [
29] focuses on the charging system components, architecture, operational modes, and control, including the interaction between the PV sources, public grid, energy storage unit, and power electronics, however, it does not take into account the management of multiple EVs. In addition, V2G was characterized as a comparatively advantageous means of peak load shaving [
10]. The paper [
24] proposes an optimal logical control algorithm based on V2G to reduce the average charging cost of EVs, which is dedicated to the French energy billing system within the peak/base hour’s contract. The algorithm can minimize the EV charging cost and maximize energy selling by using daily energy price profiles, considering constraints and disruptions: EV arrival/departure times, and the desired state of charge (
) for the next use. However, this algorithm has not yet involved a PV-powered charging station and research in the microgrid field.
In a V2G system, the EV charging station can obtain the optimal charging/discharging start time by reading the EV’s arrival time, departure time, initial state of charge namely , and the state of charge limit at the time of departure, namely . Based on the above, this paper proposes an EV charging station management with integrated V2G, in which the optimal charging/discharging start time for EVs can be achieved to perform the purpose of peak and valley filling through a dynamic searching peak and valley algorithm (SPVA). Compared with the power limit of the public grid in the “valley” period, the power limit of the public grid absorbed from the microgrid is larger, while the power limit of the public grid released to the microgrid is smaller during the “peak” period. Therefore, when EVs connect to discharge, the charging station will select a time point near the “peak” periods for EVs; when EVs connect to charge, the charging station will choose a time point far away from the “peak” periods, which can not only relieve the pressure on the public grid but also reduce unnecessary charging costs.
In order to protect the stability of the public grid, the energy injected into the public grid needs to be limited, namely the self-protection mechanism of the public grid. To better ensure the stability of the public grid, the power limit of the power grid is set to different values according to the “peak” periods and “valley” periods.
This paper studies the power management of a PV-powered charging station with integrated V2G from two aspects of energy scheduling and real-time control. The main contributions of this work are:
- (1)
An EV charging station model combined with V2G based on a DC microgrid is proposed, which consists of four parts: PV sources, a storage system, a public grid connection, and EVs. This model makes use of EV’s “load-source” character to bring benefits to users while meeting user needs.
- (2)
A suitable power management strategy for the EV charging station with integrated V2G is proposed. In the strategy, the priority order for charging EVs is PV sources, the storage system, the public grid. During the “peak” periods of the public grid, the DC microgrid discharges to the public grid, and the discharge priority order is PV sources and then the EVs, considering the discharge cost.
- (3)
The SPVA is proposed to calculate the optimal charging/discharging start time of EVs to achieve the effect of peak shaving and valley filling, while meeting the charging requirements of EVs, taking into account the EV arrival time, departure time, , and . Most importantly, it reduces the cost of the public grid, which is beneficial to the public grid and EV users.
- (4)
A reasonable electricity price mechanism is set which provides the possibility for SPVA. In order to protect the stability of the public grid, the charge/discharge power limits are different in accordance with the “peak” periods and “valley” periods of the public grid.
The presented DC microgrid structure with integrated V2G is described in
Section 2. Power flow management: grid-to-vehicle (G2V) and V2G algorithm is introduced in
Section 3. Simulation results and analyses are presented in
Section 4. Conclusions and further works are given in
Section 5.
2. DC Microgrid Structure with Integrated V2G
The microgrid, which plays an important role in the production of a smart grid, which can produce the integrated operation of multiple power sources and loads, can coordinately control the public grid and can meet users’ requirements for power quality, power reliability, and safety.
A microgrid based on a DC common bus is considered due to its superior current control because there are no negative and zero sequence currents [
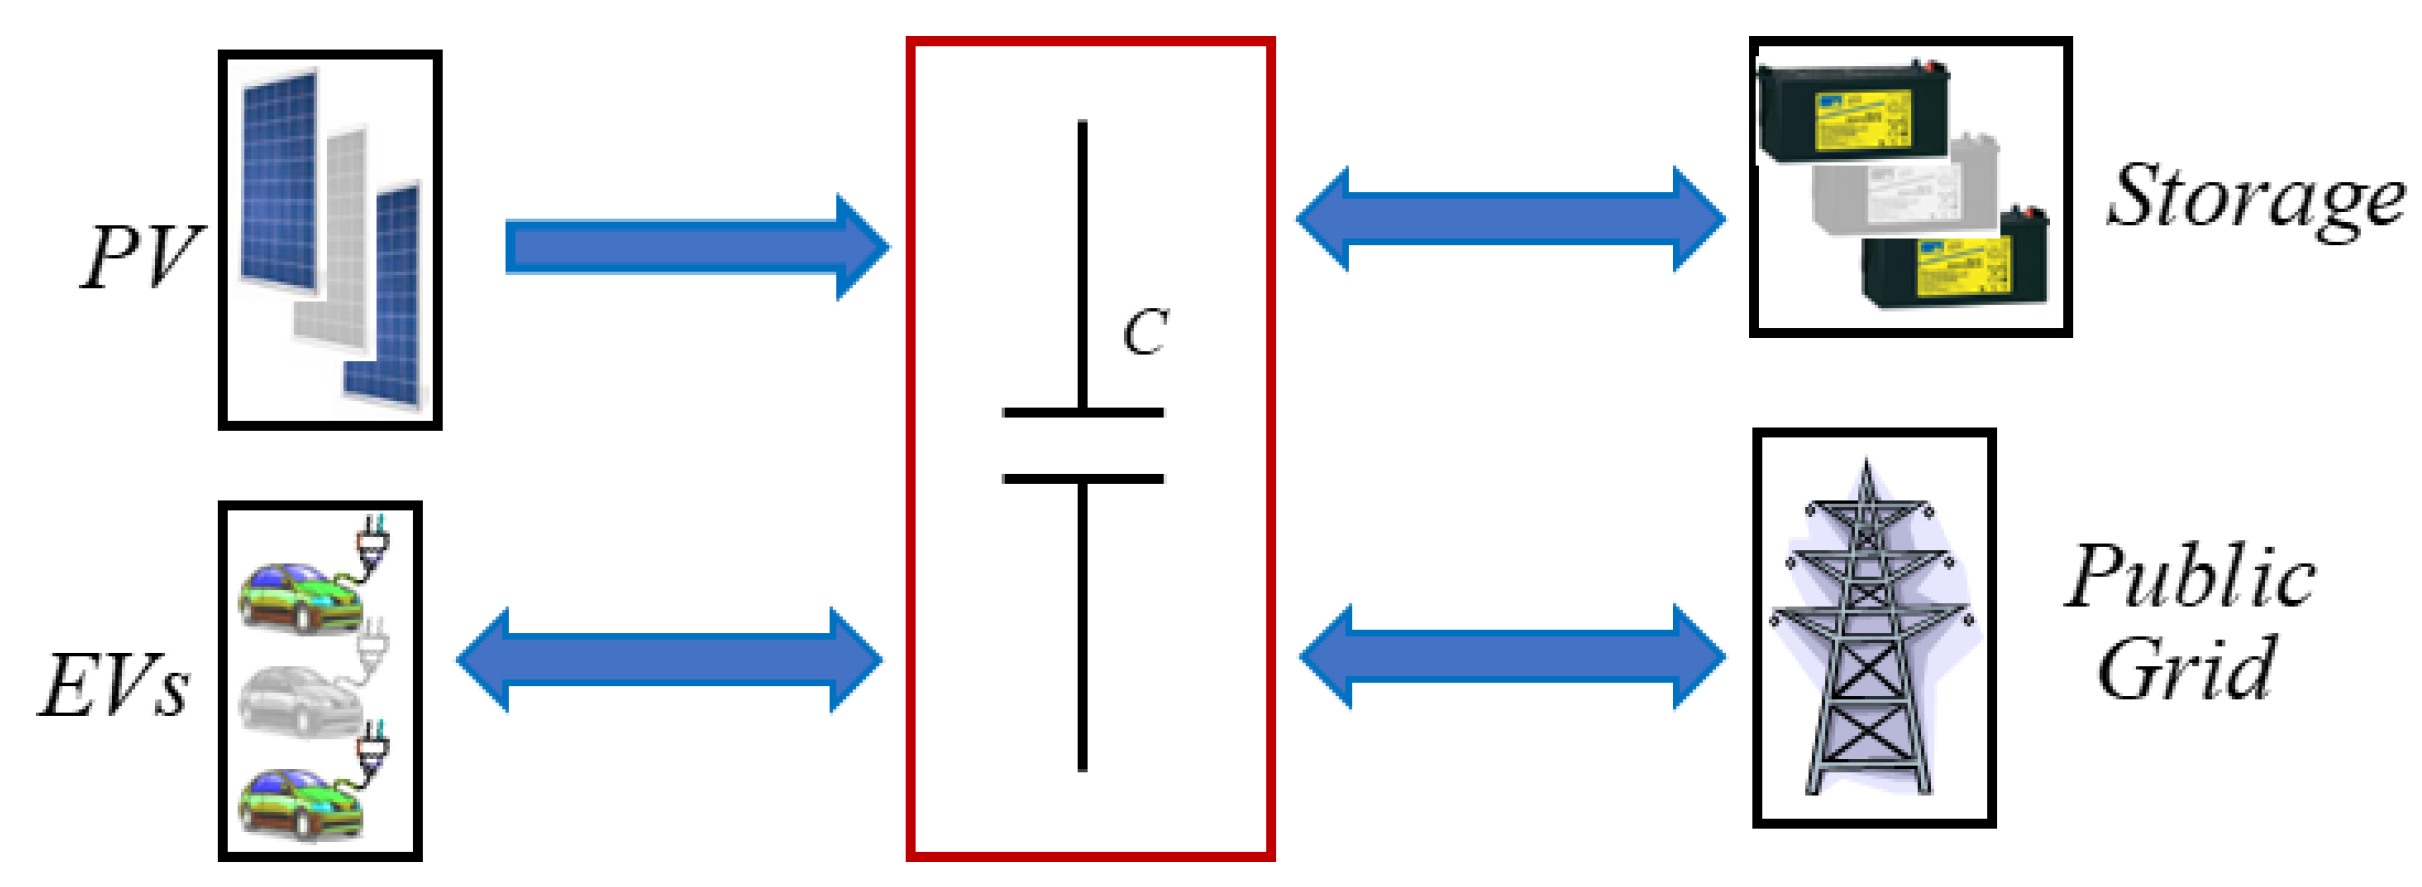
30]. The design of an EV charging station including V2G is based on DC microgrid. As shown in
Figure 1, the DC microgrid is composed of four parts: PV sources, a storage system, a public grid connection, and EVs.
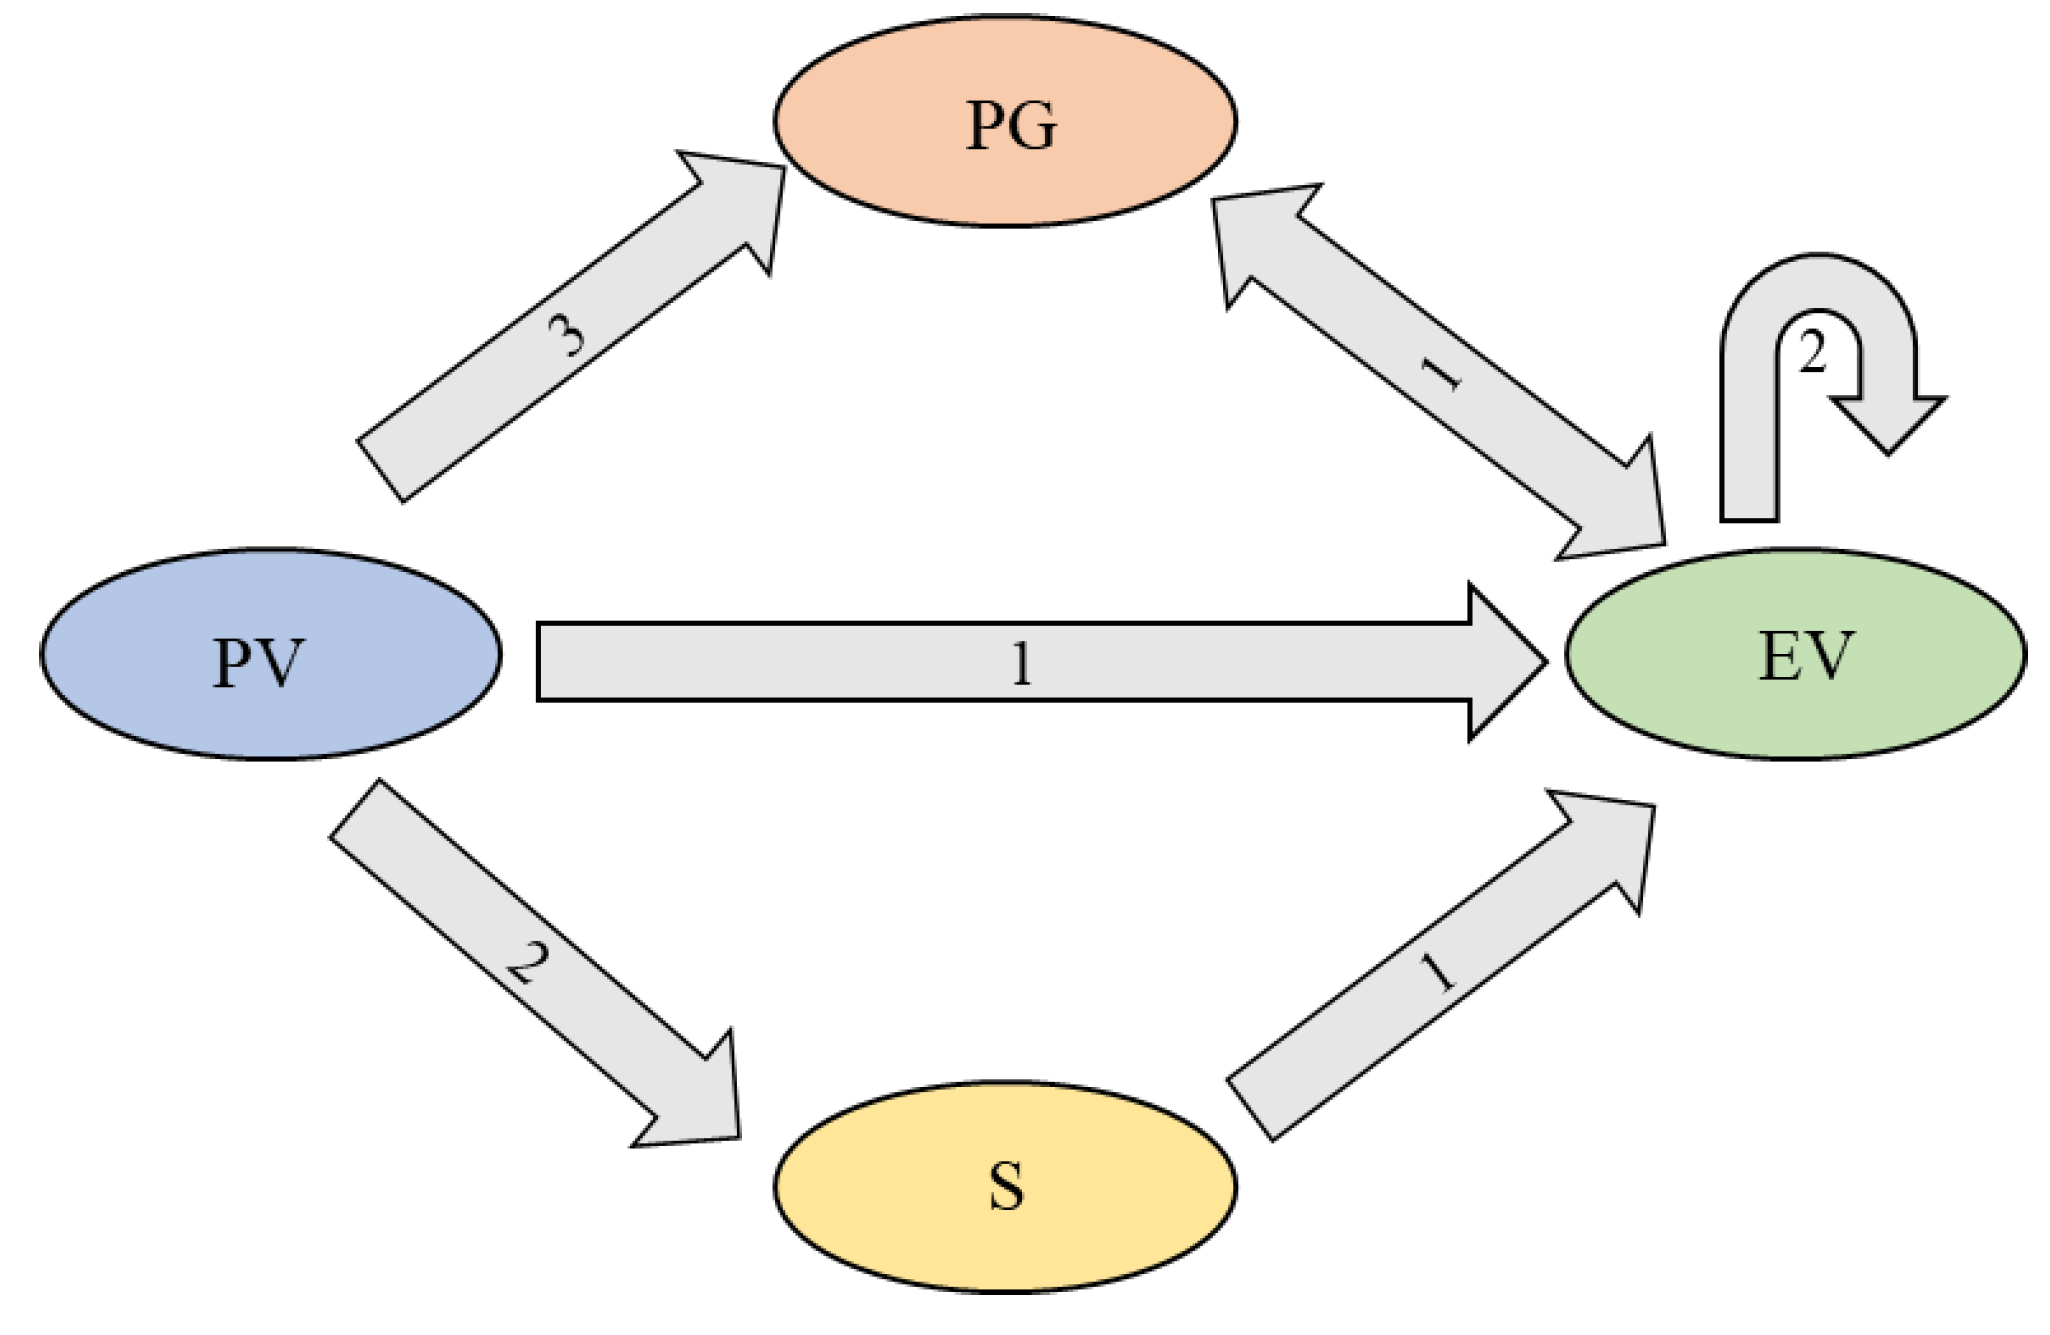
DC microgrid power flow is shown in
Figure 2: “PV” represents PV sources, “PG” represents the public grid, “S” represents the storage system, “EV” represents EVs. The real-time power priority is shown by the arrow. For example, PV sources firstly support EVs, secondly charge storage, then thirdly inject into the public grid.
According to the “peak” periods and “valley” periods of the public grid, the energy flow of the DC microgrid can be divided into two cases. During the “valley” periods of the public grid, the electricity produced by PV sources is first used to charge EVs. Storage is the second-ranked energy source for charging EVs; in addition, it is also used to absorb excess energy produced by PV sources. The public grid is the third-ranked energy source for charging EVs, and it can buy excessive energy from PV sources. During the “peak” periods of the public grid, the order of charging EVs is the same as the “valley” periods of the public grid, and the difference is that V2G is achievable during this period. If the energy produced by PV sources is still surplus after being supplied to the EVs, to adjust the peak–valley difference of the public grid, PV sources can inject excess energy into the public grid. Besides, the energy released by EVs can be injected into the public grid. Considering the energy cost, the order of injecting energy into the public grid is PV sources firstly, then EVs batteries.
During the period of V2G, in order to ensure the power balance of the public grid, the power injected into the public grid, namely
, should be limited. It may be assumed that the maximum power injected into the public grid cannot exceed the estimated PV power under standard test conditions (STC), namely
, which is shown in Equation (1), where
is PV power that can be injected into the public grid,
is the power that EVs can output.
is the coefficient of PV power, and
is the coefficient of the energy that EVs can release.
4. Simulation Results and Analyses
In the DC microgrid system, PV sources include 400 PV panels (40 in parallel and 10 in series), and its power under standard conditions is 100 kW [
31]. The storage voltage and capacity are 300 V and 300 Ah, respectively. The public grid is a low-voltage three-phase network with a frequency of 50 Hz. The charging method of lithium-ion batteries in EVs is constant current/constant voltage, while the discharge is constant power. The battery energy of EV is about 24 kWh, namely
. There are three charging modes in the charging station: fast mode whose maximal charging power is 83 kW, namely
; average mode whose maximal charging power is 27 kW, namely
; slow mode whose maximal charging power is 7 kW, namely
.
4.1. Simulation Conditions and Assumptions
In order to ensure the validity of the simulation, it is assumed that all EVs have the same battery characteristics. We can configure different battery characteristics, such as capacity, according to the EV model [
32], which will be mentioned in future research.
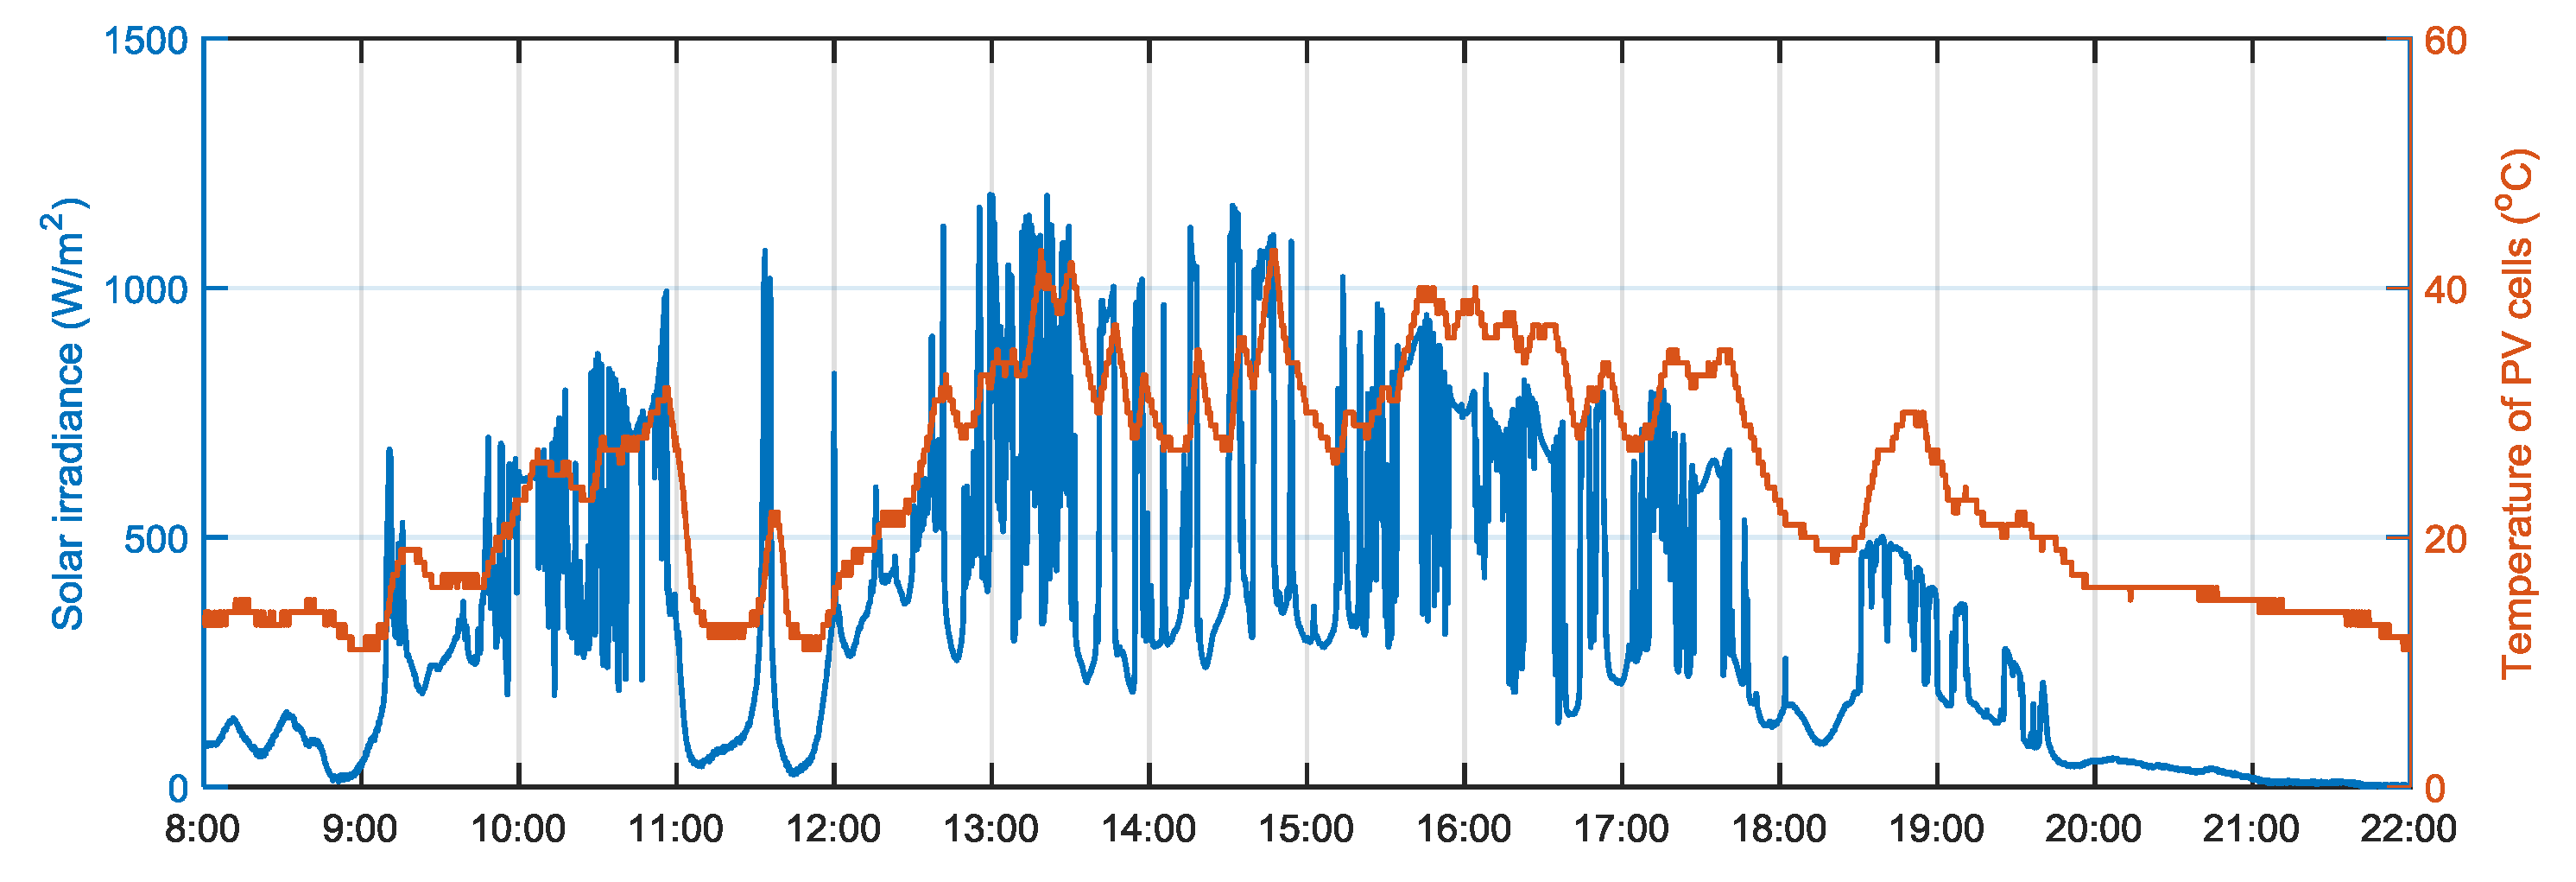
Figure 6 shows the real solar irradiance and PV cell temperature from 8:00 to 22:00 on 28 May 2019, at Compiegne, France
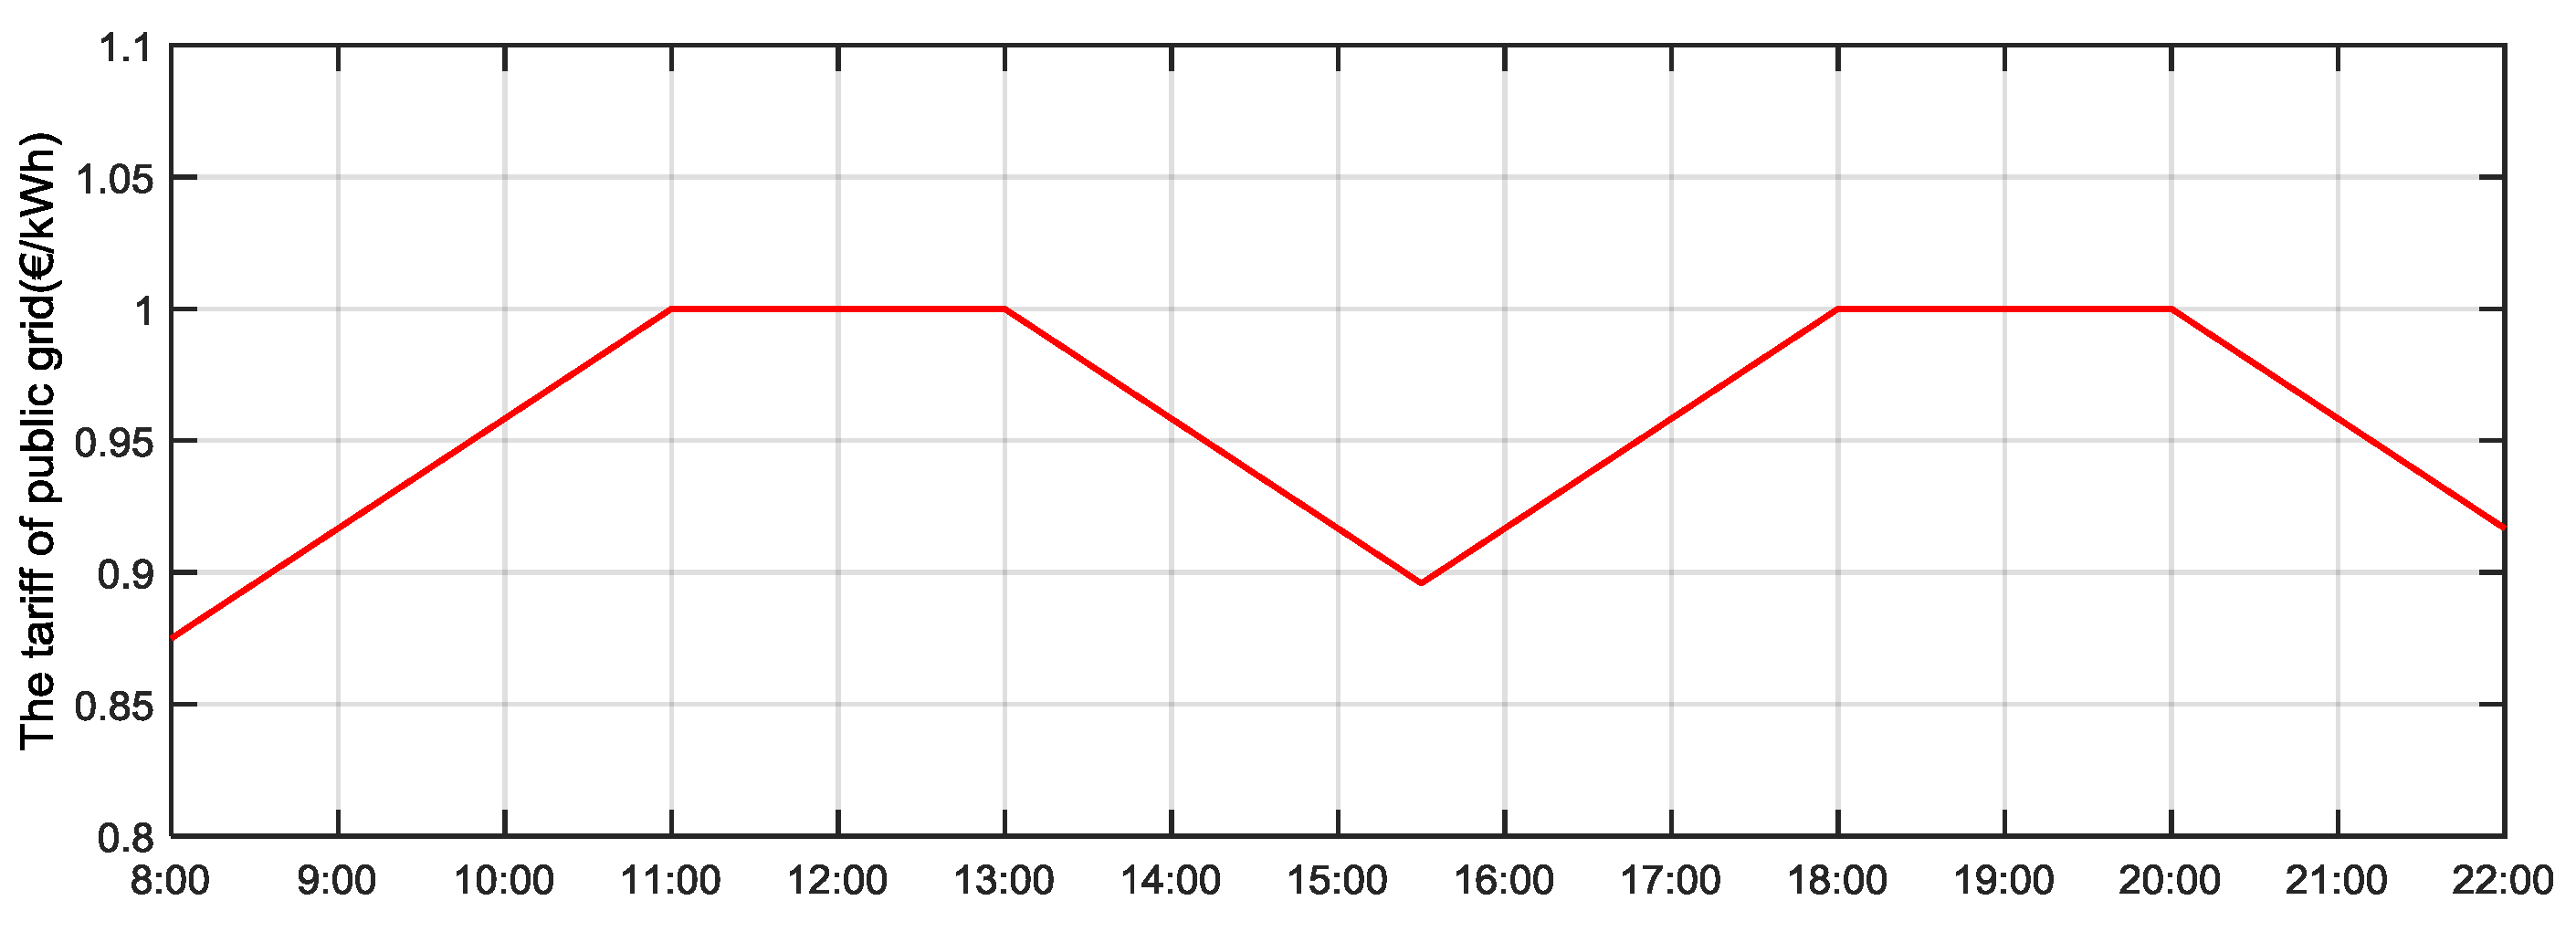
In order to highlight the “peak” periods of the public grid, the energy tariff of the public grid from 8:00 to 22:00 is designed as shown in
Figure 7. It exists two grid “peak” periods 11:00–13:00 and 18:00–20:00, and the tariff is fixed during the two time-periods. The closer the time point to these two time-periods, the higher the tariff to absorb power from the public grid, which encourages EVs to discharge close to the “peak” periods of the public grid and charge away from the “peak” periods of the public grid.
The simulation parameters of the system are detailed in
Table 1 [
31], where
is the constant discharge power, which was chosen 89.6kW,
is the storage current limitation,
and
are the
lower limit and the
upper limit, respectively,
is the capacity of the storage, and
is the rated voltage of DC bus.
The power limits of the point of common coupling of the EV charging station with the public grid are shown in
Table 2. Since loads of the public grid are different according to different periods, the power limits are set accordingly to ensure the stability of the public grid. There are two types of power limits: grid injection power limit and grid supply power limit. In the “peak” periods of the public grid, the injection power limit is 100 kW, the supply power limit is −10 kW, and in other periods, the injection power limit is 50 kW, and the supply power limit is −50 kW.
The simulation parameters of EVs are shown in
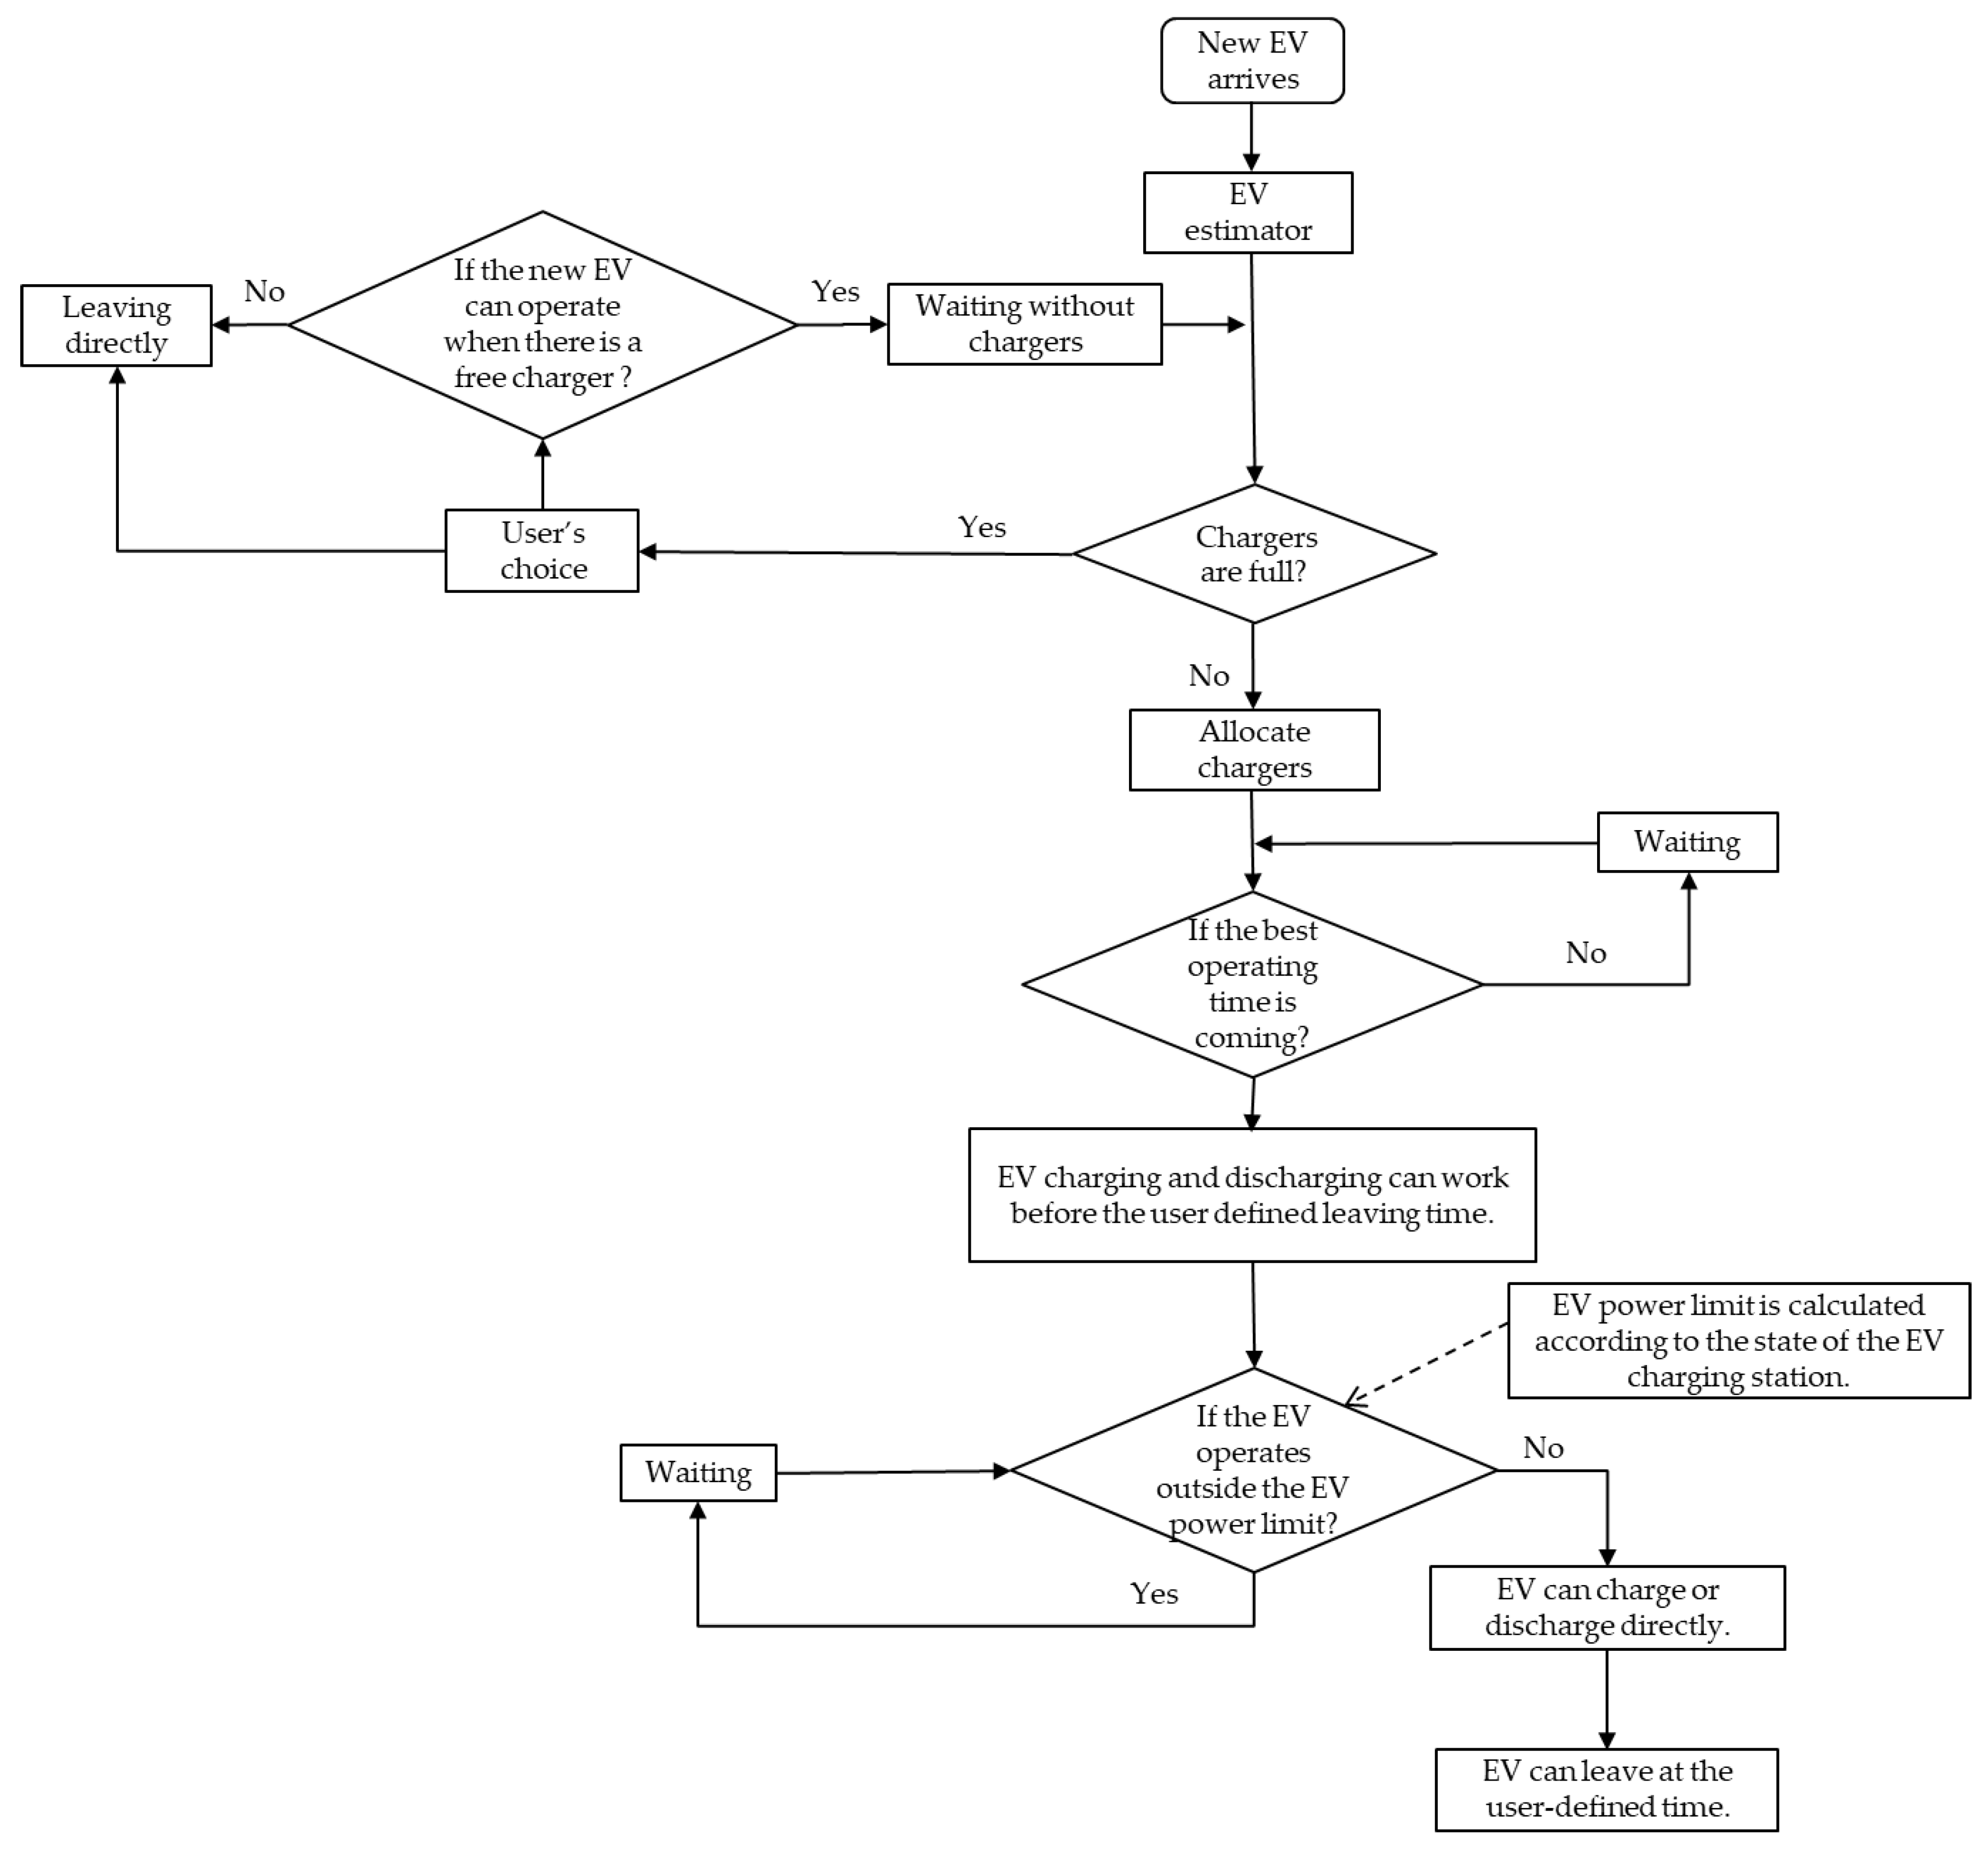
Table 3. The three charging modes for EVs, i.e., fast mode, average mode, and slow mode, are considered. When a new EV arrives, the user can choose waiting or departure if there is no free charger. “CH” represents “charge”, “DCH” represents “discharge”, “F” represents “fast mode”, ”A” represents ”average mode”, ”S” represents “slow mode”, ”W” represents ”waiting”, and ”D” represents ”departure”.
represents the ordinal number of EVs.
In this case, in order to reflect the effectiveness of the algorithm, the EV number is randomly given 16, and “Type” and ”Choice” are randomly generated by an algorithm. represents the time each EV arrives at the charging station. represents the time each EV leaves the charging station. represents the initial , represents the limit value of when the EV departures that set by users. According to the willingness of users, EVs come to charging stations for two purposes: being charged and discharging.
4.2. Simulation Results under ICDA
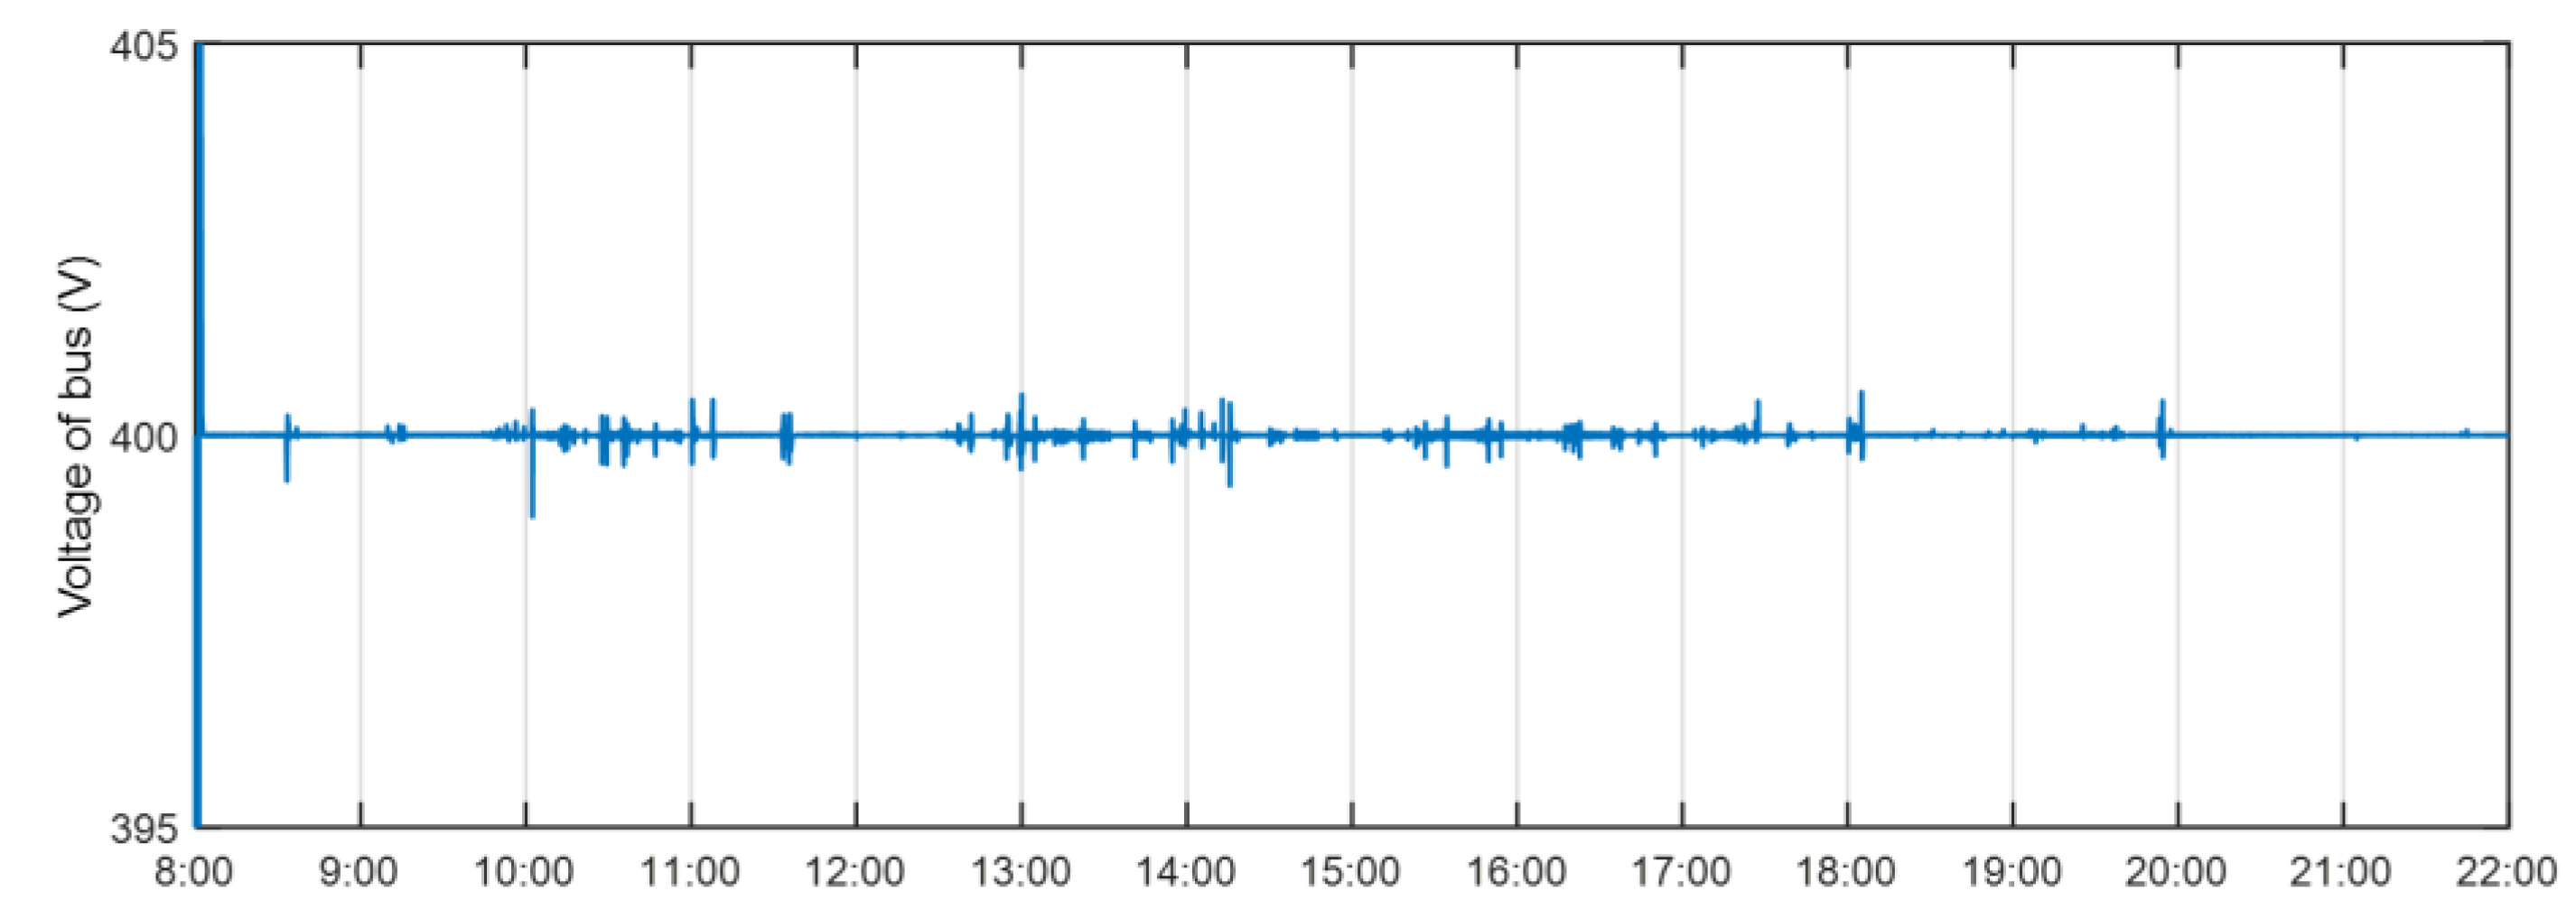
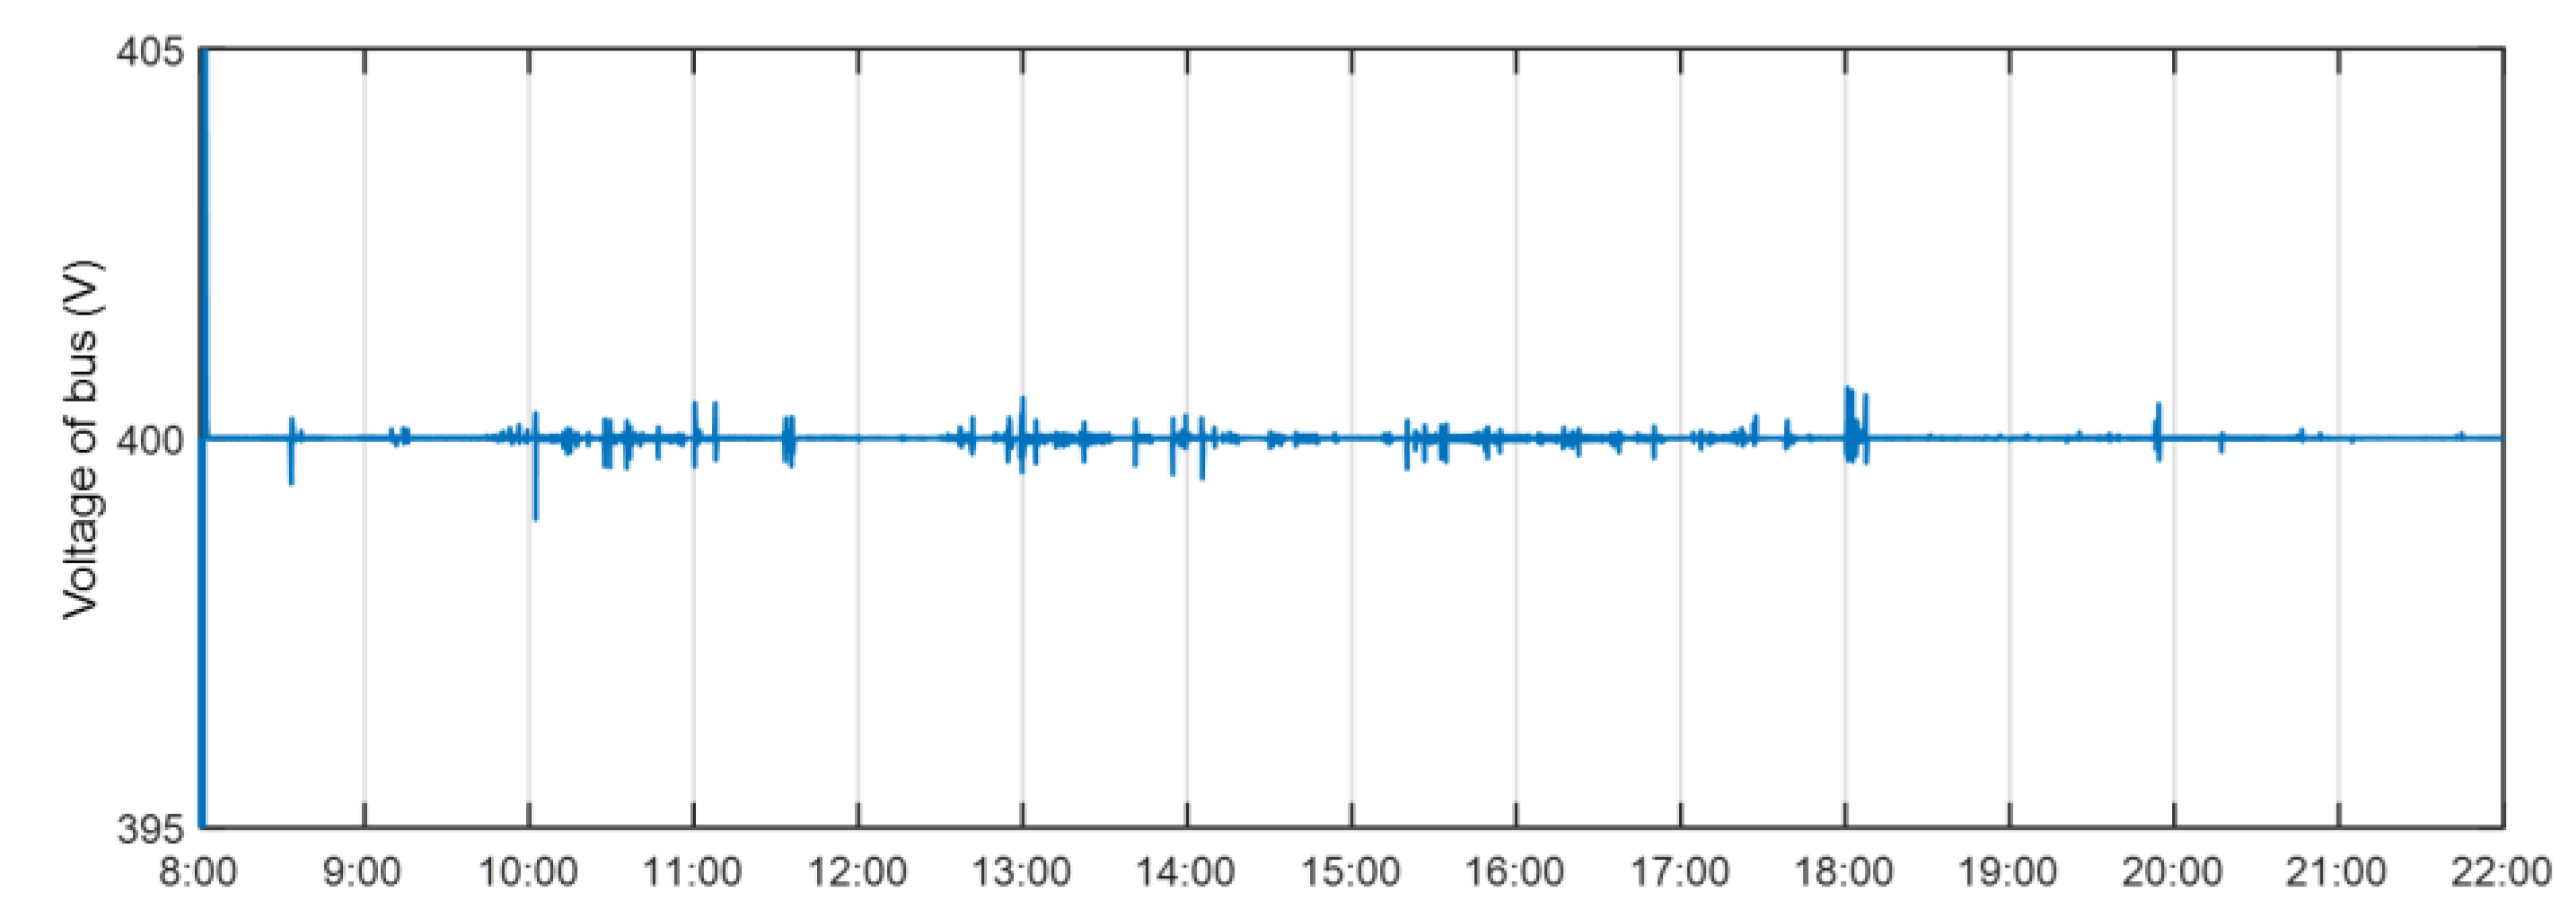
The first simulation case works under ICDA and the EV can directly be charged/discharge within the EV power limit. As shown in
Figure 8, the steady DC bus voltage is 400 V within the simulation period, which proves that the power management strategy works well to balance the powers under ICDA.
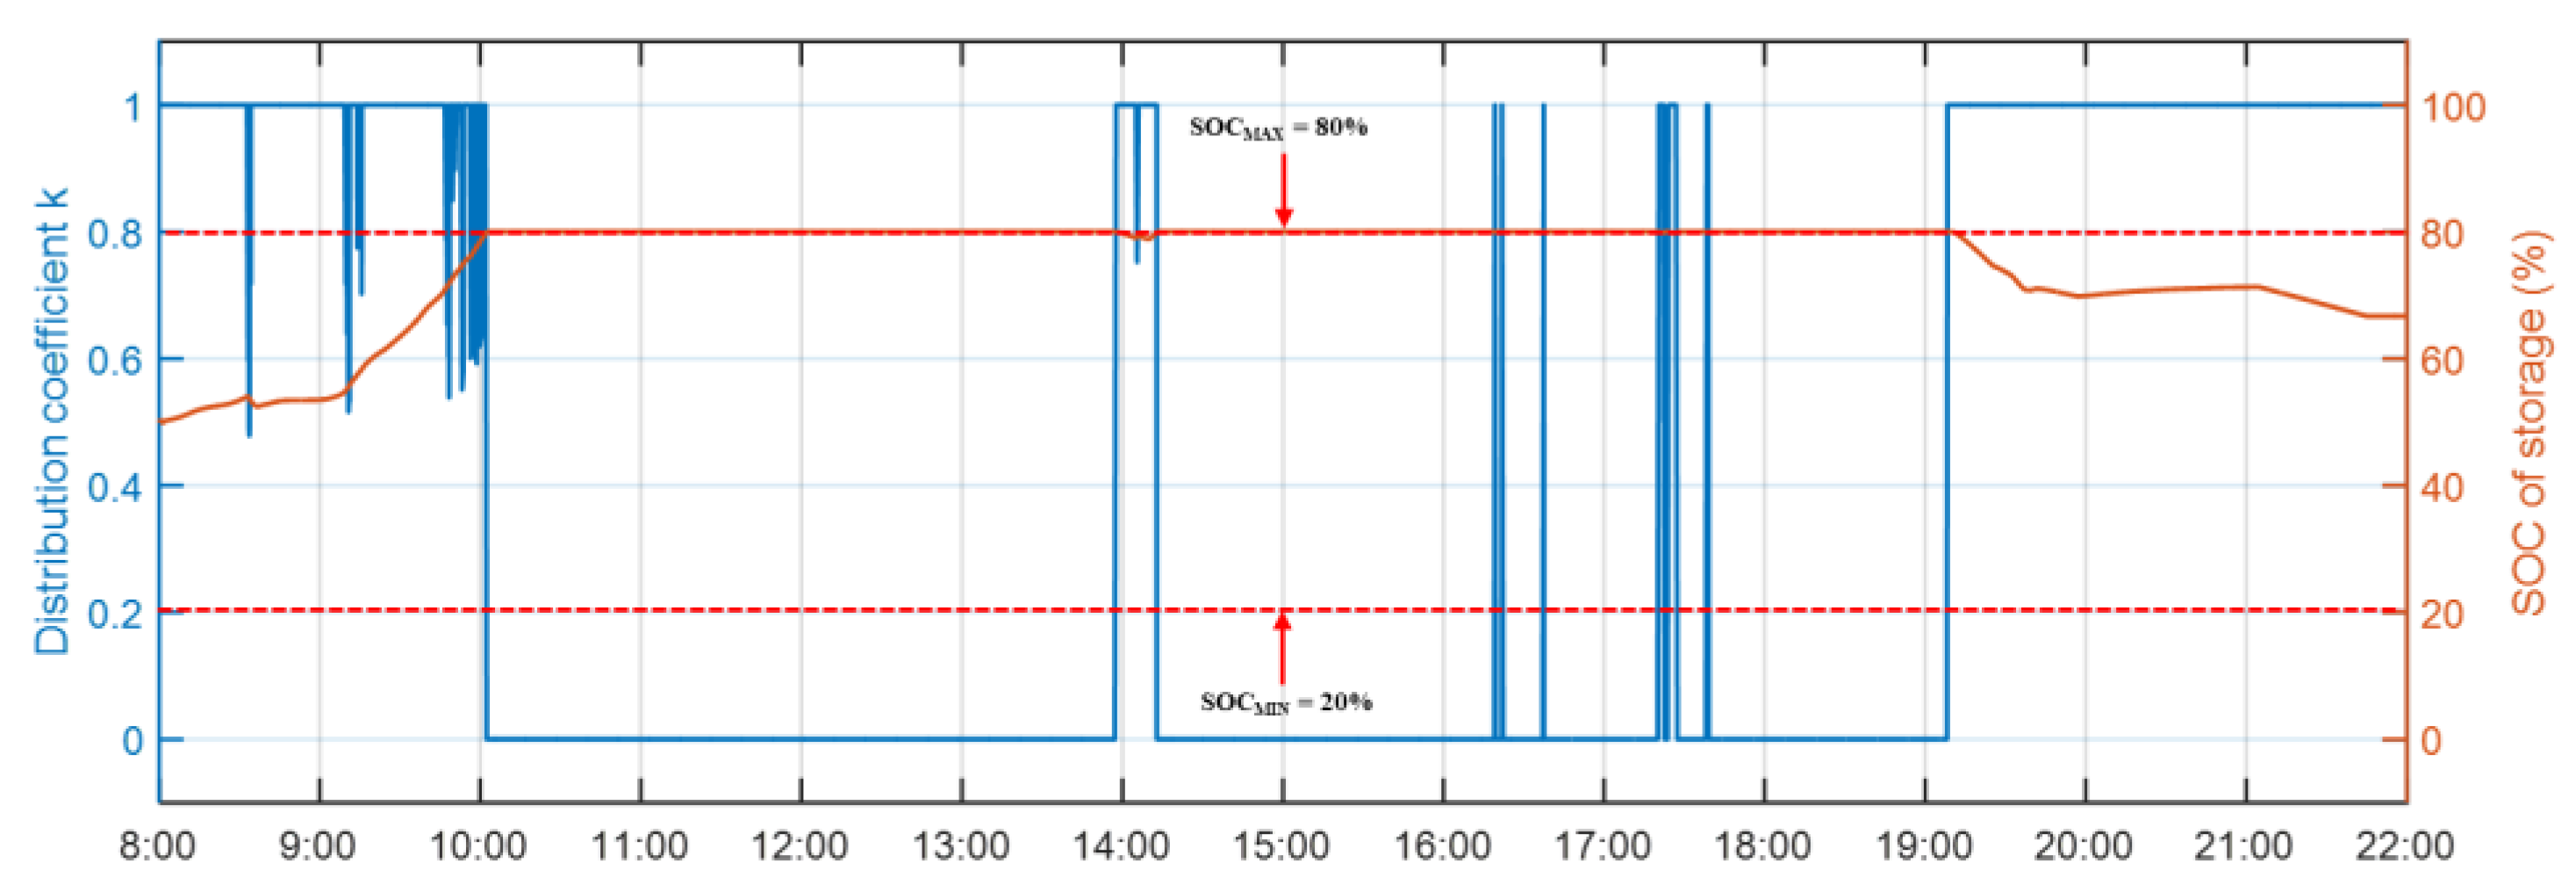
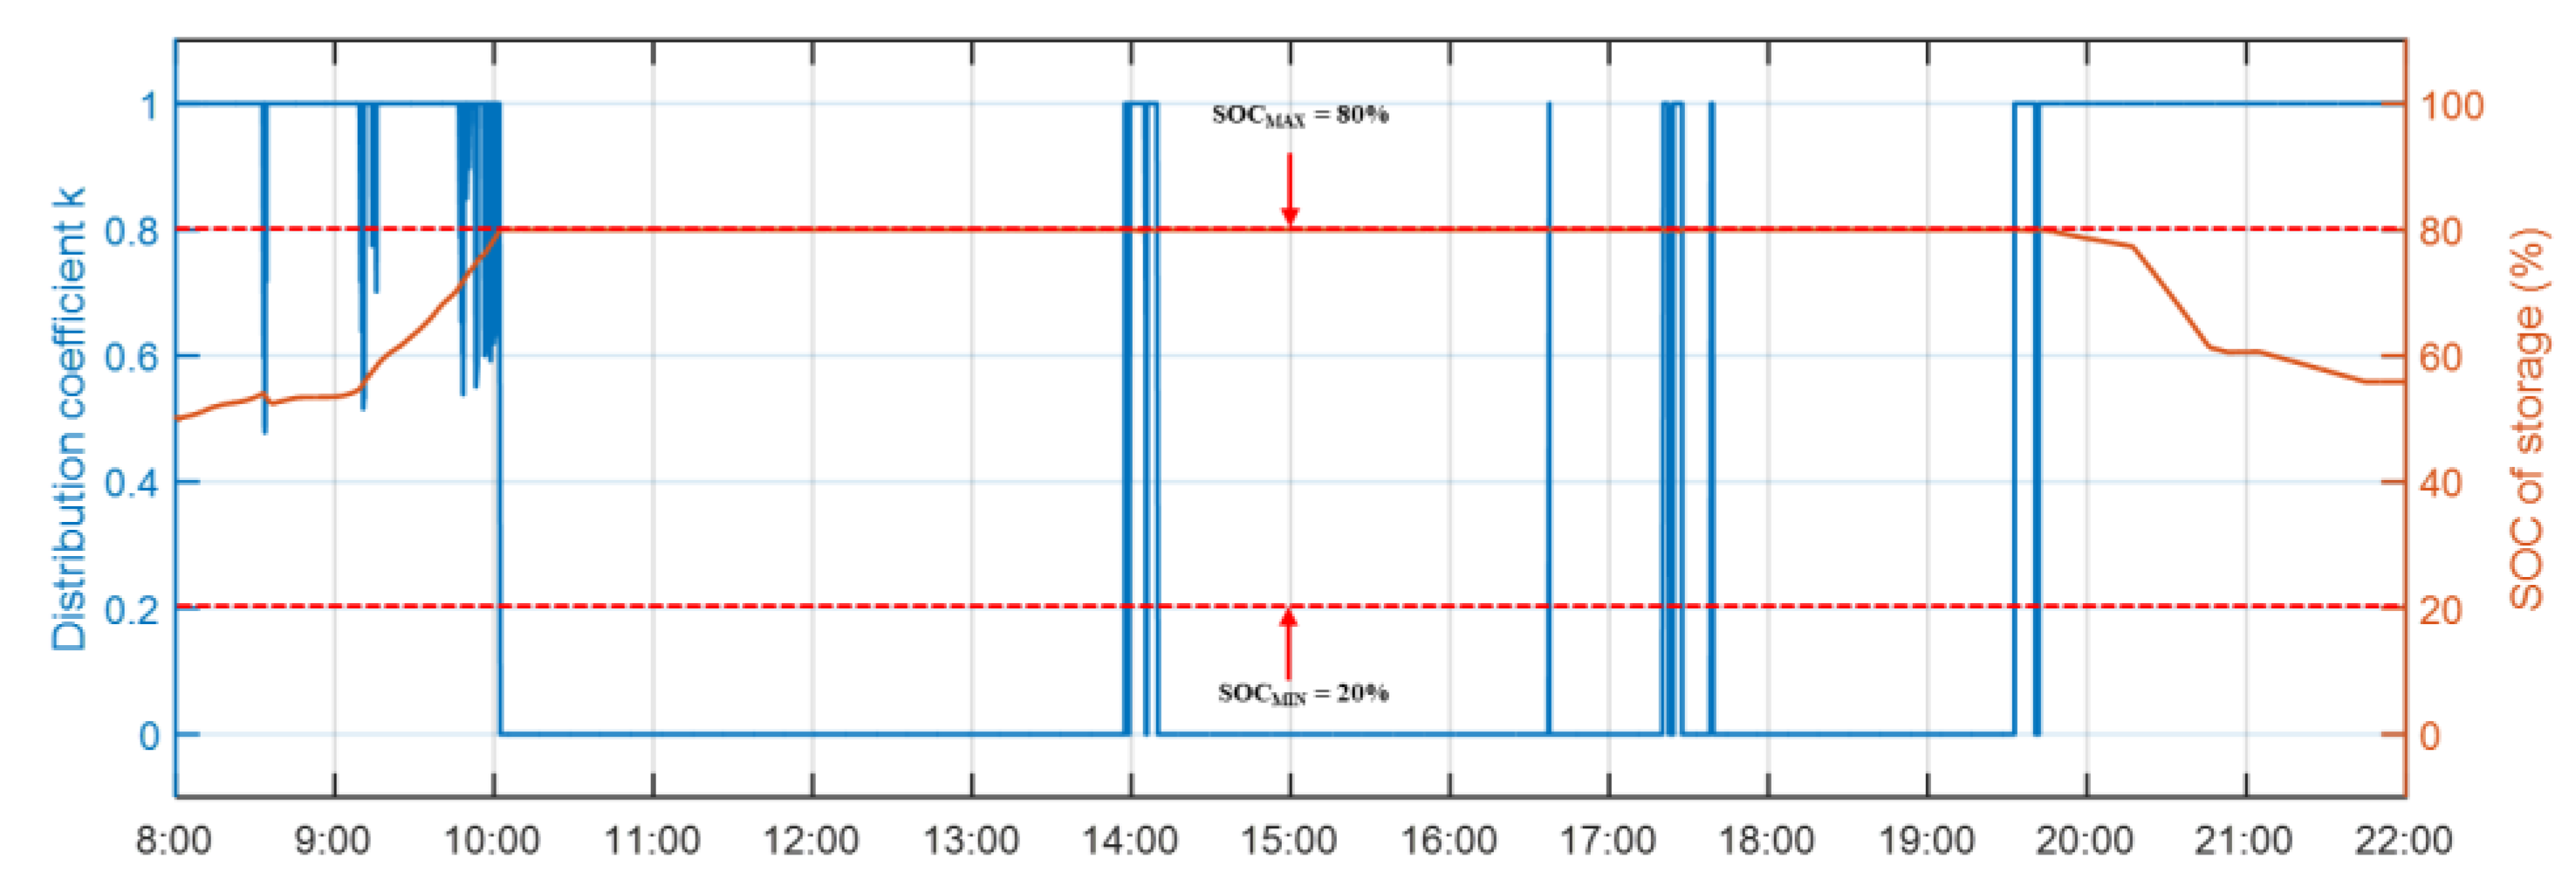
Figure 9 shows the storage
and distribution coefficient
under ICDA. The
of storage is limited between 20% and 80% to extend storage life [
33].
means only the storage is working and
means only the public grid is working.
means the storage and the public grid are working simultaneously.
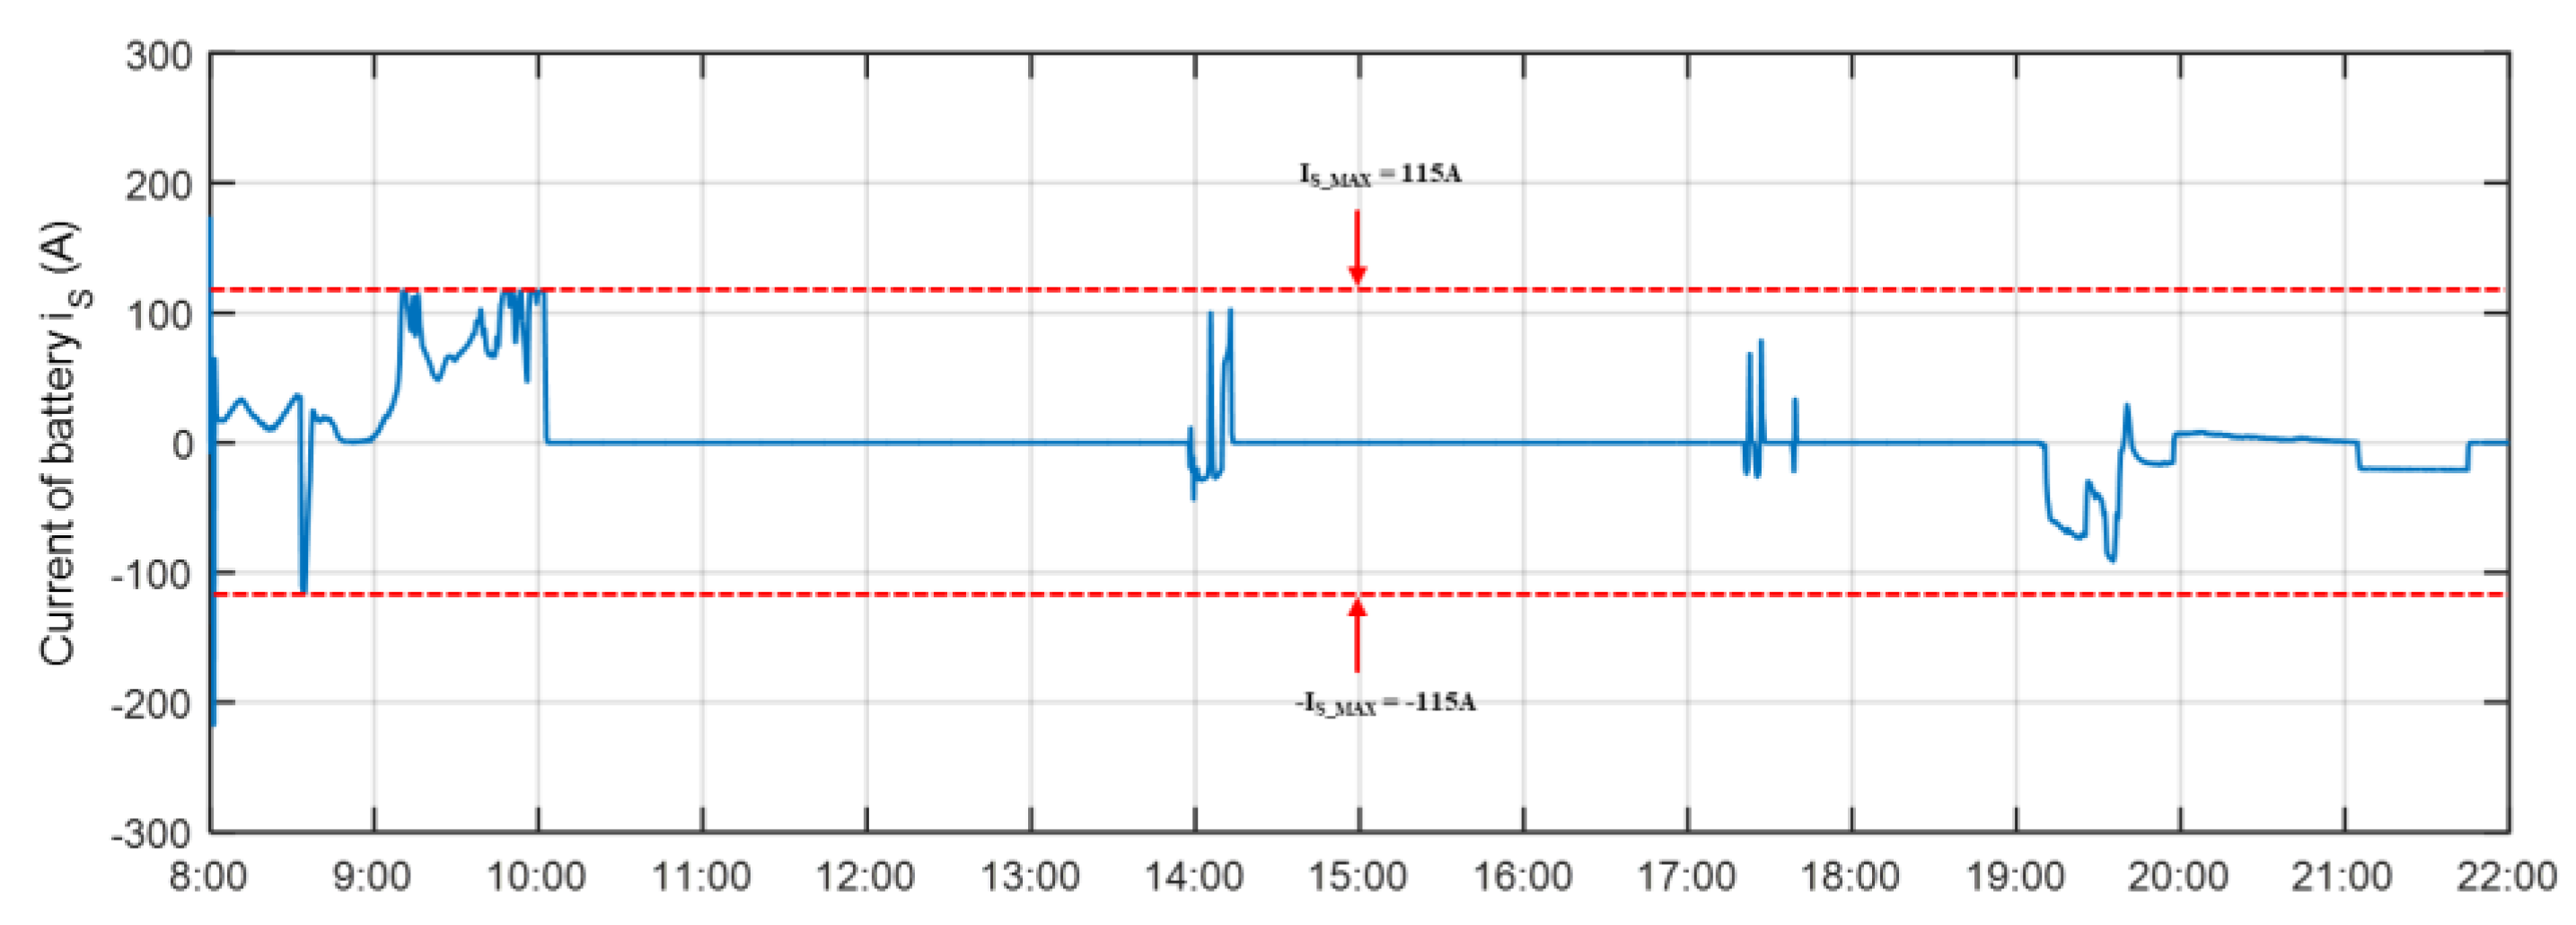
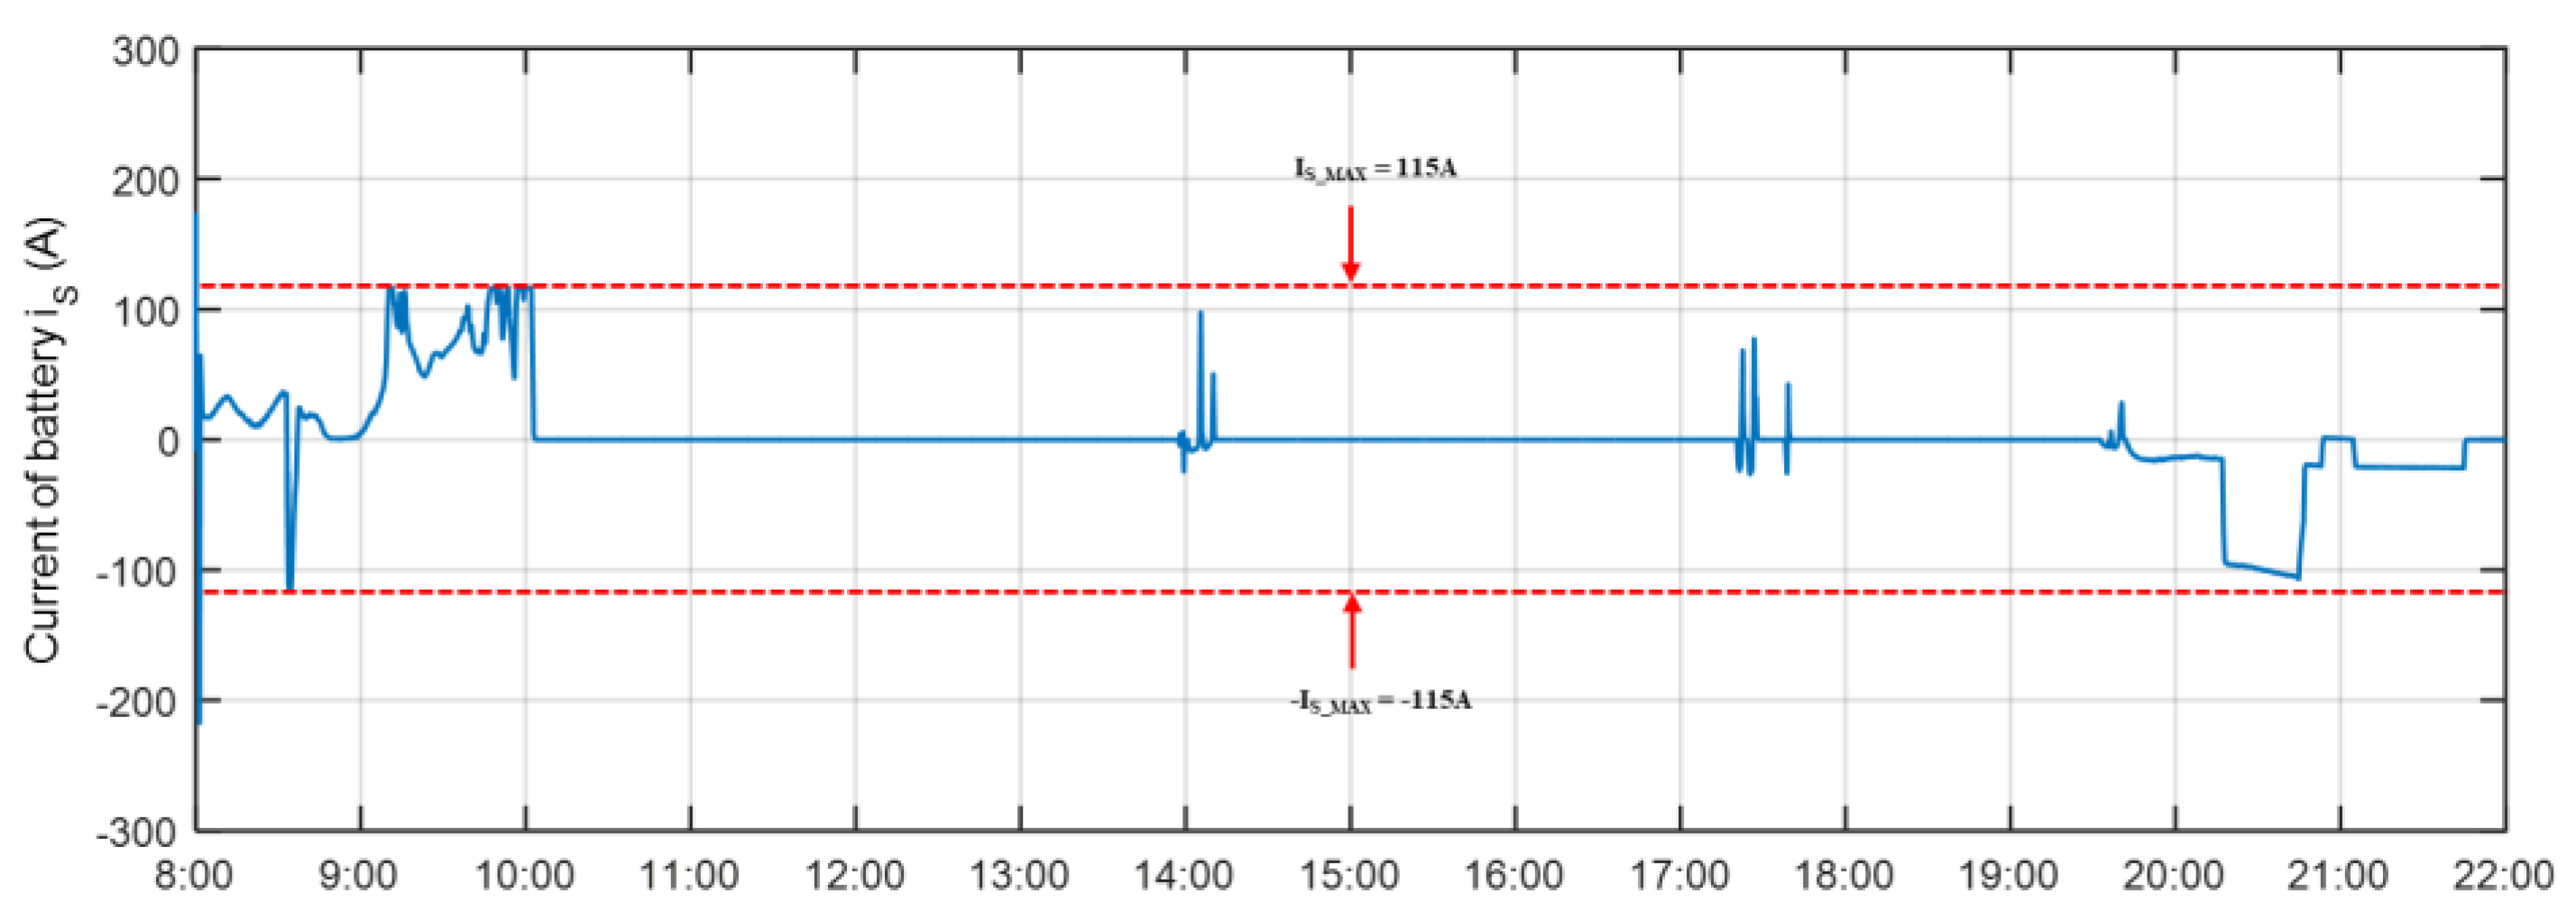
Storage current evolution under ICDA is shown in
Figure 10. The storage current is between −115 A and 115 A to reduce the damage of the storage. The value −115 A is the maximum discharge current of batteries, while the value 115 A is the maximum current for batteries to be charged. The simulation result shows that the current is successfully limited.
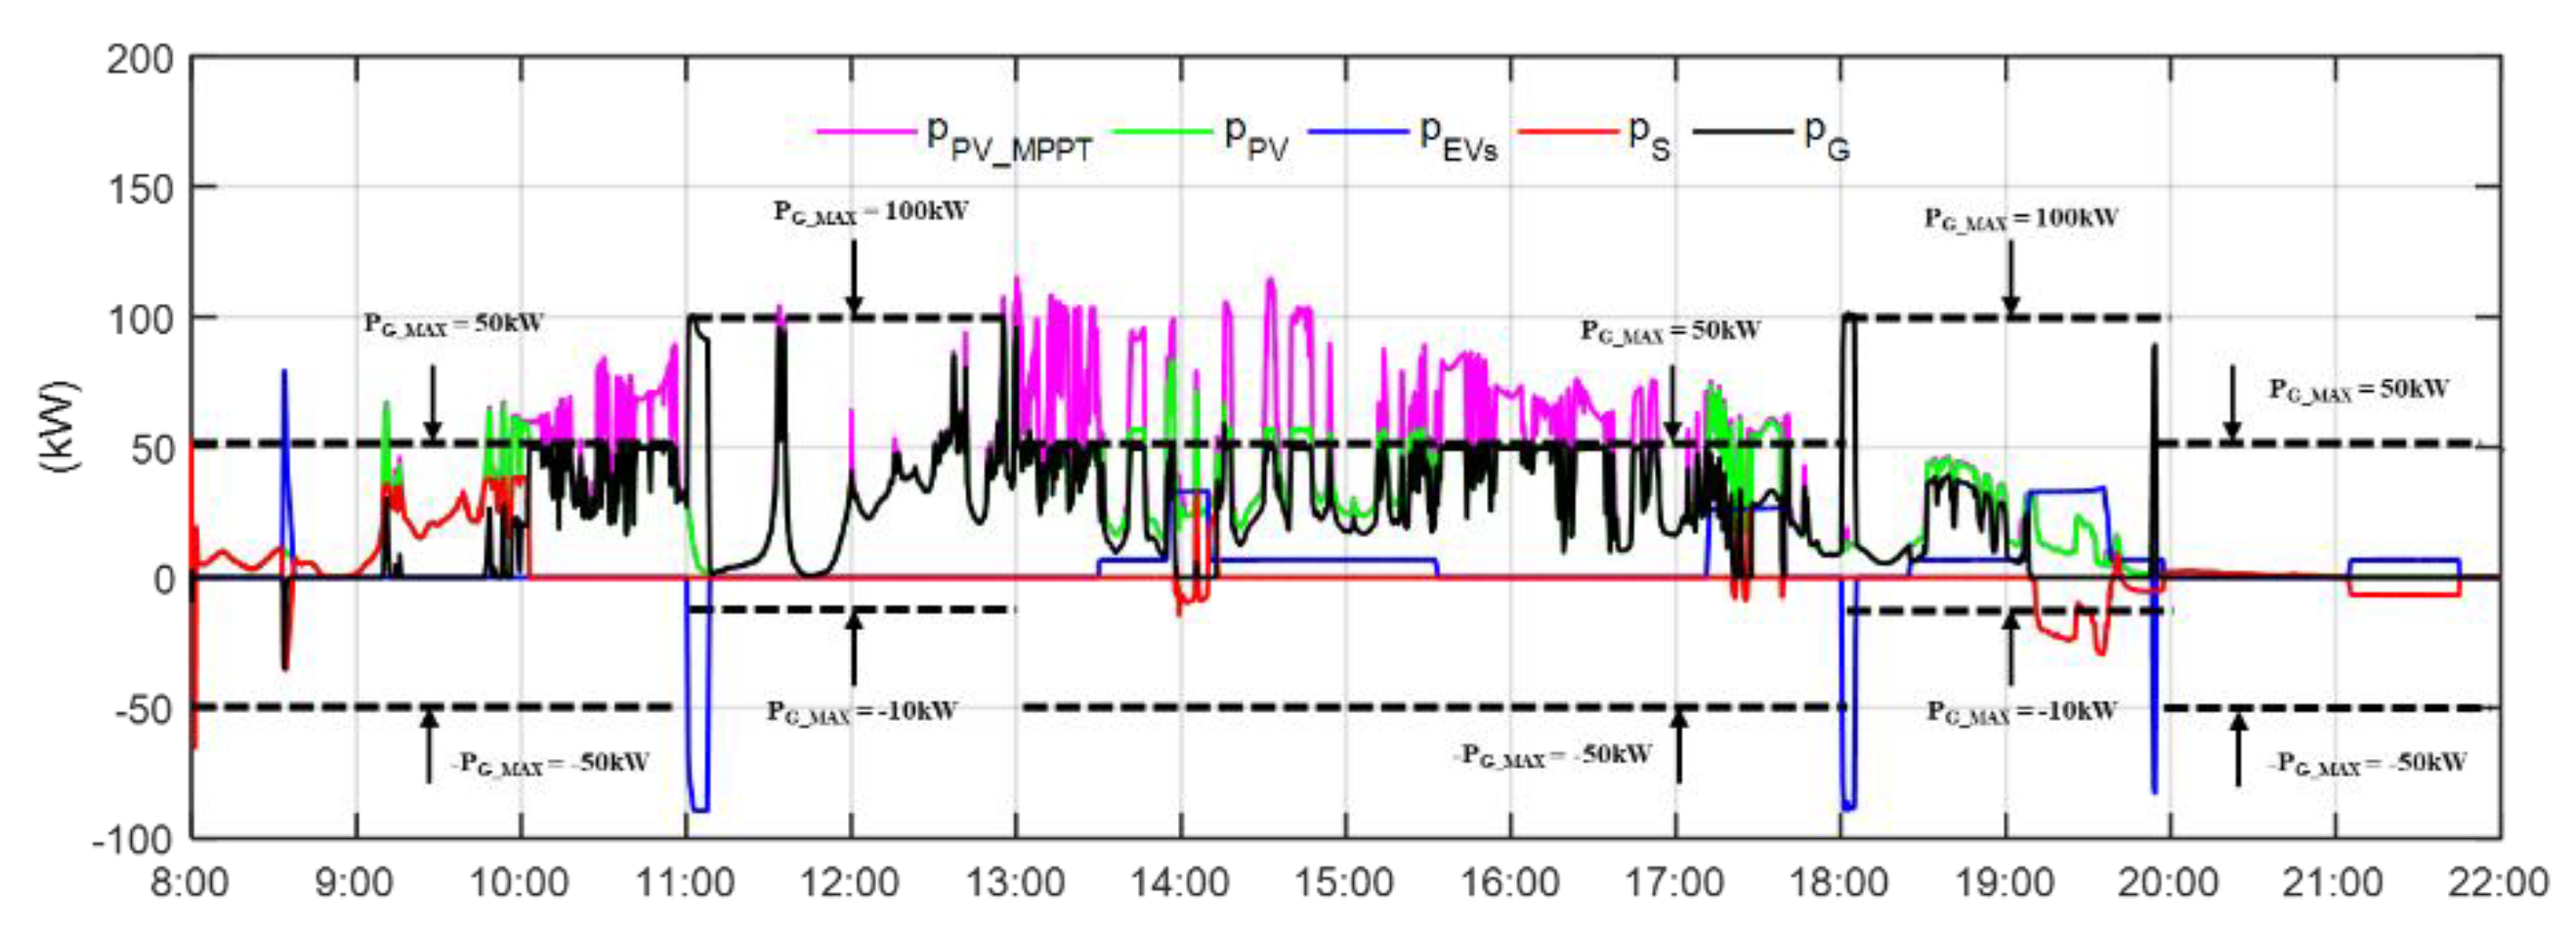
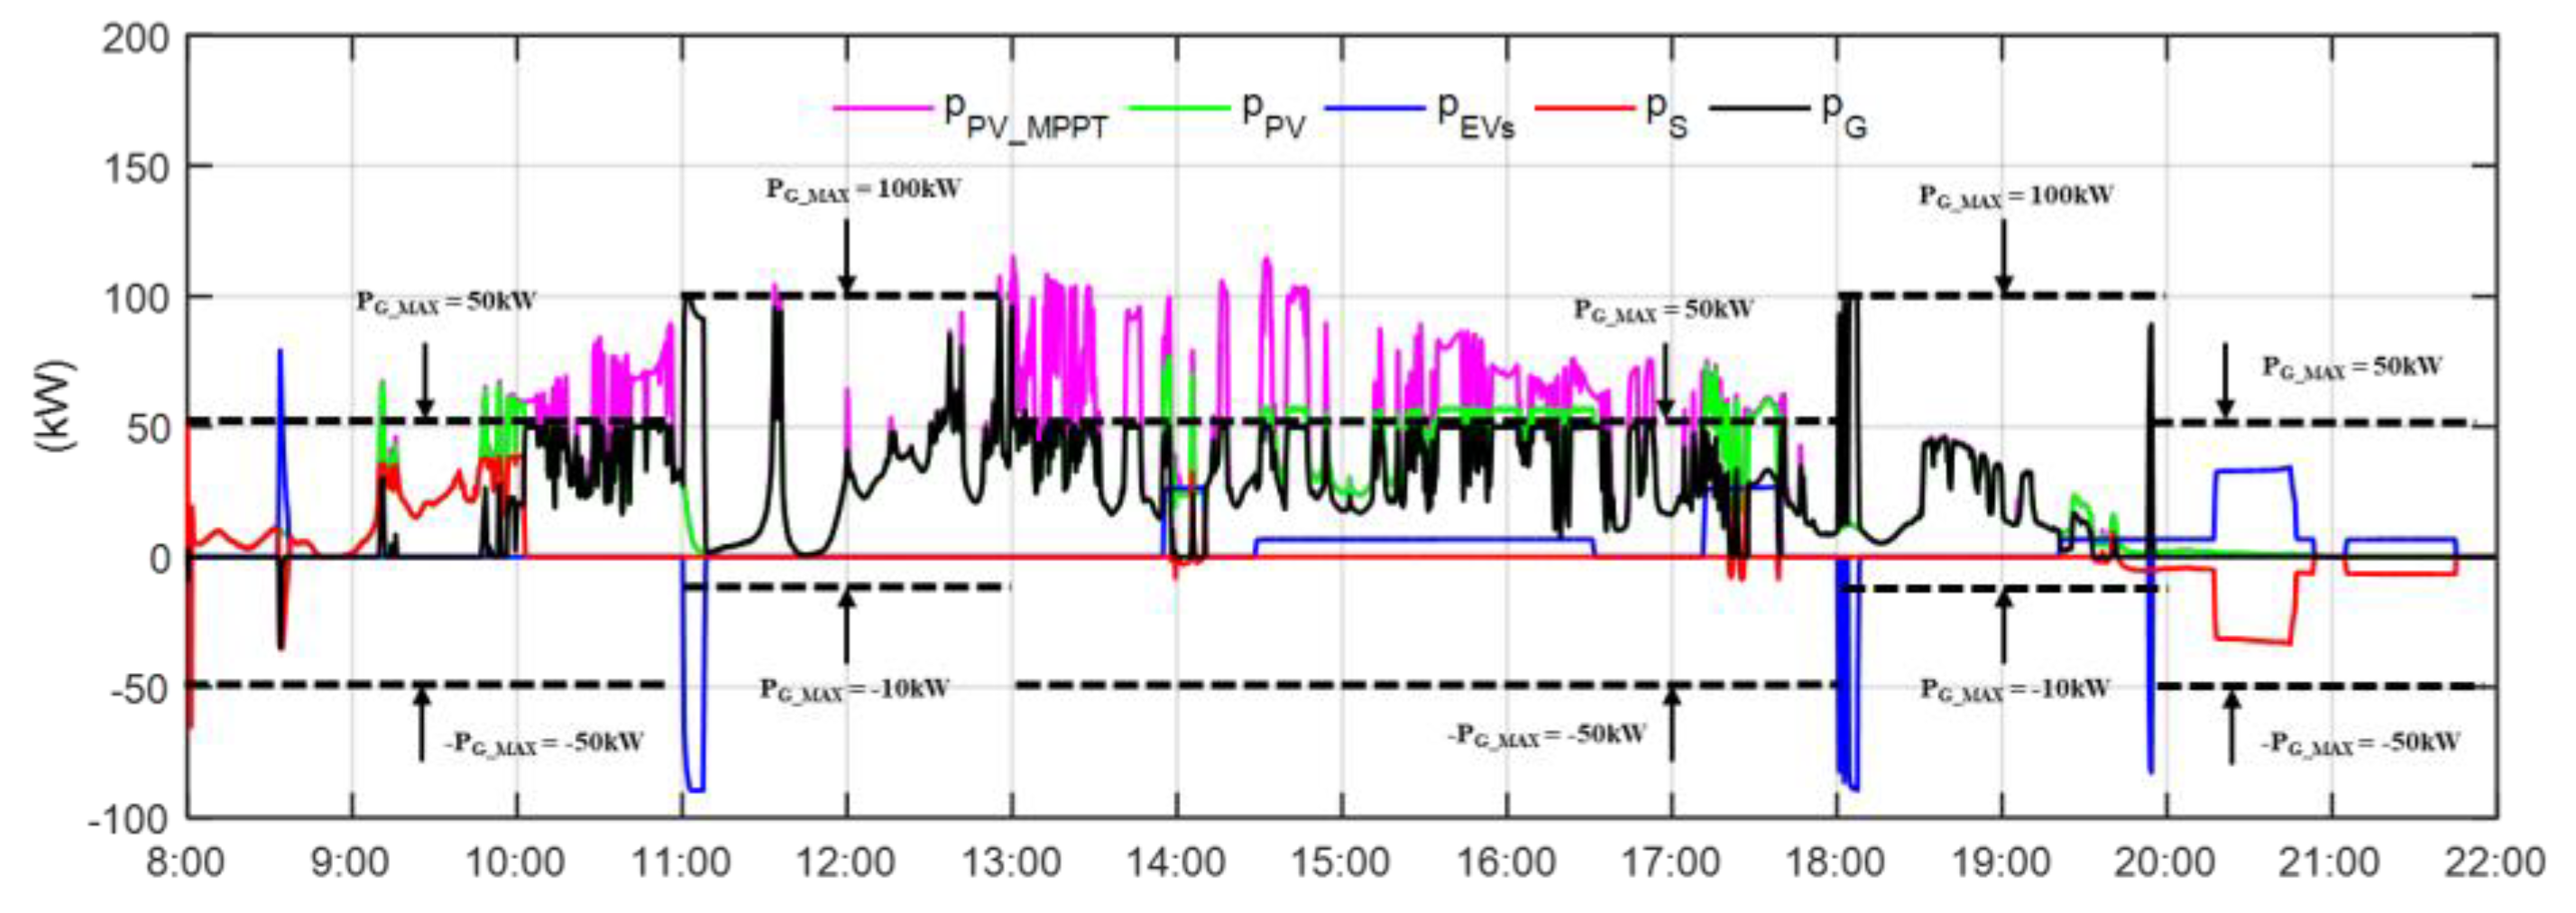
The power flow of the DC microgrid under ICDA is shown in
Figure 11. PV source can switch freely between PV-constrained production control and PV - maximum power point tracking control [
34]. The power
means that EVs show a total tendency to discharge,
means that EVs show a total tendency to be charged. During the “peak” periods of the public grid: 11:00–13:00 and 18:00–20:00, the injection power limit is 100 kW, and the supply power limit is −10 kW to prevent the public grid from overloading. During the “valley” periods of the public grid, the injection power limit is 50 kW, and the supply power limit is −50 W. Setting different power limits according to the “peak” periods and “valley” periods of the public grid is beneficial to improve the stability of the public grid, which also respects the power flow given in
Figure 2.
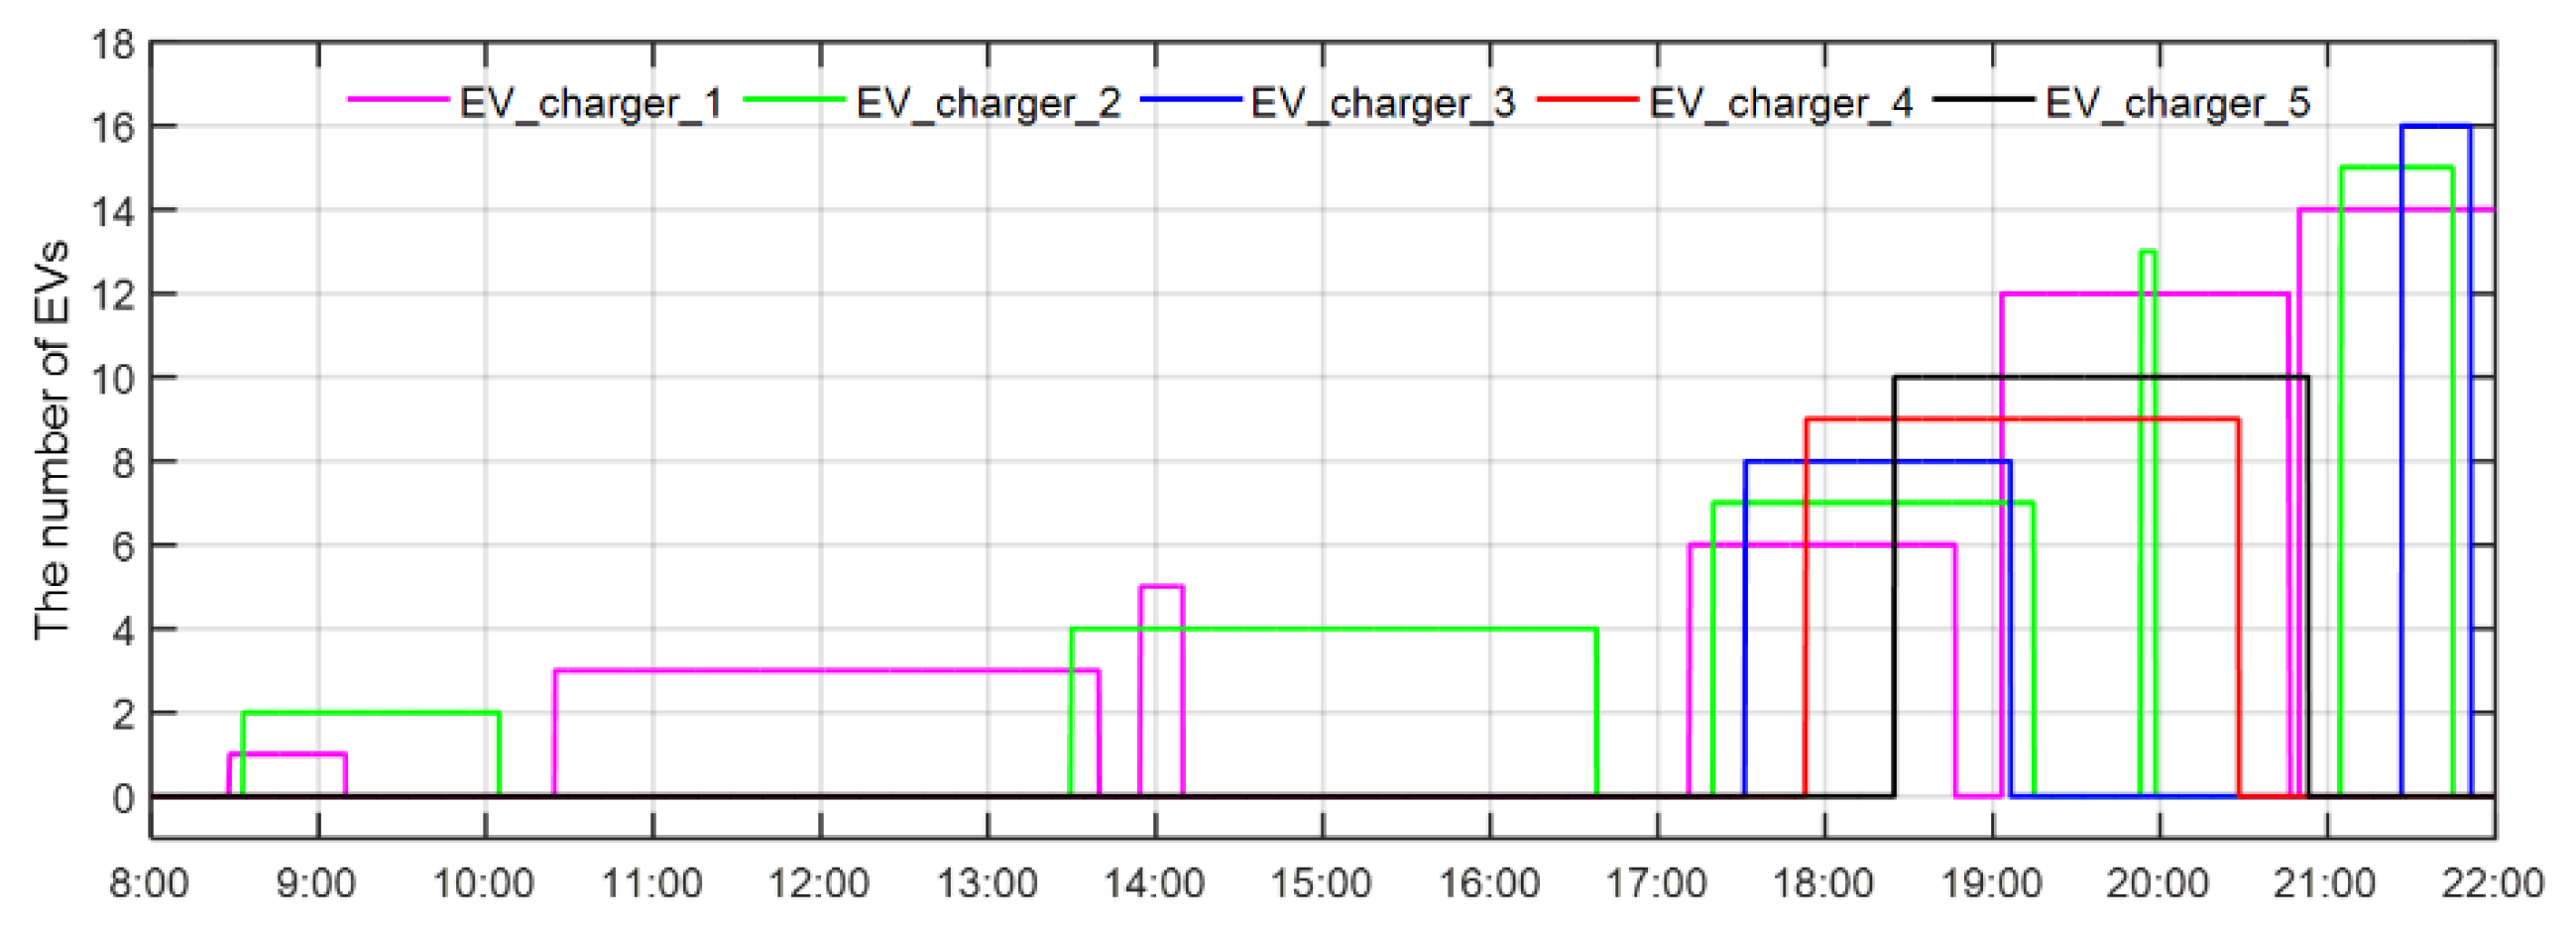
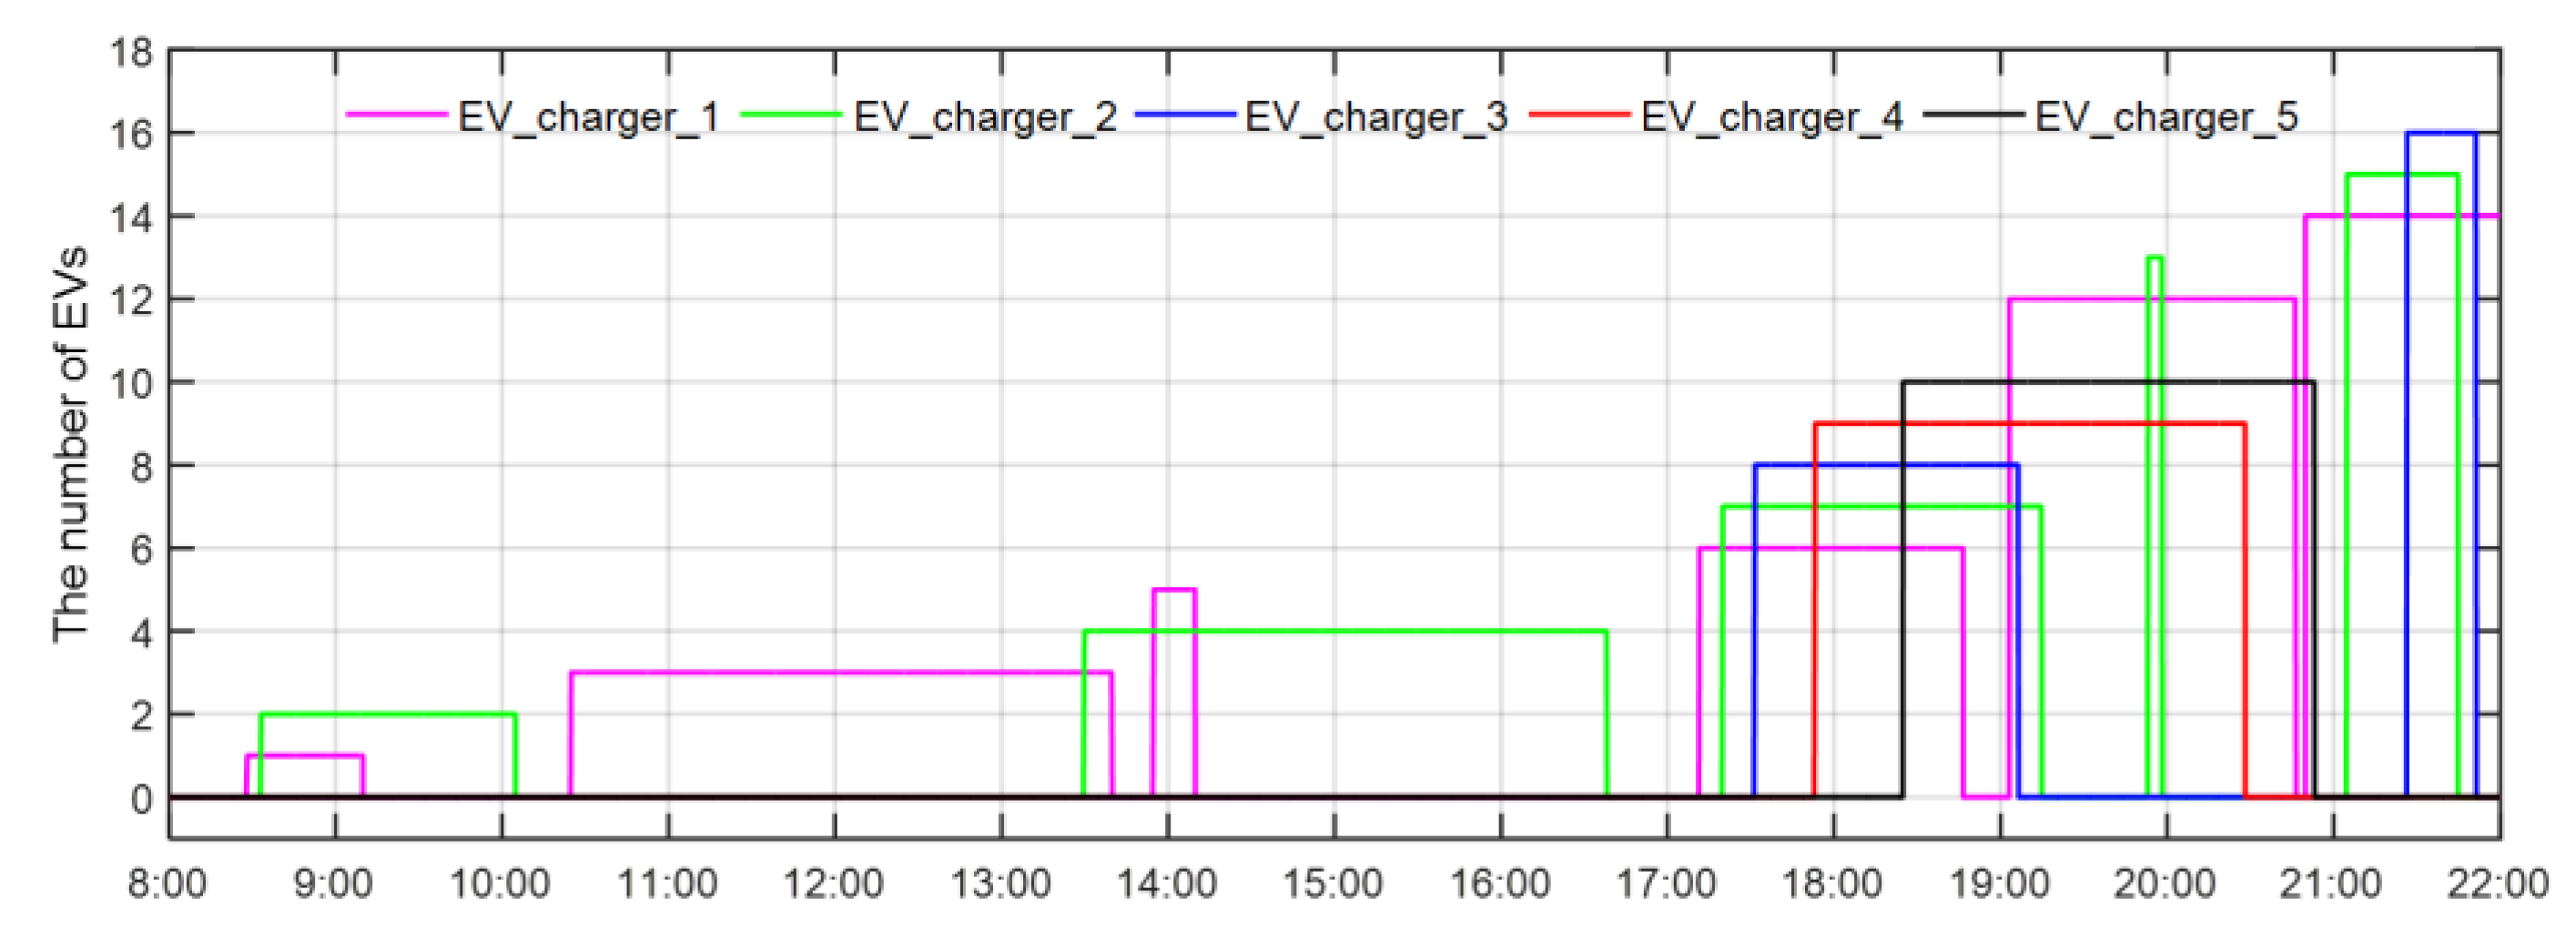
Figure 12 shows the parking periods of EVs. The parking periods of EVs are different according to the willingness of users. From EV_charger_1 to EV_charger_5 represent EVs connected to chargers one to five, respectively, e.g., EV_charger_1 represents the ordinal number and parking periods of the EVs connected to the charger one.
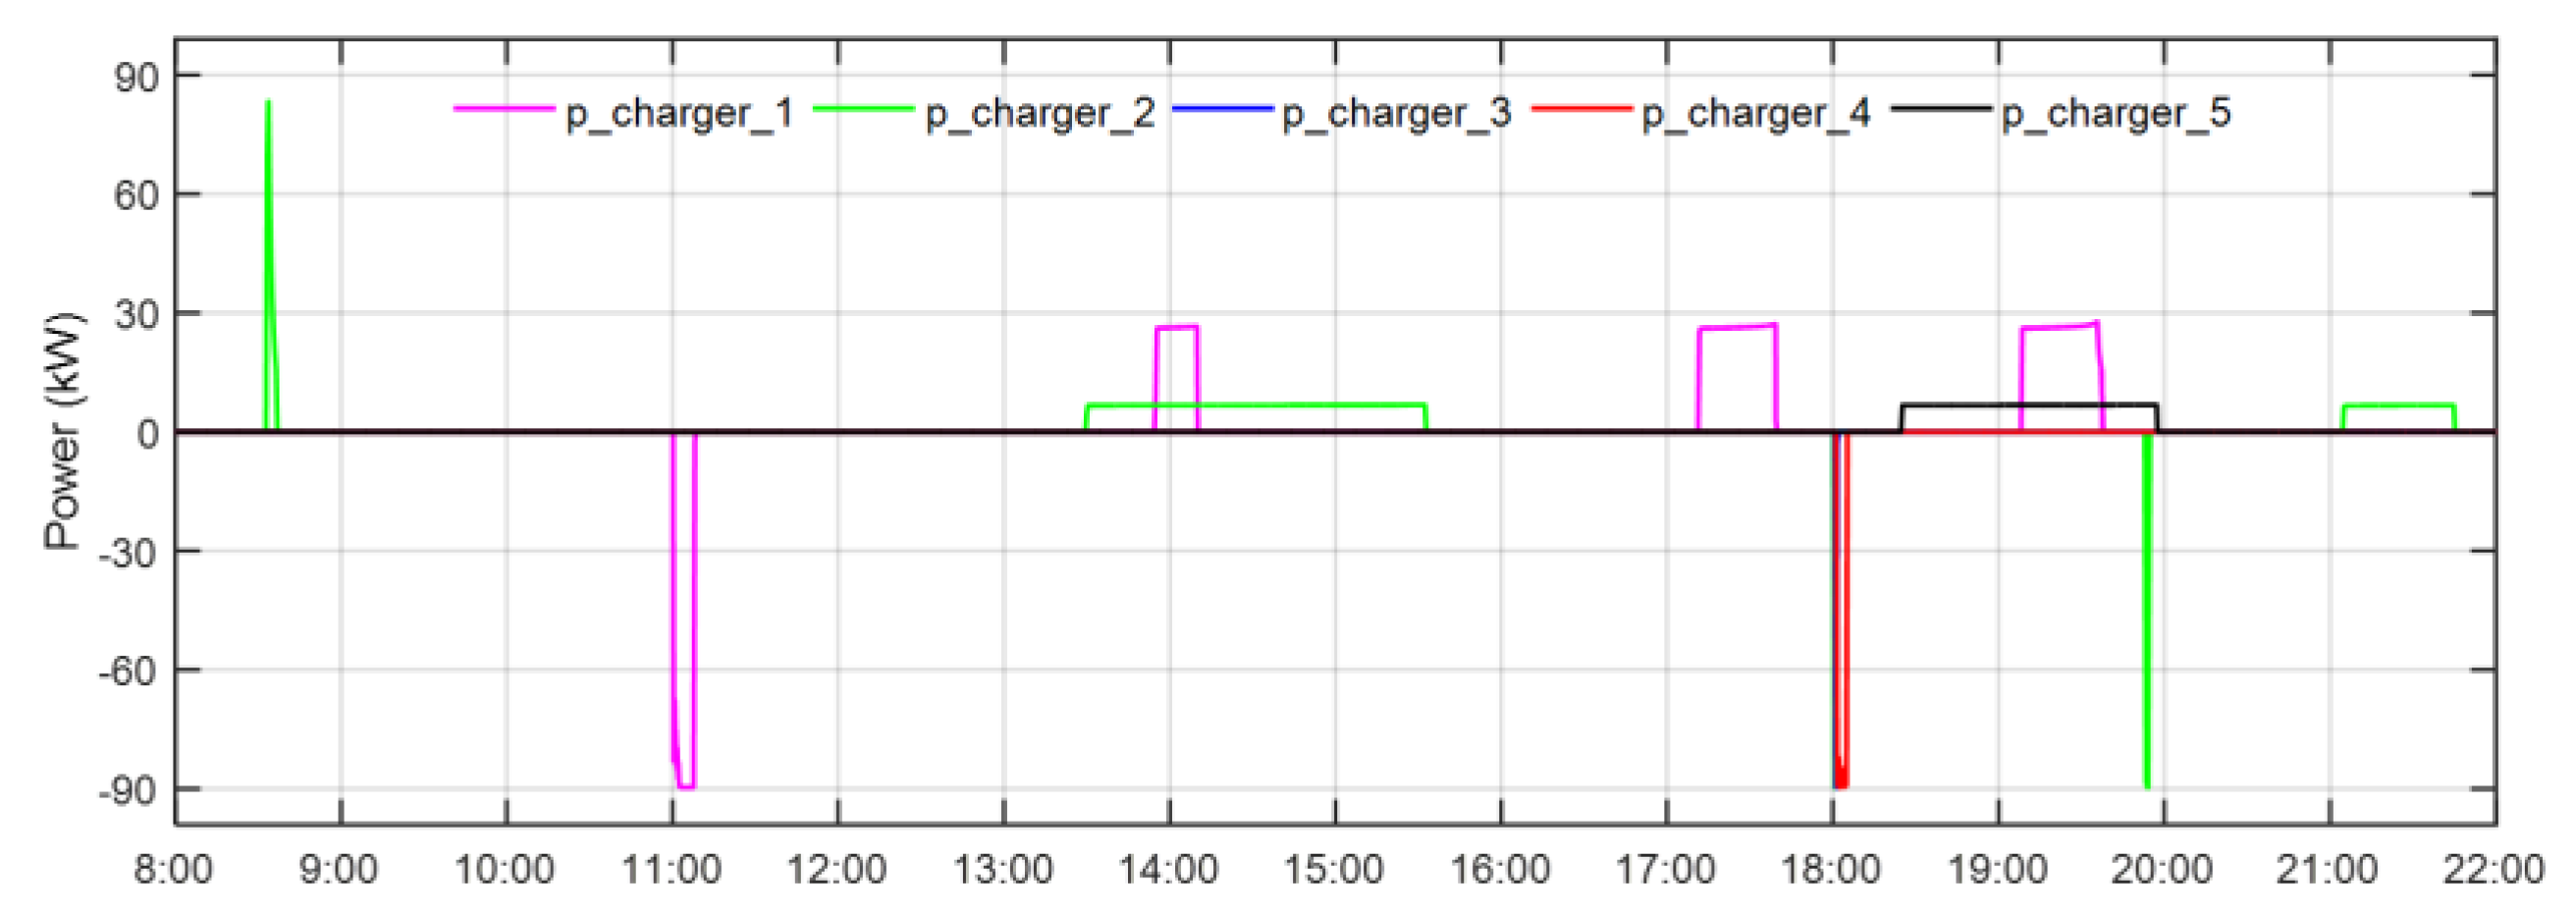
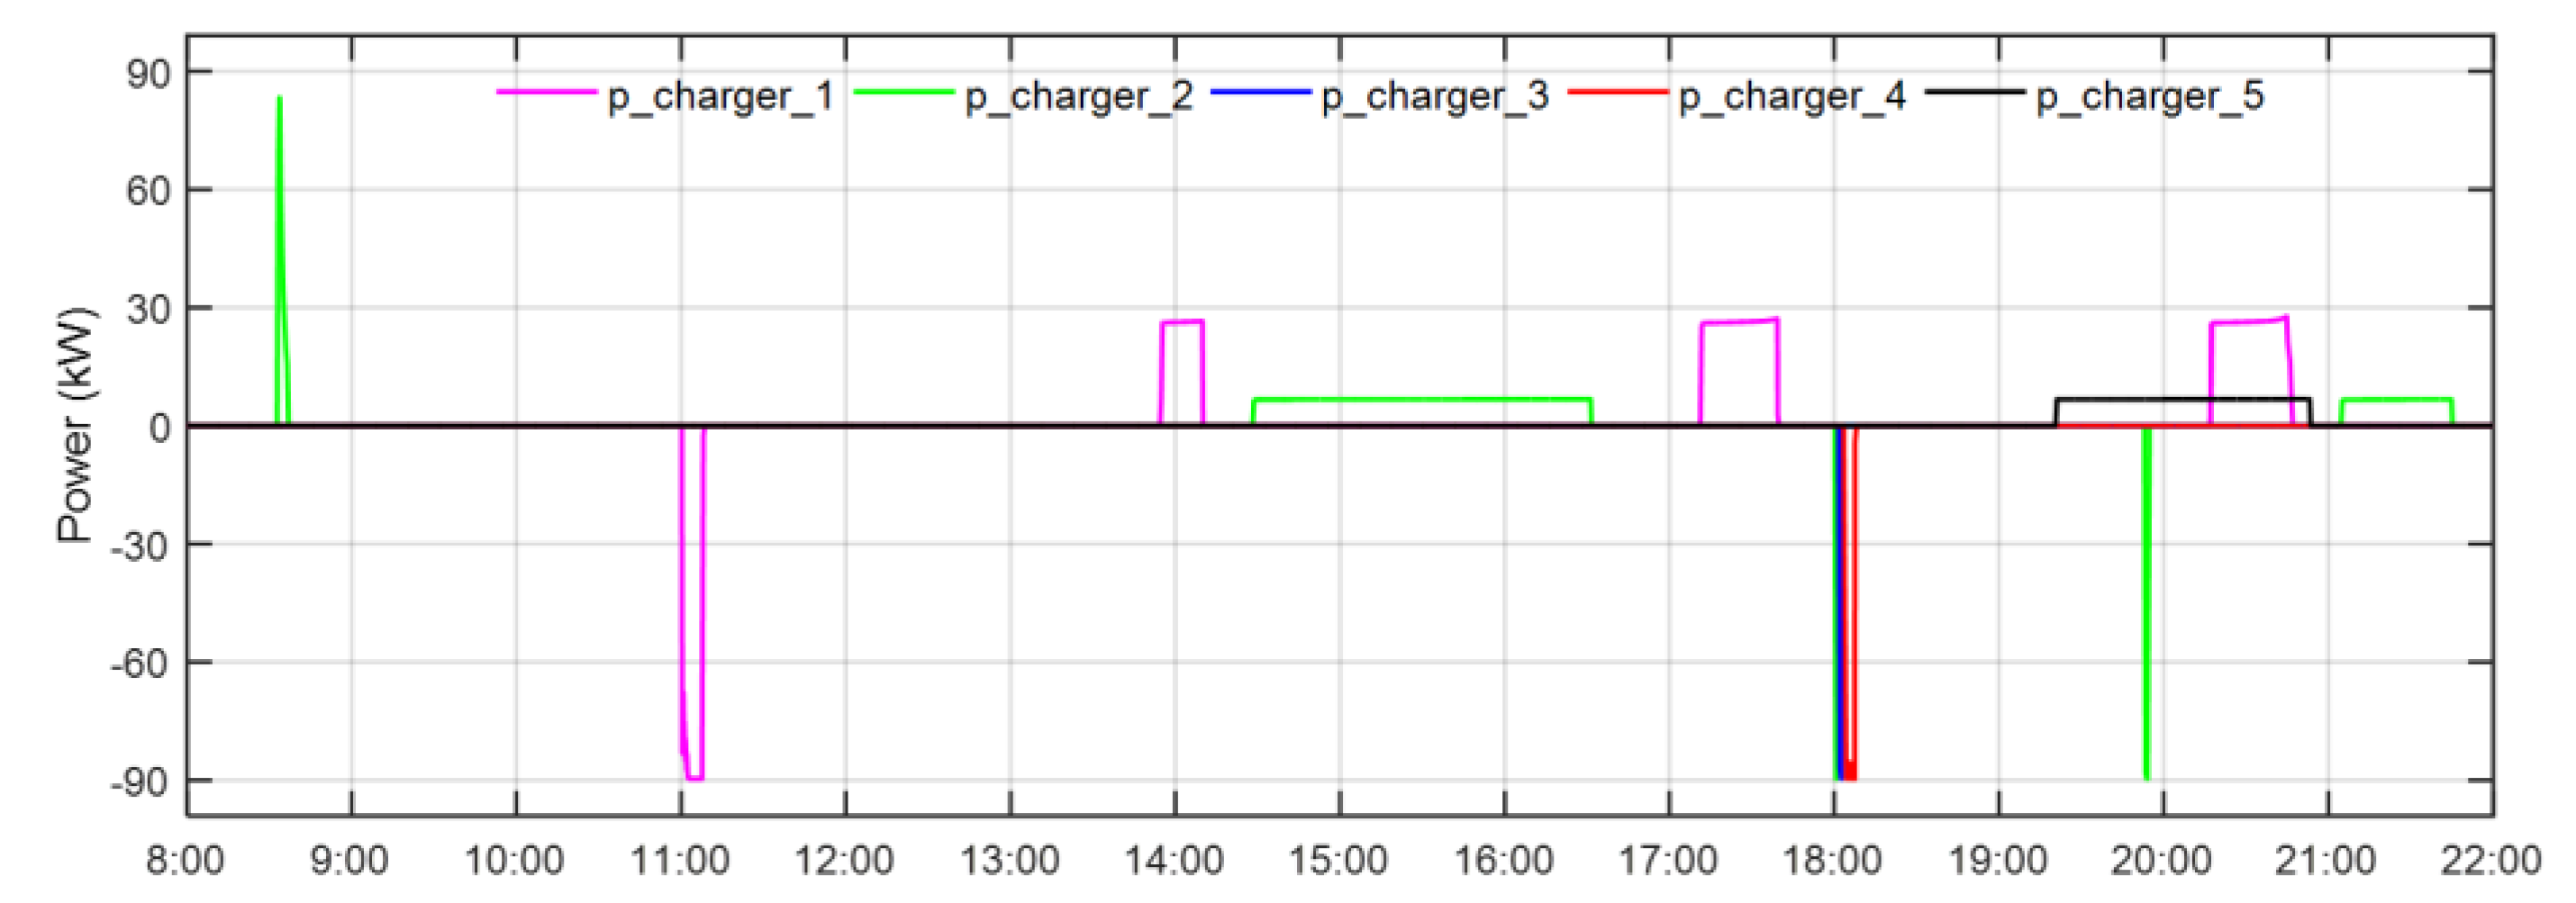
The power evolutions of EVs under ICDA are shown in
Figure 13. If the power is positive, it means that the EV is being charged; if it is negative, it means that the EV discharges.
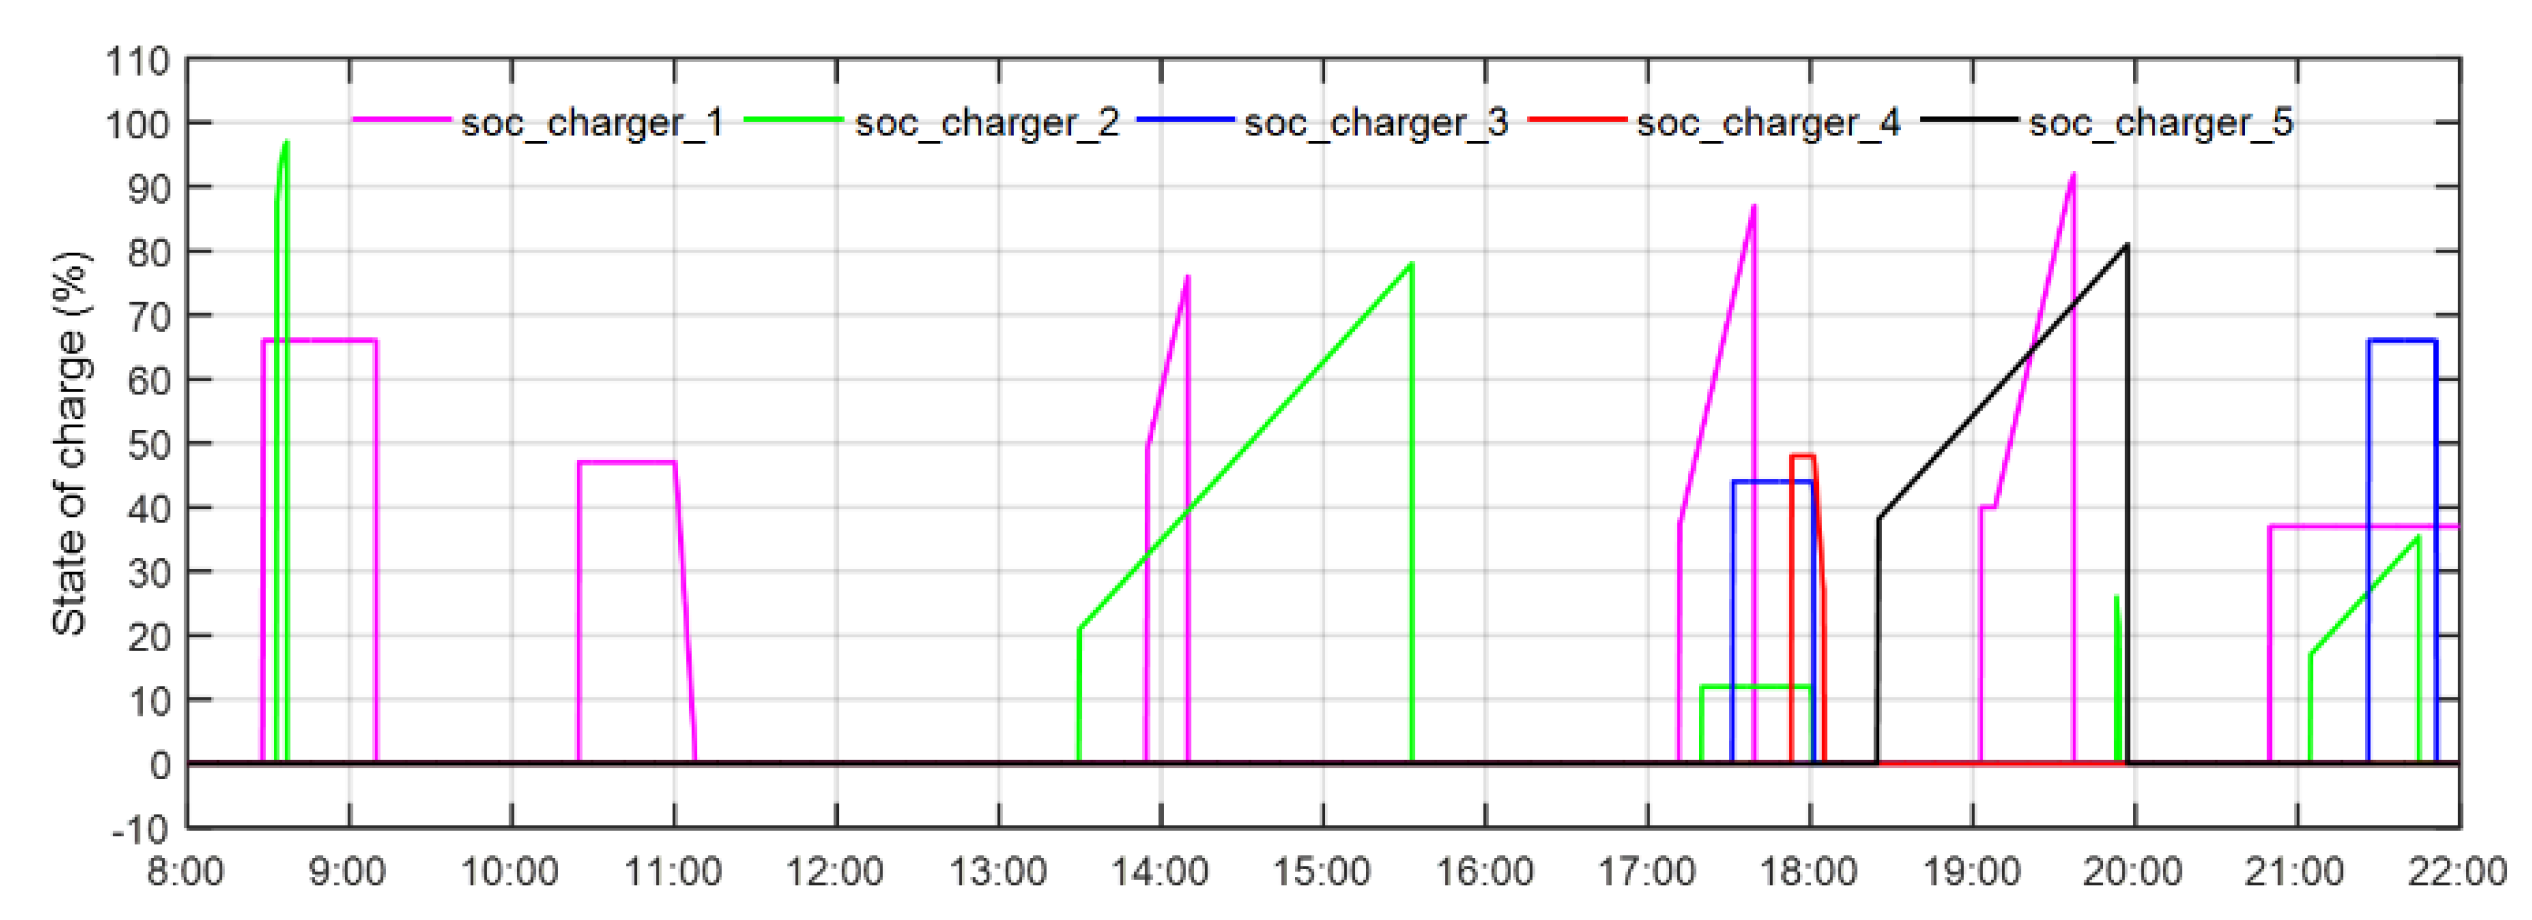
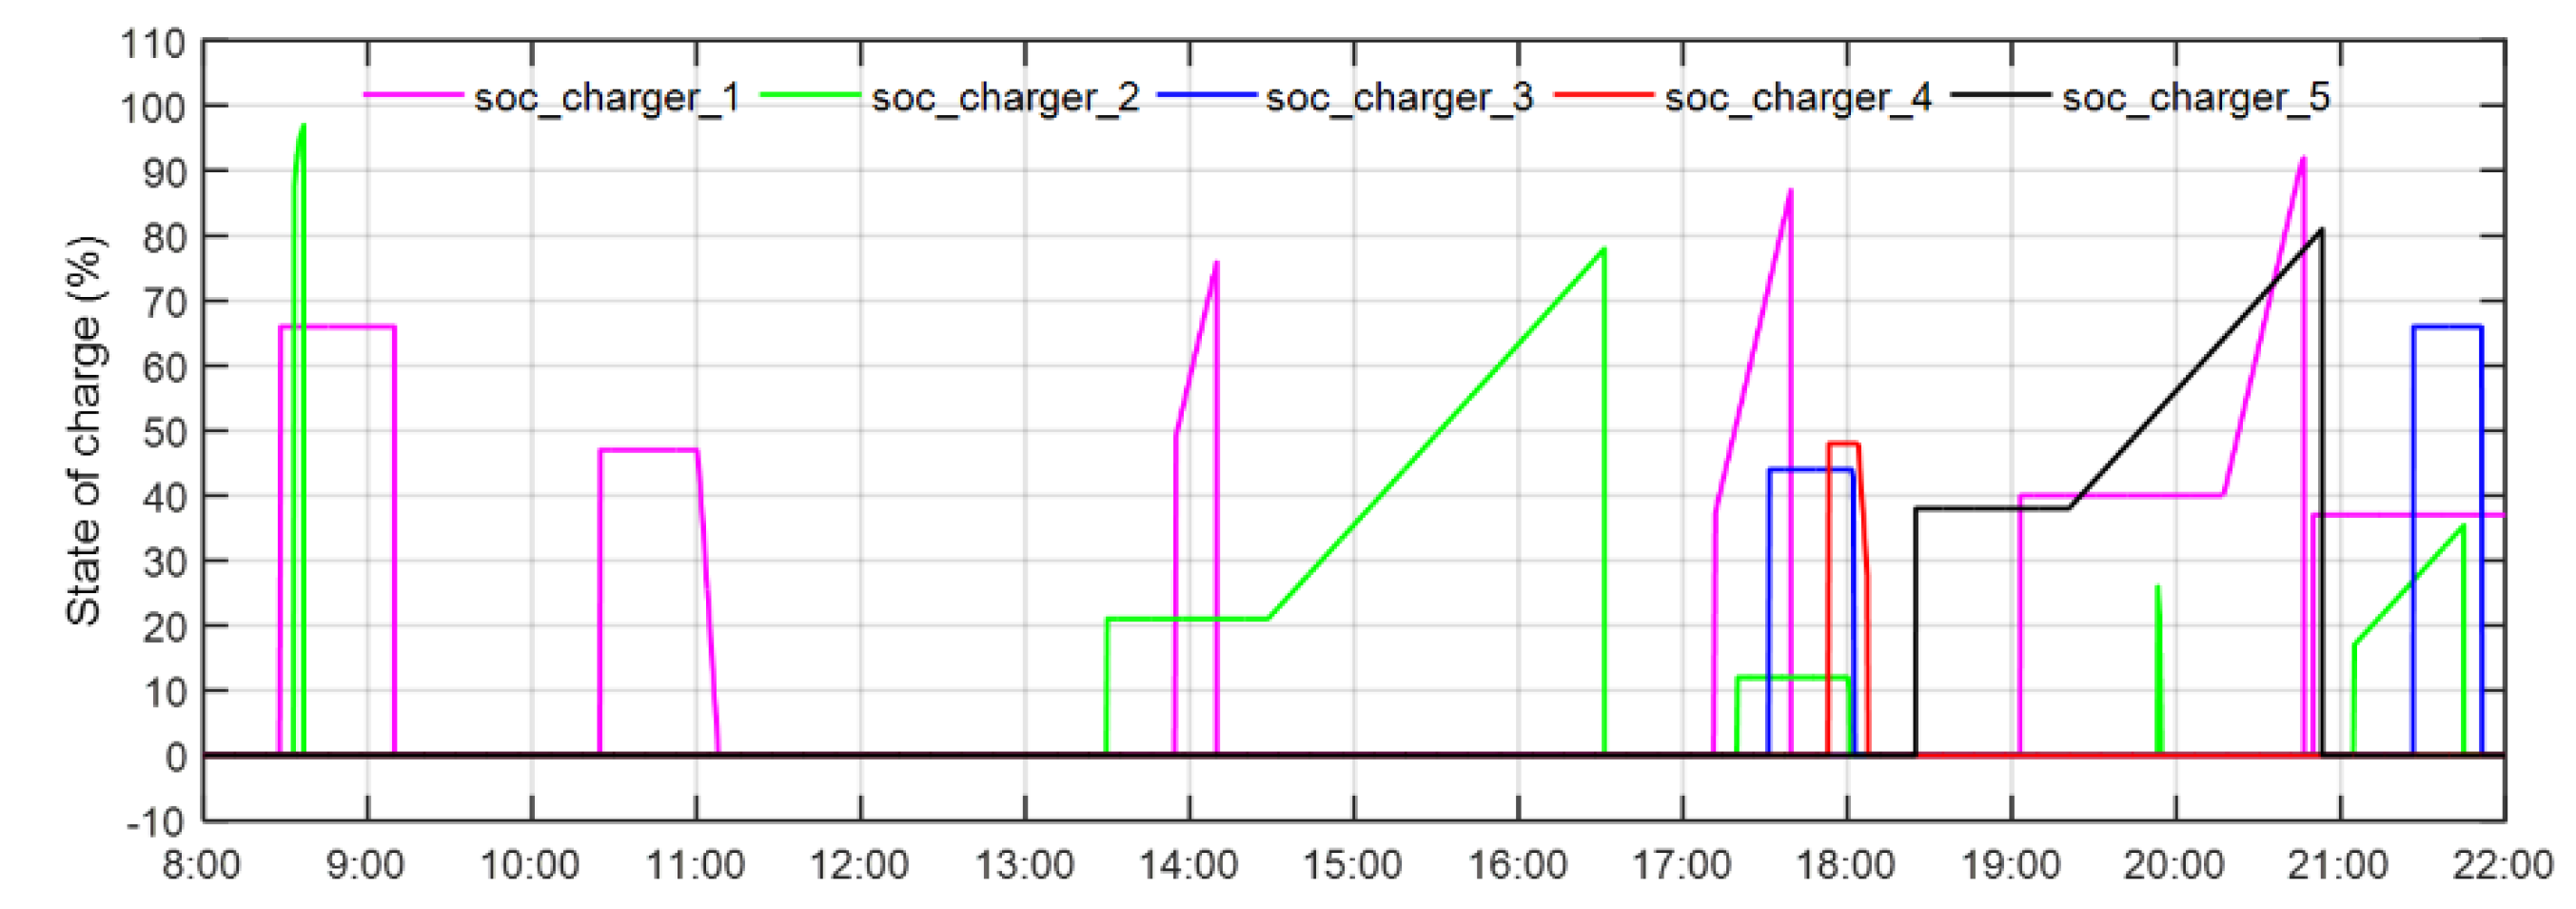
Figure 14 shows the
evolutions under ICDA.
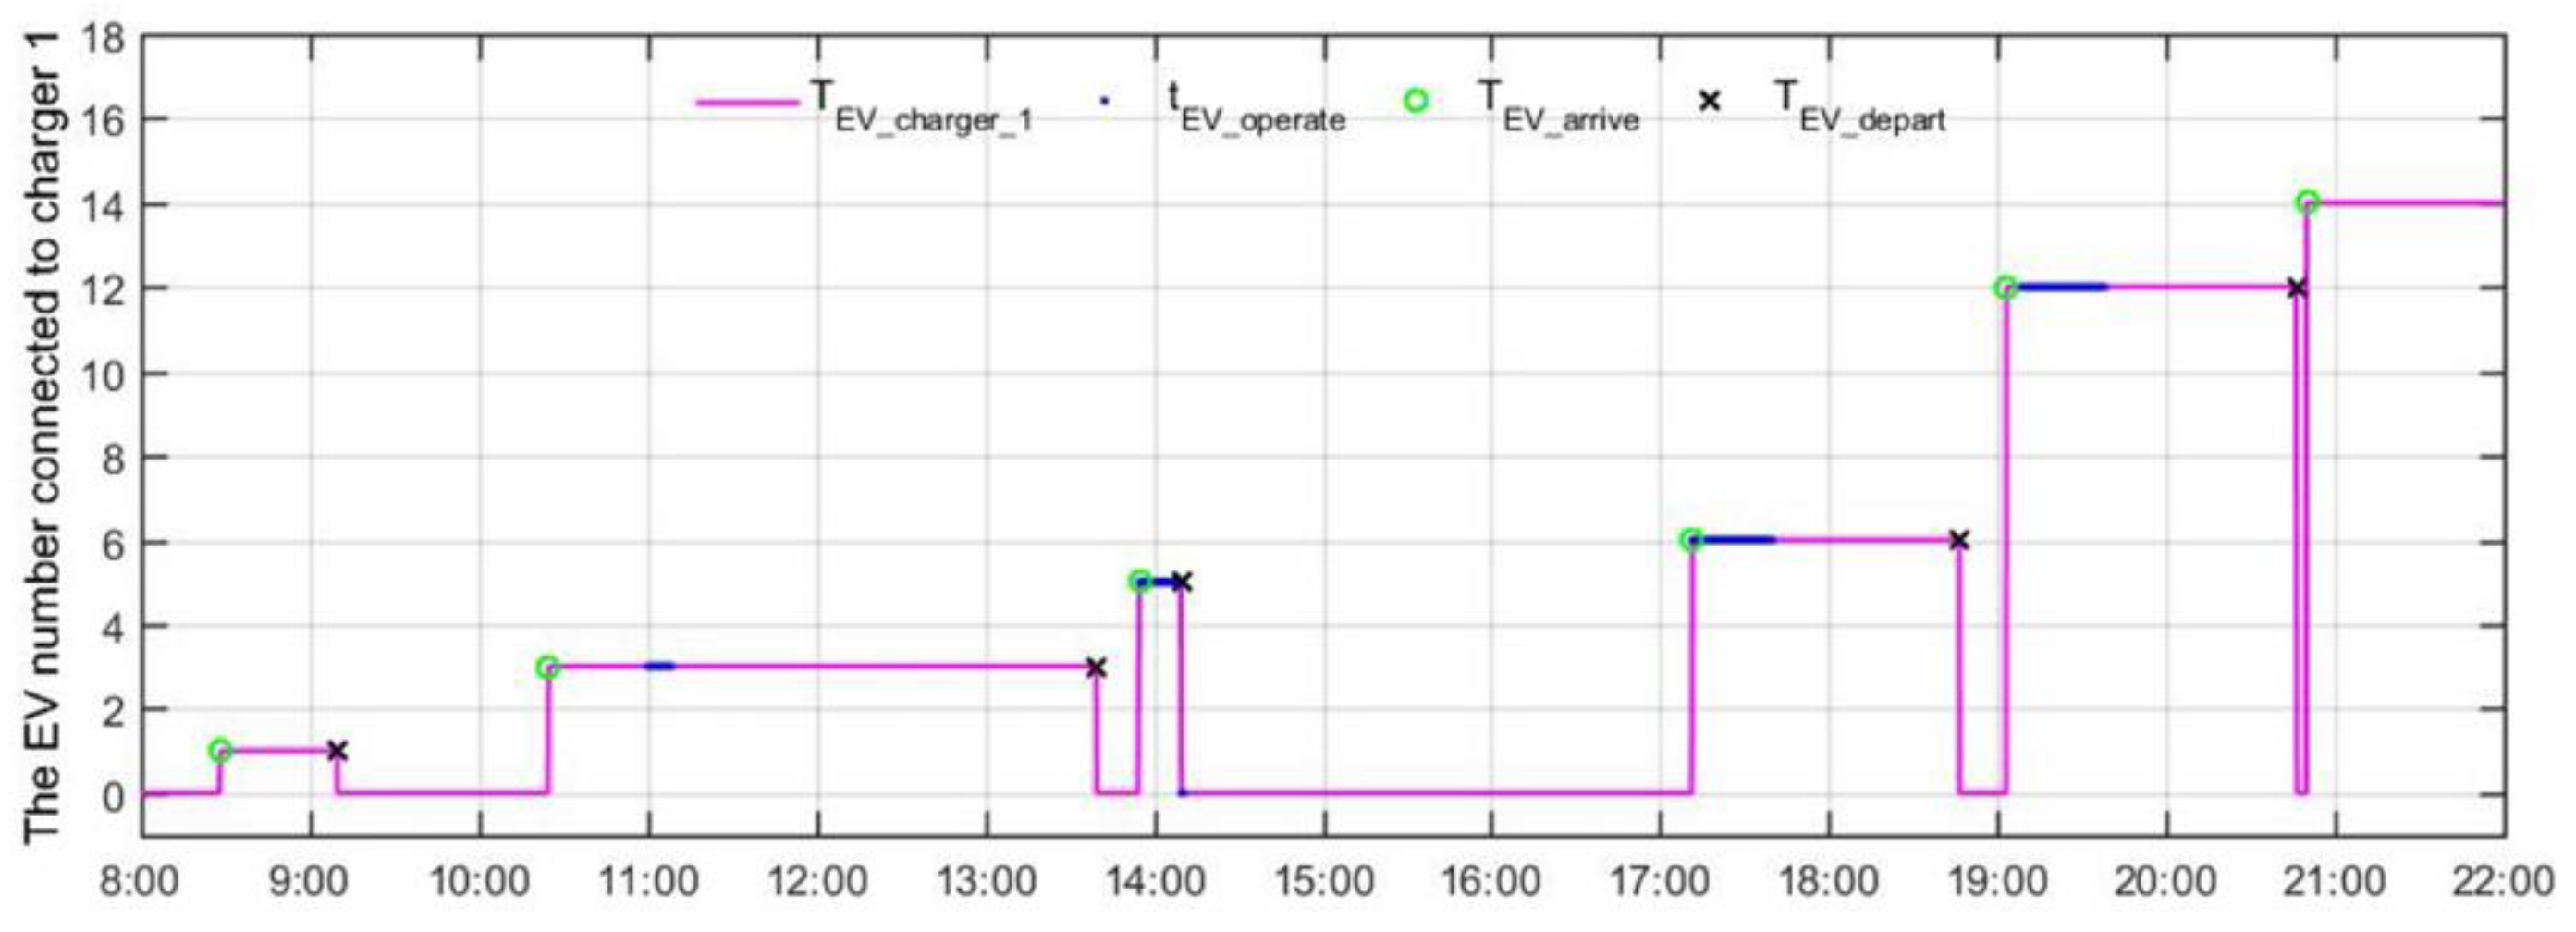
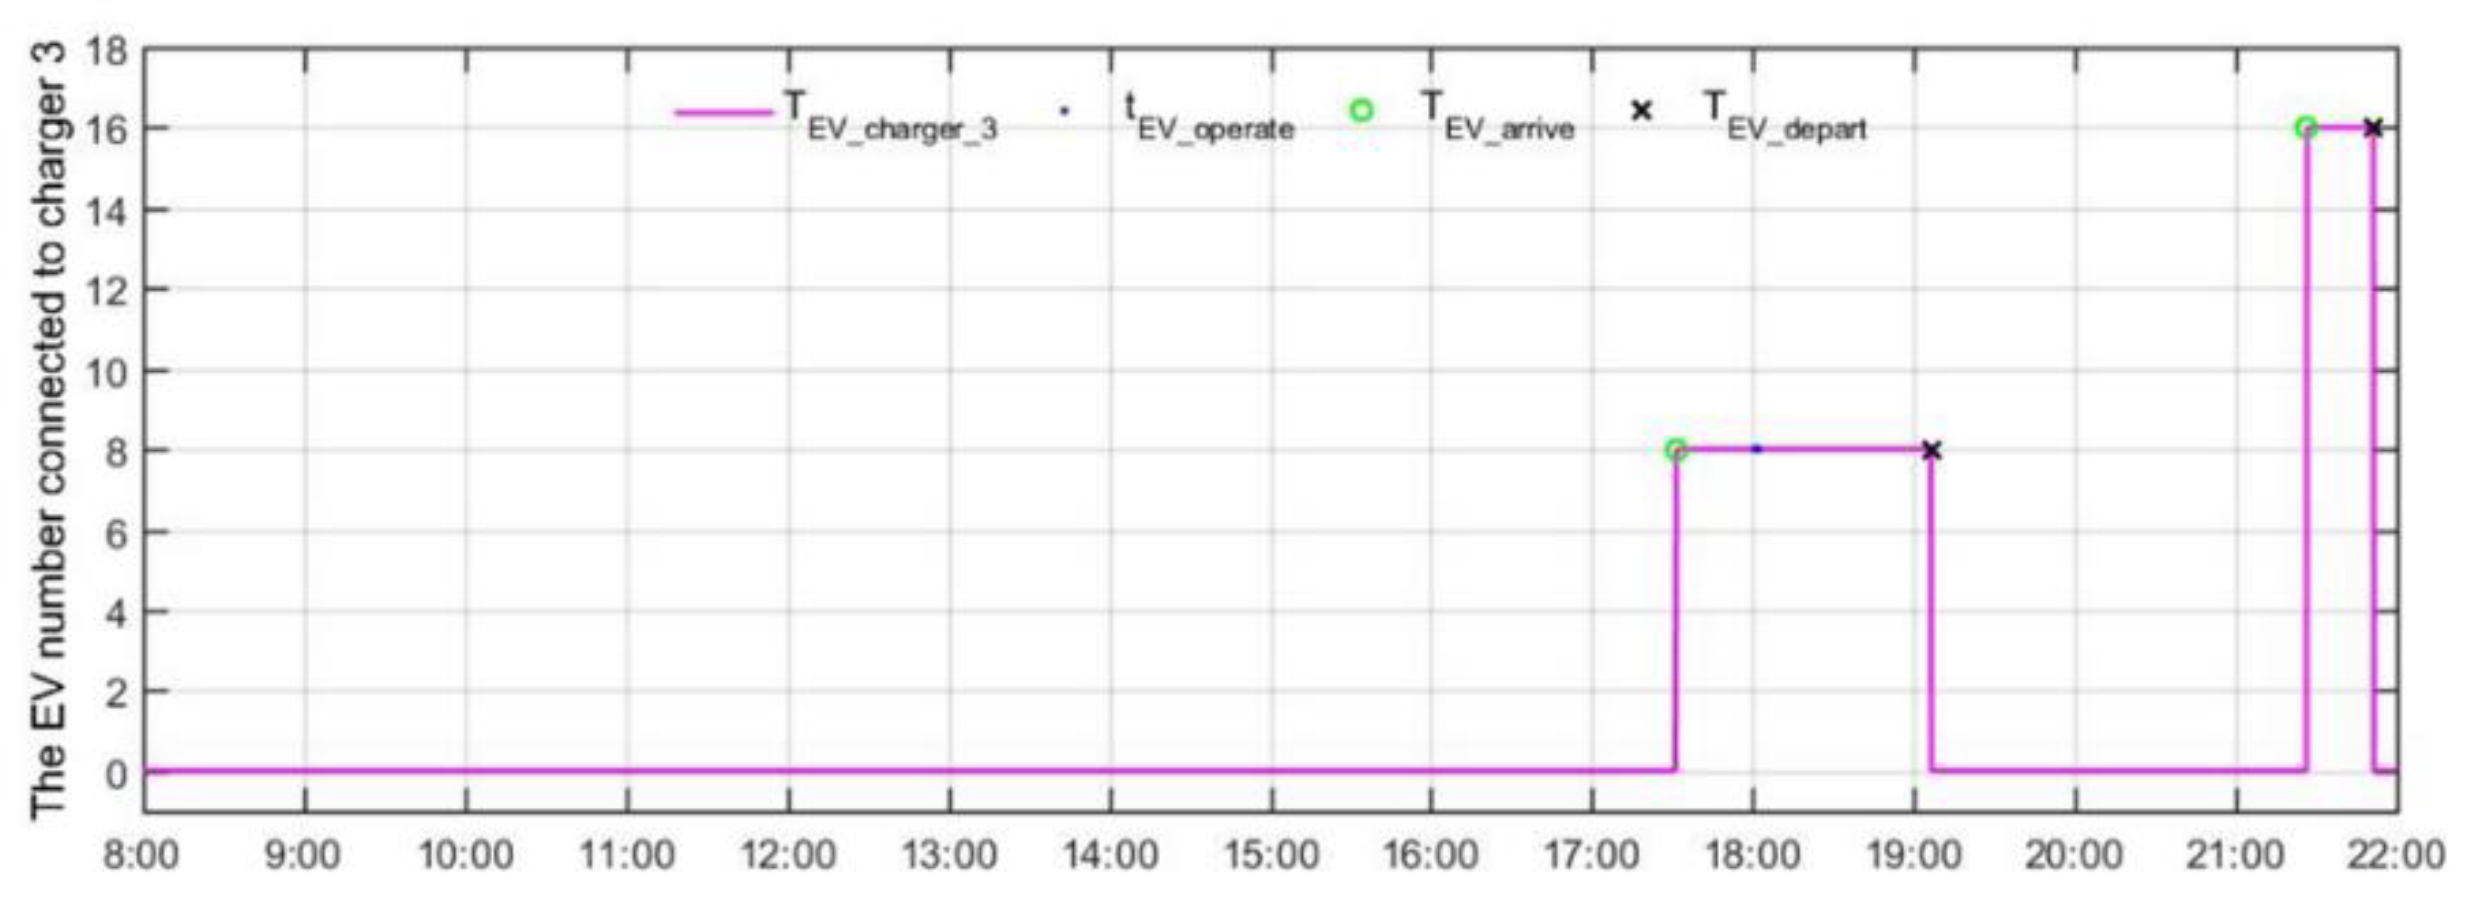
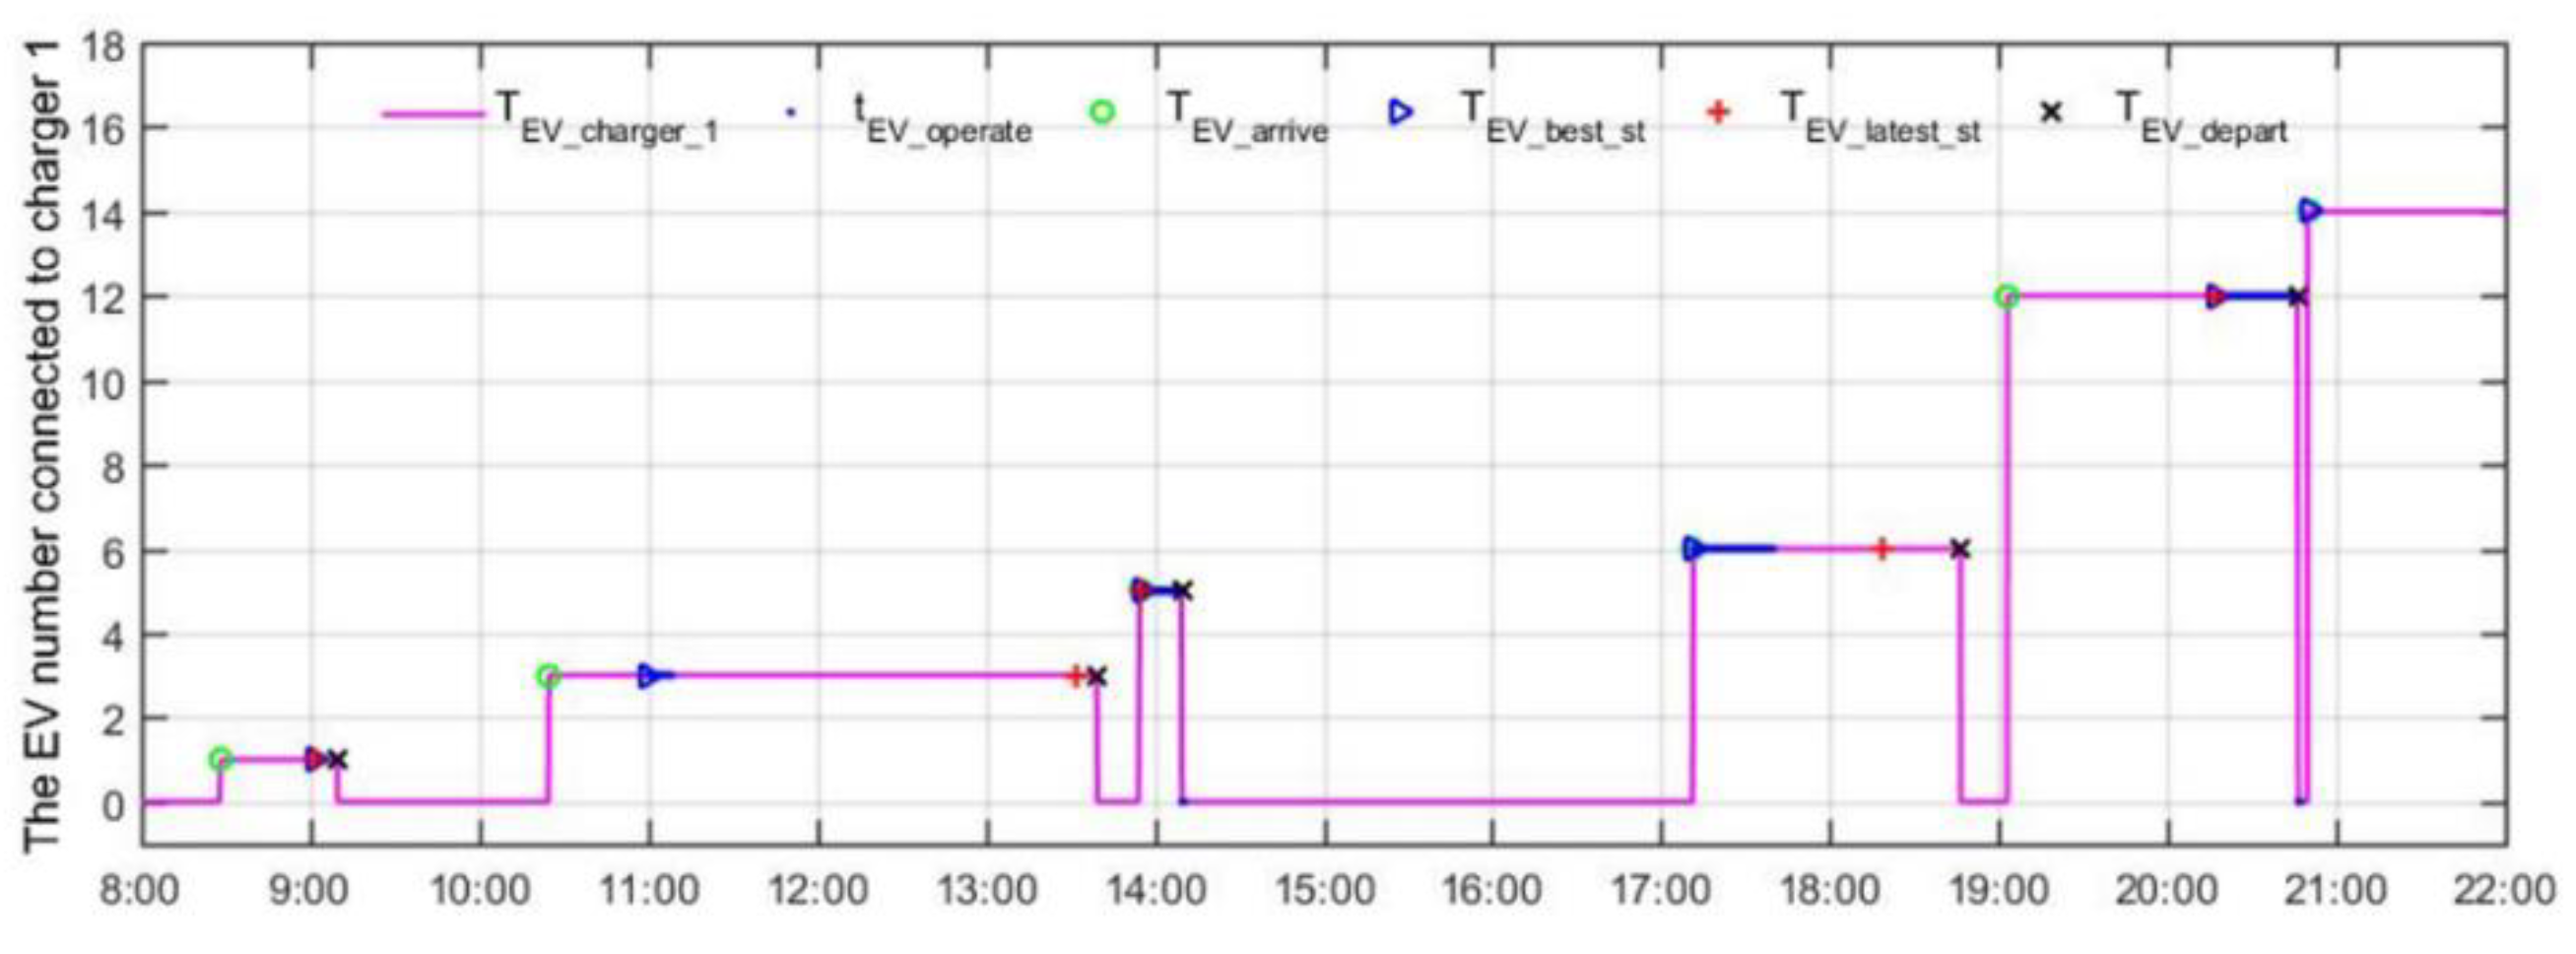
The operating time of EVs connected to charger 1 is shown in
Figure 15.
represents parking periods of EVs connected to charger 1.
represents the start operating time of EVs.
represents the arrival time of EVs.
represents the departure time of EVs.
As shown in
Figure 15, EVs connected to the charger 1 in chronological order are the 1st, 3rd, 5th, 6th, 12th, 14th. After an EV arrives at the charging station, when the power is met, the charging/discharging operation begins. EVs that immediately start charging/discharging operations after arriving at the charging station are the 5th, 6th, 12th, while the 3rd EV enters the waiting state after arriving at the charging station, then discharges when power is met. Moreover, the 1
st and 14
th did not discharge until they left because of unsatisfactory power.
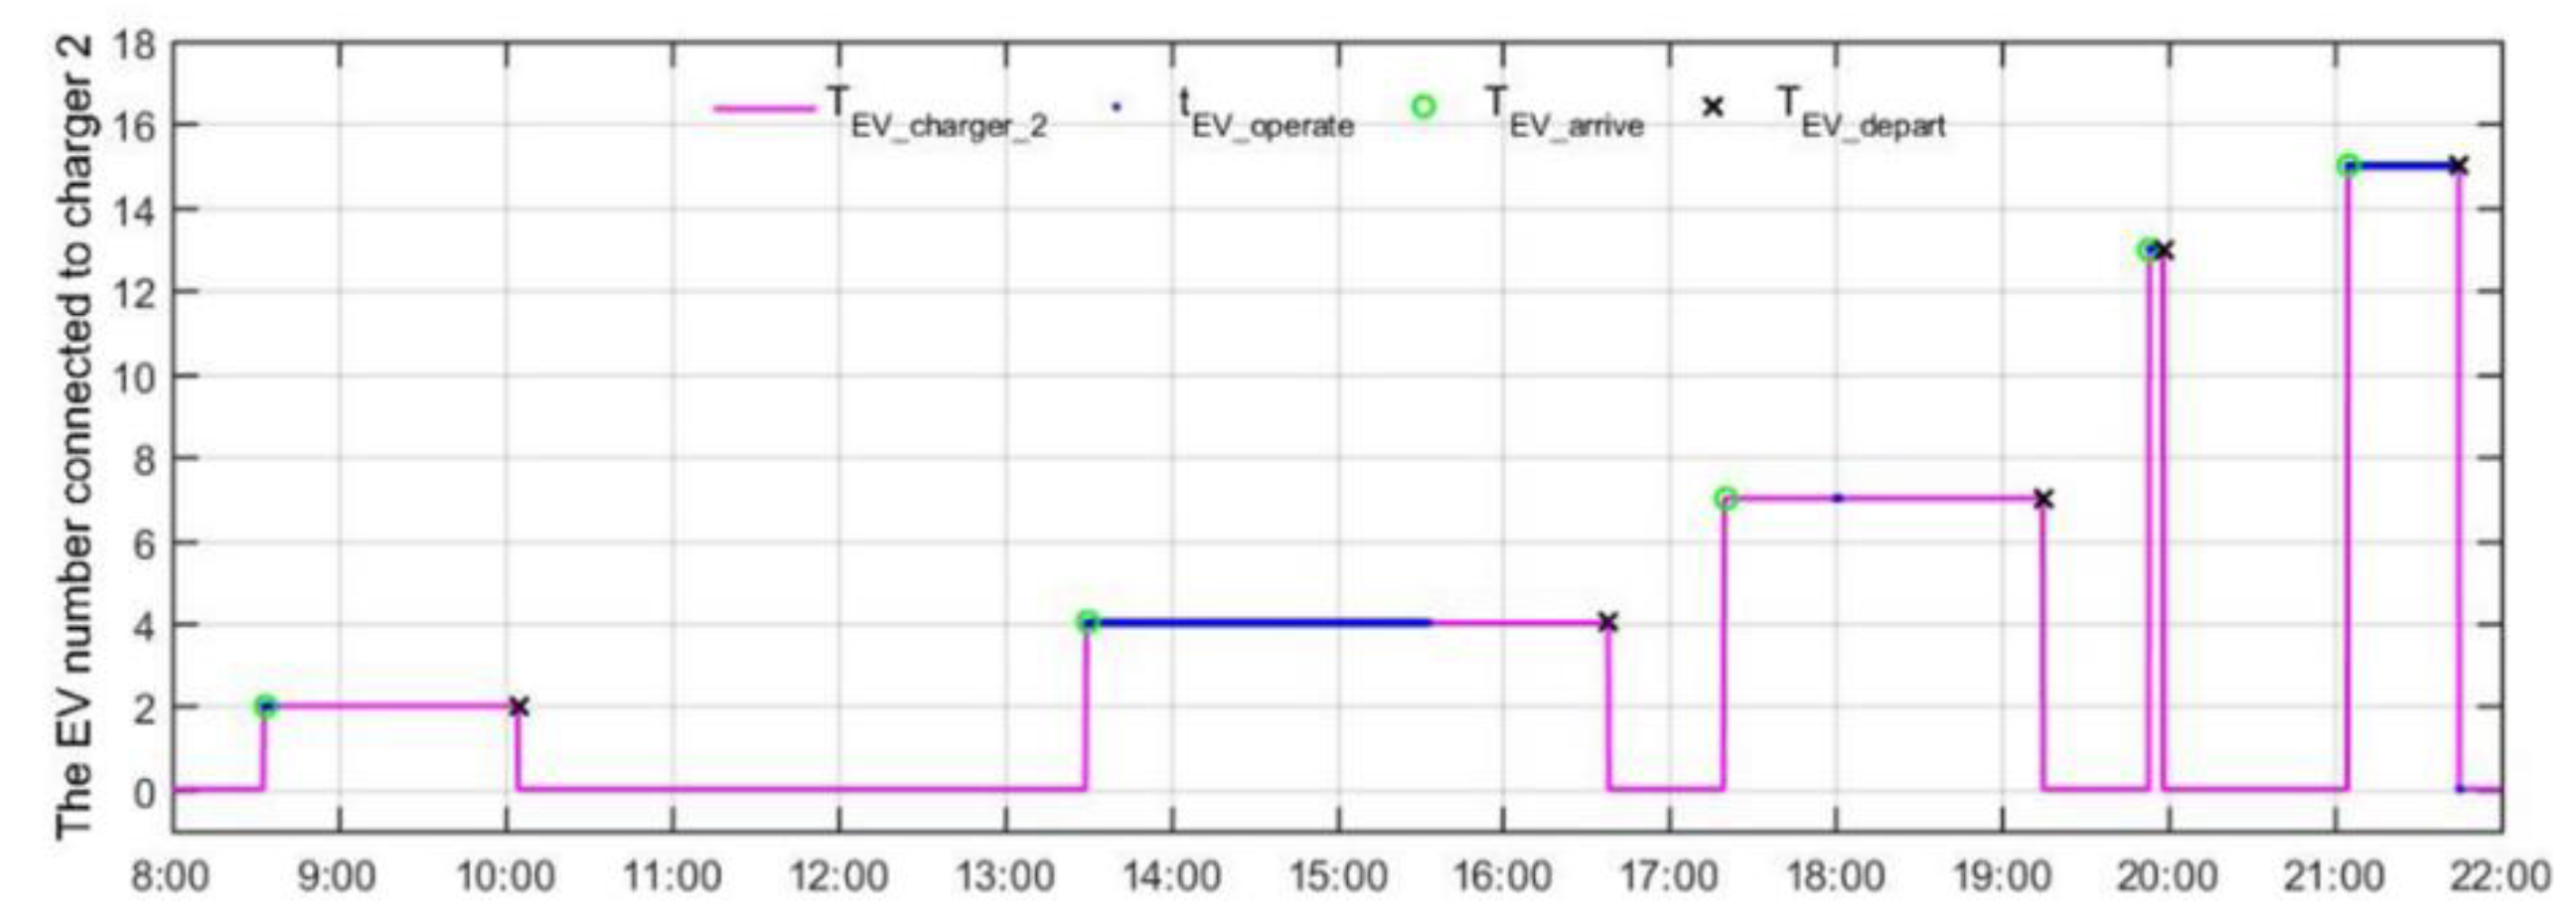
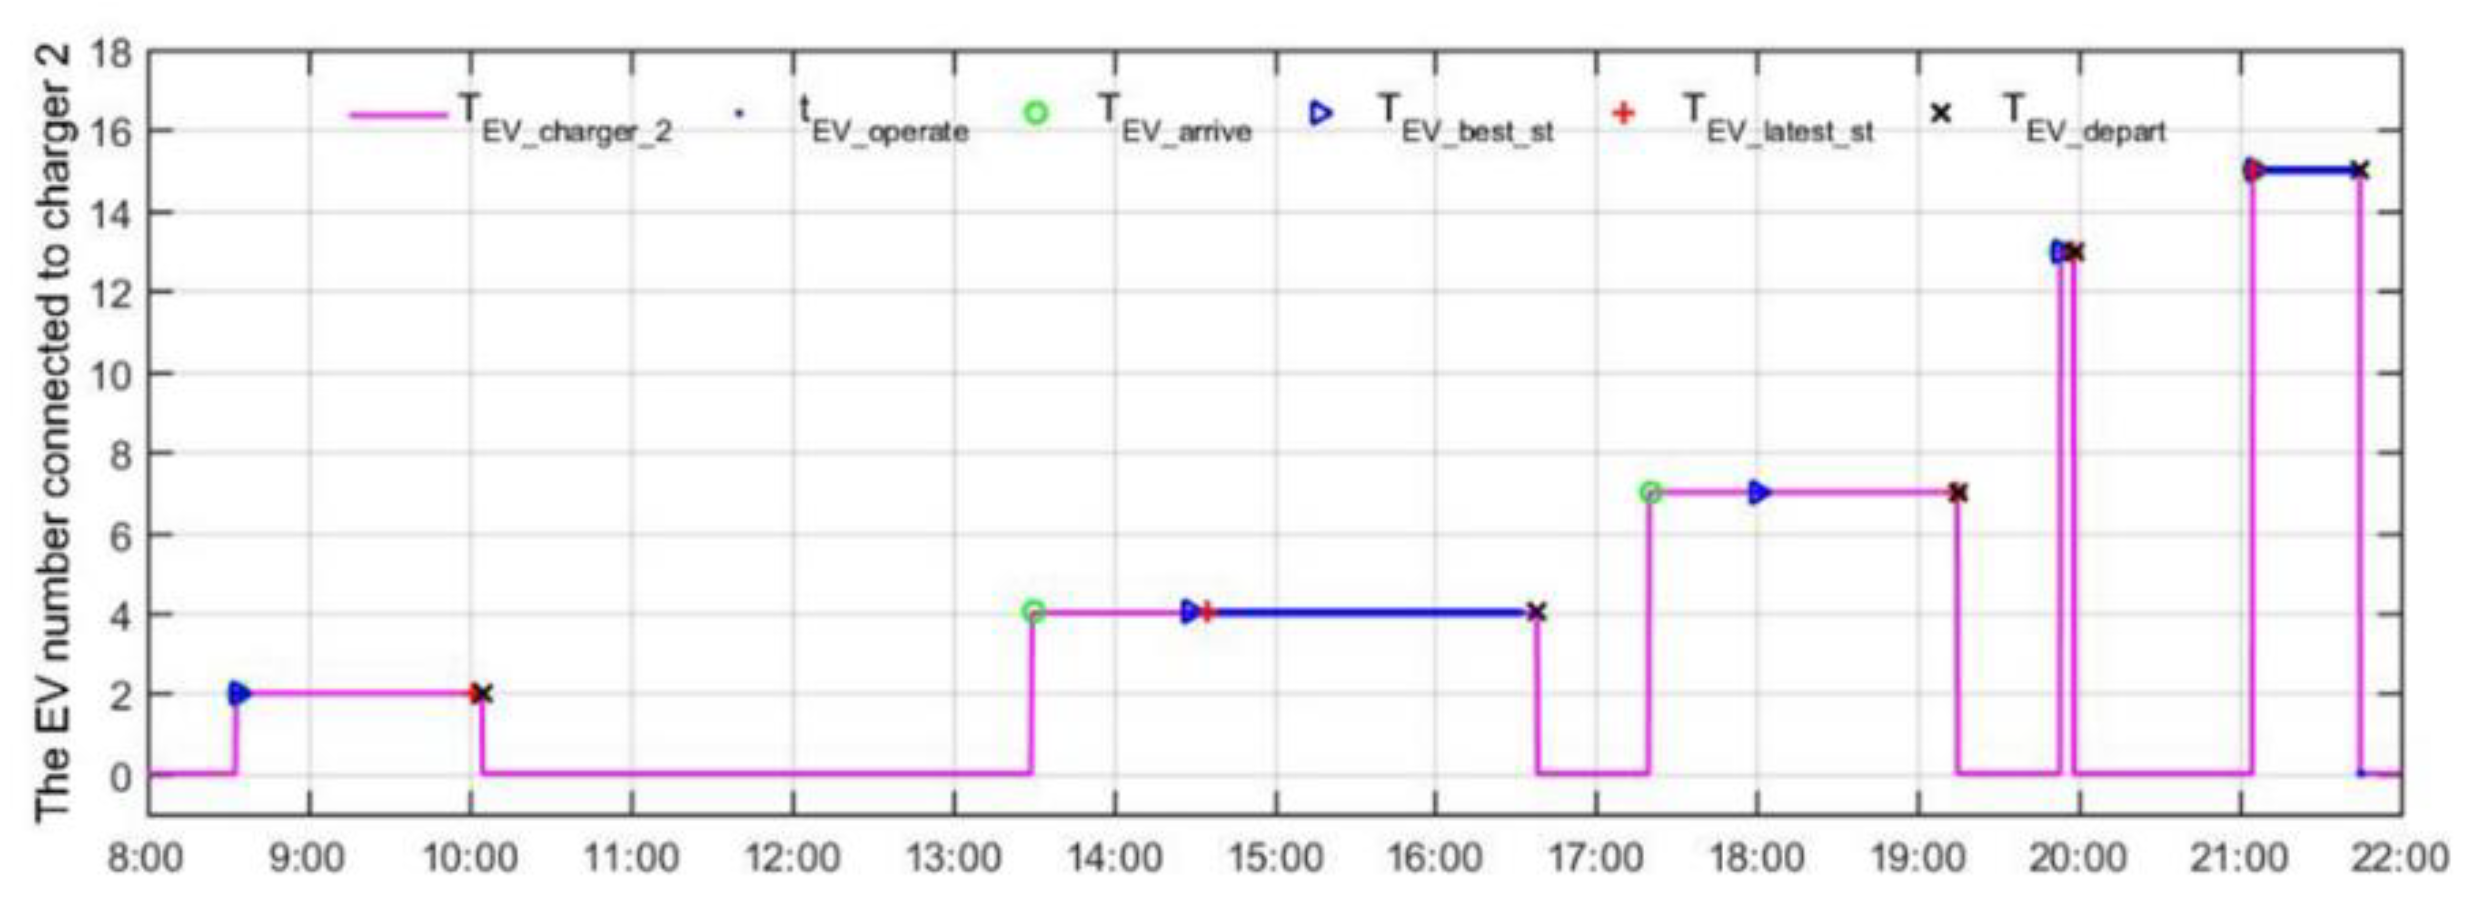
The operating time of EVs connected to charger 2 is shown in
Figure 16. As shown in
Figure 16, EVs connected to the charger 2 in chronological order are 2nd, 4th, 7th, 13th, 15th. EVs that immediately start charging/discharging operations after arriving at the charging station are the 2nd, the 4th, the 13th, the 15th EVs, while the 7th EV enters the waiting state after arriving at the charging station, then discharges when power is met.
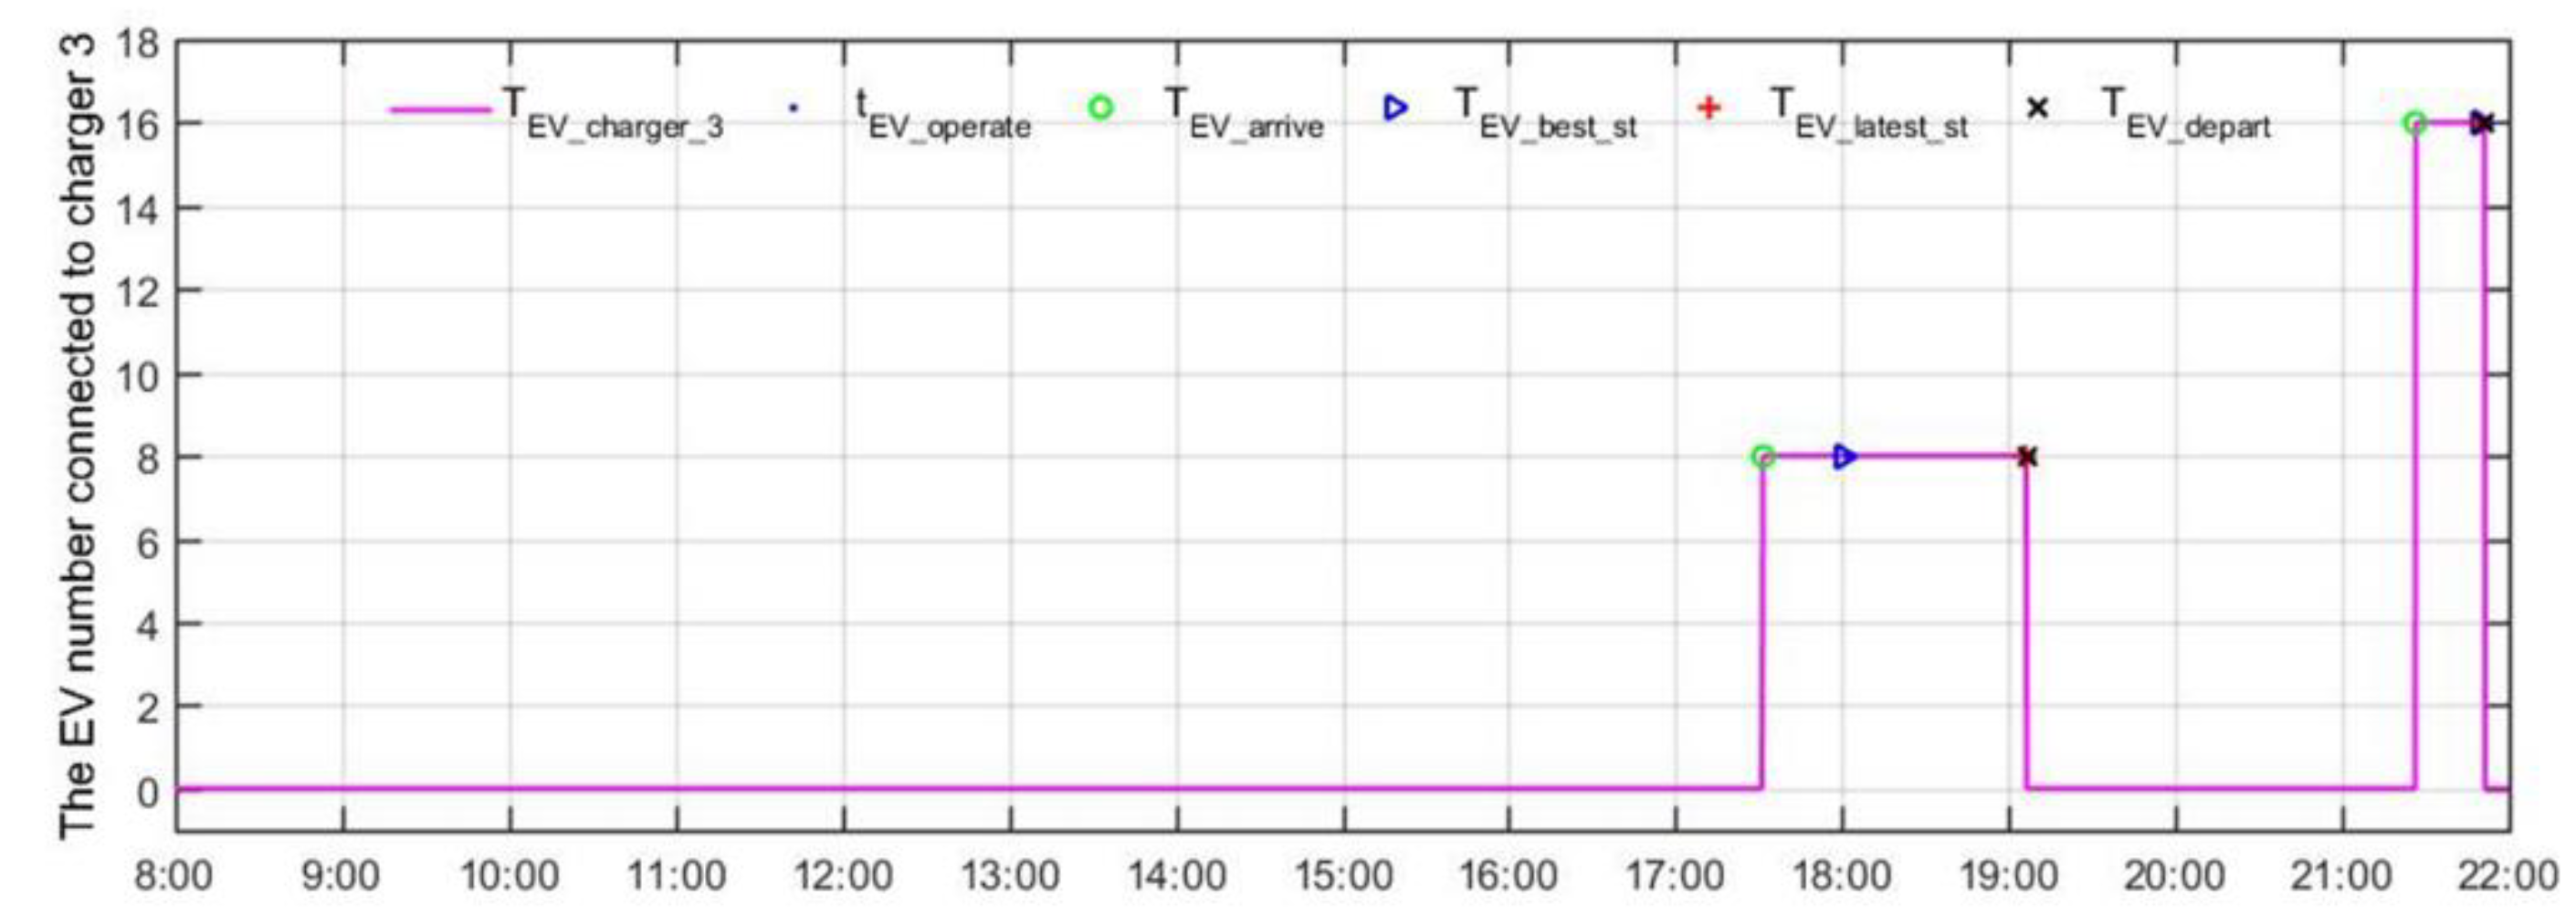
The operating time of EVs connected to charger 3 is shown in
Figure 17. As shown in
Figure 17, EVs connected to the charger 3 in chronological order are the 8th and the 16th EVs. The 8th EV enters the waiting state after arriving at the charging station, then discharges when power is met, while the 16th EV did not charge until it left because of unsatisfactory power.
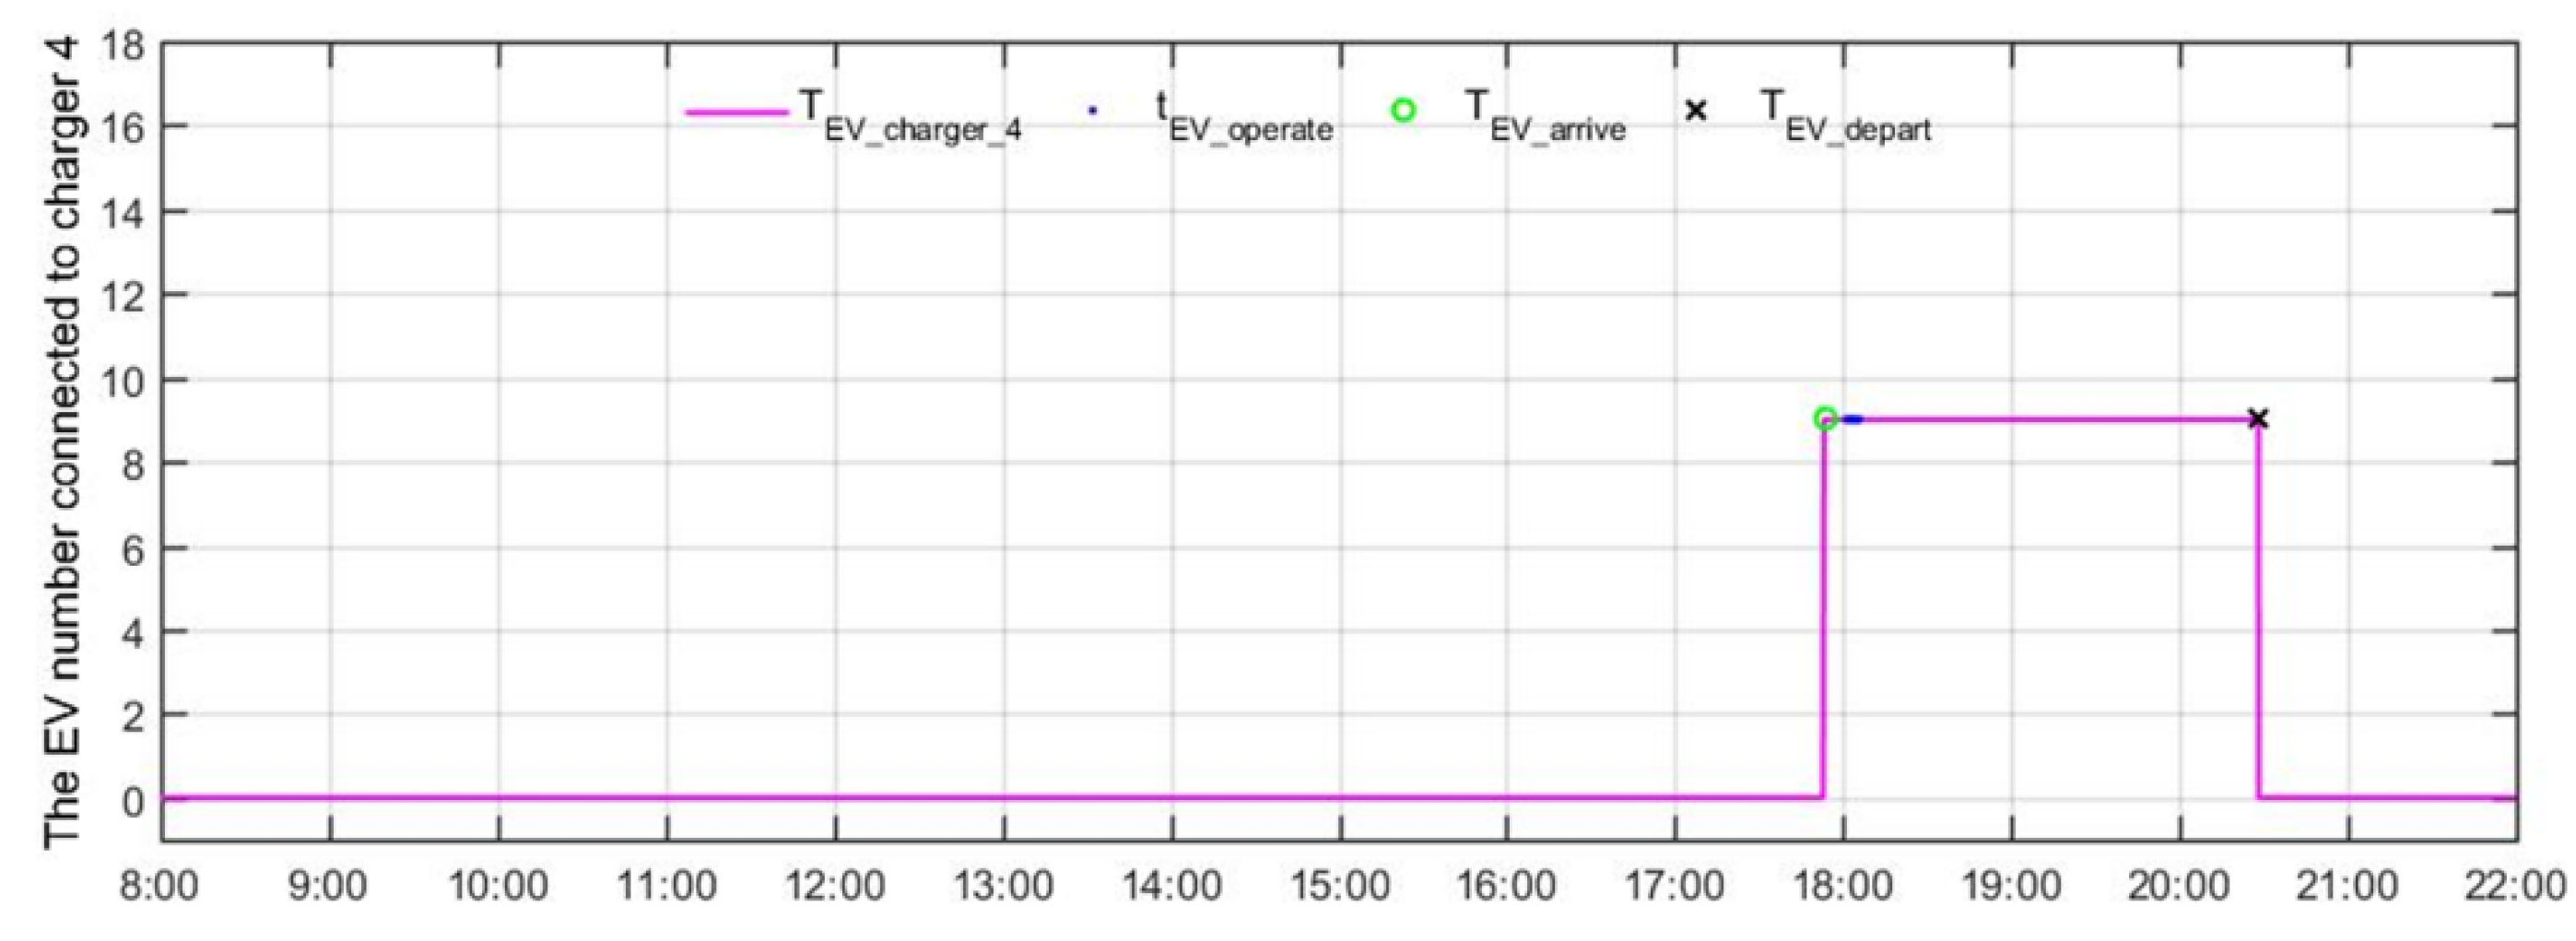
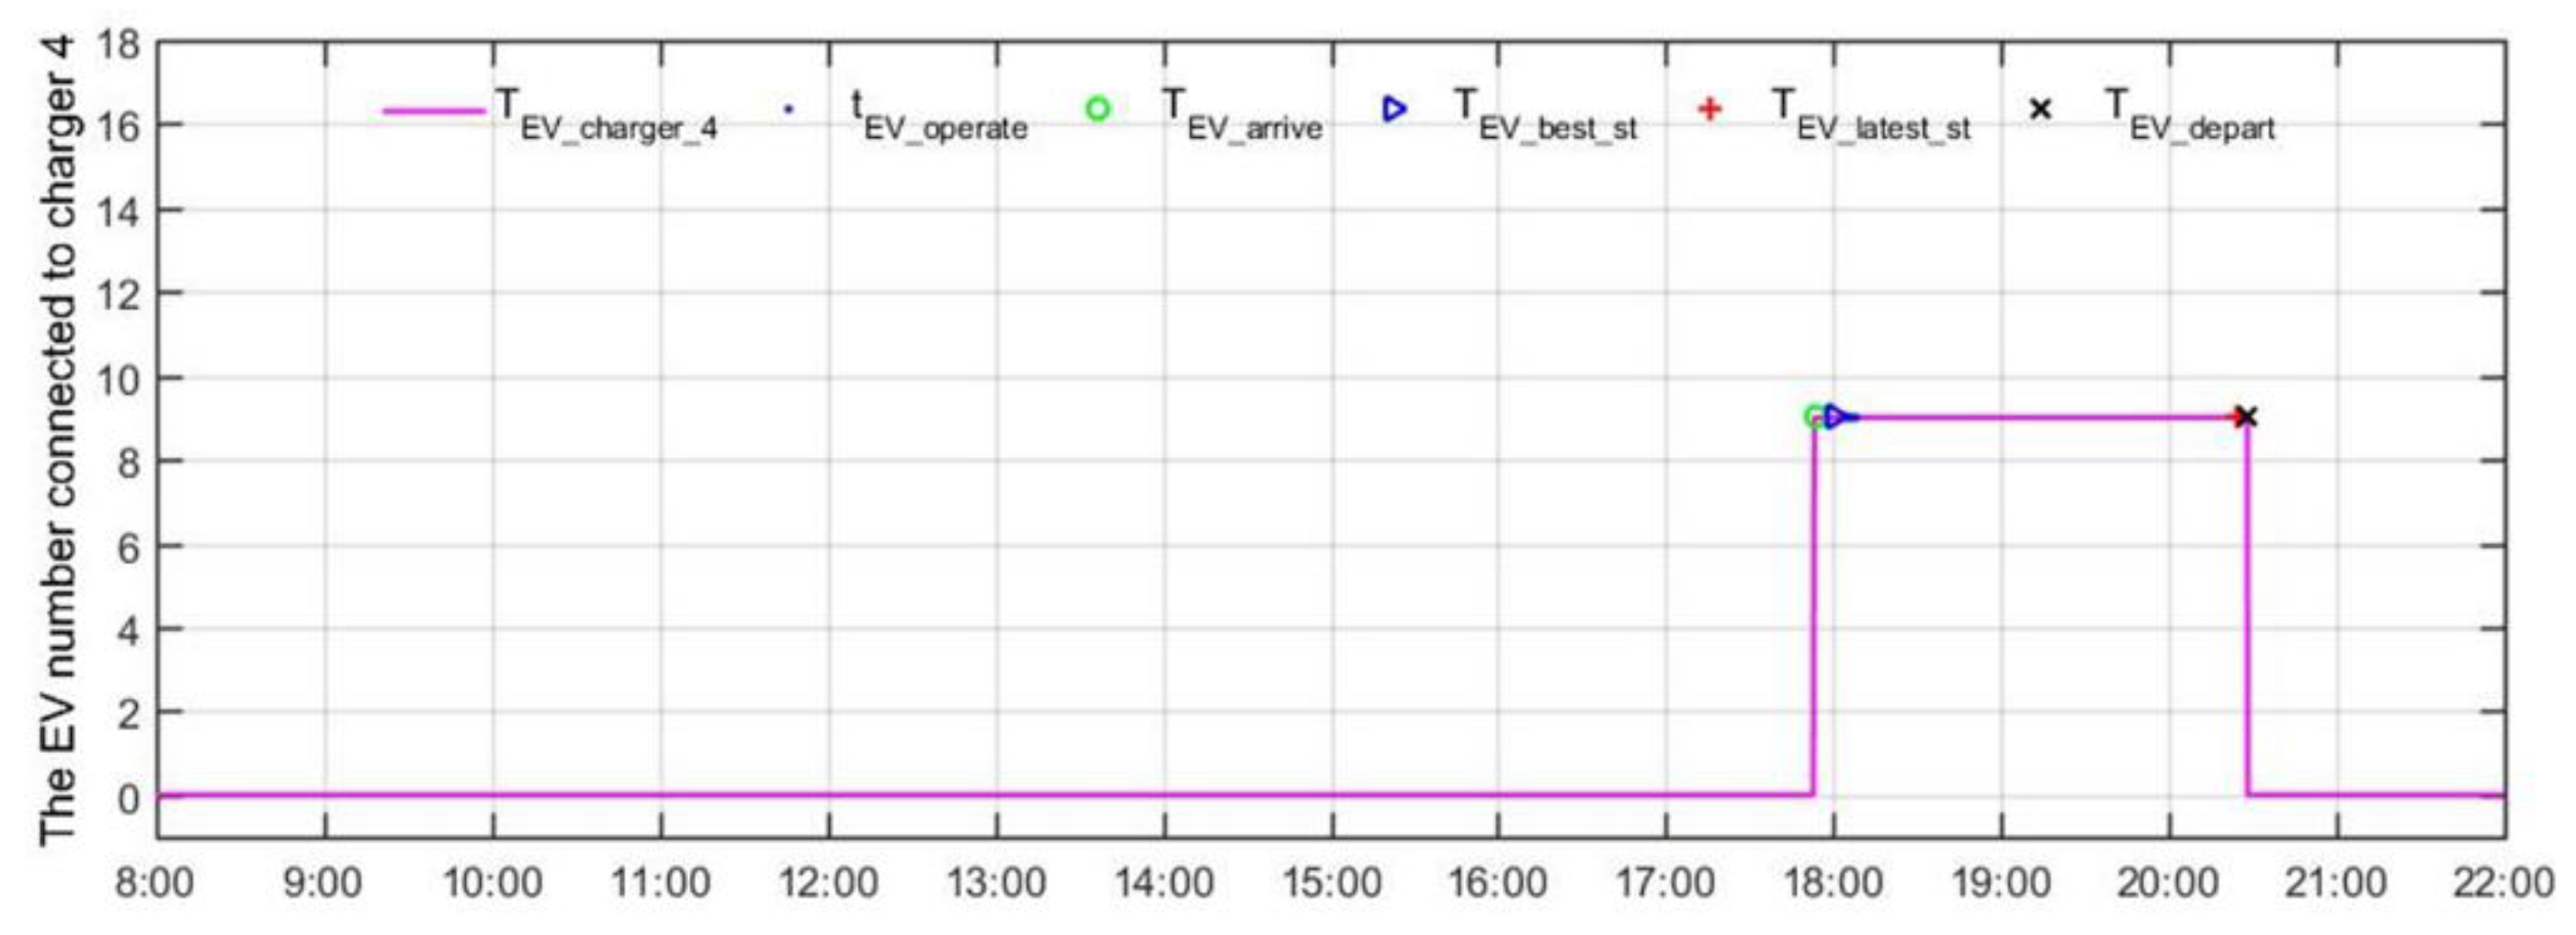
The operating time of EVs connected to charger 4 is shown in
Figure 18. As shown in
Figure 18, the EV connected to charger 4 is the 9th EV. The 9th EV enters the waiting state after arriving at the charging station, then discharges when the power is met.
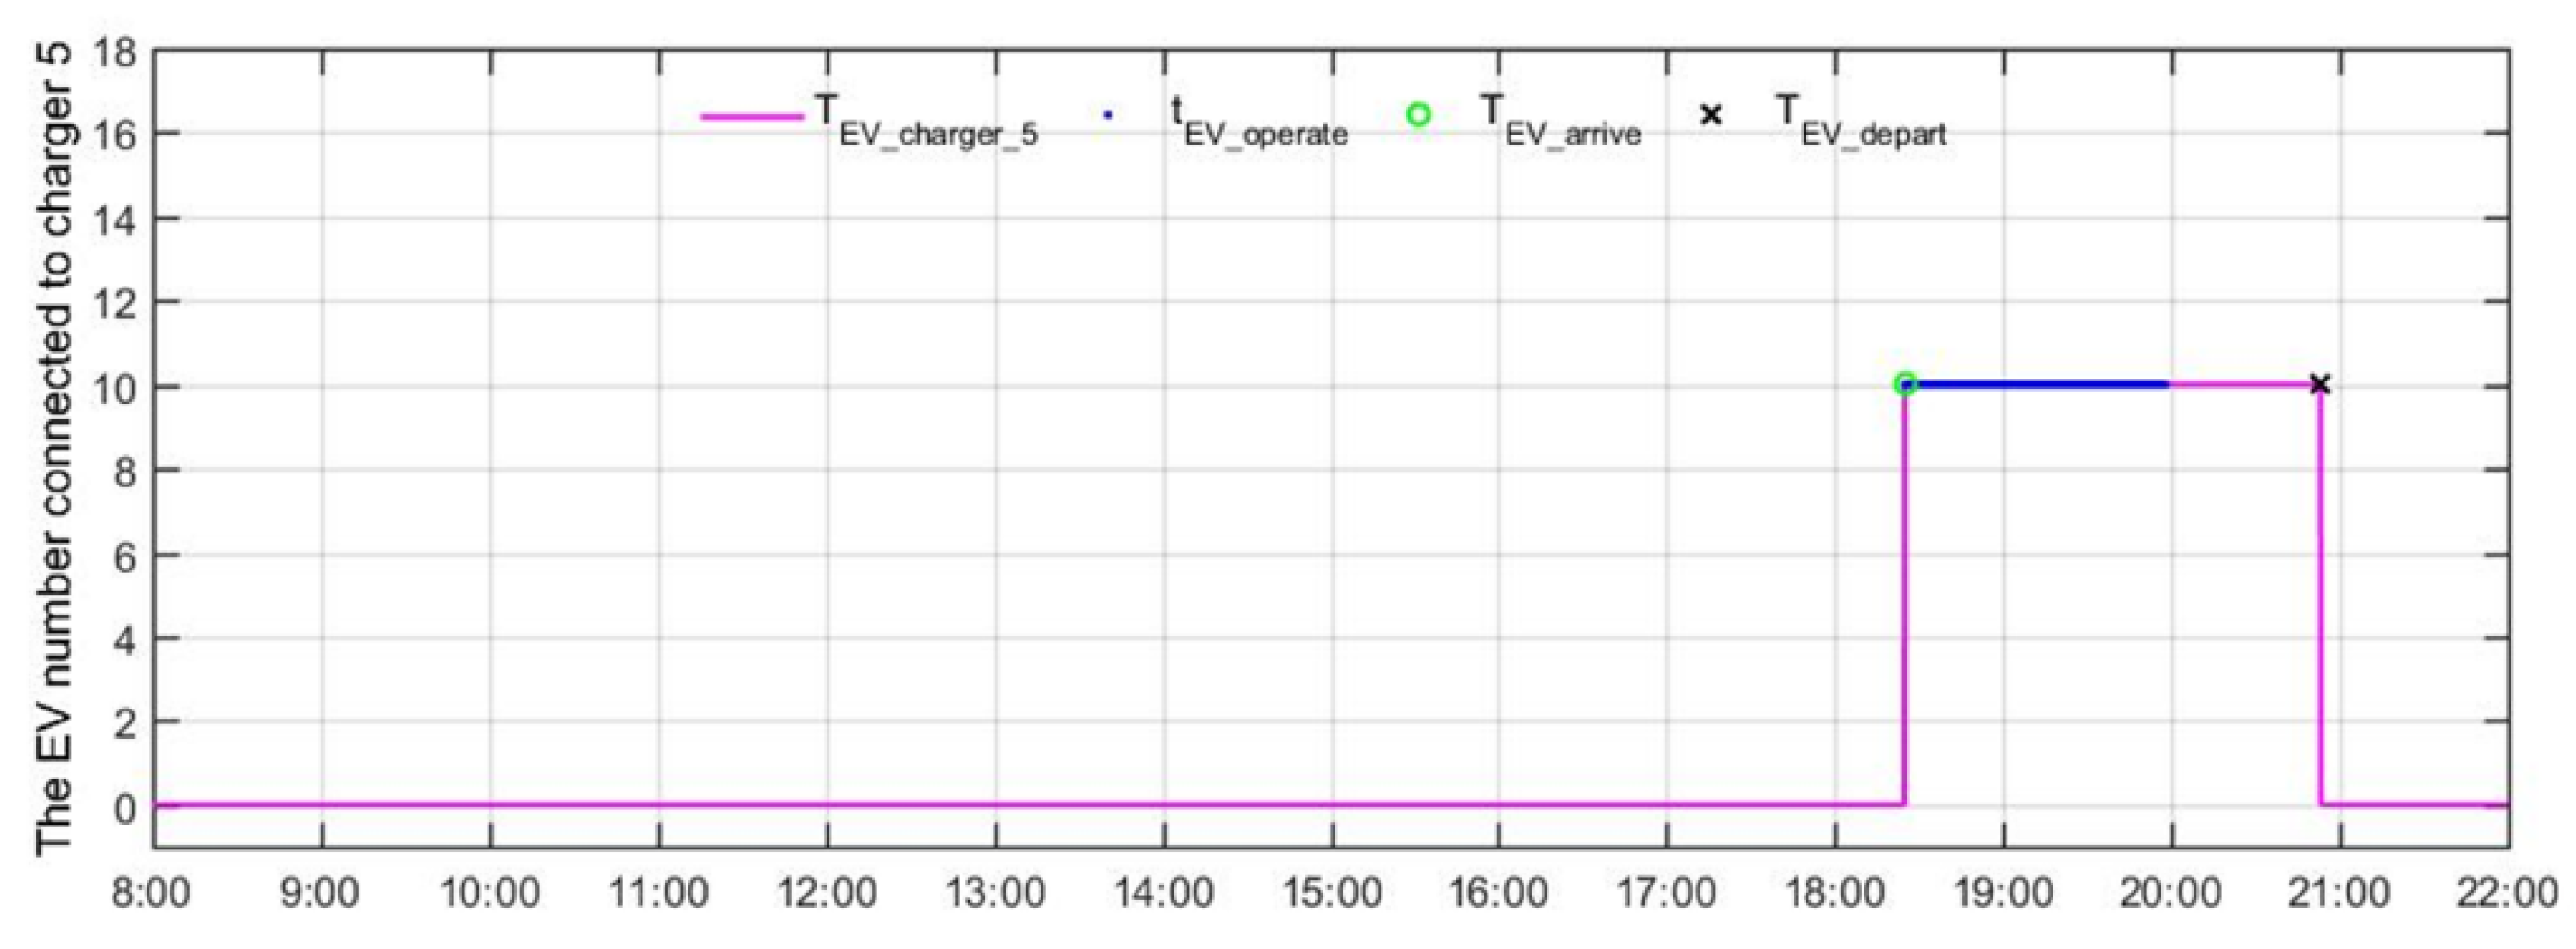
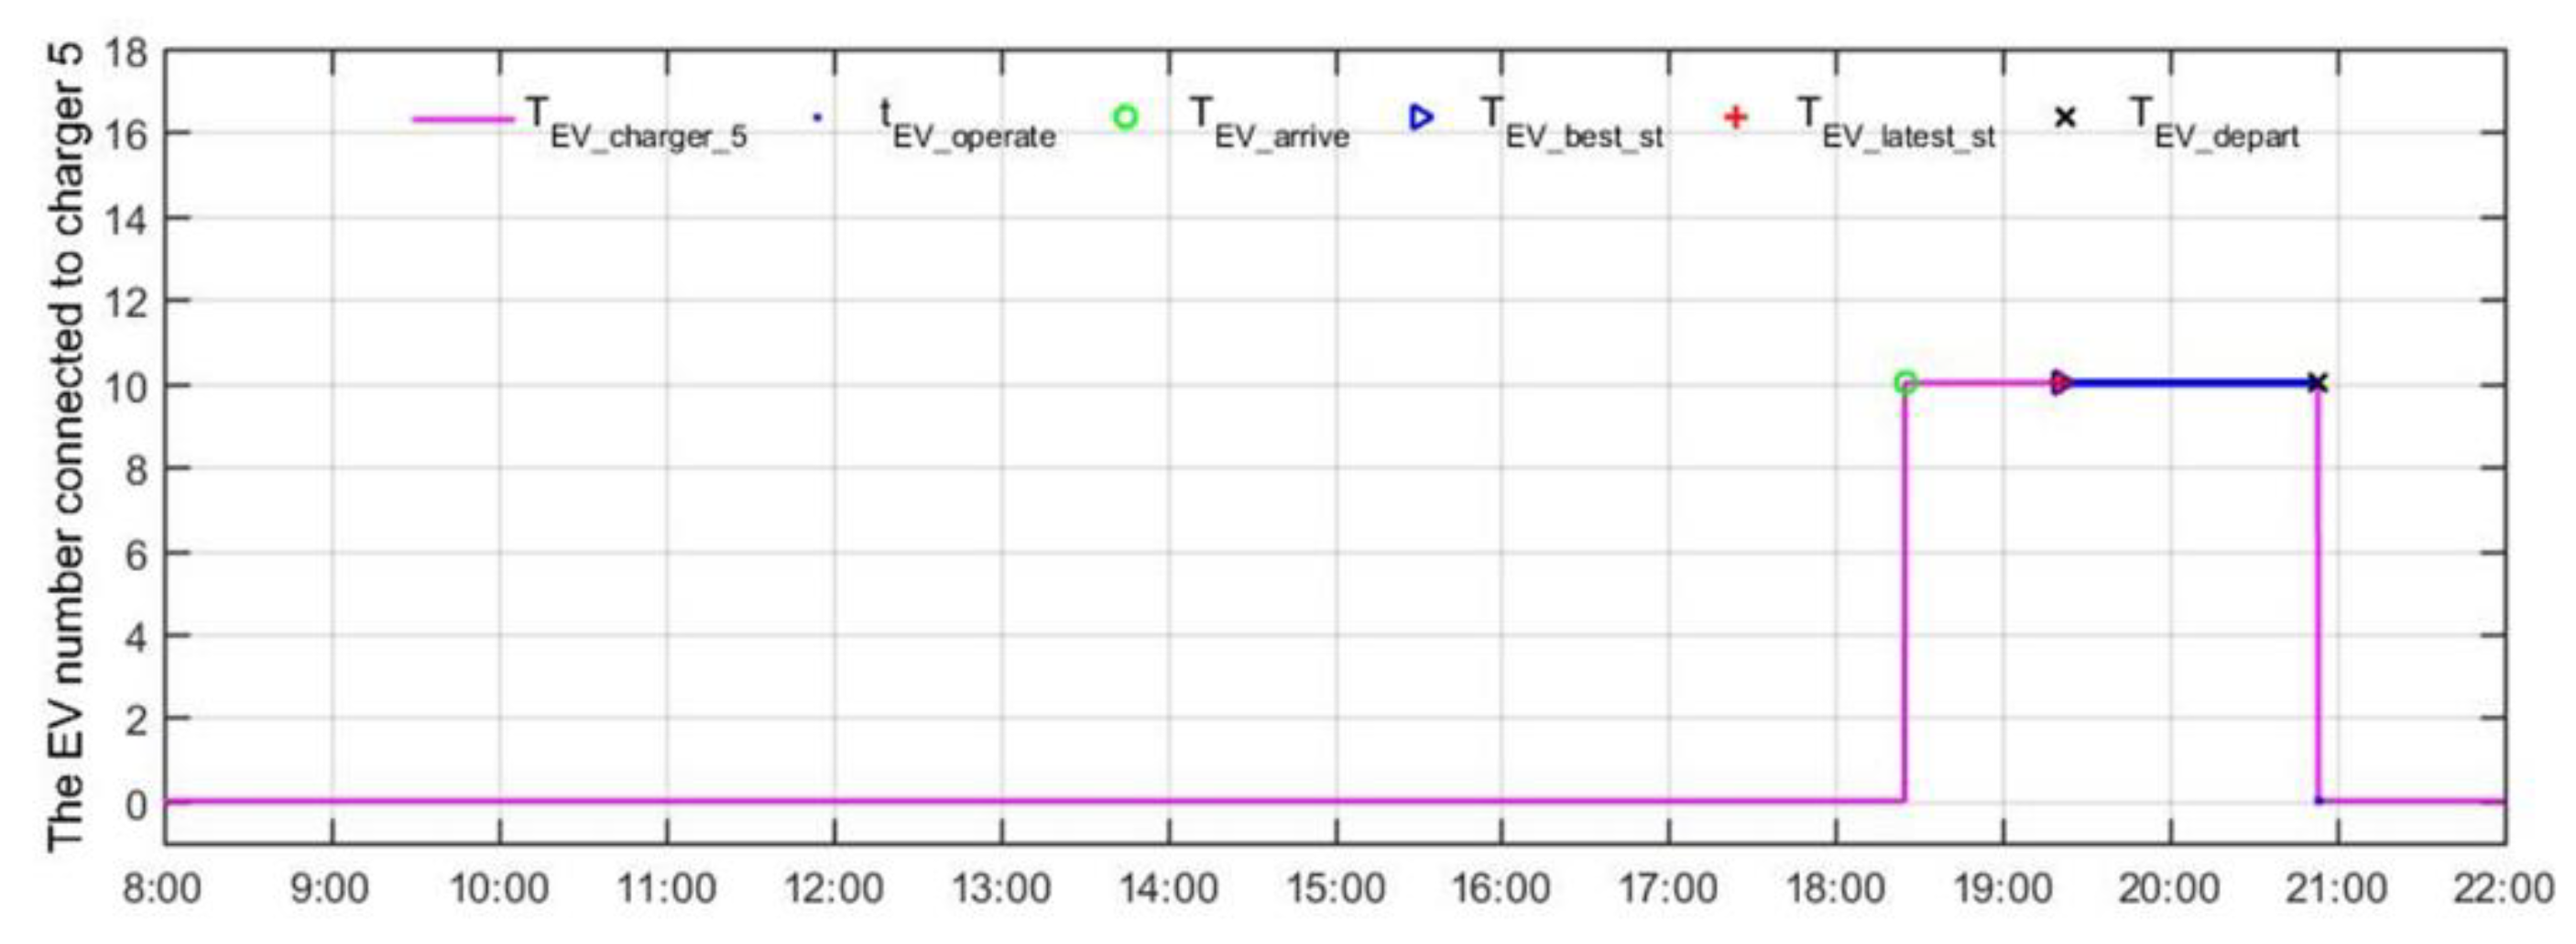
The operating time of EVs connected to charger 5 is shown in
Figure 19. The EV connected to the charger 5 is the 10th EV, which immediately starts charging/discharging operations after arriving at the charging station.
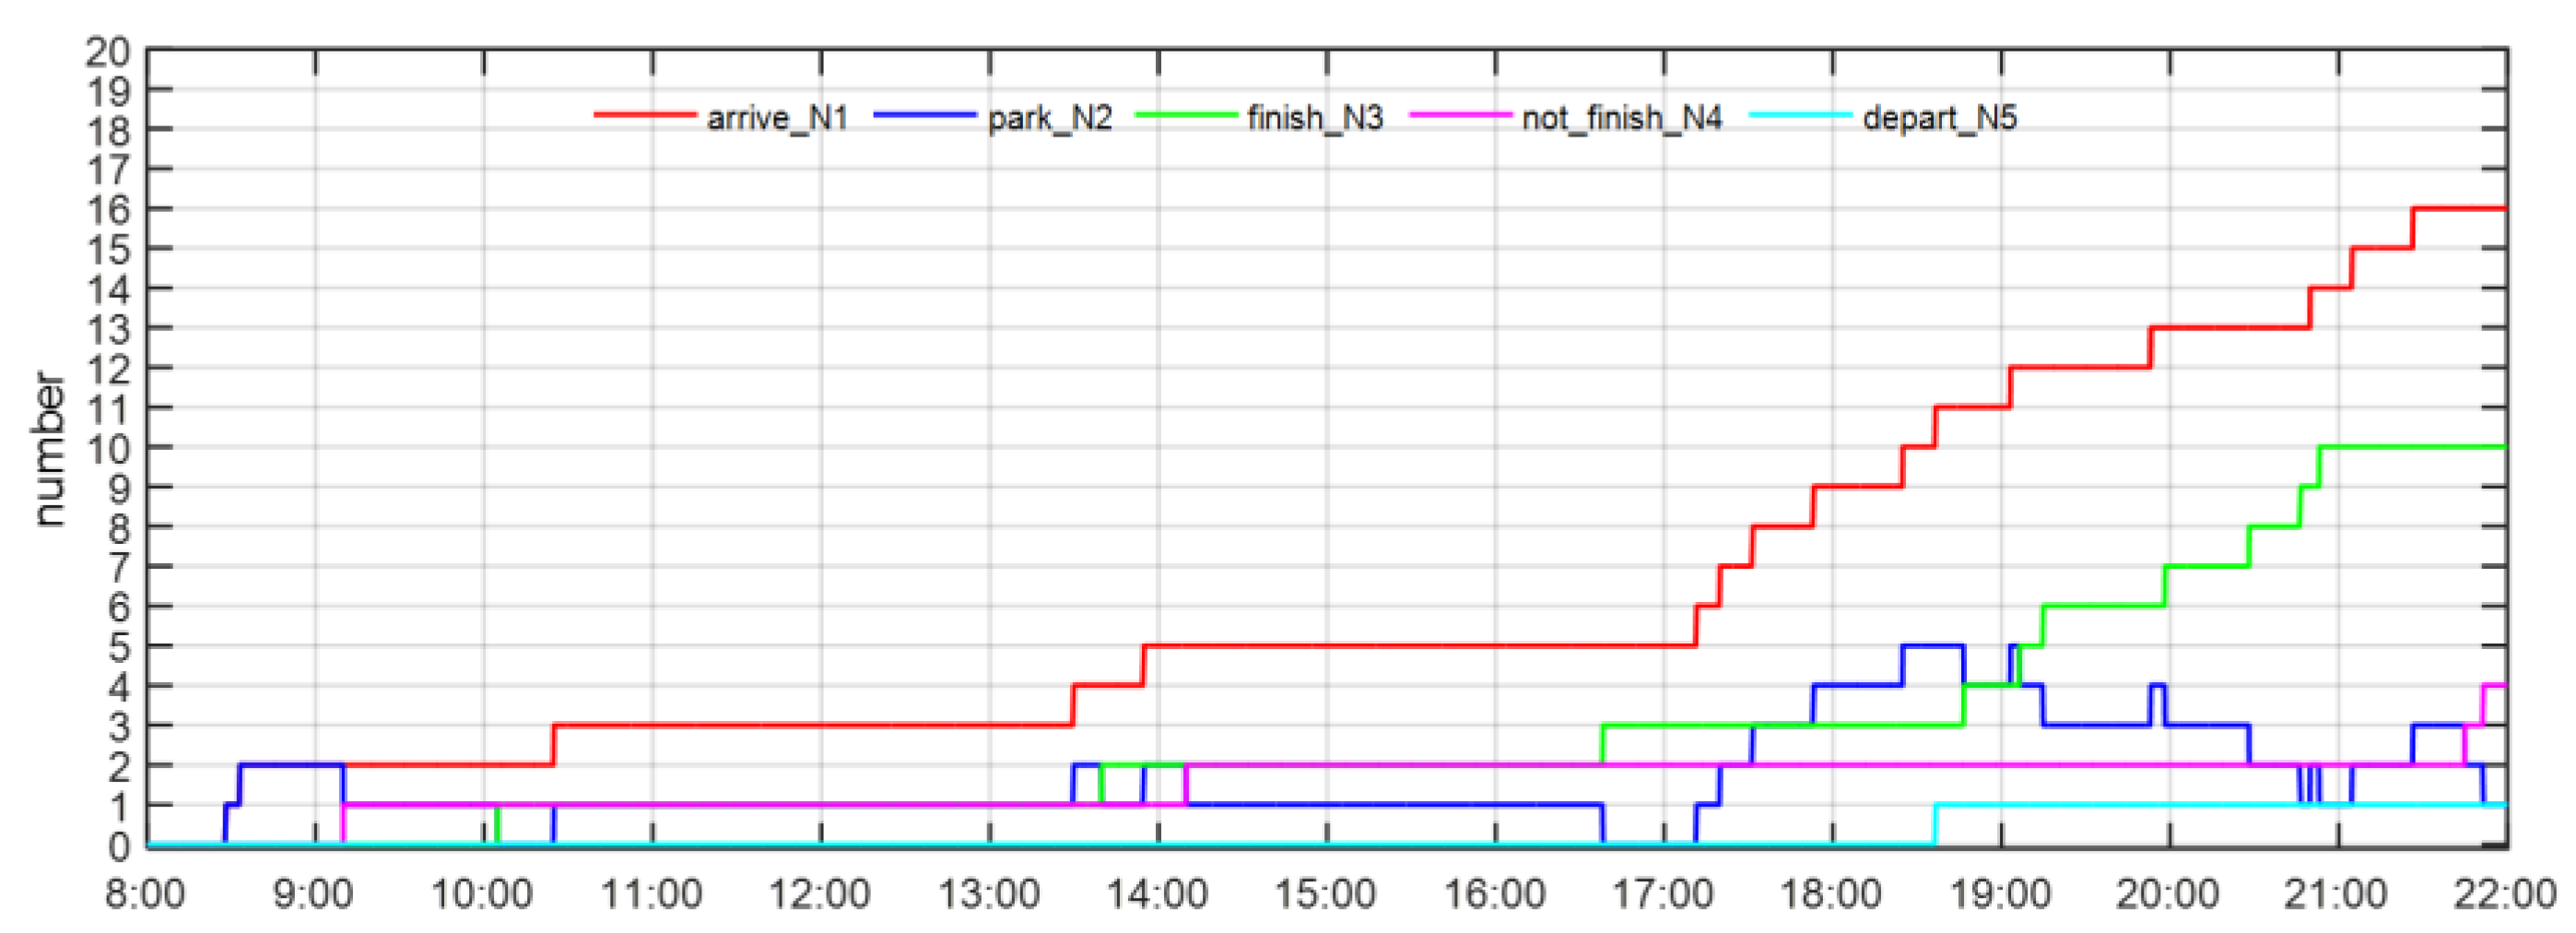
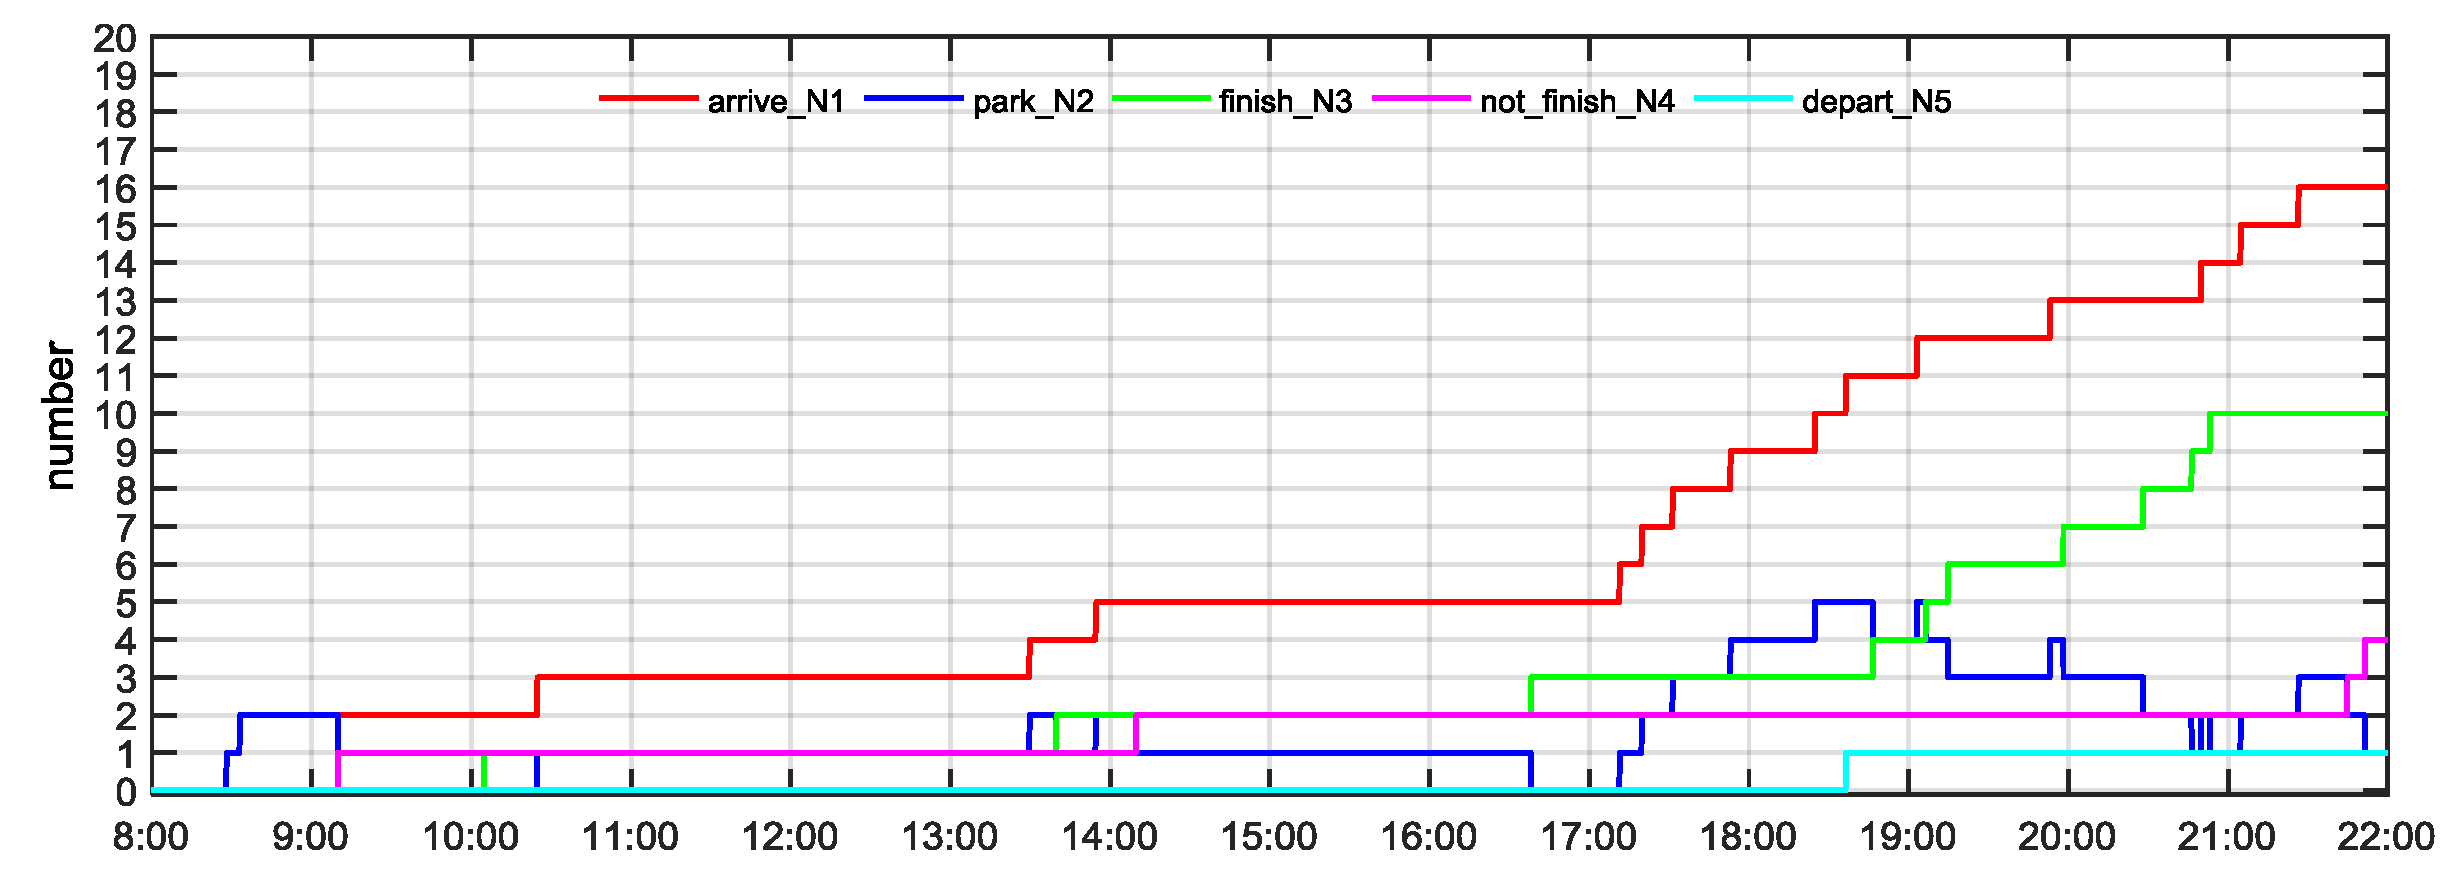
The recording of EV charging under ICDA is shown in
Figure 20.
The ratings arrive_N1, park_N2, finish_N3, not_finish_N4, and depart_N5 are, respectively, the number of EVs arrived at the charging station, the number of EVs parking at the charging station, the number of EVs that have completed operations, the number that has not completed operations, and the number of EVs leaving directly. The rating
arrive_N1 is expressed by Equation (4):
4.3. Simulation Results under SPVA
The second simulation works under SPVA and the EV cannot be charged/discharged until the estimated optimal start operating time of EVs is given by searching the “peak” periods and “valley” periods of the public grid; represents the optimal start operating time, and represents the estimated latest operating time.
As shown in
Figure 21, the steady DC bus voltage is 400 V within the simulation period, which proves that the power management strategy works well to balance the powers under SPVA.
Figure 22 shows the storage
and distribution coefficient
under SPVA. The evolutions of the state of charge
and distribution coefficient
show the feasibility of SPVA and respect the power flow given in
Figure 2.
Storage current evolution under SPVA is shown in
Figure 23. As already mentioned, the absolute value of the storage current is limited to 115 A, and the simulation result shows that the current is successfully limited.
The power flow of DC microgrid under SPVA is shown in
Figure 24. The grid power is within the imposed power limits during the simulation period, respecting the power flow given in
Figure 2. Setting different power limits of the public grid in the “valley” period and the “peak” period provides a guarantee for the stability of the public grid.
Figure 25 shows the parking periods of EVs. In order to compare the two algorithms, all the information about EVs in case one and case two are the same.
The theoretical optimal start operating time and latest start operating time of EVs are shown in
Table 4, which can be calculated by the EV charging station based on
,
,
,
, charging modes, and discharge power.
The power evolutions under SPVA are shown in
Figure 26. Compared with
Figure 13, the 4th and the10th EVs are farther away from the “peak” periods of the public grid, while the 12th EV directly avoids the “peak” periods of the public grid, thereby preventing the public grid from overloading, meanwhile reducing charging costs, which proves the effectiveness and superiority of SPVA.
Figure 27 shows the
evolutions under SPVA.
The operating time of EVs connected to charger 1 is shown in
Figure 28. Compared with
Figure 15, due to SPVA, the 12th EV did not choose to be charged immediately after arrival but waited for the optimal start operating time, which saved the user’s charging costs and avoided adding peak loads to the public grid.
The operating time of EVs connected to charger 2 is shown in
Figure 29. Compared with
Figure 16, due to SPVA, the 4th EV did not choose to be charged immediately after arrival but waited for the optimal start operating time.
The operating time of EVs connected to charger 3 is shown in
Figure 30, and the 8th and the 16th EVs have the same operation results as
Figure 17.
The operating time of EVs connected to charger 4 is shown in
Figure 31. The operating time of EVs connected to charger 5 is shown in
Figure 32 and the 9th EV has the same operation result as
Figure 18. Compared with
Figure 19, due to SPVA, the 10th EV did not choose to be charged immediately after arrival but waited for the optimal start operating time.
The recording of EV charging under SPVA is shown in
Figure 33, which respects Equation (4).
4.4. Comparison and Analysis of the Two Simulation Cases
The simulation results of ICDA and SPVA are shown in
Table 5, where
represents the completion degree of EVs, calculated by Equation (5):
The parameter represents the when EVs leave the charging station. and are the completion degree of EVs under ICDA and SPVA, respectively.
Under the two algorithms, the completion degree of EVs is the same under ICDA and SPVA, as shown in
Table 5 and
Table 6.
There are 11 EVs with a completion degree of 100%, while the 1st, 11th, 14th, and 16th EV have a completion degree of 0%, among which, the 11th EV directly left after arriving at the charging station because the charging station could not meet the user need. The 5th EV has a completion degree of 81.65%, and the 15th EV with a completion degree of 38.33%.
The comparison between the two algorithms highlights that the energy cost of public grid under ICDA is higher than that under SPVA. Thus, the power management strategy can run well under SPVA, ease the pressure on the public grid at the “peak” periods, and reduce the energy cost of the public grid.
5. Conclusions
This paper presents a power management strategy with integrated V2G to reduce the peak pressure of the public grid while meeting the needs of users. In the strategy, PV sources, battery storage, and the public grid are used to charge EVs in sequence; at the “peak” periods of the public grid, PV sources and EVs are discharged to the public grid one after another to play the role of V2G. The SPVA is proposed to judge the optimal charging/discharging start time of EVs, through its arrival time, departure time, , and , to achieve peak shaving and valley filling while reducing the cost of the public grid. In addition, in order to better maintain the stability of the public grid, the “peak” periods and “valley” periods of the public grid correspond to different power limits. Simulation results show that the charging station, based on a DC microgrid, can operate well considering the EV charging/discharging behaviors; the proposed SPVA is highly effective in reducing the cost of the public grid by calculating the optimal start operating time of EVs, while ensuring the stability of the public grid. The limitation of SPVA is that it does not consider the operating cost of the EV charging station. In the future, we can take into account the power prediction and load prediction through global optimization to minimize the operating cost of the EV charging station.
With the popularity of EVs, there will be certain rules for EVs arriving at the charging station every day, thus, the EV prediction system will be designed which can predict the current situation of EVs based on the EV data of the past few days. In addition, PV data can be predicted based on the weather forecast. With these two predictions, EV charging stations will have predictions about the usage of the public grid and batteries, which can better control the system and improve the stability of the system, laying a solid foundation for the production of fully intelligent EV charging stations in the future.


