
Re-Enrichment Learning: Metadata Saliency for the Evolutive Personalization of a Recommender System


Abstract
:1. Introduction
2. Background
3. Re-Enrichment Learning
3.1. Graph-Based Domain Transfer
3.2. Metadata Saliency
3.3. Summary
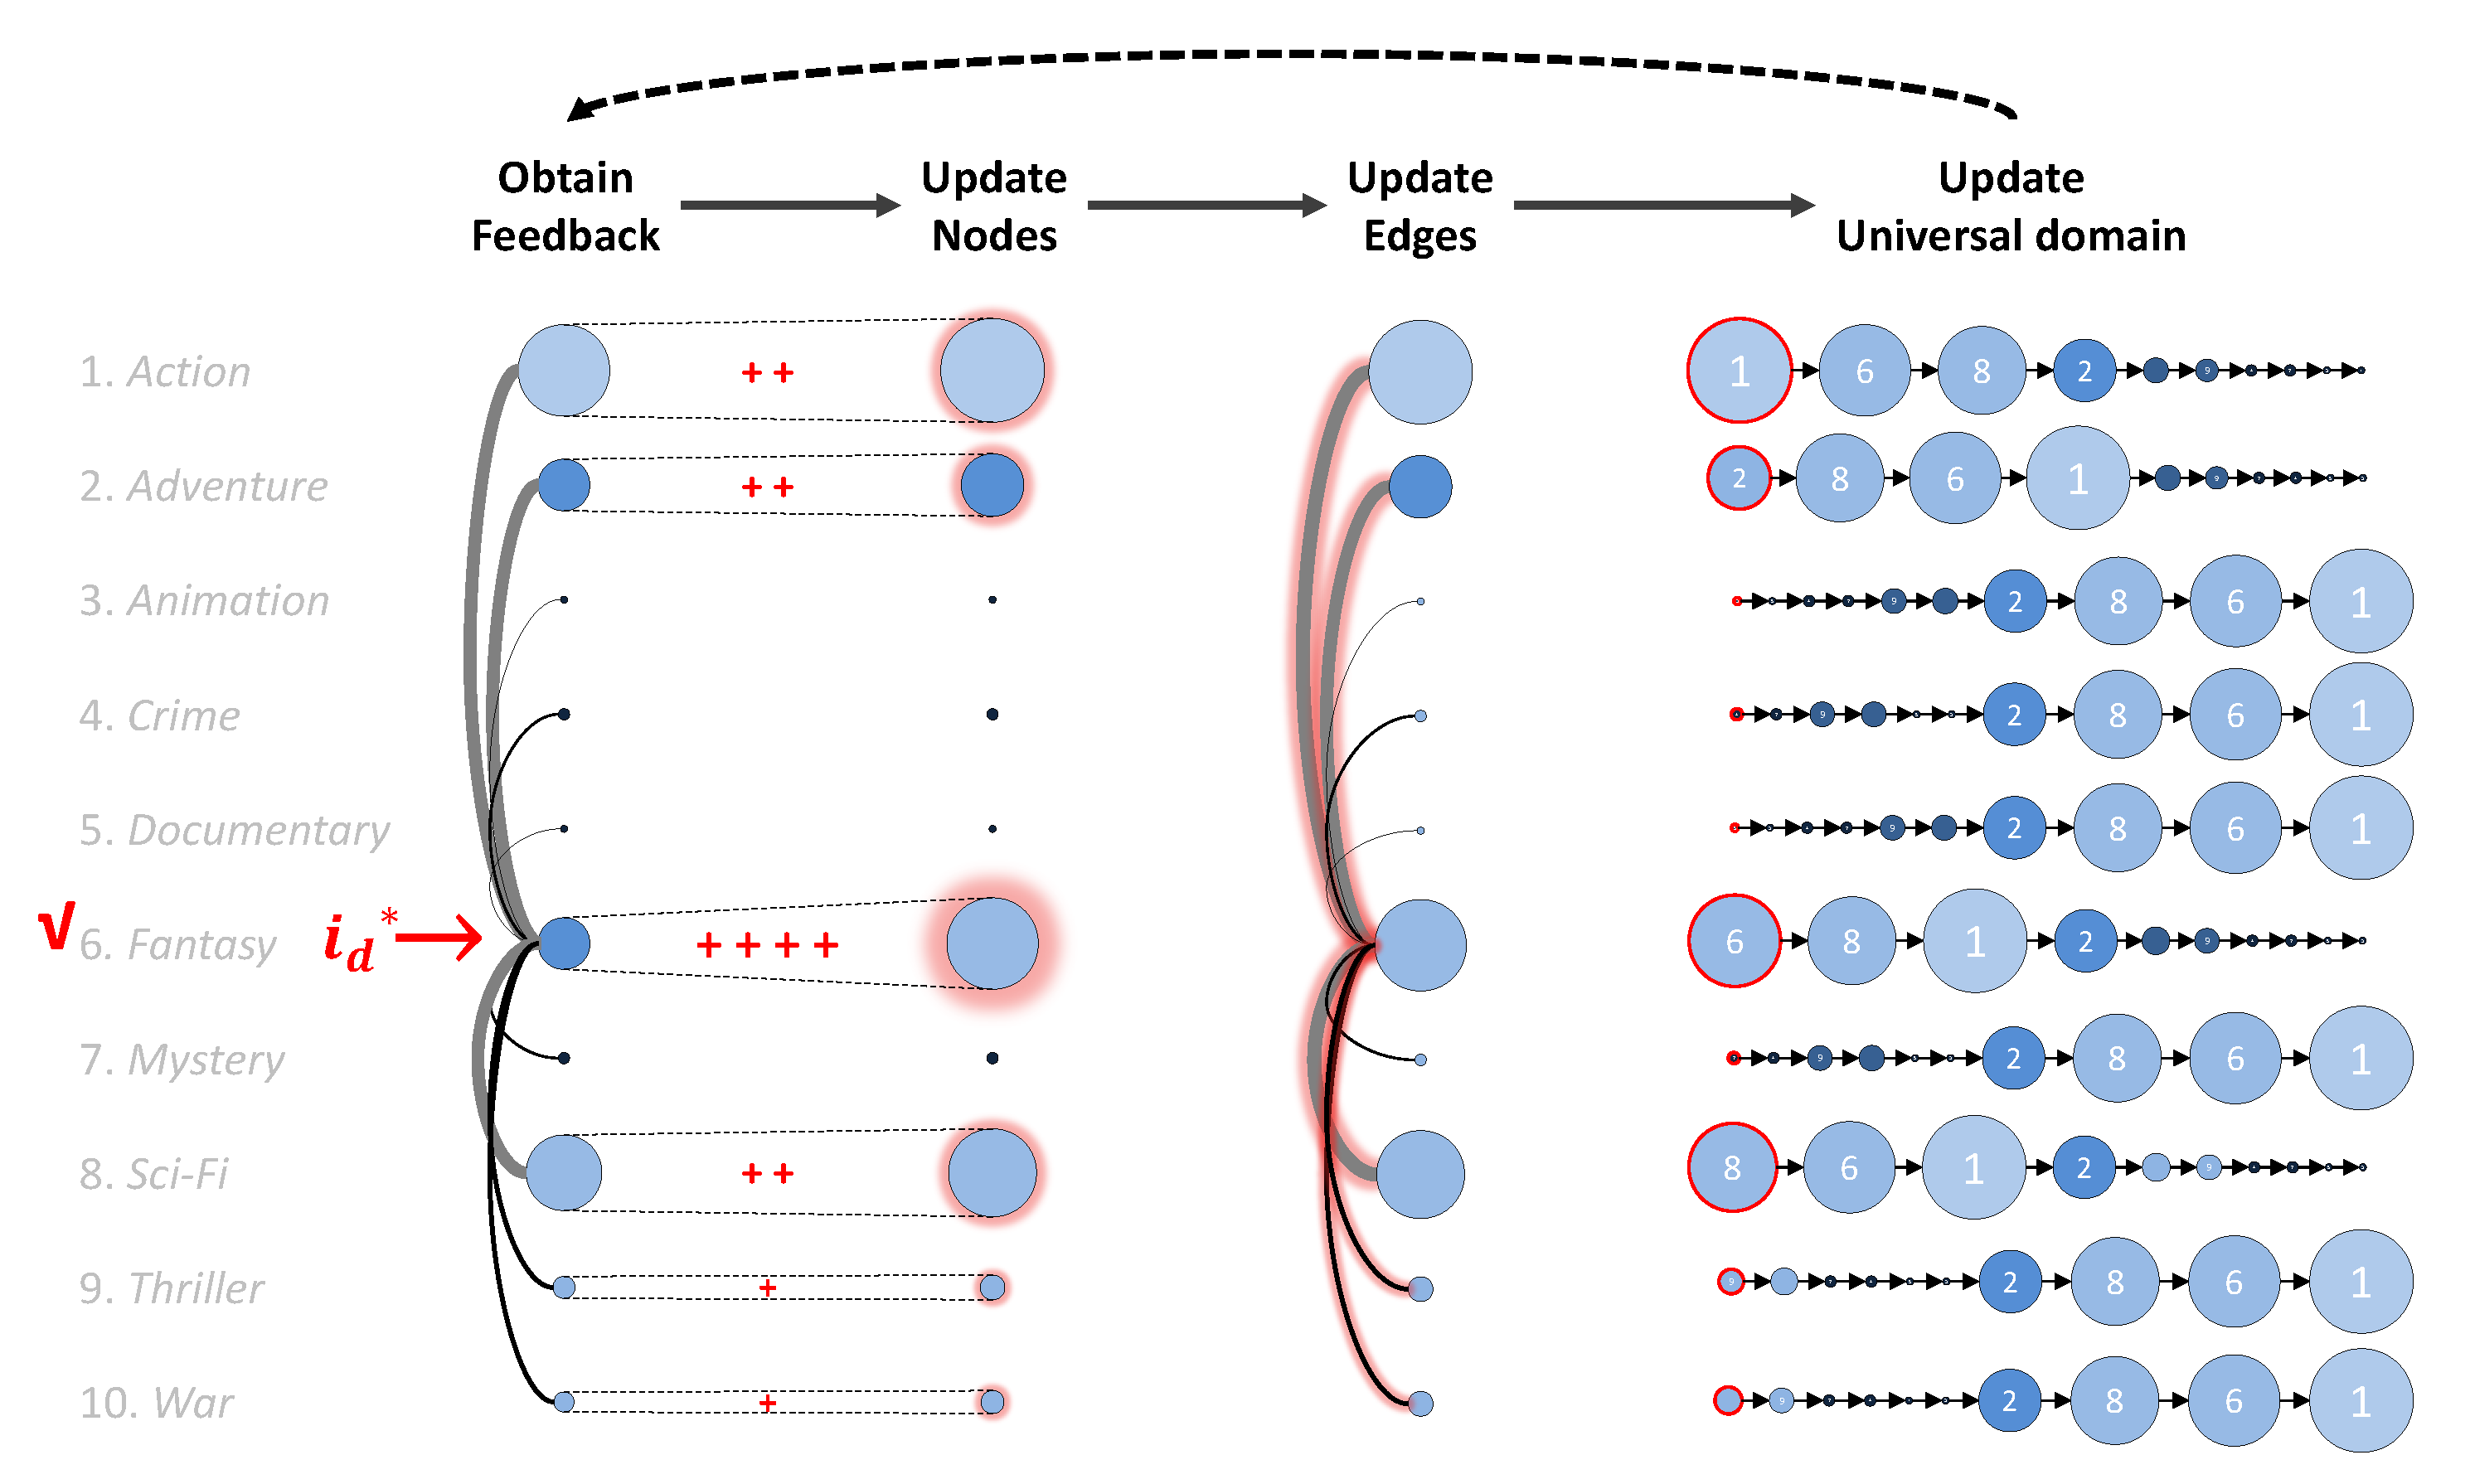
- Step 1: Obtain the user’s implicit logged feedback at time t from the recommender.
- Step 2: Update nodes →: Calculate node attribute at time t using the universal domain and the node attribute at time (as shown in Equation (10)).
- Step 3: Update edges →: Calculate the edge attribute at time t using the node attribute at time t (as in Equation (4), which consists of the two following terms).
- Step 4: Update the universal domain → (as in Equation (9)): Sort domain by edge attribute.
- Step 5: Apply the node attribute at time t, i.e., the metadata saliency, to the recommender.
4. Experiment and Discussion
4.1. Experimental Setup
4.1.1. Dataset
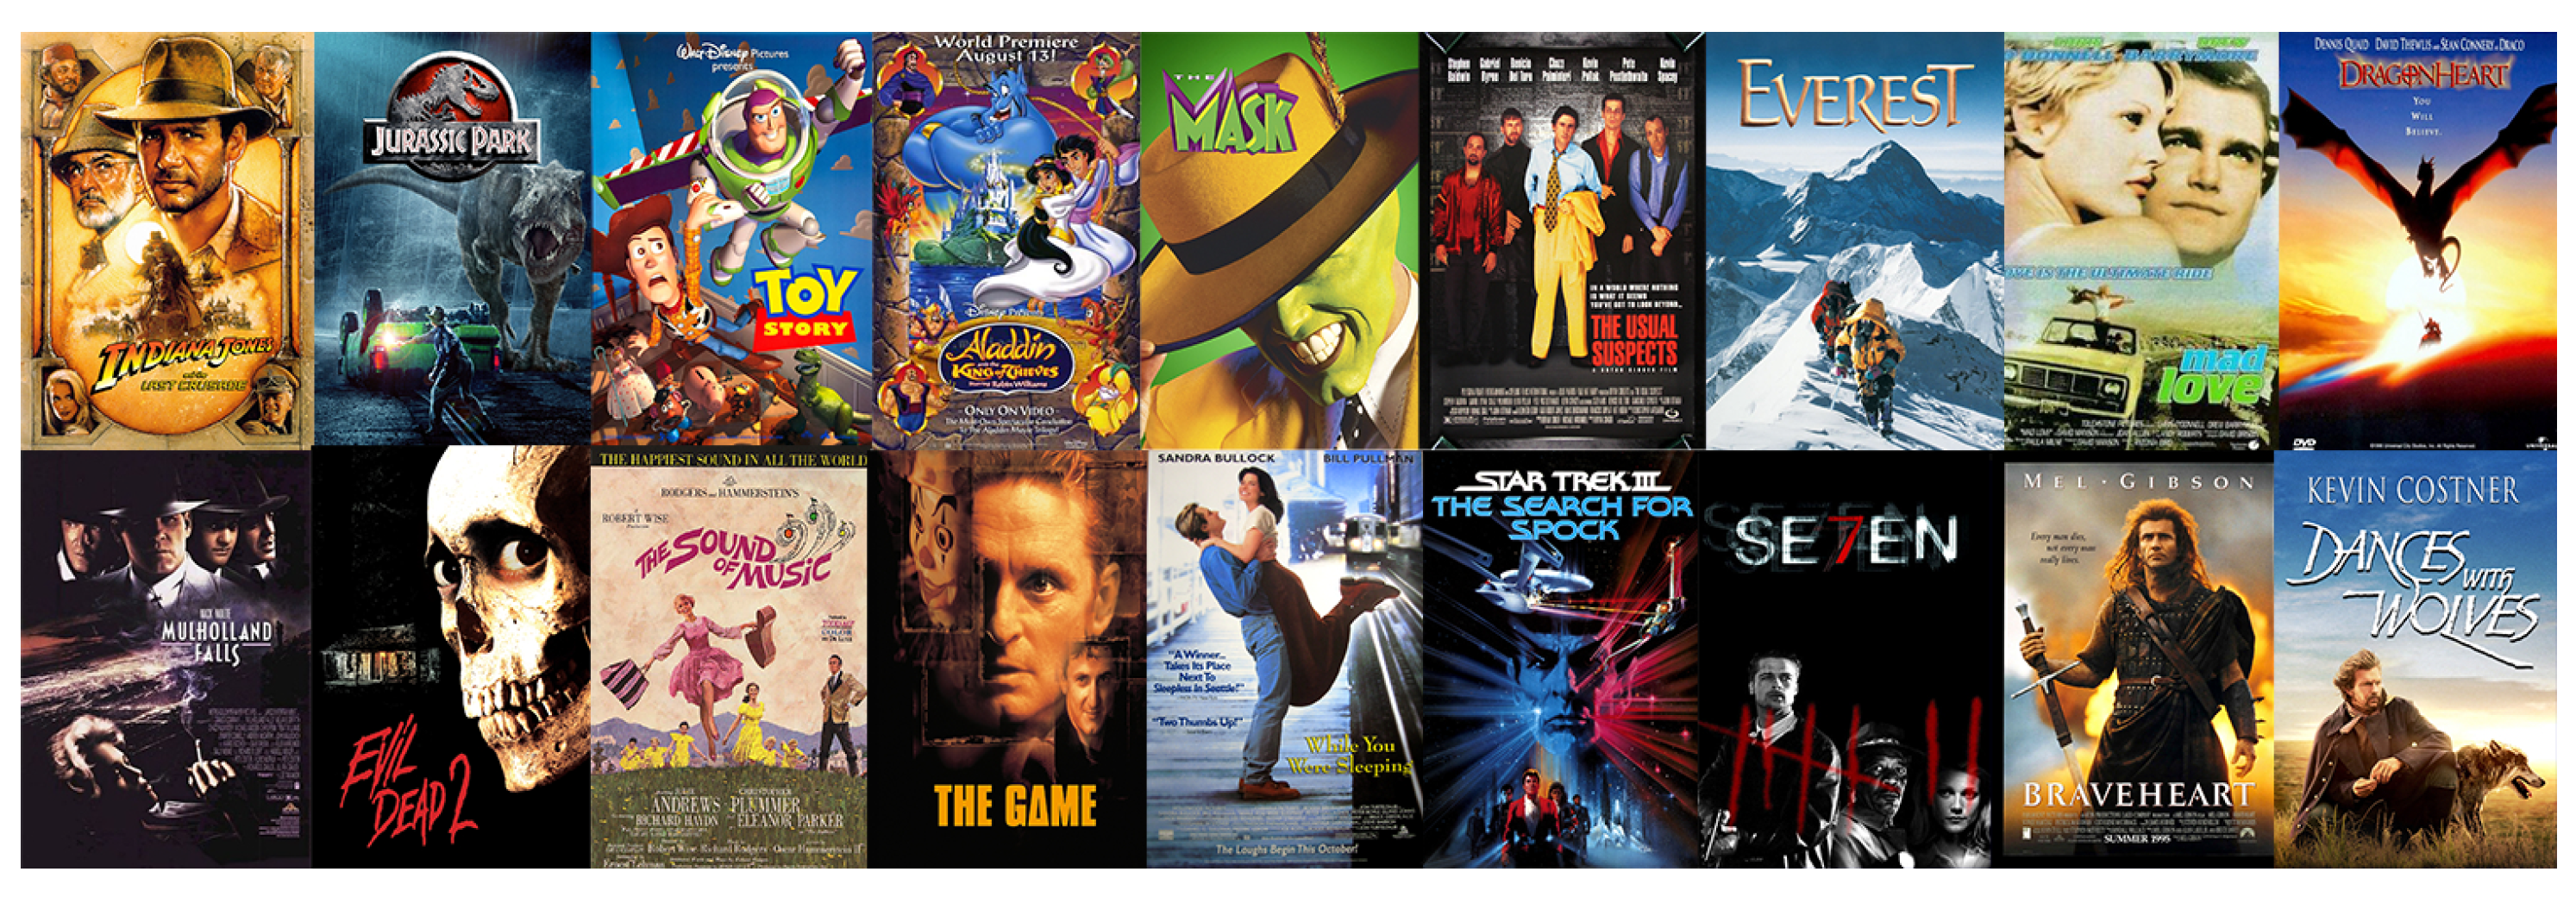
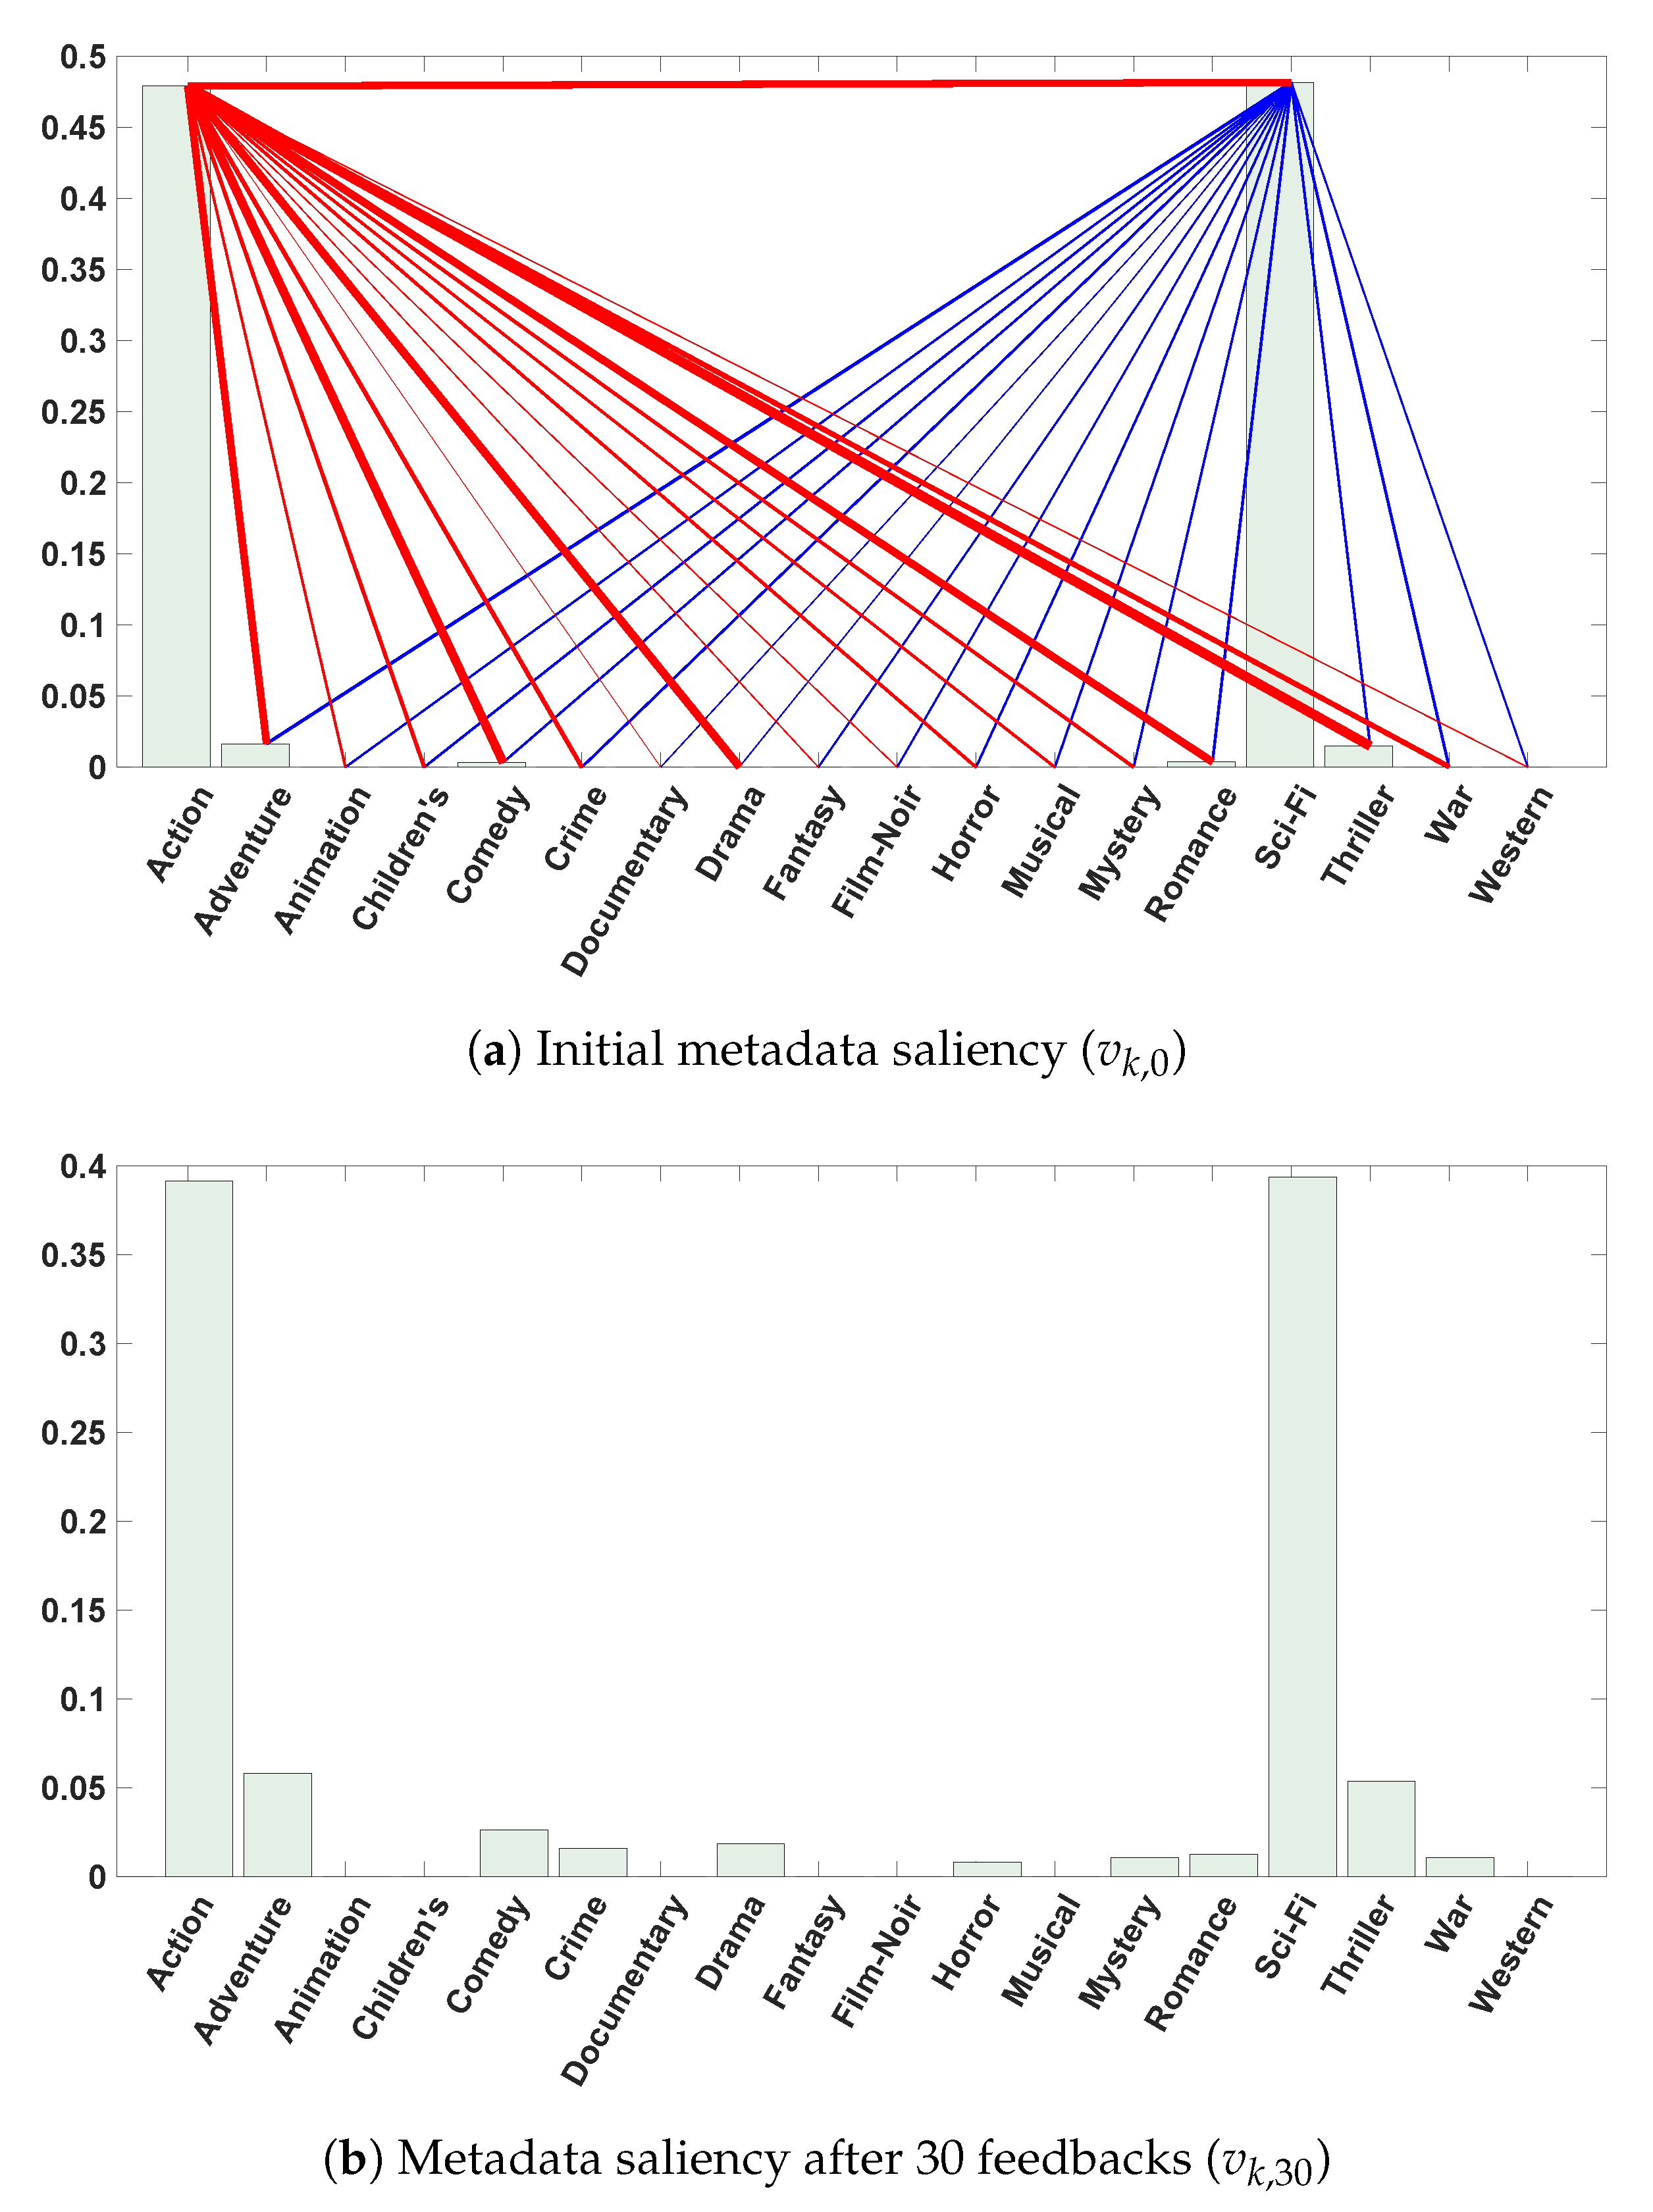
- MovieLens dataset [43]: The MovieLens () dataset was collected by the GroupLens Research Project at the University of Minnesota (see Figure 4). It consists of 100,000 ratings, which range from 1 to 5, obtained from 943 users on 1682 movies as items. The data were acquired through the MovieLens website during the seven-month collection period. The dataset was cleaned up by excluding users who wrote less than 20 ratings. A movie can belong to more than one genre; there are 18 genres, defined as: (i) Action, (ii) Adventure, (iii) Animation, (iv) Children’s, (v) Comedy, (vi) Crime, (vii) Documentary, (viii) Drama, (ix) Fantasy, (x) Film-Noir, (xi) Horror, (xii) Musical, (xiii) Mystery, (xiv) Romance, (xv) Sci-Fi, (xvi) Thriller, (xvii) War, and (xviii) Western.
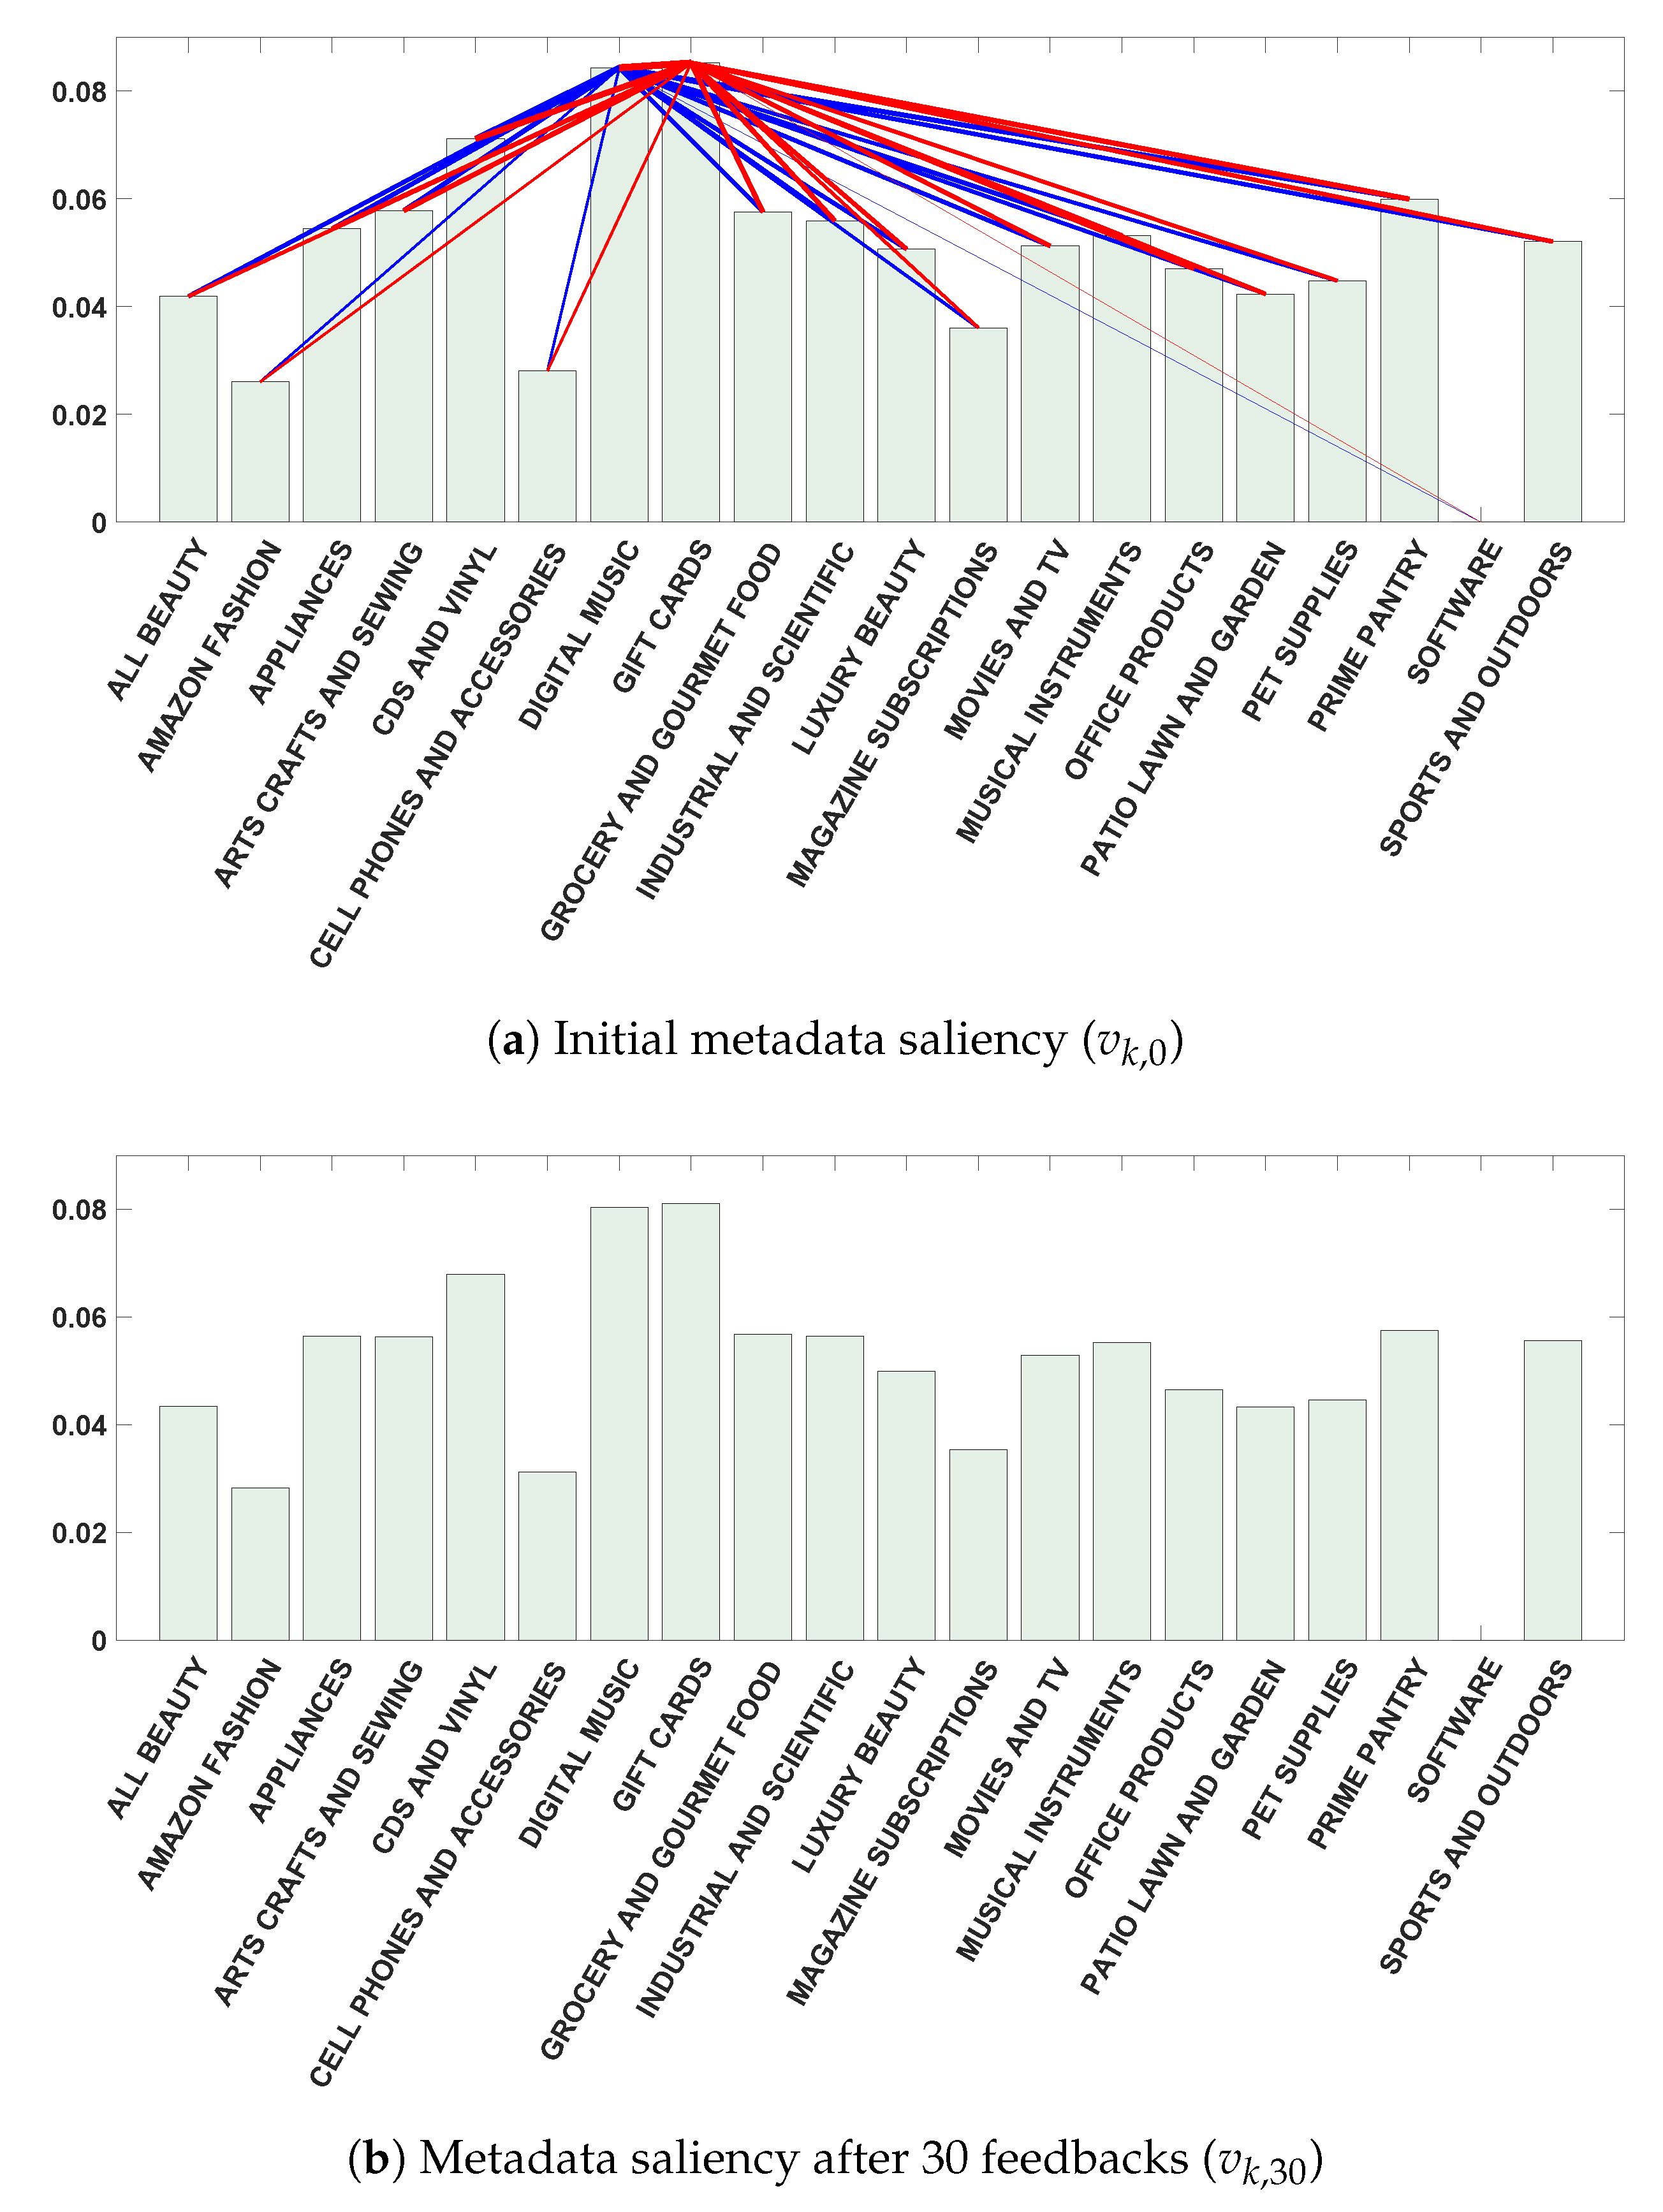
- Amazon dataset [44,45]: The Amazon review dataset contains the reviews of items and their metadata collected from the Amazon platform (see Figure 5). The dataset sampled for the experiment included around 70 million ratings of 745,018 products, ranging from 1 to 5. In the experiment, 20 categories were included: (i) Beauty, (ii) Fashion, (iii) Appliances, (iv) Arts, crafts, and sewing, (v) CDs and vinyl, (vi) Cell phones and accessories, (vii) Digital music, (viii) Gift cards, (ix) Grocery and gourmet food, (x) Industrial and scientific, (xi) Luxury beauty, (xii) Magazine subscriptions, (xiii) Movies and TV, (xiv) Musical instruments, (xv) Office products, (xvi) Patio, lawn, and garden, (xvii) Pet supplies, (xviii) Prime pantry, (xix) Software, and (xx) Sports and outdoors.
4.1.2. Evaluation
4.1.3. Configuration
4.2. Results and Discussion
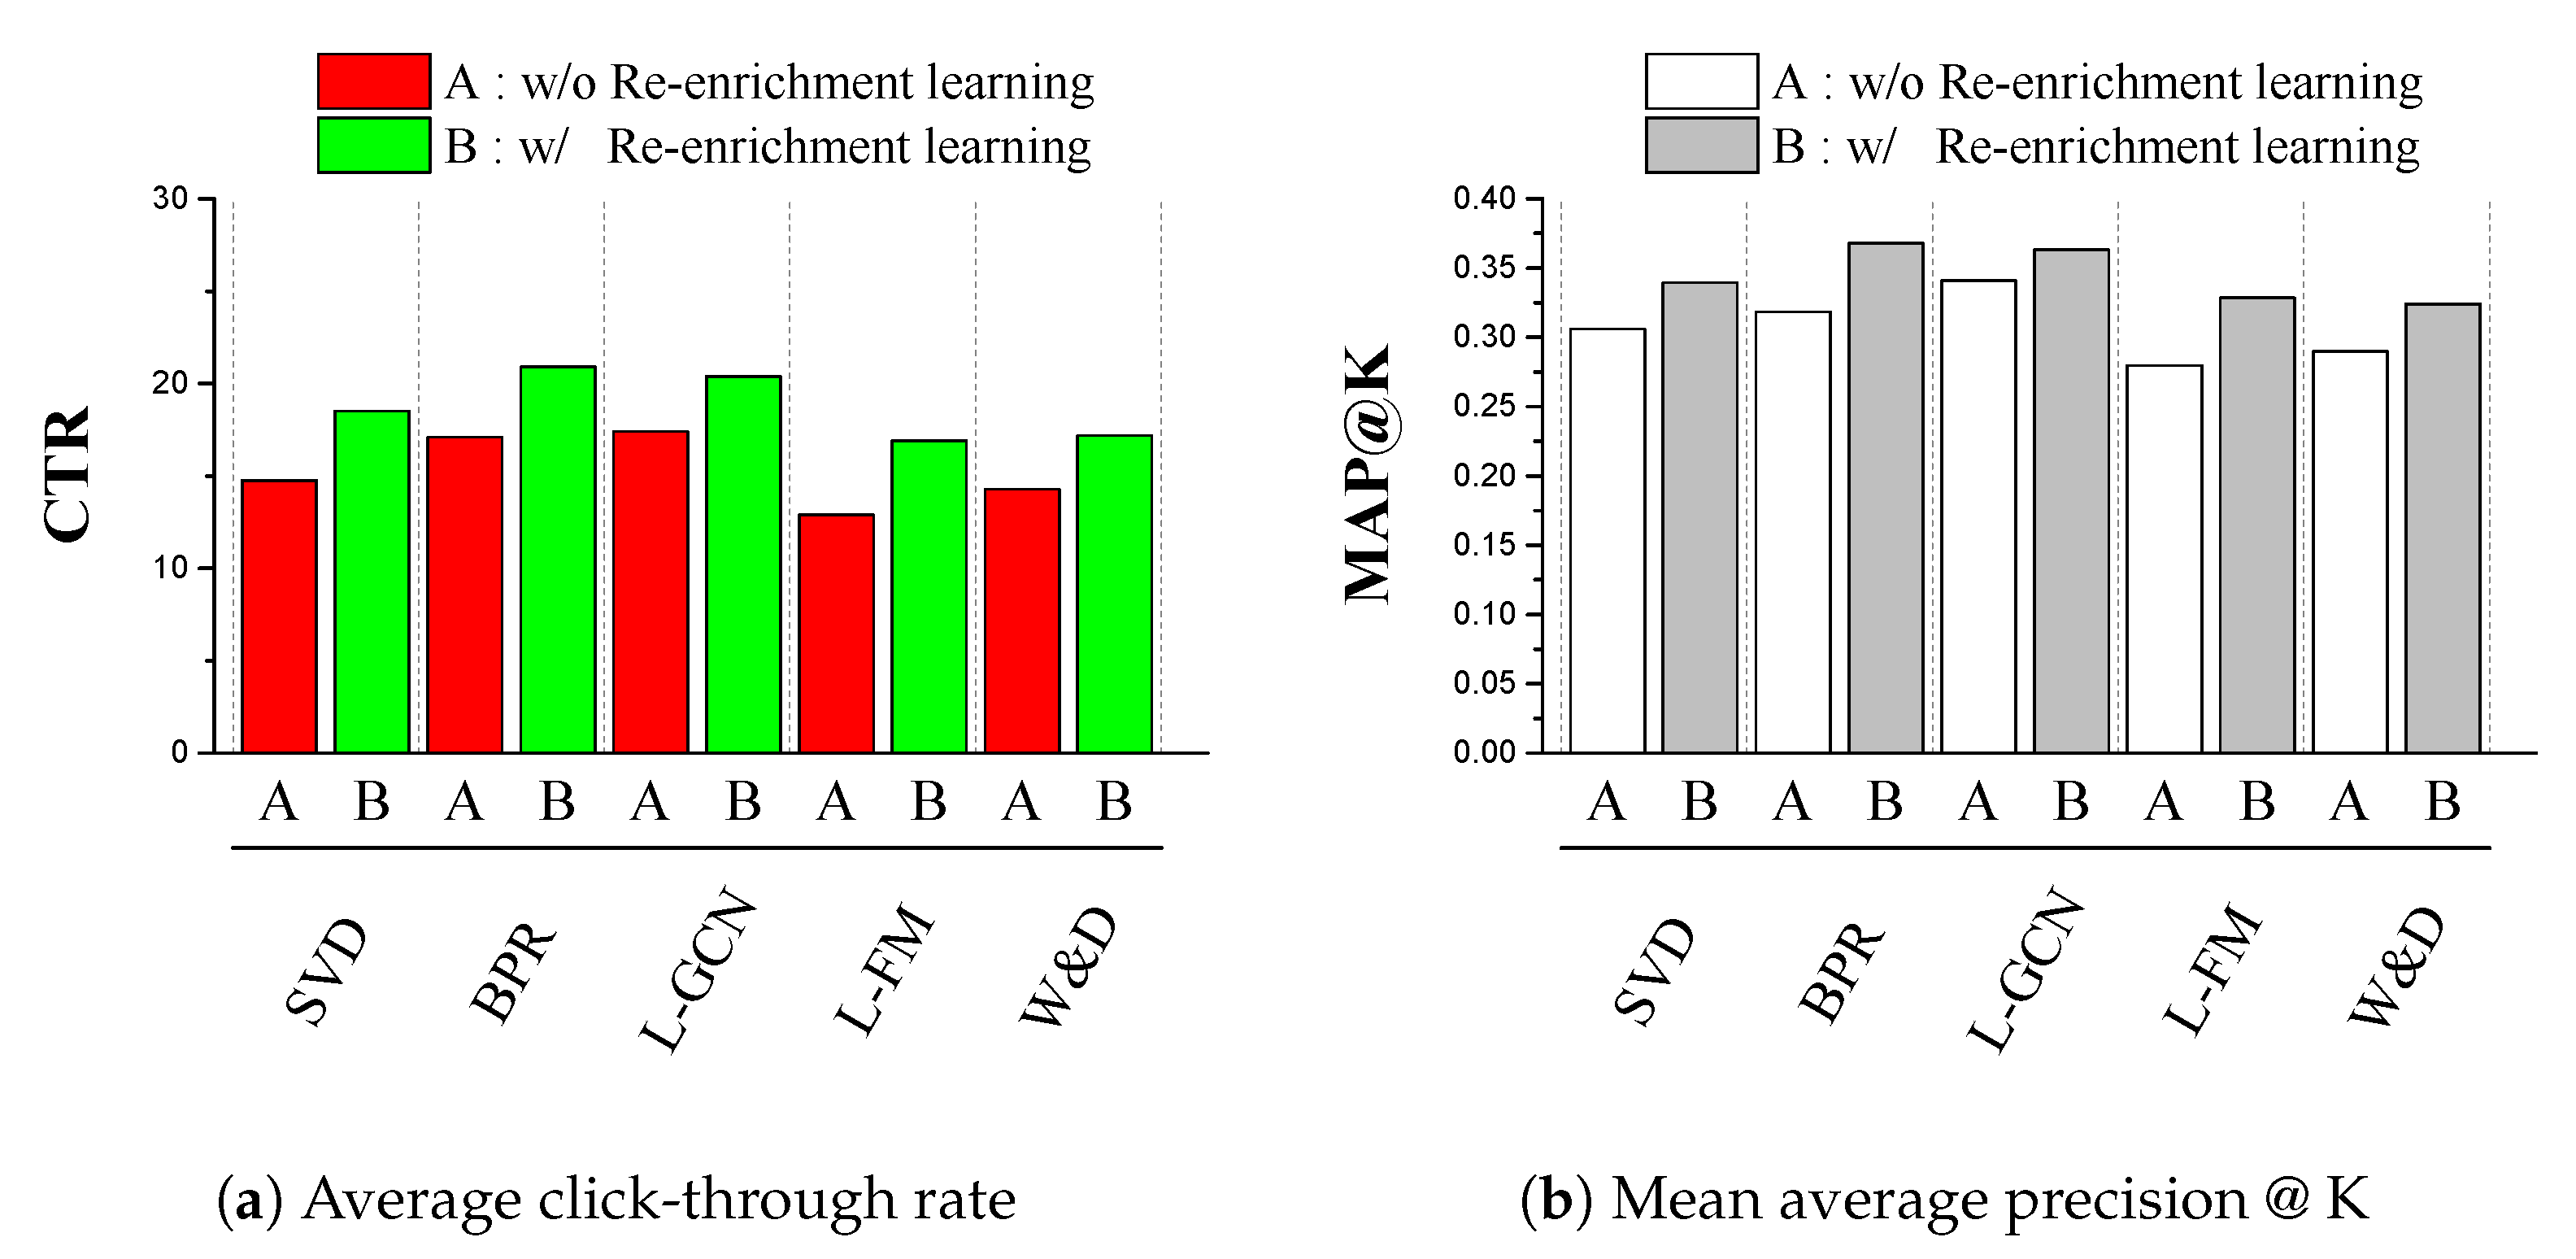
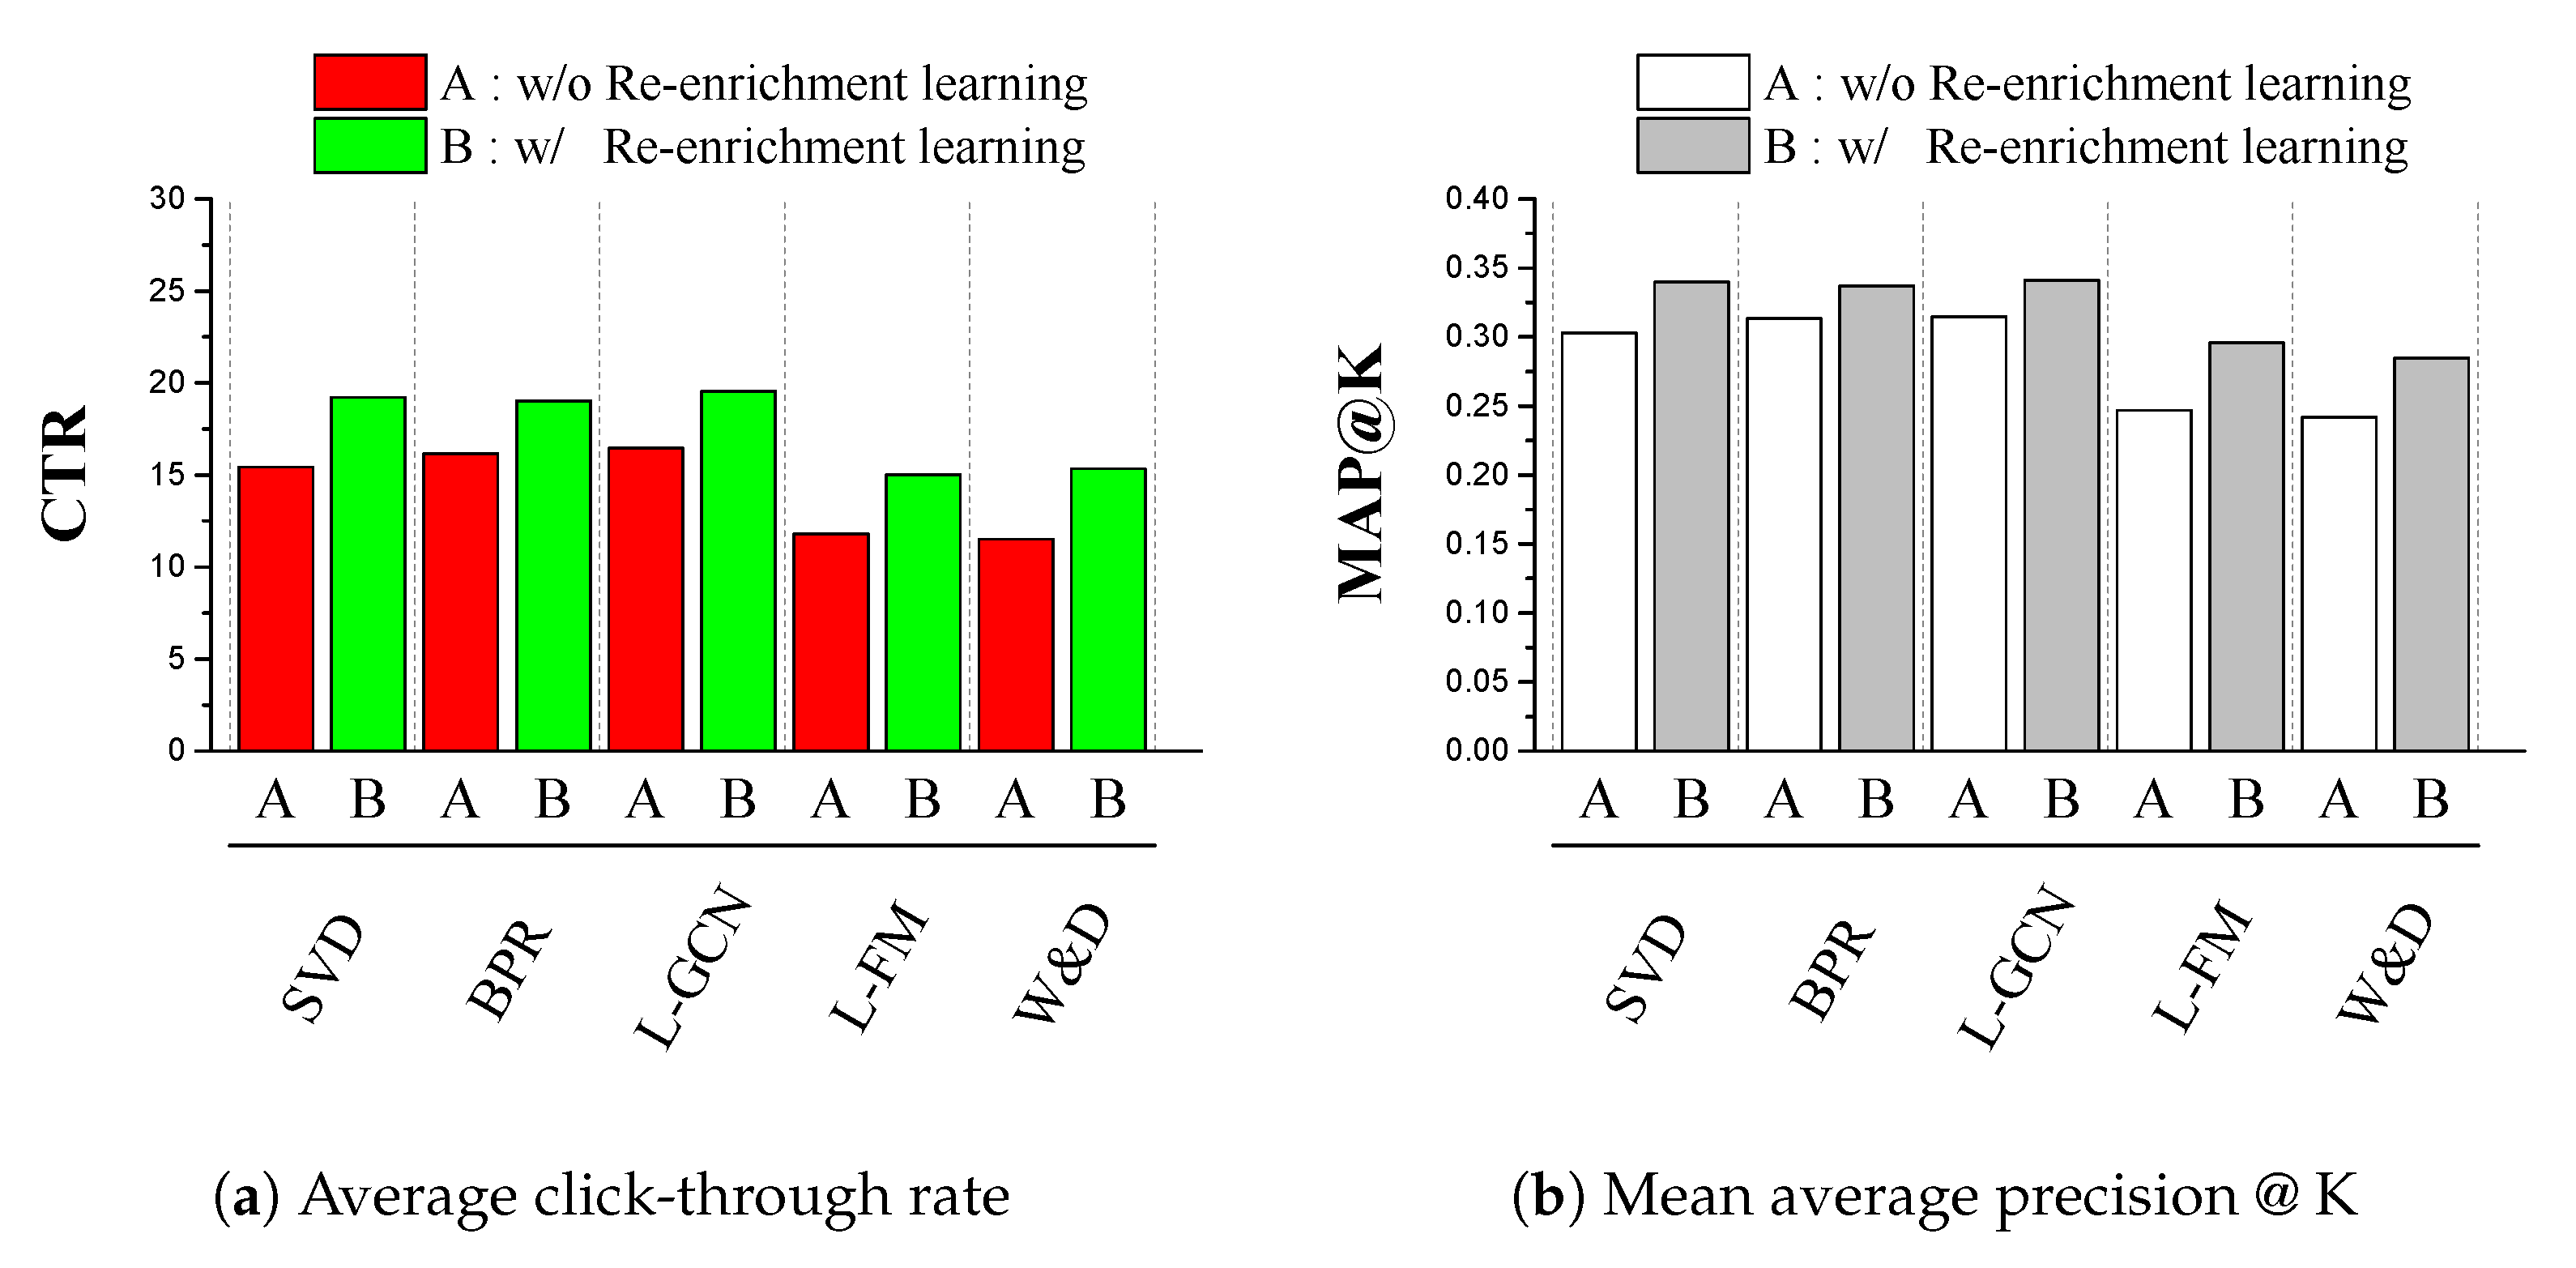
4.2.1. Recommending Movies
4.2.2. Recommending Goods
5. Conclusions
Author Contributions
Funding
Conflicts of Interest
Abbreviations
| SVD | Singular value decomposition |
| BPR | Bayesian personalized ranking |
| GCN | Graph convolution network |
| DKN | Deep knowledge-aware network |
| NPA | Neural news recommendation with personalized attention |
| CDT | Context dimension tree |
| L-FM | Light factorization machines |
| W&D | Wide and deep |
| CTR | Click-through rate |
References
- Davidson, J.; Liebald, B.; Liu, J.; Nandy, P.; Van Vleet, T.; Gargi, U.; Gupta, S.; He, Y.; Lambert, M.; Livingston, B.; et al. The YouTube video recommendation system. In Proceedings of the Fourth ACM Conference on Recommender Systems, Barcelona, Spain, 26–30 September 2010; pp. 293–296. [Google Scholar]
- Amatriain, X.; Basilico, J. Netflix recommendations: Beyond the 5 stars (part 1). Netflix Tech. Blog. 2012, 6. [Google Scholar]
- MacKenzie, I.; Meyer, C.; Noble, S. How Retailers Can Keep up with Consumers; McKinsey & Company: New York, NY, USA, 2013; Volume 18. [Google Scholar]
- Jagerman, R.; Markov, I.; de Rijke, M. When people change their mind: Off-policy evaluation in non-stationary recommendation environments. In Proceedings of the Twelfth ACM International Conference on Web Search and Data Mining, Melbourne, Australia, 11–15 February 2019; pp. 447–455. [Google Scholar]
- Gomez-Uribe, C.A.; Hunt, N. The netflix recommender system: Algorithms, business value, and innovation. ACM Trans. Manag. Inf. Syst. (TMIS) 2015, 6, 1–19. [Google Scholar] [CrossRef] [Green Version]
- Jannach, D.; Jugovac, M. Measuring the business value of recommender systems. ACM Trans. Manag. Inf. Syst. (TMIS) 2019, 10, 1–23. [Google Scholar] [CrossRef] [Green Version]
- Rabiu, I.; Salim, N.; Da’u, A.; Osman, A. Recommender System Based on Temporal Models: A Systematic Review. Appl. Sci. 2020, 10, 2204. [Google Scholar] [CrossRef] [Green Version]
- Zehlike, M.; Bonchi, F.; Castillo, C.; Hajian, S.; Megahed, M.; Baeza-Yates, R. Fa* ir: A fair top-k ranking algorithm. In Proceedings of the 2017 ACM on Conference on Information and Knowledge Management, Singapore, 6–10 November 2017; pp. 1569–1578. [Google Scholar]
- Kleinberg, J.; Raghavan, M. Selection problems in the presence of implicit bias. arXiv 2018, arXiv:1801.03533. [Google Scholar]
- Mehrotra, R.; McInerney, J.; Bouchard, H.; Lalmas, M.; Diaz, F. Towards a fair marketplace: Counterfactual evaluation of the trade-off between relevance, fairness & satisfaction in recommendation systems. In Proceedings of the 27th ACM International Conference on Information and Knowledge Management, Torino, Italy, 22–26 October 2018; pp. 2243–2251. [Google Scholar]
- Stoyanovich, J.; Yang, K.; Jagadish, H. Online set selection with fairness and diversity constraints. In Proceedings of the EDBT Conference, Vienna, Austria, 26–29 March 2018; pp. 241–252. [Google Scholar]
- Zuiderveen Borgesius, F.; Trilling, D.; Möller, J.; Bodó, B.; De Vreese, C.H.; Helberger, N. Should we worry about filter bubbles? Internet Policy Rev. J. Internet Regul. 2016, 5, 1–16. [Google Scholar] [CrossRef] [Green Version]
- Steck, H. Calibrated recommendations. In Proceedings of the 12th ACM Conference on Recommender Systems, Vancouver, BC, Canada, 2–7 October 2018; pp. 154–162. [Google Scholar]
- Jannach, D.; Lerche, L.; Kamehkhosh, I.; Jugovac, M. What recommenders recommend: An analysis of recommendation biases and possible countermeasures. User Model. User Adapt. Interact. 2015, 25, 427–491. [Google Scholar] [CrossRef]
- Lee, D.; Hosanagar, K. How do recommender systems affect sales diversity? A cross-category investigation via randomized field experiment. Inf. Syst. Res. 2019, 30, 239–259. [Google Scholar] [CrossRef] [Green Version]
- Shah, K.; Salunke, A.; Dongare, S.; Antala, K. Recommender systems: An overview of different approaches to recommendations. In Proceedings of the 2017 International Conference on Innovations in Information, Embedded and Communication Systems (ICIIECS), Coimbatore, India, 17–18 March 2017; pp. 1–4. [Google Scholar]
- Patel, B.; Desai, P.; Panchal, U. Methods of recommender system: A review. In Proceedings of the 2017 International Conference on Innovations in Information, Embedded and Communication Systems (ICIIECS), Coimbatore, India, 17–18 March 2017; pp. 1–4. [Google Scholar]
- Hu, Y.; Koren, Y.; Volinsky, C. Collaborative filtering for implicit feedback datasets. In Proceedings of the 2008 Eighth IEEE International Conference on Data Mining, Pisa, Italy, 15–19 December 2008; pp. 263–272. [Google Scholar]
- Chen, M.; Beutel, A.; Covington, P.; Jain, S.; Belletti, F.; Chi, E.H. Top-k off-policy correction for a REINFORCE recommender system. In Proceedings of the Twelfth ACM International Conference on Web Search and Data Mining, Melbourne, Australia, 11–15 February 2019; pp. 456–464. [Google Scholar]
- Gu, Y.; Chang, J.; Zhang, Y.; Wang, Y. An element sensitive saliency model with position prior learning for web pages. In Proceedings of the 2019 3rd International Conference on Innovation in Artificial Intelligence, Suzhou, China, 15–18 March 2019; pp. 157–161. [Google Scholar]
- Shen, C.; Huang, X.; Zhao, Q. Predicting eye fixations on webpage with an ensemble of early features and high-level representations from deep network. IEEE Trans. Multimed. 2015, 17, 2084–2093. [Google Scholar] [CrossRef]
- Gupta, P.; Gupta, S.; Jayagopal, A.; Pal, S.; Sinha, R. Saliency prediction for mobile user interfaces. In Proceedings of the 2018 IEEE Winter Conference on Applications of Computer Vision (WACV), Lake Tahoe, NV, USA, 12–15 March 2018; pp. 1529–1538. [Google Scholar]
- Li, J.; Su, L.; Wu, B.; Pang, J.; Wang, C.; Wu, Z.; Huang, Q. Webpage saliency prediction with multi-features fusion. In Proceedings of the 2016 IEEE International Conference on Image Processing (ICIP), Phoenix, AZ, USA, 25–28 September 2016; pp. 674–678. [Google Scholar]
- Jiang, M.; Huang, S.; Duan, J.; Zhao, Q. Salicon: Saliency in context. In Proceedings of the IEEE Conference on Computer Vision and Pattern Recognition, Boston, MA, USA, 7–12 June 2015; pp. 1072–1080. [Google Scholar]
- Bobadilla, J.; Ortega, F.; Hernando, A.; Gutiérrez, A. Recommender systems survey. Knowl.-Based Syst. 2013, 46, 109–132. [Google Scholar] [CrossRef]
- Koren, Y.; Bell, R.; Volinsky, C. Matrix factorization techniques for recommender systems. Computer 2009, 42, 30–37. [Google Scholar] [CrossRef]
- Rendle, S.; Freudenthaler, C.; Gantner, Z.; Schmidt-Thieme, L. BPR: Bayesian personalized ranking from implicit feedback. arXiv 2012, arXiv:1205.2618. [Google Scholar]
- He, X.; Deng, K.; Wang, X.; Li, Y.; Zhang, Y.; Wang, M. LightGCN: Simplifying and Powering Graph Convolution Network for Recommendation. arXiv 2020, arXiv:2002.02126. [Google Scholar]
- Kipf, T.N.; Welling, M. Semi-supervised classification with graph convolutional networks. arXiv 2016, arXiv:1609.02907. [Google Scholar]
- Wang, H.C.; Jhou, H.T.; Tsai, Y.S. Adapting topic map and social influence to the personalized hybrid recommender system. Inf. Sci. 2018. [Google Scholar] [CrossRef]
- Wu, C.; Wu, F.; An, M.; Huang, J.; Huang, Y.; Xie, X. NPA: Neural news recommendation with personalized attention. In Proceedings of the 25th ACM SIGKDD International Conference on Knowledge Discovery & Data Mining, Anchorage, AK, USA, 4–8 August 2019; pp. 2576–2584. [Google Scholar]
- Colace, F.; Lemma, S.; Lombardi, M.; Pascale, F. A Context Aware Approach for Promoting Tourism Events: The Case of Artist’s Lights in Salerno. ICEIS 2017, 2, 752–759. [Google Scholar]
- Casillo, M.; Colace, F.; Lemma, S.; Lombardi, M.; Pascale, F. A Tailor made System for Providing Personalized Services. In Proceedings of the Twenty-Ninth International Conference on Software Engineering and Knowledge Engineering (SEKE 2017), Pittsburgh, PA, USA, 5–7 July 2017; pp. 495–500. [Google Scholar]
- Singh, R.; Rani, A.; Chuchra, K. A Survey on the Generation of Recommender Systems. Int. J. Inf. Eng. Electron. Bus. 2017, 9, 26–35. [Google Scholar] [CrossRef] [Green Version]
- Kula, M.; Bogers, T.; Koolen, M. (Eds.) Metadata Embeddings for User and Item Cold-start Recommendations. In Proceedings of the 2nd Workshop on New Trends on Content-Based Recommender Systems co-located with 9th ACM Conference on Recommender Systems (RecSys 2015), Vienna, Austria, 16–20 September 2015; Volume 1448, pp. 14–21. [Google Scholar]
- Cheng, H.T.; Koc, L.; Harmsen, J.; Shaked, T.; Chandra, T.; Aradhye, H.; Anderson, G.; Corrado, G.; Chai, W.; Ispir, M.; et al. Wide & deep learning for recommender systems. In Proceedings of the 1st Workshop on Deep Learning for Recommender Systems, Boston, MA, USA, 15 September 2016; pp. 7–10. [Google Scholar]
- Schnabel, T.; Swaminathan, A.; Frazier, P.I.; Joachims, T. Unbiased comparative evaluation of ranking functions. In Proceedings of the 2016 ACM International Conference on the Theory of Information Retrieval, Newark, DE, USA, 12–16 September 2016; pp. 109–118. [Google Scholar]
- Bonner, S.; Vasile, F. Causal embeddings for recommendation. In Proceedings of the 12th ACM Conference on Recommender Systems, Vancouver, BC, Canada, 2–7 October 2018; pp. 104–112. [Google Scholar]
- Chaudhari, S.; Azaria, A.; Mitchell, T. An entity graph based recommender system. AI Commun. 2017, 30, 141–149. [Google Scholar] [CrossRef] [Green Version]
- Chiaselotti, G.; Ciucci, D.; Gentile, T. Simple undirected graphs as formal contexts. In International Conference on Formal Concept Analysis; Springer: Nerja, Spain, 23–26 January 2015; pp. 287–302. [Google Scholar]
- Zhao, Q.; Koch, C. Learning a saliency map using fixated locations in natural scenes. J. Vis. 2011, 11, 9. [Google Scholar] [CrossRef] [Green Version]
- Godil, A.; Wagan, A.I. Salient local 3D features for 3D shape retrieval. In Three-Dimensional Imaging, Interaction, and Measurement; International Society for Optics and Photonics: San Francisco, CA, USA, 4–27 January 2011; Volume 7864, p. 78640S. [Google Scholar]
- Harper, F.M.; Konstan, J.A. The movielens datasets: History and context. ACM Trans. Interact. Intell. Syst. (Tiis) 2015, 5, 1–19. [Google Scholar] [CrossRef]
- McAuley, J.; Targett, C.; Shi, Q.; Van Den Hengel, A. Image-based recommendations on styles and substitutes. In Proceedings of the 38th International ACM SIGIR Conference on Research and Development in Information Retrieval, Santiago, Chile, 9–13 August 2015; pp. 43–52. [Google Scholar]
- He, R.; McAuley, J. Ups and downs: Modeling the visual evolution of fashion trends with one-class collaborative filtering. In Proceedings of the 25th International Conference on World Wide Web, Montréal, QC, Canada, 11–15 April 2016; pp. 507–517. [Google Scholar]
- Haruna, K.; Akmar Ismail, M.; Suhendroyono, S.; Damiasih, D.; Pierewan, A.C.; Chiroma, H.; Herawan, T. Context-aware recommender system: A review of recent developmental process and future research direction. Appl. Sci. 2017, 7, 1211. [Google Scholar] [CrossRef] [Green Version]
- Feng, Y.; Lv, F.; Hu, B.; Sun, F.; Kuang, K.; Liu, Y.; Liu, Q.; Ou, W. MTBRN: Multiplex Target-Behavior Relation Enhanced Network for Click-Through Rate Prediction. In Proceedings of the 29th ACM International Conference on Information & Knowledge Management, Online, 19–23 October 2020; pp. 2421–2428. [Google Scholar]
- Zhang, D.; Liu, L.; Wei, Q.; Yang, Y.; Yang, P.; Liu, Q. Neighborhood Aggregation Collaborative Filtering Based on Knowledge Graph. Appl. Sci. 2020, 10, 3818. [Google Scholar] [CrossRef]
- Huang, R.; McIntyre, S.; Song, M.; Ou, Z. An Attention-Based Latent Information Extraction Network (ALIEN) for High-Order Feature Interactions. Appl. Sci. 2020, 10, 5468. [Google Scholar] [CrossRef]
- Schütze, H.; Manning, C.D.; Raghavan, P. Introduction to Information Retrieval; Cambridge University Press: Cambridge, UK, 2008; Volume 39. [Google Scholar]
- Kohavi, R.; Longbotham, R. Online Controlled Experiments and A/B Testing. Encycl. Mach. Learn. Data Min. 2017, 7, 922–929. [Google Scholar]
- Wilcoxon, F. Individual comparisons by ranking methods. In Breakthroughs in Statistics; Springer: New York, NY, USA, 1992; pp. 196–202. [Google Scholar]


| Pseudocode | ||||
|---|---|---|---|---|
| Input : Implicit logged feedback , Nodes , Edges , Universal domain | ||||
| Output : Nodes , Edges , Universal domain | ||||
| Parameter : Influence factor | ||||
| Update Nodes → | ||||
| fordo | ||||
| fordo | ||||
| Calculate Metadata saliency | ||||
| end for | ||||
| Construct Nodes | ||||
| end for | ||||
| Update Edges → | ||||
| fordo | ||||
| fordo | ||||
| fordo | ||||
| Calculate Likelihood for influence of node | ||||
| Calculate Weight for similarity between two nodes | ||||
| Calculate Edge attribute | ||||
| end for | ||||
| Construct Edges | ||||
| end for | ||||
| end for | ||||
| Update Universal domain → | ||||
| fordo | ||||
| Calculate Domain by sorting nodes w.r.t. edge attribute | ||||
| end for | ||||
| Construct Universal domain | ||||
| Method | CTR | MAP@K | ||||||
|---|---|---|---|---|---|---|---|---|
| SVD | 14.76% | 18.52% | +3.76% | ↑ 25.47% | 0.306 | 0.339 | +0.033 | ↑ 10.91% |
| BPR | 17.10% | 20.90% | +3.80% | ↑ 22.22% | 0.318 | 0.368 | +0.049 | ↑ 15.51% |
| L-GCN | 17.40% | 20.37% | +2.97% | ↑ 17.07% | 0.341 | 0.363 | +0.022 | ↑ 6.54% |
| L-FM | 12.89% | 16.91% | +4.02% | ↑ 31.19% | 0.280 | 0.329 | +0.049 | ↑ 17.56% |
| W&D | 14.28% | 17.18% | +2.90% | ↑ 20.31% | 0.290 | 0.324 | +0.034 | ↑ 11.77% |
| Method | CTR | MAP@K | ||||
|---|---|---|---|---|---|---|
| p-Value | p-Value | |||||
| SVD | 0.000001220 | < | 0.05 | 0.003038835 | < | 0.05 |
| BPR | 0.000001947 | < | 0.05 | 0.000007521 | < | 0.05 |
| L-GCN | 0.000001472 | < | 0.05 | 0.002098150 | < | 0.05 |
| L-FM | 0.000001110 | < | 0.05 | 0.000256538 | < | 0.05 |
| W&D | 0.000002135 | < | 0.05 | 0.000070817 | < | 0.05 |
| Method | CTR | MAP@K | ||||||
|---|---|---|---|---|---|---|---|---|
| SVD | 15.43% | 19.21% | +3.78% | ↑ 24.50% | 0.303 | 0.340 | +0.037 | ↑ 12.21% |
| BPR | 16.16% | 19.03% | +2.87% | ↑ 17.76% | 0.313 | 0.337 | +0.024 | ↑ 7.61% |
| L-GCN | 16.46% | 19.56% | +3.10% | ↑ 18.83% | 0.315 | 0.341 | +0.027 | ↑ 8.46% |
| L-FM | 11.79% | 15.01% | +3.22% | ↑ 27.31% | 0.247 | 0.296 | +0.049 | ↑ 19.75% |
| W&D | 11.52% | 15.34% | +3.82% | ↑ 33.16% | 0.242 | 0.285 | +0.043 | ↑ 17.71% |
| Method | CTR | MAP@K | ||||
|---|---|---|---|---|---|---|
| p-Value | p-Value | |||||
| SVD | 0.000000834 | < | 0.05 | 0.000029252 | < | 0.05 |
| BPR | 0.000001340 | < | 0.05 | 0.000600795 | < | 0.05 |
| L-GCN | 0.000000833 | < | 0.05 | 0.000643566 | < | 0.05 |
| L-FM | 0.000000916 | < | 0.05 | 0.000043941 | < | 0.05 |
| W&D | 0.000001110 | < | 0.05 | 0.000104444 | < | 0.05 |
Publisher’s Note: MDPI stays neutral with regard to jurisdictional claims in published maps and institutional affiliations. |
© 2021 by the authors. Licensee MDPI, Basel, Switzerland. This article is an open access article distributed under the terms and conditions of the Creative Commons Attribution (CC BY) license (http://creativecommons.org/licenses/by/4.0/).
Share and Cite
Ban, Y.; Lee, K. Re-Enrichment Learning: Metadata Saliency for the Evolutive Personalization of a Recommender System. Appl. Sci. 2021, 11, 1733. https://doi.org/10.3390/app11041733
Ban Y, Lee K. Re-Enrichment Learning: Metadata Saliency for the Evolutive Personalization of a Recommender System. Applied Sciences. 2021; 11(4):1733. https://doi.org/10.3390/app11041733
Chicago/Turabian StyleBan, Yuseok, and Kyungjae Lee. 2021. "Re-Enrichment Learning: Metadata Saliency for the Evolutive Personalization of a Recommender System" Applied Sciences 11, no. 4: 1733. https://doi.org/10.3390/app11041733