
Locating Core Modules through the Association between Software Source Structure and Execution


Abstract
:1. Introduction
2. Materials and Methods
2.1. Social Network Analysis (SNA)
2.2. Software Profiling
2.3. Data Envelopment Analysis (DEA)
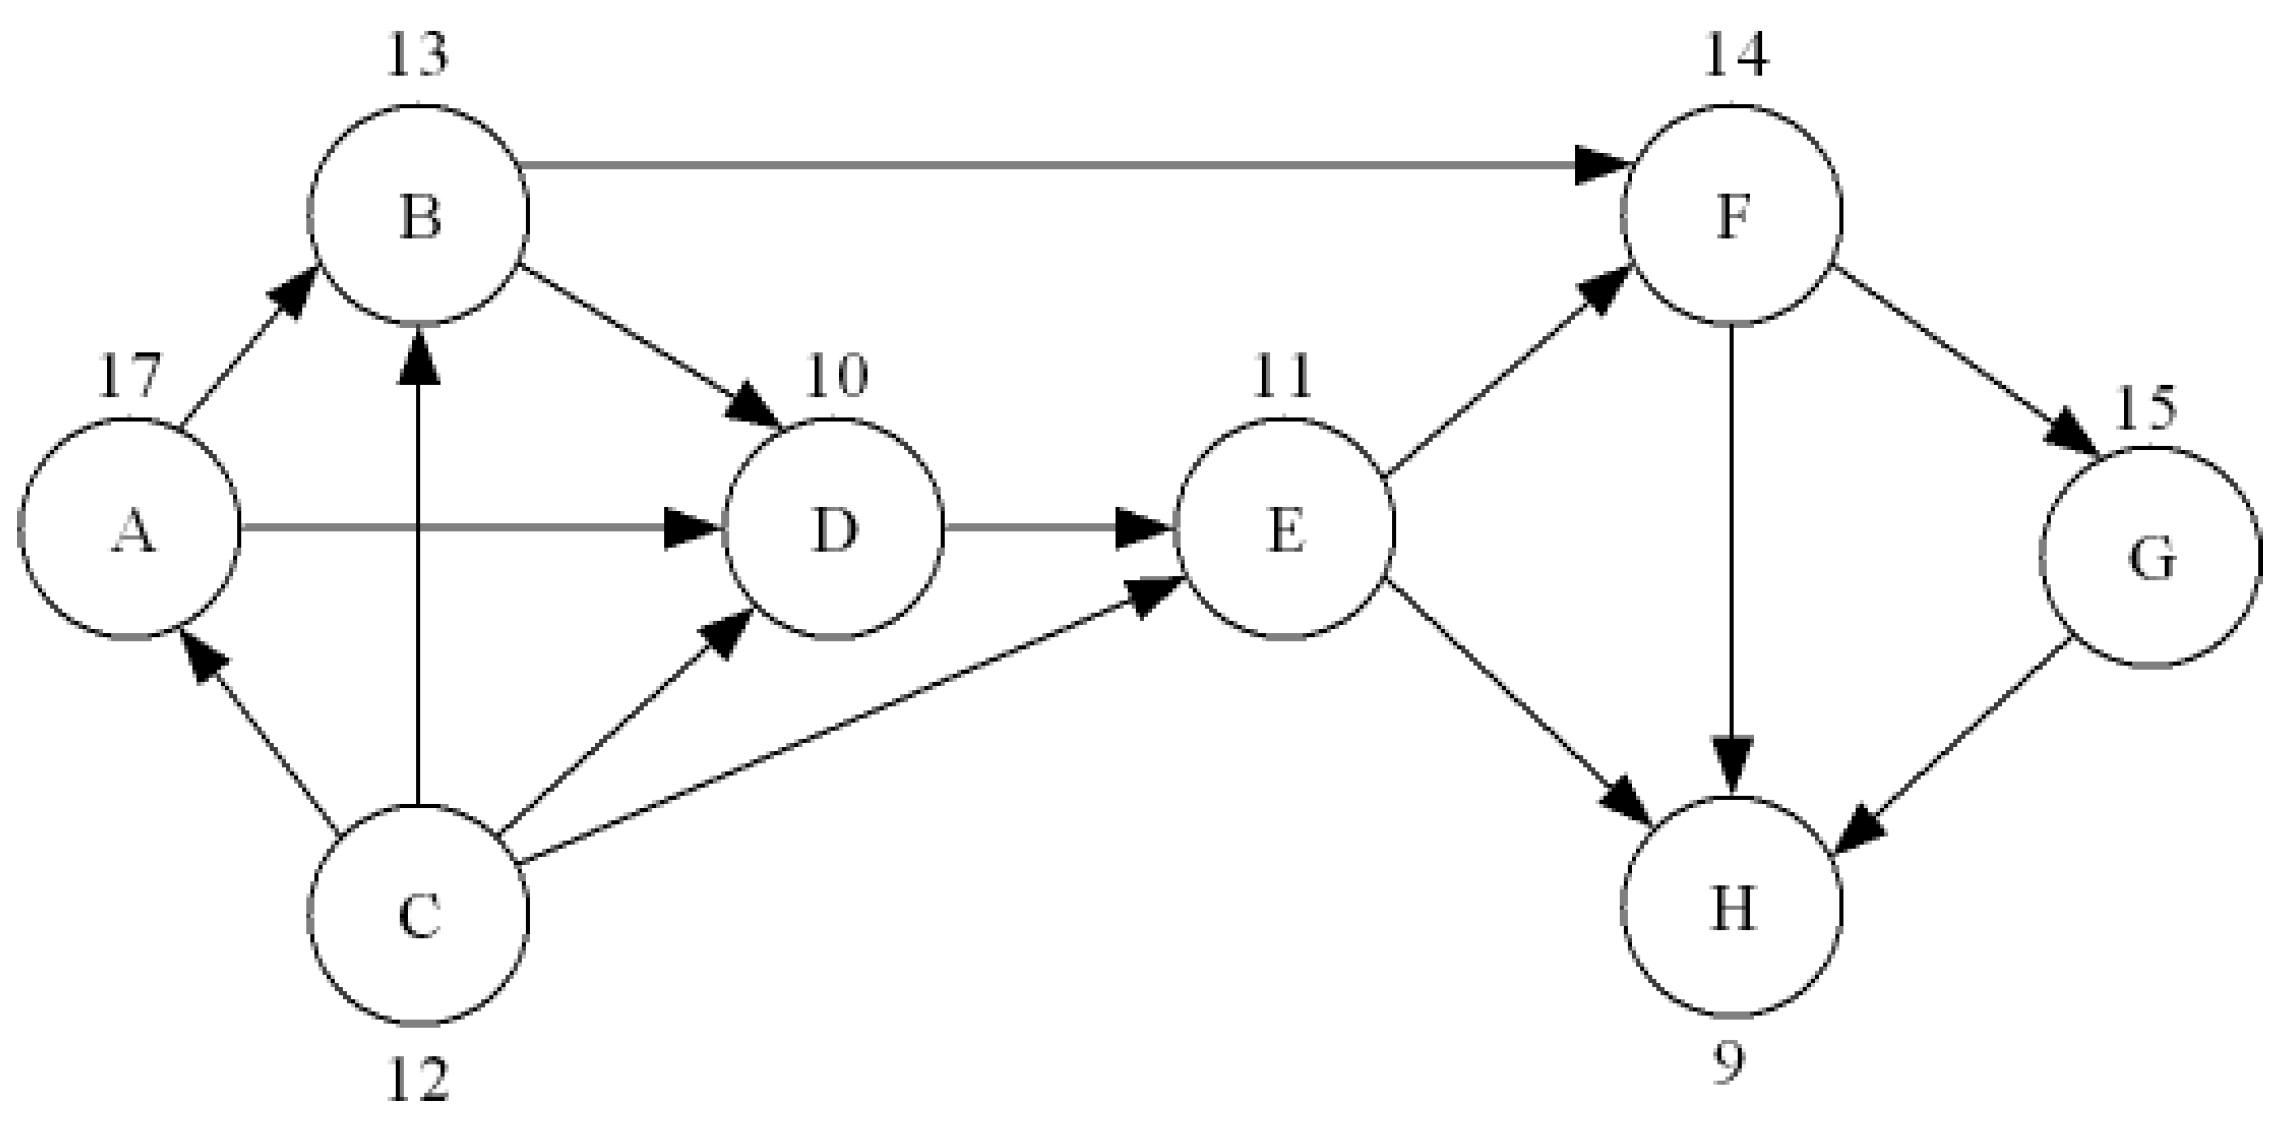
2.4. Demonstration of Node Ranking Combining Network Structure and Execution Frequency by DEA
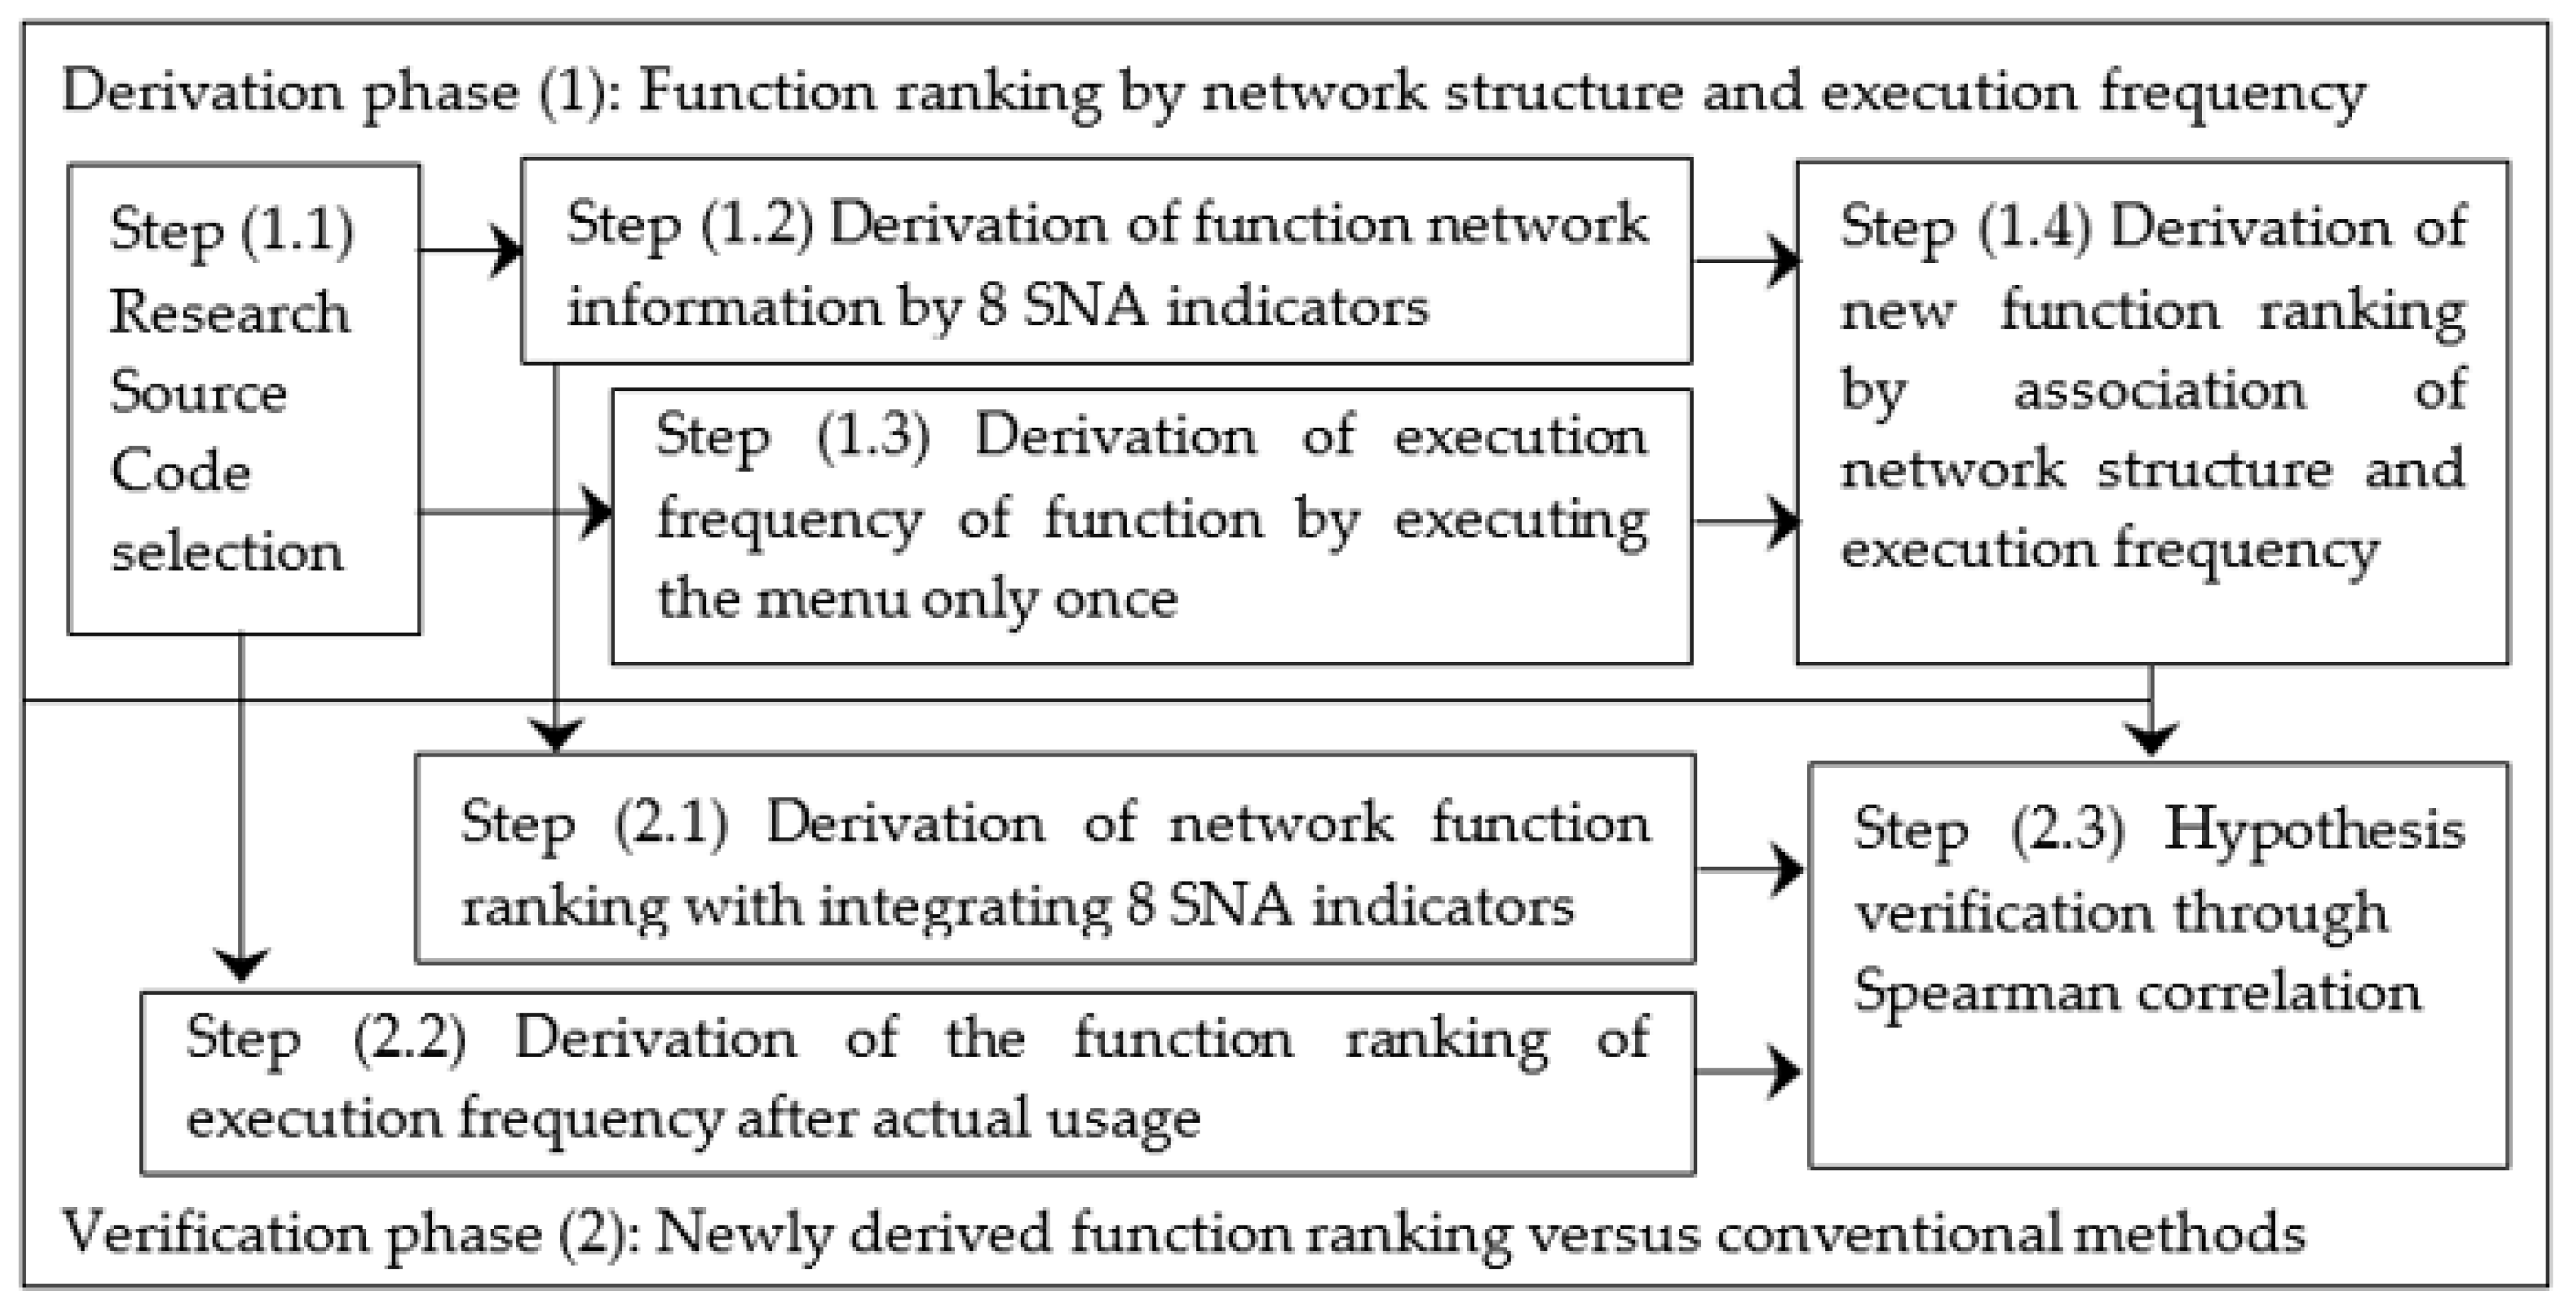
2.5. Research Procedure
2.6. Derivation Phase (1): Function Ranking by Network Structure and Execution Frequency
2.6.1. Step (1.1): Research Source Code Selection
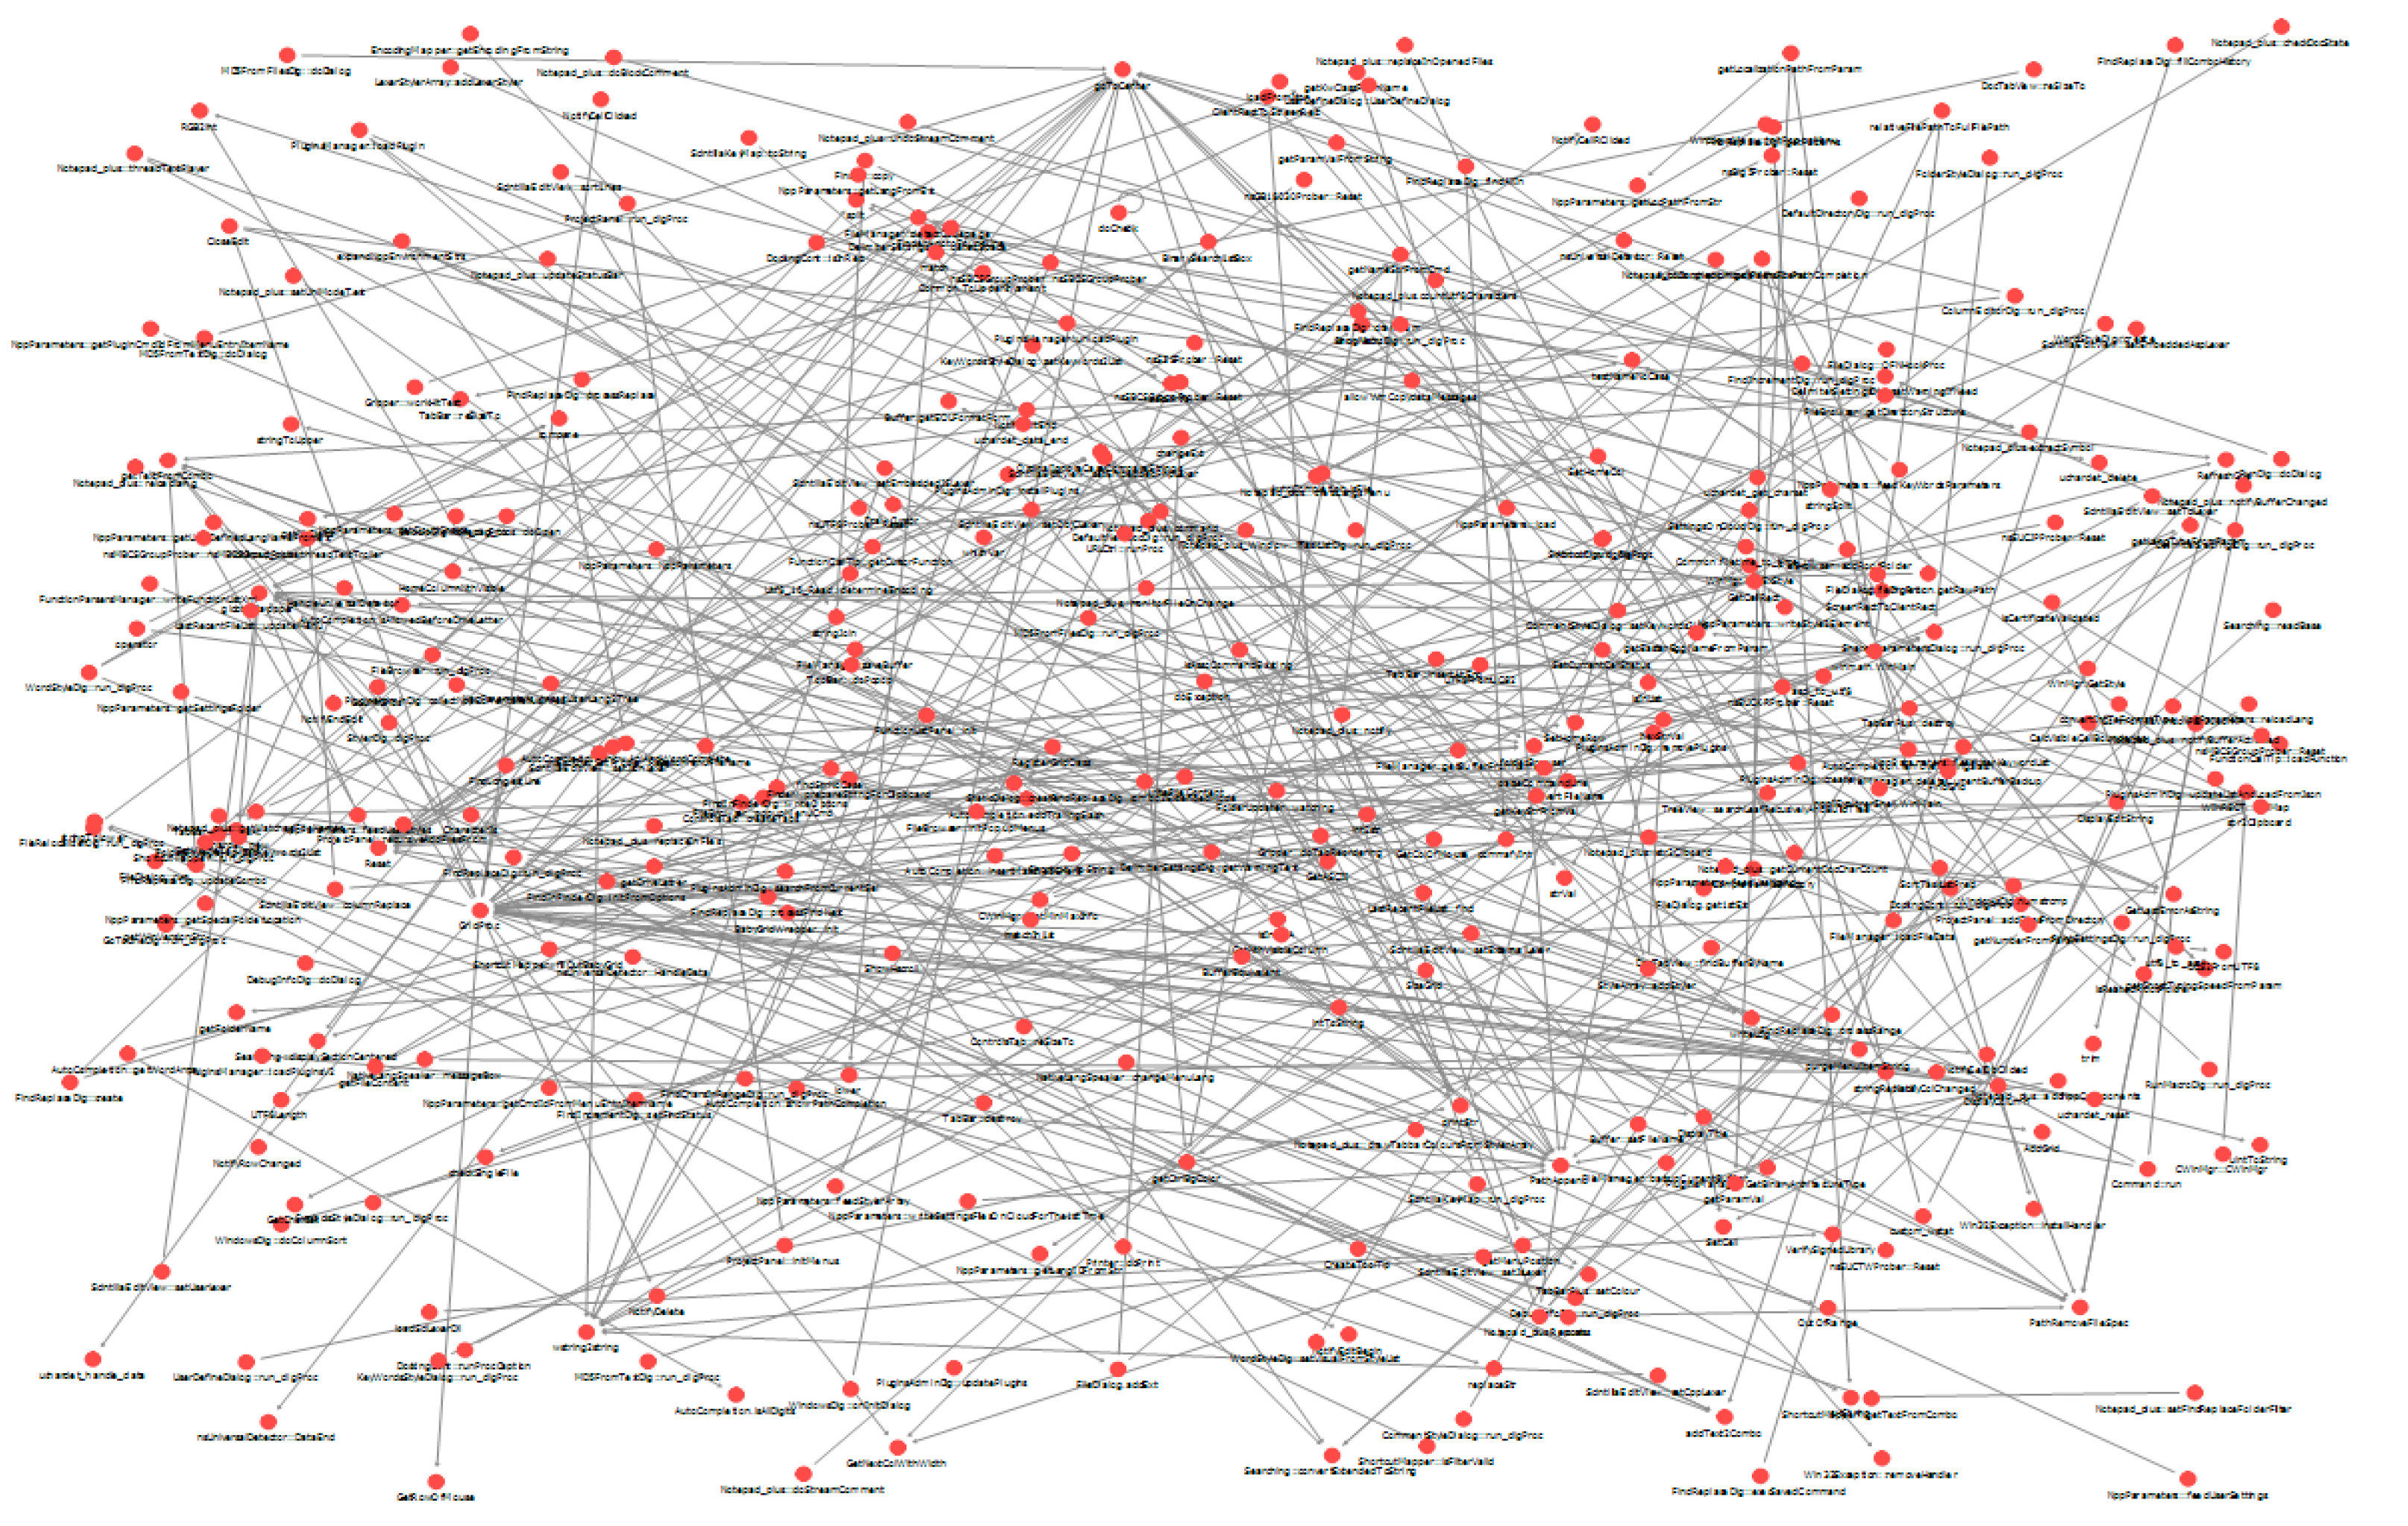
2.6.2. Step (1.2) (Static Analysis): Derivation of Function Network Information by 8 SNA Indicators
2.6.3. Step (1.3) (Dynamic Analysis): Derivation of Execution Frequency of Function by Executing the Menu Only Once
2.6.4. Step (1.4): Derivation of New Function Ranking by the Association of Network Structure and Execution Frequency
2.7. Verification Phase (2): Newly Derived Function Ranking versus Conventional Methods
2.7.1. Step (2.1): Derivation of Network Function Ranking with Integrating the Results of 8 SNA Indicators
2.7.2. Step (2.2): Derivation of Function Ranking of Execution Frequency after Actual Usage
2.7.3. Step (2.3): Hypothesis Verification through Spearman Correlation
3. Results
3.1. Hypothesis 0 Test
3.2. Hypothesis 1 Test
3.3. Hypothesis 2 Test
3.4. Hypothesis 3 Test
4. Discussion
5. Conclusions
Author Contributions
Funding
Institutional Review Board Statement
Informed Consent Statement
Data Availability Statement
Conflicts of Interest
References
- Allied Signal Aerospace Company. Handbook of Software Quality Assurance; Schulmeyer, G.G., McManus, J.I., Eds.; Van Nostrand Reinhold Co.: New York, NY, USA, 1992. [Google Scholar]
- Rahman, M. Application of Social Networking Algorithms in Program Analysis: Understanding Execution Frequencies. Master’s Thesis, Colorado State University Libraries, Fort Collins, CO, USA, 2007. Available online: http://hdl.handle.net/10217/46906 (accessed on 20 January 2021).
- Rubin, J.; Chechik, M.A. Survey of feature location techniques. In Domain Engineering; Springer: Berlin/Heidelberg, Germany, 2013; pp. 29–58. [Google Scholar] [CrossRef]
- Koschke, R.; Quante, J. On dynamic feature location. In Proceedings of the 20th IEEE/ACM International Conference on Automated Software Engineering, 7–11 November 2005; Association for Computer Machinery: New York, NY, USA; pp. 86–95. [Google Scholar] [CrossRef]
- Chen, K.; Rajlich, V. Case study of feature location using dependence graph. In Proceedings of the IWPC 2000, 8th International Workshop on Program Comprehension, Limerick, Ireland, 10–11 June 2000; pp. 241–247. [Google Scholar] [CrossRef]
- Robillard, M.P. Automatic generation of suggestions for program investigation. In Proceedings of the 10th European Software Engineering Conference Held Jointly with 13th ACM SIGSOFT International Symposium on Foundations of Software Engineering, Lisbon, Portugal, 5–9 September 2005; Association for Computer Machinery: New York, NY, USA; pp. 11–20. [Google Scholar] [CrossRef] [Green Version]
- Saul, Z.M.; Filkov, V.; Devanbu, P.; Bird, C. Recommending random walks. In Proceedings of the 6th Joint Meeting of the European Software Engineering Conference and the ACM SIGSOFT Symposium on The Foundations of Software Engineering, Dubrovnik, Croatia, 3–7 September 2007; Association for Computer Machinery: New York, NY, USA; pp. 15–24. [Google Scholar] [CrossRef]
- Wilde, N.; Scully, M.C. Software reconnaissance: Mapping program features to code. J. Softw. Maint. Res. Pract. 1995, 7, 49–62. [Google Scholar] [CrossRef]
- Wilde, N.; Casey, C. Early field experience with the software reconnaissance technique for program comprehension. In Proceedings of the WCRE’96: 4th Working Conference on Reverse Engineering, Monterey, CA, USA, 10–11 November 1996; IEEE Computer Society: Washington, DC, USA; pp. 270–276. [Google Scholar] [CrossRef]
- Stevenson, S. Investigating software reconnaissance as a technique to support feature location and program analysis tasks using sequence diagrams. Master’s Thesis, Department of Computer Science, University of Victoria, Victoria, BC, Canada, 2013. Available online: http://hdl.handle.net/1828/5112 (accessed on 20 January 2021).
- Wong, W.E.; Gokhale, S.S.; Horgan, J.R.; Trivedi, K.S. Locating program features using execution slices. In Proceedings of the 1999 IEEE Symposium on Application-Specific Systems and Software Engineering and Technology, Richardson, TX, USA, 24–27 March 1999; IEEE Computer Society: Washington, DC, USA; pp. 194–203. [Google Scholar] [CrossRef]
- Eisenbarth, T.; Koschke, R.; Simon, D. Locating features in source code. IEEE Trans. Softw. Eng. 2003, 29, 210–224. [Google Scholar] [CrossRef] [Green Version]
- Antoniol, G.; Guéhéneuc, Y.-G. Feature identification: An epidemiological metaphor. IEEE Trans. Softw. Eng. 2006, 32, 627–641. [Google Scholar] [CrossRef]
- Revelle, M.; Poshyvanyk, D. An exploratory study on assessing feature location techniques. In Proceedings of the 2009 IEEE 17th International Conference on Program Comprehension, Vancouver, BC, Canada, 17–19 May 2009; IEEE: New York, NY, USA; pp. 218–222. [Google Scholar] [CrossRef] [Green Version]
- Liu, D.; Marcus, A.; Poshyvanyk, D.; Rajlich, V. Feature location via information retrieval based filtering of a single scenario execution trace. In Proceedings of the Twenty-second IEEE/ACM International Conference on Automated Software Engineering, Atlanta, GA, USA, 5–9 November 2007; Association for Computing Machinery: New York, NY, USA; pp. 234–243. [Google Scholar] [CrossRef]
- Poshyvanyk, D.; Marcus, A. Combining formal concept analysis with information retrieval for concept location in source code. In Proceedings of the 15th IEEE International Conference on Program Comprehension (ICPC’07), Banff, AB, Canada, 9 July 2007; IEEE: New York, NY, USA; pp. 37–48. [Google Scholar] [CrossRef]
- Ganter, B.; Wille, R. Formal Concept Analysis: Mathematical Foundations; Springer Science & Business Media: Berlin, Germany, 2012. [Google Scholar]
- Hill, E.; Pollock, L.; Vijay-Shanker, K. Exploring the neighborhood with Dora to expedite software maintenance. In Proceedings of the twenty-second IEEE/ACM International Conference on Automated Software Engineering, Atlanta, GA, USA, 4–9 November 2007; Association for Computing Machinery: New York, NY, USA; pp. 14–23. [Google Scholar] [CrossRef]
- Zhao, W.; Zhang, L.; Liu, Y.; Sun, J.; Yang, F. 2006. SNIAFL: Towards a static noninteractive approach to feature location. ACM Trans. Softw. Eng. Methodol. 2006, 15, 195–226. [Google Scholar] [CrossRef]
- Borgatti, S.P.; Everett, M.G.; Johnson, J.C. Analyzing Social Networks; Sage: Newbury Park, CA, USA, 2018. [Google Scholar]
- Kim, Y.; Kim, Y. Social Network Analysis, 4th ed.; PAKYOUNGSA: Seoul, Korea, 2019; Available online: http://www.riss.kr/link?id=M15388176 (accessed on 20 January 2021).
- Nagappan, N.; Ball, T. Using software dependencies and churn metrics to predict field failures: An empirical case study. In Proceedings of the First International Symposium on Empirical Software Engineering and Measurement, Madrid, Spain, 20–21 September 2007; IEEE Computer Society: Washington, DC, USA; pp. 364–373. [Google Scholar] [CrossRef]
- Zimmerman, T.; Nagappan, N. Predicting defects using network analysis on dependency graphs. In Proceedings of the 30th International Conference on Software Engineering, Leipzig, Germany, 10–18 May 2008; Association for Computing Machinery: Washington, DC, USA; pp. 531–540. [Google Scholar] [CrossRef] [Green Version]
- Li, F.; Yi, T. Apply PageRank algorithm to measuring relationship’s complexity. In Proceedings of the 2008 IEEE Workshop Pacific-Asia Workshop on Computational Intelligence and Application, PACIIA, Wuhan, China, 19–20 December 2018; IEEE: New York, NY, USA; pp. 914–917. [Google Scholar] [CrossRef]
- Kafle, S. Prioritization of component-to-component links for testing in component based systems. Ph.D. Dissertation, George Washington University, Washington, DC, USA, 2015. Available online: https://search.proquest.com/openview/44e0a634a287ca84b958f17a03d738df/1?pq-origsite=gscholar&cbl=18750&diss=y (accessed on 20 January 2021).
- Hu, W. Using citation influence and social network analysis to predict software defects. Master’s Thesis, Department of Computing Science, University of Alberta, Edmonton, AB, Canada, 2013. [Google Scholar] [CrossRef]
- Nguyen, T.H.; Adams, B.; Hassan, A.E. Studying the impact of dependency network measures on software quality. In Proceedings of the 2010 IEEE International Conference on Software Maintenance, Timioara, Romania, 12–18 September 2010; pp. 1–10. [Google Scholar] [CrossRef]
- He, P.; Li, B.; Ma, Y.; He, L. Using software dependency to bug prediction. Math. Probl. Eng. 2013, 6, 1–12. [Google Scholar] [CrossRef]
- Huh, S.M.; Kim, W.J. Priority analysis for software functions using social network analysis and DEA (Data Envelopment Analysis). J. Inf. Technol. Serv. 2018, 17, 171–189. [Google Scholar] [CrossRef]
- Renieres, M.; Reiss, S.P. Fault localization with nearest neighbor queries. In Proceedings of the 18th IEEE International Conference on Automated Software Engineering (ASE), Montreal, QC, Canada, 6–10 October 2003; IEEE: New York, NY, USA; pp. 30–39. [Google Scholar] [CrossRef]
- Harrold, M.J.; Rothermel, G.; Wu, R.; Yi, L. An empirical investigation of program spectra. In Proceedings of the 1998 ACM SIGPLAN-SIGSOFT Workshop on Program Analysis for Software Tools and Engineering, Montreal, QC, Canada, 26 June 1998; Association for Computing Machinery: New York, NY, USA; pp. 83–90. [Google Scholar] [CrossRef]
- Charnes, A.; Cooper, W.W.; Rhodes, E. Measuring the efficiency of decision-making units. Eur. J. Oper. Res. 1978, 2, 429–444. [Google Scholar] [CrossRef]
- Banker, R.D.; Charnes, A.; Cooper, W.W. Some models for estimating technical and scale inefficiencies in data envelopment analysis. Manag. Sci. 1984, 30, 1078–1092. [Google Scholar] [CrossRef] [Green Version]
- Choi, M.S.; Kim, W.J.; Cho, H.-K.; Park, S.J. A study on an evaluation method for LCD TV products using axiomatic design based hybrid AHP/DEA model. Korean Mana. Sci. Rev. 2012, 29, 33–56. [Google Scholar] [CrossRef] [Green Version]
- Seo, K.-S.; Ahn, H.-M. Urban railway train operation efficiency studies using DEA. In Proceedings of the Autumn Conference & Annual Meeting of The Korean Society for Railway, 20–22 October 2016; Korean Society for Railway. pp. 446–459. Available online: http://www.riss.kr/link?id=A102260697 (accessed on 20 January 2021).
- Kim, B.H.; Han, S.Y.; Kim, Y.C. Design of advanced HITS algorithm by suitability for importance-evaluation of web-documents. J. Soc. e-Bus. Stud. 2003, 8, 23–31. Available online: http://www.riss.kr/link?id=A76195204 (accessed on 20 January 2021).
- CodeCover—An Open-source Glass-box Testing Tool. 2011. CodeCover. Available online: http://www.codecover.org (accessed on 20 January 2021).
- Graham, S.L.; Kessler, P.B.; McKusick, M.K. Gprof: A call graph execution profiler. ACM SIGPLAN Not. 1982, 17, 120–126. [Google Scholar] [CrossRef]
- Emrouznejad, A.; Yang, G.-L. A survey and analysis of the first 40 years of scholarly literature in DEA: 1978–2016. Socio-Econ. Plan. Sci. 2018, 61, 4–8. [Google Scholar] [CrossRef]
- Sudhaman, P.; Thangavel, C. Efficiency analysis of ERP projects—Software quality perspective. Int. J. Proj. Manag. 2015, 33, 961–970. [Google Scholar] [CrossRef]
- Paschalidou, G.; Stiakakis, E.; Chatzigeorgiou, A. An application of data envelopment analysis to software quality assessment. In Proceedings of the 6th Balkan Conference in Informatics, Thessaloniki, Greece, 19–21 September 2013; Association for Computing Machinery: New York, NY, USA; pp. 228–235. [Google Scholar] [CrossRef]
- Kou, G.; Peng, Y.; Shi, Y.; Wu, W. Classifier evaluation for software defect prediction. Stud. Inform. Control. 2012, 21, 117–126. [Google Scholar] [CrossRef] [Green Version]
- Wray, B.; Mathieu, R. Evaluating the performance of open source software projects using data envelopment analysis. Inform. Manag. Comput. Secur. 2008, 16, 449–462. [Google Scholar] [CrossRef]
- Zhang, S.; Wang, Y.; Tong, J.; Zhou, J.; Ruan, L. Evaluation of project quality: A DEA-based approach. In Software Process Workshop; Springer: New York, NY, USA, 2006; pp. 88–96. [Google Scholar] [CrossRef]
- Cao, Q. Assessing productivity of UML-based systems analysis and design: A DEA approach. In Proceedings of the Americas Conference on Information Systems, New York, NY, USA, 6–8 August 2004; Association for Information Systems: New York, NY, USA; pp. 1652–001614847. [Google Scholar]
- Yang, Z.; Paradi, J.C. DEA evaluation of a Y2K software retrofit program. IEEE Trans. Eng. Manag. 2004, 51, 279–287. [Google Scholar] [CrossRef]


| Node | Static Analysis (Social Network Analysis (SNA)) | Dynamic Analysis | |||||||
|---|---|---|---|---|---|---|---|---|---|
| In- degree | Out- degree | Page Rank | Authority | Hub | In-closeness | Out-closeness | Betweenness | Execution Frequency | |
| A | 0.1429 | 0.1257 | 0.0703 | 0.3193 | 0.4867 | 0.1429 | 0.4286 | 0 | 17 |
| B | 0.2857 | 0.2857 | 0.0879 | 0.5195 | 0.3501 | 0.2857 | 0.4464 | 0.0833 | 13 |
| C | 0 | 0.5714 | 0.0625 | 0 | 0.7762 | 0 | 0.6364 | 0 | 11 |
| D | 0.4286 | 0.1429 | 0.1099 | 0.6635 | 0.1581 | 0.4286 | 0.2857 | 0.0595 | 10 |
| E | 0.2857 | 0.2857 | 0.1252 | 0.3843 | 0.1056 | 0.3810 | 0.3214 | 0.1310 | 11 |
| F | 0.2857 | 0.2857 | 0.1158 | 0.1875 | 0.0343 | 0.4464 | 0.2857 | 0.1548 | 14 |
| G | 0.1429 | 0.1429 | 0.0914 | 0.0141 | 0.0285 | 0.3673 | 0.1429 | 0 | 15 |
| H | 0.4286 | 0 | 0.1685 | 0.0693 | 0 | 0.5833 | 0 | 0 | 9 |
| Nodes | Efficiency | Rank |
|---|---|---|
| A | 73.7% | 6 |
| D | 70.% | 7 |
| C | 540.0% | 2 |
| D | 67.8% | 8 |
| E | 84.9% | 4 |
| F | 1000.0% | 1 |
| G | 84.6% | 5 |
| H | 96.4% | 3 |
| Function | 8 Social Network Analysis (SNA) Indicators | |||||||
|---|---|---|---|---|---|---|---|---|
| In- degree | Out- degree | Page- Rank | Authority | Hub | In- closeness | Out-closeness | Betweenness | |
| DisplayColumn | 2653 | 13,263 | 1342 | 164,373 | 130,571 | 2653 | 13,642 | 4 |
| DisplayEditString | 7958 | 2653 | 1895 | 196,486 | 30,884 | 8488 | 3537 | 35 |
| DisplayTitle | 2653 | 0 | 1342 | 164,373 | 0 | 2653 | 0 | 0 |
| doCheck | 2653 | 0 | 3968 | 0 | 0 | 2653 | 0 | 0 |
| DockingCont::isInRect | 0 | 2653 | 1323 | 0 | 0 | 0 | 2653 | 0 |
| DockingCont::run_dlgProc | 0 | 2653 | 1323 | 0 | 0 | 0 | 2653 | 0 |
| DockingCont::runProcCaption | 0 | 2653 | 1323 | 0 | 0 | 0 | 2653 | 0 |
| DocTabView:: findBufferByName | 0 | 2653 | 1323 | 0 | 0 | 0 | 3537 | 0 |
| DocTabView::reSizeTo | 0 | 2653 | 1323 | 0 | 0 | 0 | 2653 | 0 |
| doException | 2653 | 2653 | 1383 | 0 | 0 | 2653 | 2653 | 7 |
| DrawCursor | 2653 | 2653 | 1342 | 164,373 | 30,884 | 2653 | 3537 | 0 |
| Functions | Execution Frequency |
|---|---|
| Notepad_plus::process | 188,207 |
| nsBig5Prober::Reset | 20,865 |
| StyleArray::addStyler | 15,276 |
| Notepad_plus::command | 12,113 |
| getKwClassFromName | 9176 |
| Shortcut::run_dlgProc | 8962 |
| getNameStrFromCmd | 8769 |
| FindReplaceDlg::run_dlgProc | 6340 |
| LexerStylerArray::addLexerStyler | 6100 |
| FindGrid | 5266 |
| GridProc | 5238 |
| commafyInt | 3626 |
| New Functions Ranking | Functions |
|---|---|
| 1 | Notepad_plus::process |
| 2 | GetWinVersionStr |
| 3 | CalcVisibleCellBoundaries |
| 4 | Notepad_plus::str2Cliboard |
| 5 | Notepad_plus::replaceInFiles |
| 6 | GetCharset |
| 7 | CreateToolTip |
| 8 | nsSBCSGroupProber::Reset |
| 9 | checkSingleFile |
| 10 | FunctionCallTip::getCursorFunction |
| 11 | ScintillaKeyMap::run_dlgProc |
| 12 | CommentStyleDialog::run_dlgProc |
| 13 | ClientRectToScreenRect |
| 14 | Searching::convertExtendedToString |
| 15 | NppParameters::feedUserLang |
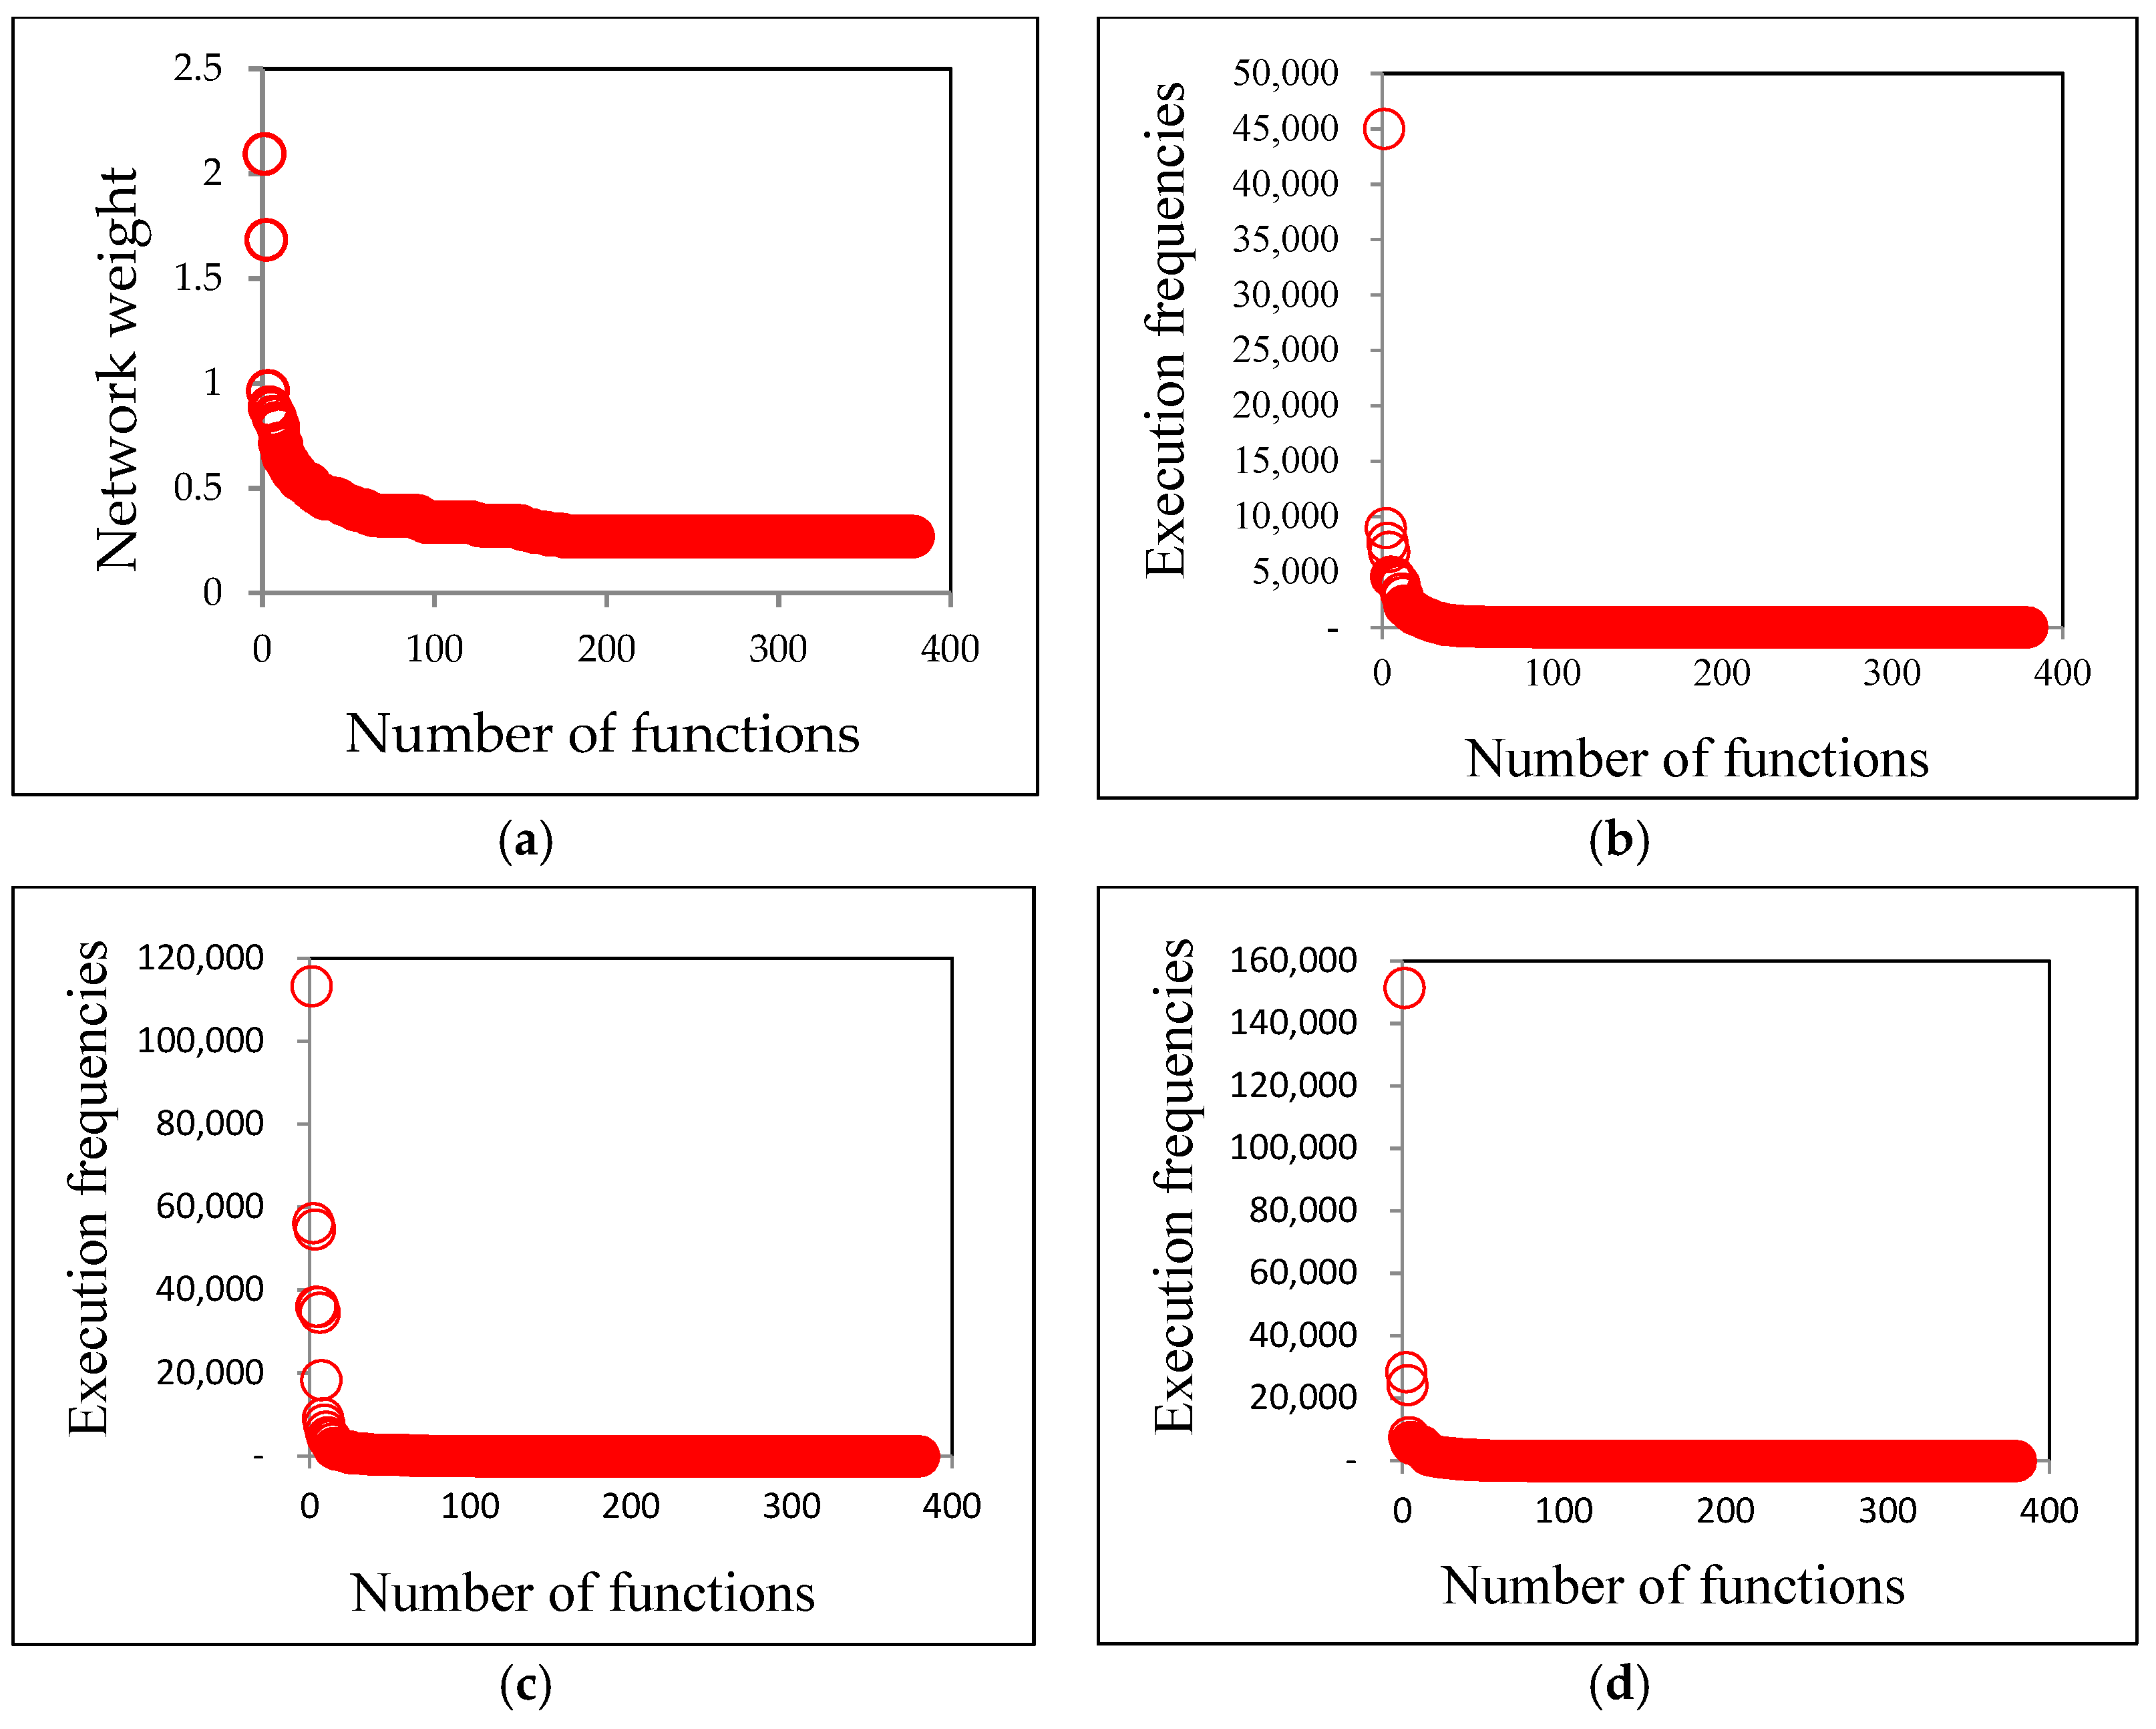
| Spearman Correlation Comparison | Figure 4b Highest Correlation Data | Figure 4c Medium Correlation Data | Figure 4d Lowest Correlation Data | ||
|---|---|---|---|---|---|
| Table 3 | Degree Centrality | In-degree | 8.9% | 10.6% | 13.5% |
| Out-degree | −0.5% | −1.7% | −1.9% | ||
| HITS Centrality | Authority | 6.5% | 16.0% | 16.3% | |
| Hub | 5.0% | 10.3% | 10.% | ||
| Closeness Centrality | In-closeness | 9.7% | 11.2% | 13.9% | |
| Out-closeness | 2.0% | 0.6% | 0.2% | ||
| Page Rank centrality | 9.5% | 10% | 12.4% | ||
| Node betweenness | 7.4% | 7.2% | 9.7% | ||
| Figure 4a | Integrated 8 SNA indicators | 0.94% | 12.1% | 13% | |
| Spearman Correlation Comparison | Spearman Correlation | p-Value | Hypothesis 1 | ||
|---|---|---|---|---|---|
| Table 3 | Degree Centrality | In-degree | 24.596% | 1.293 × 10⁻⁶ | Rejected |
| Out-degree | −9.413% | 0.6754 | Not Rejected | ||
| HITS Centrality | Authority | 16.708% | 0.001112 | Rejected | |
| Hub | 13.074% | 0.01095 | Rejected | ||
| Closeness Centrality | In-closeness | 24.549% | 1.362 × 10⁻⁶ | Rejected | |
| Out-closeness | −7.775% | 0.1313 | Not Rejected | ||
| PageRank centrality | 23.239% | 4.97 × 10⁻⁶ | Rejected | ||
| Node betweenness | 15.125% | 0.0032 | Rejected | ||
| Figure 4a | Integrated 8 SNA indicators | 25.58% | 4.63 × 10⁻⁷ | Rejected | |
| Ranking of Execution Frequency | Spearman Correlation | p-Value | Hypothesis 2 |
|---|---|---|---|
| Highest correlation data | 83.121% | 2.2 × 10⁻¹⁶ | Rejected |
| Medium correlation data | 82.169% | 2.2 × 10⁻¹⁶ | Rejected |
| Lowest correlation data | 79.699% | 2.2 × 10⁻¹⁶ | Rejected |
Publisher’s Note: MDPI stays neutral with regard to jurisdictional claims in published maps and institutional affiliations. |
© 2021 by the authors. Licensee MDPI, Basel, Switzerland. This article is an open access article distributed under the terms and conditions of the Creative Commons Attribution (CC BY) license (http://creativecommons.org/licenses/by/4.0/).
Share and Cite
Huh, S.M.; Kim, W.J. Locating Core Modules through the Association between Software Source Structure and Execution. Appl. Sci. 2021, 11, 1685. https://doi.org/10.3390/app11041685
Huh SM, Kim WJ. Locating Core Modules through the Association between Software Source Structure and Execution. Applied Sciences. 2021; 11(4):1685. https://doi.org/10.3390/app11041685
Chicago/Turabian StyleHuh, Sang Moo, and Woo Je Kim. 2021. "Locating Core Modules through the Association between Software Source Structure and Execution" Applied Sciences 11, no. 4: 1685. https://doi.org/10.3390/app11041685