Article

Gradient Boosting Machine to Assess the Public Protest Impact on Urban Air Quality

1
Grupo de Biodiversidad Medio Ambiente y Salud (BIOMAS), Universidad de Las Américas UDLA, Vía a Nayón, Quito 170124, Ecuador
2
School of Information and Engineering, Dalarna University, 791 88 Falun, Sweden
3
Research Center for the Territory and Sustainable Habitat, Universidad Tecnologica Indoamerica, Machala y Sabanilla, Quito 170301, Ecuador
4
Carrera de Ingeniería Ambiental, Facultad de Ciencias Químicas, Universidad de Cuenca, Cuenca 010203, Ecuador
5
Secretariat of the Environment, Quito 170501, Ecuador
*
Author to whom correspondence should be addressed.
Appl. Sci. 2021, 11(24), 12083; https://doi.org/10.3390/app112412083
Submission received: 18 November 2021 / Revised: 13 December 2021 / Accepted: 16 December 2021 / Published: 18 December 2021
(This article belongs to the Special Issue Air Quality Prediction Based on Machine Learning Algorithms II)

Abstract

:
Political and economic protests build-up due to the financial uncertainty and inequality spreading throughout the world. In 2019, Latin America took the main stage in a wave of protests. While the social side of protests is widely explored, the focus of this study is the evolution of gaseous urban air pollutants during and after one of these events. Changes in concentrations of NO2, CO, O3 and SO2 during and after the strike, were studied in Quito, Ecuador using two approaches: (i) inter-period observational analysis; and (ii) machine learning (ML) gradient boosting machine (GBM) developed business-as-usual (BAU) comparison to the observations. During the strike, both methods showed a large reduction in the concentrations of NO2 (31.5–32.36%) and CO (15.55–19.85%) and a slight reduction for O3 and SO2. The GBM approach showed an exclusive potential, especially for a lengthier period of predictions, to estimate strike impact on air quality even after the strike was over. This advocates for the use of machine learning techniques to estimate an extended effect of changes in human activities on urban gaseous pollution.

1. Introduction

Polluted air can contain a substantial amount of chemicals in the form of microparticles and harmful gases. Among the most common atmospheric gaseous pollutants are carbon monoxide (CO), nitrogen oxides (NO and NO2), sulfur dioxide (SO2) and ozone (O3). All of them can cause a variety of respiratory and cardiovascular health problems and are especially dangerous for at-risk populations: the young, the elderly and people with respiratory or cardiovascular problems [1]. The air pollutant concentrations can be affected by social dynamics, such as the trigger of mass protests due to economic troubles, job insecurity and rapidly growing inequality [2]. In 2019, a huge number of public protests and strikes spiked up in developing and developed countries, including Europe, Asia and the Americas [3,4,5,6]. At the end of 2019, Latin America was in the center stage of demonstrations against governments in Mexico [7], Chile [8], Bolivia [9,10], Colombia [11] and Ecuador [12]. Massive protests and riots spread from capital cities overtaking significant parts of the countries, and in a few cases even lasting well into 2020 or 2021 [13,14].
As social dissatisfaction is growing more vocal, it encourages scientific curiosity to question the effects that protests and strikes might have on air quality. During those special events, the protesters often cause restrictions or complete seizure of public and private transportation, which might improve air quality, however, they might also cause riots, vandalisms, burning and looting [15]. Though protests have previously been investigated from the social science perspective [16,17], the research on air pollution dynamics is still very limited. Previous research analyzing the air quality during strike events has demonstrated a variety of effects on air quality. A study in Hong Kong during large-scale street protests reported a substantial reduction in NO2 in the central area [5]. An investigation in São Paulo during a truck drivers’ strike showed a 50% reduction in CO and NO concentrations, although NO2 and particulate matter (PM) indicated no changes [18]. In contrast, during public transport strikes in Italy and Spain, CO levels increased due to the greater use of private vehicles [19,20]. Such differences in research findings suggest a need for a broader understanding of the impact of these events on air quality.
In previous studies, pollution change estimates are often based on differences between central and background sites [5] or “trend conditions”. The latter are usually calculated using a comparable period (e.g., 3 to 5 years) prior to the protest event [18] or simply comparing pollution pre-strike levels to those during the strike [21]. Depending on the nature of the pollutant, these types of analyses could be subject to biases, as meteorological conditions that influence the production and transport of certain contaminants could vary between the time periods used for comparison [22]. In the case of traffic-borne primary pollutants, however, macroscopic observations before and after events that cause a change in traffic, are useful as differences are directly related to the physical source of pollution. In the case of statistics-based models (e.g., machine learning algorithms), meteorology variables can be included in order to avoid biases and to increase confidence when calculating business-as-usual (BAU) conditions, as previously done in COVID-19 impact studies [23,24,25].
As the number and scale of protests spiral, especially considering the economic burden due to the global COVID-19 pandemic, it is crucial to be able to evaluate the true environmental impact of these events. Hence, the purpose of this study is to find out how local is the impact of these events on urban air quality and how long do the effects last after the protests stop? For that, a new approach is proposed to quantify the effect of such an event on urban pollution. A specific South American case study in Quito, Ecuador, is investigated to gauge changes in air quality during the national strike of 2019 and up to 12 days later. Due to the location of the central government in Quito, protesters, mostly indigenous groups, traveled hundreds of kilometers by foot to Quito from all over the country. Throughout the protests, there was a voluntary (private bus companies) and forced (city transportation lines and private vehicles) lockdown of urban transport circulation. Otherwise, circulating vehicles were often attacked and forced to stop by protesters. These unusual conditions allowed for estimating the impact of the motorized fleet on trace gas levels in this high elevation Andean capital.
In this study, to estimate the protest impact on urban air quality in the South American city, first, the strike impact on concentrations of NO2, CO, O3 and SO2 was evaluated using an inter-period observational data comparison, considering 12 days before, 12 days during and 12 days after the strike. Then, the evolution of trace gas levels was assessed using machine learning (ML) gradient boosting machine (GBM) modeled business-as-usual (BAU) conditions. The comparison between the two approaches was investigated. Finally, the two model performance evaluations conclude the study.

2. Materials and Methods

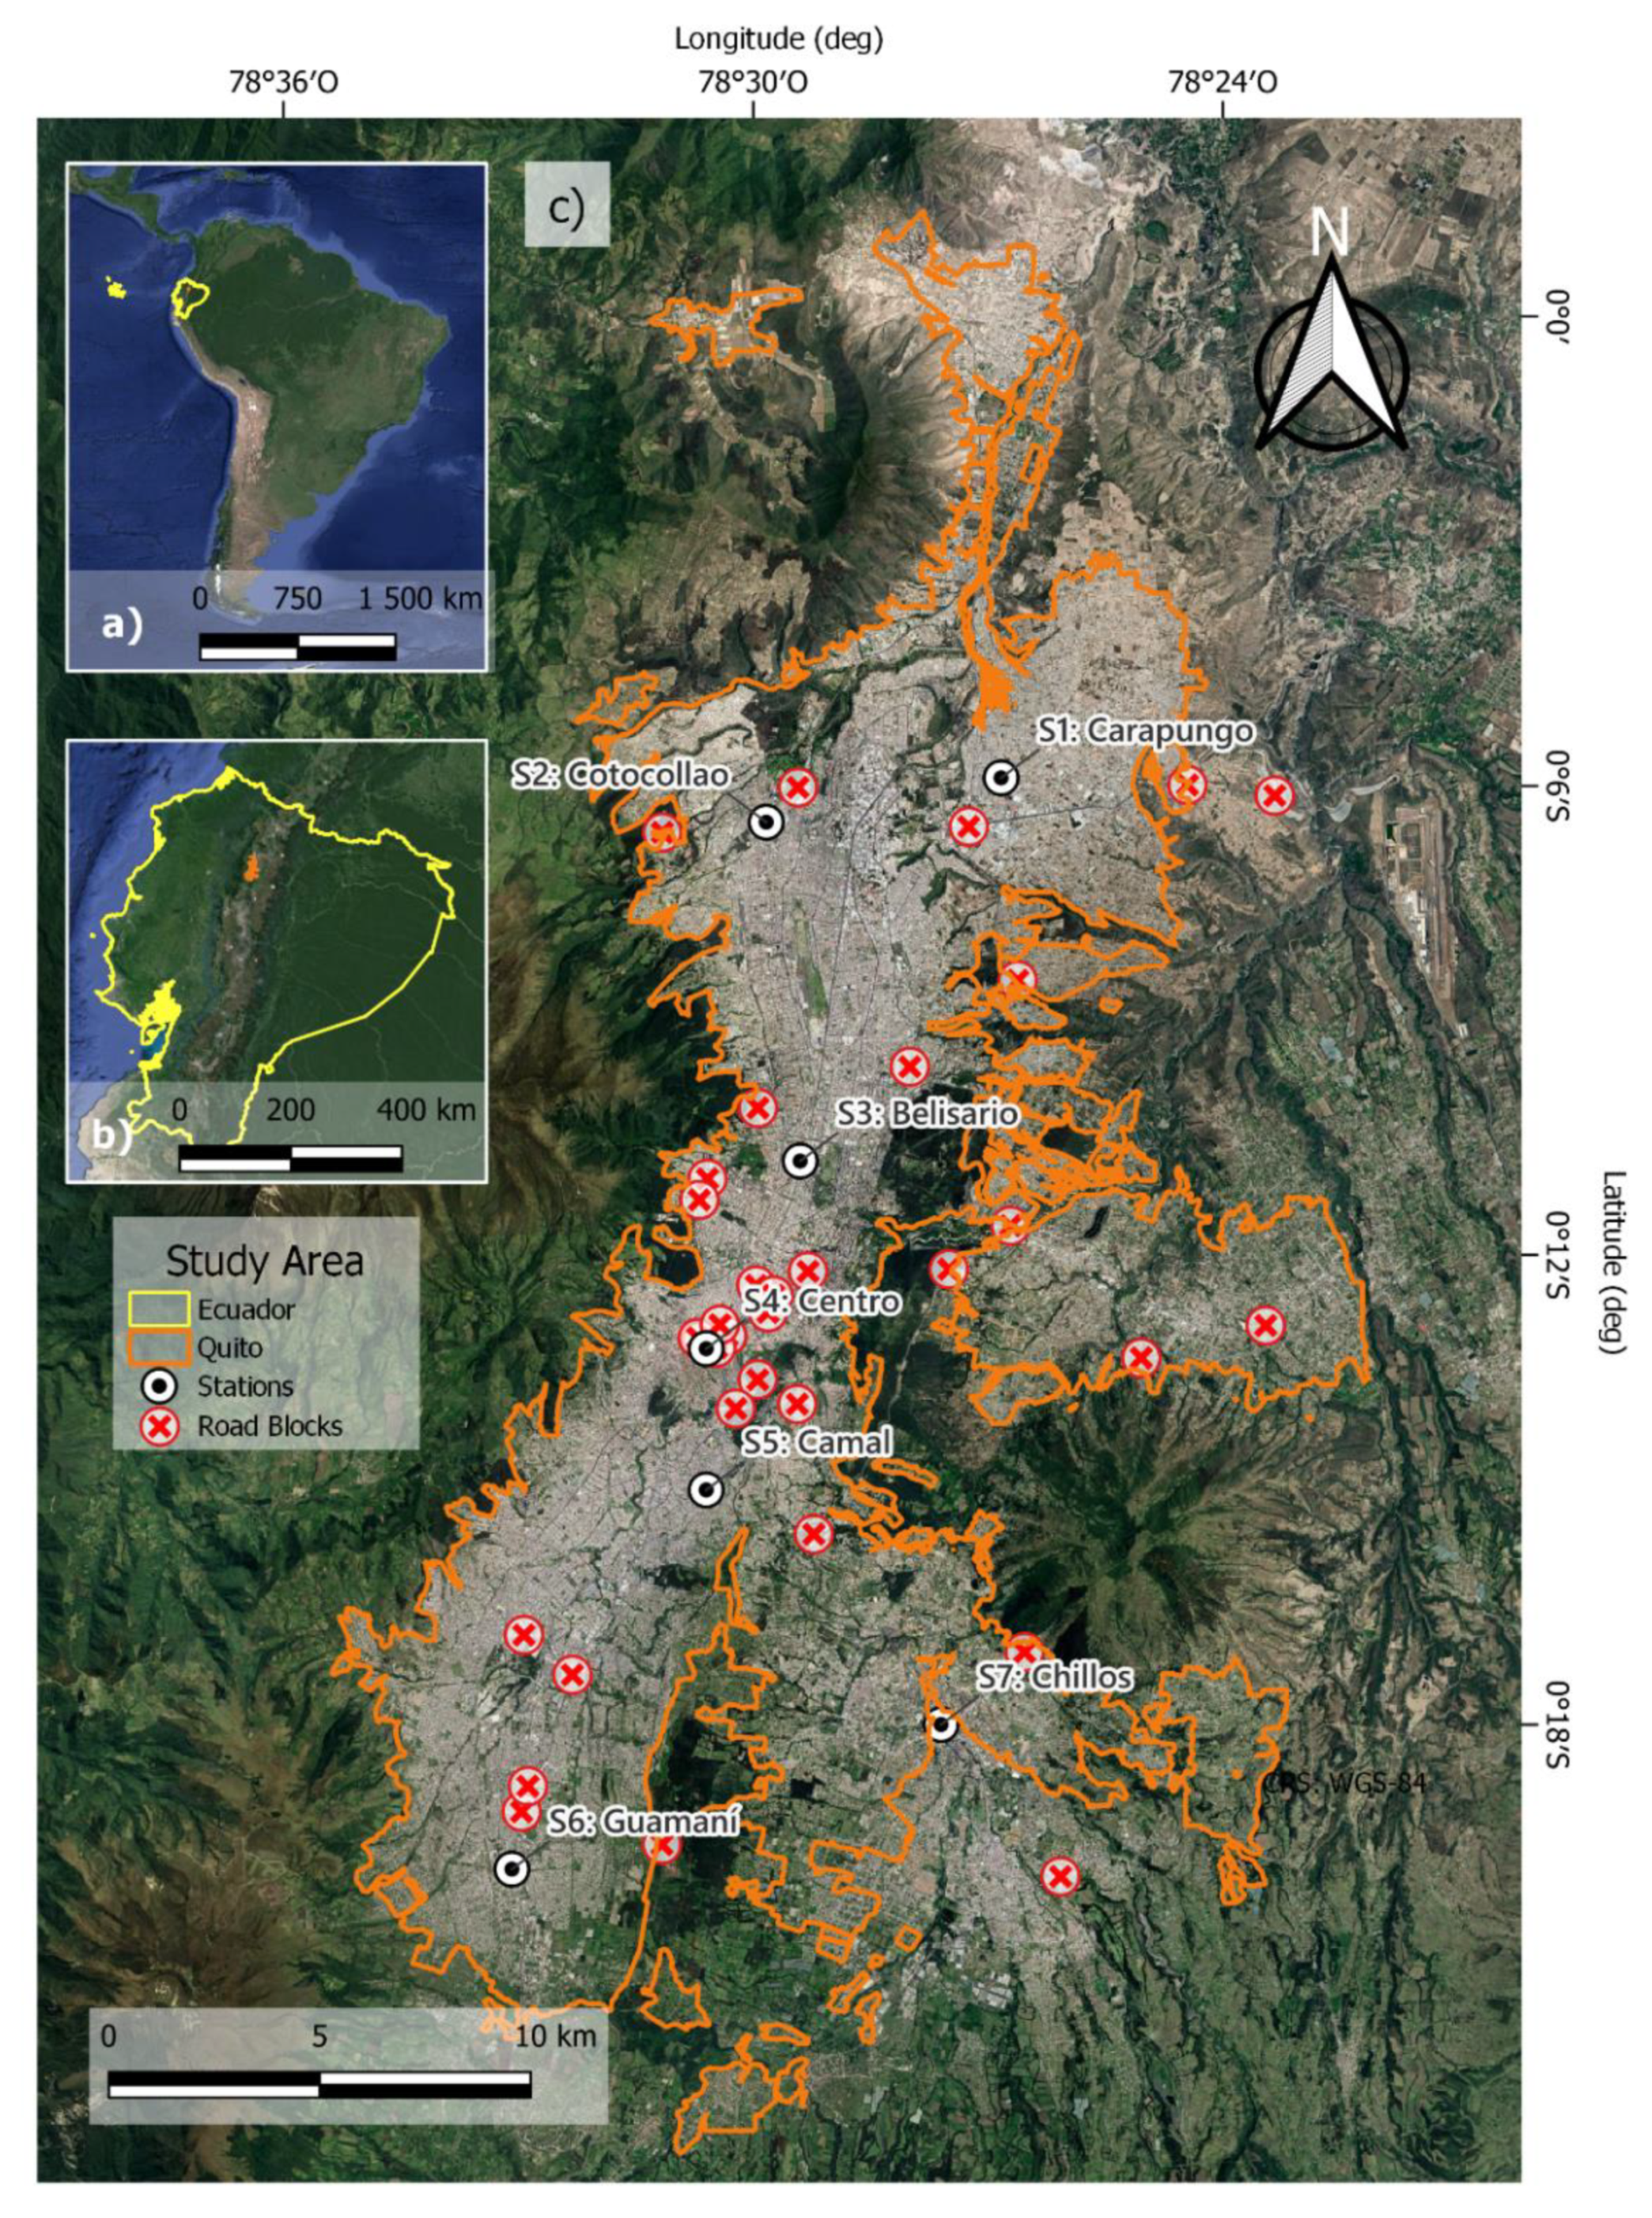
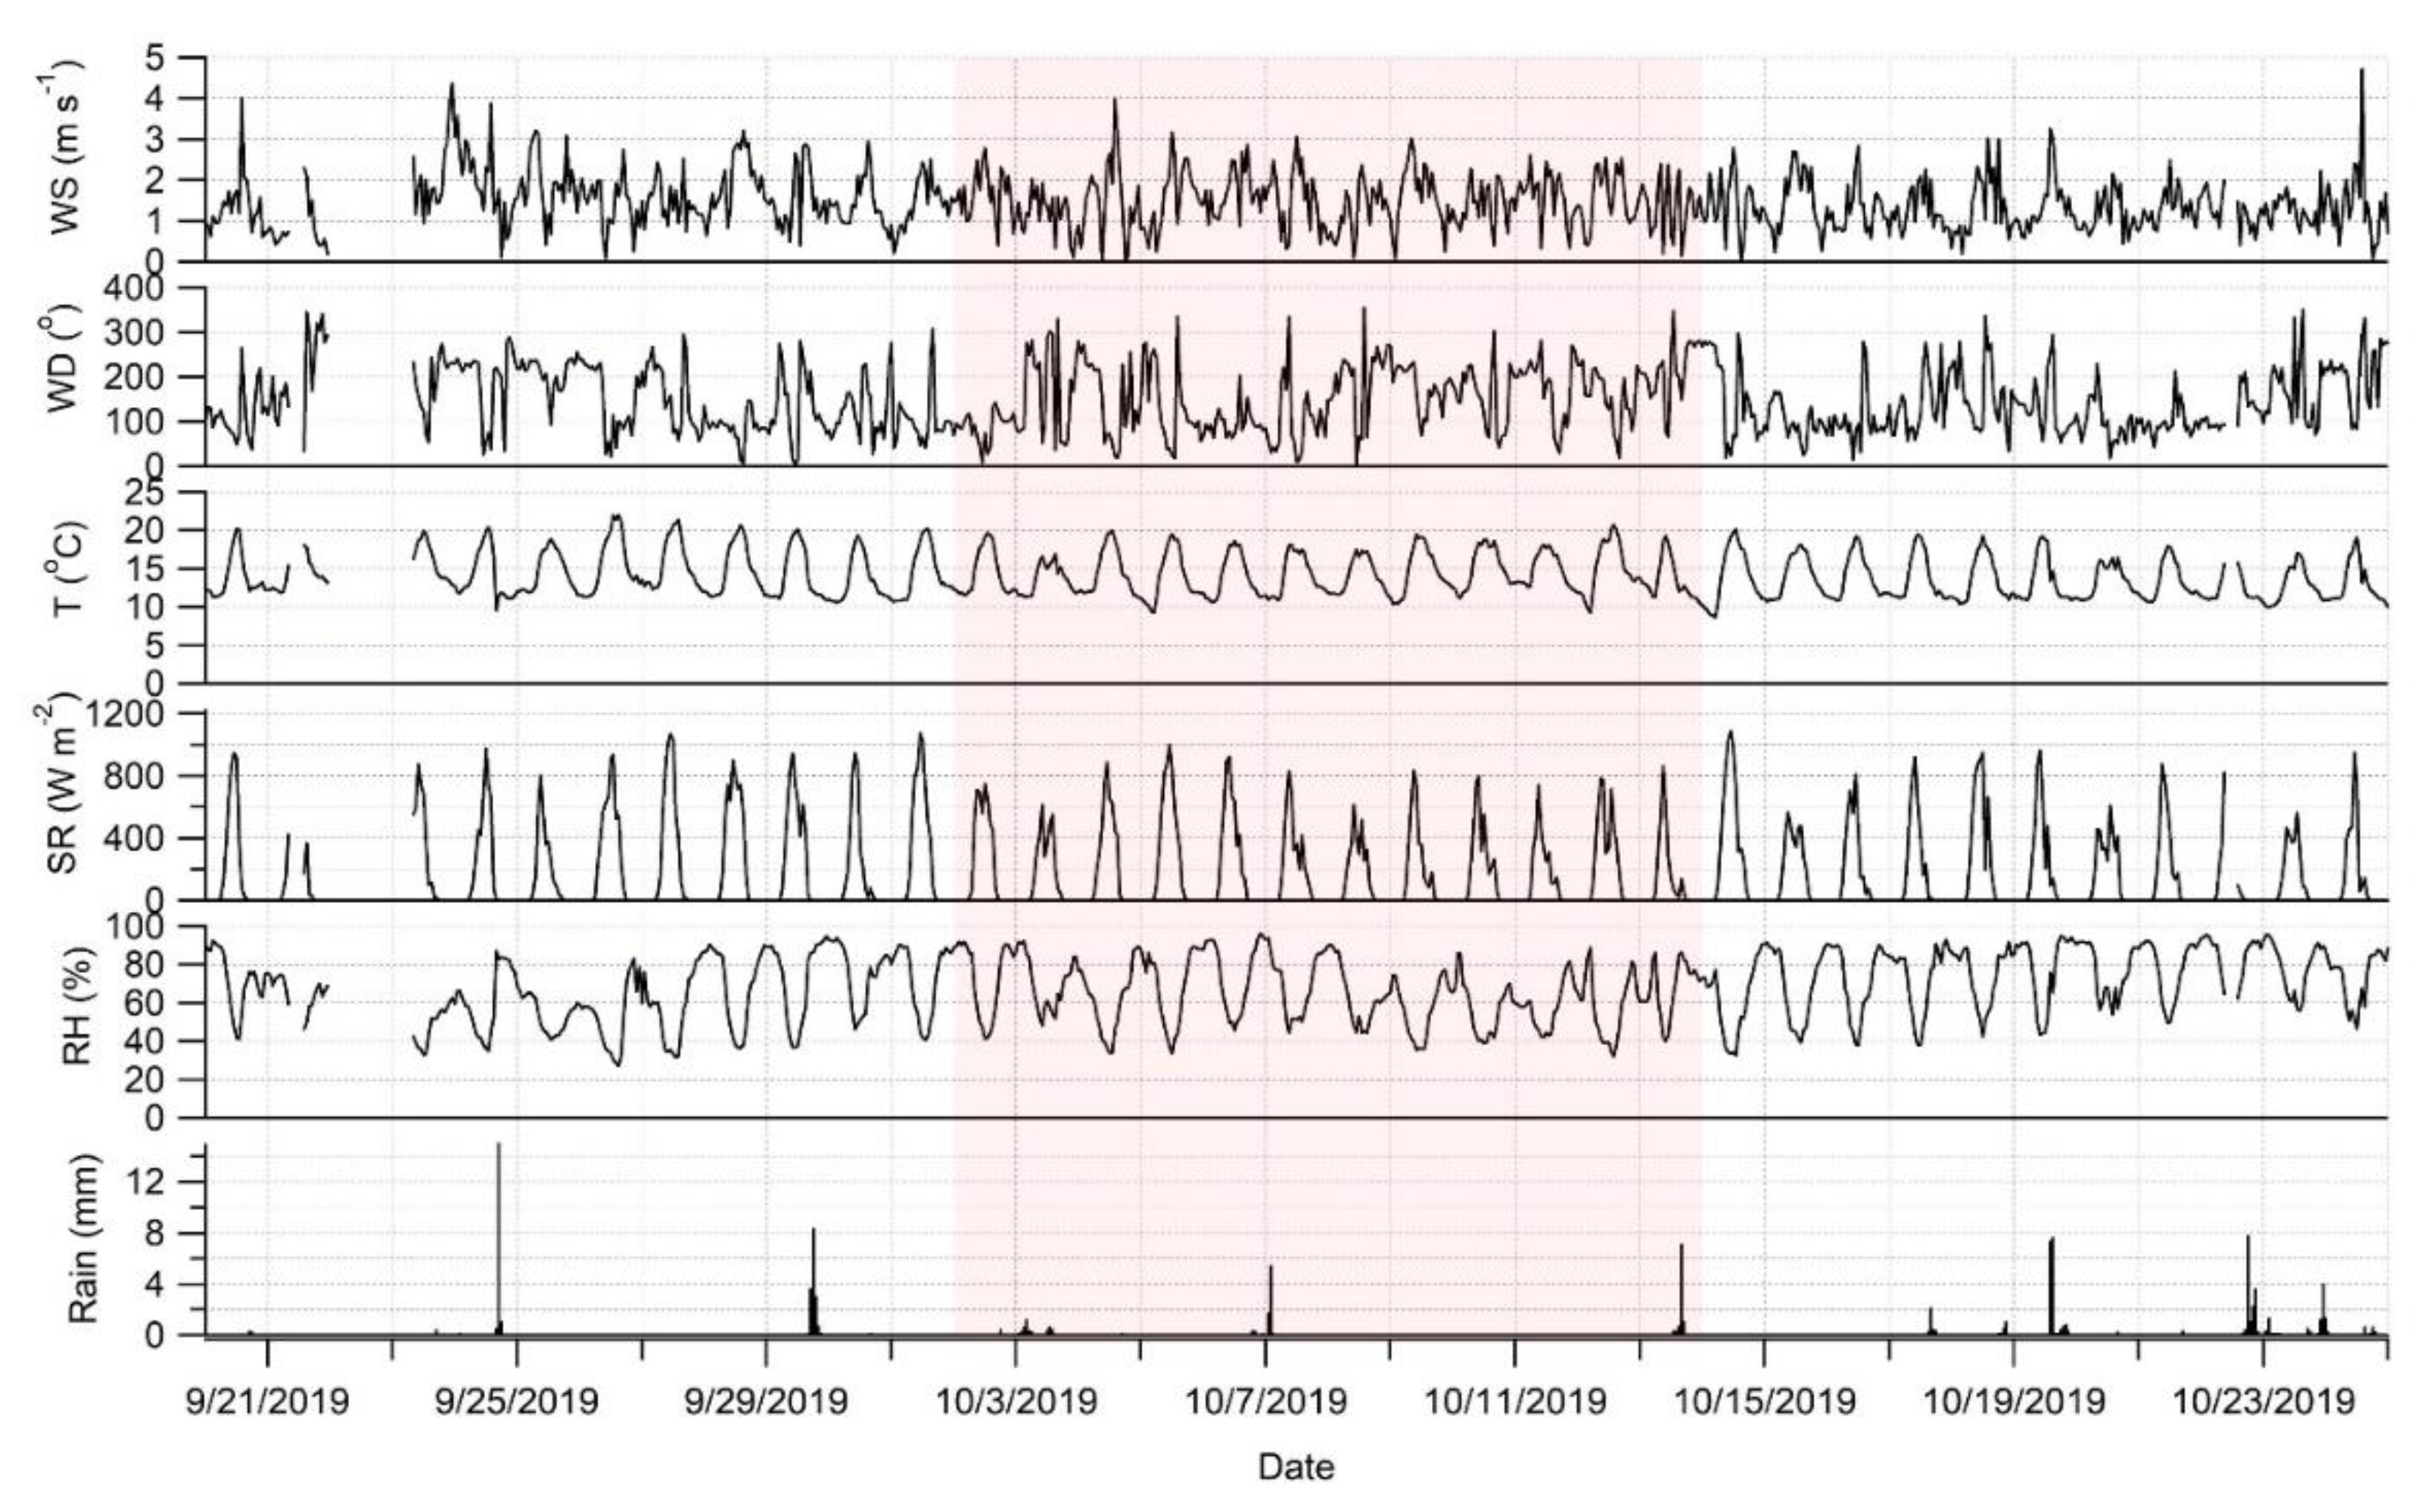
2.1. Study Sites, Data Analysis and Visualization

Geographically divided by the Andes mountains and the equator, Ecuador (17.3 million inhabitants) is the most densely populated South American country (71 people km−2) [26,27]. Due to a wide range of elevations influencing ecosystems, this region is known for its extremely high biodiversity. The Ecuadorian capital of Quito is positioned at an average elevation of 2850 m above sea level (m.a.s.l.) on the western branch of the Andes cordillera (Figure 1). It spreads over an assortment of heights, varying from the slopes of an active Pichincha volcano (4800 m.a.s.l.) towards the inter-Andean valleys (2300 m.a.s.l.). The change in elevation in the capital city is responsible for an array of precipitation-dependent microclimates [28]. Close to 3,000,000 people inhabit the metropolitan district of Quito (DMQ) [29]. This urban center is characterized by a rapidly growing motorized fleet of vehicles powered by poor-quality fossil fuels affecting air quality [30,31].
In this study, air quality changes due to the political protests in Quito were measured at seven sites of the environmental monitoring network of the Secretariat of the Environment of DMQ. The study sites are well distributed across the city (north to south): S1-Carapungo (elev. 2660 m.a.s.l, coord. 78°26′50″ W, 0°5′54″ S), S2-Cotocollao (elev. 2739 m.a.s.l, coord. 78°29′50″ W, 0°6′28″ S), S3-Belisario (elev. 2835 m.a.s.l, coord. 78°29′48″ W, 0°11′4.57″ S), S4-Centro (elev. 2820 m.a.s.l, coord. 78°30′36″ W, 0°13′12″ S), S5-Camal (elev. 2840 m.a.s.l, coord. 78°30′36″ W, 0°15′00″ S), S6-Guamani (elev. 3066 m.a.s.l., coord. 78°33′5″ W, 0°19′51″ S) and S7-Chillos (elev. 2453 m.a.s.l, coord. 78°27′36″ W, 0°18′00″ S) (Figure 1).
Air pollution and meteorological variables (Table A1, Appendix A) were sampled using the United States Environmental Protection Agency approved methods [32], described in detail in past publications [30]. Data from the ground-based sites were gathered from September 20 to 25 October 2019. This includes three 12-day periods: before (20 September 2019–1 October 2019), during (2 October 2019–13 October 2019) and after (14 October 2019–25 October 2019) the national strike of Ecuador. We believe that the S2-Cotocollao site had technical issues in measuring the NO2 concentrations during the study period, thus it was excluded from the NO2 analysis. The data for atmospheric variables were processed as 24-h averages and accumulation (rain only) for all seven study sites. In addition, 12-day statistics were processed for four main atmospheric gaseous pollutants: NO2, CO, O3 and SO2. For each pollutant, the concentration change in each site was computed as the mean percent difference between the 12-days before the strike and values measured during (and after) the strike (e.g., % change = (pre-strike average − strike average)/(pre-strike average) × 100%). The pre-strike period might be presumed as business-as-usual conditions, due to the normal anthropogenic activity. Then, from those, the average values and standard deviations for each pollutant were calculated for the whole of Quito. The accuracy of the inter-period comparative approach was measured through the root mean squared error (RMSE), as follows:
RMSE   = i = 1 N ( P r e d i c t i o n i O b s e r v a t i o n i ) 2 N
where “prediction” is the average concentration of the 12 days before the strike and “observation” stands for the hourly data on the same period of time. The performance of the inter-period comparison method is used as a benchmark to assess the reliability of the machine learning model to predict the pollution change.
Air quality is influenced by environmental conditions. Thus, six meteorological parameters (relative humidity, precipitation, temperature, atmospheric pressure, wind speed and wind direction) were included in the analysis. Those were sampled from the same monitoring sites using complete Vaisala WXT536 instrumentation, while a Kipp&Zonnen (Delft, The Netherlands) pyrometer was used to measure global solar radiation. For hourly 24 h and 12-day data analysis and visualization, Microsoft Excel, Igor Pro 6.0 (Wavemetrics Inc., Nimbus, Portland) and QGIS 3.20.2 software were utilized. QGIS 3.20.2 software was utilized for spatial imaging of pollution, using the EPSG.4326 (WGS84) coordinate system (available at https://qgis.org/downloads/, accessed on 20 October 2021). Public access data was used for: country limits from Geographic Military Institute data (retrieved from https://sni.gob.ec/geoservicios-ecuador, accessed on 25 October 2021); for city limits urban growth of Quito (retrieved from http://gobiernoabierto.quito.gob.ec/?page_id=1122, accessed on 11 July 2021); and for the monitoring sites (retrieved from http://www.quitoambiente.gob.ec/index.php/generalidades, accessed on 20 October 2021). Roadblock and barricade sites were retrieved from Ecuadorian newscasts (available at https://www.primicias.ec/noticias/sociedad/quito-manifestaciones-vias/, https://www.elcomercio.com/actualidad/bloqueos-escombros-personas-vias-quito.html, accessed on 11 July 2021) and Satellite XYZ Tiles service from Google (available at http://mt0.google.com/vt/lyrs=s&hl=en&x={x}&y={y}&z={z}, accessed on 11 July 2021). Inverse distance weighting (distance coefficient p = 2; grid resolution 1 m) was used for city data interpolation between the study sites.

2.2. Machine Learning Modelling

The impact of the national protest on the concentrations of NO2, SO2, CO and O3 was quantified through a machine learning (ML) approach. A model was trained to predict business-as-usual concentrations of the pollutants from hourly measurements of meteorological and temporal variables. Due to the nonlinear relationships between meteorology and air quality, we selected a nonparametric algorithm called gradient boosting machine (GBM). It is a state-of-the-art decision tree-based ensemble method (Friedman, 2001). As explained in our previous study on the strike effect on the concentration of fine particulate matter [15], we applied a meteorology-normalized technique [33] to get a prediction that considers the real climatic conditions during the unusual anthropogenic event.
The meteorology was analysed through seven features: solar radiation, temperature, pressure, relative humidity, precipitation, wind direction and wind speed. The temporal attributes were: hour, weekday, year day, and trend (date index). The dataset was split into a training set (1 January 2015–1 April 2019) and a testing set (2 April 2019–1 October 2019). Therefore, the performance of the models was tested six months prior to the protests. The accuracy of the models was measured through the coefficient of determination (R2) and the root mean squared error (RMSE) (see Equation (1)). In the latter, “prediction” values are provided by the ML model outputs for the 12 days before the strike, while “observation” are observational data during the same period. This RMSE for the ML model will be compared to the RMSE for the inter-period method for each pollutant, in order to estimate the performance of the modeling approach in relation to the baseline (i.e., inter-period accuracy).
GBM builds an ensemble of weak and shallow consecutive trees with each tree learning and improving the previous one. The algorithm sequentially adds new models to the ensemble. At each iteration, a new weak base-learner model is trained from the error of the entire learned ensemble. A model is considered weak if its error rate is just slightly better than random guessing. In this boosting method, a weak model is built at each iterative sequence, in order to improve the remaining errors. The generalization of the algorithm is a stage-wise additive model of n individual regression trees as shown in Equation (2).
f ( x ) = n = 1 N f n ( x )
For each pollutant, the concentration change was computed from the mean difference between ML-based business-as-usual and the actual value measured during or after the strike (e.g., % change = (BAU − observed)/(BAU) × 100%). Then, from those, the average values and standard deviations for each pollutant were calculated for the whole of Quito. The GBM models were implemented in R, using the H2O package. The parameters of the library were tuned for stopping the training (i.e., increment in the number of trees) if ten successive trees did not reduce the prediction error.

3. Results and Discussion

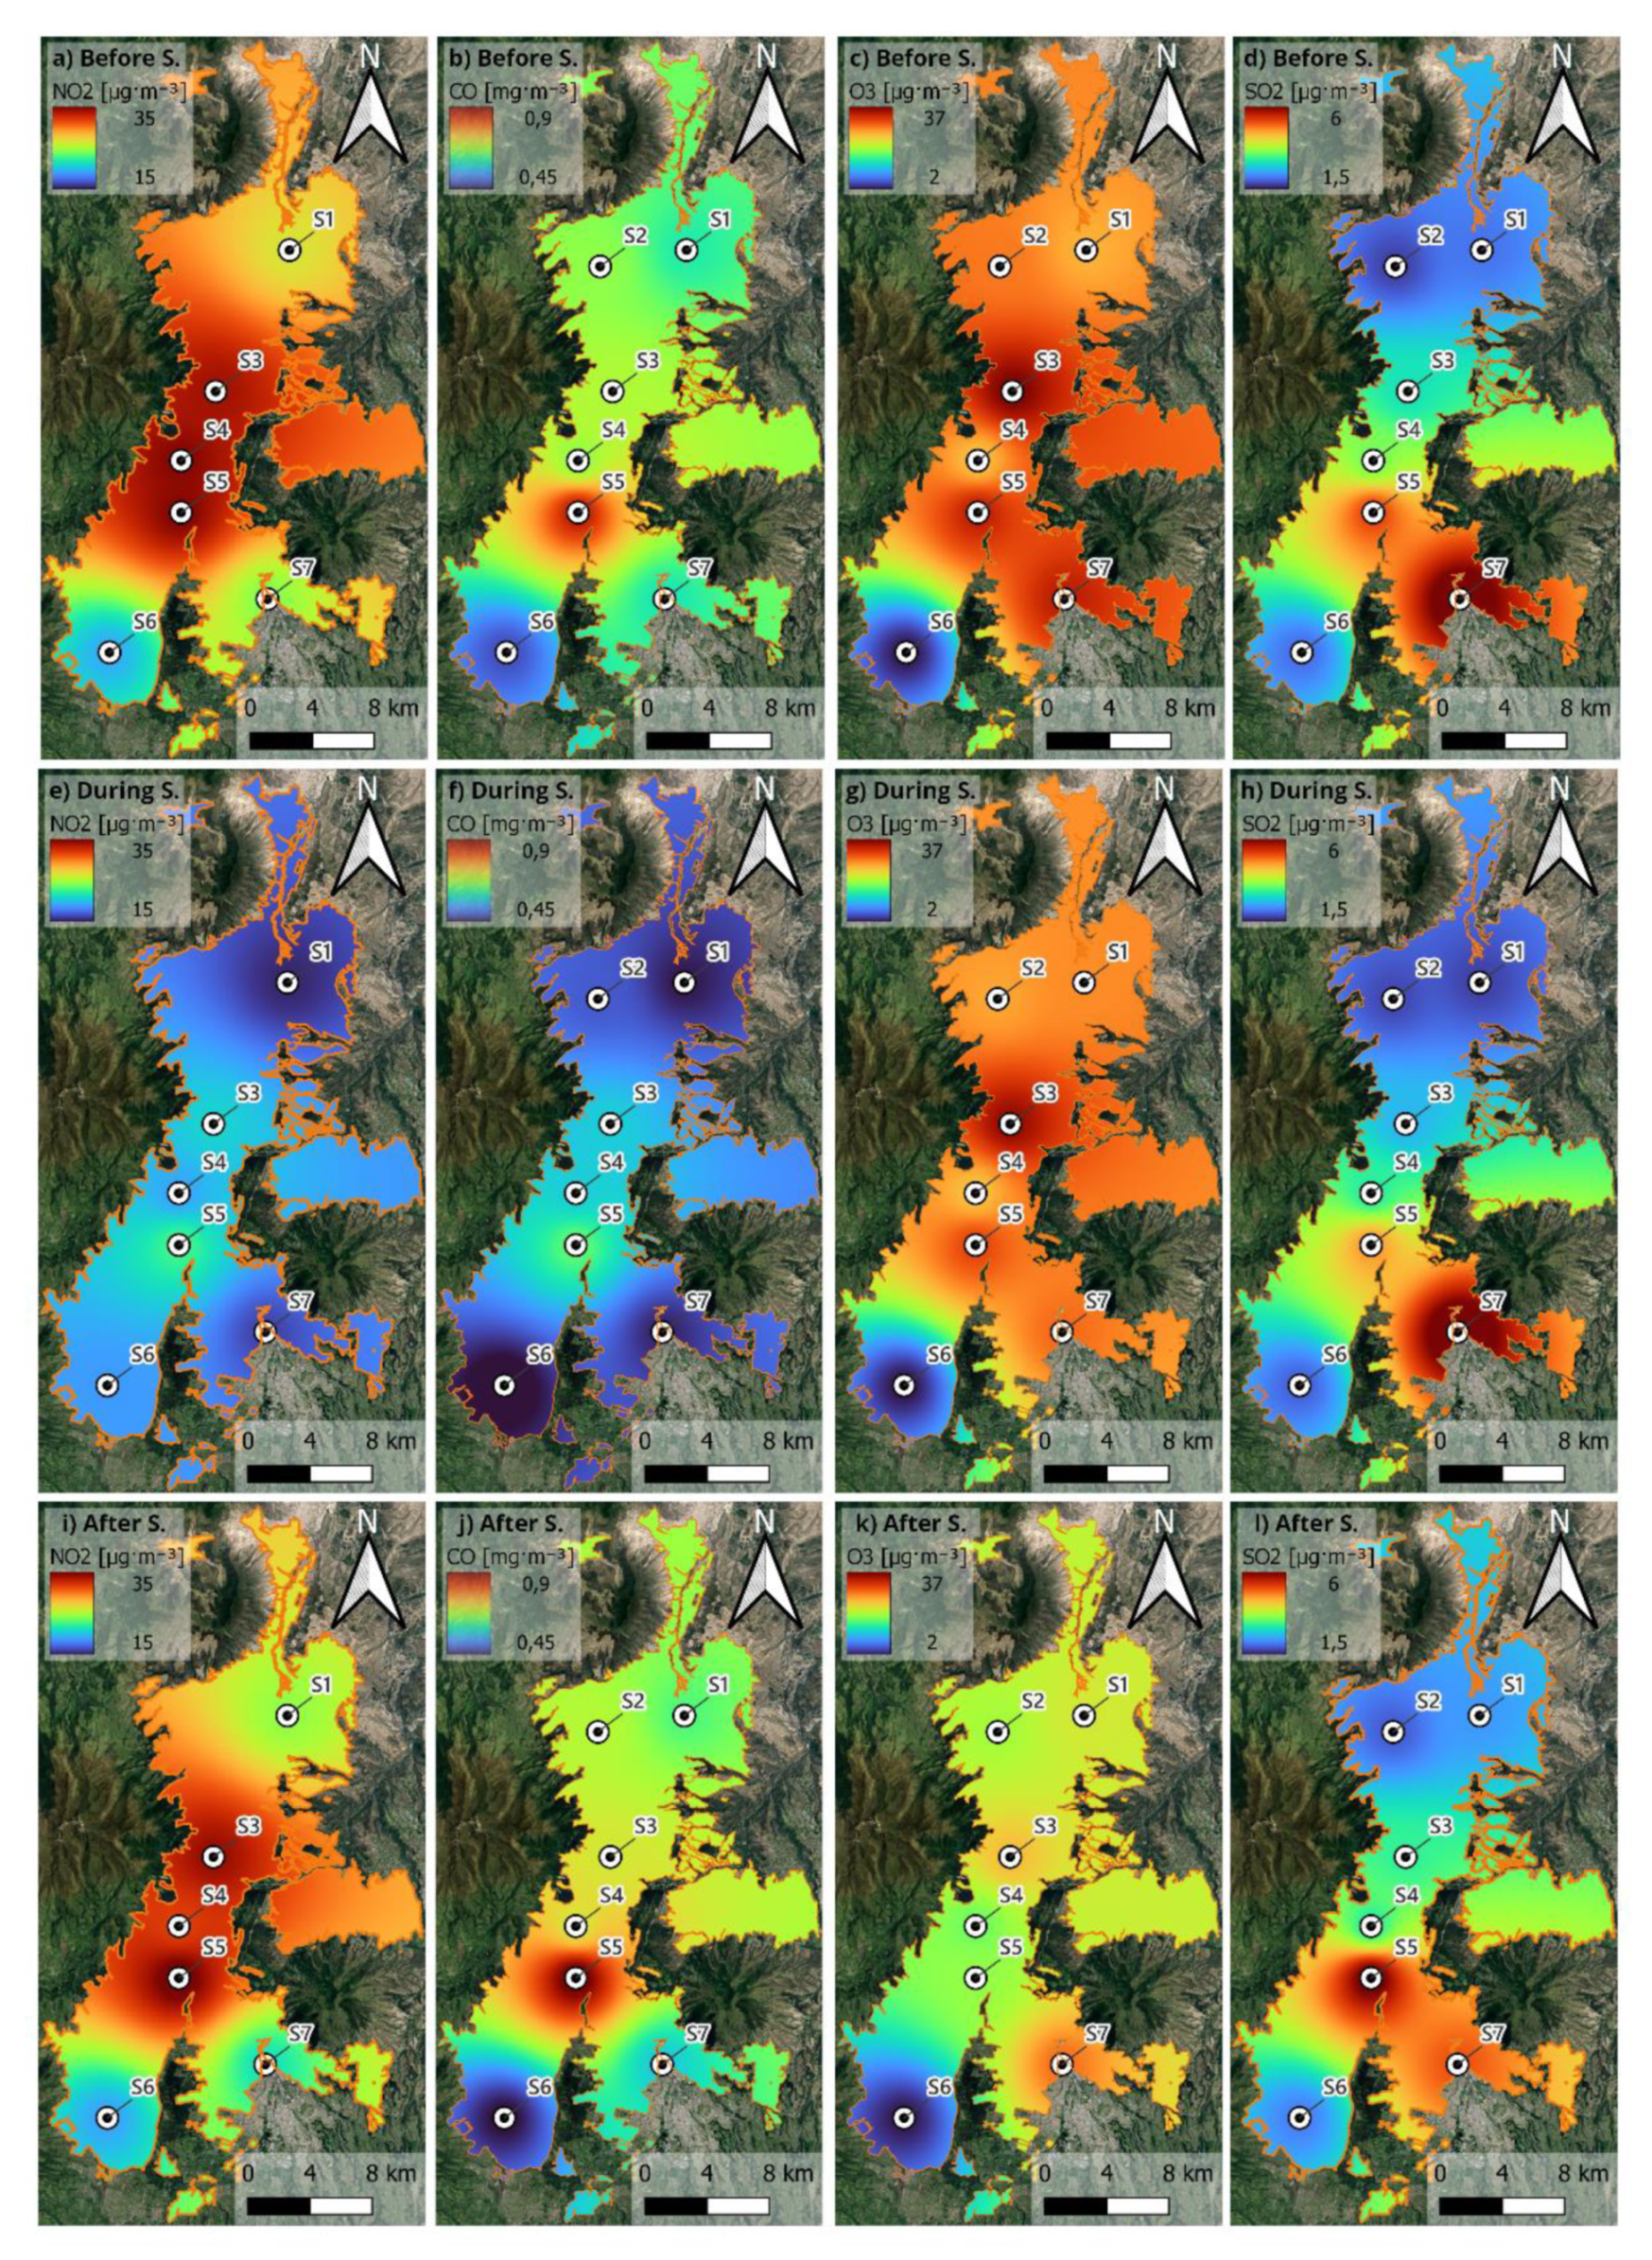
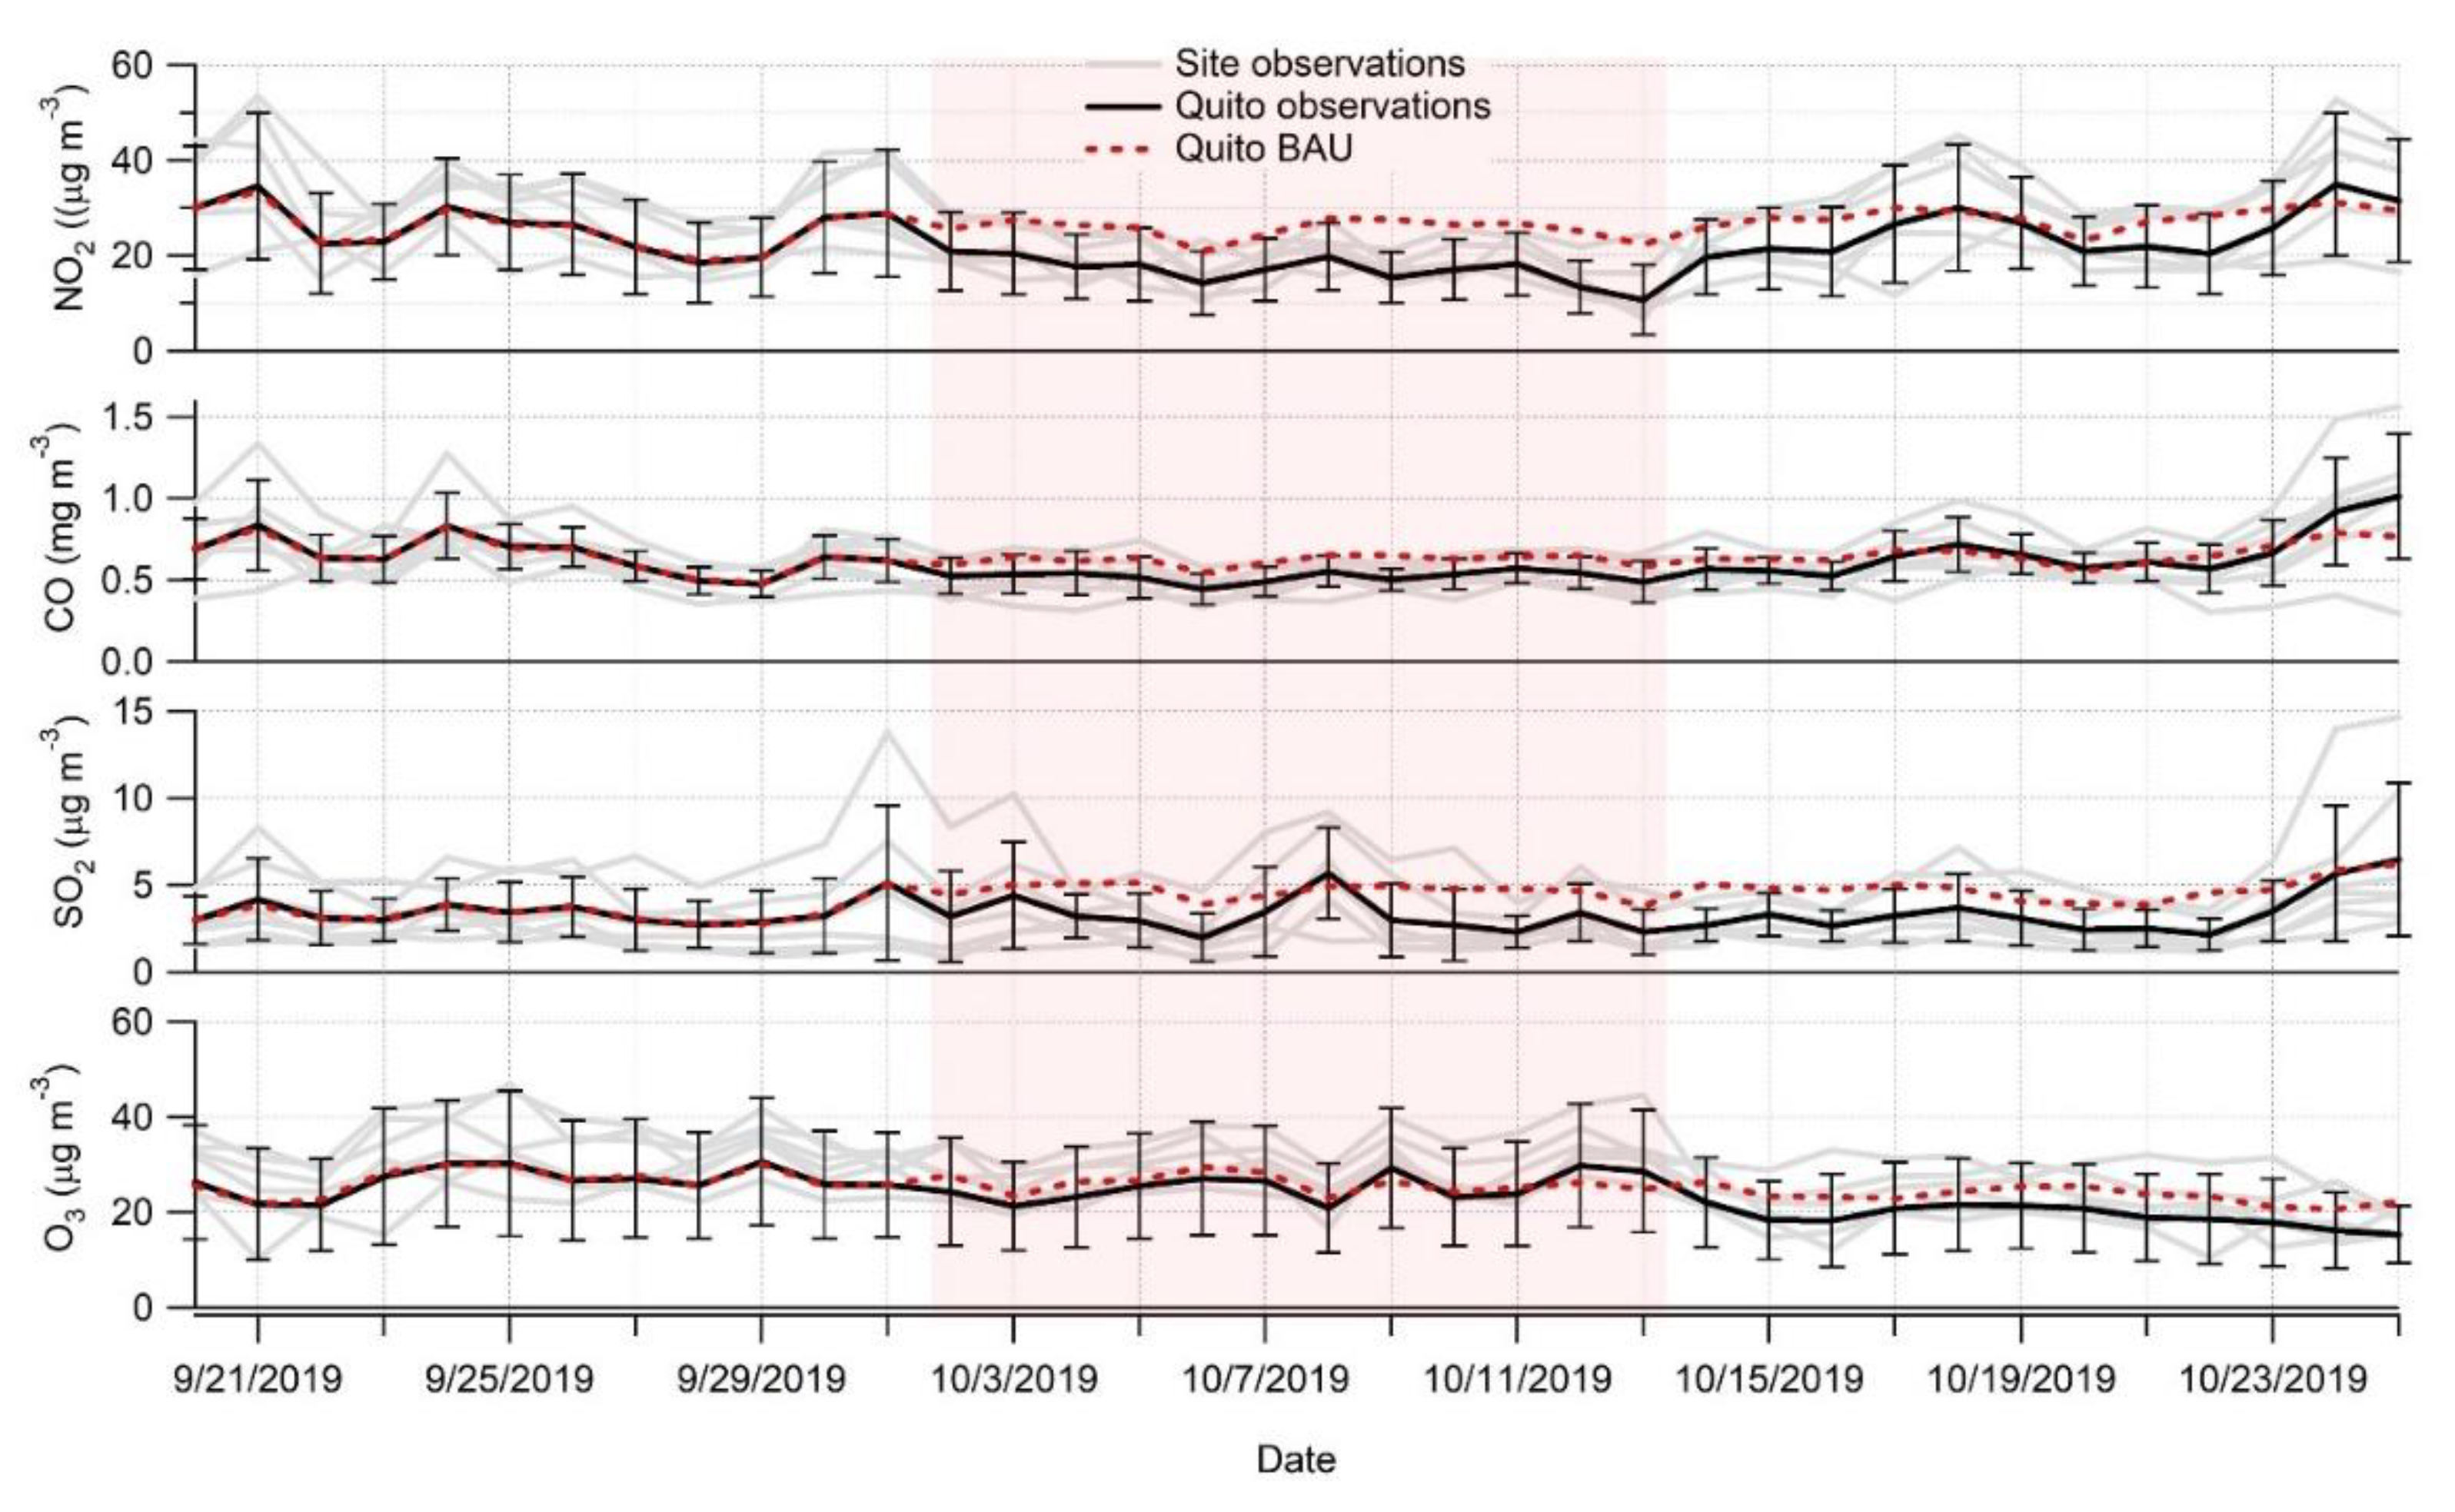
3.1. Inter-Period Observational Approach

Ground-based observations are reported from seven well-distributed monitoring sites around the city. To better visualize the evolution of spatial observational data, 12-day average data inverse distance weighting images for pre-strike (20 September 2019–1 October 2019), during the strike (2 October 2019–13 October 2019) and post-strike (14 October 2019–25 October 2019) are presented in Figure 2. Numerical analysis of percentage changes is also presented in Table 1. It can be seen that CO (−19.85 ± 6.67%) and NO2 (−32.36 ± 15.38%) concentrations showed a much higher reduction during the strike when compared to the 12-day average before the strike (see Table 1 and Figure 2a,b,e,f). Meanwhile, O3 and SO2 showed much smaller decreases, −5.18 ± 7.32% and −7.20 ± 7.48%, respectively (see Table 1 and Figure 2c,d,g,h). For concentrations of SO2, there is a visible reduction in most of the sites (−7.2 ± 7.48%), except for the two sites showing an increase in SO2, one of them near the thermoelectric power plant in S7-Chillos (Figure 2h) showing no changes in electricity production. We note that the latter site reaches the highest SO2 concentrations in the city, which is due to crude oil and poor-quality diesel fuel burned at the plant.
Similar results were observed in other studies carried out during strike events involving a suspension of motorized fleet circulation. A significant reduction in CO concentrations was observed in the city of Hyderabad in India. Explicitly, a CO level reduction of −40% was registered in 2009 [34] and 20% in 2010 [21]. In a study in Sao Paulo, Brazil, an even higher reduction, −67%, of CO levels was reported [18]. A reduction of NO2 concentrations was also observed in Sao Paulo ranging from −7% [18] to −55.5% [35]. As the findings of our study, low reductions in SO2 (−11%) were reported in another study in Sao Paulo [36]. On the other hand, during the truck strike event in 2009 in Hyderabad [34] a significant reduction in O3 (−50%) was observed, while in Sao Paulo, the O3 concentration reduction was lower (−16%) although still superior to our findings [18].
As expected, after the strike ended, most of the gaseous criteria pollutants returned to the pre-strike levels (Figure 2i–l and Table 1). When NO2 concentrations still showed a slight reduction (−2.79 ± 5.82%), CO and SO2 increased a little by +1.62 ± 5.83% and +3.29 ± 13.56%, respectively (Table 1). These overall fluctuations, however, are quite negligible from the pre-strike scenario, thus suggesting a return of human activities to normal levels and a return of anthropogenic emissions to the urban air shed. Some hot spots in the city can be pinpointed. For example, for NO2 concentrations, the central part of the city flairs back up post-strike (see Figure 2i), almost indistinguishably as before the strike (Figure 2a). This indicates a return of the traffic to the city streets and roads [37,38]. The northwestern part of the city stays less polluted, where most of the urban sprawl to residential, less dense areas is found. A similar effect can be observed for the combustion-related CO concentrations that returned to the industrial part of the city after the strike (Figure 2j).
Compared to the pre-strike levels (Figure 2c), the concentrations of O3 decreased during (−5.18 ± 7.32%) and after the strike (−25.77 ± 12.01%) (Figure 2g,k). As important as meteorological conditions are to ozone formation and accumulation in the ambient air, a key question is whether the reduction in primary urban emissions, due to activities that were paralyzed by the strike, had an impact on the levels of ozone in Quito. We propose that a shift in emission proportions had an impact in terms of ozone production rates, mainly during those days when solar radiation was more available (Figure A1, Appendix A). As demonstrated in previous work [39], during the strict COVID-19 lockdown, there was a substantial decrease in traffic emissions in Quito, and thus NOx, comparable to the strike (Figure 2e,f). As a result, the local atmospheric chemistry shifted from a generally NOx-saturated regime into conditions in which free radicals [OH (hydroxyl) and HO2 (hydroperoxyl)]—the core of the ozone production chemistry—were less depleted to form subspecies such as nitric acid and, instead, produced additional ozone per unit time (ozone production rates, ppbv h−1). However, increased rates of ozone production were counterbalanced by meteorological conditions, as the strict lockdown also coincided with a period of increased cloudiness and rain. Such conditions had the effect of cleaning the atmosphere. Therefore, even though the strike did not last very long, it shares similar traits to the COVID-19 lockdown from the perspective that primary emissions decreased and meteorology was similar.
Finally, for concentrations of SO2, during the strike (−7.2 ± 7.48%) and post-strike (+3.29 ± 13.56%), the change is much smaller, with sustained peaks in the southern valley of the city, where a thermoelectric plant is located (Figure 2d,h,l). This indicates there were close to no changes in power generation during the strike. However, further away from the power plant, an impact of reduced city traffic circulation can be observed in almost all the sites during the strike.

3.2. Machine Learning (ML) Approach

As the straightforward observational data analysis of the inter-period comparison may be skewed by variation of meteorological conditions, it is important to estimate the pollution changes using a business-as-usual scenario modeled using the ML technique [25]. Figure 3 shows observed and modeled trace gas concentrations during the study period, including three 12-day periods of pre-strike (20 September 2019–1 October 2019), during the strike (2 October 2019–13 October 2019) and post-strike (14 October 2019–25 October 2019) averaged over the whole city of Quito (black lines). The ML modeled BAU conditions (red broken line) show a very good agreement with the observed data before the strike, suggesting a good model performance (see Table A2, Appendix A). However, when the national strike takes place, the observations, as expected, are clearly lower than the BAU concentrations (Figure 3). Table 2 summarizes the all-site and overall Quito modeled percentage changes for each pollutant due to the strike activities using the machine learning approach. Some sites were more affected by the pollution changes than others, especially the city center, which was the epicenter of the protest. Overall, it can be seen that the highest reduction from the BAU scenario during the strike is for NO2 (−31.53 ± 17.22%) (Table 1). SO2 (−17.65 ± 27.38%) and CO (−15.55 ± 6.64%) also show a significant reduction during the strike. These statistics confirm the importance of the suspension of human activities, especially the circulation of motorized traffic. This has been previously proven globally during the COVID-19 pandemic [25,40,41,42,43]. While the primary pollutants show a significant reduction due to the reduction in anthropogenic activities during the national strike, O3 shows only a slight reduction (−6.82 ± 15.11%) in its concentrations. The latter is due to a potential shift from a NOx-saturated regime into a more NOx-limited regime during the event of national transportation protest although more research is needed to better understand ozone.
Furthermore, even up to 10 days after the strike, the pollution levels took time to return to BAU conditions (Figure 3), varying from −21.49 ± 14.72% for O3 to −12.43 ± 6.25% for NO2 and −9.71 ± 32.25% for SO2 as an overall reduction (Table 2). This is an interesting observation, showing an extension of the effect of the violent strikes on anthropogenic activities even days after the event was over.

3.3. Assessment of the Methods

While both methods show an overall reduction in the concentrations of most gaseous pollutants during the social strike in the Ecuadorian capital, some statistics vary. During the strike, both methods show a significant reduction in the concentrations of NO2 (inter-period: −32.36 ± 15.38% vs. ML model: −31.53 ± 17.22%) and CO (inter-period: −19.85 ± 6.67 vs. ML model: −15.55 ± 6.64%). In both cases, the ML method is more conservative. Again, the two methods agree a smaller reduction is observed for O3 (inter-period: −5.18 ± 7.32% vs. ML model: −6.82 ± 15.11%). These agreements suggest that both approaches are able to estimate equally well the impact of the strike on urban gaseous pollution. This might be due to the fact that the comparison of observations two weeks before the unusual event is within a short enough time to be as good as an ML modeling approach. Meanwhile, SO2 concentrations show a much larger reduction using the ML model (−17.65 ± 27.38%) when compared to the inter-period analysis (−7.20 ± 7.48%).
After the strike, the only pollutant that both methods fully agree on is a continuous reduction of O3 concentrations (inter-period: −25.77 ± 12.01% vs. ML model: −21.49 ± 14.72%). Again, the ML model is more conservative, suggesting a possible overestimation of the observational approach. The other three pollutants show a continuous reduction in concentrations using the ML model approach (NO2: −12.43 ± 6.25%; CO: −4.29 ± 6.50%; SO2: −9.71 ± 32.25%) and nearly no changes using the inter-period analysis (NO2: −2.79 ± 5.82%; CO: 1.62 ± 5.83%; SO2: 3.29 ± 13.56%). This again might propose the importance of using an ML BAU condition prediction to better estimate the extended effect of the protest on urban air quality.
In order to confirm which of the two approaches is more accurate, a method performance evaluation is presented in Table 3. It can be observed that the ML model, using the GBM method, demonstrates better performance in RMSE indicators in all cases except for a slightly worse performance on SO2. For this latter pollutant, the observational inter-period analysis tends to overperform the GBM (except the northern suburban S2-Cotocollao site), even if the difference is minuscule. This result is consistent with previous studies showing a lower performance of the models to predict SO2 than other pollutants [25,33,44]. It suggests that the ML model should integrate additional features to improve the prediction of this particular contaminant [45]. For instance, gas-particle interaction must be taken into consideration in predicting this pollutant [46]. While the meteorology has been accounted for, the PM levels were not considered in the ML prediction for SO2. A previous study [15] showed large spikes in PM2.5 concentrations during the strike (beyond the BAU conditions) in most of the sites. Some exceptions were observed in the northern sites (S2-Cotocollao and S3-Belisario). This might help explain a poorer ML performance to predict this pollutant, since the unusual PM behavior, due to barricade burning, is not taken into account.
Opposite to the SO2, the RMSE for NO2, CO and O3 computed for the ML modeling approach are considerably smaller than the inter-period method. This outcome suggests that the machine learning method based on weather normalization tends to be more reliable than a simple inter-period comparison to estimate the effect of protests on urban gaseous pollution. However, we do not notice a large difference in the estimate of concentration change between the two methods (see Table 1 and Table 2). This apparent contradiction can be explained by the fact that the protest occurred in quite a short period of time, for which the environmental condition (e.g., seasonal variation) did not change significantly. It suggests that a simple averaging approach can provide a fair estimate of pollution change on a few weeks of unchanged meteorology, but might have more complications to account for an event that lasts over several months, such as the COVID-19 lockdown [25].
Ultimately, besides assessing the impact of a protest on urban air quality, the general purpose of this study was to propose a machine learning approach to quantify the effect of an unusual event on urban pollution. This was done by investigating the pollution concentrations during the business-as-usual conditions in an absence of a strike. There are different ways to calculate the BAU conditions. In recent studies focused on the COVID-19 lockdown impact on air pollution, the average values on the weeks [47] or the years [48] preceding the event are used as an approximation of the BAU. A limitation of the latter technique is the fact that it does not consider the meteorological conditions, which can significantly modify the assumed BAU pollution concentrations. In this study, we used the prior period averaging technique, but also provided a more robust estimation of the national protest on urban air pollution by developing a meteorology-normalized ML model [25,43] that takes into account the weather conditions during, and even after, the strike. The performance of the GBM method, compared to the averaging technique, is a more powerful method for predicting the true and lasting effect of an unusual event such as a protest on urban air quality.
This unique investigation offers an example from South America, where the protests often get violent and involve a strategy of burning toxic barricade objects, covering the city in smoke. However, we show that BAU emissions from traffic in this high elevation city are larger than those from protest activities. Therefore, this study can serve as a valuable lesson to help better estimate the future changes in pollution due to changes in human activities, such as pandemics, protests, or strikes anywhere on the planet. In addition, it can serve as a call for urban planning strategies in developing countries to steer the city transportation problems towards greener and more sustainable solutions.

4. Conclusions

This study successfully employs two different approaches to estimate the effect of a national strike of 2019 in Ecuador on concentrations of urban trace gases (NO2, CO, O3 and SO2): (i) observational inter-period analysis of air quality differences between the pre-strike period versus the periods during and post-strike in the capital city; and (ii) comparing a machine learning (ML) gradient boosting machine (GBM) modeled business-as-usual (BAU) conditions in Quito with the observed concentrations of atmospheric gaseous pollutants. Unexpectedly, the two approaches agree closely for urban NO2 (ML: −31.5 ± %, inter-period: −32.36 ± 15.39%), CO (ML: −15.55 ± %, inter-period: −19.85 ± 6.67%) and O3 (ML: −6.82 ± %, inter-period: −5.18 ± 7.32%) concentration changes during the strike. The ML approach overestimates the overall reduction of city SO2 concentrations (ML: −17.65 ± %, inter-period: −7.20 ± 7.48%) during the national protest, which might show a limitation of this method on predicting SO2 using selected meteorological parameters. We also estimate the effect of a national strike up to 12-days after the protest is over. While both approaches agree on a continuous decrease in O3 pollution, suggesting the changes in precursor abundance even post-strike, they could not be more different for the other three gaseous pollutants. The observation-only inter-period approach underestimates the long-lasting effect on NO2 reduction (ML: −12.43 ± 6.25%, inter-period: −2.79 ± 5.82%) and disagrees on the protest effects on CO (ML: −4.29 ± 6.50%, inter-period: 1.62 ± 5.83%) and SO2 (ML: −9.71 ± 32.25%, inter-period: 3.29 ± 13.56%) after the protest ended.
We conclude that overall, the GBM model is more robust than the inter-period comparison method for predicting the true effect of an unusual event such as a protest on urban air quality. Nevertheless, some contaminants are more difficult to predict than others. This is the case of SO2, for which the prediction accuracy is not different than the baseline (i.e., the inter-period method). For this latter gas, better performance could be expected by considering additional features in the ML model (e.g., PM). This unique study presents an example from frequently violent protests, involving burning toxic barricade objects to block transport circulation, from South America. We show that the emissions from those burnings have less impact on atmospheric pollution at an urban scale than the footprint of “normal” city traffic. It can serve as a valuable tool to help better estimate the future changes in pollution due to changes in human activities, such as pandemics, protests or strikes.

Author Contributions

Conceptualization, R.Z. and Y.R.; methodology, R.Z. and Y.R.; software, R.Z., M.B. and Y.R.; validation, R.Z., Y.R. and K.A.; formal analysis, R.Z. and Y.R.; investigation, R.Z., Y.R., S.B.-B. and D.M.; resources, R.Z., Y.R., S.B.-B., D.M. and V.D.; data curation, R.Z., V.D. and Y.R.; writing—original draft preparation, R.Z.; writing—review and editing, R.Z., Y.R. and K.A.; visualization, R.Z., Y.R. and M.B.; supervision, R.Z.; project administration, R.Z.; funding acquisition, R.Z., S.B.-B. and D.M. All authors have read and agreed to the published version of the manuscript.

Funding

This research received funding from Universidad de Las Americas, Ecuador, for the funding of AMB.RZ.21.03 project and CEDIA (Corporación Ecuatoriana para el Desarrollo de la Investigación y la Academia) for the funding of CEPRA-XV-2021-018 project.

Institutional Review Board Statement

Not applicable.

Informed Consent Statement

Not applicable.

Data Availability Statement

The data was acquired from the Secretariat of the environment at http://datos.quitoambiente.gob.ec/descarga.html (accessed on 20 October 2021).

Acknowledgments

We would like to thank Maria Cazorla at Universidad San Francisco de Quito, Instituto de Investigaciones Atmosféricas, Quito, Ecuador, for her help with the interpretation of ozone trends.

Conflicts of Interest

The authors declare no conflict of interest. The funders had no role in the design of the study; in the collection, analyses, or interpretation of data; in the writing of the manuscript, or in the decision to publish the results.

Appendix A

Figure A1. Meteorological conditions in the center of Quito (S4-Centro) prior, during (red shaded area) and after the national strike of 2019 in Ecuador.
Applsci 11 12083 g0a1
Table A1. Atmospheric parameters used in the study for the inter-period (I-P) (1 January 2015–10 January 2019) analysis and gradient boosting machine (GBM) (20 September 2019–25 October 2019) machine learning approach.
Data SetI-PGBM
COXX
NO2XX
SO2XX
O3XX
Solar radiationXX
TemperatureXX
Pressure X
Relative humidityXX
PrecipitationXX
Wind directionXX
Wind speedXX
Hour X
Weekday X
Year day X
Date trend X
Table A2. Model performance statistics for NO2, SO2, CO and O3 at seven different study sites and an overall mean for the city Quito, Ecuador.
NO2SO2COO3
R2RMSER2RMSER2RMSER2RMSE
S1-Cotocollao0.844.100.711.250.770.170.915.39
S2-Carapungo0.765.970.582.110.710.190.905.71
S3-Belisario0.746.210.482.270.780.180.896.64
S4-Centro0.746.500.572.430.740.220.905.55
S5-Camal0.727.020.644.380.740.250.896.82
S6-Guamani0.775.930.341.770.700.200.886.89
S7-Chillos0.686.000.436.830.770.130.887.77
Overall Mean0.755.960.533.010.740.190.896.40

References

  1. United States Environmental Protection Agency. Criteria Air Pollutants. 2021. Available online: https://www.epa.gov/criteria-air-pollutants (accessed on 3 April 2021).
  2. United Nation. UNDESA World Social Report 2020. Department of Economic and Social Affairs Social Inclusion, 2021. Available online: https://www.un.org/development/desa/dspd/world-social-report/2020-2.html (accessed on 3 April 2021).
  3. Shek, D.T.L. Protests in Hong Kong (2019–2020): A perspective based on quality of life and well-being. Appl. Res. Qual. Life 2020, 15, 619–635. [Google Scholar] [CrossRef] [Green Version]
  4. Ting, T. From ‘be water’ to ‘be fire’: Nascent smart mob and networked protests in Hong Kong. Soc. Mov. Stud. 2020, 19, 362–368. [Google Scholar] [CrossRef]
  5. Brimblecombe, P. Street protests and air pollution in Hong Kong. Environ. Monit. Assess. 2020, 192, 295. [Google Scholar] [CrossRef]
  6. Dettmer, J. 2019—A Year of Protest; Voice of America. 2019. Available online: https://www.voanews.com/europe/2019-year-protest (accessed on 20 September 2021).
  7. Cerna, D.C. La protesta feminista en México: La misoginia en el discurso institucional y en las redes sociodigitales. Rev. Mex. Cienc. Polit. Soc. 2020, 65, 177–205. [Google Scholar] [CrossRef]
  8. Rebón, J.; Encina, C.R. Revueltas en y contra el neoliberalismo. Argentina, 2001 y Chile, 2019. Sociedad 2020, 40, 157–173. [Google Scholar]
  9. Stefanoni, P. Qué pasa en Bolivia? Nueva Sociedad. 2019. Available online: https://nuso.org/articulo/Bolivia-Evo-Morales-Carlos-Mesa-elecciones/ (accessed on 23 February 2021).
  10. Chapula, A.E. Reelección Presidencial en Bolivia, 2005–2019; Universidad Autónoma de Guerrero: Chilpancingo de los Bravo, Mexico, 2020. [Google Scholar]
  11. Pinzón, É.R. Colombia 2020: La Movilización Social Como Oportunidad y Reflejo del Cambio; Analisis Fundacion Carolina, 2020; Available online: https://www.fundacioncarolina.es/wp-content/uploads/2020/01/AC-1.20.pdf (accessed on 16 December 2021).
  12. Bastos, S.; Andrade, S. Ecuador, octubre de 2019: Fue un movimiento de jóvenes, jóvenes indígenas y más. Encartes 2020, 3, 235–237. [Google Scholar] [CrossRef]
  13. Buben, J.; Radek, A.; Kouba, K. Nicaragua in 2019: The surprising resilience of authoritarianism in the aftermath of regime crisis. Rev. Cienc. Polít. 2020, 40, 431–455. [Google Scholar] [CrossRef]
  14. BBC News. Renuncia Manuel Merino: La Ola de Protestas en Perú que Dejó Dos Muertos y 100 Heridos y Culminó con la Dimisión del Presidente. Mundo, 2020. Available online: https://www.bbc.com/mundo/noticias-america-latina-54948270 (accessed on 20 September 2021).
  15. Zalakeviciute, R.; Alexandrino, K.; Mejia, D.; Bastidas, M.G.; Oleas, N.H.; Gabela, D.; Chau, P.N.; Bonilla-Bedoya, S.; Diaz, V.; Rybarczyk, Y. The effect of national protest in Ecuador on PM pollution. Sci. Rep. 2021, 11, 17591. [Google Scholar] [CrossRef] [PubMed]
  16. Franzosi, R. One hundred years of strike statistics: Methodological and theoretical issues in quantitative strike research. ILR Rev. 1989, 42, 348–362. [Google Scholar] [CrossRef]
  17. Ortiz, I.; Burke, S.; Berrada, M.; Cortes, H. World protests 2006–2013. In SSRN: Initiative for Policy Dialogue and Friedrich-Ebert-Stiftung New York Working Paper No. 2013; 2014; Available online: https://papers.ssrn.com/sol3/papers.cfm?abstract_id=2374098 (accessed on 20 September 2021).
  18. Chiquetto, J.B.; Alvim, D.S.; Rozante, J.R.; Faria, M.; Rozante, V.; Gobo, J.P.A. Impact of a truck Driver’s strike on air pollution levels in São Paulo. Atmos. Environ. 2021, 246, 118072. [Google Scholar] [CrossRef]
  19. Meinardi, S.; Nissenson, P.; Barletta, B.; Dabdub, D.; Rowland, F.S.; Blake, D.R. Influence of the public transportation system on the air quality of a major urban center. A case study: Milan, Italy. Atmos. Environ. 2008, 42, 7915–7923. [Google Scholar] [CrossRef] [Green Version]
  20. Basagaña, X.; Triguero-Mas, M.; Agis, D.; Perez, N.; Reche, C.; Alastuey, A.; Querol, X. Science of the total environment effect of public transport strikes on air pollution levels in Barcelona (Spain). Sci. Total Environ. 2018, 610–611, 1076–1082. [Google Scholar] [CrossRef]
  21. Mahalakshmi, D.V.; Sujatha, P.; Naidu, C.V.; Chowdary, V.M. Contribution of vehicular emission on urban air quality: Results from public strike in Hyderabad. Indian J. Radio Space Phys. 2014, 43, 340–348. [Google Scholar]
  22. Xiang, J.; Austin, E.; Gould, T.; Larson, T.; Shirai, J.; Liu, Y.; Marshall, J.; Seto, E. Impacts of the COVID-19 responses on traffic-related air pollution in a Northwestern US city. Sci. Total Environ. 2020, 747, 141325. [Google Scholar] [CrossRef]
  23. Giani, P.; Castruccio, S.; Anav, A.; Howard, D.; Hu, W.; Crippa, P. Short-term and long-term health impacts of air pollution reductions from COVID-19 lockdowns in China and Europe: A modelling study. Lancet Planet. Health 2020, 4, e474–e482. [Google Scholar] [CrossRef]
  24. Huang, L.; Liu, Z.; Li, H.; Wang, Y.; Li, Y.; Zhu, Y.; Gee Ooi, M.C.; An, J.; Shang, Y.; Zhang, D.; et al. The silver lining of COVID-19: Estimation of short-term health impacts due to lockdown in the Yangtze River Delta Region, China. GeoHealth 2020, 4, e2020GH000272. [Google Scholar] [CrossRef]
  25. Rybarczyk, Y.; Zalakeviciute, R. Assessing the COVID-19 impact on air quality: A machine learning approach, Geophys. Res. Lett. 2021, 48, e2020GL091202. [Google Scholar] [CrossRef]
  26. Instituto Nacional de Estadistica y Cencos. Datosmacro.com. Ecuador-Población; Expansion, 2019. Available online: https://datosmacro.expansion.com/demografia/poblacion/ecuador (accessed on 6 July 2021).
  27. Worldometer. Countries in South America by Population. 2021. Available online: https://www.worldometers.info/population/countries-in-south-america-by-population/ (accessed on 6 July 2021).
  28. Zalakeviciute, R.; López-Villada, J.; Rybarczyk, Y. Contrasted effects of relative humidity and precipitation on urban PM2.5 pollution in high elevation urban areas. Sustainability 2018, 10, 2064. [Google Scholar] [CrossRef] [Green Version]
  29. Instituto Nacional de Estadísticas y Censos (INEC). Proyecciones Poblacionales. Poblacion, 2013. Available online: https://web.archive.org/web/20131018060046/https://www.ecuadorencifras.gob.ec/proyecciones-poblacionales/ (accessed on 6 October 2021).
  30. Zalakeviciute, R.; Rybarczyk, Y.; Villada, J.L.; Suarez, M.V.D. Quantifying decade-long effects of fuel and traffic regulations on urban ambient PM2.5 pollution in a mid-size South American city. Nat. Sci. Rep. 2018, 9, 66–75. [Google Scholar]
  31. Zalakeviciute, R.; Bastidas, M.; Buenaño, A.; Rybarczyk, Y. A traffic-based method to predict and map urban air quality. Appl. Sci. 2020, 10, 2035. [Google Scholar] [CrossRef] [Green Version]
  32. Secretaría de Ambiente. Secretaria de Ambiente: Informe Final Inventario de Emisiones de Contaminantes Criterio; DMQ: Distrito Metropolitano de Quito, Ecuador, 2011; p. 53. [Google Scholar]
  33. Grange, S.K.; Carslaw, D.C.; Lewis, A.C.; Boleti, E.; Hueglin, C. Random forest meteorological normalisation models for Swiss PM10 trend analysis. Atmos. Chem. Phys. 2018, 18, 6223–6239. [Google Scholar] [CrossRef] [Green Version]
  34. Sharma, A.R.; Kharol, S.K.; Badarinath, K.V.S. Influence of vehicular traffic on urban air quality—A case study of Hyderabad, India. Transp. Res. Part. D 2010, 15, 154–159. [Google Scholar] [CrossRef]
  35. Debone, D.; Leirião, L.F.L.; Miraglia, S.G.E.K. Air quality and health impact assessment of a truckers’ strike in Sao Paulo state, Brazil: A case study. Urban. Clim. 2020, 34, 100687. [Google Scholar] [CrossRef]
  36. De Silva, D.C.E.; Marcusso, R.M.N.; Barbosa, C.G.G.; Gonçalves, F.L.T.; Cardoso, M.R.A. Air pollution and its impact on the concentration of airborne fungi in the megacity of São Paulo, Brazil. Heliyon 2020, 6, e05065. [Google Scholar] [CrossRef]
  37. European Commission. Air quality: Traffic Measures Could Effectively Reduce NO2 Concentrations by 40% in Europe’s Cities; The European Commission’s Science and Knowledge Service. 2019. Available online: https://ec.europa.eu/jrc/en/news/air-quality-traffic-measures-could-effectively-reduce-no2-concentrations-40-europe-s-cities (accessed on 7 February 2021).
  38. Pilecka, J.; Grinfelde, I.; Purmalis, O.; Burlakovs, J. Car transport intensity impact on heavy metal distribution in urban environment. IOP Conf. Ser. Earth Environ. Sci. 2020, 578, 12032. [Google Scholar] [CrossRef]
  39. Cazorla, M.; Herrera, E.; Palomeque, E.; Saud, N. What the COVID-19 lockdown revealed about photochemistry and ozone production in Quito, Ecuador. Atmos. Pollut. Res. 2021, 12, 124–133. [Google Scholar] [CrossRef]
  40. Wang, Y.; Yuan, Y.; Wang, Q.; Liu, C.; Zhi, Q.; Cao, J. Changes in air quality related to the control of coronavirus in China: Implications for traffic and industrial emissions. Sci. Total Environ. 2020, 731, 139133. [Google Scholar] [CrossRef]
  41. Bauwens, M.; Compernolle, S.; Stavrakou, T.; Muller, J.-F.; van Gent, J.; Eskes, H.; Levelt, P.F.; van der Veefkind, A.J.P.; Vlietinck, J.; Uy, H.; et al. Impact of coronavirus outbreak on NO2 pollution assessed using TROPOMI and OMI observations. Geophys. Res. Lett. 2020, 47, e2020GL087978. [Google Scholar] [CrossRef]
  42. Ding, J.; van der Veefkind, A.J.P.; Eskes, B.; Mijling, B.; Stavrakou, T.; van Geffen, J.H.M. NOx emissions reduction and rebound in China due to the COVID-19 crisis. Geophys. Res. Lett. 2020, 47, e2020GL089912. [Google Scholar] [CrossRef]
  43. Petetin, H.; Bowaldo, D.; Soret, A.; Guevara, M.; Jorba, O.; Serradell, K.; Garcia-Pando Perez, C. Meteorology-normalized impact of the COVID-19 lockdown upon NO2 pollution in Spain. Atmos. Chem. Phys. 2020, 20, 11119–11141. [Google Scholar] [CrossRef]
  44. Liu, F.; Wang, M.; Zheng, M. Effects of COVID-19 lockdown on global air quality and health. Sci. Total Environ. 2021, 755, 142533. [Google Scholar] [CrossRef] [PubMed]
  45. Maratea, A.; Petrosino, A.; Manzo, M. Extended Graph Backbone for Motif Analysis. In Proceedings of the 18th International Conference on Computer Systems and Technologies, Ruse, Bulgaria, 23–24 June 2017; pp. 36–43. [Google Scholar]
  46. Abián, M.; Millera, Á.; Bilbao, R.; Alzueta, M.U. Impact of SO2 on the formation of soot from ethylene pyrolysis. Fuel 2015, 159, 550–558. [Google Scholar] [CrossRef]
  47. Zalakeviciute, R.; Vasquez, R.; Bayas, D.; Buenano, A.; Mejia, D.; Zegarra, R.; Diaz, V.; Lamb, B. Drastic improvements in air quality in Ecuador during the COVID-19 outbreak. Aerosol Air Qual. Res. 2020, 20, 1783–1792. [Google Scholar] [CrossRef]
  48. Sokhi, R.S.; Singh, V.; Querol, X.; Finardi, S.; Targino, A.C.; de Fatima Andrade, M.; Pavlovic, R.; Garland, R.M.; Massague, J.; Kong, S.; et al. A global observational analysis to understand changes in air quality during exceptionally low anthropogenic emission conditions. Environ. Int. 2021, 157, 106818. [Google Scholar] [CrossRef] [PubMed]
Figure 1. Positioning of the study area in: (a) the South American continent; (b) Ecuador; and (c) study sites (black/white markers) in the urban area of Quito, Ecuador. Roadblocks during the national strike are indicated by red cross markers.
Applsci 11 12083 g001
Figure 2. Spatial variation of trace gas (NO2, CO, O3 and SO2) concentrations in Quito, Ecuador. The maps represent data averaged over 12-day periods of pre-strike (20 September 2019–1 October 2019), during the strike (2 October 2019–13 October 2019) and post-strike (14 October 2019–25 October 2019).
Applsci 11 12083 g002
Figure 3. Concentrations of trace gases (NO2, SO2, CO and O3) in Quito averaged (black solid line) over seven monitoring sites (grey shadow) during 12-day periods of pre-strike (20 September 2019–1 October 2019), during the strike (2 October 2019–13 October 2019) and post-strike (14 October 2019–25 October 2019). The red dotted line shows machine learning modeled business-as-usual (BAU) conditions for the city. Error bars show one standard deviation of the observed data.
Applsci 11 12083 g003
Table 1. An inter-period analysis of the 12-day period before the strike (20 September 2019–1 October 2019) comparison with pollutant concentration changes pre-strike (2 October 2019–13 October 2019) and post-strike (14 October 2019–25 October 2019). Negative values show consequential percent reduction of pollution, while positive values show an increase during or after the national strike. The color scale is based on a gradient color in red, yellow, and green. The greener is the cell, the higher is the pollution drop.
Inter-Period
Estimated Change
NO2COO3SO2
DuringAfterDuringAfterDuringAfterDuringAfter
S1-Carapungo−41.770.94−25.314.27.41−13.82−16.1412.57
S2-CotocollaoNDND−25.583.39−7.55−31.312.649.94
S3-Belisario−38.570.94−15.283.72−2.64−31.98−13.817.42
S4-Centro−44.89−8.51−12.847.060.04−29.42−10.91−11.24
S5-Camal−33.922.7−25.846.09−8.32−45.22−10.0218.15
S6-Guamani−2.41−1.3−10.63−8.33−11.11−14.07−4.165.68
S7-Chillos−32.63−11.54−23.47−4.81−14.07−14.571.99−19.46
Overall Mean−32.37−2.80−19.851.62−5.18−25.77−7.203.29
±15.39±5.82±6.67±5.83±7.32±12.01±7.48±13.56
Table 2. A machine learning modeling-based period comparisons: real data 12-day periods during (2 October 2019–13 October 2019) and after (14 October 2019–25 October 2019) the strike compared to the same periods modeled as business-as-usual conditions. Negative values show a pollution reduction from the BAU scenario, while positive values show an increase from the BAU scenario. The color scale is based on a gradient color in red, yellow, and green. The greener is the cell, the higher is the pollution drop.
ML Estimated
Change
NO2COO3SO2
DuringAfterDuringAfterDuringAfterDuringAfter
S1-Carapungo−32.55−6.73−10.500.67−17.07−30.97−24.194.92
S2-CotocollaoNDND−24.60−0.62−14.69−32.2928.4437.77
S3-Belisario−41.39−12.63−15.13−6.2312.43−9.39−35.99−15.13
S4-Centro−39.83−12.08−15.572.96−1.21−12.19−33.71−35.28
S5-Camal−40.64−13.88−18.45−14.725.14−25.16−21.91−21.45
S6-Guamani3.01−5.95−4.31−1.36−31.69−40.7511.2317.76
S7-Chillos−37.76−23.31−20.30−10.73−0.620.32−47.40−56.57
Overall Mean−31.53−12.43−15.55−4.29−6.82−21.49−17.65−9.71
±17.22±6.25±6.64±6.50±15.11±14.72±27.38±32.25
Table 3. Comparison of the performance between the two methods: gradient boosting machine (GBM) vs. inter-period analysis (I-P). The best accuracy (i.e., the lowest RMSE) is highlighted in yellow.
NO2 CO O3 SO2
GBMI-PGBMI-PGBMI-PGBMI-P
S1-Carapungo5.9714.010.190.335.7117.302.111.16
S2-CotocollaoNDND0.170.295.3922.211.251.32
S3-Belisario6.2116.670.180.336.6425.952.271.73
S4-Centro6.5016.860.220.265.5517.932.432.39
S5-Camal7.0214.250.250.436.8226.924.384.32
S6-Guamani5.939.900.200.276.8917.731.771.13
S7-Chillos6.0012.960.130.257.7727.076.835.34
Quito average6.2714.110.200.326.1721.342.372.01
Publisher’s Note: MDPI stays neutral with regard to jurisdictional claims in published maps and institutional affiliations.

