Article

Vision Transformer-Based Tailing Detection in Videos

Department of Computer Science and Engineering, Sogang University, Mapo-gu, Seoul 04107, Korea
*
Author to whom correspondence should be addressed.
Appl. Sci. 2021, 11(24), 11591; https://doi.org/10.3390/app112411591
Submission received: 28 October 2021 / Revised: 22 November 2021 / Accepted: 3 December 2021 / Published: 7 December 2021

Abstract

:
Tailing is defined as an event where a suspicious person follows someone closely. We define the problem of tailing detection from videos as an anomaly detection problem, where the goal is to find abnormalities in the walking pattern of the pedestrians (victim and follower). We, therefore, propose a modified Time-Series Vision Transformer (TSViT), a method for anomaly detection in video, specifically for tailing detection with a small dataset. We introduce an effective way to train TSViT with a small dataset by regularizing the prediction model. To do so, we first encode the spatial information of the pedestrians into 2D patterns and then pass them as tokens to the TSViT. Through a series of experiments, we show that the tailing detection on a small dataset using TSViT outperforms popular CNN-based architectures, as the CNN architectures tend to overfit with a small dataset of time-series images. We also show that when using time-series images, the performance of CNN-based architecture gradually drops, as the network depth is increased, to increase its capacity. On the other hand, a decreasing number of heads in Vision Transformer architecture shows good performance on time-series images, and the performance is further increased as the input resolution of the images is increased. Experimental results demonstrate that the TSViT performs better than the handcrafted rule-based method and CNN-based method for tailing detection. TSViT can be used in many applications for video anomaly detection, even with a small dataset.

1. Introduction

Tailing is a situation in which one pedestrian follows another pedestrian in the same direction for some amount of time. The intention of a tailing person can range from assaulting, snatching, or even kidnapping. According to the statistics released by United Nations Office on Drugs and Crime (UNODC) [1], between 2006–2008, there were 4671 kidnapping events in Canada, 10,509 kidnapping events in Turkey, 2034 kidnapping events in the United Kingdom, and 23,991 kidnapping events in India. Figure 1 shows two of the alleged kidnapping attempts (on left), and three snatching cases (on right).
The events given in Figure 1 are recorded using surveillance cameras, which are, presently, cheaper to deploy, and comes with an easier installation process. According to a survey [2], the surveillance cameras installed in 2016 worldwide will produce approximately 566 GB of data in one day. This rapid growth of surveillance video data presents higher challenges for video processing and understanding. In addition, the manual methods of monitoring also put limits to the effectiveness of these surveillance systems. Searching for abnormal incident in recorded sequences using human supervisors is tedious, and time-consuming work. Thus, the development of computer vision techniques of event-detection [3], video retrieval [4] and video summarizing [5] are eminent part of modern surveillance systems.
Since tailing detection can prevent crimes such as assault and kidnapping in advance, tailing detection becomes an important problem to solve. However, tailing detection from surveillance videos is not an easy task, due to the diversity in the behavior and motion patterns of the suspect and victim. Moreover, it is difficult to distinguish suspected tailing people from normal people. Previous work on suspicious event detection in surveillance videos is mostly inspired by anomaly detection [6], where the anomalous events are defined as of low probabilities relative to normal events, or events that are inconsistent with normal samples, and those which deviate from the normal behavioral and appearance patterns.
Basic anomaly detection methods consist of two major steps, (i) representation of the event using visual or behavioral features and (ii) establishment of the anomaly detection model that distinguish between normal and abnormal event. Examples of low-level visual or behavioral features include spatiotemporal 3D gradient features [7], multi-scale histogram of optical flow (MHOF) [8], structural context descriptor (SCD) [9], and mixture of dynamic textures (MDT) [10], while the examples of high-level features include object trajectory features [11] and object appearance characteristics [12]. Building an anomaly detection model refers to defining a set of rules or models to distinguish between normal and abnormal events, based on the input features. Cluster-based anomaly detection models [13] tend to cluster similar normal events together, and the events whose center lies farthest from the center of the cluster are regarded as abnormal events. Another method used as an anomaly detection model is the state inference model [14], where the assumption for a normal event is that the normal events undergo a fixed change over time, while abnormal events do not. Finally, the sparse reconstruction [8,15]-based anomaly detection models calculate the reconstruction error of events and expect a small error relative to the reconstruction error of the abnormal events.
The problem of tailing detection differs from event classification methods [16], where the task is to classify the event into one of multiple classes such as “attempting a board trick”, “feeding an animal” and “making a sandwich” based on detection of one or more primitive actions, such as “jumping”, “sliding” and “flipping”. Another related problem is the human-interaction recognition [17], where the goal is to recognize the activity of a person with respect to its surroundings based on body posture, body part movement, etc. [18]. However, tailing detection need to find some abnormal behaviors of pedestrians based on their walking patterns. Thus, in this paper, we define the problem of tailing detection as an anomaly detection problem, where the abnormal event is defined as a low probability event where a suspect follows the victim in the same direction by maintaining a predefined distance from the victim for a given amount of time. In contrast with the previous anomaly detection methods, this paper presents following major contributions:
  • For the first time, we define and formulate the tailing detection problem as an anomaly detection problem.
  • To address the difficulties of empirical evaluation of tailing detection, we introduce the very first tailing detection dataset and define the metrics to evaluate and compare the tailing detectors.
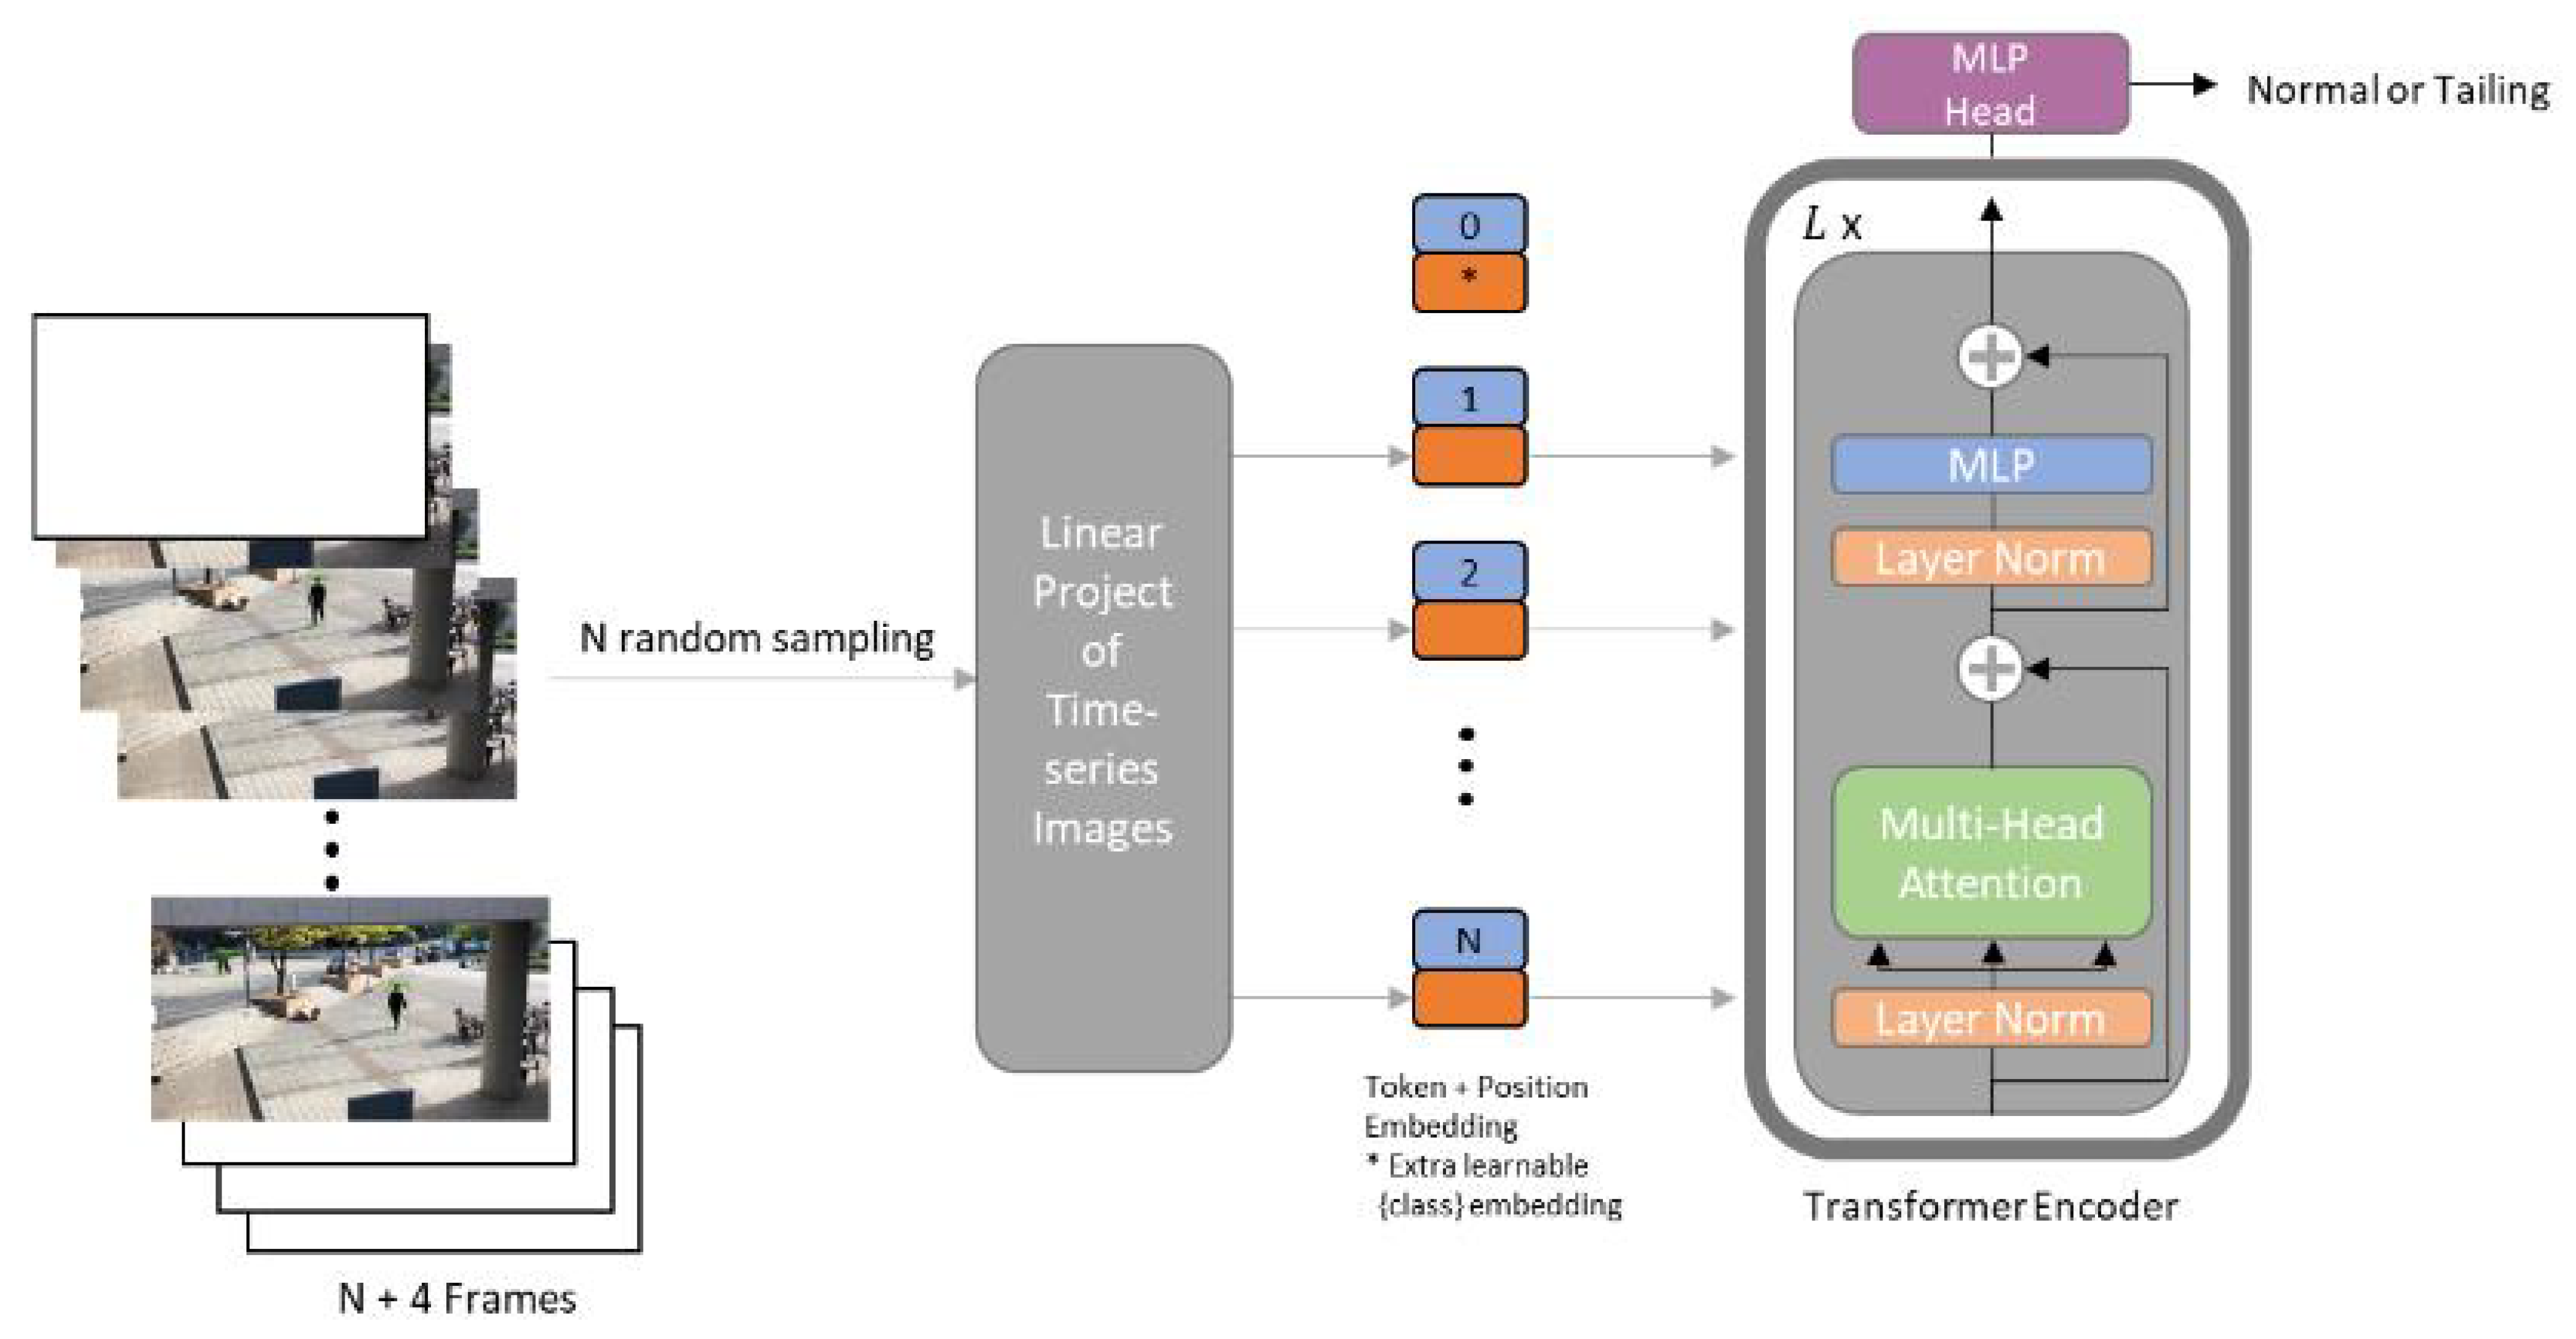
  • Unlike traditional multi-input CNN-based architectures or Recurrent Neural Networks (RNN), we propose the Time-Series Vision Transformer (TSViT) as a new method for solving time-series image data for tailing detection.
  • Most previous anomaly detection methods process the complete input frame. Consequently, their performance is highly dependent upon context information. In contrast, to make the proposed tailing detection scheme robust against view changes, lighting conditions or cluttered background, we only pass the spatial information of the pedestrian to the TSViT, by encoding frames with the pedestrian’s location information into embedding tokens.
  • We also show the successful use of Ordered Random Sampling (ORS) method to not only avoid overfitting, but also to augment the data and increase the probability of detection of the anomalous event.
The remainder of the paper is organized as follows: Section 2 reviews, in general, previous work on anomaly detection. With the mathematical characterization of the handcrafted rule-based method and CNN-based event classifier, we present the proposed TSViT-based tailing detection method in Section 3. With the introduction to our tailing detection dataset, we present the experimental details and the performance comparison of the proposed method in Section 4. Finally, the paper is concluded in Section 5.

2. Related Work

To the best of our knowledge, there has been no previous research on tailing detection with systematic experiments and quantitative results. However, the method of tailing detection is similar to anomaly detection in videos. Therefore, following we review some of the research articles related to anomaly detection.
Recent work in anomaly detection addresses event representation and globally consistent statistical inference, where researchers define features and models for the discrimination of normal and anomalous events. Some researchers proposed two-stage anomaly detection schemes, where the first stage consists of extracting low-level or high-level appearance features from the input frames of the video, and the second stage consists of classifying the features using trained anomaly detection models. Amraee et al. [19] proposed a histogram of gradient (HOG) descriptors and a Gaussian Mixture Model (GMM)-based method to detect abnormal events, such as in crowd videos. A rule-based connected component analysis scheme is used to preprocess the frames before computing the HoG features.
To cope up with the lack of data, Sikdar et al. [20] proposed a training-less framework for anomaly detection in crowd scenes. Their method consists of object detection followed by computing the saliency-guided optical flow of the moving objects in the scene, and then comparing the global optical flow using Earth Mover’s Distance (EMD).
Fusion techniques where two or more appearance cues are fused, have also been proposed. Zhang et al. [21] presented an anomaly detection framework that integrates motion and appearance cues to detect abnormal objects and behaviors in video. A Support Vector Data Description (SVDD) model is trained using spatiotemporal gradient features, to classify the events. In another research [12], the authors generated intermediate classification scores of Convolutional Neural Network (CNN)-based features and optical flow maps using trained GMM classifiers, and then fuse those two scores using late fusion.
However, some researchers argue that the two-stage anomaly detection exhibit poor generalization capabilities, as the event representation stage and anomaly detection stage are designed separately [22]. Moreover, handcrafted features rely on object appearance, which is difficult to handle in a crowded scene, especially for moving objects that occlude each other.
Given the development of deep neural networks, and their application to diverse computer vision problems such as object detection [23], semantic segmentation [24] and video summarizing [5], many researchers shifted their focus from two-stage anomaly detection to one-stage detection using deep learning techniques. Given a large-scale labeled dataset, a deep convolutional neural network is trained to jointly optimize the feature extraction and abnormal event recognition stages. A recent study [25] uses FlowNet2 [26] to extract optical flow maps of different time stamps of the input video, and then fuses them to boost the prediction probability. In addition to reconstruction loss, Zhao et al. [27] trained a 3D CNN with weight-decreasing prediction loss. The purpose of prediction loss is to capture the trajectory of the moving objects and enforce the encoder to better extract the temporal features. Most of the anomaly detection methods detect abnormality in crowd videos, where the behavior of the individual is compared against the global behavior, and thus, the techniques are vulnerable to overfitting.
The anomaly detection methods that are similar to the proposed method of tailing detection are those using object trajectories. It is comprised of either explicitly or implicitly segmenting and tracking each object in the scene, and fitting models to the resulting object tracks [28] (event classification), Ref. [29] (distinguish between vehicle and pedestrian based on tracking pattern), Refs. [30,31] (crowd behavior), Ref. [32] (traffic videos). Although capable of identifying abnormal behaviors of high-level semantics (e.g., unusual long-term trajectories), these procedures are both difficult and computationally expensive due to the tracking algorithm. All these techniques use handcrafted features along with tracking algorithms, which make them vulnerable to varying environmental conditions. The main difference between our method and these prior studies is that we do not use any tracking algorithm, rather, the discrete spatial locations of the objects are used to train a transformer network.
To the best of our knowledge, there has been no prior research to detect tailing events from surveillance videos. Furthermore, no public dataset on tailing exists. Hence, in this research, we first present a large tailing dataset named, Sogang Tailing Detection Dataset (STD dataset), containing videos of tailing events and normal events. Second, we investigate three methods for the purpose of tailing detection. (i) A handcrafted rule-based method, (ii) a convolutional neural network-based (CNN) event classifier, and (iii) the proposed Vision Transformer-based unified framework. The handcrafted rule-based method detects tailing using trajectory similarity and cosine similarity based on the pedestrian’s position. However, the rule base method is sensitive to noise, which leads to bad performance. The convolutional neural network [33] detects tailing using the channel-wise concatenated one-hot encoded frames, based on pedestrian location information. However, the one-hot encoded pattern is diluted as it passes through the series of CNN layers, and the performance decreases as the structure of the network is extended. On the other hand, the proposed TSViT achieved high performance with smaller training dataset than the rule-based or CNN-based method. TSViT [34] uses transformer to solve image classification problems for time-series tasks. Inspired by the way ViT divides images into patches and uses them as embedding tokens, TSViT also uses each fixed-length frame as an embedding token. Furthermore, previous work on anomaly detection that uses CNN [35], treats samples that are different from normal samples as anomalies, thus, they ignore the fact that abnormal events have a smaller probability of occurrence. Many normal samples that do not appear are often misjudged as abnormal, leading to false alarms. For tailing detection, it is highly unlikely that the motion patterns of the suspect and the victim match in random frames. Hence, in addition, to TSVit, we also introduce an ordered random sample method to complement the performance of TSVit when working with time-series data, and fully use the fact that the abnormal events are less likely to occur.
The comparison of TSViT against rule-based method and simple-CNN classifier proves the significance of the proposed TSViT method for anomaly detection on STD dataset, and shows that TSViT can be used in many applications for video event detection.

3. Proposed Methods

According to a personal security expert Robert Siciliano, to identify whether someone is being followed, one should take a wrong turn (or mix up walking pattern) as “it is rare for two people to make the same wrong turn at the same time. If a potential stalker mimics your maneuver, your suspicions may be warranted” [36] Similarly, we approach the tailing detection as a spatiotemporal anomaly detection problem, where the abnormal event is defined as: on a less crowded street, it is highly unlikely that the trajectories of the two persons match above a defined threshold for more than a specified amount of time. Here, the temporal abnormality refers to the recurrence of the tailing for more than a specified amount of time, while the spatial abnormality is reflected from the similarities of the two trajectories. Hence, under normal conditions, a statistical model p x ( x ) is assumed for the distribution of measurements X. Abnormalities are defined as measurements whose probability is lower than a threshold under this model. In the following subsections, we first define the proposed ordered random sampling method that is used to leverage the low probability constraint of an anomalous event, to train the anomaly detection models, followed by the three different implementations of tailing detection models including two baseline methods and one proposed method.

3.1. Anomaly Modeling with Ordered Random Sampling

In general, tasks for time-series images are learned by sampling the subset data using a sliding window method [37]. However, on a small dataset, the sliding window method is likely to cause overfitting, as the sliding window-based method can only generate a limited amount of data. To solve this problem, we used the ordered random sampling method. Ordered random sampling is a method of making input data by randomly sampling some frames from data and then sorting them in time order. Consequently, in the case of ordered random sampling, the amount of training dataset increases combinatorically. A combinatorial increase is defined as the rapid growth of the data due to the generation of finite combinations of data.
Another important benefit we extract from the ordered random sampling, is the fact that it relatively reduces the probability of an abnormal event. In other words, it is highly unlikely that the location patterns of two pedestrians in a random subset of frames are the same. Thus, in this way, the information related to the low probability of the anomaly event is used during the training of the tailing detector. This approach makes our method distinguishable from other end-to-end anomaly detection frameworks [35], where the relative probability of the anomaly event is not considered. By using ordered random sampling we improve the reality of the likelihood model of the normal and abnormal events.

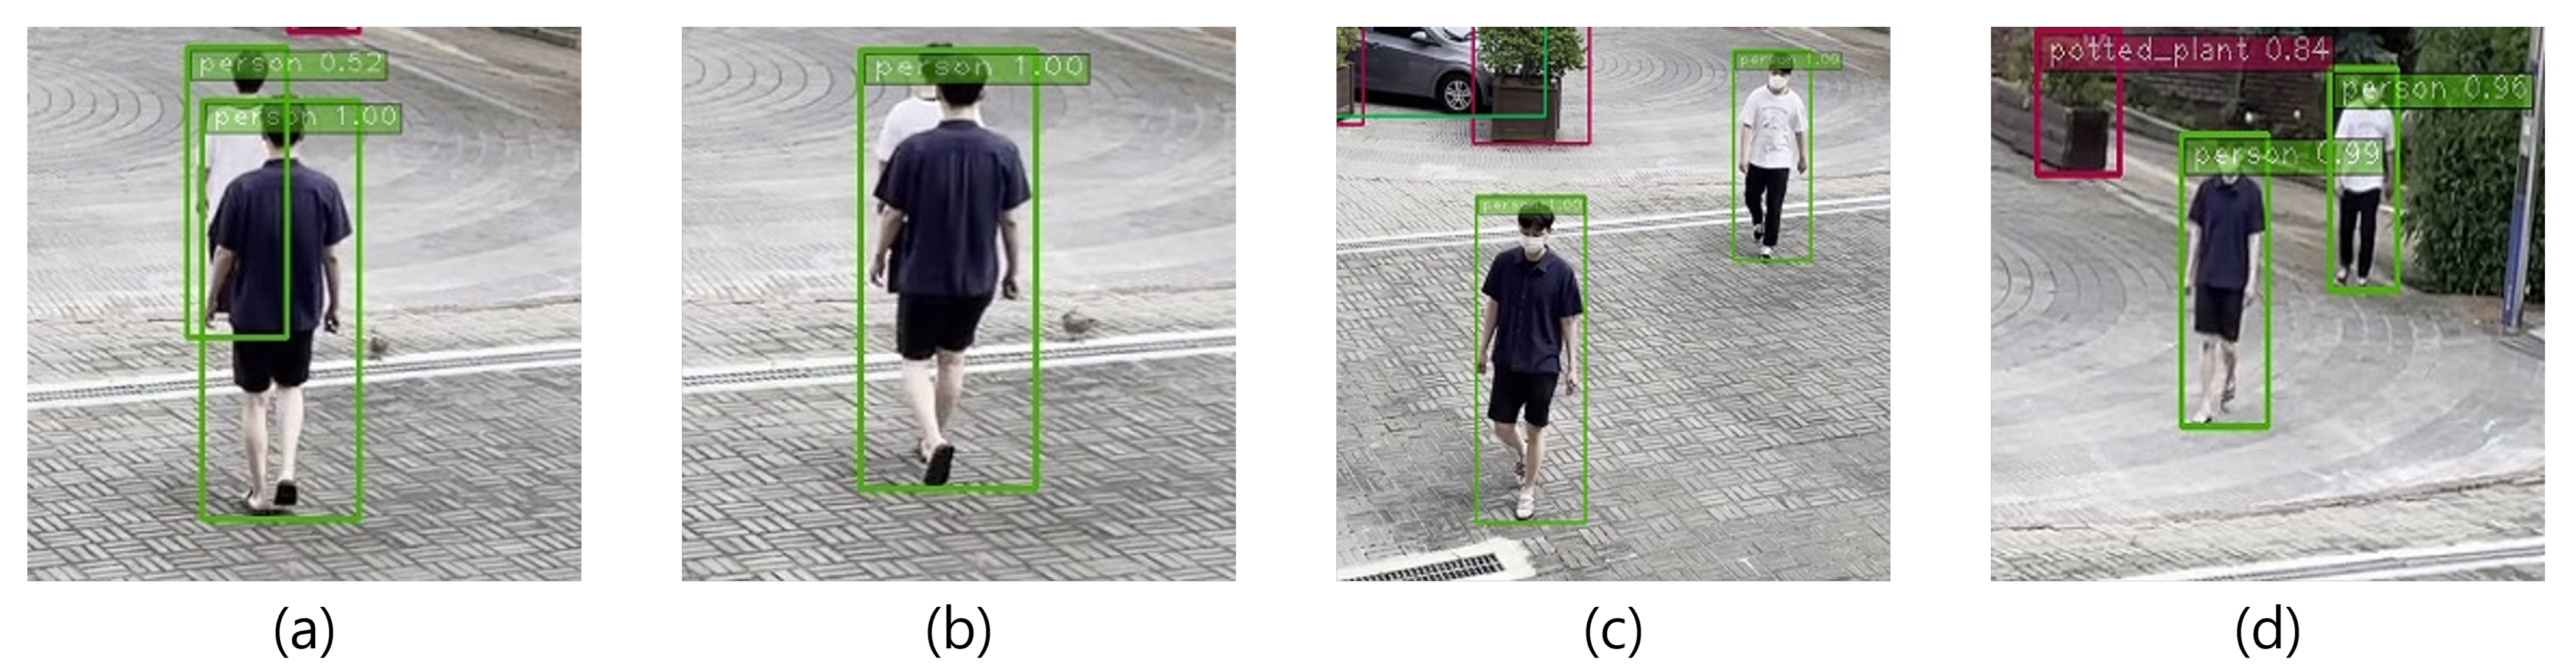
3.2. Removing Context Dependency

As indicated by [14], anomaly detection is highly affected by context information. The role of context in anomaly judgments is observed to be situation-specific, and hence previous techniques are somewhat less generalizable on datasets. For example, in some cases, the interaction of the pedestrians with their immediate surrounding information improves the anomaly detection performance due to the relative local context, but the anomaly detection performance drops when compared with the general global context. Consequently, the context information can negatively affect the anomaly detection performance due to the contradicting local and global saliency maps of the pedestrian with their surroundings. Although capturing the STD dataset, enough variations are added; however, it is impossible to capture all possible variations. In tailing detection, the proposed methods can overfit the predictions based on contextual information, such as the visual appearance of the persons, their relative motion with respect to the background, or objects in the background. Thus, we adopted to use only location information of the pedestrians in all three methods. We used an off-the-shelf person detector to convert the input RGB frames to location information, by encoding the location information (represented by a bounding box around the pedestrian) into one-hot encoding, as shown in Figure 2. Later, this encoded location information is concatenated with respect to the time axis, and passed as input to the proposed method. In this way, the proposed method is leveraged to use the location information to distinguish between tailing and non-tailing events. We discuss three different implementations of the tailing detection algorithm including the proposed method, and compare their performance in the following sections.

3.3. Baseline Method 1: Handcrafted Rule-Based Tailing Detection

For handcrafted rule-based tailing detection, we adopt the classical formulation of anomaly detection, where anomalies or tailing events are considered to be outliers. First, we extract pedestrian coordinates using an off-the-shelf object detector. Similar to [29], we construct the trajectories of the motions of people using the pedestrians coordinates in each frame. These trajectories are used to estimate the pedestrians motion pattern. To perform the rule-based tailing event detection, we considered two models for the similarity measurement, i.e., trajectory similarity and cosine similarity.

3.3.1. Trajectory Similarity

Moving objects change their locations over time and tracking them generates a sequence of points in time and space, called a trajectory [38]. There are various similarity measures to compare two different trajectories such as Euclidean and Hausdorff. To consider multiple points on trajectories, we used Fréchet distance as the similarity measure. Fréchet distance is a non-metric measure that takes into account both the location and ordering of the points along curves of the two trajectories [38]. When trajectories of tailing suspect and victim, T a and T b are given, the Fréchet distance is defined as:
F ( T a , T b ) = inf α , β max t [ 0 , 1 ] d ( T a ( α ( t ) ) , T b ( β ( t ) ) ) ,
where α and β are non-decreasing function from [0,1] onto [ α , β ] [39]. The shorter the Fréchet distance, the more similar the two trajectories.

3.3.2. Cosine Similarity

Cosine similarity is the method used to measure the degree of similarity [40]. With this method, two pedestrians in the same direction, will have a value close to 1, and −1 in the opposite case as in Equation (2). Comparing the direction of the pedestrian’s path, we assume direction vectors using the pedestrian’s coordinates.
s i m i l a r i t y = cos ( θ ) = A · B A B = i = 1 n A i × B i i = 1 n ( A i ) 2 × i = 1 n ( B i ) 2
In the case of tailing, two pedestrians walk in the same direction by maintaining a constant distance. If the distance between trajectories of two pedestrians is similar to the Fréchet distance value and the cosine similarity is close to 1, we declare this as a tailing event.

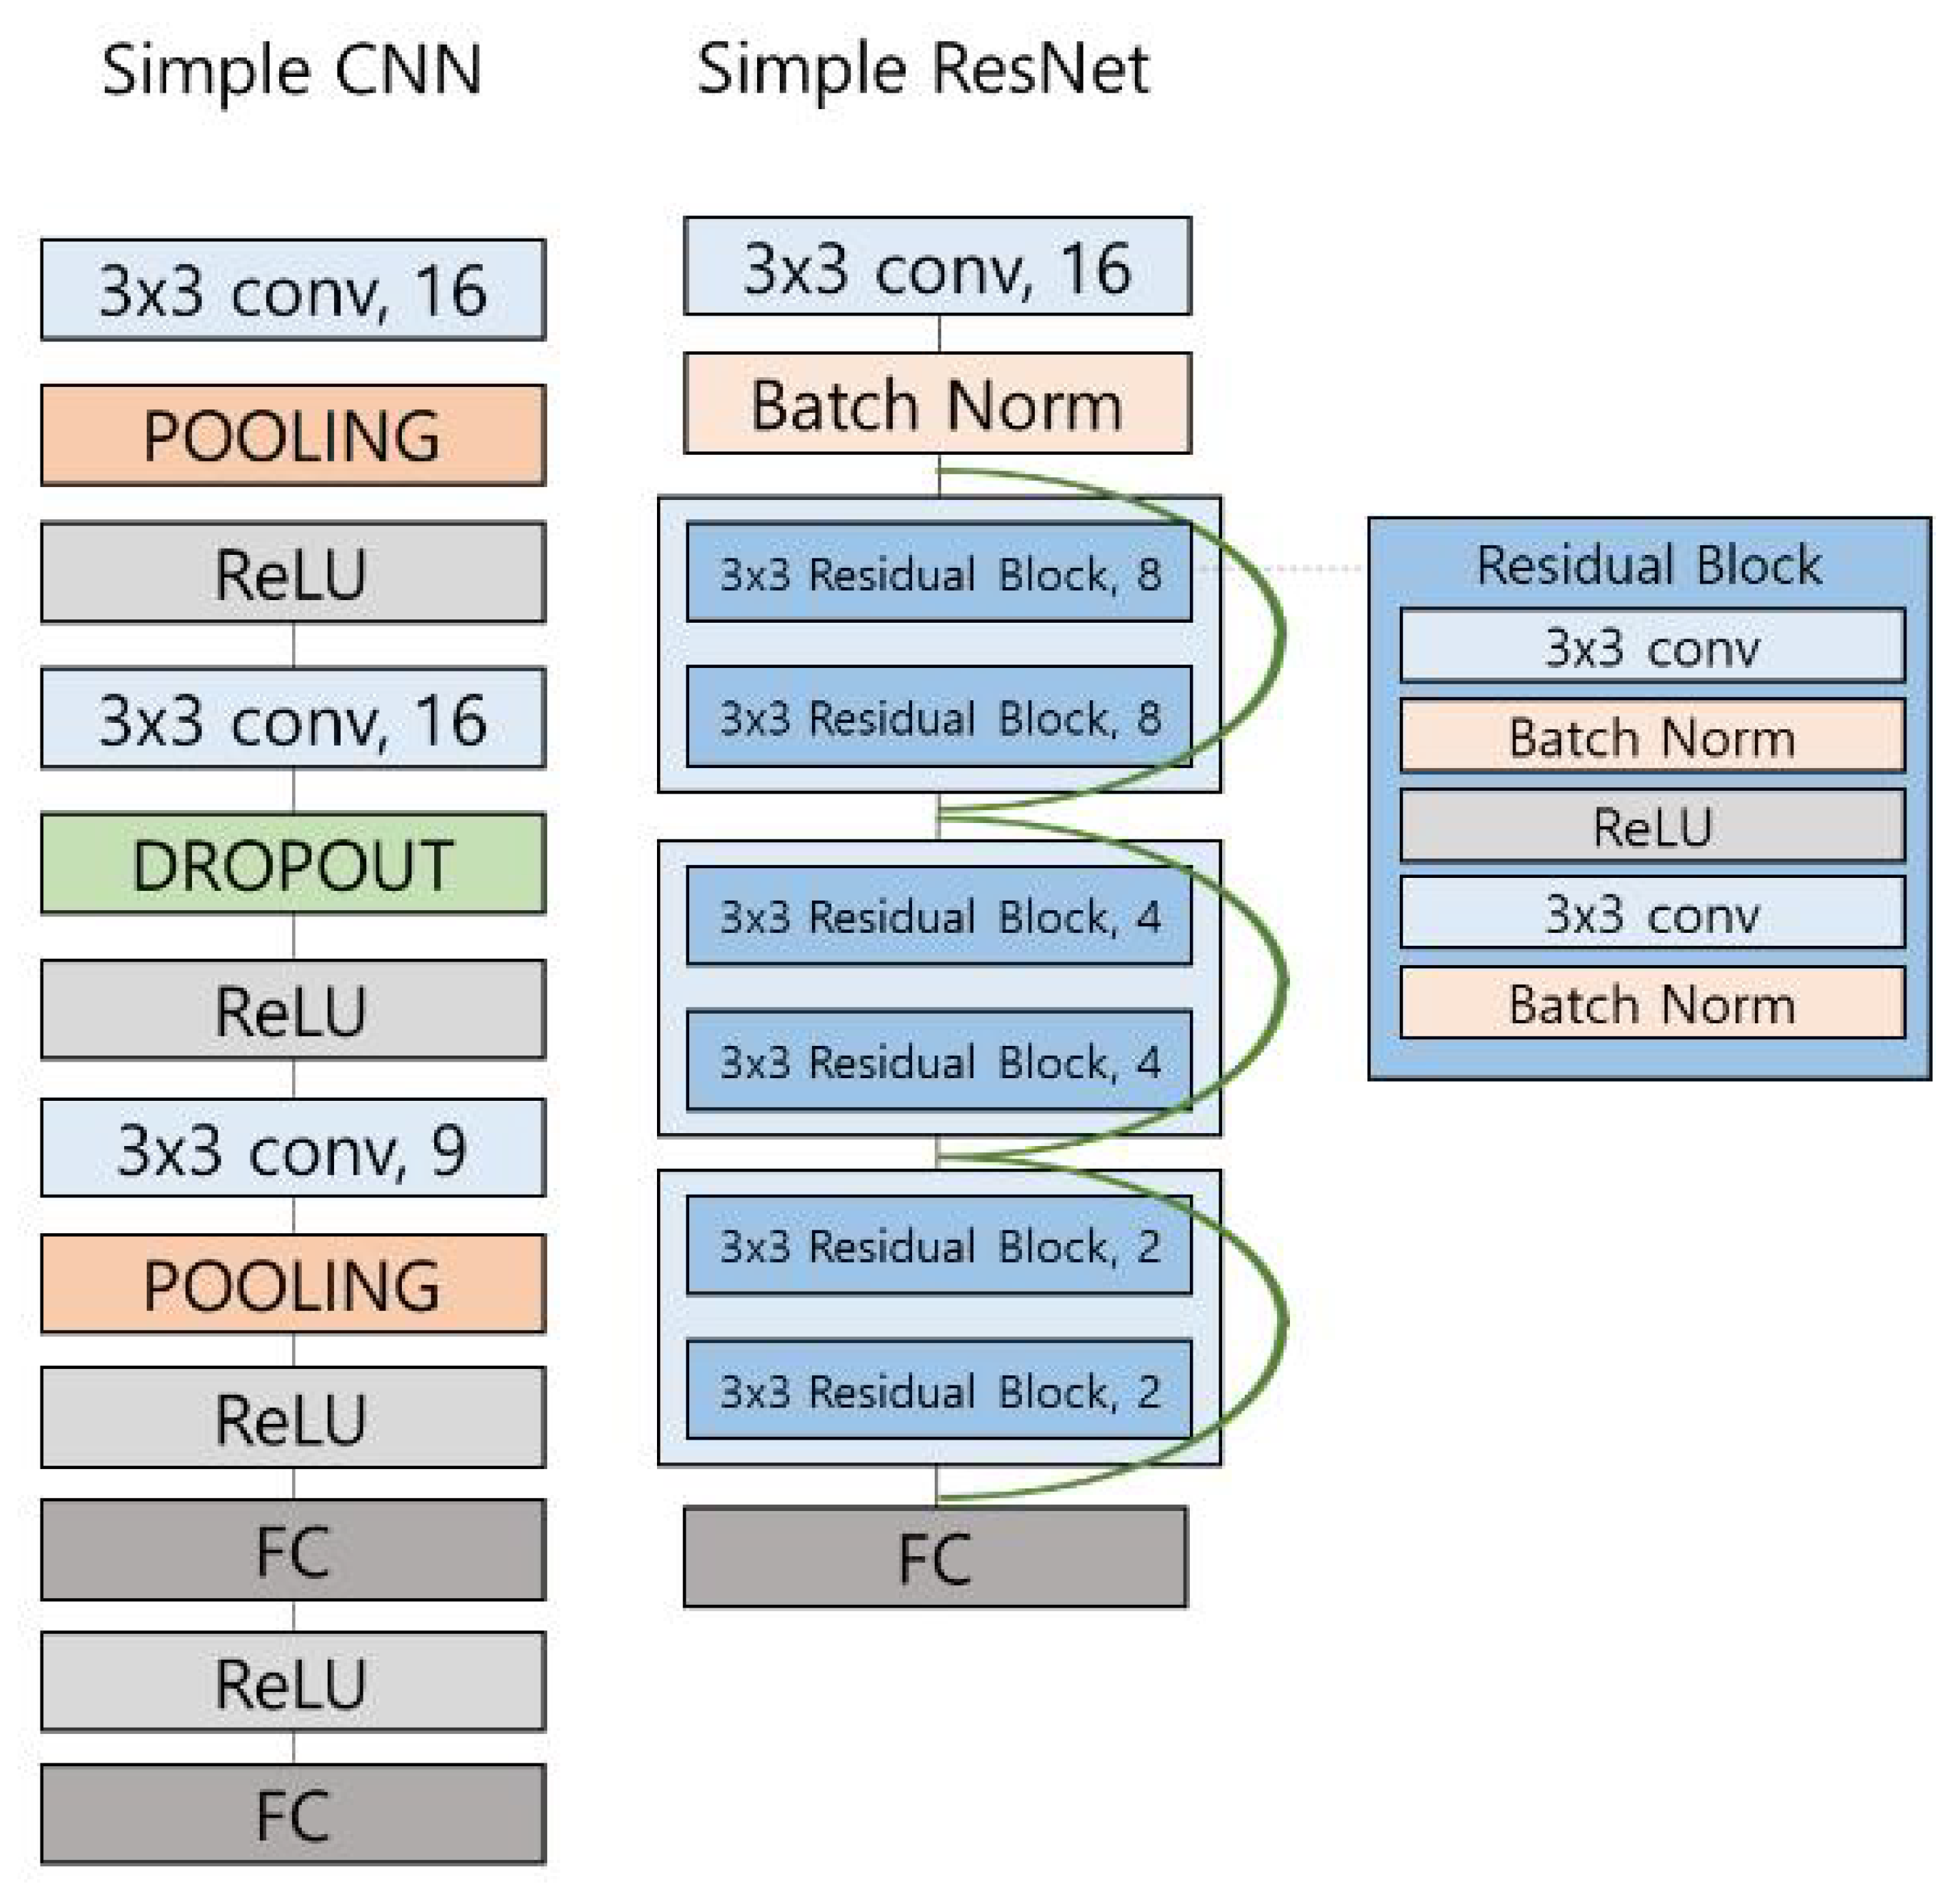
3.4. Baseline Method 2: CNN-Based Detection

In image classification, the convolutional neural networks learn and classify object patterns from 3-channel images [41]. To learn the pattern in time-series images, we accumulate the one-hot encoded frames over time as shown in Figure 2, and used it as the input to the convolutional neural network.
To observe the effects of the depth of the CNN on the tailing detection performance, we experimented with time-series images using a simple-CNN and a ResNet [42] architecture. Figure 3 shows the simple-CNN and ResNet architectures. Simple-CNN consists of three convolution layers and two fully connected layers. Simple-ResNet consists of three connection blocks. Each connection block consists of two residual blocks, which are composed of convolution, batch normalization, and activation layer as shown in Figure 3. With this simple-ResNet architecture, we focus on two factors. First, we want to check whether the residual block shows good performance on time-series data. Second, we want to reduce the size of the model to optimize memory usage. We also experimented with the original ResNet architecture to analyze the relationship between network size and performance. The input channel of the first convolution layer of all ResNet is changed to the number of accumulative frames, N, in Figure 2.

3.5. Method 3: Proposed Tsvit Method

Figure 4 shows the overall process of TSViT-based tailing detection. TSViT has a structure that embeds the time-series images into tokens and passes them through the transformer encoder. The transformer encoder consists of layer normalization (LN), multi-head self-attention (MSP), and multi-layer perceptron (MLP) block, as the original ViT [34]. We explain methods for dealing with time-series images of small dataset below.

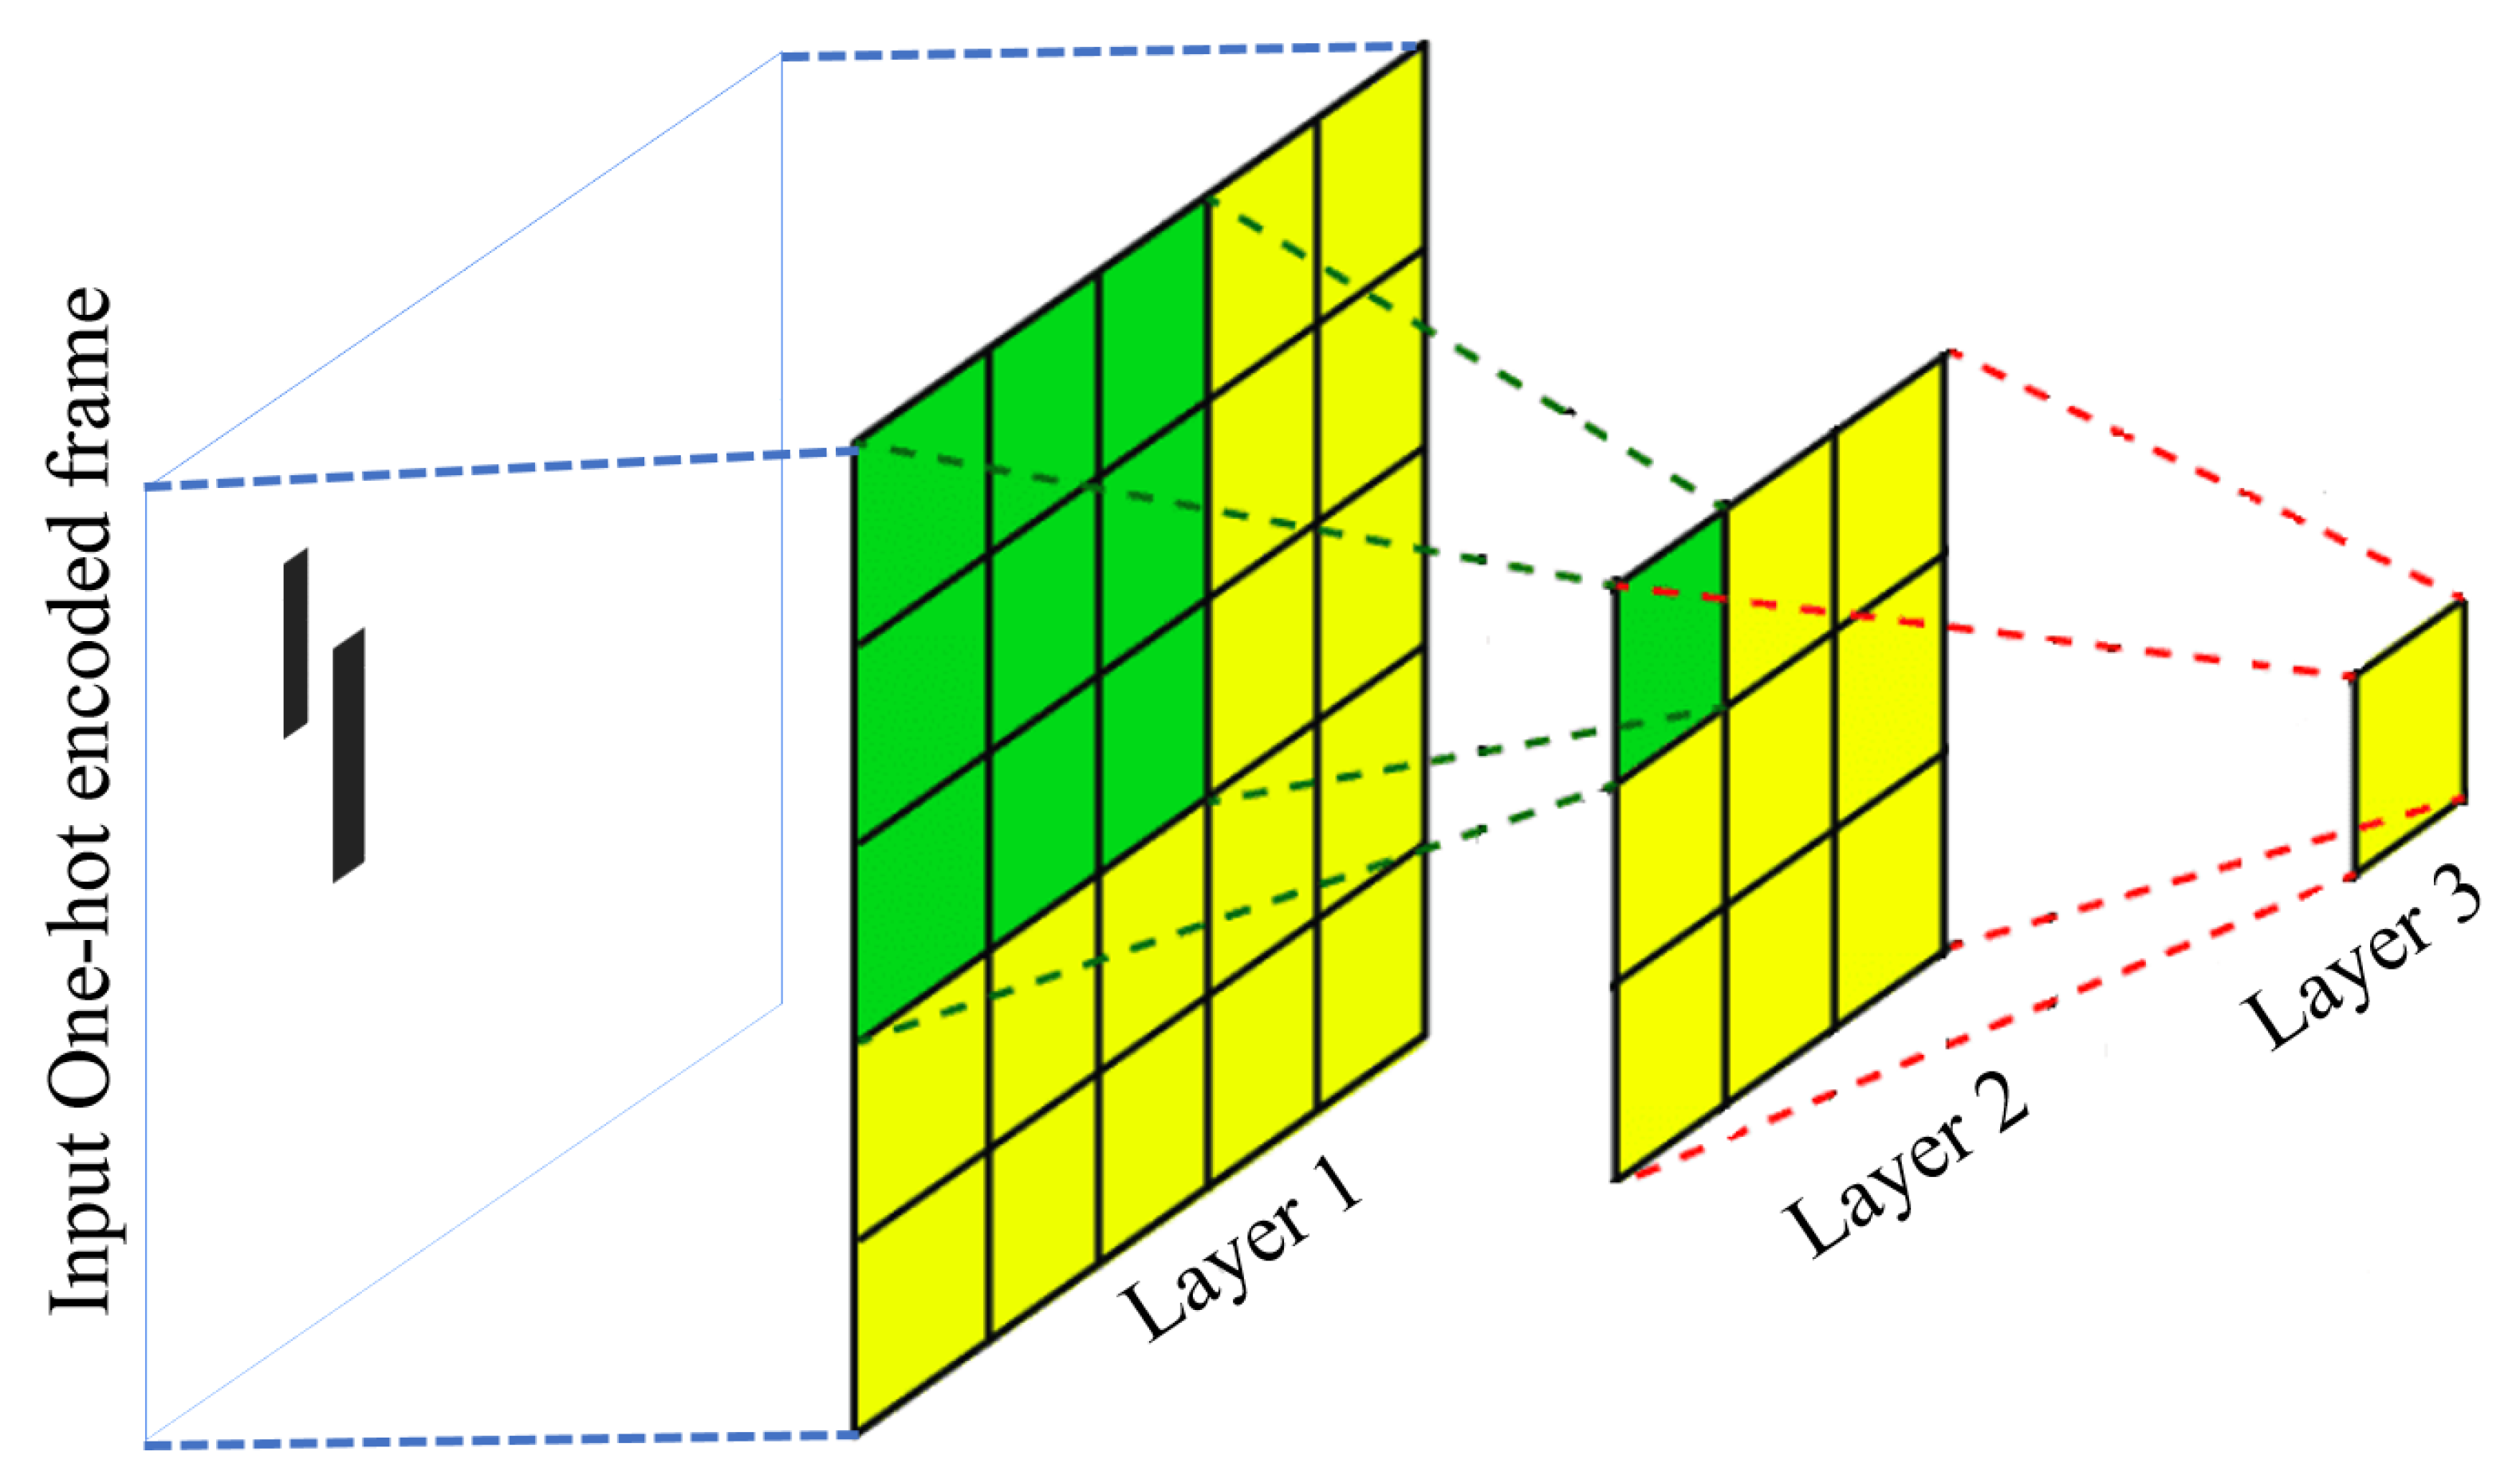
Embedding Time-Series Images

In the natural language processing (NLP) tasks, input embedding can be expressed as the sum of the embeddings in a sentence, allowing parallel processing of words [43]. To handle 2D images with the transformer, equi-sized patches from one image are reshaped to 1D token embedding [34]. To process time-series images with transformers, we configure token embeddings from extracted frames. To ensure the frame order, positional embedding is also added.
Vision-Transformers generally show a weaker inductive bias resulting in increased reliance on model regularization or data augmentation when trained on a relatively smaller dataset. The proposed ordered random sampling also acts as a data augmentation method, where the data combinations are generated during training. For every n distinct samples, we can generate n ! / ( ( n r ) ! × r ! ) ordered pairs, where r denotes the size of samples chosen at a time. However, in the case of sliding window-based sampling, only n ( r 1 ) samples can be generated.

4. Experiments and Analysis

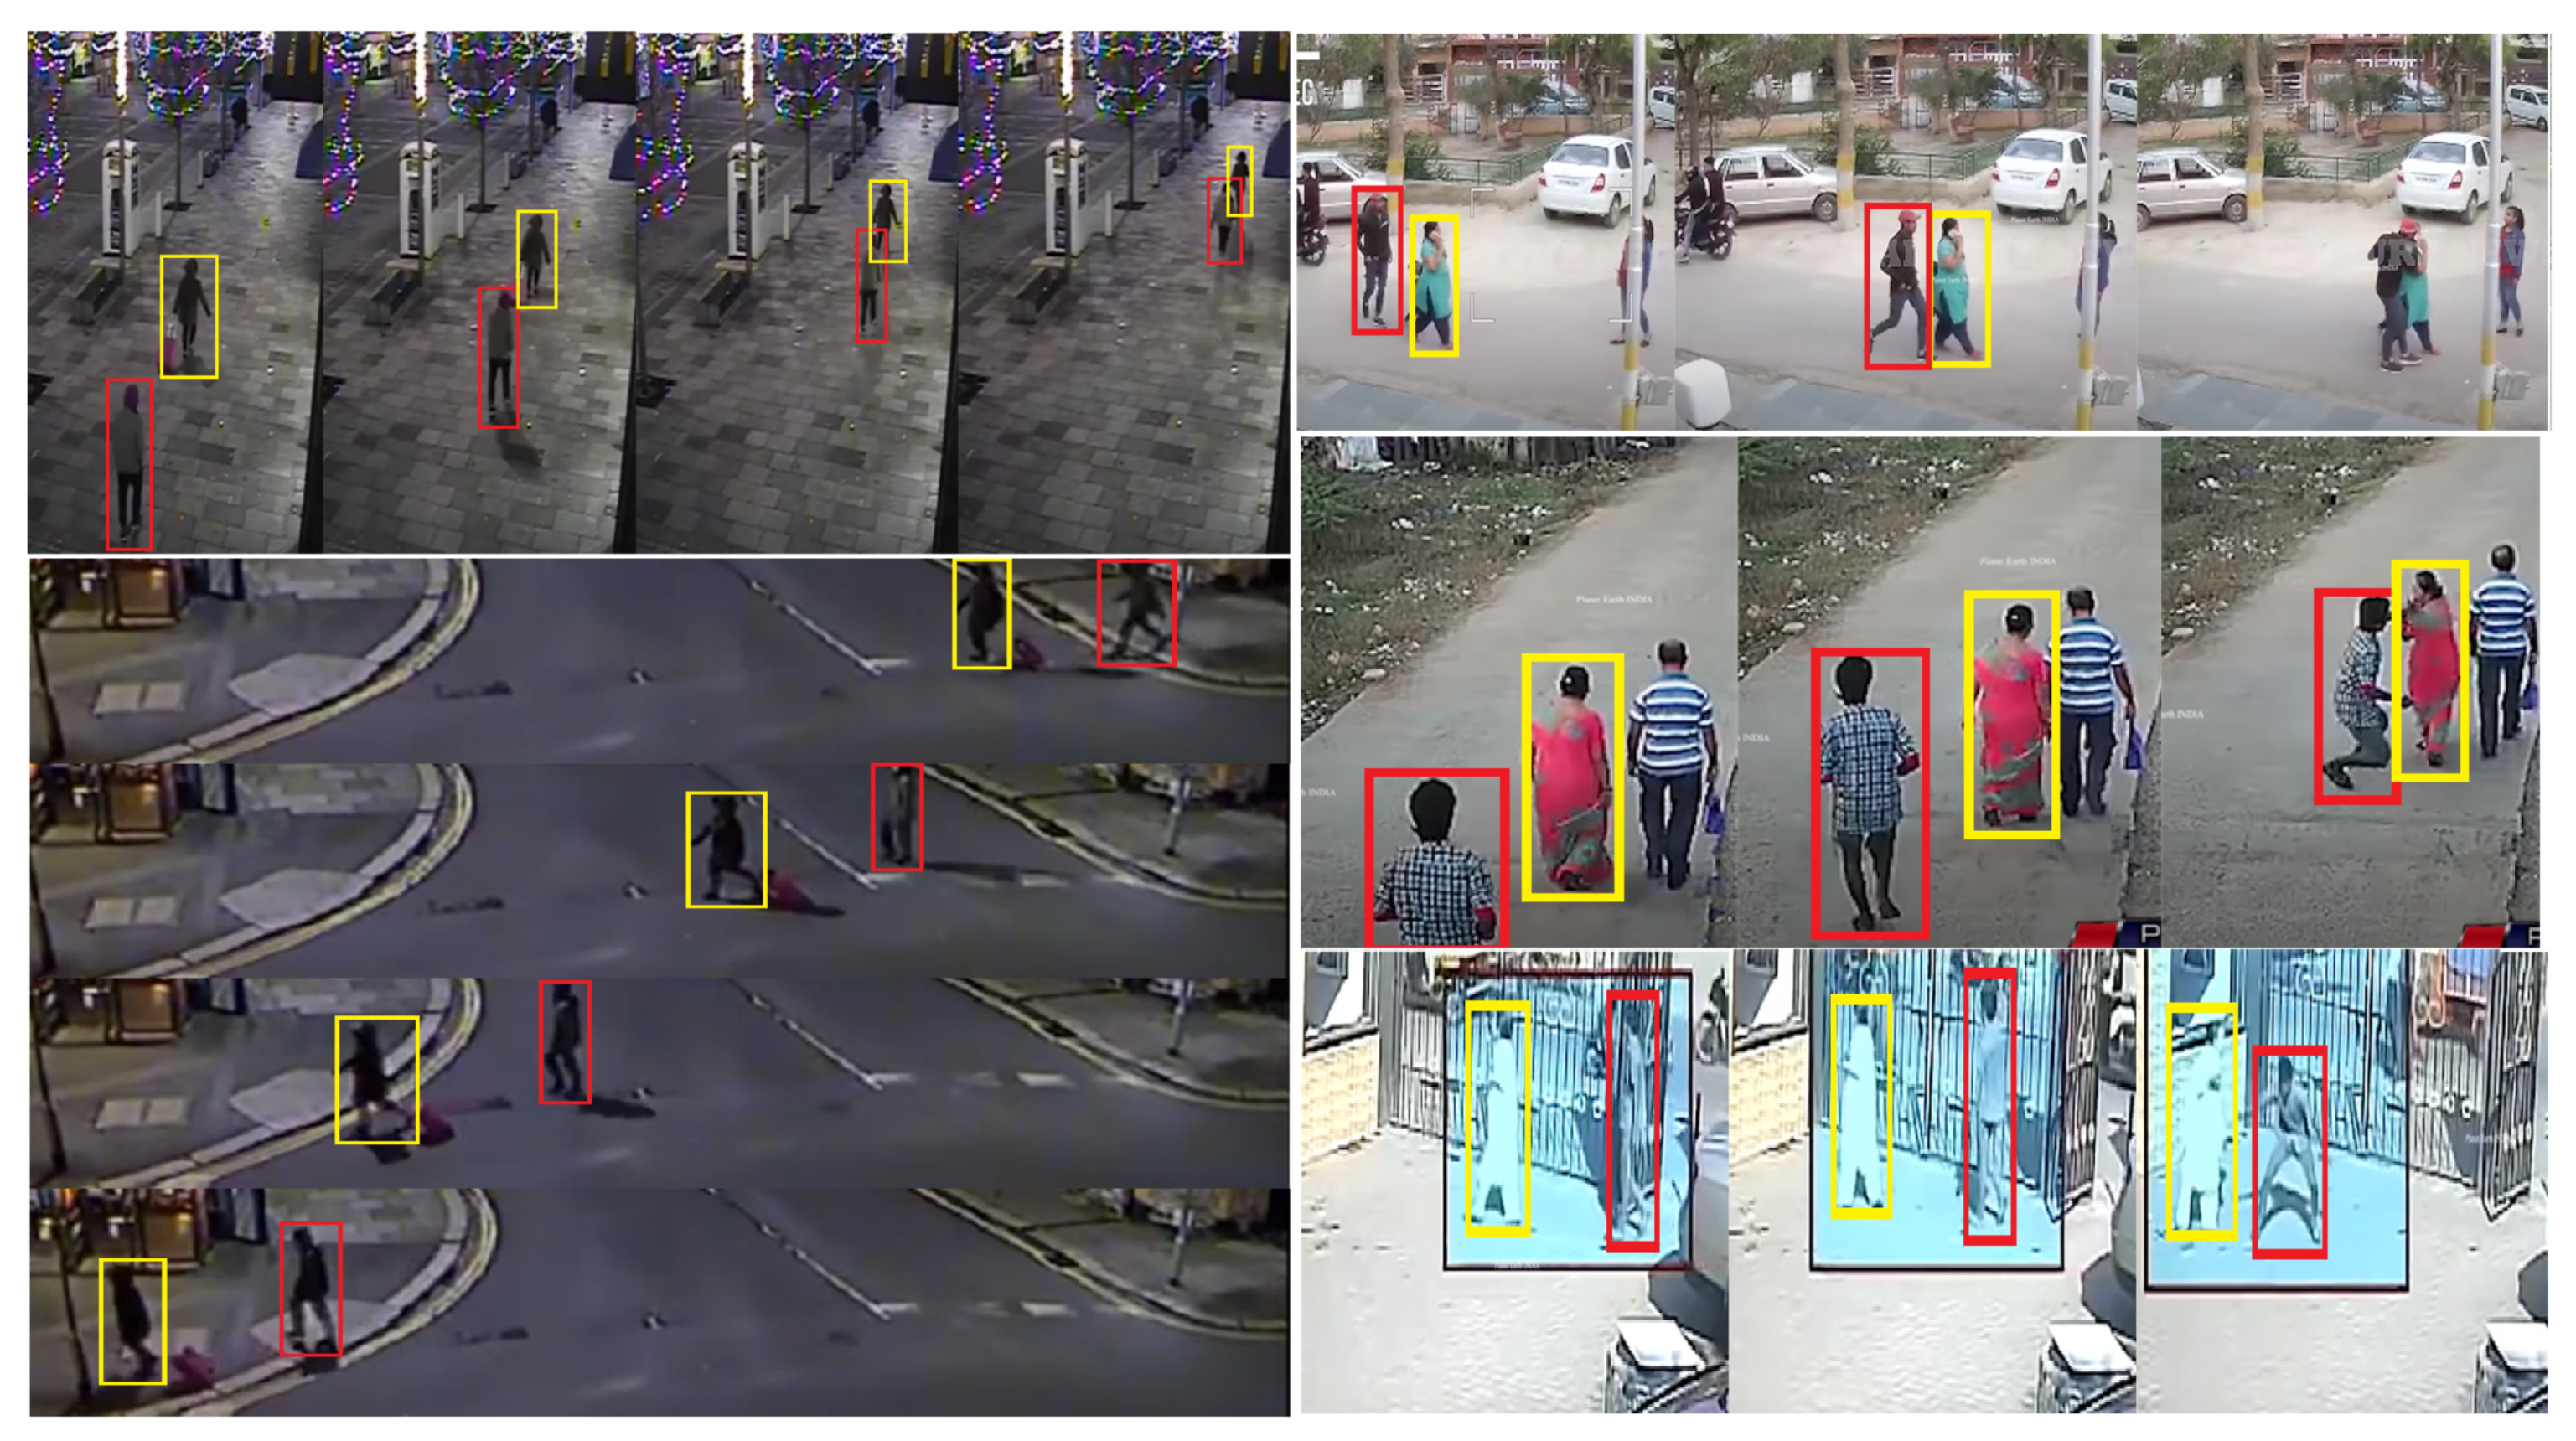
4.1. Sogang Tailing Detection Dataset

The absence of any public or private tailing dataset is the main motivation to develop our own tailing dataset. The dataset consists of video clips recorded with a stationary camera, overlooking pedestrian walkways in the Sogang University campus, mimicking CCTV footage. The videos are recorded in such a way that the crowd situation is kept as low as possible. When the number of people increase in the video, a highly sophisticated tracking method is required to obtain accurate trajectories of people. In such a case the tailing detection performance greatly depend on the tracking performance. We decoupled the tailing detection and tracking problems by limiting the number of people in the video, and focused mainly on developing the tailing detection technique.
We collected a balanced set of 246 videos with 123 tailing and 123 normal (no tailing) events, making it the largest dataset among the anomaly detection datasets such as UCSD [44] (70 video clips) and Avenue dataset [7] (37 video clips). The total durations are 1495 and 1085 s for tailing and normal videos, respectively. The videos are collected under various lighting conditions, background variations, camera viewpoints, and non-aligned surfaces (like stairs). In total, four volunteers appear in the videos by switching their roles, such as subject A acts as a victim and subject B acts as a suspect, while in another video, they switch their roles. In this way, the dataset is made invariant of the appearance of the pedestrians. The tailing event is mimicked by volunteers in such a way that the suspect follows the victim by maintaining a fixed distance, with similar walking speed and direction as the victim. The volunteers try to act as naturally as possible. The videos are recorded at a resolution of 1920 × 1080 with 30 frames per second. The average length of videos is 10 s. Figure 5 shows example frames from the STD dataset.

4.2. Experimental Settings

For the experiments, we used a balanced set of 100 tailing, and 100 normal videos for training, and 23 tailing and 23 normal videos for the testing. We extracted 2 frames per second from the video to construct the time-series images. In the rule-based method, only the extracted frames and object detection results are used for the tailing detection. In the case of the deep learning methods (i.e., CNN and TSViT), we constructed an encoded pattern from the pedestrian detection results. The encoded pattern represents two-dimensional one-hot encoding including the bounding box information of the detected pedestrians. To pass the frames as time-series data, we concatenate 9 one-hot encoded frames along the time axis. For reporting the performance of the proposed tailing detection method and comparing the performance with baseline methods, precision and recall values are reported. We also present the per frame event classification accuracy. Given the seriousness of the consequences of a tailing event, we mainly focus on improving the recall of the tailing event detection. We evaluate all three methods using the same test set as explained above.

4.2.1. Method 1: Handcrafted Rule-Based Method

The rule base method achieved 61.45% of accuracy with 77.73% precision and 53.48% recall. Due to differences in camera angles and perspective effects, the rule-based method did not use normalized coordinates. Since rule-based methods are sensitive to noise, it is difficult to expect high detection accuracy. Figure 6 shows the example cases where the handcrafted rule-based method fails. Figure 6a,b depicts the situation where the spatial information becomes corrupted due to Figure 6a overlapping, and Figure 6b occlusion. However, Figure 6c,d illustrate the perspective effect, i.e., the distance between the victim and suspect is same in both Figure 6c,d but due to perspective difference, the distance between the victim and suspect appears different in Figure 6c,d. Handcrafted rule-based method shows poor tailing detection results in these situations.

4.2.2. Method 2: CNN-Based Method

The CNN exhibits better performance than that of the handcrafted rule-based method because CNNs can robustly learn tailing patterns from the images of multiple views, and handle the noisy localization generated by the object detector, during the extensive training process. The CNN can also handle the perspective effect illustrated in Figure 6c,d, and perform better than rule-based method in the partial occlusion situation depicted in Figure 6. The tailing event detection result with various CNN architectures are summarized in Table 1. The number written next to model, i.e., 512, represents the input frame size 512 × 512.
  • Training configurations. We trained all the CNN architectures used in this experiment for 100 epochs using SGD [45] with momentum = 0.9, weight decay = 0.0001, and a batch size of 64. We performed a grid search with a learning rate (lr) in [0.001 0.01]. We use MultiplicativeLR as the lr scheduler.
From the experimental results, we can make a few observations. First, CNN performance did not significantly increase as the depth of the model is increased. The simple-CNN shows the best detection accuracy at 63.54%. On the other hand, if we compare the recall of the tailing detection, ResNet-101 shows the best performance among all CNN-based models, while slightly outperforming ResNet-50. The recall drops as the ResNet architecture is further deepened to ResNet-152. The general consensus is that the larger the convolutional neural network, the better the performance [46]. However, according to the experimental results, there is no significant gain with increasing model size. We consider that this is due to two reasons, (i) overfitting on small datasets, and (ii) spatial inconsistency. In general, as the size of the model increases, with a sufficient dataset, the capacity of the model increases, and so does its performance. However, in the case of small datasets, as the model capacity increases, overfitting may incur. Secondly, as the network size is increased, the spatial information becomes inconsistent due to the increase in the receptive fields of the deeper filters. We believe that these two reasons constitute the main reasons behind the low performance of deeper networks such as ResNet-152, in comparison with simpler-CNN in terms of accuracy and precision.

4.2.3. Method 3: Proposed TSViT

We used TSViT configuration based on ViT [34], which is summarized in Table 2. The “Base”, and “Large” models are adopted from ViT, while we added a variant called “Small” in our experiments. In Table 2 and Table 3, B, L and S stand for Base, Large and Small, while the number written next to the model name, i.e., 256 and 512, represent the input frame size 512 × 512.
  • Model variants.
  • Training configurations. We trained all TSViT for 100 epochs using AdamW [47] with β 1 = 0.9 , β 2 = 0.999 , weight decay = 0.01, and a batch size of 64. We performed five ordered random sampling per video in each epoch. We performed grid search with a learning rate in [0.0025, 0.1]. We used a learning rate with gradual warmup [48] up to 20 epochs and then cosine annealing decay [49] for the remaining epochs. For data augmentation, we only used random horizontal flipping.
The overall comparison of Table 1 and Table 3 reveals that the proposed TSViT method outperform all CNN-based models. Transformer-based “Base” model TSViT-B/512 exhibits the best accuracy of 76.56% in comparison with the 63.54% best accuracy of simple-CNN, a 13.02% improvement. Similarly, the recall is improved from 91.92% of ResNet-101 to 98.05% of the TSViT-B/512 model, even with the smaller model size (1092 M vs. 2410 M parameters). This shows that the transformer can have better inductive biases compared to CNN by using temporal information in a better way of embedding time-series data frame by frame. Third, the performance of Transformer-based models increases as the input frame size is increased. This is because the self-attention layer in the transformer embeds positional information from the input image [50], and thus, higher resolution translates to more accurate positional embedding.
The proposed TSViT-based tailing detector shows a processing time of 7.69 milliseconds per sample (a sample consists of 9 frames), while the object detector exhibits a delay of 23 milliseconds. Overall, the tailing decision is made within 30.69 milliseconds using one GPU.

4.3. Effectiveness of the Proposed Sampling Method

In Table 4, we compare the performance of the proposed ORS method with the sliding window-based sampling method. We trained the proposed TSViT tailing detection algorithm with ORS method and then trained the TSViT with the sliding window-based sampling method and reported the performance comparison in Table 4. Table 4 shows the average performance of all the six implementations of TSViT (given in Table 2). It is clear from Table 4 that the ORS method not only increase the amount of training data by augmentation, but improves the performance over sliding window-based sampling method. However, there is a small performance difference when observing the accuracy and precision, but ORS shows a high performance gain in terms of recall.

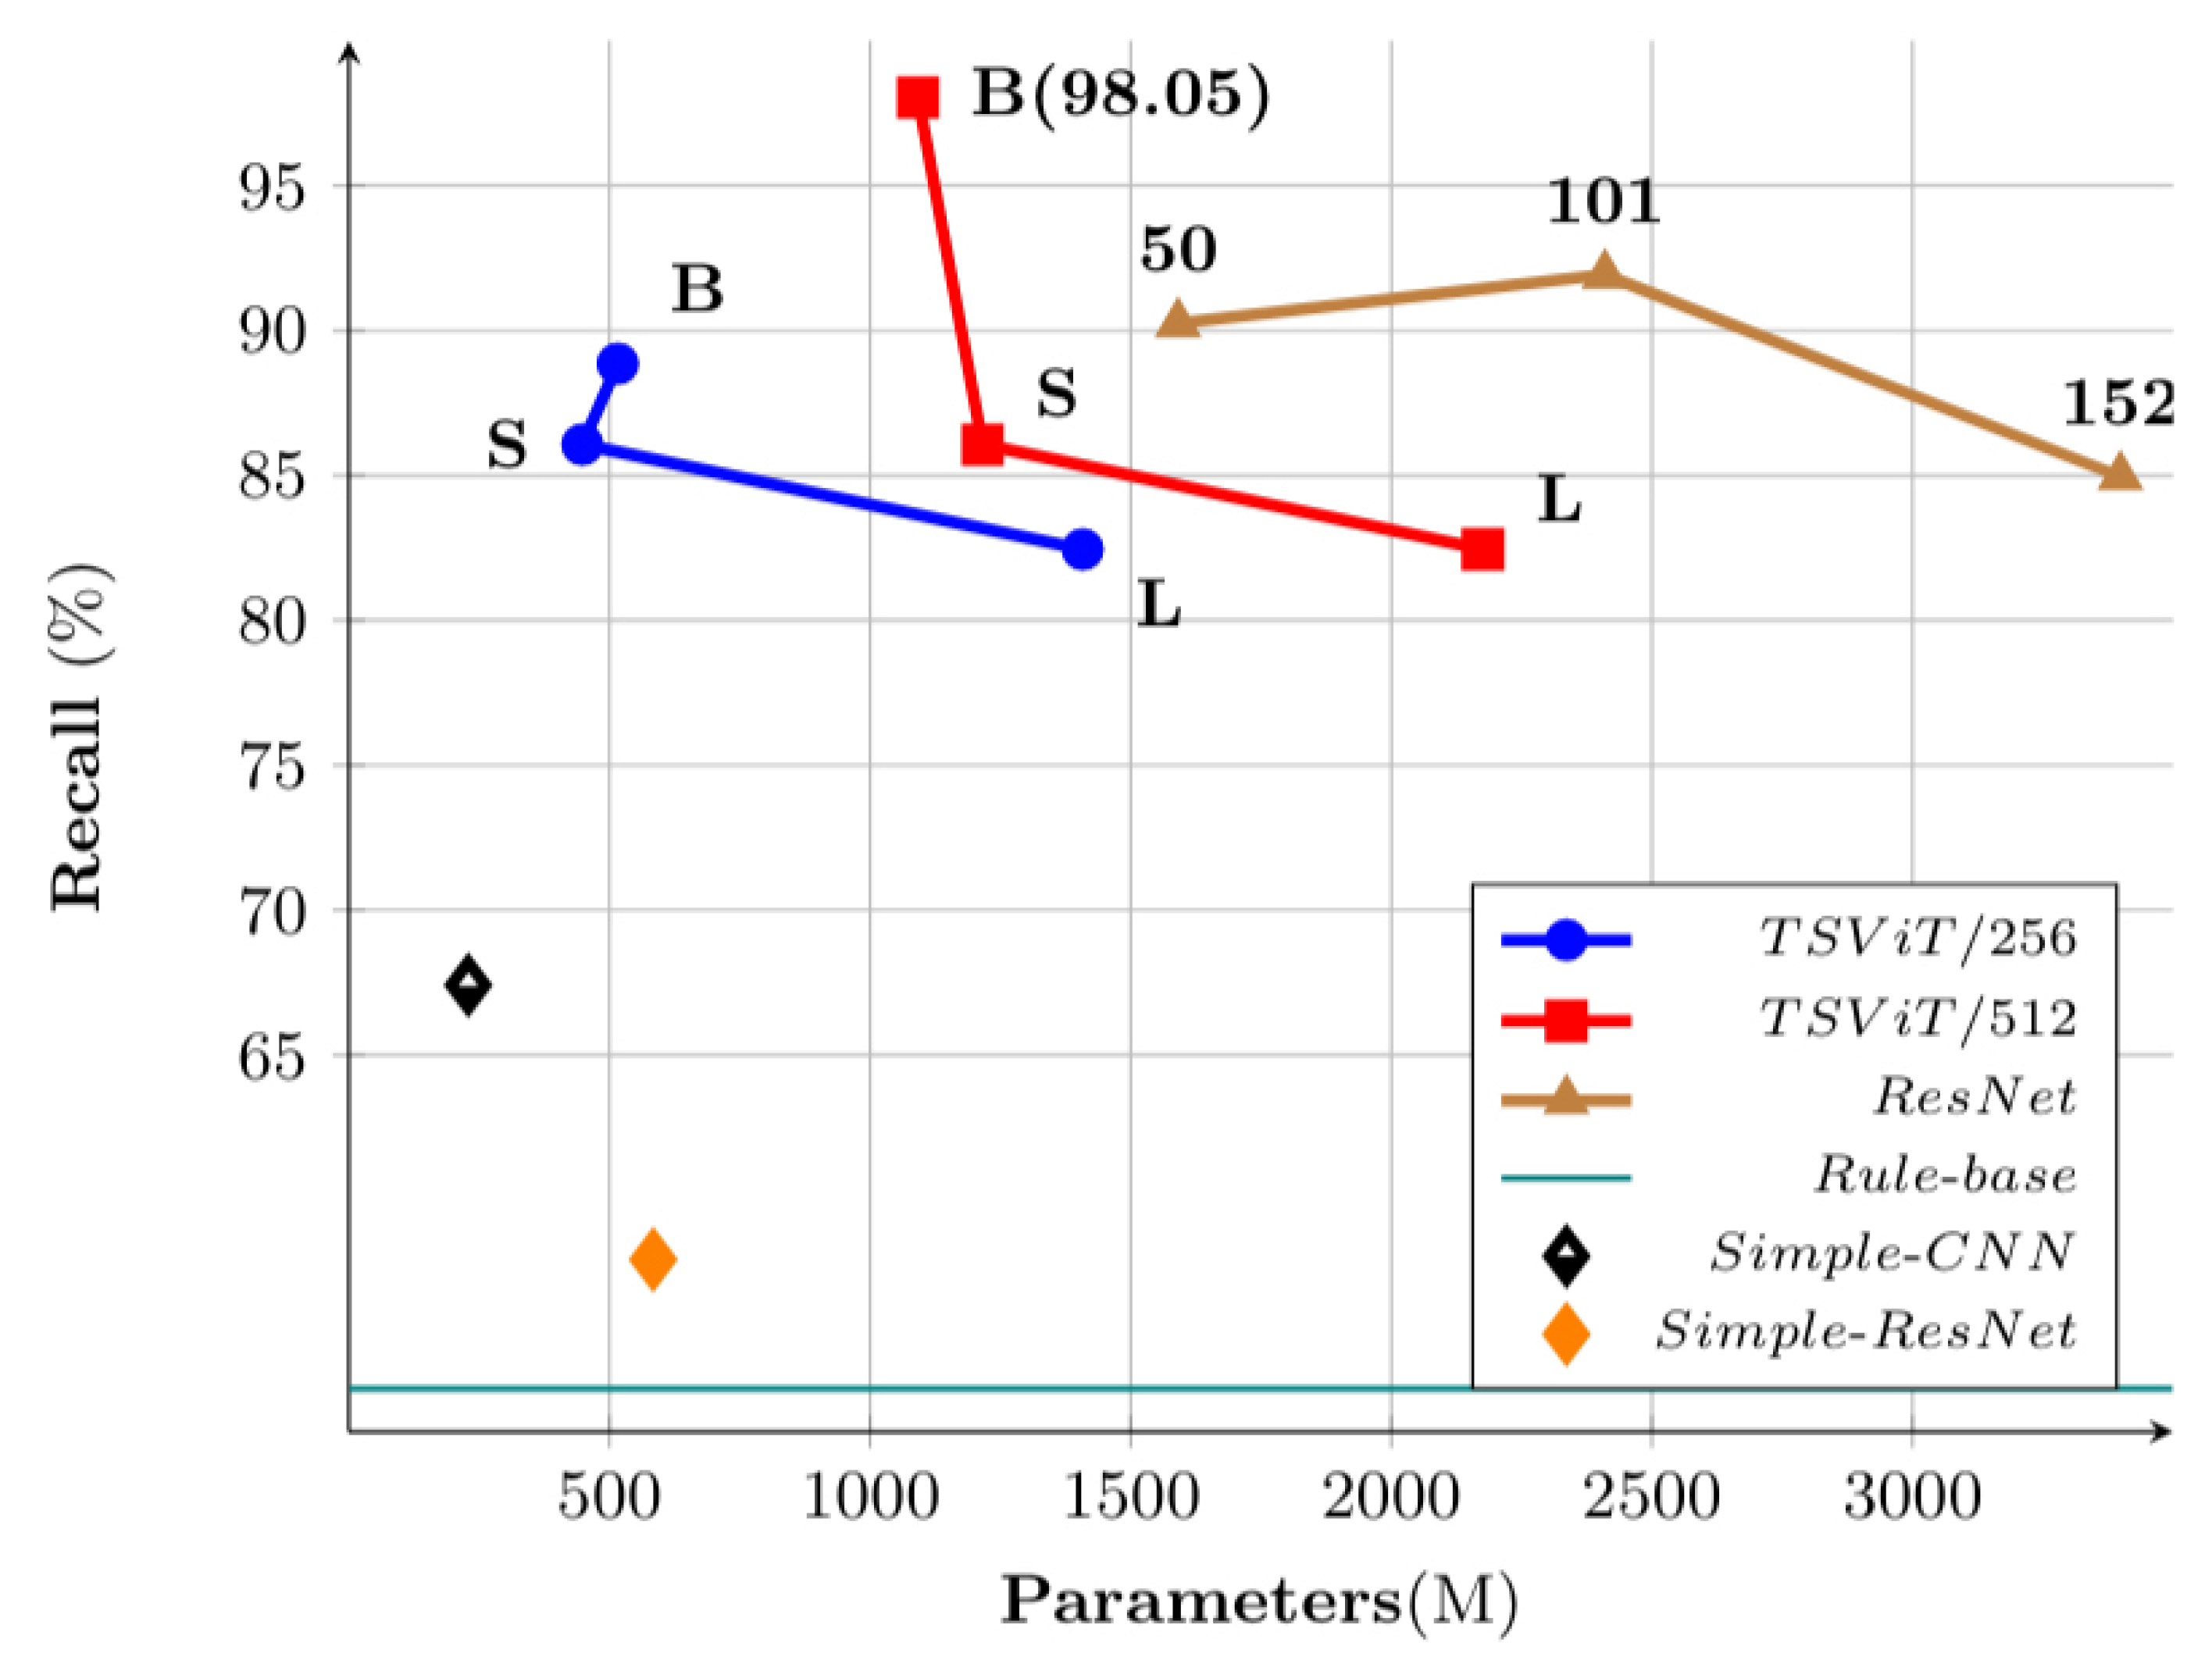
4.4. Discussion on Tailing Detection Performance with Model Size

We also performed a scaling study of different models. Since the recall is more important factor in tailing detection, we compared recalls of these models. The model set includes: five variants of CNN: (i) Simple-CNN, (ii) Simple-ResNet, (iii) ResNet50/512, (iv) ResNet101/512, (v) ResNet152/512; and six variants of TSViT: (i) TSViT-S/256, (ii) TSViT-B/256, (iii) TSViT-L/256, (iv) TSViT-B/512, (v) TSViT-S/512, (vi) TSViT-L/512. In the case of TSViT, the recall drops as the network size increases, except for TSViT-S/256 (see Figure 7). We believe that this is related to the fewer attention heads and smaller number of hidden layers in TSViT-B/256 and TSViT-B/256, compared with TSViT-S/256. On the other hand, for CNN variants, ResNet-101 shows very little improvement over ResNet-50 considering the increase of its model size. However, further increasing the network to ResNet-152 reduces the performance, as shown in Figure 7.
Generally, CNN-based methods perform better when they are fed with contextual information, and CNN makes the relationship between context and the tasks in the deeper layers. However, in our implementation, we only use one-hot encoded frames to represent location, which contains little contextual information. Moreover, the granularity of the location information degrades, because of the presence of max-pooling layers in the CNN, and thus resulting in performance degradation with deeper CNNs. Figure 8 illustrates the phenomena of increasing receptive field as we go deeper into the network.
On the other hand, TSViT performance drops when the attention heads are increased. According to [34], attention distance is analogous to receptive field size in CNN. As depth increases, attention distance increases for all heads. This leads to using more context information, and thus negatively affects the performance of the TSViT.

5. Conclusions and Future Work

In this paper, a method of tailing detection based on Vision Transformer is proposed, which is an end-to-end trainable framework. Tailing or following someone is an unwanted social behavior that can lead to extreme crimes such as abduction, assault or snatching. The proposed method models the tailing detection as an anomaly detection problem, where the tailing event can be captured as spatiotemporal characteristic patterns in time-series image data. With the help of the proposed ordered random sampling method, we leveraged the low probability constraint associated with the abnormal event in the training of the proposed Vision Transformer-based tailing detector. We also removed the context dependency from the proposed tailing detector by encoding location information into one-hot patterns, and passing them to the Vision Transformer using the token embedding method. This paper also introduced a challenging tailing detection data set, composed of scenes of pedestrians mimicking normal and tailing situations.
We present two baseline methods, (i) a rule-based method that computes the similarity between the location patterns of the pedestrians using cosine and trajectory similarity, (ii) a CNN-based method that takes multiple input frames using multiple channels. A comparison of the performances showed the significance of the proposed method. The tailing detection performance of TSViT was further improved by regularizing the model through the ordered random sampling method that can address the small dataset problem.
We believe that this paper presents the first step towards computer vision-based tailing detection, and the evaluations given in this study can be a guideline for future research in this area. The proposed work has a great potential in the field of computer vision-based surveillance. The proposed system can also be used in automatically identifying potential areas of criminal activity. Future efforts will aim towards using auto-augmentation methods to cope up against data scarcity, imposing more constraints on the visual cues to identify tailing events, borrowing key concepts from human-interaction recognition for tailing detection, and an analysis of the effects of image sequence length on the performance and processing speed.

Author Contributions

Conceptualization, S.L. and J.L.; methodology, S.L., J.L. and W.C.; software, S.L. and J.L.; validation, J.L., Z.A.S. and U.P.; formal analysis, J.L. and Z.A.S.; investigation, J.L. and Z.A.S.; resources, U.P.; data curation, J.L., S.L. and W.C.; writing—original draft preparation, J.L., Z.A.S.; writing—review and editing, Z.A.S., U.P.; supervision, U.P.; project administration, U.P.; funding acquisition, U.P. All authors have read and agreed to the published version of the manuscript.

Funding

This work was partly supported by the Korea Agency for Infrastructure Technology Advancement (KAIA) grant funded by the Ministry of the Interior and Safety (Grant 21PQWO-B153358-03) and Basic Science Research Program through the National Research Foundation of Korea (NRF) funded by the Ministry of Education (NRF-2020R1F1A1072332).

Institutional Review Board Statement

Not applicable.

Informed Consent Statement

Not applicable.

Conflicts of Interest

The authors declare no conflict of interest.

References

  1. Data-Kidnapping-United Nations Office on Drugs and Crime. Available online: https://www.unodc.org/documents/data-and-analysis/Crime-statistics/Kidnapping.xls (accessed on 13 September 2021).
  2. Song, H.; Sun, C.; Wu, X.; Chen, M.; Jia, Y. Learning Normal Patterns via Adversarial Attention-Based Autoencoder for Abnormal Event Detection in Videos. IEEE Trans. Multimed. 2020, 22, 2138–2148. [Google Scholar] [CrossRef]
  3. Vats, K.; Fani, M.; Walters, P.; Clausi, D.; Zelek, J. Event Detection in Coarsely Annotated Sports Videos Via Parallel Multi Receptive Field 1D Convolutions; CVPR Workshop: Seattle, WA, USA, 2020; pp. 3856–3865. [Google Scholar]
  4. Gabeur, V.; Sun, C.; Alahari, K.; Schmid, C. Multi-Modal Transformer for Video Retrieval; ECCV: Aurora, CO, USA, 2020. [Google Scholar]
  5. Kanafani, H.; Ghauri, J.A.; Hakimov, S.; Ewerth, R. Unsupervised Video Summarization via Multi-source Features. In Proceedings of the ACM International Conference on Multimedia Retrieval (ICMR), Taipei, Taiwan, 21–24 August 2021; pp. 466–470. [Google Scholar]
  6. Ye, F.; Zheng, H.; Huang, C.; Zhang, Y. Deep Unsupervised Image Anomaly Detection: An Information Theoretic Framework. In Proceedings of the IEEE International Conference on Image Processing (ICIP), Anchorage, AK, USA, 19–22 September 2021; pp. 1609–1613. [Google Scholar]
  7. Lu, C.; Shi, J.; Jia, J. Abnormal Event Detection at 150 FPS in MATLAB; ICCV: Seoul, Korea, 2013; pp. 2720–2727. [Google Scholar]
  8. Cong, Y.; Yuan, J.; Liu, J. Abnormal Event Detection in Crowded Scenes Using Sparse Representation. Pattern Recognit. 2013, 46, 1851–1864. [Google Scholar] [CrossRef]
  9. Yuan, Y.; Fang, J.; Wang, Q. Online Anomaly Detection in Crowd Scenes via Structure Analysis. IEEE Trans. Cybern. 2015, 45, 548–561. [Google Scholar] [CrossRef]
  10. Chan, A.B.; Vasconcelos, N. Mixture of Dynamic Textures; ICCV: Beijing, China, 2005; pp. 641–647. [Google Scholar]
  11. Bera, A.; Kim, S.; Manocha, D. Realtime Anomaly Detection Using Trajectory-Level Crowd Behavior Learning; CVPR Workshops: Las Vegas, NV, USA, 2016; pp. 1289–1296. [Google Scholar]
  12. Chen, Z.; Li, W.; Fei, C.; Liu, B.; Yu, N. Robust Anomaly Detection via Fusion of Appearance and Motion Features. In Proceedings of the IEEE Visual Communications and Image Processing (VCIP), Taichung, Taiwan, 9–12 December 2018; pp. 1–4. [Google Scholar]
  13. Kwon, J.; Lee, K.M. A Unified Framework for Event Summarization and Rare Event Detection from Multiple Views. PAMI 2015, 37, 1737–1750. [Google Scholar] [CrossRef]
  14. Li, W.; Mahadevan, V.; Vasconcelos, N. Anomaly Detection and Localization in Crowded Scenes. PAMI 2014, 36, 18–32. [Google Scholar]
  15. Zhao, B.; Fei-Fei, L.; Xing, E.P. Online Detection of Unusual Events in Videos via Dynamic Sparse Coding; CVPR: Colorado Springs, CO, USA, 2011; pp. 3313–3320. [Google Scholar]
  16. Trichet, R.; Nevatia, R.; Burns, B. Video Event Classification with Temporal Partitioning. In Proceedings of the IEEE International Conference on Advanced Video and Signal Based Surveillance (AVSS), Karlsruhe, Germany, 25–28 August 2015; pp. 1–6. [Google Scholar]
  17. Shu, X.; Tang, J.; Qi, G.J.; Liu, W.; Yang, J. Hierarchical Long Short-Term Concurrent Memory for Human Interaction Recognition. PAMI 2021, 43, 1110–1118. [Google Scholar] [CrossRef] [Green Version]
  18. Lee, D.G.; Lee, S.W. Human Interaction Recognition Framework based on Interacting Body Part Attention. arXiv 2021, arXiv:2101.08967. [Google Scholar]
  19. Amraee, S.; Vafaei, A.; Jamshidi, K.; Adibi, P. Anomaly Detection and Localization in Crowded Scenes Using Connected Component Analysis. Multimed. Tools Appl. 2018, 77, 14767–14782. [Google Scholar] [CrossRef]
  20. Sikdar, A.; Chowdhury, A.S. An Adaptive Training-less Framework for Anomaly Detection in Crowd Scenes. Neurocomputing 2020, 415, 317–331. [Google Scholar] [CrossRef]
  21. Zhang, Y.; Lu, H.; Zhang, L.; Ruan, X. Combining Motion and Appearance Cues for Anomaly Detection. Pattern Recognit. 2016, 51, 443–452. [Google Scholar] [CrossRef]
  22. Ma, Q. Abnormal Event Detection in Videos Based on Deep Neural Networks. Mach. Learn. Image Video Process. 2021, 2021, 6412608. [Google Scholar] [CrossRef]
  23. Xu, M.; Zhang, Z.; Hu, H.; Wang, J.; Wang, L.; Wei, F.; Bai, X.; Liu, Z. End-to-End Semi-Supervised Object Detection with Soft Teacher; ICCV: Montreal, QC, Canada, 2021; pp. 3060–3069. [Google Scholar]
  24. Yuan, Y.; Fu, R.; Huang, L.; Zhang, C.; Chen, X.; Wang, J. HRT: High-Resolution Transformer for Dense Prediction. arXiv 2021, arXiv:2110.09408. [Google Scholar]
  25. Wang, W.; Chang, F.; Mi, H. Intermediate Fused Network with Multiple Timescales for Anomaly Detection. Neurocomputing 2021, 433, 37–49. [Google Scholar] [CrossRef]
  26. Ilg, E.; Mayer, N.; Saikia, T.; Keuper, M.; Dosovitskiy, A.; Brox, T. FlowNet 2.0: Evolution of Optical Flow Estimation with Deep Networks; CVPR: Honolulu, HI, USA, 2017; pp. 1647–1655. [Google Scholar]
  27. Zhao, Y.; Deng, B.; Shen, C.; Liu, Y.; Lu, H.; Hua, X.S. Spatio-Temporal AutoEncoder for Video Anomaly Detection. In Proceedings of the 25th ACM International Conference on Multimedia. Association for Computing Machinery, Mountain View, CA, USA, 23–27 October 2017; pp. 1933–1941. [Google Scholar]
  28. Stauffer, C.; Grimson, W. Learning Patterns of Activity Using Real-Time Tracking. PAMI 2000, 22, 747–757. [Google Scholar] [CrossRef] [Green Version]
  29. Zhang, T.; Lu, H.; Li, S. Learning Semantic Scene Models by Object Classification and Trajectory Clustering; CVPR: Miami, FL, USA, 2009; pp. 1940–1947. [Google Scholar]
  30. Basharat, A.; Gritai, A.; Shah, M. Learning Object Motion Patterns for Anomaly Detection and Improved Object Detection; CVPR: Anchorage, AK, USA, 2008; pp. 1–8. [Google Scholar]
  31. Cui, X.; Liu, Q.; Gao, M.; Metaxas, D.N. Abnormal Detection Using Interaction Energy Potentials; CVPR: Colorado Springs, CO, USA, 2011; pp. 3161–3167. [Google Scholar]
  32. Jiang, F.; Yuan, J.; Tsaftaris, S.; Katsaggelos, A. Anomalous Video Event Detection Using Spatiotemporal Context. Comput. Vis. Image Underst. 2011, 115, 323–333. [Google Scholar] [CrossRef]
  33. LeCun, Y.; Bottou, L.; Bengio, Y.; Haffner, P. Gradient-Based Learning Applied to Document Recognition. Proc. IEEE 1998, 86, 2278–2324. [Google Scholar] [CrossRef] [Green Version]
  34. Dosovitskiy, A.; Beyer, L.; Kolesnikov, A.; Weissenborn, D.; Zhai, X.; Unterthiner, T.; Dehghani, M.; Minderer, M.; Heigold, G.; Gelly, S.; et al. An Image is Worth 16x16 Words: Transformers for Image Recognition at Scale. arXiv 2020, arXiv:2010.11929. [Google Scholar]
  35. Hasan, M.; Choi, J.; Neumann, J.; Chowdhury, A.K.R.; Davis, L.S. Learning Temporal Regularity in Video Sequences; CVPR: Las Vegas, NV, USA, 2016; pp. 733–742. [Google Scholar]
  36. Are You Being Followed on Foot or By Car? What to, Do. Available online: https://www.huffpost.com/entry/are-you-being-followed-on_b_5096448 (accessed on 15 October 2021).
  37. Frank, R.J.; Davey, N.; Hunt, S.P. Time Series Prediction and Neural Networks. J. Intell. Robot. Syst. 2001, 31, 91–103. [Google Scholar] [CrossRef]
  38. Magdy, N.; Sakr, M.A.; Mostafa, T.; El-Bahnasy, K. Review on Trajectory Similarity Measures. In Proceedings of the IEEE Seventh International Conference on Intelligent Computing and Information Systems (ICICIS), Cairo, Egypt, 12–14 December 2015; pp. 613–619. [Google Scholar]
  39. Eiter, T.; Mannila, H. Computing Discrete Fréchet Distance; Technical Report; Citeseer: Princeton, NJ, USA, 1994. [Google Scholar]
  40. Lahitani, A.R.; Permanasari, A.E.; Setiawan, N.A. Cosine Similarity to Determine Similarity Measure: Study Case in Online Essay Assessment. In Proceedings of the 4th International Conference on Cyber and IT Service Management, Bandung, Indonesia, 26–27 April 2016; pp. 1–6. [Google Scholar]
  41. Krizhevsky, A.; Sutskever, I.; Hinton, G.E. Imagenet Classification with Deep Convolutional Neural Networks. Adv. Neural Inf. Process. Syst. 2012, 25, 1097–1105. [Google Scholar] [CrossRef]
  42. He, K.; Zhang, X.; Ren, S.; Sun, J. Deep Residual Learning for Image Recognition; CVPR: Las Vegas, NV, USA, 2016; pp. 770–778. [Google Scholar]
  43. Vaswani, A.; Shazeer, N.; Parmar, N.; Uszkoreit, J.; Jones, L.; Gomez, A.N.; Kaiser, Ł.; Polosukhin, I. Attention is All You Need. In Advances in Neural Information Processing Systems; The MIT Press: Cambridge, MA, USA, 2017; pp. 5998–6008. [Google Scholar]
  44. Mahadevan, V.; Li, W.; Bhalodia, V.; Vasconcelos, N. Anomaly Detection in Crowded Scenes; CVPR: San Francisco, CA, USA, 2010; pp. 1975–1981. [Google Scholar]
  45. Robbins, H.; Monro, S. A Stochastic Approximation Method. Ann. Math. Stat. 1951, 22, 400–407. [Google Scholar] [CrossRef]
  46. Simonyan, K.; Zisserman, A. Very Deep Convolutional Networks for Large-Scale Image Recognition. arXiv 2014, arXiv:1409.1556. [Google Scholar]
  47. Loshchilov, I.; Hutter, F. Decoupled Weight Decay Regularization. arXiv 2017, arXiv:1711.05101. [Google Scholar]
  48. Goyal, P.; Dollár, P.; Girshick, R.; Noordhuis, P.; Wesolowski, L.; Kyrola, A.; Tulloch, A.; Jia, Y.; He, K. Accurate, Large Minibatch SGD: Training Imagenet in 1 h. arXiv 2017, arXiv:1706.02677. [Google Scholar]
  49. Loshchilov, I.; Hutter, F. SGDR: Stochastic Gradient Descent with Warm Restarts. arXiv 2016, arXiv:1608.03983. [Google Scholar]
  50. Kannojia, S.P.; Jaiswal, G. Effects of Varying Resolution on Performance of CNN Based Image Classification: An Experimental Study. Int. J. Comput. Sci. Eng. 2018, 6, 451–456. [Google Scholar] [CrossRef]
Figure 1. Real world example of tailing, in the streets of London (source-YouTube). On left: Two examples of tailing, in both cases the tailing person was yielding a knife while tailing (London). On Right: Three examples of tailing, followed by snatching (India). Suspect in red rectangle, while victim in yellow rectangle.
Applsci 11 11591 g001
Figure 2. Pedestrian location information is encoded into a one-hot pattern; white regions represent the background, and black regions represent the bounding box surrounding each pedestrian. The encoded location information is concatenated along the time axis to form a 1 × N × H × W-dimensional tensor.
Applsci 11 11591 g002
Figure 3. The network architecture of simple-CNN and ResNet.
Applsci 11 11591 g003
Figure 4. Overall process of the proposed TSViT-based tailing detector.
Applsci 11 11591 g004
Figure 5. Frames of different videos from the Sogang Tailing Dataset (STD). Suspect: Red rectangle, Victim: Yellow rectangle, Pedestrians: Green rectangle, Volunteers mimicking a non-tailing event: Cyan rectangle.
Applsci 11 11591 g005
Figure 6. The handcrafted rule-based tailing detection method fails to detect tailing when (a) victim is partially occluded or (b) fully occluded by the suspect. The rule-based method also fails to handle the perspective effect depicted in (c,d).
Applsci 11 11591 g006
Figure 7. Performance of each network according to model size.
Applsci 11 11591 g007
Figure 8. A very small region (yellow) in layer 3 represents a large receptive field (yellow and green grids of layer 1), resulting in loss of spatial information. Moreover, the bigger receptive field in layer 1 (yellow and green) represents more contextual information, which negatively affect the tailing detection performance as discussed in Section 3.2.
Applsci 11 11591 g008
Table 1. Tailing detection performance comparison among different CNN architectures.
Tailing
ModelParams (M)Accuracy (%)PrecisionRecall
Simple-CNN22963.540.72240.6741
Simple-ResNet58459.370.71480.5794
ResNet-50/512159160.240.62550.9025
ResNet-101/512241062.320.63710.9192
ResNet-152/512339961.630.64620.8496
Table 2. Details of the various Vision Transformer architectures used in our experiments.
ModelLayersHidden Size DMLP SizeHeadsParams(M)
TSViT-S/25661024204816448
TSViT-B/25612768307212516
TSViT-L/2562410244096161408
TSViT-B/512127683072121092
TSViT-S/512610242048161216
TSViT-L/5122410244096162176
Table 3. Performance comparison of the proposed end-to-end TSViT-based tailing detection frameworks.
Tailing
ModelParams (M)Accuracy (%)PrecisionRecall
TSViT-S/25644874.650.76310.8607
TSViT-B/25651671.350.71850.8886
TSViT-L/256140873.090.76290.8245
TSViT-B/512109276.560.73330.9805
TSViT-S/512121674.650.76310.8607
TSViT-L/512217673.090.76290.8245
Table 4. Performance comparison between proposed ORS and the sliding window-based sampling method.
ModelAccuracy (%)PrecisionRecall
TSViT with Sliding Window71.030.78600.7362
TSViT with ORS73.900.75060.8732
Publisher’s Note: MDPI stays neutral with regard to jurisdictional claims in published maps and institutional affiliations.

