Article

A Hard Example Mining Approach for Concealed Multi-Object Detection of Active Terahertz Image

1
MIIT Key Laboratory of Pattern Analysis and Machine Intelligence, Collaborative Innovation Center of Novel Software Technology and Industrialization, College of Computer Science and Technology, Nanjing University of Aeronautics and Astronautics, Nanjing 211106, China
2
Shanghai Institute of Satellite Engineering (SISE), Shanghai 201108, China
*
Author to whom correspondence should be addressed.
Appl. Sci. 2021, 11(23), 11241; https://doi.org/10.3390/app112311241
Submission received: 29 October 2021 / Revised: 21 November 2021 / Accepted: 24 November 2021 / Published: 26 November 2021

Abstract

:
Concealed objects detection in terahertz imaging is an urgent need for public security and counter-terrorism. So far, there is no public terahertz imaging dataset for the evaluation of objects detection algorithms. This paper provides a public dataset for evaluating multi-object detection algorithms in active terahertz imaging. Due to high sample similarity and poor imaging quality, object detection on this dataset is much more difficult than on those commonly used public object detection datasets in the computer vision field. Since the traditional hard example mining approach is designed based on the two-stage detector and cannot be directly applied to the one-stage detector, this paper designs an image-based Hard Example Mining (HEM) scheme based on RetinaNet. Several state-of-the-art detectors, including YOLOv3, YOLOv4, FRCN-OHEM, and RetinaNet, are evaluated on this dataset. Experimental results show that the RetinaNet achieves the best mAP and HEM further enhances the performance of the model. The parameters affecting the detection metrics of individual images are summarized and analyzed in the experiments.

1. Introduction

Detecting concealed objects underneath clothing is a critical task in public security inspection, while the traditional manual check is often criticized with inefficiency, invasion of privacy, and high rate of missed detection. Terahertz waves, which are between microwave and infrared, are electromagnetic waves with frequencies ranging from 0.1 to 10 terahertz. Due to its high penetration, low energy, coherence, and fingerprint spectrum of most substances in the terahertz band, terahertz imaging technology [1,2,3,4] provides a non-contact and non-destructive way to discover objects concealed underneath clothing with no harm to health.
According to the presence or absence of terahertz source irradiation, there are two categories of terahertz imaging systems: passive [1,5,6] and active [2,3,7]. The passive imaging system needs no terahertz irradiation source but relies on the terahertz radiation energy of the measured object itself to reconstruct an image. The active imaging system utilizes a terahertz source to irradiate the object and uses the reflected or transmitted signal to reconstruct the image. Due to the weak radiation of the human body, passive imaging requires a sensitive receptor and has difficulty avoiding environmental disturbance. In an active imaging system, the signal frequency linearity, phase noise, transmitter power, receiver noise factor, and other indicators play significant roles in the imaging quality. Therefore, the difficult acquisition and low quality of terahertz images remain a technical bottleneck for object detection.
Previous work focused more on the task of segmenting terahertz images and yielded many results. However, in many visual tasks, especially in a security check system, the desired output should include localization, i.e., a class label is supposed to be assigned to each pixel. Traditional object recognition often follows the detection-first regime. Unfortunately, the imaging quality mentioned above leads to poor detection. As far as we know, there is no public terahertz dataset for multi-target detection. For both of these reasons, multi-object detection techniques for terahertz images are not well developed. Our work focuses on this problem in the hope of advancing the task.
In this paper, we provide an active terahertz imaging dataset for multi-object detection. The state-of-the-art deep-learning-based object detectors YOLOv3 [8], YOLOv4 [9], FRCN-OHEM [10] and RetinaNet [11] are evaluated on the dataset. Due to the high sample similarity, poor imaging quality, and small objects of terahertz images, general detectors do not perform well on this dataset. In order to detect smaller objects, we extended RetinaNet by embedding low-level features. Aiming at solving the problem of unbalanced training samples, we proposed a new Hard Example Mining (HEM) approach for the multi-object detection of terahertz images. Focal loss [11] and HEM are discussed and tested in this paper. We compare in detail the parameters that affect the image detection metrics and give a method for selecting the optimal threshold.
The contributions of this paper are three-fold:
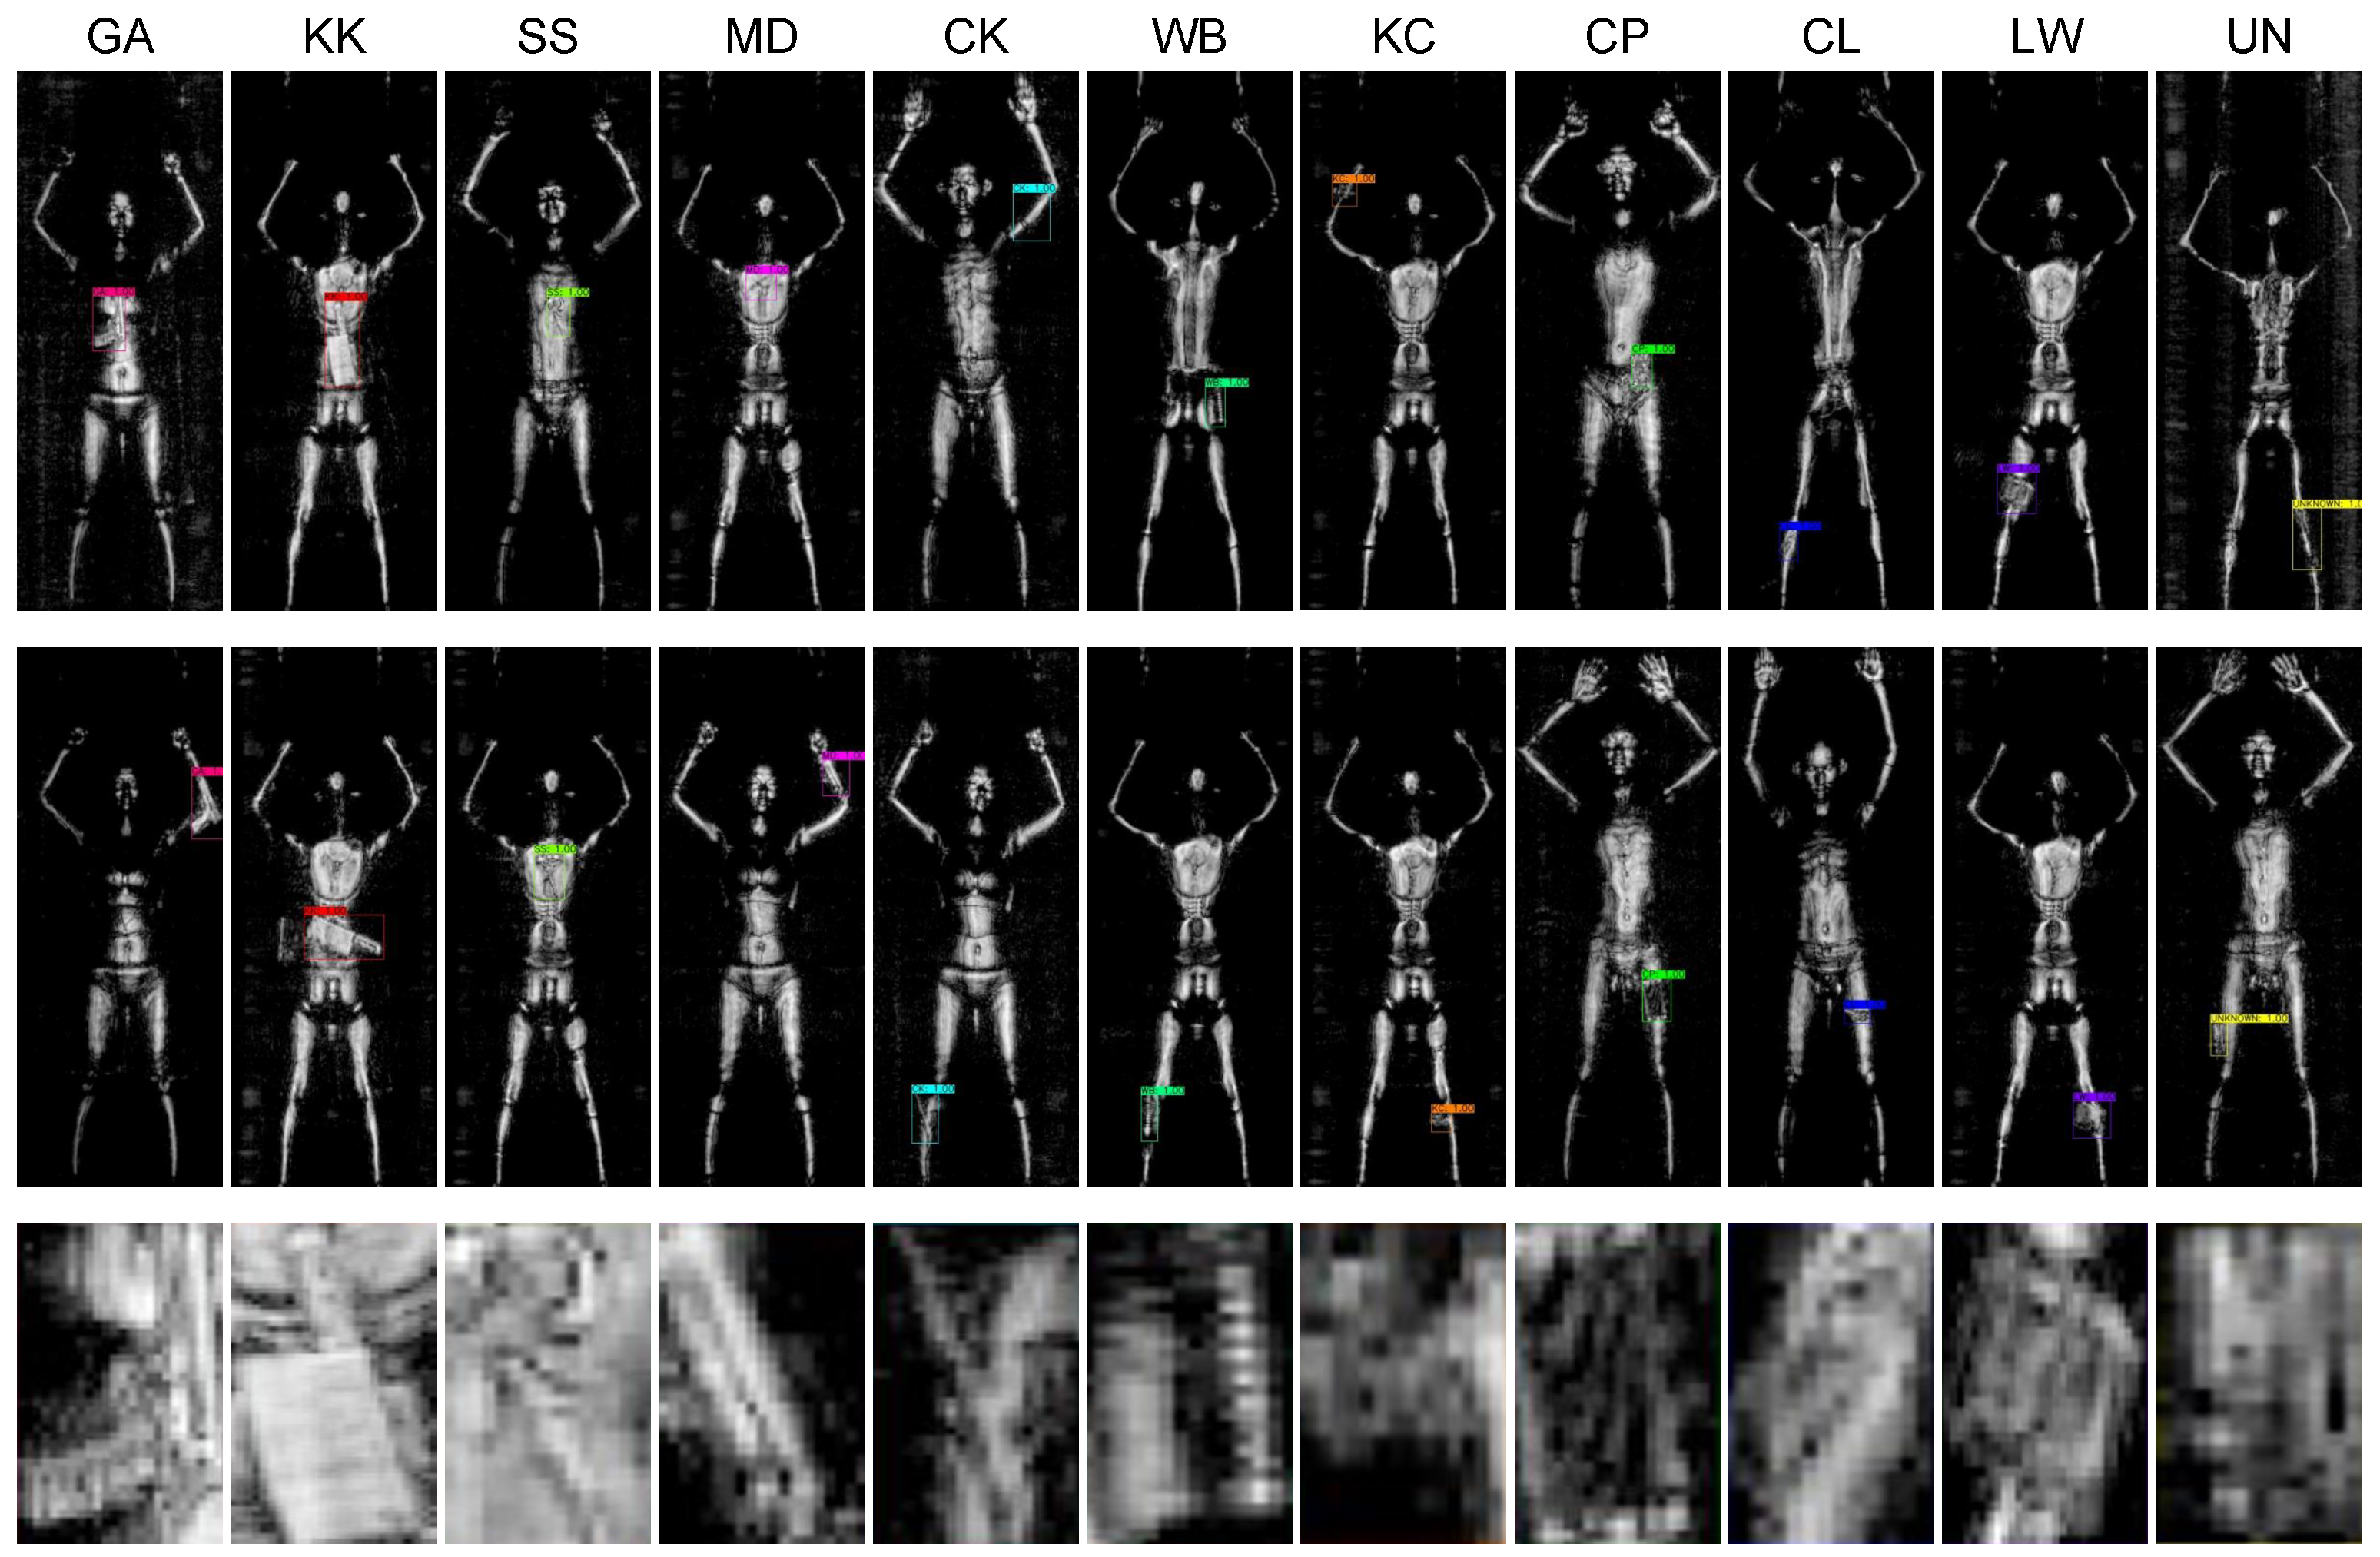
  • Provide an active terahertz imaging dataset for concealed multi-object detection. To our knowledge, there is no public dataset in terahertz imaging to evaluate multi-object detection algorithm. We provide an active terahertz imaging dataset for multi-object detection with 3157 image samples with 1347 concealed objects.
  • An image-based Hard Example Mining scheme based on RetinaNet is designed, and four state-of-the-art object detectors are evaluated on this dataset. The experiment indicates that HEM further improves the performance of the RetinaNet.
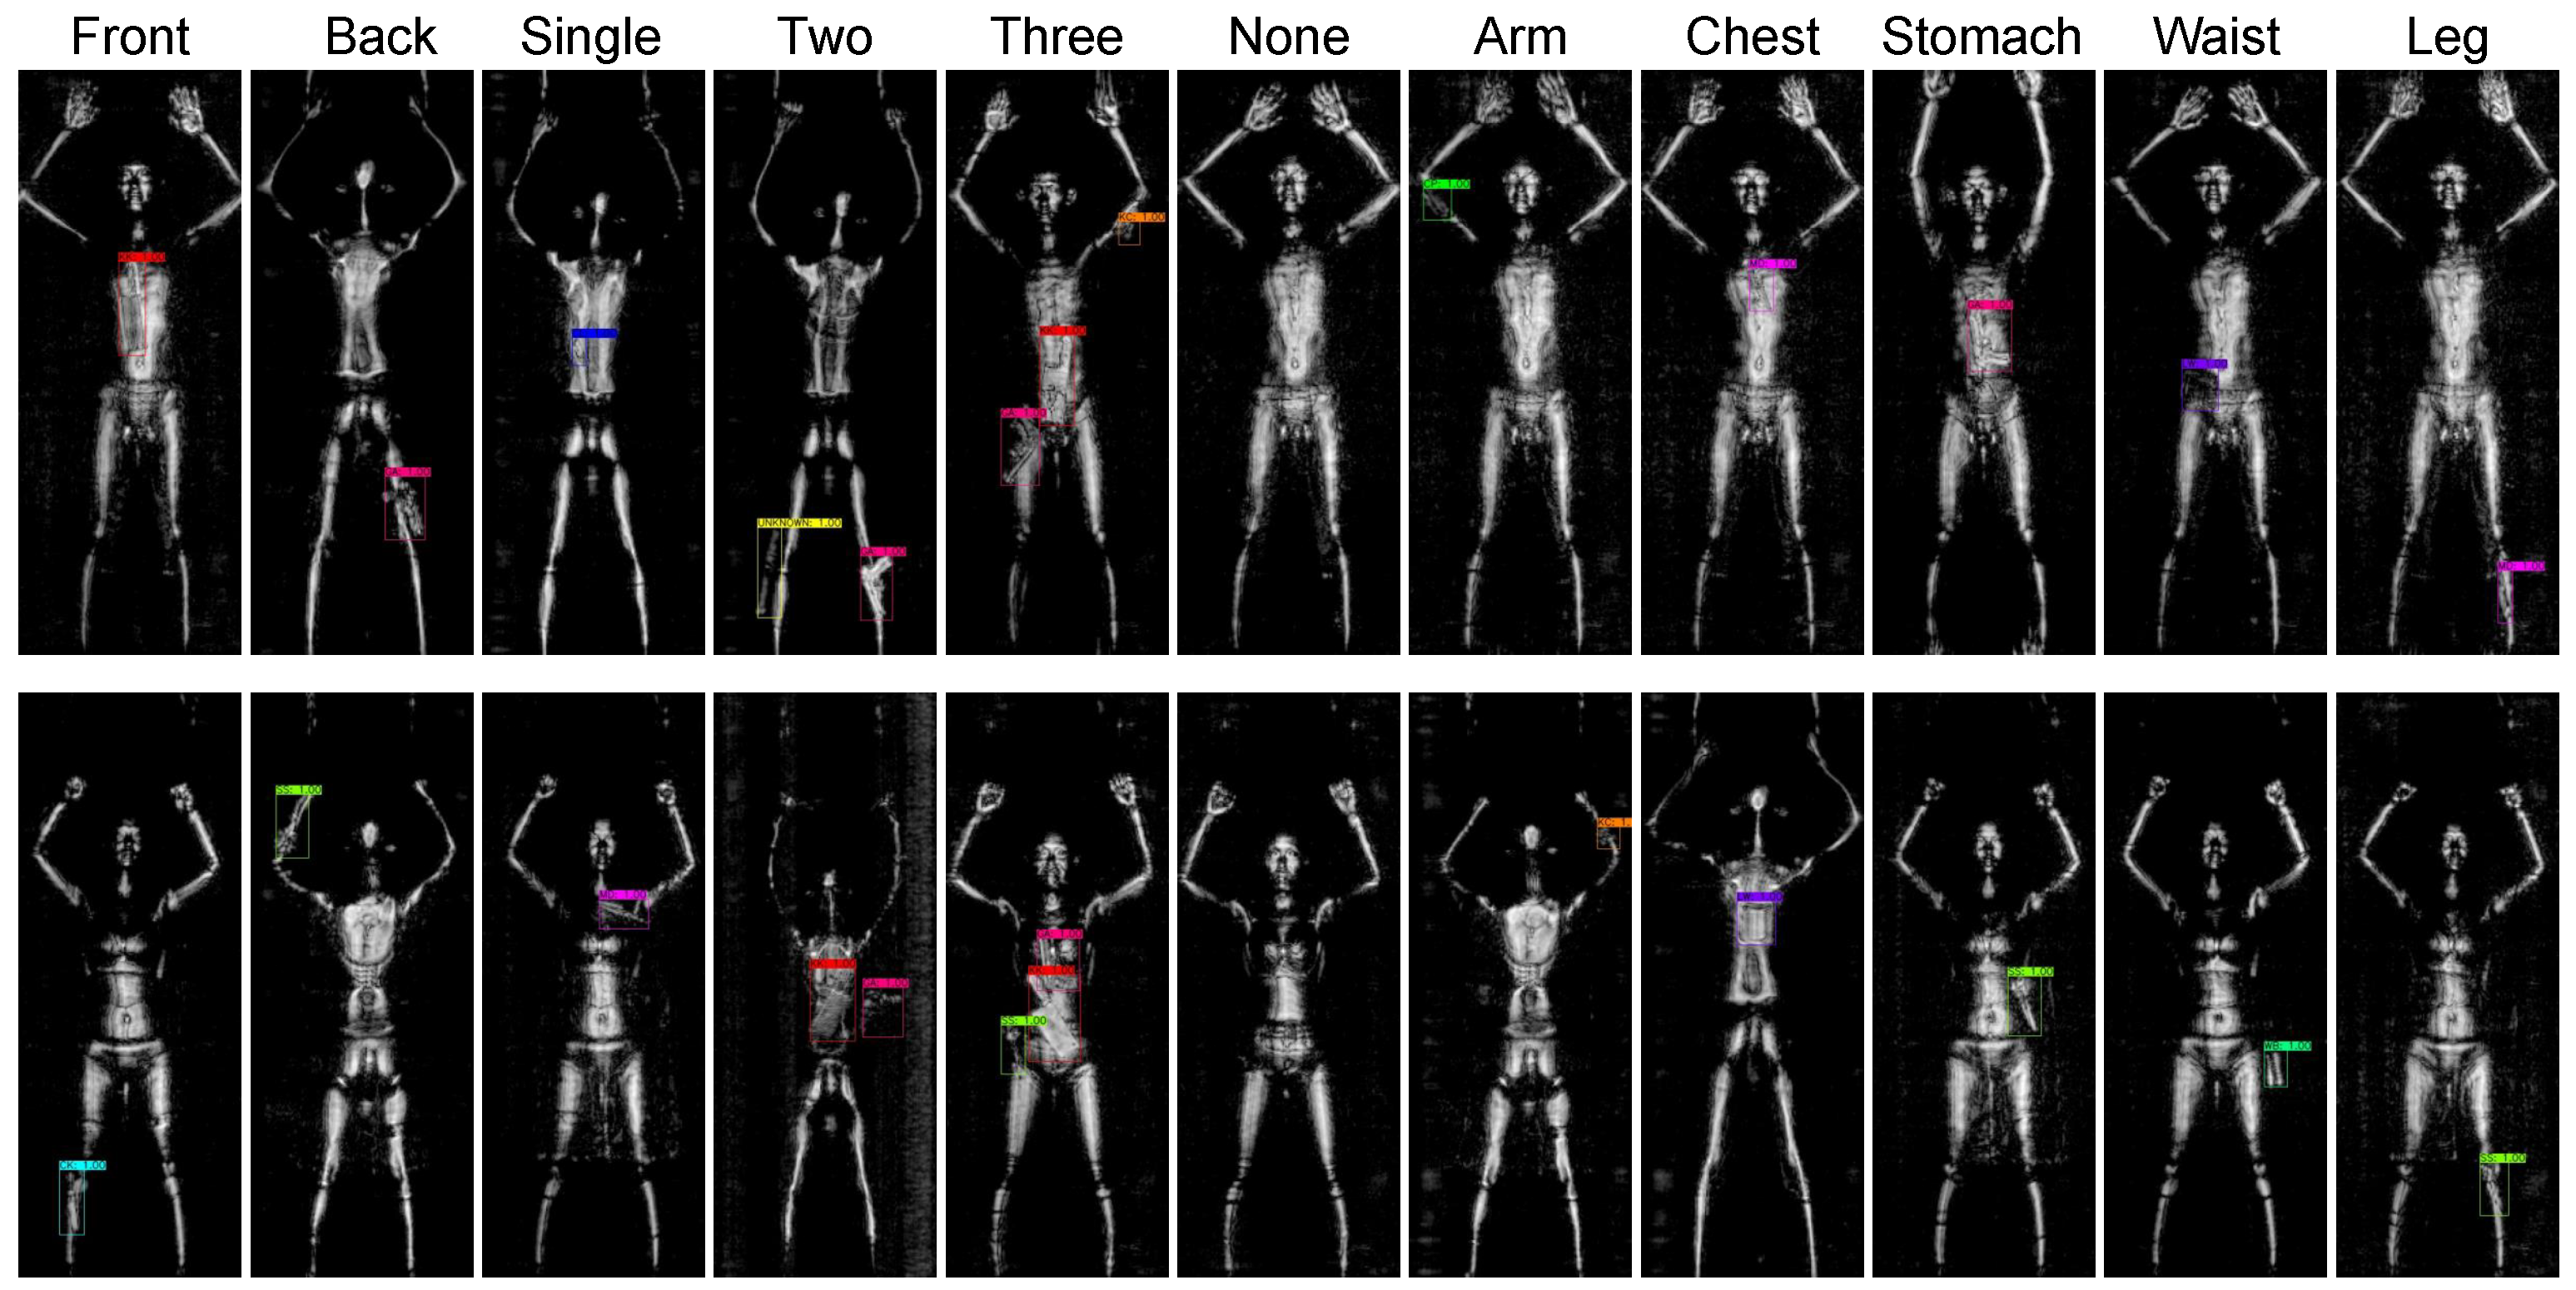
  • The experiment indicates that hiding objects in different parts of the human body affect detection accuracy. The parameters affecting the single-image detection metrics are summarized and analyzed in the experiments.
The remainder of this paper is organized as follows: we discuss the related work in Section 2. The details of our proposed terahertz dataset are described in Section 3. We formulate the problem and describe the proposed method in detail in Section 4. The experimental results are presented and discussed in Section 5, and the conclusions and future work are presented in Section 6.

2. Related Work

2.1. Object Detection in Terahertz Image

Due to poor imaging quality and immature level of object detection technology, earlier work paid more attention to object segmentation in terahertz images. Shen [6] proposed a multi-level threshold segmentation algorithm to model radiation temperature using a Gaussian mixture model, which used an anisotropic diffusion algorithm to remove noise. Yeom [5] also used the Mixed Gaussian model to estimate object boundary. Due to the complexity of terahertz imaging, the above methods can only obtain rough segmentation results. In our previous work [7], we proposed a deep-learning-based method—Mask Conditional Generative Adversarial Nets (Mask-CGANs)—to segment objects in a terahertz image of poor quality.
Convolutional neural networks have excelled in a wide range of tasks, and they have been applied to terahertz image object detection. Yao [12] used a sliding window to slide on the terahertz image to obtain the sub-images and obtained the probability of the existence of the object in each sub-image. Then, the probabilities of each sub-image were accumulated to obtain the probability map of the whole image. Finally, the location and the bounding box of the object were obtained by threshold filtering. Wang [13] improved on Yao’s work by using a two-step search method instead of an exhaustive search to reduce the computational complexity. All the methods detected a single hidden object but ignored the situation of multiple objects in practical application.
In addition to the above approaches specifically designed for terahertz image object detection, M. Kowalski [14,15] verified the performance of three universal object detectors (i.e., SSD [16], R-FCN [17], and YOLOv3 [8]) on terahertz image dataset. It was demonstrated that SSD and YOLOv3 have faster detection speeds, while R-FCN has a higher detection rate. Zhang [18] proposed an improved Faster R-CNN [19] to detect terahertz images. The input image needs to pass through the Faster R-CNN and human body threshold segmentation branch to detect the object and the human body.
While there has been research work dedicated to deep learning terahertz image object detection, the lack of publicly available terahertz datasets due to the sensitive nature of terahertz imaging technology and privacy protection has limited research in this direction. We hope that our proposed terahertz multi-object detection dataset facilitates the development of this research.

2.2. Hard Example Mining in Object Detection

There is an imbalance problem in object detection, as the number of negative samples in the training dataset is usually much larger than the number of positive samples. During the training process of the model aiming at minimizing the loss function, the large number of negative samples often causes excessive weighting, leading to the degradation of detection accuracy.
In general, the detector has to constrain the loss of positive and negative samples in order to balance the positive and negative samples. In the two-stage detector, the number of negative samples is generally reduced by downsampling the negative samples RoI. In the one-stage detector, the weights of positive and negative samples are generally adjusted directly on the loss function.
Besides the above general methods of balancing positive and negative samples, there are also some methods that specialize in mining hard samples. OHEM [10] is a classic method in hard example mining. OHEM emphasizes the mining of hard samples and does not distinguish between hard positive and hard negative samples. In addition, it selects samples each time as those with large losses without setting the proportion of positive and negative samples. Since OHEM selects hard samples based on the total loss, and the ratio of classification loss and regression loss varies during the training of the network, this loss is not completely reliable. To address the above problems, S-OHEM [20] proposes a distribution sampling method according to the losses of different training stages. This method divides the losses into four stages, and the scaling parameters of classification loss and regression loss are different for each stage. However, the hard example mining method described above cannot be directly applied to a one-stage target detector; therefore, we have proposed a Hard Example Mining method applicable to RetinaNet.

3. Active Terahertz Object Detection Dataset

Previous work on terahertz images has been less extensive, and most experiments have been conducted on their own datasets. A dataset containing 1440 terahertz images for segmentation was proposed in our previous work [7]. These samples are sampled from four subjects (360 for each one including fore and back views) containing weapons such as guns, knives, or nothing. To the best of our knowledge, no terahertz dataset for multiple target detection has been proposed in previous work.
A terahertz security inspection gate developed by Terahertz Research Centre, China Academy of Engineering Physics, was used for dataset acquisition. This imaging system adopts array scanning mode, works at 140 GHz, with imaging resolution of 5 mm by 5 mm. When acquiring data, human models stand with hidden objects in their clothing. This dataset is diversified—objects are hidden in different positions of human body, and the number of hidden objects in an image is from 0 to 3. There are four male and six female models with an equal amount of participation during image acquisition. Images acquired in each imaging include the front and back of the model. Eleven classes of objects and their corresponding quantity of object are labeled as shown in Table 1. Note that the Class Unknown (UN) refers to those objects that do not fall into the 10 clear classes. We annotated the bounding boxes and class labels of the acquired terahertz dataset in Pascal VOC format [21]. Figure 1 shows some visual annotations of each category, and Figure 2 shows some visual annotations of diversification.
The statistical result of the terahertz dataset is shown in Table 2. Figure 3 shows the statistical result of the object size and number distribution in the dataset. Green strips in the figure indicate average object size, and blue circles are the quantity for each class. The dataset is available online. Link: https://github.com/LingLIx/THz_Dataset (accessed on 29 September 2021).

4. Methodology

Object detection aims at inferring the location, size, and class label of the object on an image. In this section, we discuss the detectors we used for evaluation in the dataset. We also introduced an HEM strategy to enhance RetinaNet to detect smaller objects. Details of the methods are described as follows:

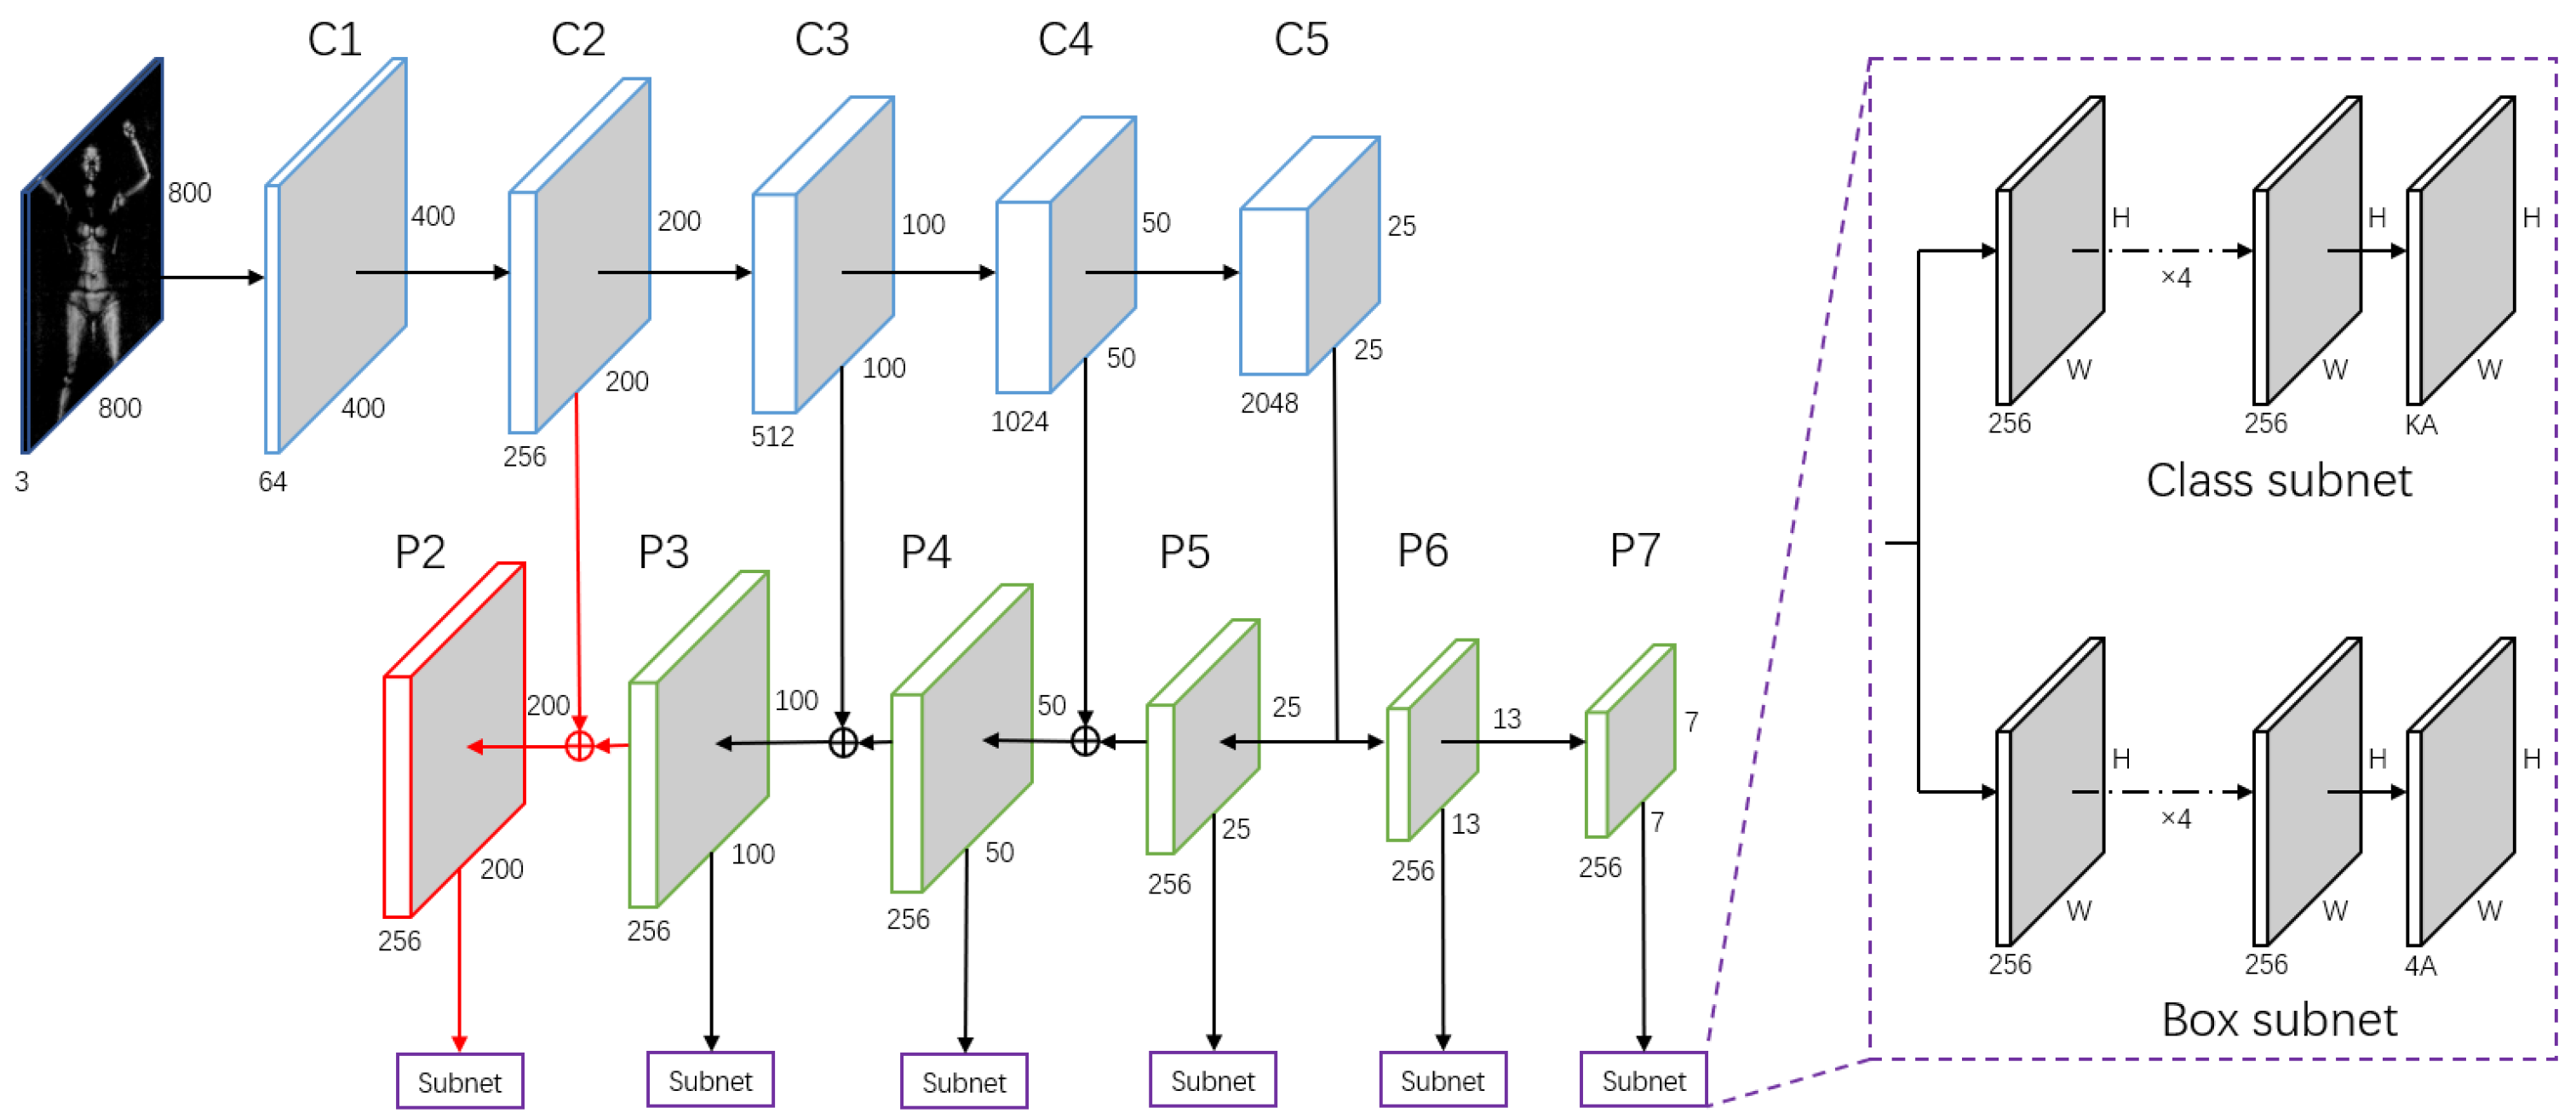
4.1. The Basic Detector

RetinaNet [11] is a one-stage object detection algorithm, which directly regresses and classifies the bounding box. Its network structure is shown in Figure 4 except for the red part. In this network, the Resnet-50 structure [22] is selected as the feature extraction network (Blue part). In order to make the model have better multi-scale detection capability, the feature pyramid structure of high-level and low-level feature fusion was adopted (Green part). The final multi-level feature map is followed by the sub-network of object classification and bounding box regression (Purple part).
Deep residual networks use blocks of residuals to connect the inputs and outputs of adjacent layers, improving the “gradient disappearance” and “gradient explosion” problems in model training. The feature pyramid combines high-level and low-level features to improve the detection performance of the model. The input features are obtained from each feature pyramid level, and then the convolution layer decoding features with four convolution kernels of 3 × 3 and output channels of 256 are used. The difference lies in the final output layer. The output of the classification sub-network converts the output channel to be the same as the number of object categories (K) multiplied by the number of detection anchors (A), i.e., the number of output channels is K × A. Finally, the prediction results of each channel are binarized through the sigmoid function to determine whether it is the corresponding category of the channel. The output of the detection box regression sub-network passes through the linear transformation converts the output to a vector of 4 × A. Classification sub-network does not share parameters with box regression sub-network. Sub-networks share parameters among different levels of the feature pyramid.
Object detection problem is a typical class imbalance problem. Take the two-class object detection as an example: the number of negative samples (i.e., scene background) needed for training is often much larger than the number of positive samples (i.e., objects). However, in the model training process to minimize the loss function, the introduction of a large number of negative class samples often causes bias, resulting in the decline of detection accuracy.
Focal Loss (FL) are designed for the unbalanced sample problem in RetinaNet. FL is based on the binary cross-entropy function as follows:
C E ( p , y ) = { log ( p ) y = 1 log ( 1 p ) y = 1
In Formula (1), p represents the probability of prediction, with a positive label y = 1 and negative label y = 1 . P t is defined as follows:
P t = { p y = 1 1 p y = 1
We can obtain C E ( p , y ) = C E ( P t ) = l o g ( P t ) . In Formula (2), p represents the probability of model prediction, with positive label y = 1 and negative label y = 1 . The larger the prediction value of the positive class is, the better the prediction value of the negative class is, which is equivalent to optimizing the P t of all samples to the maximum. The binary classification cross entropy can calculate the classification error well, but the problem of sample imbalance still exists; therefore, the balanced cross-entropy is introduced.
C E ( P t ) = α log ( P t )
In Formula (3), α is the parameter matrix of positive and negative samples. For this case, the number of negative samples is larger than that of positive ones, for positive samples, α = 1 , and for negative samples, α = 0.25 . Therefore, the impact of positive samples on model loss function is larger than that of negative samples. On this basis, an adjustment factor ( 1 P t ) γ is added, and focal loss is finally obtained as follows:
F L ( P t ) = α ( 1 P t ) γ log ( P t )
In Formula (4), γ is the parameter regulating the contribution of hard and easy examples to the loss function. For the hard example, it is difficult to infer a high confidence score, and it obtains a lower P t . The smaller P t is, the larger ( 1 P t ) γ is; thus, a relatively large loss is generated. Similarly, for a simple example, it could obtain a higher P t . The larger P t is, the smaller ( 1 P t ) γ is, and the focus of model training is on the hard examples.

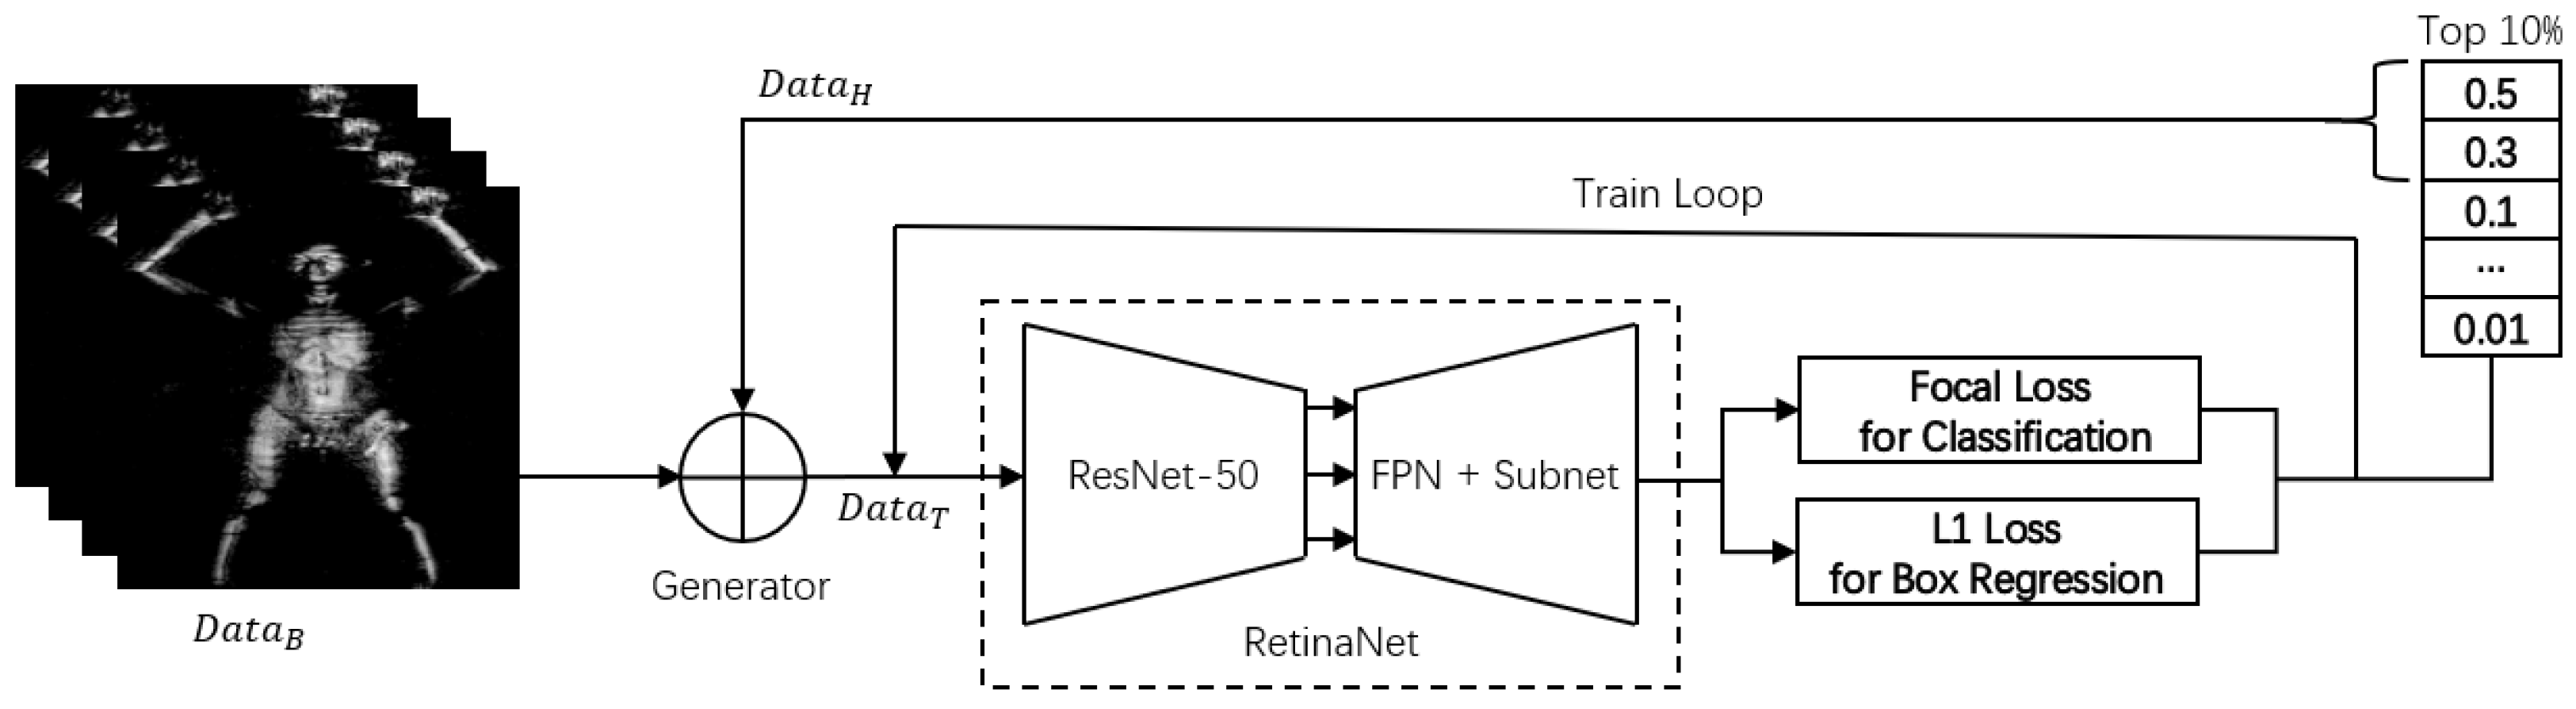
4.2. Hard Example Mining Approach

RetinaNet is a one-stage object detection algorithm, which directly regresses and classifies the bounding box of the object with fast detection speed. In order to deal with the sample imbalance problem, FL is used as the classification loss function in training. FL mainly solves the problem of positive and negative sample imbalance and also deals with the problem of hard examples. However, there are a small number of hard examples in the terahertz image dataset for which the effect of FL is limited.
OHEM provides a method to specifically mine hard examples for training. It is designed for a two-stage object detector and cannot be used directly for RetinaNet; therefore, we modified the process. We first train the basic detector, then used the detector to compute loss to select hard examples, and used these hard examples to reinforce training the detector. HEM is implemented by converting the selection hard RoI to selection hard examples. The HEM training process is shown in Figure 5, where D a t a B denotes the base terahertz image sample set, D a t a T denotes the training sample set, and  D a t a H denotes the hard example sample set.
The training process is mainly divided into two stages. The first stage is the training of the basic detector, and the second stage is the hard example mining and the intensive training of the model. In the first stage, the base terahertz image sample set is randomly disrupted and input to RetinaNet combined with focal loss to train the network directly until convergence. Once the basic detector training is complete, move on to the second stage. First, all training samples are passed through RetinaNet to calculate the loss, and then the top 10% samples with large loss are selected as hard examples according to the order of loss from largest to smallest. Finally, the hard example D a t a H and the base terahertz sample D a t a B are input into the training data generator, which is randomly disrupted to generate new training data D a t a T and continue to train the detector. The pseudo-code for the whole process is shown in Algorithm 1.
Algorithm 1: Hard example mining process.
Input: M o d e l = R e t i n a N e t : Detector
     D a t a B : Basic terahertz images
     D a t a H = N o n e : Hard examples
     D a t a T = D a t a B : Training examples
     T o p K = 10 % : Percentage of hard example
     L o o p = 20 : Training loops for hard examples
  1 /* Stage one                    ( */
  2 Initialize Use D a t a T to train M o d e l until convergence
  3 /* Stage two                    */
  4 while  Loss reduction  do ( (
Applsci 11 11241 i001
13end (
In the second stage, there are two methods of adding hard examples to the training data generator. The first is to ensure the training set size is constant and add hard examples after removing the easy classification samples (namely HEM E ’). The second is to directly add hard examples to expand the training set (namely HEM A ’). The following experiments show that using the second method to add difficult examples to the training set is more effective.

5. Results and Discussion

5.1. Single Class Comparison Experiments

The experiments first compared the effect of the percentage of hard examples and the number of iterations in the HEM process on the detection performance of RetinaNet. ResNet-50 is used as the feature extraction network, and focal loss is used as the classification loss function. We treat all objects as a single class to verify the performance of the method and use AP as an evaluation criterion.
The experimental results are shown in Table 3. The percentages of hard examples were selected as 5%, 10%, and 20% for comparison, where 0% indicates the performance of the trained base model when no HEM is performed. The number of iterations of training data after each HEM is selected as 10, 20 and 30 times for comparison. In terms of the percentage of hard examples, it is not the case that more hard examples being selected is better, and too few selections do not achieve the meaning of HEM. In a limited dataset, the proportion of hard examples is small, and there is no clear threshold for the samples selected according to the loss ranking. According to the experimental results, in the terahertz image object detection dataset, a better result can be achieved when the percentage of hard examples is 10%. In terms of the number of iterations, too many and too few iterations do not give the best performance for the model. According to the experimental results, the number of iterations (20) achieve the best results on different percentages of hard examples. Selecting hard examples to enhance the training model is a process of model enhancement and model overfitting equilibrium, and the number of iterations changes according to the number of new samples.
Overall, hard example mining works effectively on the single-class terahertz image object detection dataset, improving the AP of the model by 1.6% on top of the basic detector.

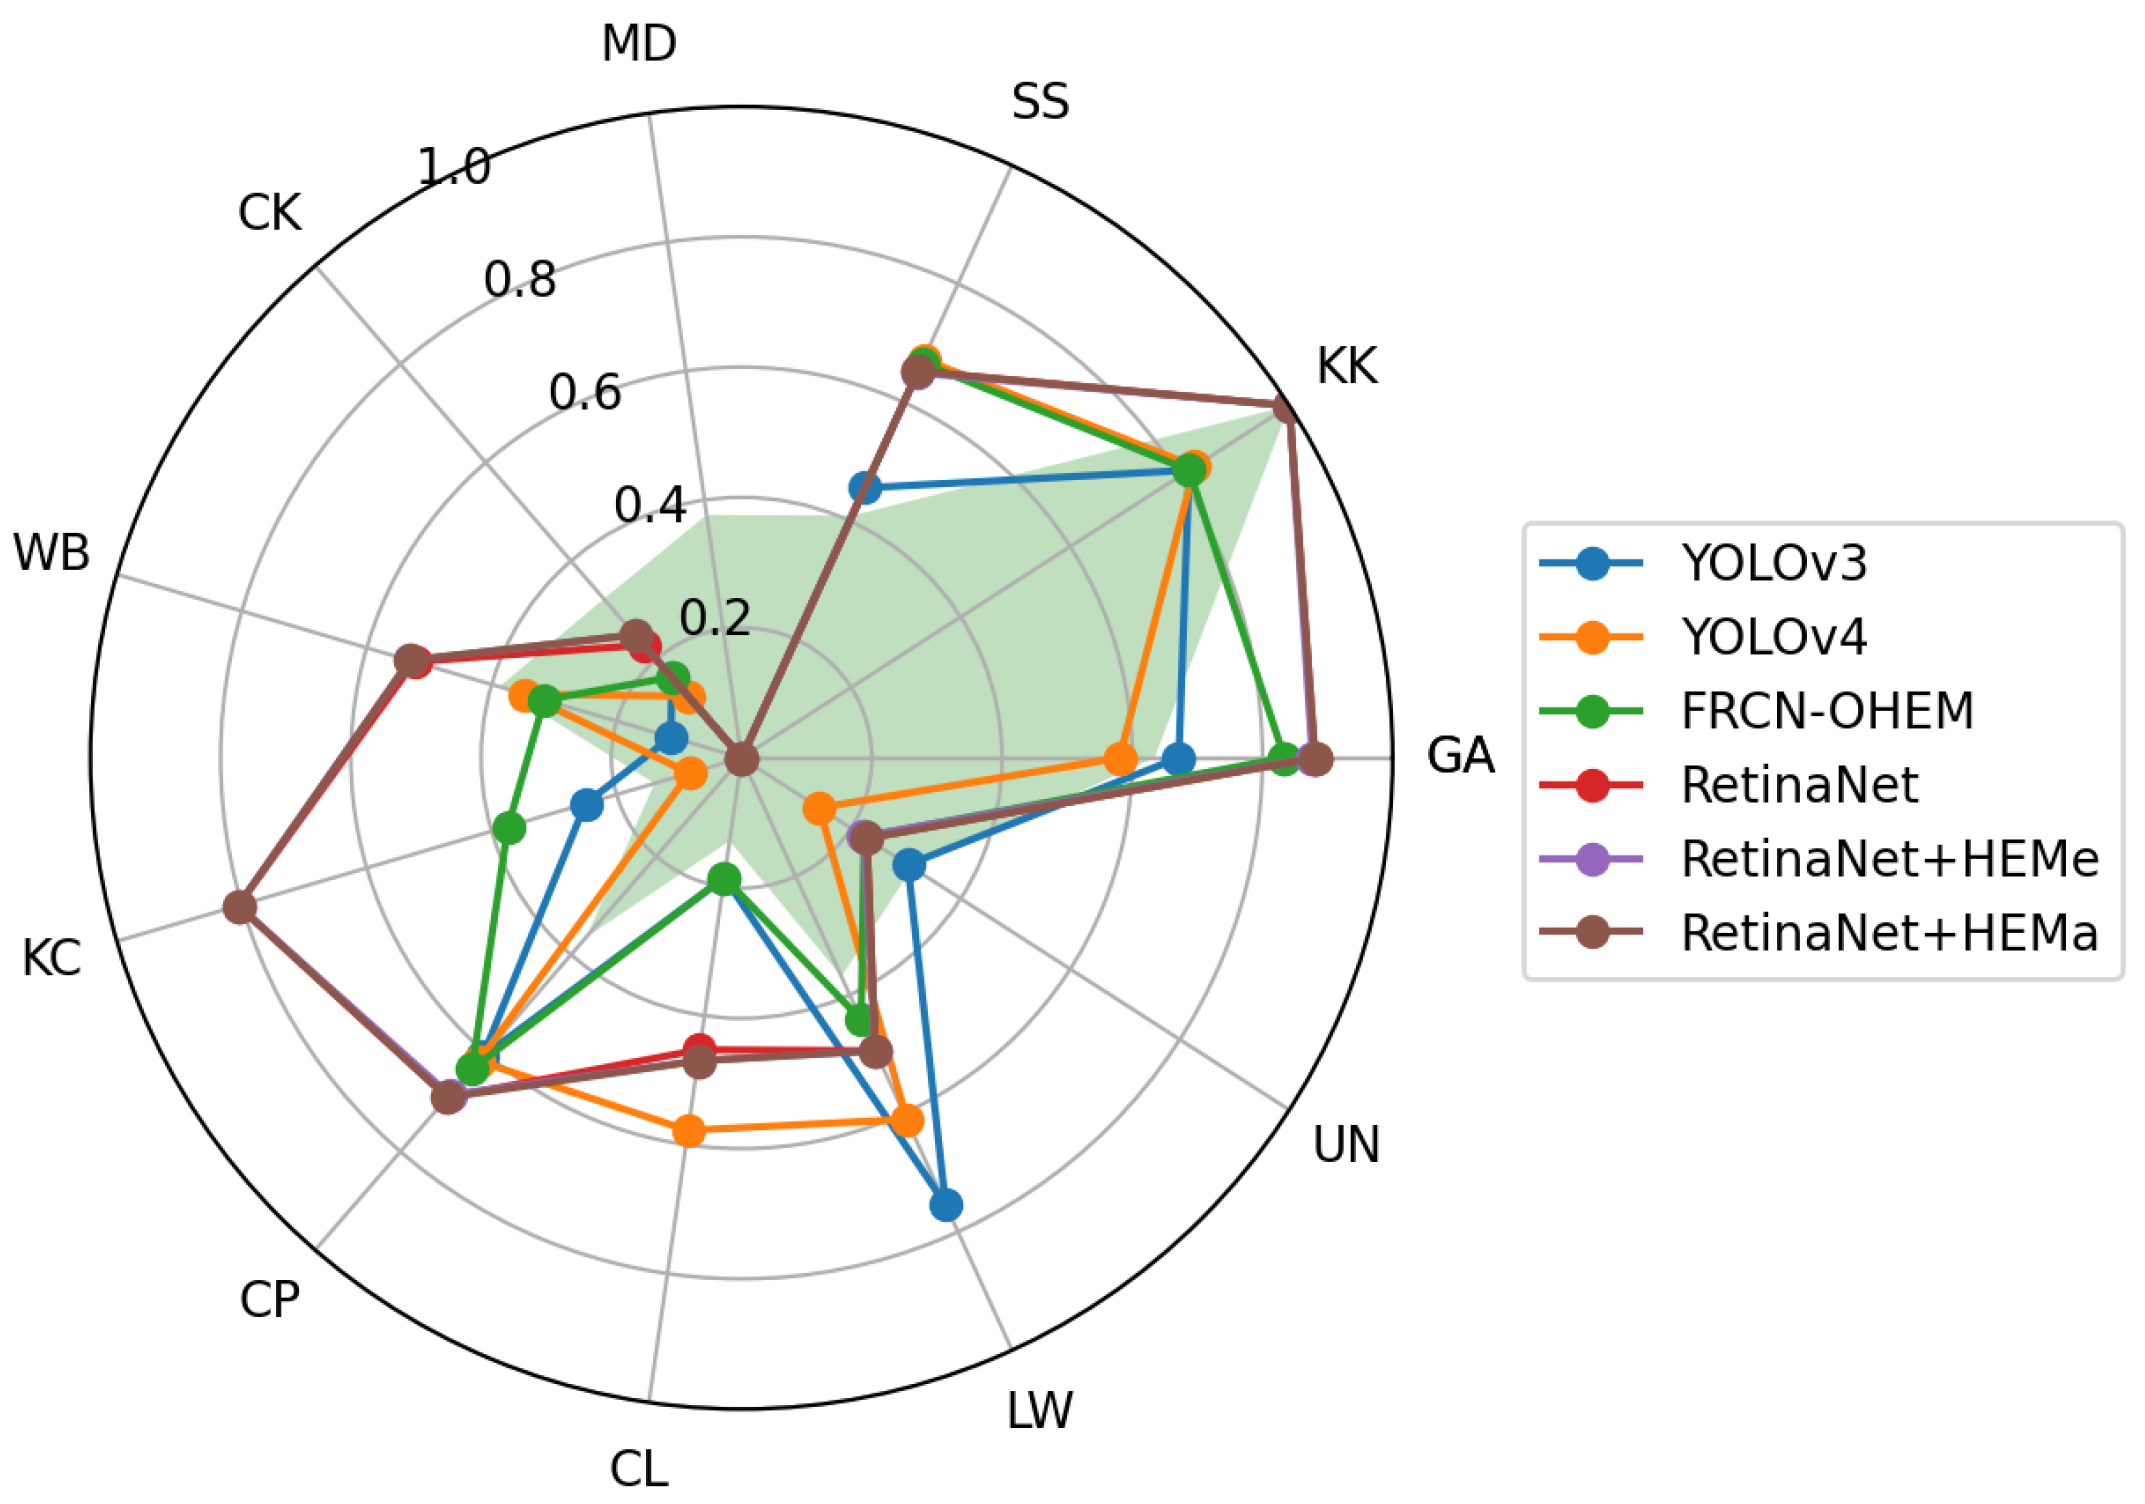
5.2. Multi-Class Comparison Experiments

The experiments also compare the multi-class detection performance of the base RetinaNet and RetinaNet using HEM. Three general detectors, YOLOv3, YOLOv4, and FRCN-OHEM are added as contrast. For RetinaNet, we use ResNet-50 as the feature extraction network and focal loss as the classification loss function. The evaluation criteria used are mAP and AP. The percentage of hard examples used in the HEM process is 10%, and the number of iterations is 20.
The experimental results are shown in Table 4. We can see that the second method achieves better detection performance, and both are better than the results without adding HEM.
Obviously, among the basic detectors YOLOv3, YOLOv4, FRCN-OHEM and RetinaNet, RetinaNet has the best mAP. Comparing Experiment “RetinaNet” and “RetinaNet + HEM E ”, the HEM technique improves the accuracy of the model in detecting the “CL, CK” class. However, due to the deletion of some easy samples in the HEM process in Experiment “RetinaNet + HEM E ”, the accuracy of the model for “GA, CP" decreased. In Experiment “RetinaNet + HEM A ”, the detection accuracy of all categories is no lower than that of Experiment “RetinaNet + HEM E ”, and the detection accuracy of “CL, CK, WB” category is improved. These experiments show that our proposed HEM approach can improve the detection accuracy of hard examples in terahertz images, and the training set construction approach of adding hard examples directly to the training set has better results.
To compare the performance of different models more intuitively, we plot the results of Table 4 as a radar map with additional information on the pixel size of the bounding box for each class, as shown in Figure 6. Overall, the detection AP of each model is positively correlated with the pixel bounding box size of the target. The larger the bounding box the higher the detection AP of the model, and vice versa.
As shown in Table 4, the detection accuracy of all detectors for “MD” is 0. This is because the number of the object in test set is very small, and “MD” is similar to “CK” in appearance. The difference between the two categories is very small, which not only leads to a detection rate of 0 for “MD” but also seriously affects the detection rate of “CK”.
Figure 7 shows the general examples and the hard examples selected by HEM in the active terahertz dataset. In general examples, The bounding box size of the targets is larger, and the shape and details of the targets are clear. The most obvious features of the hard examples are the small targets (e.g., “CL” class), misclassified targets (e.g., “CK”), and blurred targets or images.

5.3. Position Analysis of Object in Terahertz Imaging

In single imaging, the hidden objects may be placed perpendicular to the imaging plane. These objects are difficult to detect compared to objects parallel to the imaging plane. As shown in Table 5, we calculate the recall rate of objects in different positions of the human body. The last two columns indicate the imaging direction of the object.
From Table 5, we can see that RetinaNet has the highest recall rate no matter where the object is hidden. Generally, the items hidden on the arm are smaller, while the objects on the body and legs are larger, the recall rate of objects on the arms is relatively low. Because of the imaging diversity of the human body, the recall is also low when objects are on the body, compared with on legs. For objects parallel to and perpendicular to the imaging plane, all detectors have a better recall rate on the former. Therefore, it is necessary to use multi-view detection in the practical application, which can effectively detect items placed perpendicular to the imaging plane.

5.4. Image-Level Detection Performance

In a practical terahertz security inspection system, detection rate and false-alarm rate are two important indicators of the system performance. When calculating the detection rate and false-alarm rate for a single image, it is also necessary to determine whether the detection is correct. There are three important thresholds involved in the whole testing process, namely the Non-Maximum Suppression (NMS) threshold, the confidence level (SCO) threshold, and the IoU threshold.
In the following experiments, the metrics are first calculated for the usual thresholds (NMS 0.5, IoU 0.5, and SCO 0.5). The effect of each threshold and the method for selecting the optimal threshold are then discussed in detail.

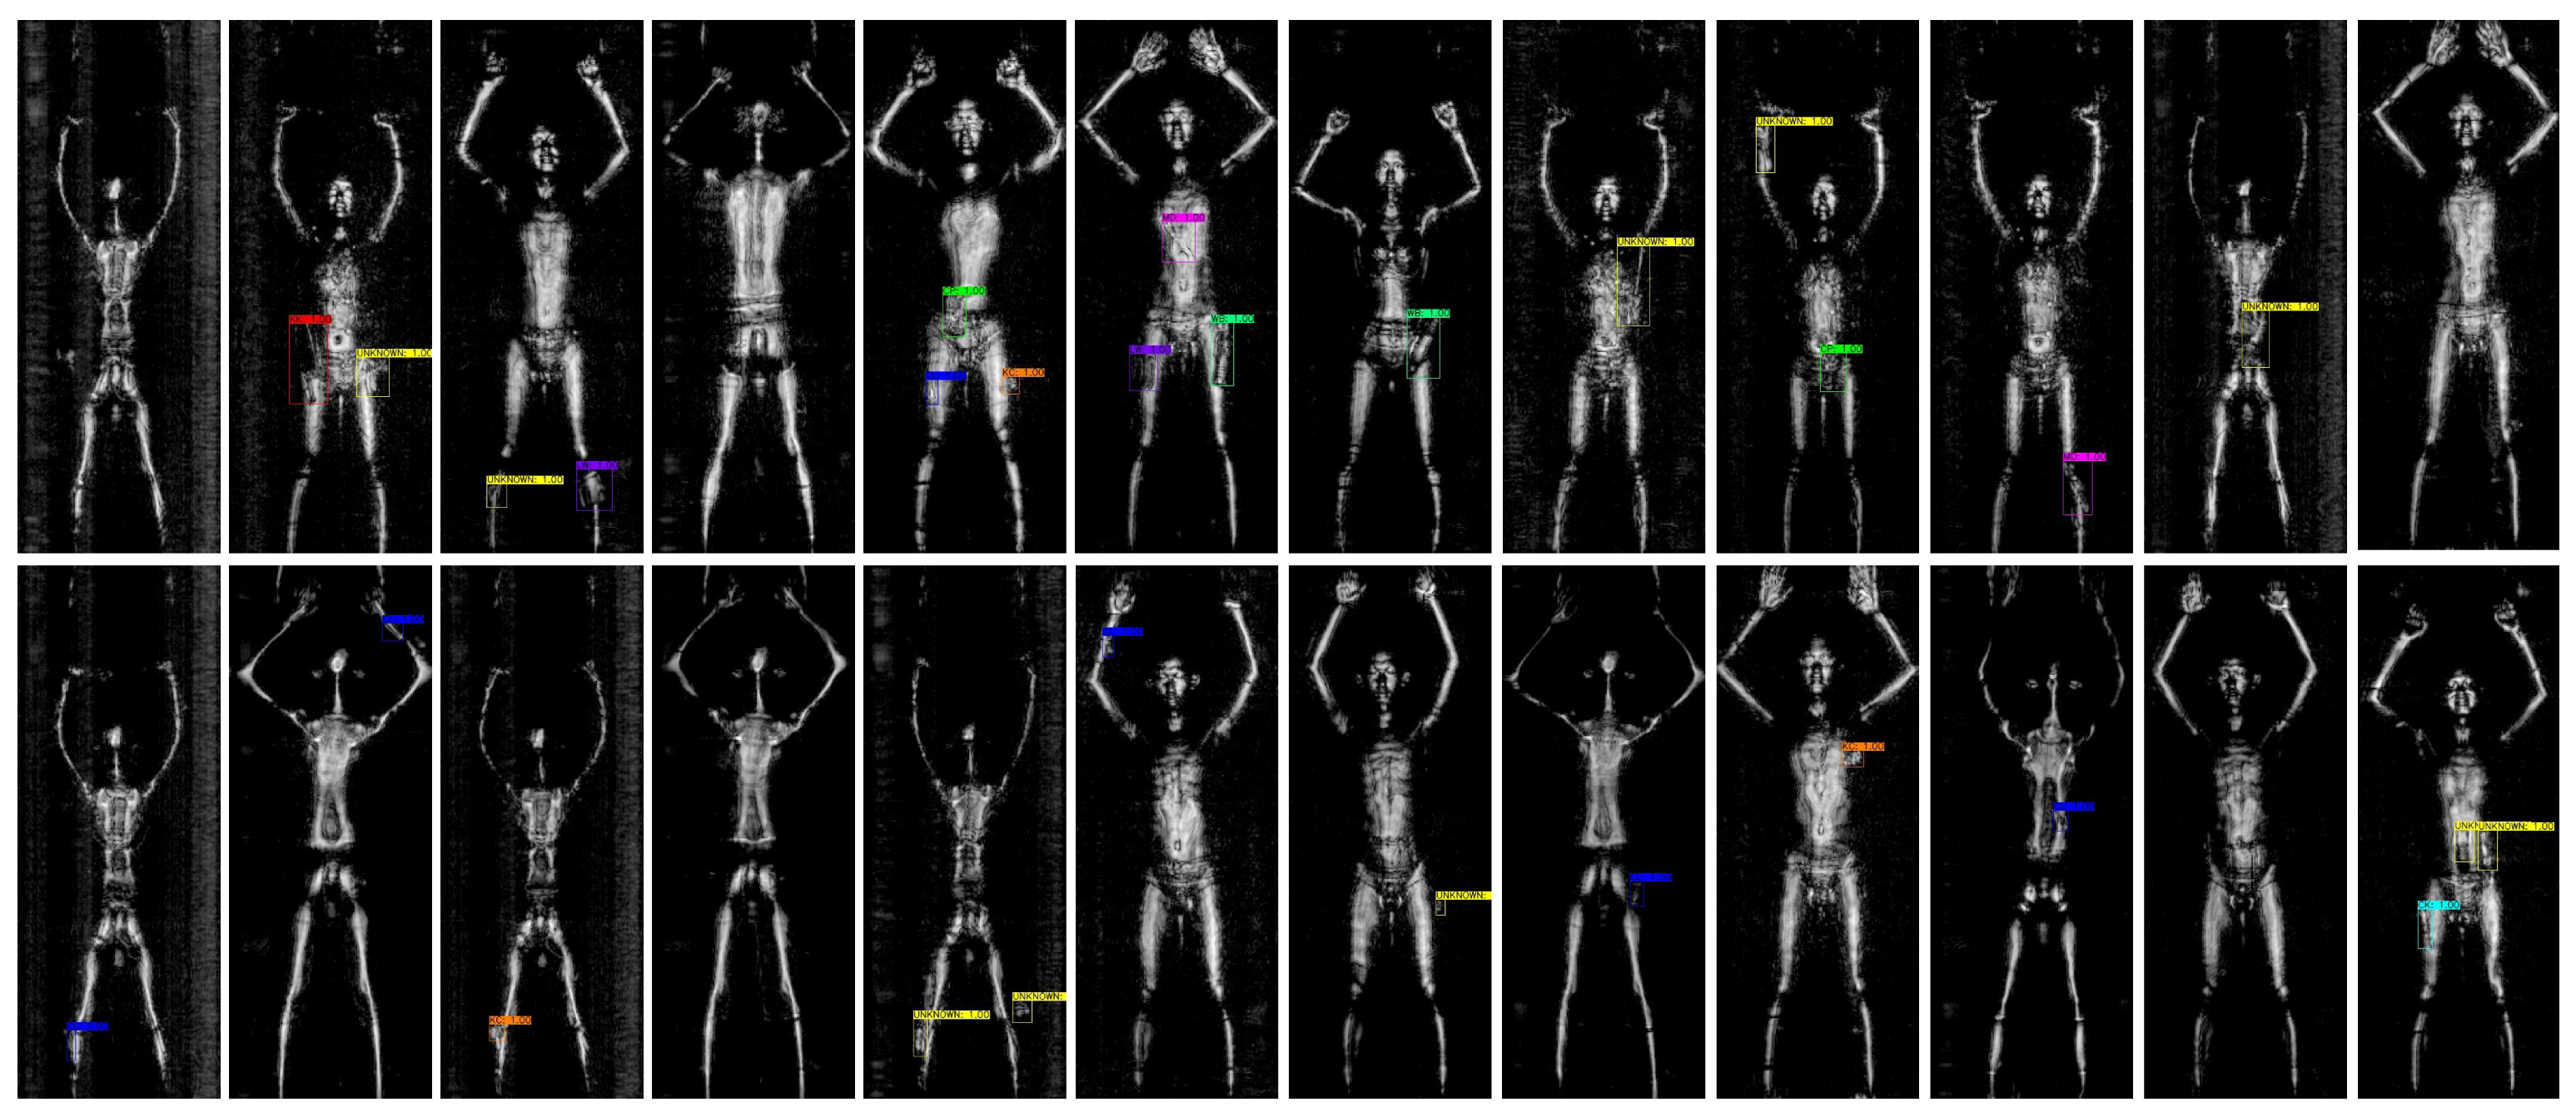
5.4.1. The General Test Result

For an image, we first define the object-level detection metric as follows:
  • ObjDetection: the detector marks the location of the hidden object, and the IoU between the detection bounding box and the ground truth bounding box is more than 50%.
  • ObjFalseAlarm: the detector marks the location of the hidden object, but there are no objects.
Then we define image-level detection indicators as follows:
  • ImgDetection: if some or all of the hidden objects in a terahertz image are ObjDetection.
  • ImgFalseAlarm: if there is any ObjFalseAlarm in a terahertz image.
Finally, we obtain a image-level Detection Rate (DR) and False-Alarm Rate (FAR) as follows:
D R = 1 n i = 1 n I m g D e t e c t i o n ( i )
F A R = 1 n i = 1 n I m g F a l s e A l a r m ( i )
where i is the image index and n is the total quantity of images.
The image-level detection result is shown in Table 6. The Detection Rate (DR) of RetinaNet is over 90% when its False-Alarm Rate (FAR) is 1.27%. Although YOLOv4 has the lowest FAR, its DR is lower than RetinaNet. FRCN-OHEM has the worst performance. RetinaNet has the best performance in detection of terahertz images, which makes it suitable for practical terahertz security inspection.

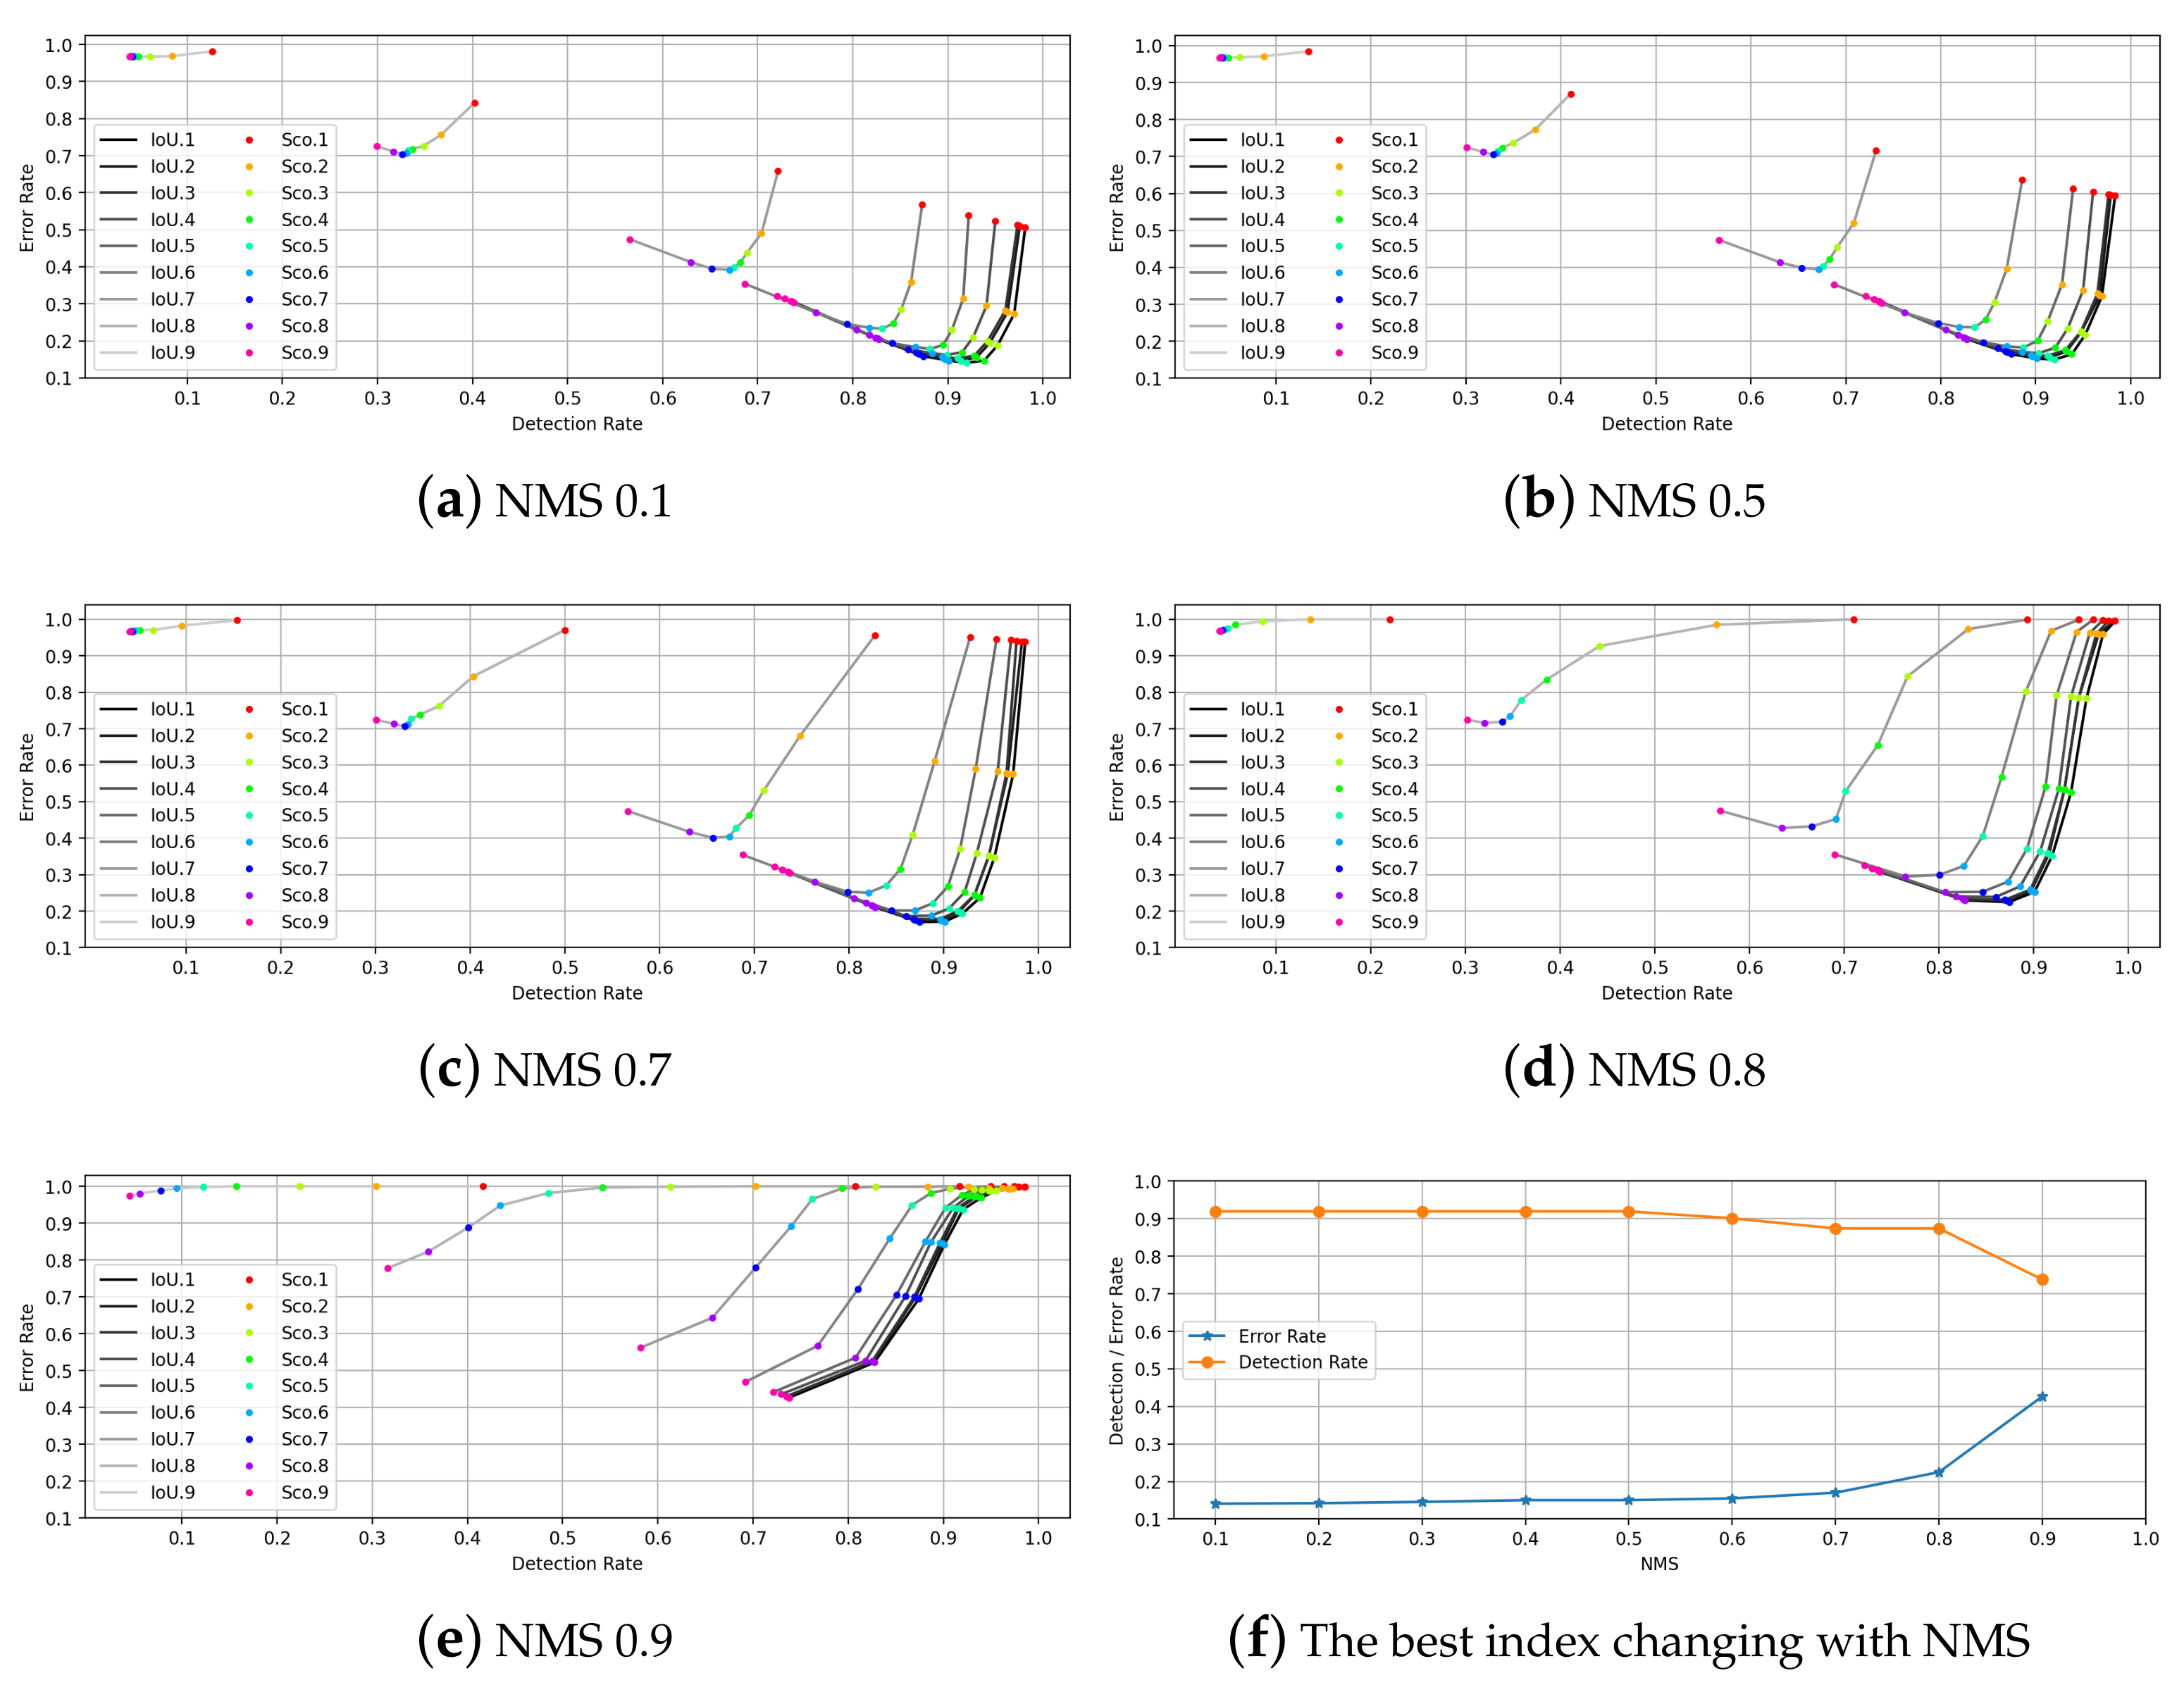
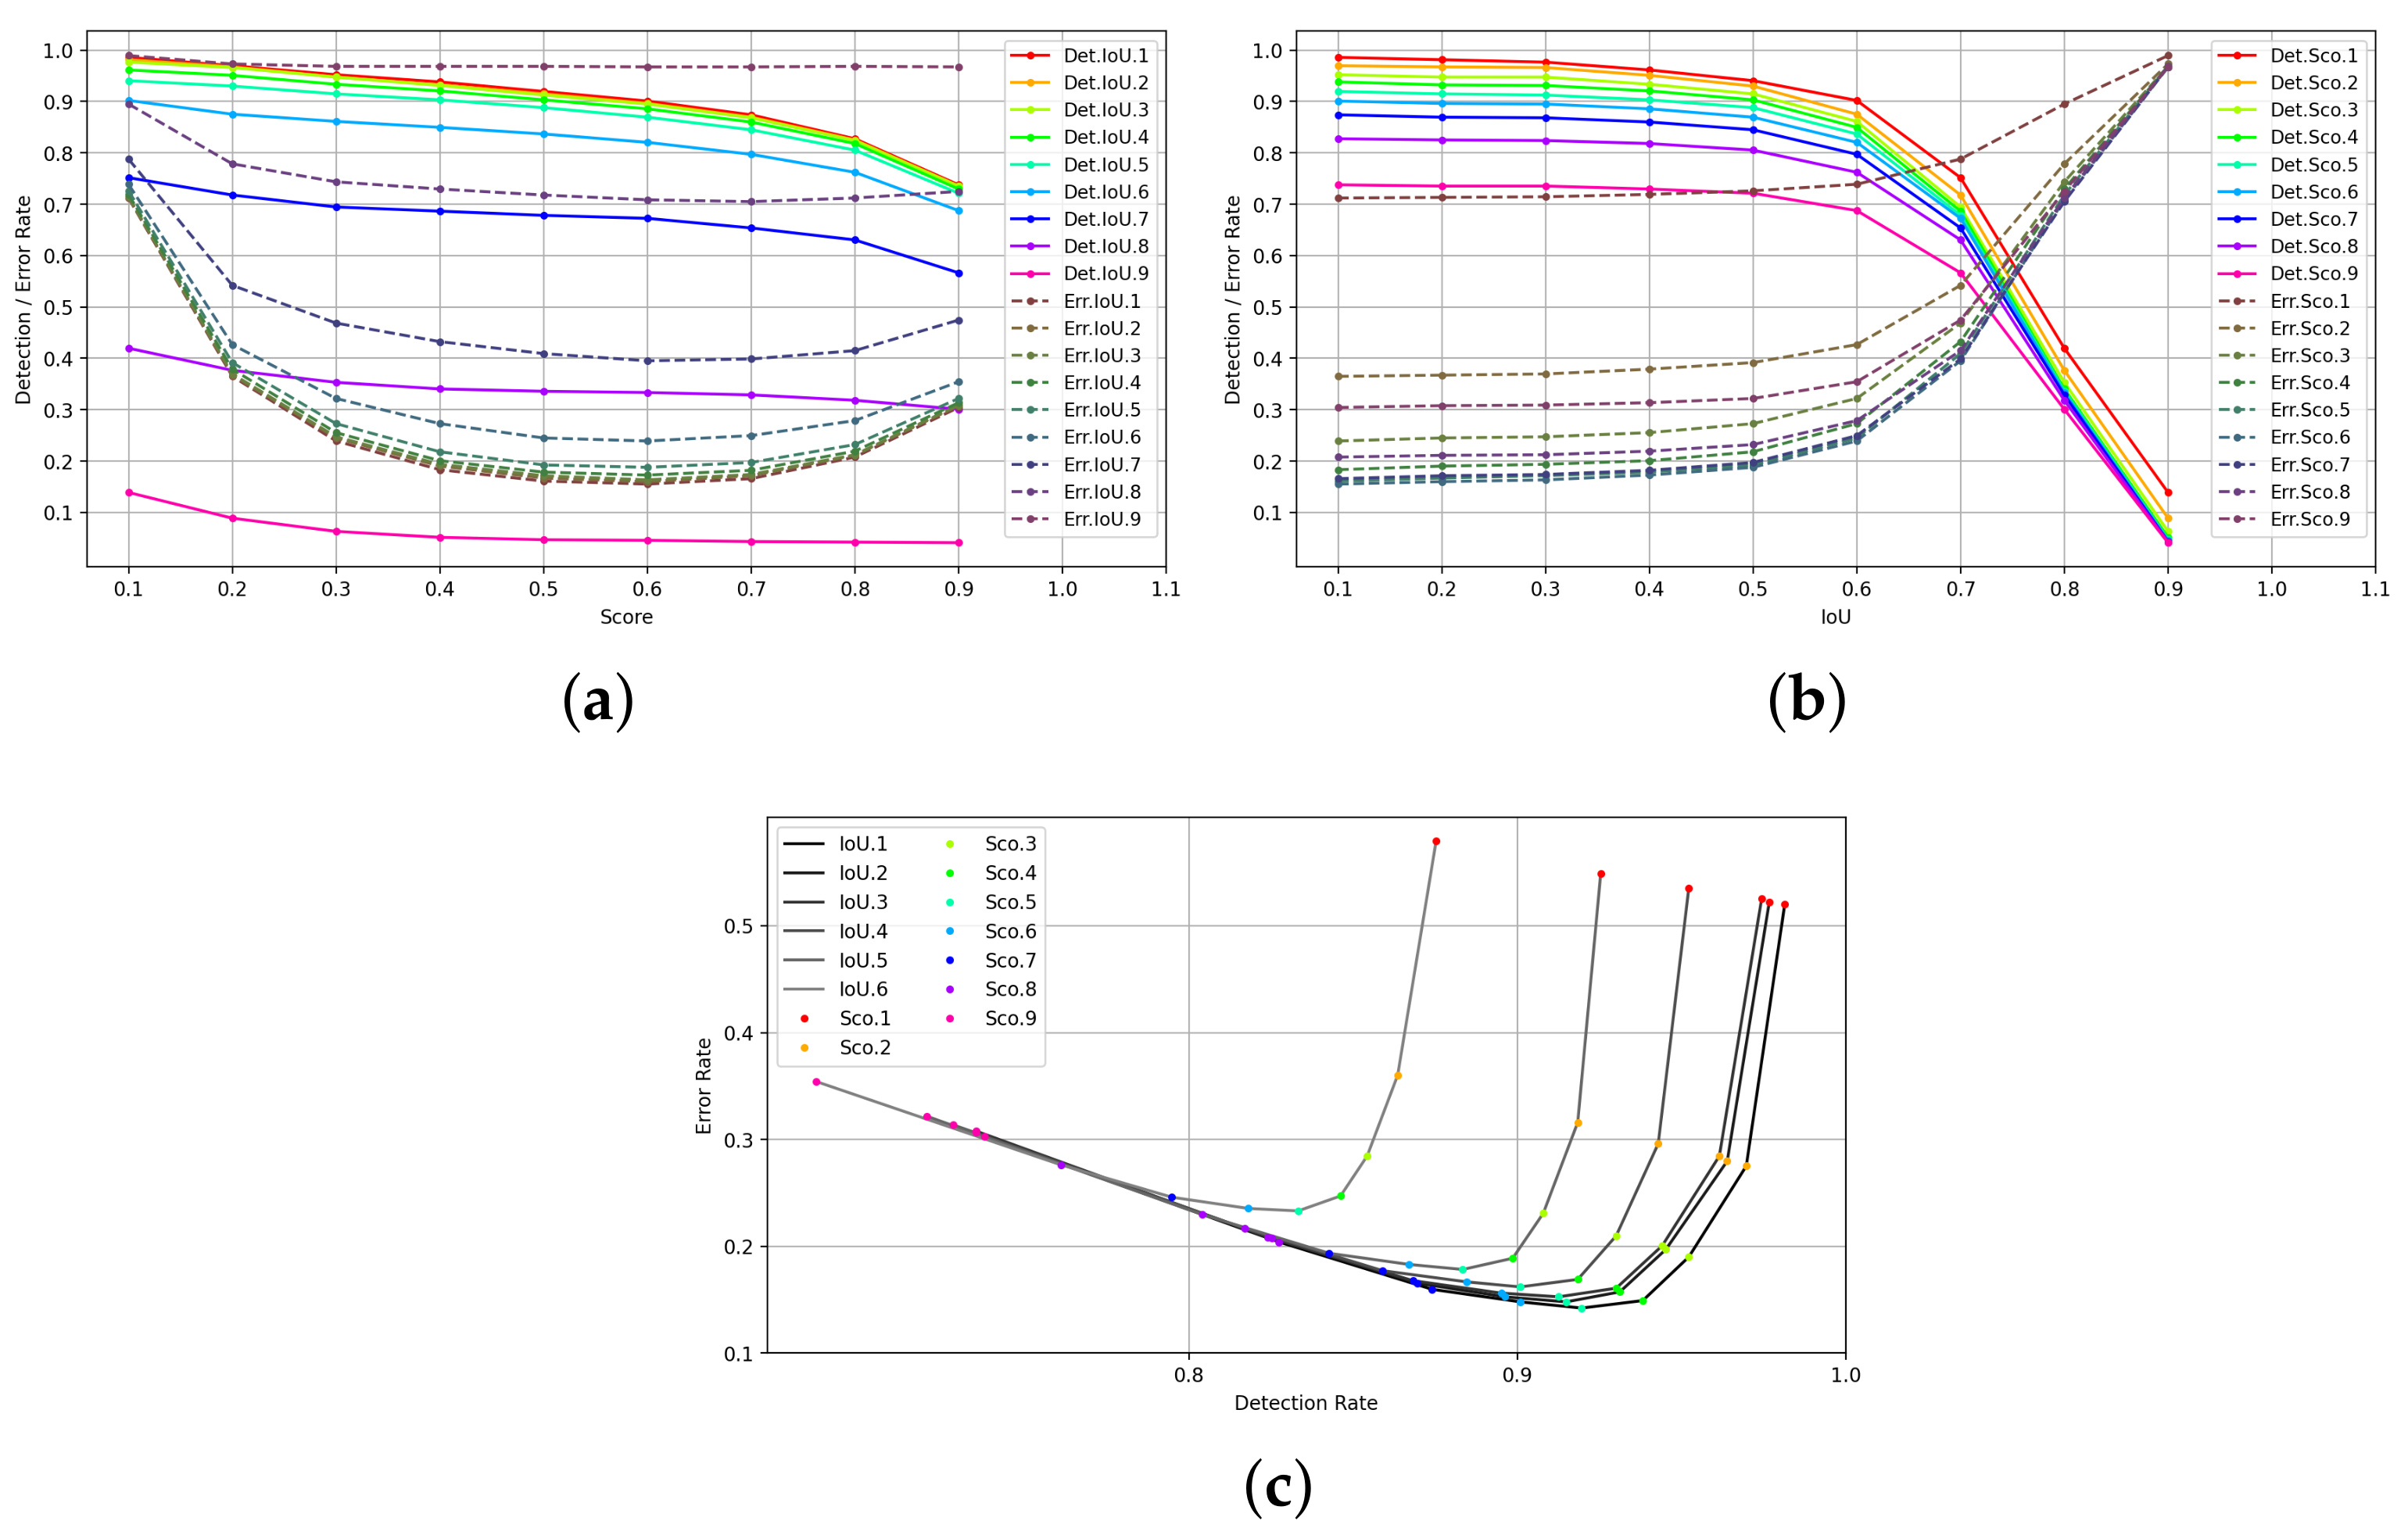
5.4.2. Balance of Detection Rate and False-Alarm Rate

NMS Threshold: Generally, anchor-based detectors output a large number of detection bounding boxes with confidence, and multiple detections may exist for a single object. These redundant boxes are generally removed by NMS operations to retain the best detection results. The NMS process is as follows:
(1)
Ranking of all candidate bounding boxes according to their confidence scores;
(2)
Select the bounding box with the highest confidence score to add to the final output list and remove it from the list of candidate bounding boxes;
(3)
Calculate the IoU of the bounding box with the highest confidence score against the other candidate boxes and remove the bounding boxes with an IoU greater than a threshold;
(4)
Repeat the above (2)∼(3) process until the list of bounding boxes is empty.
Too many retention boxes may result in too many false positives, while too few retention boxes may result in too many missed detections. The number of retention boxes is positively related to the NMS threshold; therefore, there is a need to balance this threshold.
Subplot a,e of Figure 8 show the curves of detection rate and false-alarm rate corresponding to the change of NMS threshold from 0.1∼0.9 curve, and subplot Figure 8f shows the curve of the lowest false-alarm rate and its corresponding detection rate with NMS threshold for each subplot. At low NMS thresholds, the increase in the NMS threshold mainly affects the false-alarm rate of the model. At high NMS thresholds, the NMS threshold has a serious impact on both the false-alarm rate and the detection rate. In particular, the detection rate was essentially constant for NMS thresholds below 0.5.
Confidence threshold: After the detection results are subjected to NMS operation, most of the overlapping detection boxes will be removed, but some unreasonable detection boxes are still left behind. Each detection box has a confidence score, a value between 0∼1, indicating the possibility that a target is surrounded by a box. As the confidence threshold gets higher, object recall decreases, but detection accuracy increases. Therefore, we need to set a suitable threshold so that the detection results are balanced between recall and detection rate.
IoU threshold: The IoU threshold is a key threshold when calculating the performance metrics for a single image. To distinguish between correct detection and incorrect detection, the intersection over union ratio is calculated between the detection result and the ground truth of the test image. A higher IoU threshold will result in a lower detection rate of the object, but a higher probability of the object being detected correctly. This threshold also needs to be balanced.
Comprehensive Analysis: In order to analyze the variation of single-image detection rate and false-alarm rate with confidence threshold and IoU threshold, the NMS threshold should be determined first. According to Figure 8f, when the NMS threshold is 0.1, the false-alarm rate is the lowest and the detection rate is the highest, which is the most desirable outcome in all cases. Therefore, we selected the experimental results when the NMS threshold is 0.1.
According to the previous definition of single-image detection rate and false-alarm rate, we can find that the false-alarm rate is not only related to error detection but also related to missed detection. Therefore, as shown in Figure 9a, the curve change of the false-alarm rate is not unidirectional. In the case of a high IoU threshold, the false-alarm rate is high and almost constant with an increasing confidence score.
As the IoU threshold decreases, the false-alarm rate decreases as the confidence level increases. When the IoU threshold is very low, the false-alarm rate first has a significant decrease with the confidence level, which is the process of reducing error detections.
The curves of single-image detection rate and false-alarm rate with IoU are shown in Figure 9b. The detection rate decreases with an increasing IoU threshold, and the false-alarm rate increases with increasing IoU threshold. It is interesting to note that the trend of the effect of the IoU threshold on the detection rate for different confidence scores is very similar, while it is different for the false-alarm rate. The change in the IoU threshold at a detection box confidence threshold of 10% has little effect on the false-alarm rate, while at a detection box confidence threshold greater than 20%, the change in the IoU threshold has a greater effect on the false-alarm rate.
An enlarged view of the curves of the single-image detection rate and false-alarm rate is shown in Figure 9c. In practice, we need to select the appropriate confidence threshold and IoU threshold according to the task requirements. For example, the false-alarm rate of detection in a security check is strictly required to be less than 15%. According to Figure 9c, there are only the bottom two IoU threshold curves to choose from. Among the candidate IoUs, the one with the highest IoU is generally chosen to ensure the accuracy of detection. The figure shows that the curve of IoU 0.2 is the best. After selecting the IoU threshold, it is necessary to select the confidence threshold on that threshold curve. The confidence threshold on the current curve that matches the highest detection rate and lowest false-alarm rate is SCO 0.5.
Therefore, in this terahertz dataset, the best thresholds are NMS 0.1, SCO 0.5, and IoU 0.2.

5.5. Discussion

Unlike the original single-target detection method [12,13] applied to terahertz images, which can only detect a single target, our method is also suitable for situations where there are multiple objects to be detected. Similar to M. Kowalski’s experiments [14,15], our experiments demonstrate that RetinaNet has better detection results than YOLOv3, YOLOv4, and FRCN-OHEM. We extend RetinaNet to better detect small targets by embedding low-level features.
Because the number of negative samples in the training dataset is usually much larger than the number of positive samples, there is an imbalance problem in target detection. Aiming at solving the problem of unbalanced training samples, because the OHEM method [10] cannot be directly applied to one-stage target detectors, we proposed a new Hard Example Mining (HEM) approach for the multi-object detection. Our proposed HEM approach was successfully applied to the RetinaNet network and improved the detection rate. Through the above experiments, we demonstrate the role of hard example mining in the multi-object detection of terahertz images. In addition, the analysis of object positions in terahertz imaging shows that the position of hidden objects has a significant impact on the detection rate. Therefore, the use of multi-view detection is required in practical applications. We compare in detail the parameters that affect the image detection metrics and give a method for selecting the best threshold value. By discussing the various thresholds and the choice of parameters, the model can achieve the best detection results.
Missing and wrong detection of dangerous goods bring serious harm to social security. The improvement of detection accuracy is of great significance in practical applications.

6. Conclusions

In this paper, an active terahertz imaging dataset for multi-object detection is provided. We hope it provides the opportunity to bridge the fields of computer vision and photoelectric imaging. We design an image-based hard example mining scheme based on RetinaNet, and the experimental results show that this method can improve the detection performance of the model for hard examples. We compare the three parameters that affect detection metrics of a single image in detail and give the method of selecting the best threshold. Our proposed dataset enables more researchers to focus on the detection of targets in terahertz images and promote the development of the field of photoelectric imaging. Our hard example mining method applied to RetinaNet has good detection results on terahertz images, which would also play an important role in practical security scenarios. Due to the limited number of images in the dataset, the final detection rate of our method needs to be further improved, especially for small-target detection in the image. Our future work will focus on exploring the detection methods of small objects on this active terahertz images dataset.

Author Contributions

Conceptualization, L.L. and D.L.; methodology, F.X.; validation, L.L., D.L. and X.C.; formal analysis, D.L.; investigation, L.L.; resources, X.C.; data curation, L.L.; writing—original draft preparation, F.X.; writing—review and editing, L.L.; visualization, F.X.; supervision, X.C.; L.L.: Formal analysis, Writing—review & editing, Data curation and Resources; F.X.: Methodology, Writing—original draft, Data curation, and Project administration; D.L.: Conceptualization, Investigation, Supervision and Visualization; X.C.: Conceptualization, Investigation, and Validation. All authors have read and agreed to the published version of the manuscript.

Funding

This work is partially supported by AI+ Project of NUAA (XZA20003), National Science Foundation of China (61772268).

Data Availability Statement

The dataset is available online. Link: https://github.com/LingLIx/THz_Dataset (accessed on 29 September 2021).

Conflicts of Interest

The authors declare no conflict of interest.

References

  1. Kowalski, M.; Kastek, M.; Walczakowski, M.; Palka, N.; Szustakowski, M. Passive Imaging of Concealed Objects in Terahertz and Long-Wavelength Infrared. Appl. Opt. 2015, 54, 3826–3833. [Google Scholar] [CrossRef]
  2. Cooper, K.; Dengler, R.; Llombart, N.; Bryllert, T.; Chattopadhyay, G.; Mehdi, I.; Siegel, P. An Approach for Sub-Second Imaging of Concealed Objects Using Terahertz (THz) Radar. J. Infrared Millim. Terahertz Waves 2009, 30, 1297–1307. [Google Scholar] [CrossRef]
  3. Yan, X.; Liang, L.; Yang, J.; Liu, W.; Ding, X.; Xu, D.; Zhang, Y.; Cui, T.; Yao, J. Broadband, Wide-Angle, Low-Scattering Terahertz Wave by a Flexible 2-Bit Coding Metasurface. Opt. Express 2015, 23, 29128–29137. [Google Scholar] [CrossRef] [PubMed]
  4. Helal, S.; Sarieddeen, H.; Dahrouj, H.; Al-Naffouri, T.Y.; Alouini, M.S. Signal Processing and Machine Learning Techniques for Terahertz Sensing: An Overview. arXiv 2021, arXiv:2104.06309. [Google Scholar]
  5. Yeom, S.; Lee, D.S.; Son, J.Y.; Jung, M.K.; Jang, Y.; Jung, S.W.; Lee, S.J. Real-time outdoor concealed-object detection with passive millimeter wave imaging. Opt. Express 2011, 19, 2530–2536. [Google Scholar] [CrossRef]
  6. Shen, X.; Dietlein, C.R.; Grossman, E.; Popovic, Z.; Meyer, F.G. Detection and segmentation of concealed objects in terahertz images. IEEE Trans. Image Process. 2008, 17, 2465–2475. [Google Scholar] [CrossRef] [PubMed]
  7. Liang, D.; Pan, J.; Yu, Y.; Zhou, H. Concealed object segmentation in terahertz imaging via adversarial learning. Optik 2019, 185, 1104–1114. [Google Scholar] [CrossRef]
  8. Redmon, J.; Farhadi, A. Yolov3: An Incremental Improvement. arXiv 2018, arXiv:1804.02767. [Google Scholar]
  9. Bochkovskiy, A.; Wang, C.Y.; Liao, H.Y.M. YOLOv4: Optimal Speed and Accuracy of Object Detection. arXiv 2020, arXiv:2004.10934. [Google Scholar]
  10. Shrivastava, A.; Gupta, A.; Girshick, R. Training Region-Based Object Detectors with Online Hard Example Mining. In Proceedings of the IEEE Conference on Computer Vision and Pattern Recognition, Las Vegas, NV, USA, 27–30 June 2016; pp. 761–769. [Google Scholar]
  11. Lin, T.Y.; Goyal, P.; Girshick, R.; He, K.; Dollár, P. Focal Loss for Dense Object Detection. In Proceedings of the IEEE International Conference on Computer Vision, Venice, Italy, 22–29 October 2017; pp. 2980–2988. [Google Scholar]
  12. Jia-Xiong, Y.; Ming-Hui, Y.; Yu-Kung, Z.; Liang, W.; Xiao-Wei, S. Using convolutional neural network to localize forbidden object in millimeter-wave image. J. Infrared Millim. Waves 2017, 36, 354–360. [Google Scholar]
  13. Wang, C.J.; Sun, X.W.; Yang, K.H. A low-complexity method for concealed object detection in active millimeter-wave images. J. Infrared Millim. Waves 2019, 38, 32–38. [Google Scholar]
  14. Kowalski, M. Hidden Object Detection and Recognition in Passive Terahertz and Mid-Wavelength Infrared. Infrared Millim. Terahertz Waves 2019, 40, 1074–1091. [Google Scholar] [CrossRef] [Green Version]
  15. Kowalski, M. Real-Time Concealed Object Detection and Recognition in Passive Imaging at 250 GHz. Appl. Opt. 2019, 58, 3134–3140. [Google Scholar] [CrossRef] [PubMed]
  16. Liu, W.; Anguelov, D.; Erhan, D.; Szegedy, C.; Reed, S.; Fu, C.Y.; Berg, A.C. SSD: Single Shot Multibox Detector. In European Conference on Computer Vision; Springer: Amsterdam, The Netherlands, 2016; pp. 21–37. [Google Scholar]
  17. Dai, J.; Li, Y.; He, K.; Sun, J. R-FCN: Object Detection via Region-Based Fully Convolutional Networks. In Advances in Neural Information Processing Systems; NeurIPS: Barcelona, Spain, 2016; pp. 379–387. [Google Scholar]
  18. Zhang, J.; Xing, W.; Xing, M.; Sun, G. Terahertz Image Detection with the Improved Faster Region-Based Convolutional Neural Network. Sensors 2018, 18, 2327. [Google Scholar] [CrossRef] [PubMed] [Green Version]
  19. Ren, S.; He, K.; Girshick, R.; Sun, J. Faster R-CNN: Towards Real-Time Object Detection with Region Proposal Networks. In Advances in Neural Information Processing Systems; NeurIPS: Montreal, QC, Canada, 2015; pp. 91–99. [Google Scholar]
  20. Li, M.; Zhang, Z.; Yu, H.; Chen, X.; Li, D. S-OHEM: Stratified Online Hard Example Mining for Object Detection. In CCF Chinese Conference on Computer Vision; Springer: Tianjin, China, 2017; pp. 166–177. [Google Scholar]
  21. Everingham, M.; Van Gool, L.; Williams, C.K.; Winn, J.; Zisserman, A. The Pascal Visual Object Classes (VOC) Challenge. Int. J. Comput. Vis. 2010, 88, 303–338. [Google Scholar] [CrossRef] [Green Version]
  22. He, K.; Zhang, X.; Ren, S.; Sun, J. Deep Residual Learning for Image Recognition. In Proceedings of the IEEE Conference on Computer Vision and Pattern Recognition, Las Vegas, NV, USA, 27–30 June 2016; pp. 770–778. [Google Scholar]
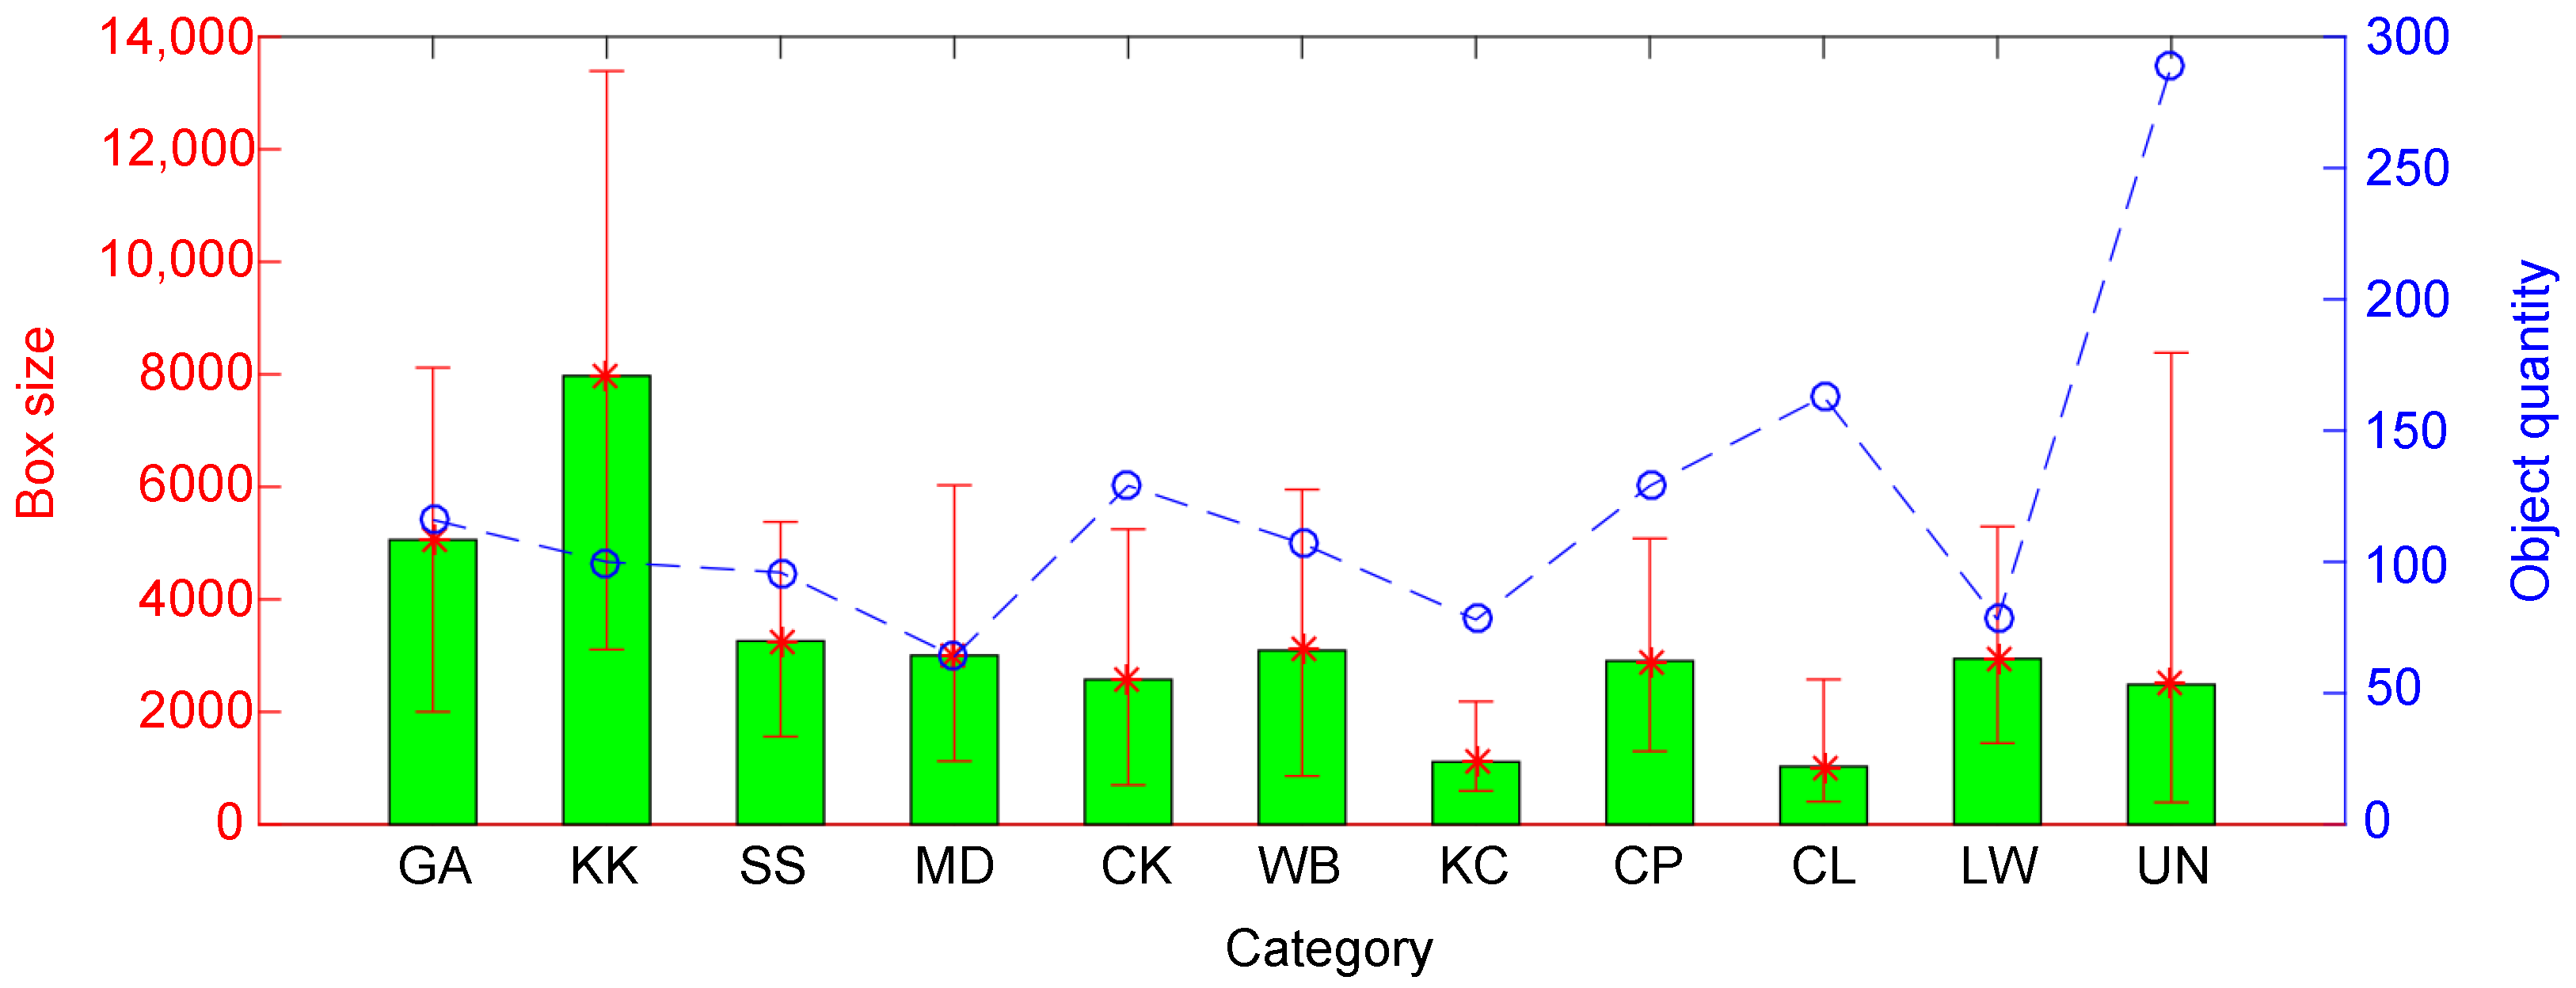
Figure 1. Visualization display of some images with a single object in our terahertz object detection dataset. On the top of the figure are the corresponding class’ abbreviation.
Applsci 11 11241 g001
Figure 2. Visualization display of diversified data of terahertz object detection dataset. On the top of the figure are the data characteristics.
Applsci 11 11241 g002
Figure 3. Average size of bounding box and quantity for each class in terahertz object detection dataset.
Applsci 11 11241 g003
Figure 4. Network structure of modified RetinaNet. C1–C5 represent the resnet-50 feature extraction structure, and P2 to P7 represent the feature pyramid structure. Each layer of feature pyramid is followed by a sub-network.
Applsci 11 11241 g004
Figure 5. Training process of RetinaNet and Focal Loss combined with HEM.
Applsci 11 11241 g005
Figure 6. Visual radar map of each category of AP in Table 4. The radius of the radar is the AP for each category, the individual fold lines represent the model as shown in the legend on the right, the categories represented by each orientation are represented at the outermost part of the radar, and the shaded area in the middle of the radar represents the normalized scale of the average pixel size of the bounding box for each category.
Applsci 11 11241 g006
Figure 7. Example of general examples (first row) and hard examples selected by HEM (second row).
Applsci 11 11241 g007
Figure 8. The curve of detection rate and false alarm rate with NMS, IoU, and confidence score. The last subplot represents the curve of the lowest false-alarm rate and its corresponding detection rate variation with the NMS threshold for the previous subplots.
Applsci 11 11241 g008
Figure 9. (a) is the curves of detection rate and false-alarm rate with confidence threshold for NMS threshold of 0.1. (b) is the curves of detection rate and false-alarm rate with IoU threshold for NMS threshold of 0.1. The corresponding curve colors for different confidence levels are shown in the legend on the right. (c) is an enlarged view of the lower-right area of Figure 8a.
Applsci 11 11241 g009
Table 1. Object classes of terahertz object detection dataset.
ClassGAKKSSMDCKWBKCCPCLLWUN
ItemGunKitchen KnifeScissorsMetal DaggerCeramic KnifeWater BottleKey ChainCell PhoneCigarette LighterLeather WalletUnknown
Qty.11610096641291077812916378289
Table 2. Detail statistics of terahertz object detection dataset.
ItemDetail
Number of images3157
Image size and format335 × 880 p.x. JPEG
Imaging resolution5 × 5 mm
Models4 males, 6 females
Number of categories11
Objects per image0, 1, 2, 3
Maximum object size13,390 p.x.
Average object size3222 p.x.
Minimum object size390 p.x.
Testing set316 images
Table 3. The comparative experimental results of HEM with different parameters for single-class detection. Among them, the results with underline are the worst, and the results with bold are the best.
Hard Example Ratio (%)∖Training Loop102030
068.0168.0168.01
569.5569.5769.49
1069.5869.6369.59
2069.5669.6069.55
Table 4. The results of detection AP for each category in HEM experiments. The results with underline are the worst. and the results with bold are the best.
MethodGAKKSSMDCKWBKCCPCLLWUNmAP
YOLOv367.1581.6945.560.016.3911.2925.0060.7418.5775.4330.3539.29
YOLOv458.0582.7267.270.012.5034.728.3361.6254.7961.0214.2341.39
FRCN-OHEM83.3981.6966.670.016.3931.5637.3863.2118.5744.2322.3842.32
RetinaNet88.07100.065.240.022.9252.3880.5669.0045.2849.4422.8654.16
RetinaNet + HEM E 87.67100.065.000.025.0153.1280.5668.4847.0049.4422.2354.41
RetinaNet + HEM A 88.07100.065.240.025.0153.1280.5669.0047.0049.4422.8654.57
Table 5. Recall rate of detection in different parts of the human body. The detection results of 147 objects in the test set are counted. The results with underline are the worst, and the results with bold are the best.
ModelOn Arms (8)On Body (69)On Legs (70)Parallel (95)Perpendicular (52)
YOLOv40.25000.47830.61430.57890.4423
FRCN-OHEM0.3750.46380.50000.51580.4038
RetinaNet0.50000.49280.70000.61050.5577
Table 6. Image-level detection result. The detection results of 316 images in the test set are counted. Red is the best, and blue is the worst. The results with underline are the worst, and the results with bold are the best.
MethodDR (%)FAR (%)
YOLOv484.490.63
FRCN-OHEM88.8618.99
RetinaNet91.461.27
Publisher’s Note: MDPI stays neutral with regard to jurisdictional claims in published maps and institutional affiliations.

