Article

Effect of Target Size, Location, and Input Method on Interaction in Immersive Virtual Reality

1
Department of Industrial & Management Engineering, Incheon National University, Incheon 22012, Korea
2
School of Information Convergence, Kwangwoon University, Seoul 01897, Korea
*
Author to whom correspondence should be addressed.
Appl. Sci. 2021, 11(21), 9846; https://doi.org/10.3390/app11219846
Submission received: 25 September 2021 / Revised: 16 October 2021 / Accepted: 19 October 2021 / Published: 21 October 2021
(This article belongs to the Special Issue State-of-the-Art in Human Factors and Interaction Design)

Abstract

:
Although new virtual reality (VR) devices and their contents are actively being released, there are still not enough studies to prepare its interface/interaction standard. In this study, it was investigated whether specific interaction factors influenced task performance and the degree of virtual reality sickness when performing pointing tasks in immersive virtual reality. A smartphone-based VR device was used, and twenty-five targets were placed in a 5 × 5 layout on the VR experimental area that extended to a range similar to the human viewing angle. Task completion time (TCT) was significantly affected by target selection method (p < 0.001) and target size (p < 0.001), whereas the error rate (ER) significantly differed for the target selection method (p < 0.001) and not for the target size (p = 0.057). Target location was observed to be a factor affecting TCT (p < 0.001), but it did not affect the ER (p = 0.876). VR sickness was more severe when the target size was smaller. Gaze selection was found to be more efficient when accuracy is demanded, and manual selection is more efficient for quick selection. Moreover, applying these experimental data to Fitts’ Law showed that the movement time was found to be less affected by the device when using the gaze-selection method. Virtual reality provides a three-dimensional visual environment, but a one-dimensional formula can sufficiently predict the movement time. The result of this study is expected to be a reference for preparing interface/interaction design standards for virtual reality.

1. Introduction

Recently, as communications and display technologies have evolved, a basis for commercialization has been established, and virtual reality (VR) has emerged as a next-generation platform along with augmented reality and mixed reality. Research on virtual reality is largely divided into two categories: studies to attenuate motion sickness and to analyze input device task performance. Currently, there are many factors obstructing the popularization of VR. One of the main problems is VR sickness [1]. In order for VR-related markets to continue to develop in the future, an environment in which VR can be experienced for a long time without motion sickness must be prepared. Hardware-based research has primarily focused on reducing the gap between motion and visual information [2,3]. The inconsistency of visual information is the main reason for the occurrence of VR sickness. When a user turns his or her head and senses a change of position through a sensory organ, sickness may occur if the VR motion does not correspond to natural sensations [4,5,6]. This difference is referred to as motion-to-photon (MTP) latency. The hardware market has an aim of reducing this phenomenon to less than a 20-ms latency [7,8,9]. In addition, studies have been conducted to reduce this MTP latency using machine learning algorithms [10] or IMU sensors [9]. In terms of software, motion sickness has been effectively reduced by adjusting focus [11,12,13], viewing angle [13], and visual effect or guide [14,15,16,17]. These studies suggest that motion sickness levels can be adjusted not only by reducing MTP latency but also by the interaction method and interface configuration of virtual reality. In addition, studies have been conducted mainly to measure VR sickness levels after watching videos [18] or experiencing a first-person roller coaster ride [19], that is, in an environment where there was little interaction by participants. Therefore, it is necessary to study the level of VR sickness when the virtual reality and the user actively interact, not in such a passive environment.
Conventional platforms, such as PC, web, and mobile, have been studied thus far, and users have adapted to most interfaces and unique features of each platform. However, because VR is still in the early stages of popularization, related studies have not been carried out sufficiently, and standard input methods have not been set for current commercial products. Therefore, interaction research such as VR input tools and selection methods needs to be carried out for immersive VR. Since the user’s head movement is used for interaction of VR, the research analyzing the performance for each input device in virtual reality is mainly focused on head tracking or helmet tracking. The head/helmet tracking method is a method of visually indicating how close the cursor is to a target by calculating the head direction angle at every moment [20] and is also applied to the head-mounted display (HMD) of virtual reality. Jagacinski and Monk [21] compared the time it takes to press a target when using a joystick with when using an infrared light mounted on the helmet to measure the position of the head. Additionally, Borah [22] compared the task completion time of the same task with four methods (mouse, eye-tracking, head-tracking, and mixture of eye-tracking and head-tracking). However, while these studies used head-tracking, most of them are the non-immersive virtual reality that controls the cursors on a computer monitor screen. That is, studies conducted on immersive virtual reality environments are still insufficient. In addition, these studies tend to focus on a front-facing field-of-view (FOV) [23,24], and little has been carried out to analyze the differences in task performance according to the characteristics of the target. Unlike other displays (e.g., monitor or touchscreen), where the available space is limited to a single screen, in VR, objects can be placed anywhere where the user turns his or her head in any direction, similar to the real world. In addition, a high level of interactivity in VR environment narrows the psychological distance between the user and the device [25,26], and when experiencing a realistically implemented virtual environment, it can elicit a physiological response and emotional arousal similar to the response to a real-world’s stimulus [27]. It is necessary to conduct more research to prepare interaction and interface design guidelines specific to immersive virtual reality environments.
There are two types of immersive virtual reality input methods: (1) the method of additionally using a separate device and (2) the method using head tracking. PC-based virtual reality devices that connect to a computer equipped with high-performance graphics cards use these separate input devices. In case of using a separate device, a ray-casting remote controller, an eye-tracker, and a glove-type controller are used. The ray-casting is the method of showing the ray in the direction of pointing then selecting by pressing the button on the controller. It has the advantage that the movement of the controller is immediately reflected on the screen so that the operation is intuitive and easy, and tactile feedback can be obtained through an effect such as vibration. Cournia et al. [28] compared the task completion time of selecting an object in virtual reality when using the ray-casting with when using an eye-tracker. It was found that the task was faster with ray-casting than with eye-tracker. Piumsomboon et al. [29] proposed three novel eye-tracking-based interaction methods and compared them with the eye-tracker method. The task performance was similar, but new techniques had a greater user experience. The interaction method using the eye-tracking technology is not dominant in the virtual reality market yet, but it is expected to be a natural interaction if the technology is implemented at a high level in the future. Finally, using a glove-type controller such as Leap motion [30] or Kinect is a method of wearing gloves with sensors and reaching out to an object or using gestures [31]. These allow greater freedom of hands and natural interaction [32], but it is not easy to obtain tactile feedback when input occurs [33,34].
On the other hand, a smartphone-based virtual reality device uses the smartphone’s touchscreen as the display and hardware of the virtual reality, and the role of the headset is to show the screen in three dimensions to the user through the lens attached to the VR headset. Among these smartphone-based VR devices, there are products that can use separate controllers, but low-cost smartphone-based VR headsets mainly use head tracking. This type of method can be divided into (1) the method of pressing the capacitive touch button on the virtual reality headset, and (2) the method of placing the cursor on the object and holding it for a certain time [35]. Smartphone-based VR is less expensive than a dedicated headset for virtual reality and does not require a high-end computer, so people who are new to virtual reality can easily access it. Since research conducted in the meantime is being conducted for PC-based VR devices, it is necessary to conduct research for smartphone-based VR devices.
Therefore, the task performance and the level of virtual reality sickness were analyzed when performing input tasks using two main input methods—gaze selection and manual selection—mentioned above in smartphone-based virtual reality. In this study, participants selected targets not only within a viewing angle but also slightly away from the viewing angle, and task performance was analyzed by setting and quantitatively measuring variables related to task time and accuracy. In addition to the input method, how the user experience is affected by differences in interface elements such as the size and location of the buttons was compared. The purpose of this study is to investigate the size and position of the target (i.e., interface elements) and the effect of the input method (i.e., interaction elements) on task performance and VR sickness. Additionally, the movement time data were applied to Fitts’ law and analyzed whether there is a difference in predictive power according to the input methods.

2. Related Work

2.1. Fitts’ Law

Fitts’ law [36] is widely used in the field of human–computer interaction as a way of predicting the movement time of the target-pointing task. Fitts defined the index of difficulty (ID) of the task using the amplitude (A) and the width (W) of the target as variables. The relationship between the ID and the movement time is expressed by the following simple linear regression model.
M o v e m e n t   t i m e   M T = a + b   I D ;   w h e r e   I D = log 2 2 A W
This is a simple but relatively powerful model for estimating movement time as a way to express the concept that the greater distance to the target, the smaller the target size, and the greater the difficulty of the task. Some models with slightly modified ID definitions were presented. Among them, a model proposed by Welford [37] and the Shannon model proposed by MacKenzie [38] were often used. These models had been used to analyze target selection tasks in two dimensions, such as selection with a controller [38,39,40], selection with a stylus pen [41], or tapping a touchscreen by hand [42,43,44]. However, these models were applicable to 1-dimensional (1D) work. Thereafter, models considering the width and height of the target were proposed [45,46,47]. Murata and Iwase [48] and Cha and Myung [49] proposed a 3D extended Fitts’ law, which included the movement angles as variables. Table 1 summarizes the IDs used in the Fitts’ law formula and the various modified formulas mentioned above. In this study, we confirm that Fitts’ law is established in a 3D VR environment (Section 5.3).

2.2. Virtual Reality Sickness Questionnaire

The Simulator Sickness Questionnaire (SSQ) proposed by Kennedy et al. [50] was developed to measure the level of motion sickness in the simulator environment. Thus, the degree of motion sickness was evaluated on a scale of four points for 16 symptoms. Each sickness symptom is included in one or two categories (e.g., nausea, oculomotor, disorientation). The motion sickness level of the simulator could be quantitatively expressed by calculating the score of the sickness symptom included in each category. Kim et al. [51] proposed the Virtual Reality Sickness Questionnaire (VRSQ), which modified the SSQ for the VR environment. Table 2 shows the evaluation items of VRSQ and the category to which each evaluation item belongs. At the bottom of the table, it shows how to calculate the score of each category and its total score. This study used the VRSQ of Table 2 to determine how the interaction method (input) and interface elements (target size and location) affect VR sickness.

3. Method

3.1. Participants

A total of 20 subjects were recruited from the local university, and the sex ratio was equalized. The age range of the subjects was 18-to-25 yrs (mean: 22.7; s.d: ± 1.9). This is considering that the main users of virtual reality devices are mainly in their 20s and 30s [52,53]. Of the subjects, 12 had experienced HMD-based VR before, but the rest were first-timers. The subjects were all students with no vision problems. Prior to the experiment, the subjects were individually adjusted focal lengths for their visual acuity via a dial on atop the HMD so that they could clearly see the image. Therefore, VR sickness caused by unclear images could be reduced as much as possible. All participants provided informed consent, and the study design was approved by the university’s institutional review board (IRB No. 7007971-201801-003-02).

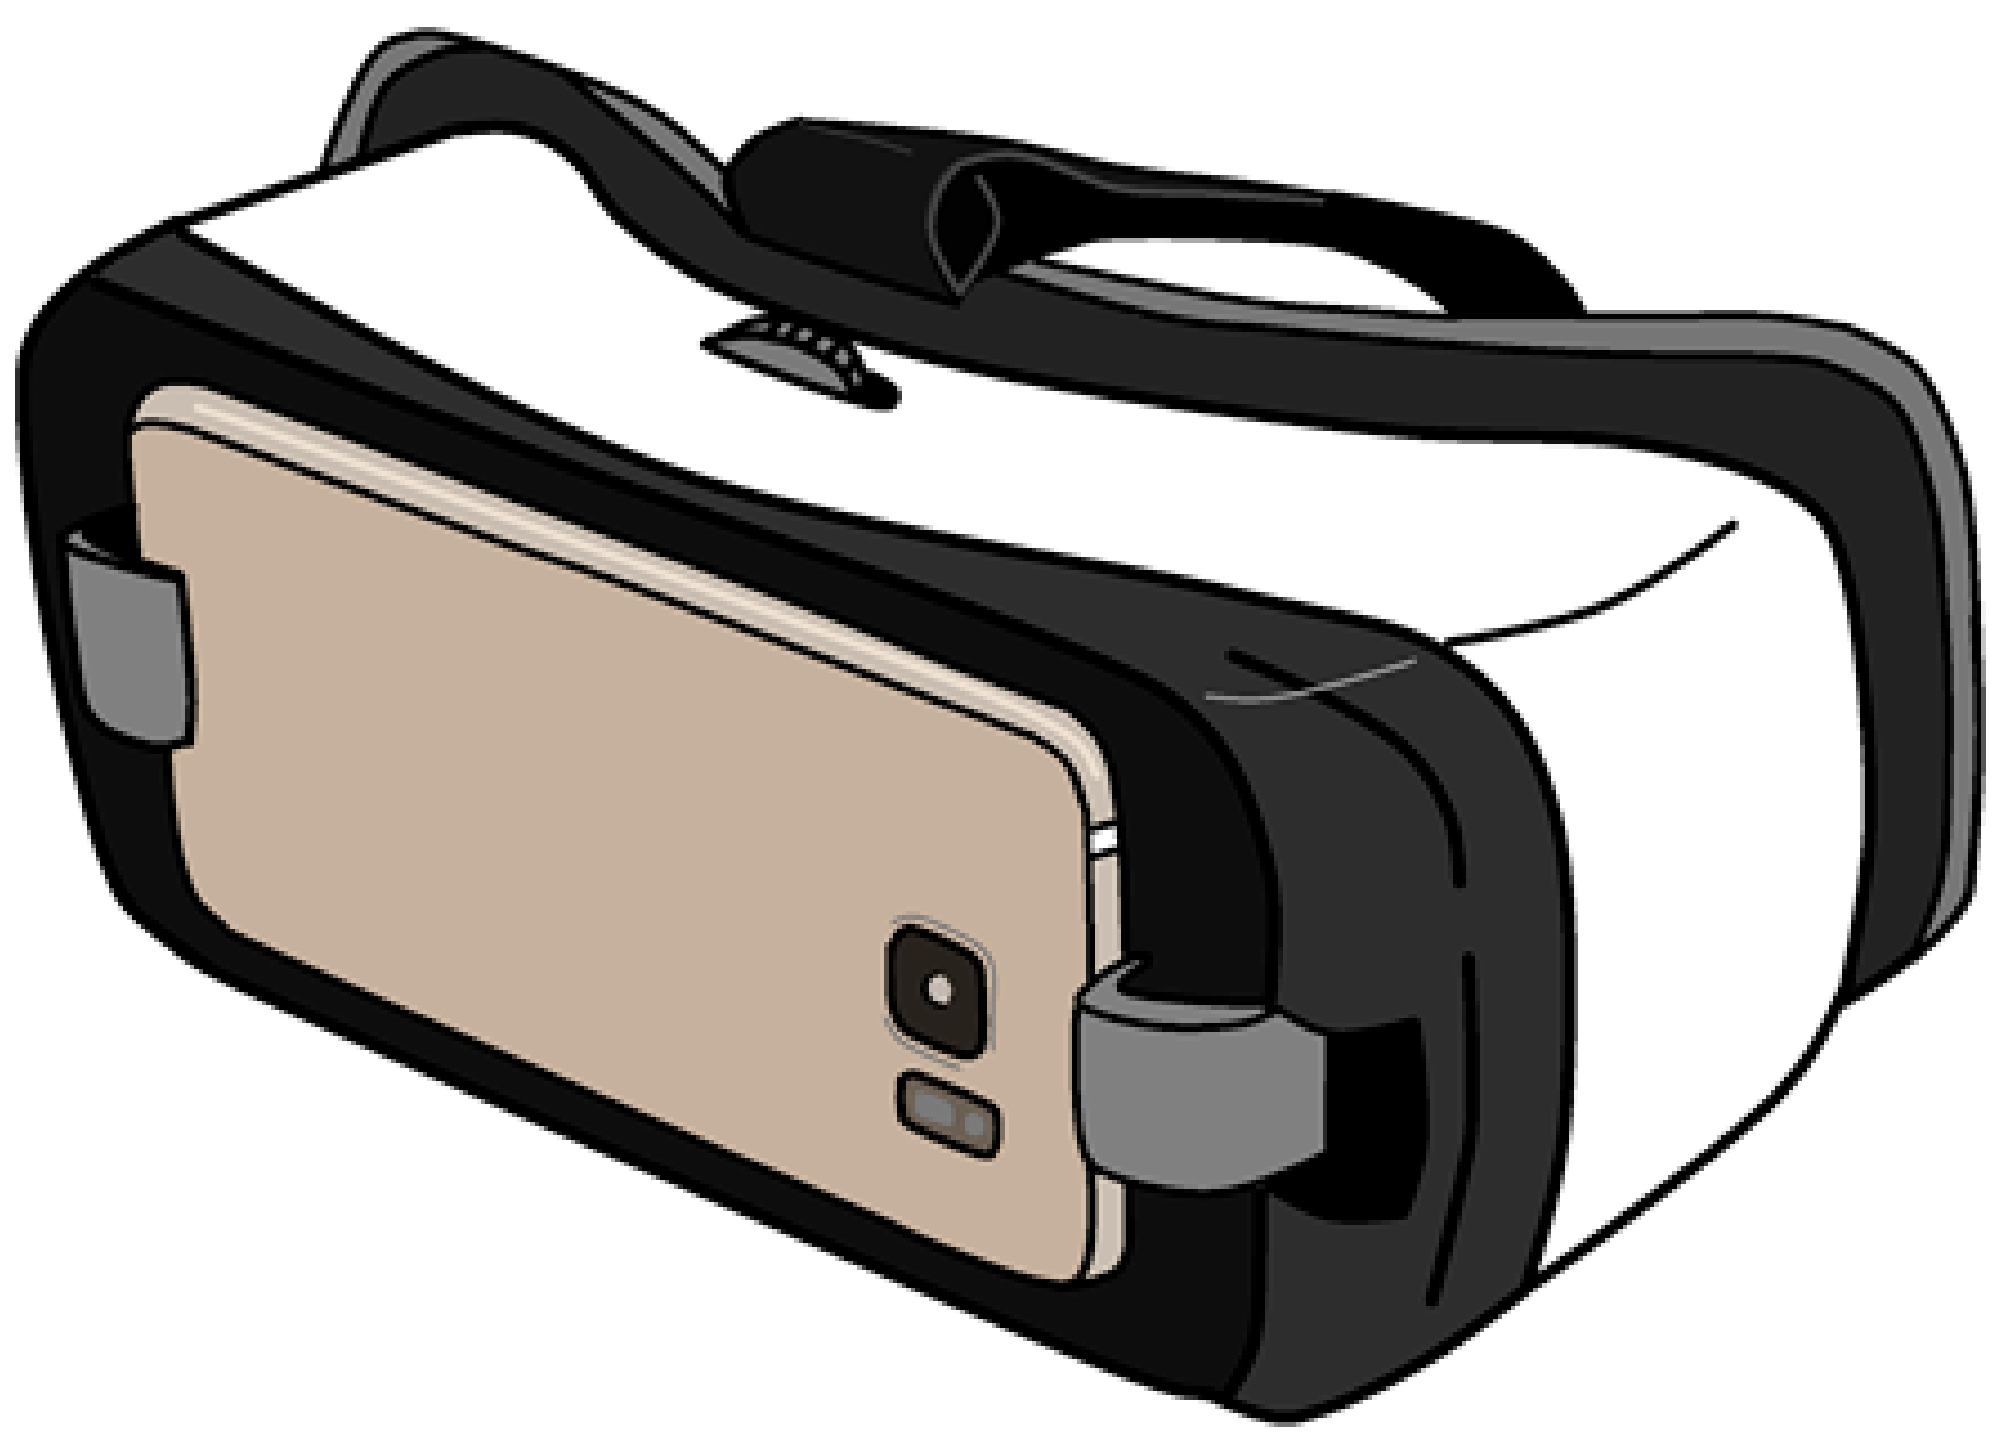
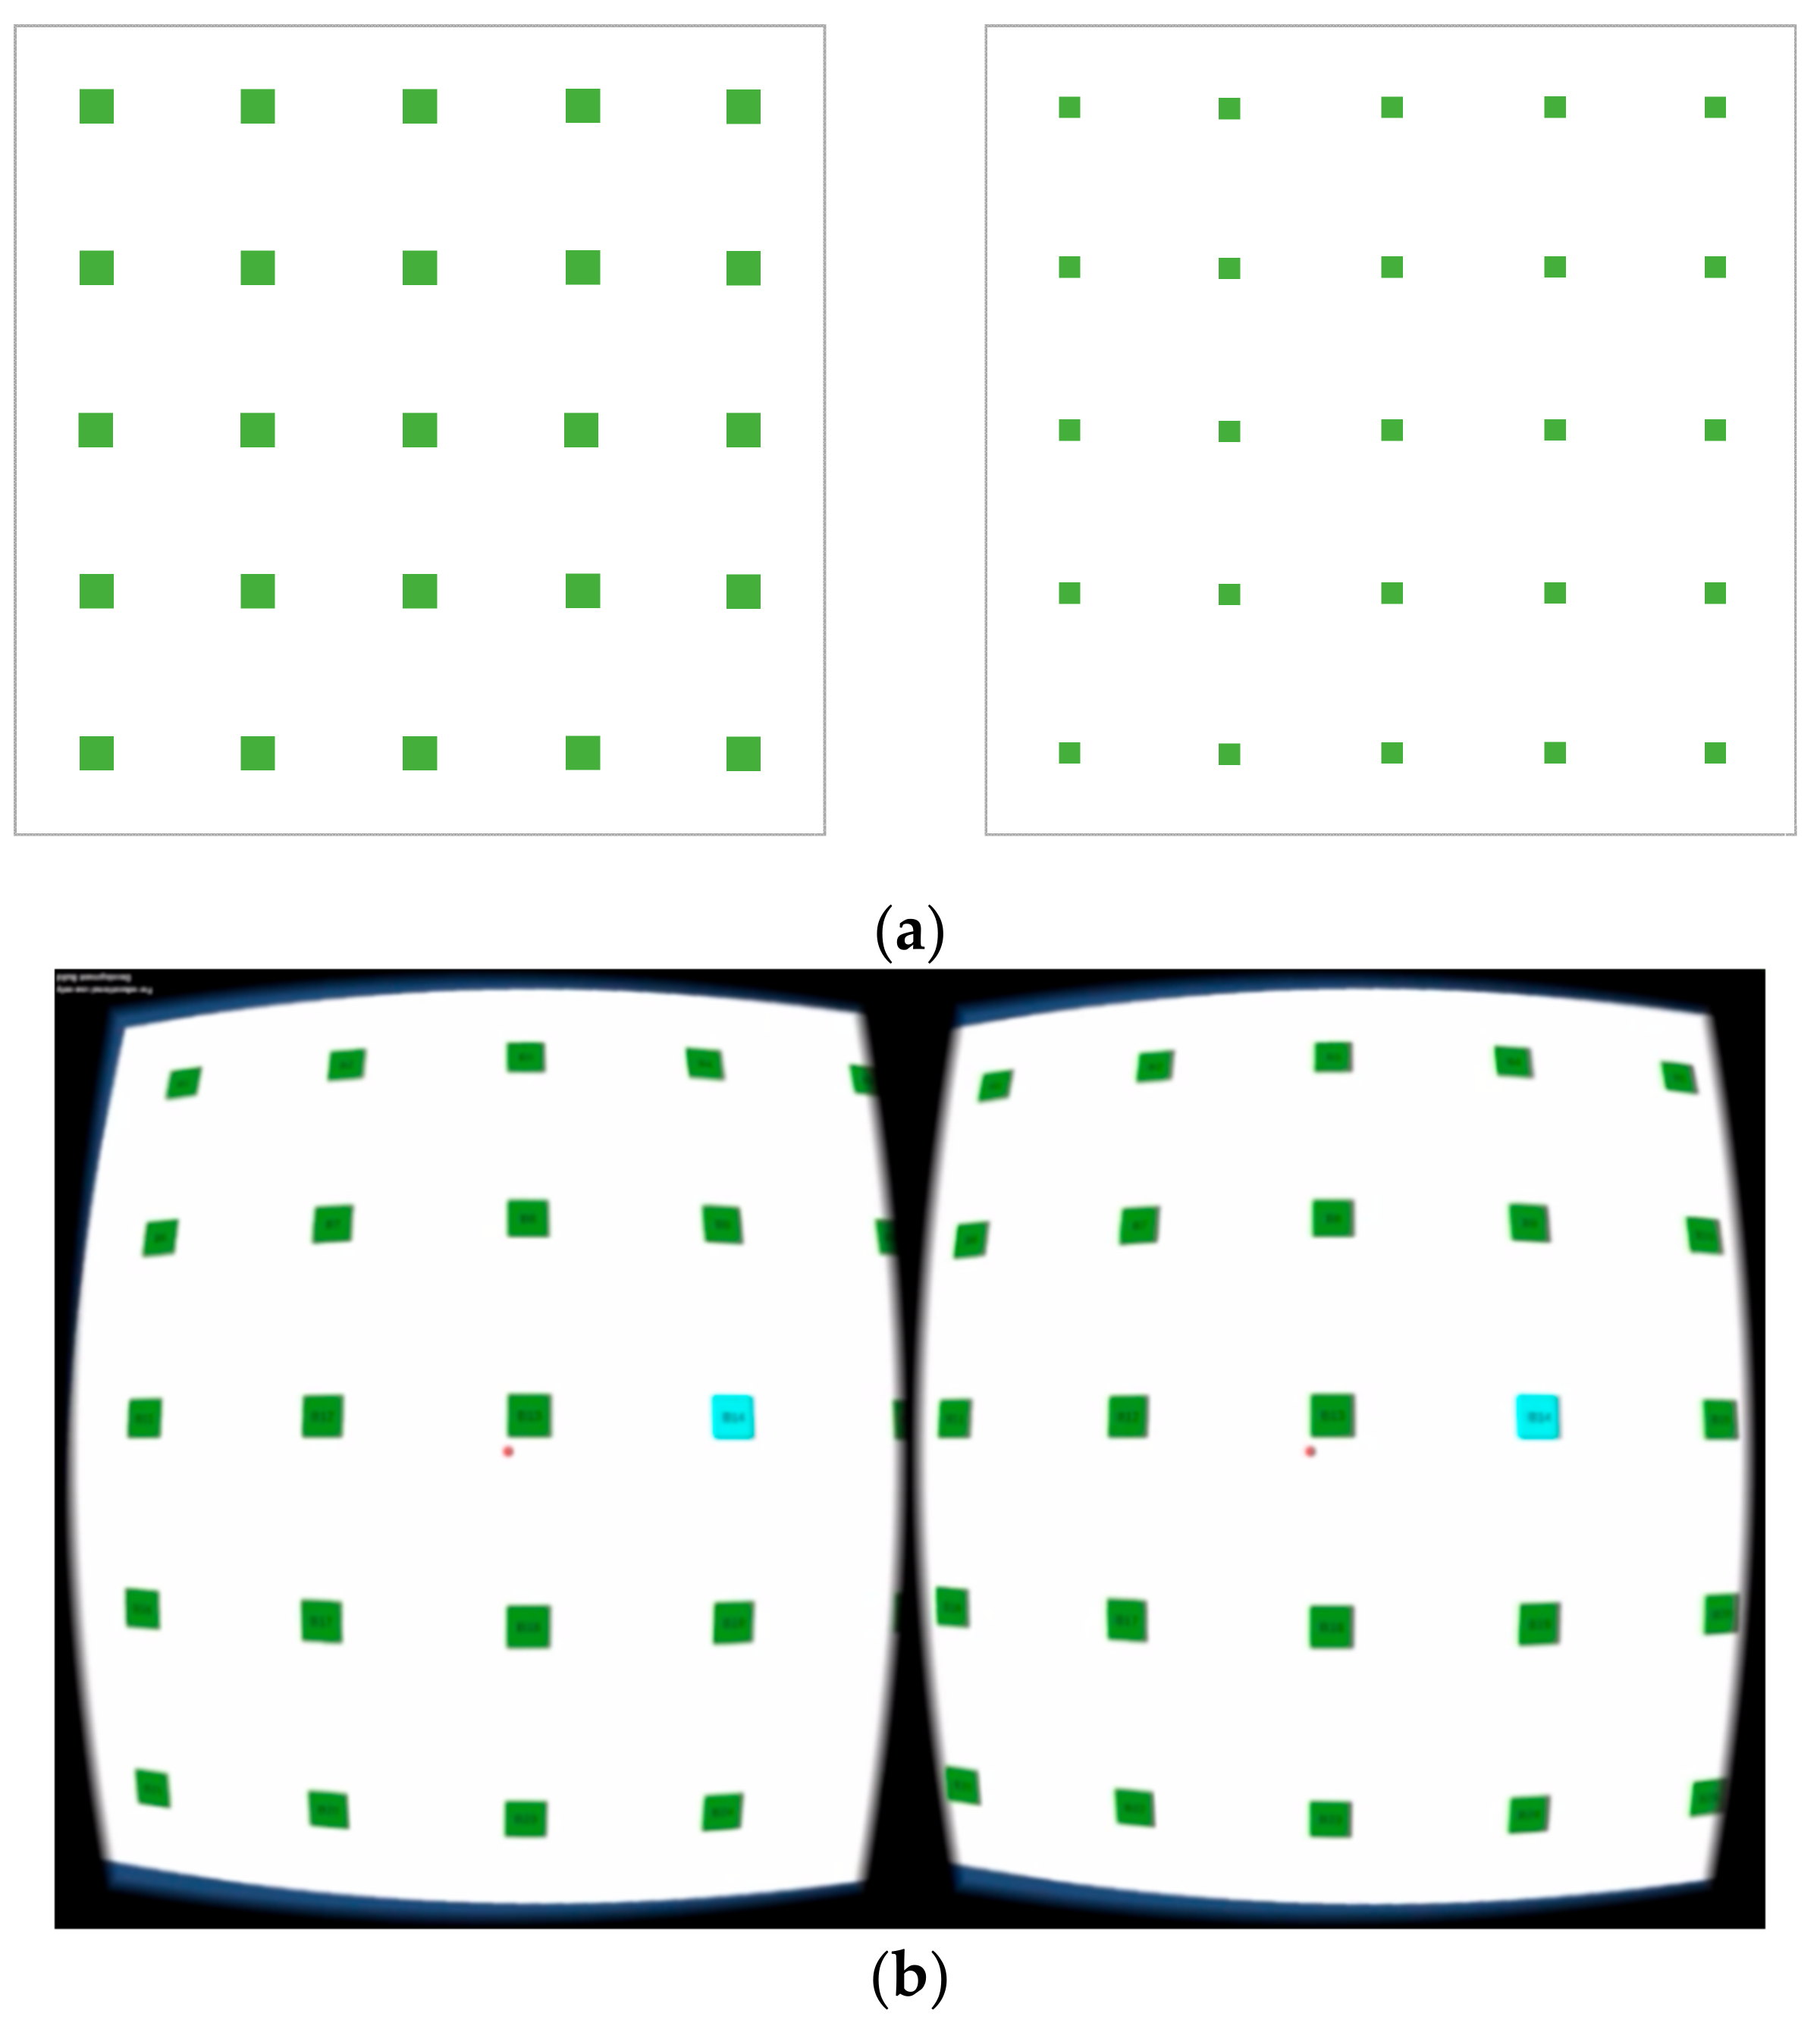
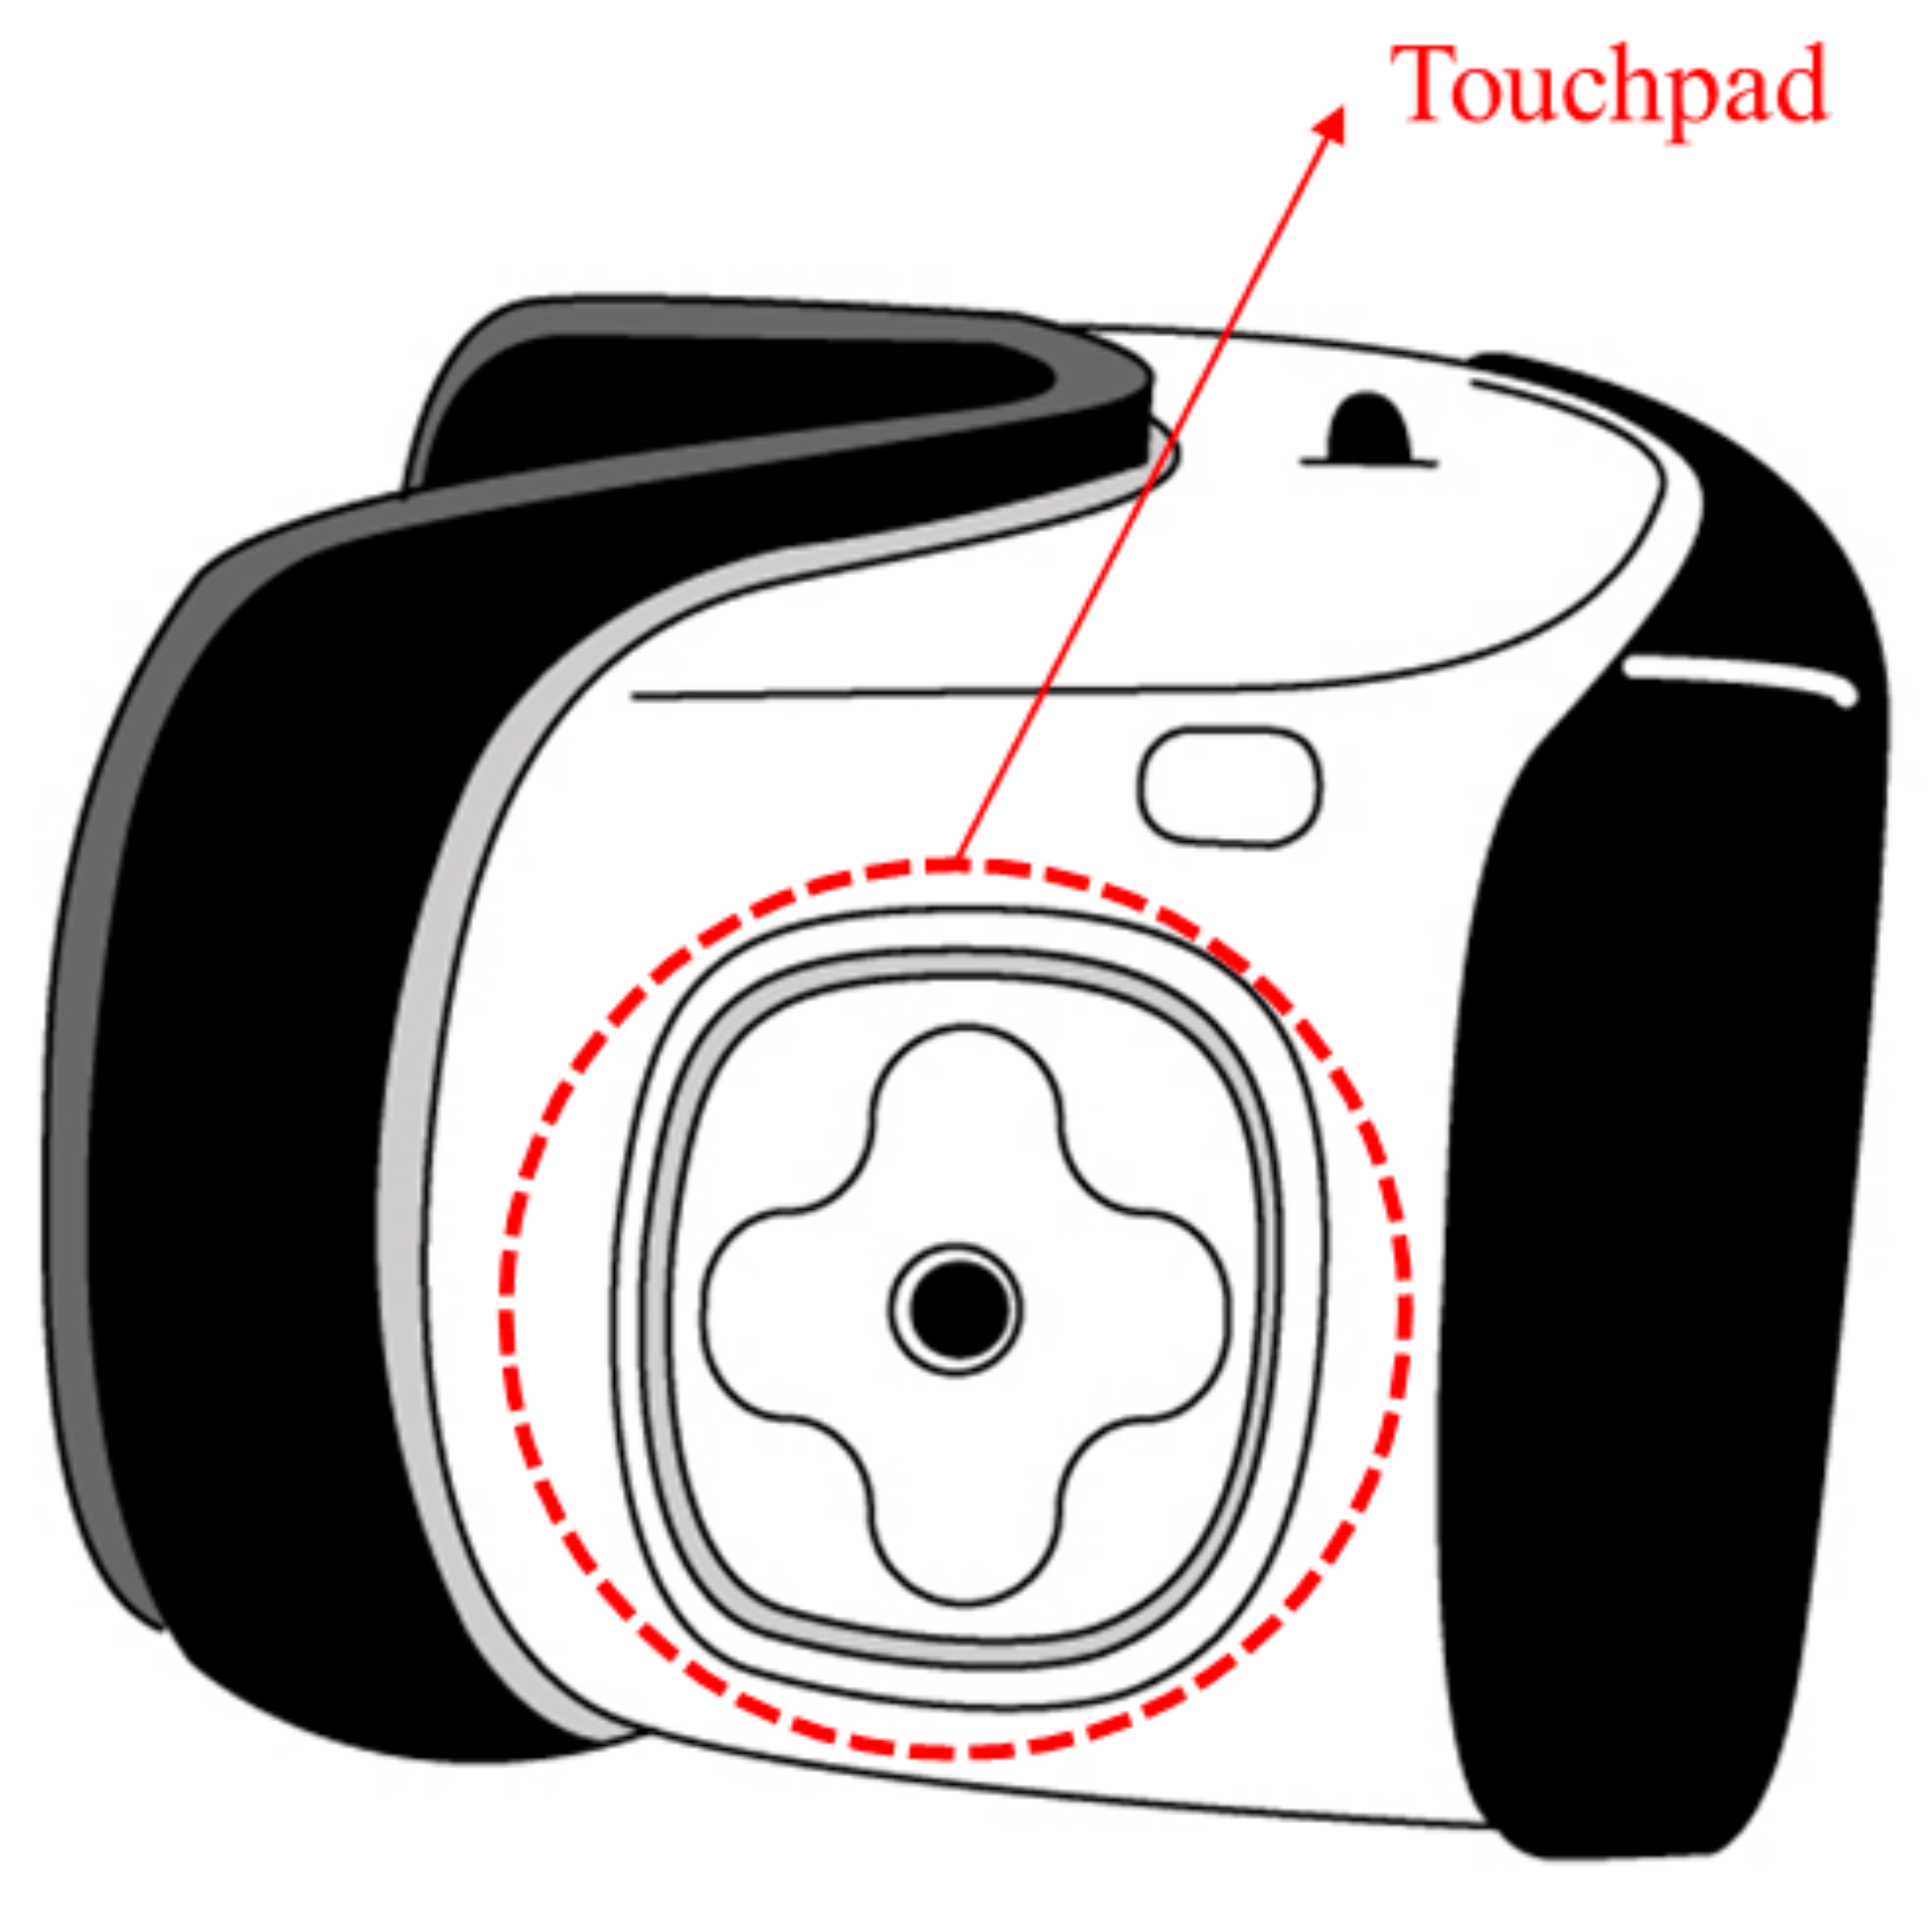
3.2. Apparatus and Application

For the VR experiment, a smartphone-based virtual reality head-mounted display (HMD) was used. The smartphone was a Samsung Galaxy S7 (SM-G930K), and the VR headset that holds the smartphone was a Samsung Gear VR (SM-R322) (Figure 1). The liquid crystal display of the smartphone was used as the HMD screen. The VR effect was realized by providing stereoscopic images. The resolution was 2560 × 1440, and the maximum viewing angle through the HMD was 96° on a diagonal basis, which was sufficient for the experiment. The total weight was 470 g (smartphone: 152 g, headset: 318 g), similar to other virtual reality headsets, and the duration of one type of experiment was within 3 min. Therefore, the effect of motion sickness due to the device’s weight is expected to be small.
The applications used to conduct the experiments were created and implemented directly with Unity and C#. In VR, the visual size varies depending on how far away things are spaced. Therefore, when implementing the target, the target size was determined using a viewing angle, which is a unit that takes into account both the absolute size of the target and the absolute distance from the subject’s eye to the target, rather than using only the absolute size of the target. Based on the results of Bababekova et al. [54], the viewing angle of the target was determined (Figure 2). The distance and the size of the target set here were fixed, so it did not change over the participants. Referring to the experimental design of other studies that analyzed the effect of the target characteristics [43,44,55,56], a total of 25 square targets, spaced at regular intervals in a 5 × 5 array, was placed on a white plane with a viewing angle of about 127°19′ on a diagonal basis. Therefore, the experiment was performed within a range similar to the mid-peripheral vision of a human, which is not less than the viewing angle provided by the VR HMD. The size of the target was set at two levels. The viewing angle was set at about 3°50′ for large targets and about 2°23′ for small targets. Figure 3 shows an example of the experimental area.
The experimental conditions comprise a total of four according to the target size and target selection method. The size of the target was two levels, as described above, and the target selection method is also divided into two. Target selection methods included gaze selection and manual selection. Both used a cursor fixed at the center of the screen, reflecting head movement through head tracking, placing the cursor on the point to be selected. In this case, the gaze-selection method was automatically selected after 1000 ms when placing the cursor on the target. This is based on a previous study in which the highest task performance was obtained when the gaze-timing was 1000 ms [57]. For reference, in the previous study, considering that the average waiting time used for the top 5 applications based on the number of downloads from the Android Play Store was 1.52 (±0.60) seconds, the waiting time was set to 1 s, 1.5 s, and 2 s. However, the manual-selection method was used after placing the cursor on the target and pressing the touchpad on the right side of the HMD (Figure 4).

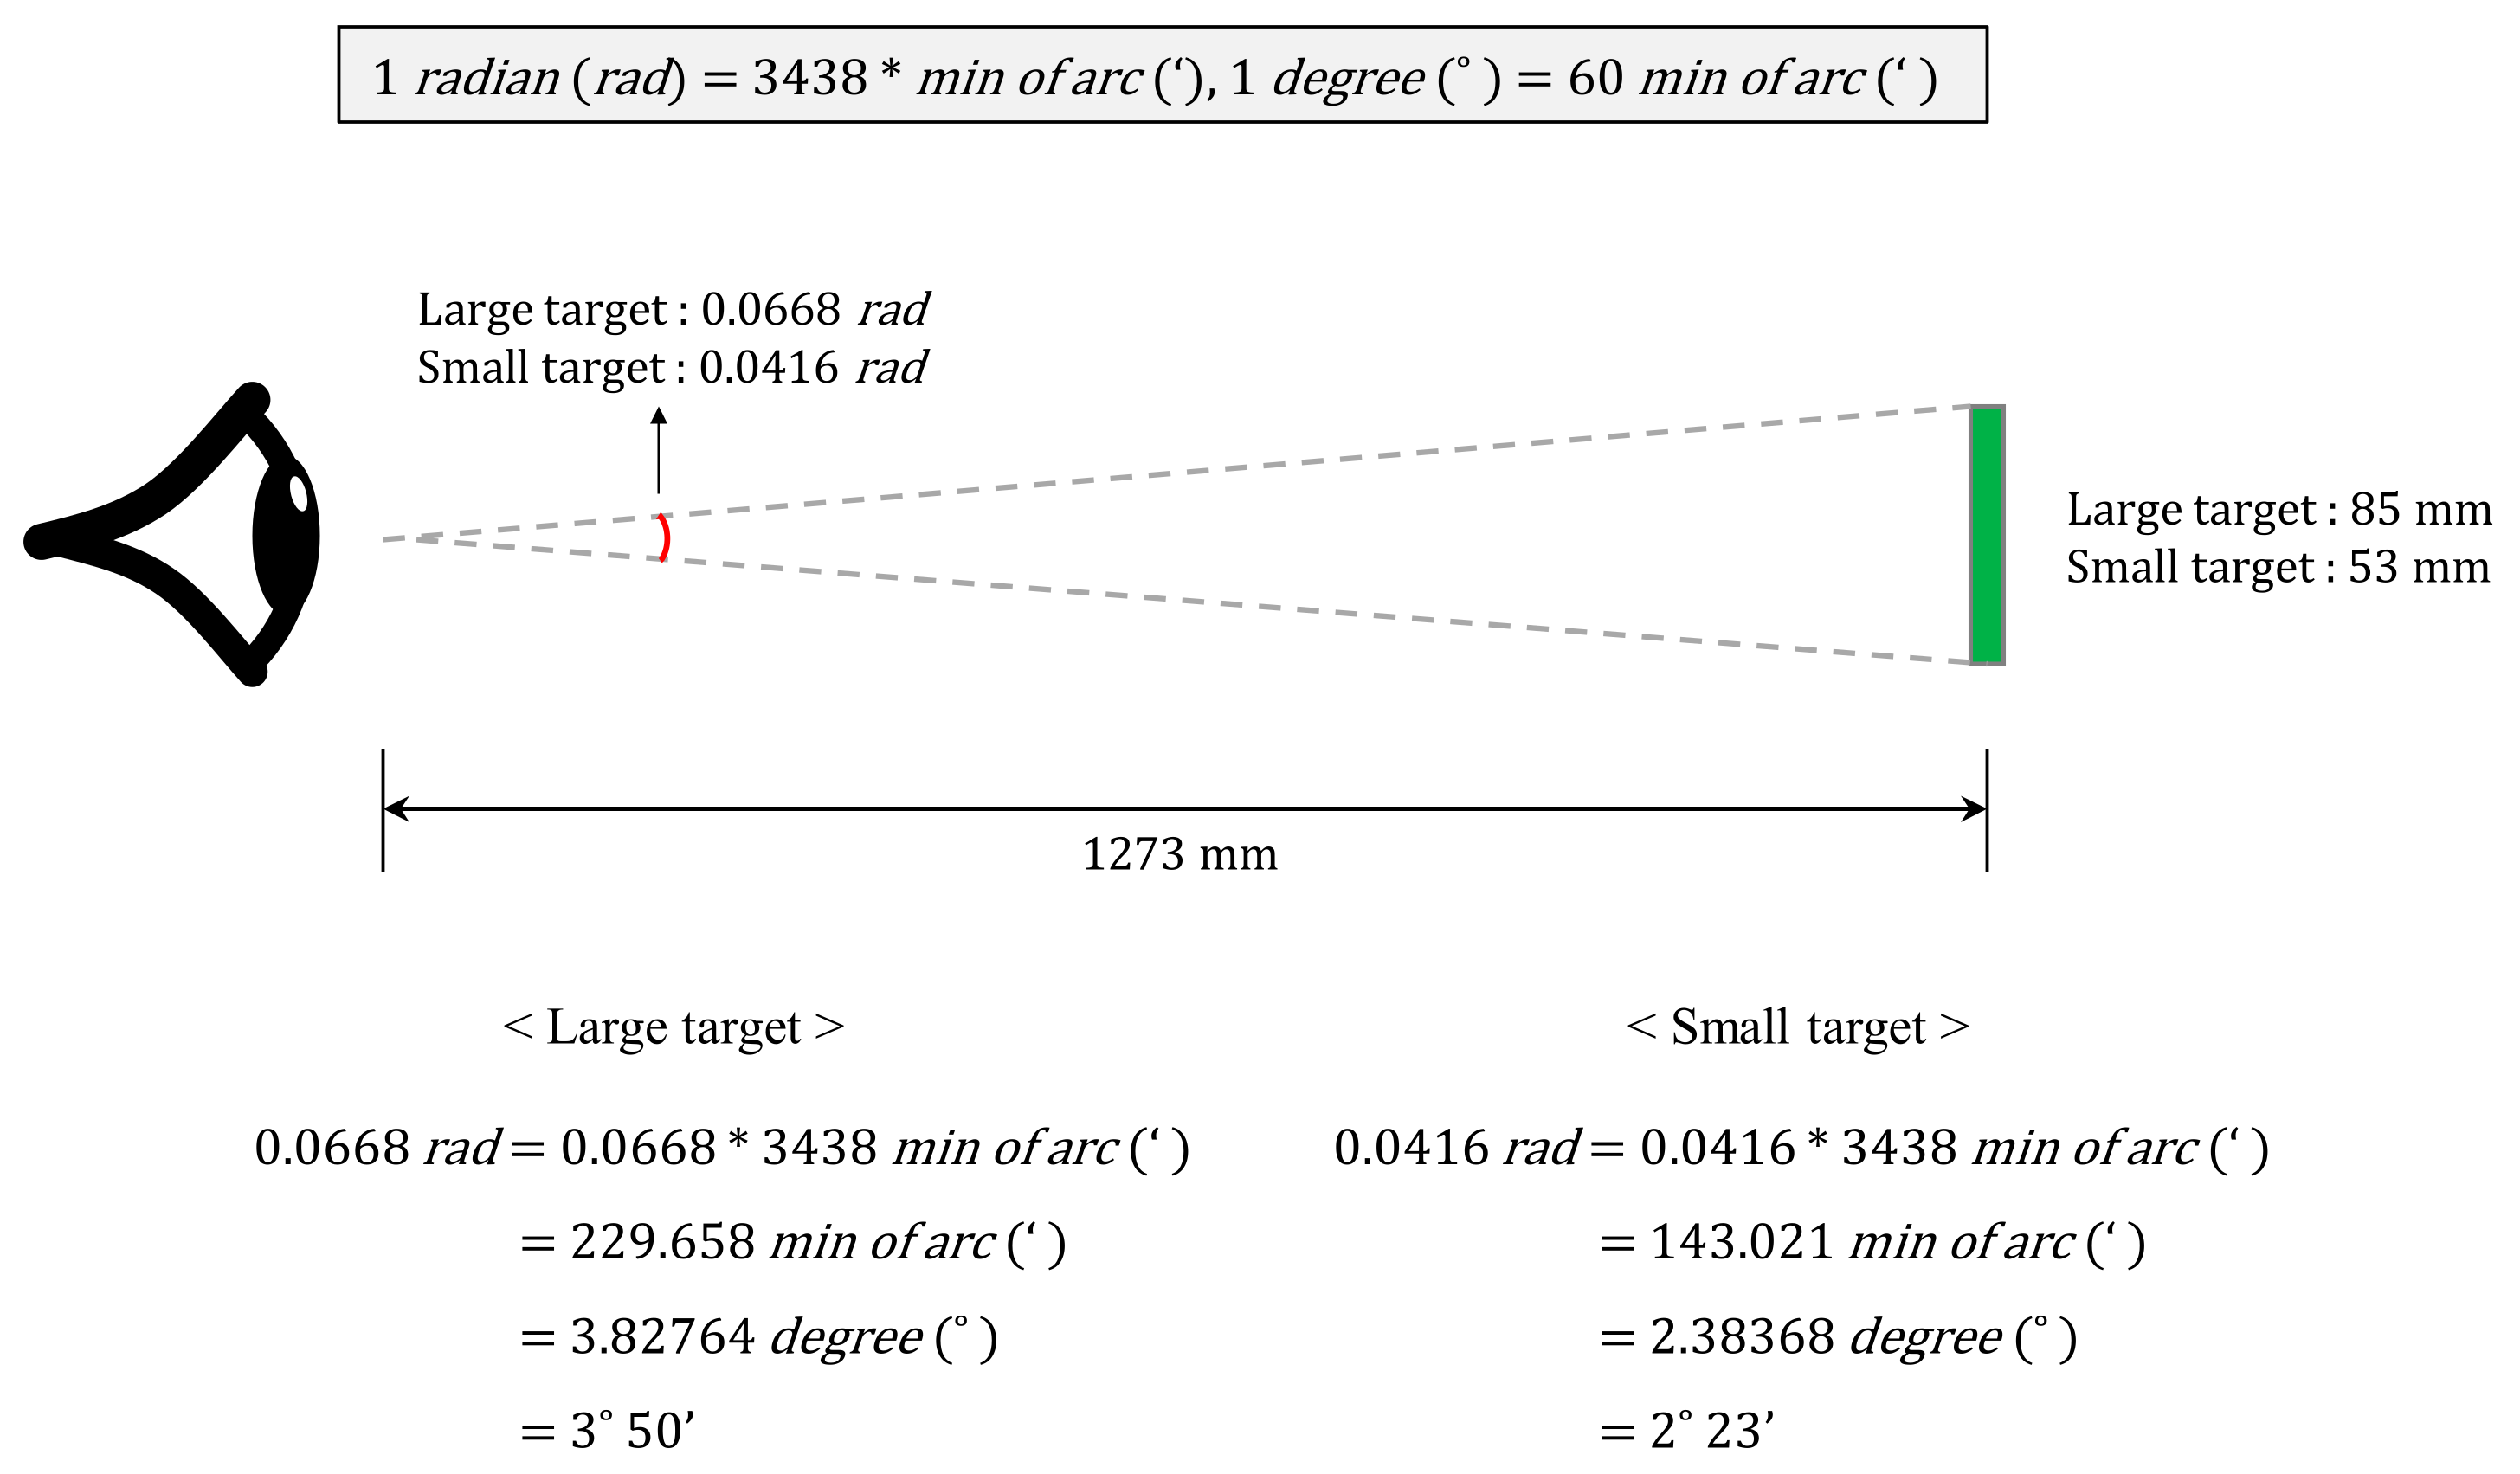
3.3. Experimental Measurement
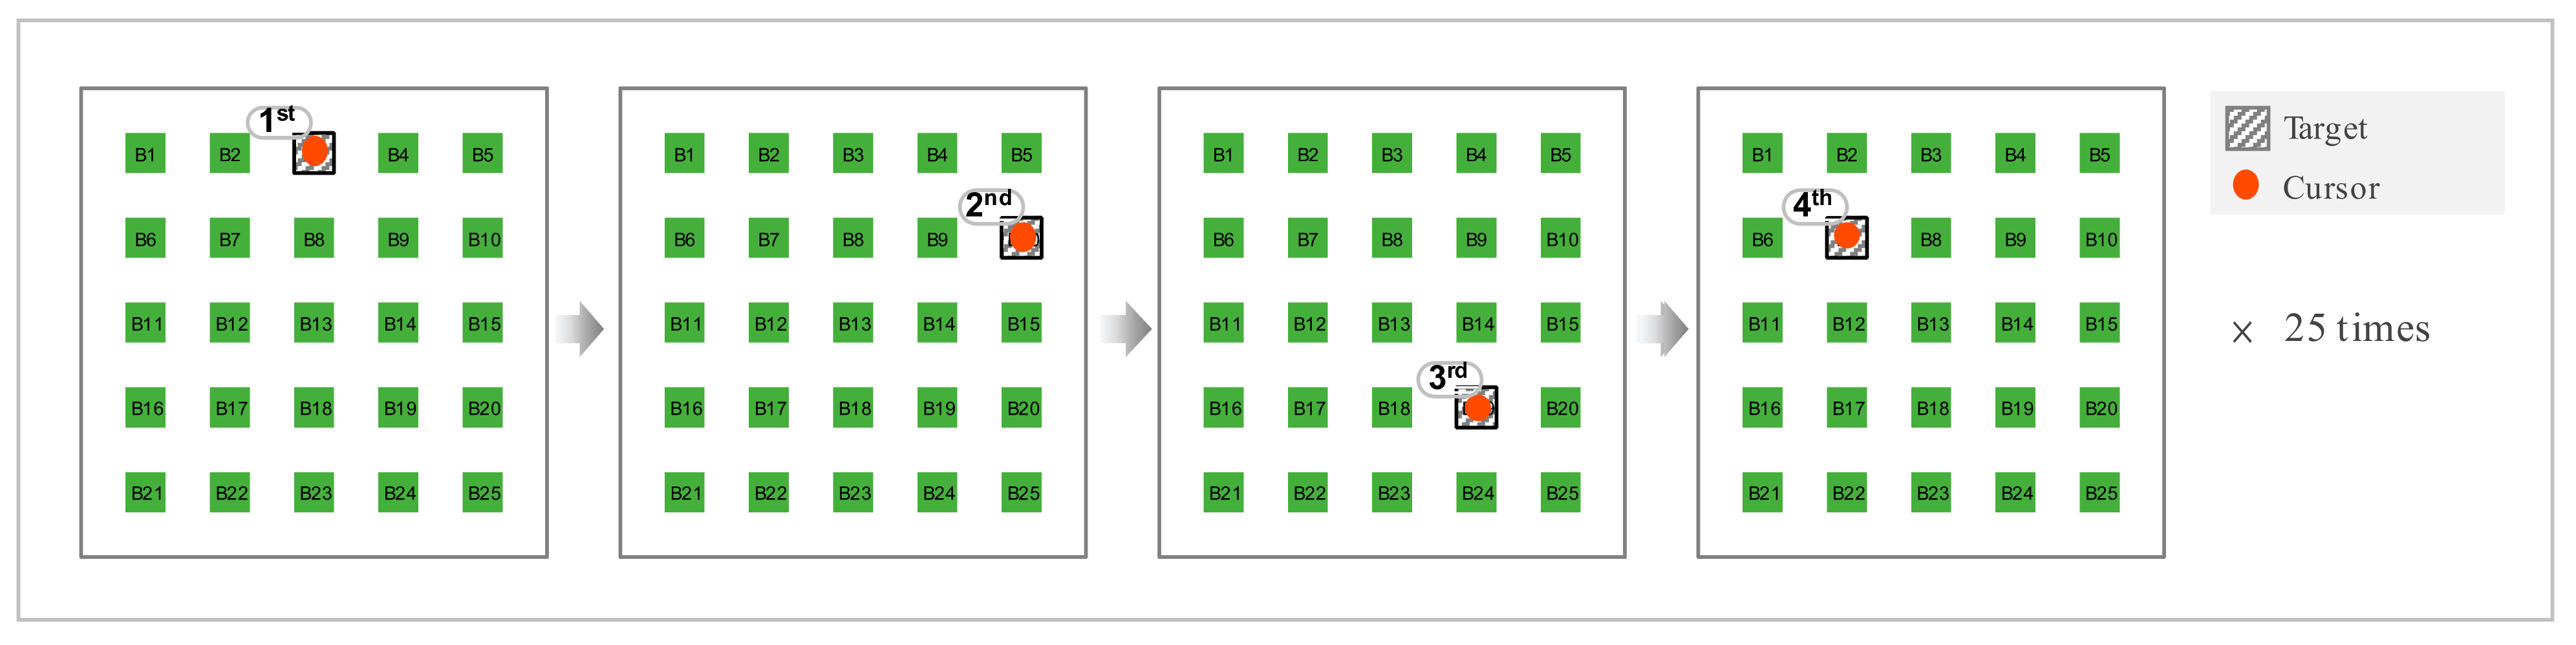
This experiment was performed to evaluate how the size, position, and selection methods of the target affected the performance of the task when the user performed the input operation in the virtual environment. Therefore, task completion time (TCT) and the error rate (ER) in all four experiments were measured. Task completion time was defined as the time from when one target was presented to when each participant selected the target. The error rate was defined as the number of incorrect selections made during the task.
Additionally, we measured VR sickness using the VRSQ. Participants rated the level of motion sickness at four levels while taking a break after each experiment (0: Not at all; 1: Slight; 2: Moderate; 3: Very). Therefore, a total of four questionnaires were completed by each participant.

3.4. Procedure

Experiments were performed using within-subject design methods. Experiments conducted in this study show that the learning effect could be increased toward the end of the experiment because the target was repeatedly pressed many times and was challenging. Therefore, to minimize the learning effect, the order of execution of the four experimental conditions was determined using the Latin Square balancing design technique.
In all four conditions of the experiment, one of the 25 green targets was highlighted in blue. The targets presented were designed to appear randomly without any set rules. One task ended when four target selections were completed. When the participant was ready for the next task, he or she began by pressing the HMD’s touchpad. In order to reduce the effect by a small number of samples, participants were asked to perform the task several times. Thus, the task was repeated 25 times, so one participant selected a total of 400 targets (4 selections × 25 repetitions × 2 target sizes × 2 selection methods) (Figure 5). The participants sat in their chairs and performed the experiments in a relaxed posture. At the end of each of the four experimental conditions, the participants completed a VRSQ.

4. Results

As the result of the statistical analysis, there was no significant difference by gender in all dependent variables (TCT: p = 0.450; ER: p = 0.062; VRSQ: 0.683; α = 0.05).

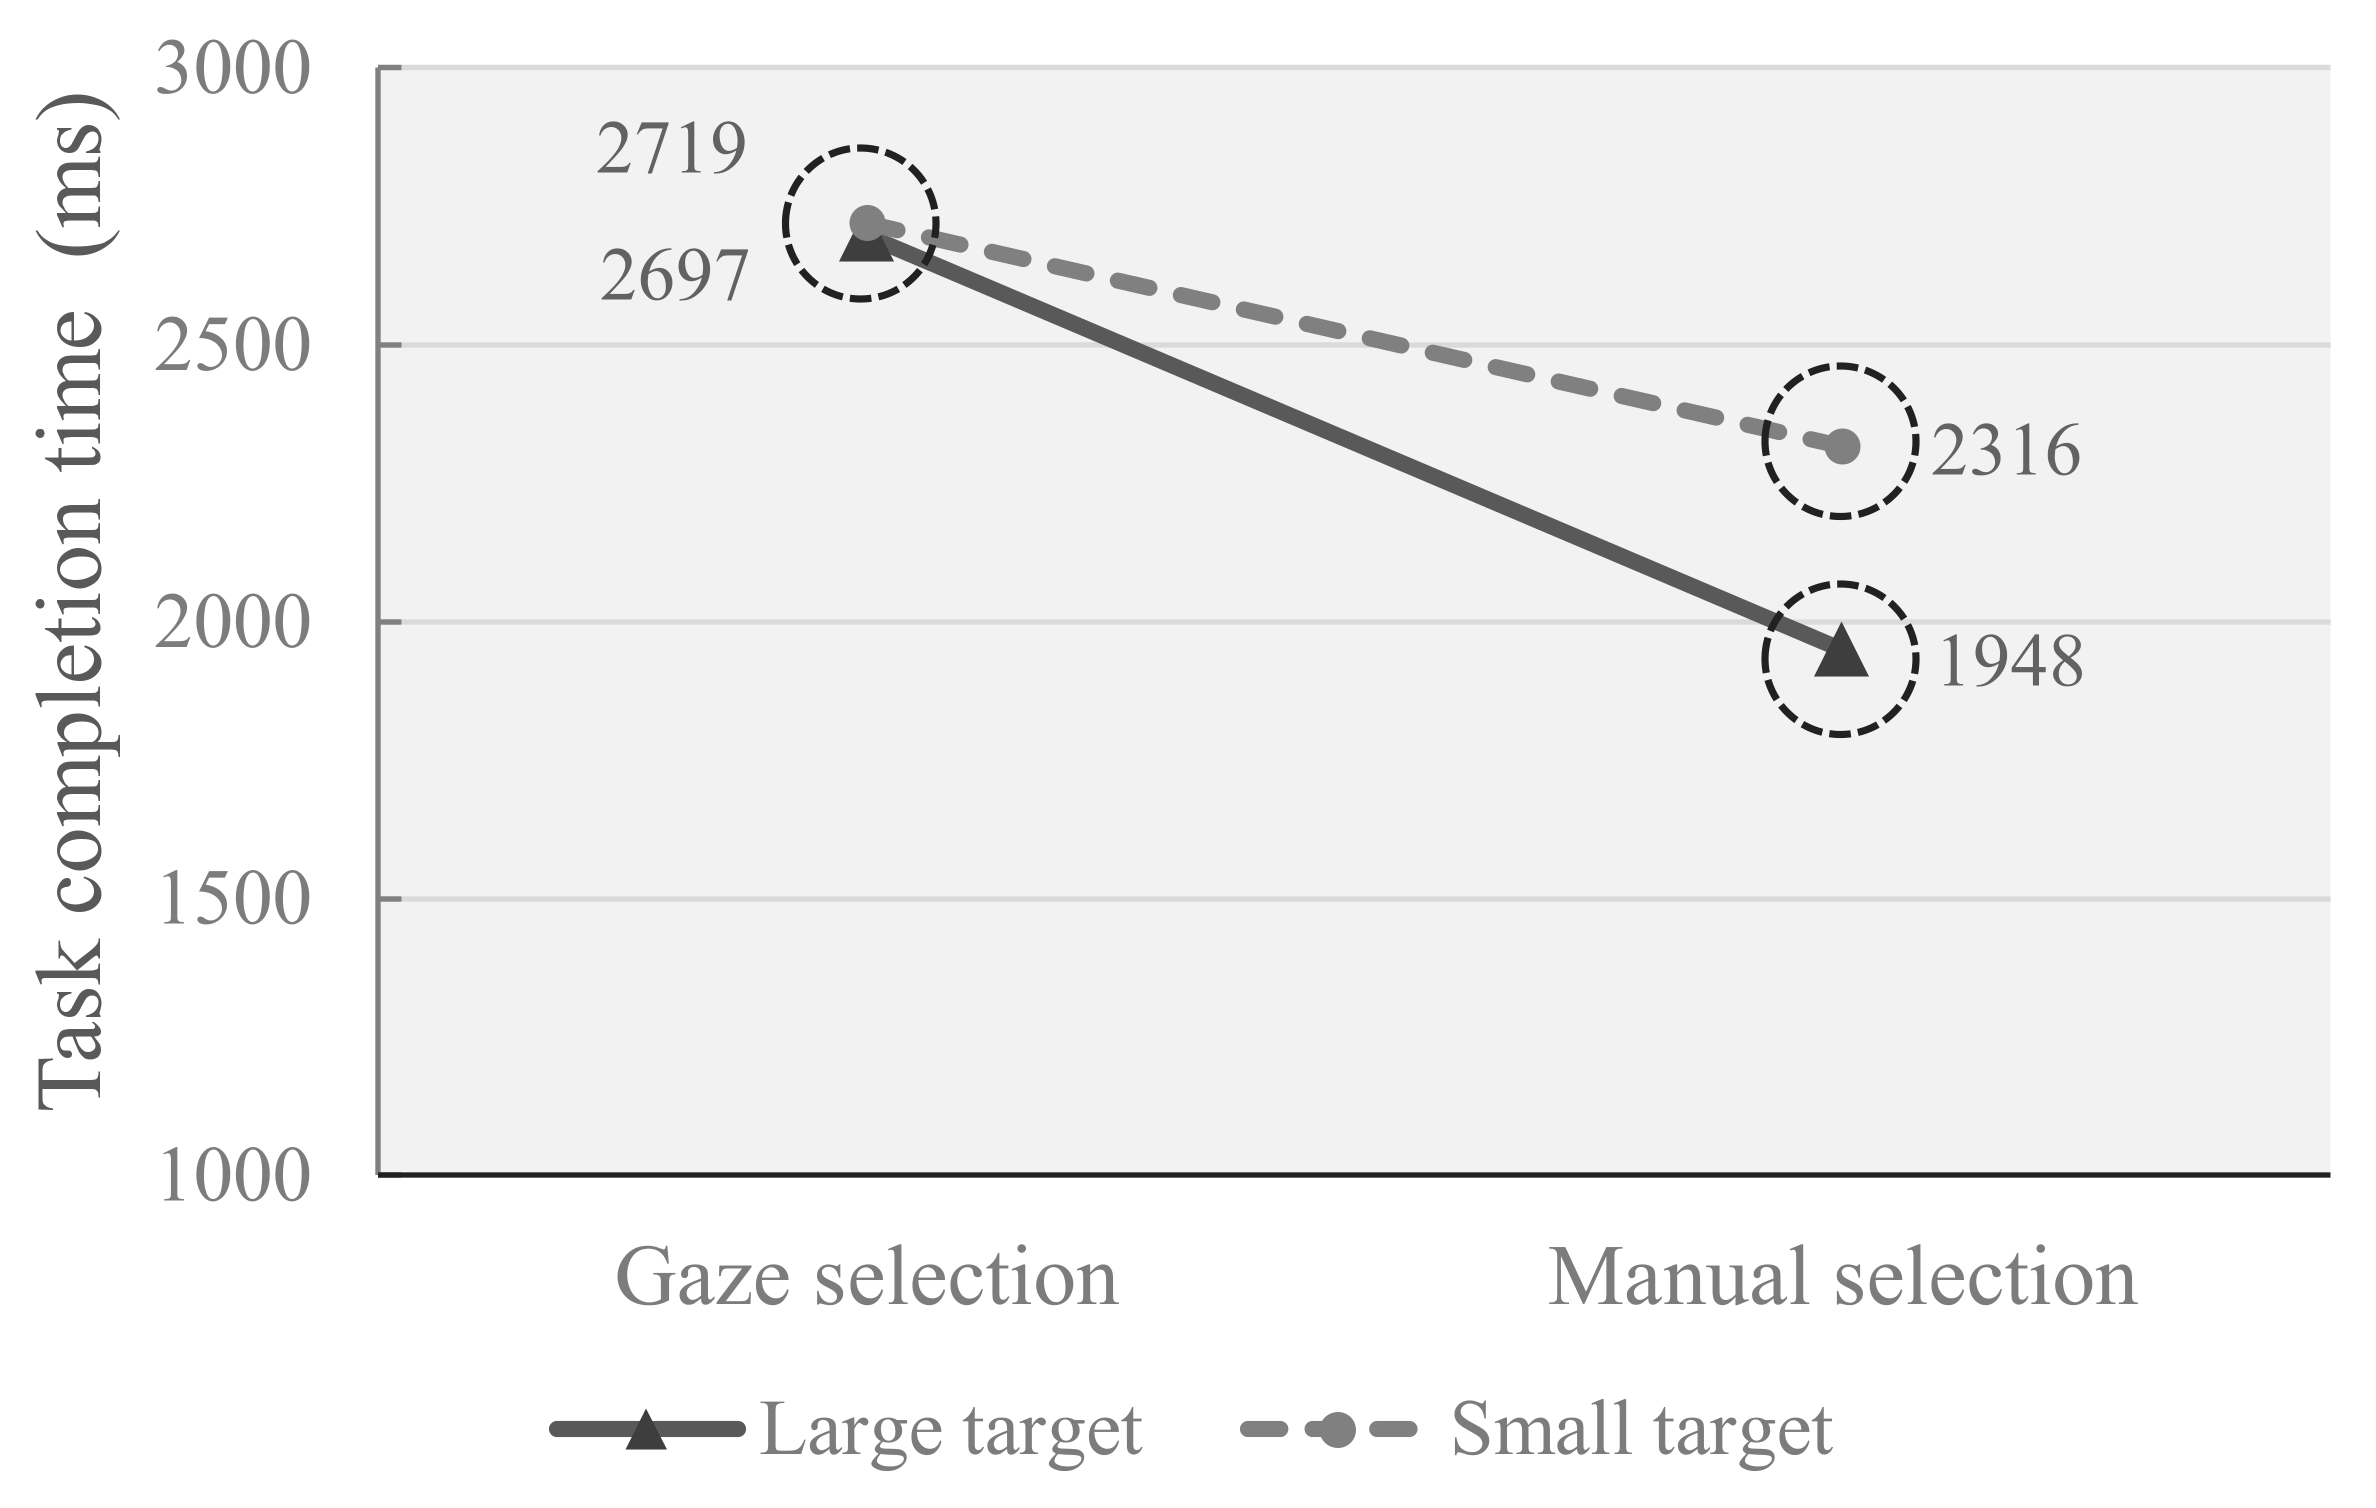
4.1. Task Completion Time

The mean and standard deviation of each task completion time (TCT) based on two independent variables were measured as follows (Table 3). The average TCT of the large target was 2322 ms, and the small target was 2518 ms, indicating that the time required to select a small target was longer. For determining whether the difference in TCT was statistically significant depending on the size of the target, a two-way repeated measure of ANOVA (RM-ANOVA) analysis was performed. Thus, it was found that the size of the target could have a significant effect on TCT (p < 0.001; α = 0.05).
The manual-selection method took 2132 ms, and the gaze-selection method took 2708 ms. In the case of manual selection, the TCT was shorter than that of gaze selection. Likewise, RM-ANOVA analysis was conducted to find out whether the difference in target selection method was significant (p < 0.001). Additionally, the interaction effect between target size and input method was also significant (p < 0.001). Simple effect analysis showed that there was no effect on target size during gaze-selection, but TCT was significantly different according to target size in manual-selection (Figure 6).

4.2. Error Rate

We examined how the error rate (ER) varied with each experimental condition. ER of the large target was 0.35% and 0.65% in the small target. The chi-squared test was performed to determine whether these differences were statistically significant. The results showed that the size of the target was not a significant factor in the ER (p = 0.057; α = 0.05). Additionally, the manual-selection method showed ER of 0.90%, and the gaze-selection method was 0.10%. ER was about nine times different, depending on the selection method. As in the chi-squared test, the two target selection methods were analyzed to be significant factors for the ER (p < 0.001).

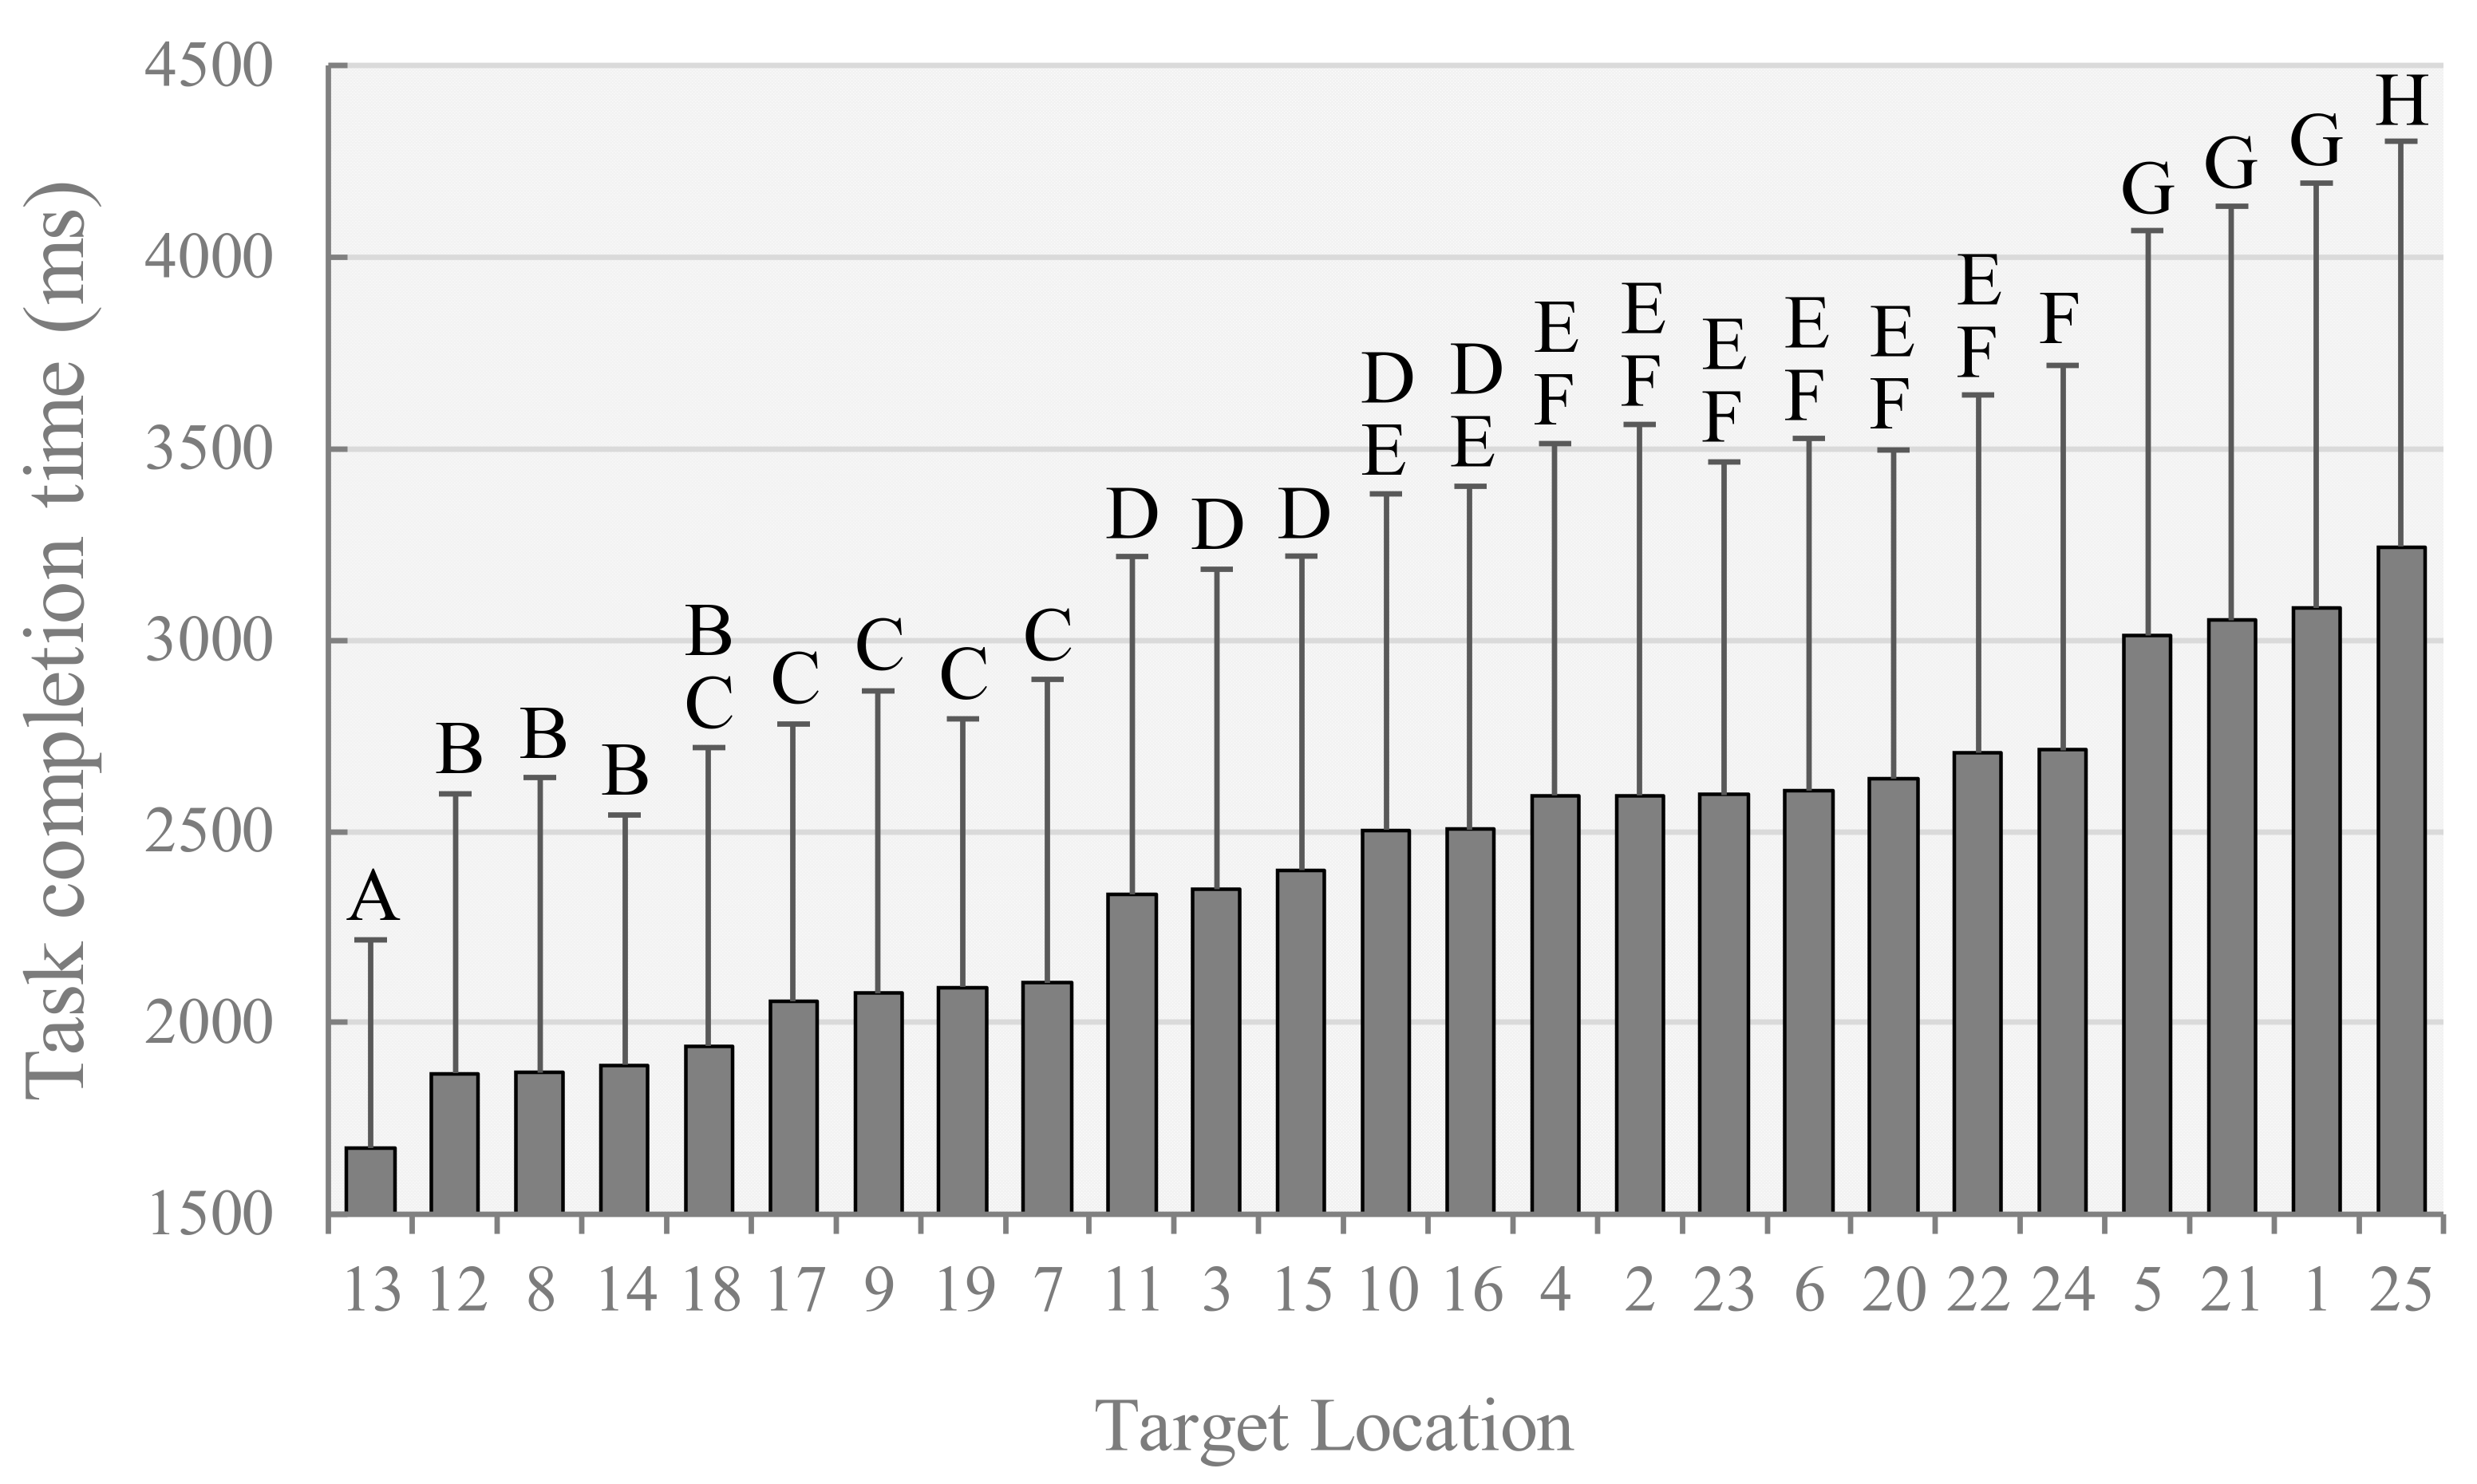
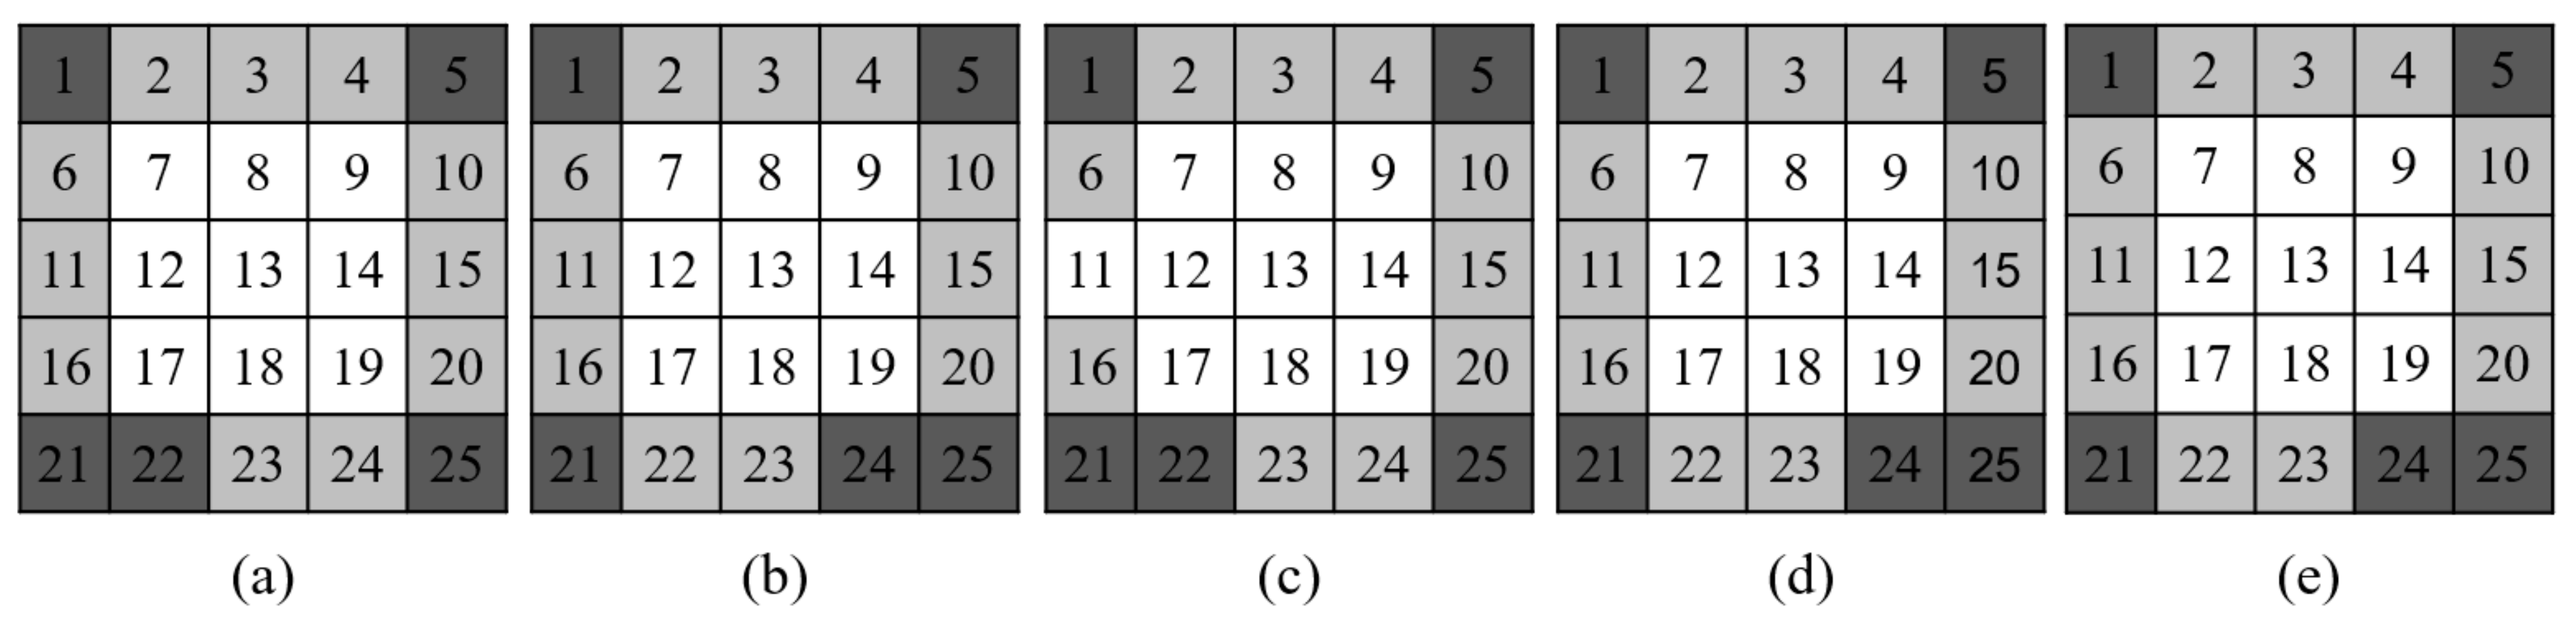
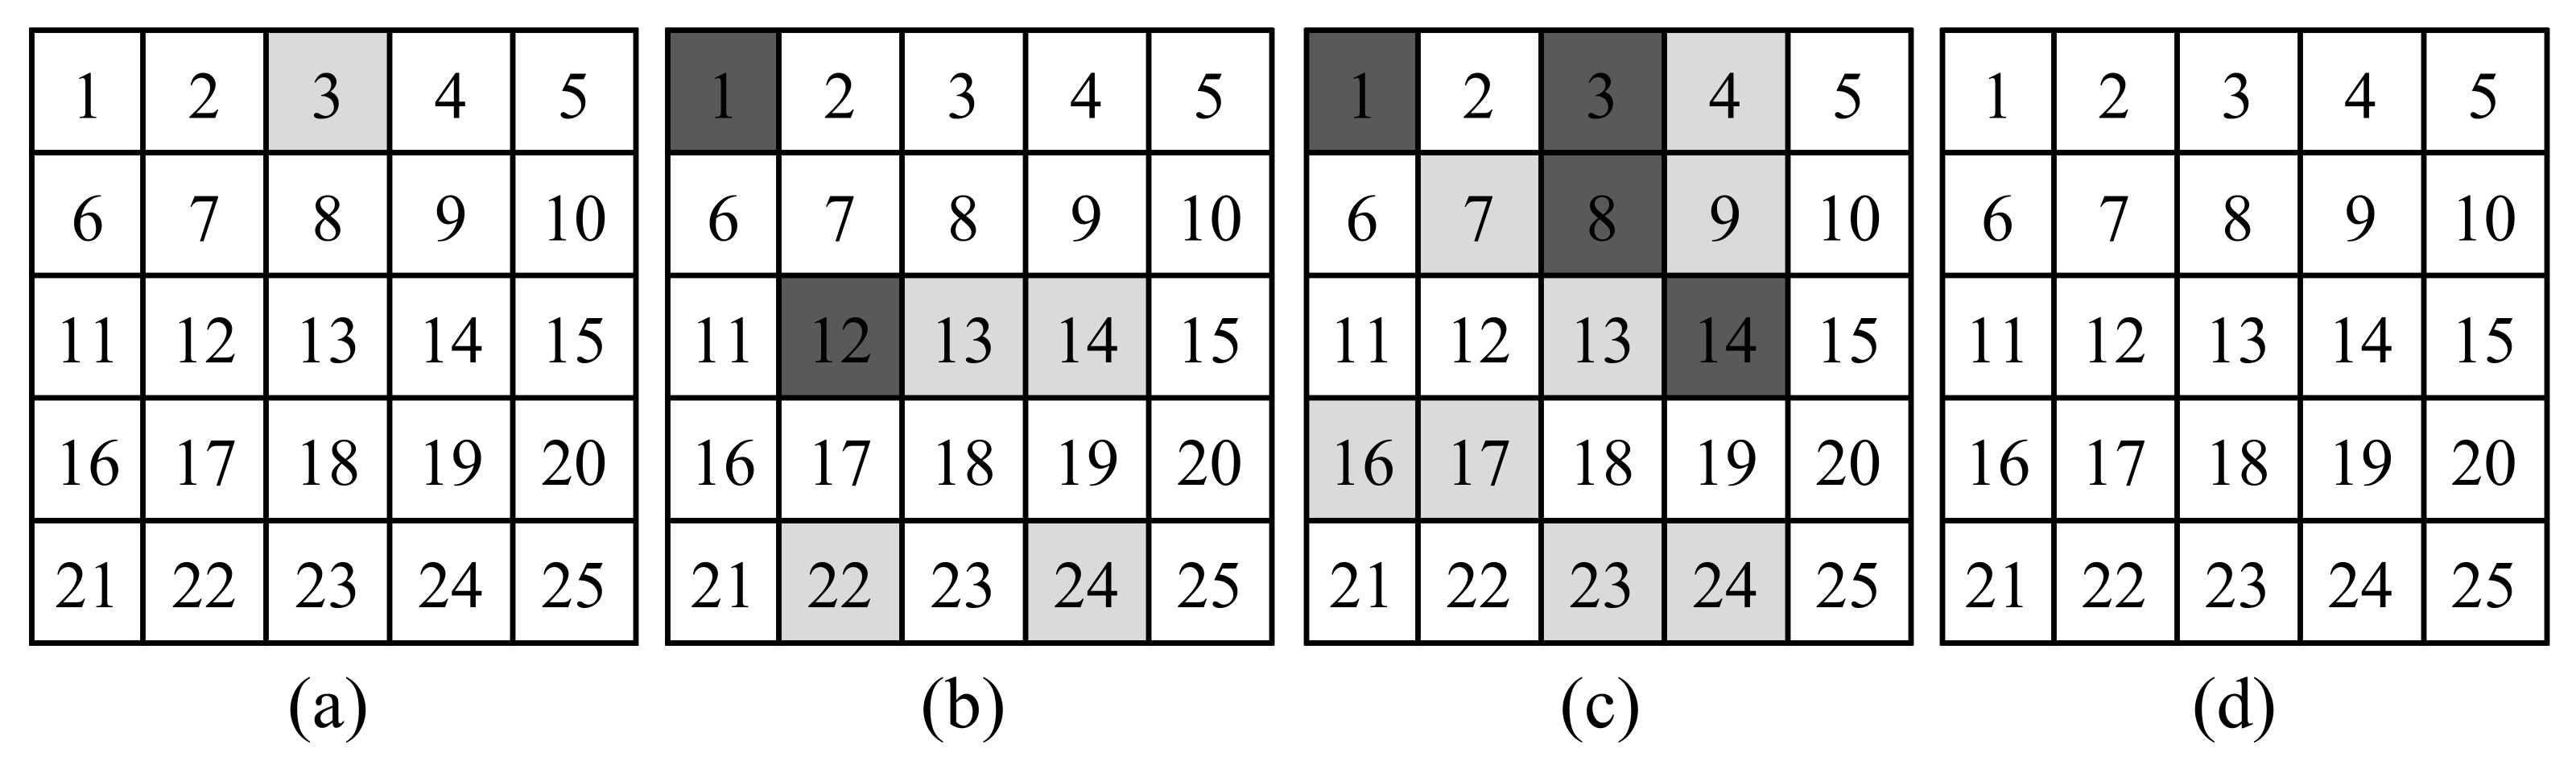
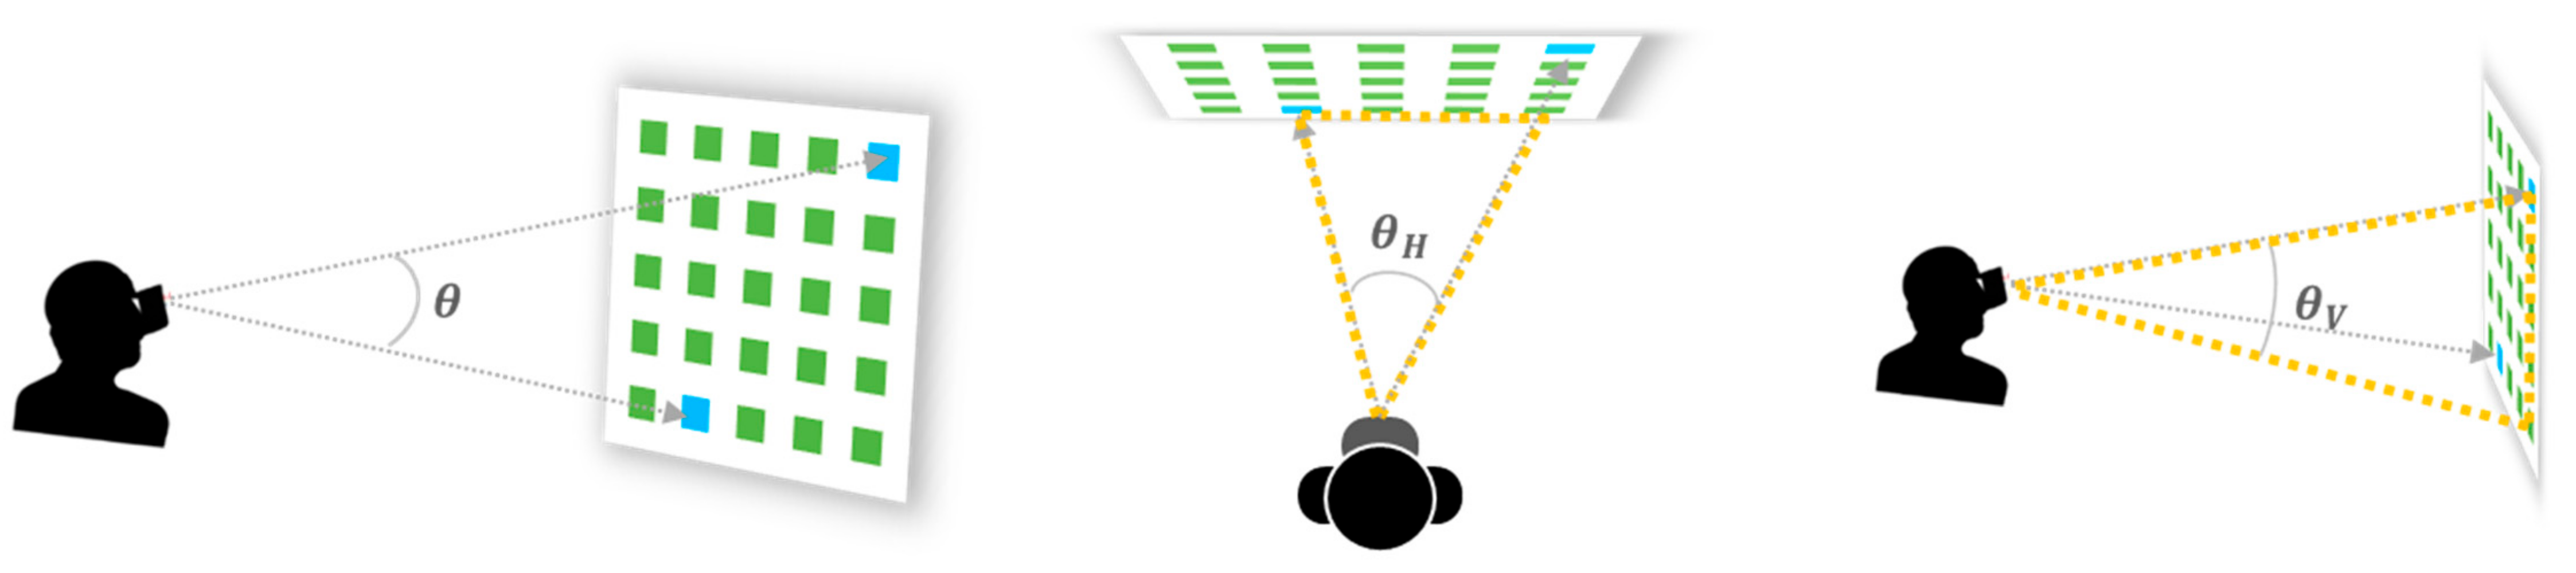
4.3. Target Location

To investigate the influence of the TCT per the position of the target, the average TCT was obtained for each target position. The one-way repeated measure of ANOVA analysis was performed using the target location as an independent variable (α = 0.05). The target location data were entered on a nominal scale from 1 to 25 in order from the top left. The result showed that the target position was a significant factor in the TCT in all experimental conditions (p < 0.001). Post-hoc analysis was performed using the Student–Newman–Keuls (SNK) test, and SNK analysis showed statistically significant differences for the target location (Figure 7).
We performed a separate classification task to visually check how the TCT differed according to the position of the target. First, TCTs, according to 25 targets, were grouped by post hoc analysis. Among them, the targets belonging to the same group as the target corresponding to the median value were classified into the medium speed group. The targets with shorter times were classified into the fast-speed group based on the medium-speed group, and those with longer times were classified into the slow-speed group. Table 4 shows the range of TCTs for the three groups determined by the target size and the selection method.
Figure 8 shows the distribution of TCT for each condition. According to the criteria in Table 4, the slow-speed group was shown in dark gray, the medium-speed group in light gray, and the fast-speed group in white. In all experimental conditions, targets located at the center were classified into the fast-speed group. Additionally, as the distance from the center increased, time also became longer. In particular, targets located farthest from the center were classified into the slow-speed group.
Unlike the TCT, the chi-squared test found that the target position was not statistically significant at ER (p = 0.876; α = 0.05). Figure 9 shows the location of the error in each condition. Errors less than 1/3 of all errors were white, less than 2/3 errors were light gray, and the rest were dark gray. Thus, the darker the color, the more errors occurred at the position; the brighter the color, the fewer errors occurred. Figure 9a,b show the error distributions for large and small targets. By comparison, whereas the error rate was not analyzed as a significant difference per the target size, more errors occurred in the smaller target. However, through Figure 9c,d, the error distribution of the two selection methods could be checked. In the case of manual selection, many areas were painted in dark colors, but in gaze selection, all areas were marked in white. As with the results of the analysis in Section 4.3, it can be confirmed that errors occurred significantly, depending on the selection method. However, there was no effect from the target position.

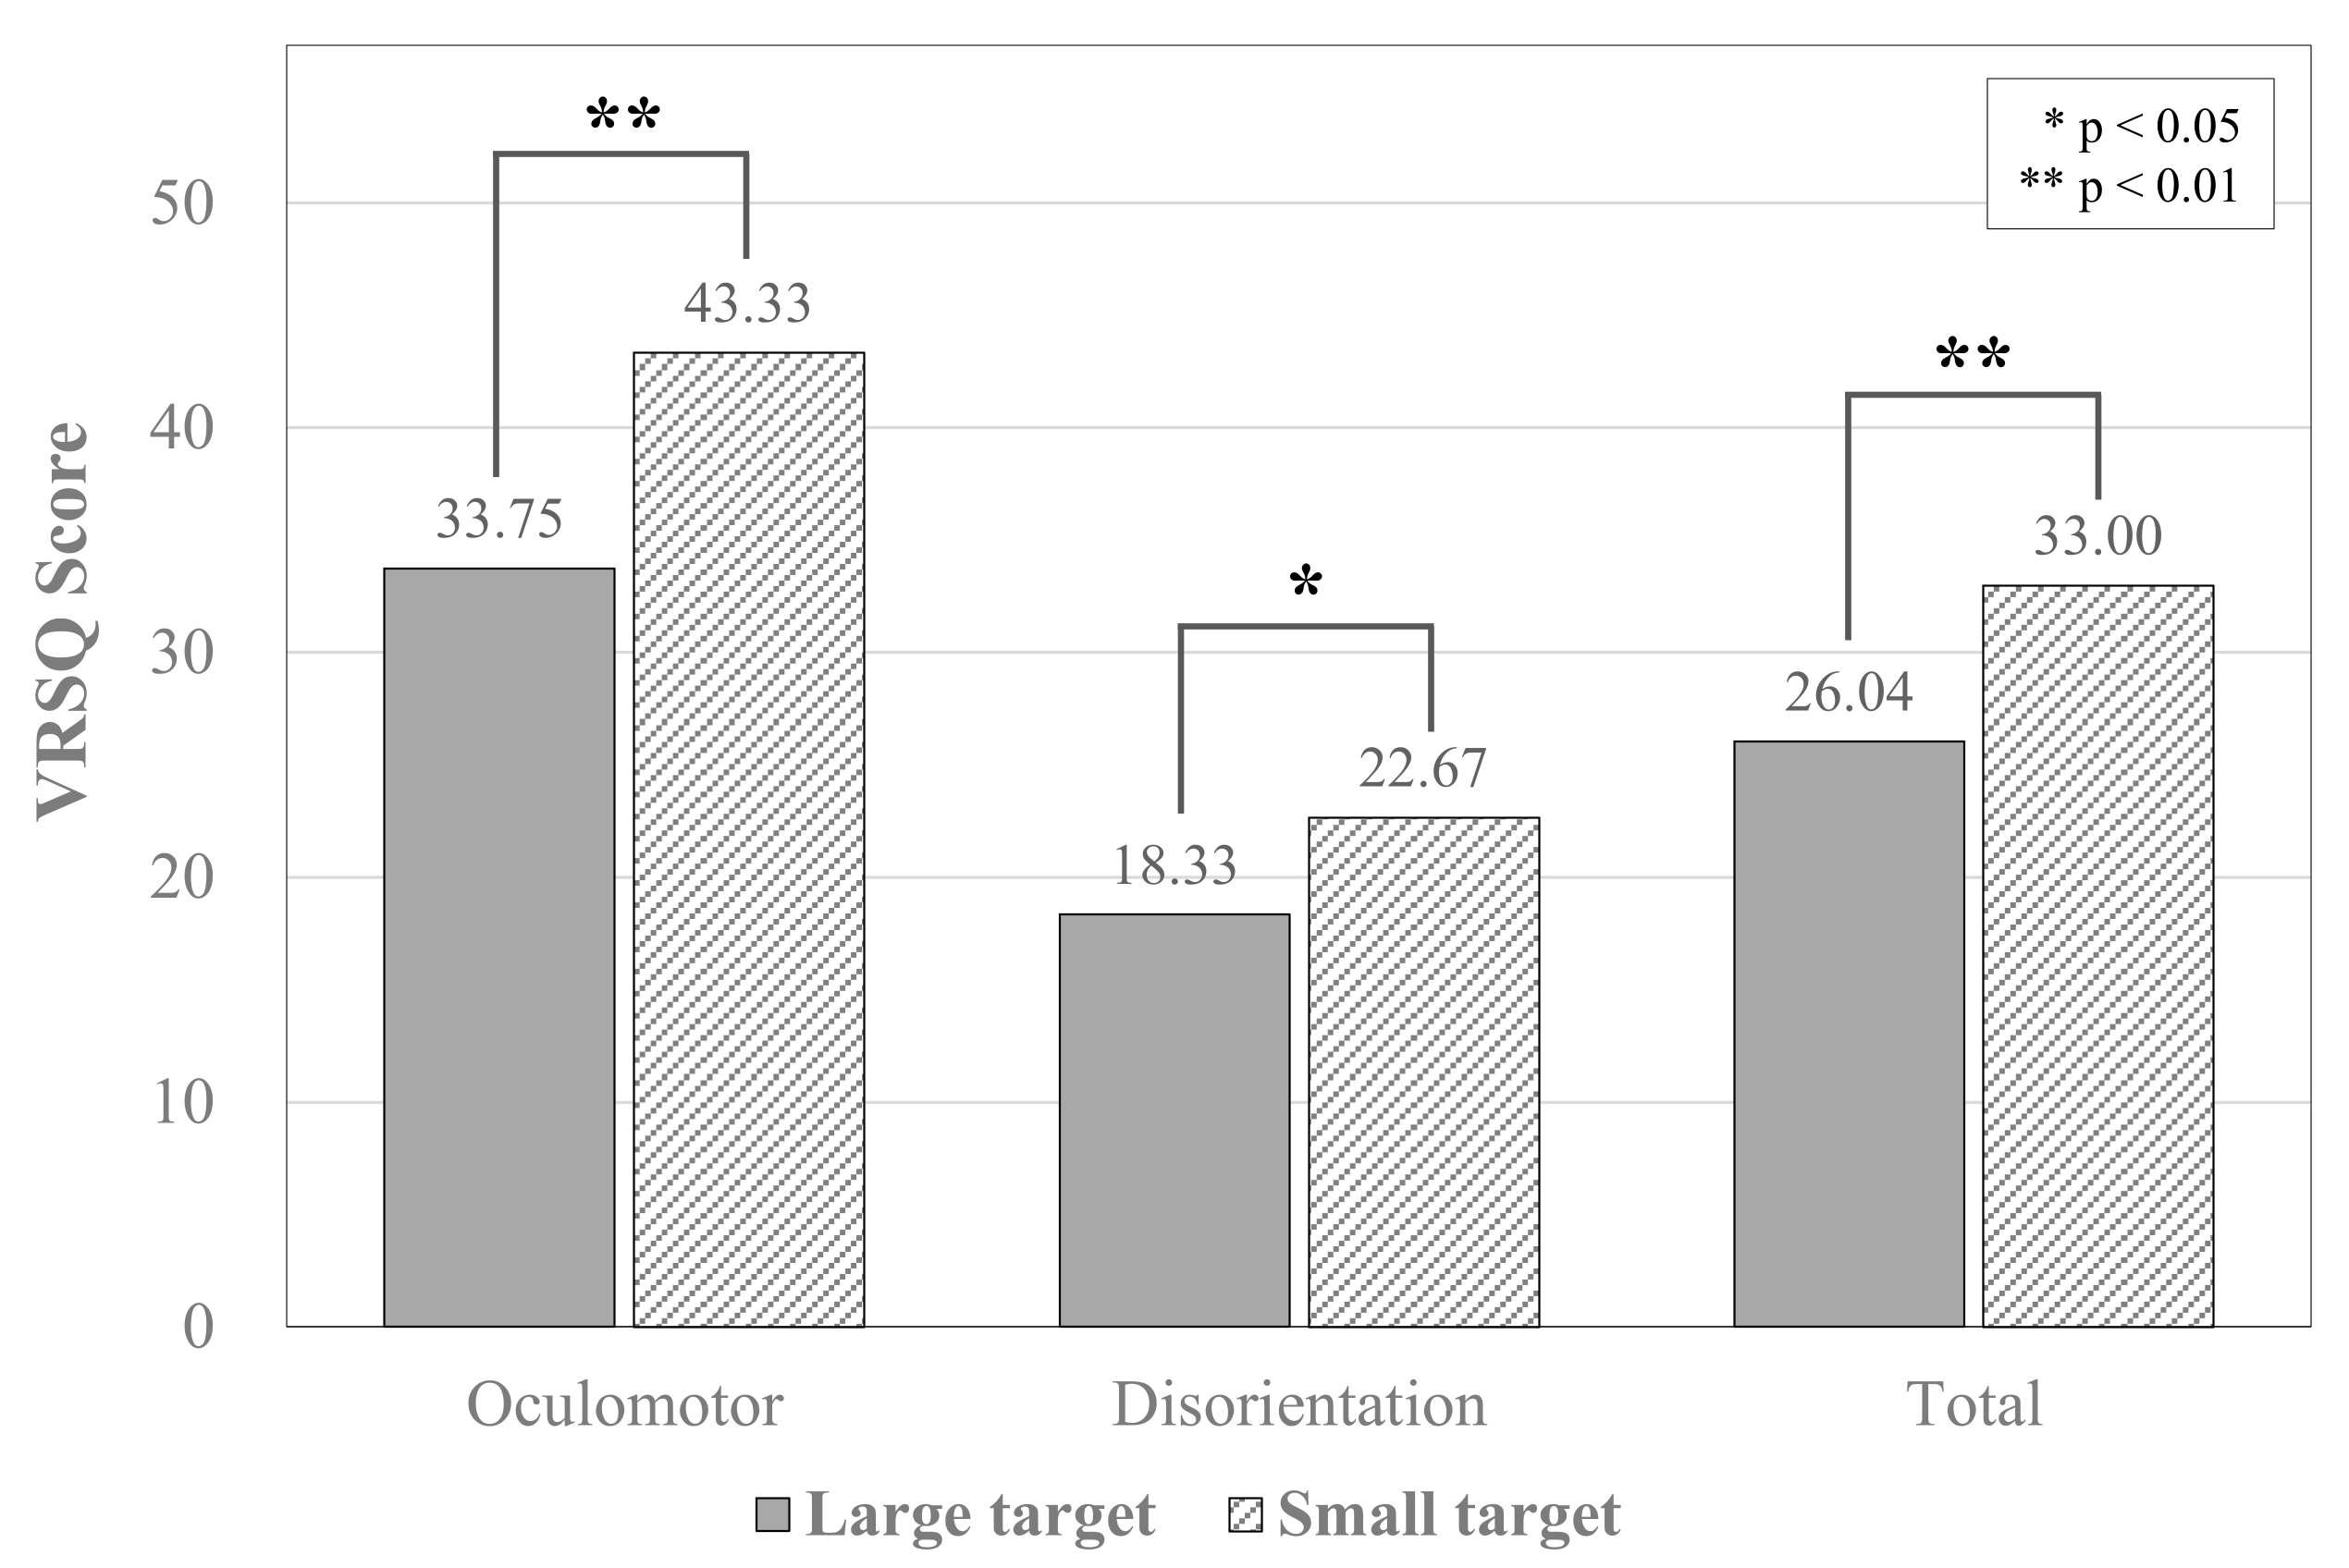
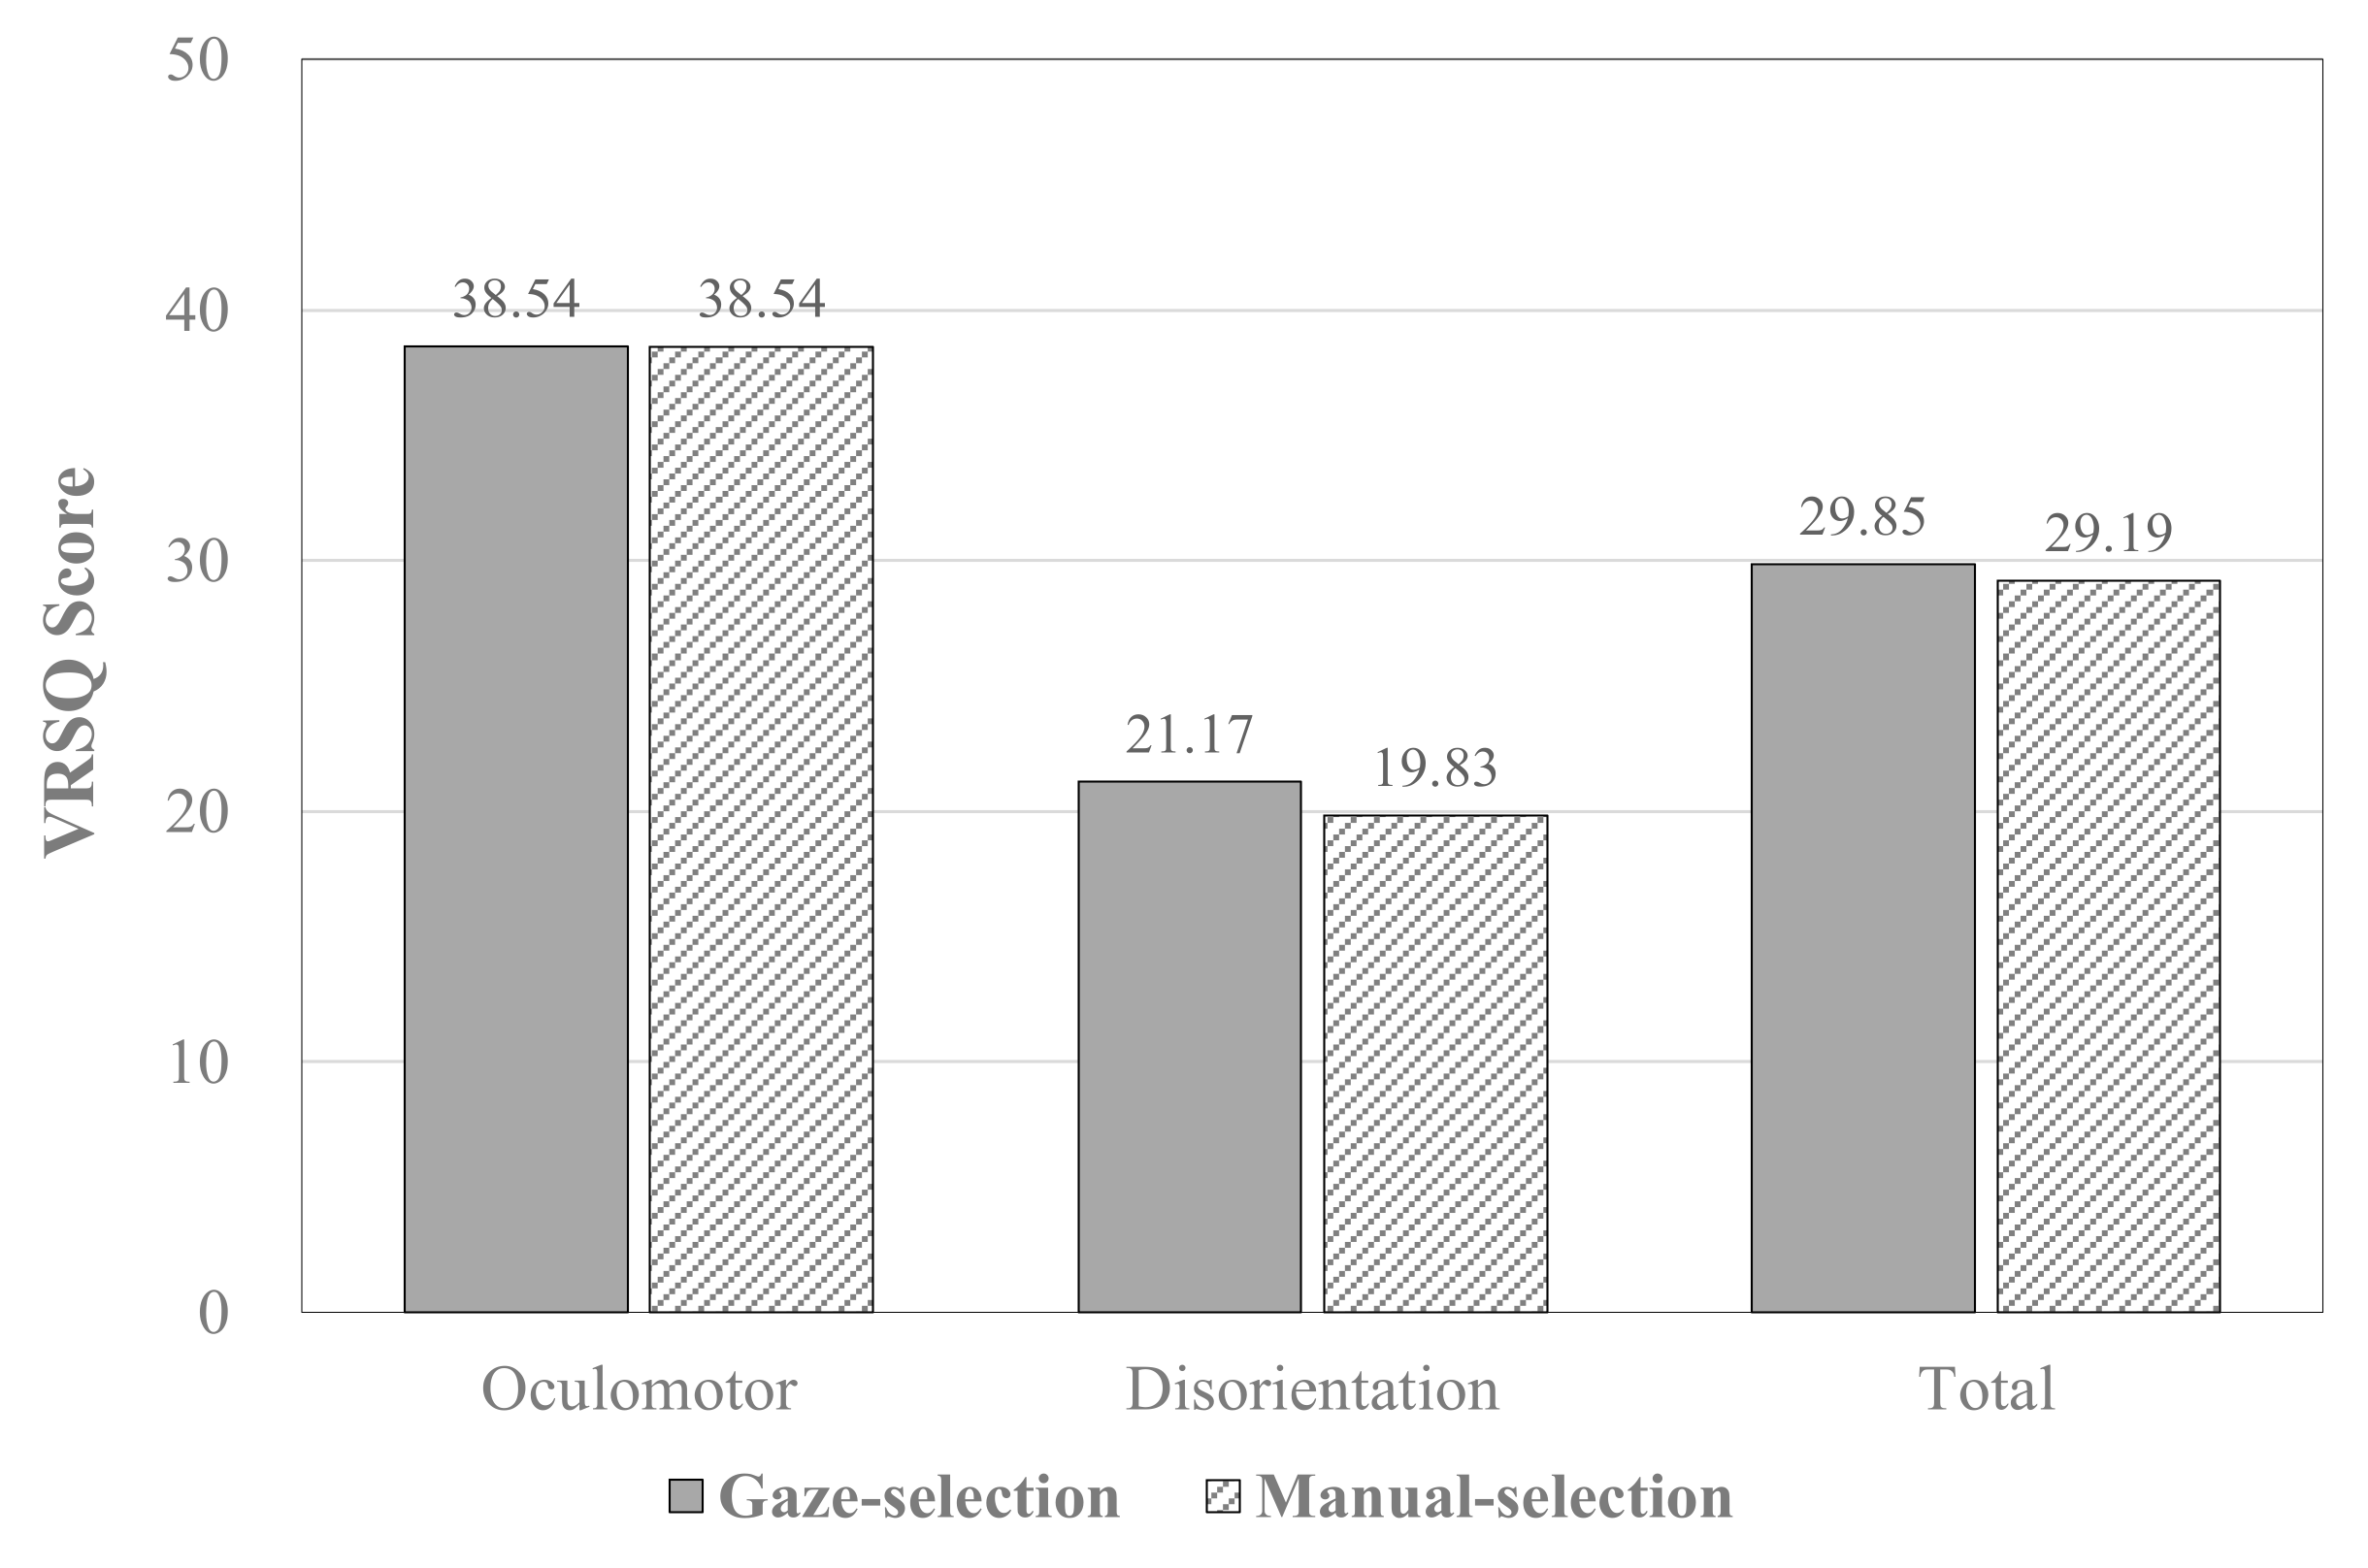
4.4. Virtual Reality Sickness

We measured the motion sickness of the experiments performed in this study using the VSRQ. The oculomotor score was 38.54, and the disorientation score was 20.5. The total score was 29.52. For further analysis, ANOVA analysis of the VRSQ scores, per independent variables, was performed (α = 0.05). Thus, the difference according to the target size was analyzed as significant (oculomotor: p < 0.01; disorientation: p < 0.05; total: p < 0.01). Among the components of the VRSQ, the oculomotor was 33.75 points for the large target and 43.33 points for the small target. Disorientation was 18.33 points and 22.67 points, respectively. The total was 26.04 points and 33 points (Figure 10).
However, the difference in scores per the input method was not statistically significant (oculomotor: p = 1.000; disorientation: p = 0.468; total: p = 0.689) (Figure 11). Oculomotor was 38.54 points for both methods, the disorientation was 21.17 points for gaze selection, and 19.83 points for manual selection. The gaze-selection showed a score equal to or slightly higher than the manual selection, but no significant difference.

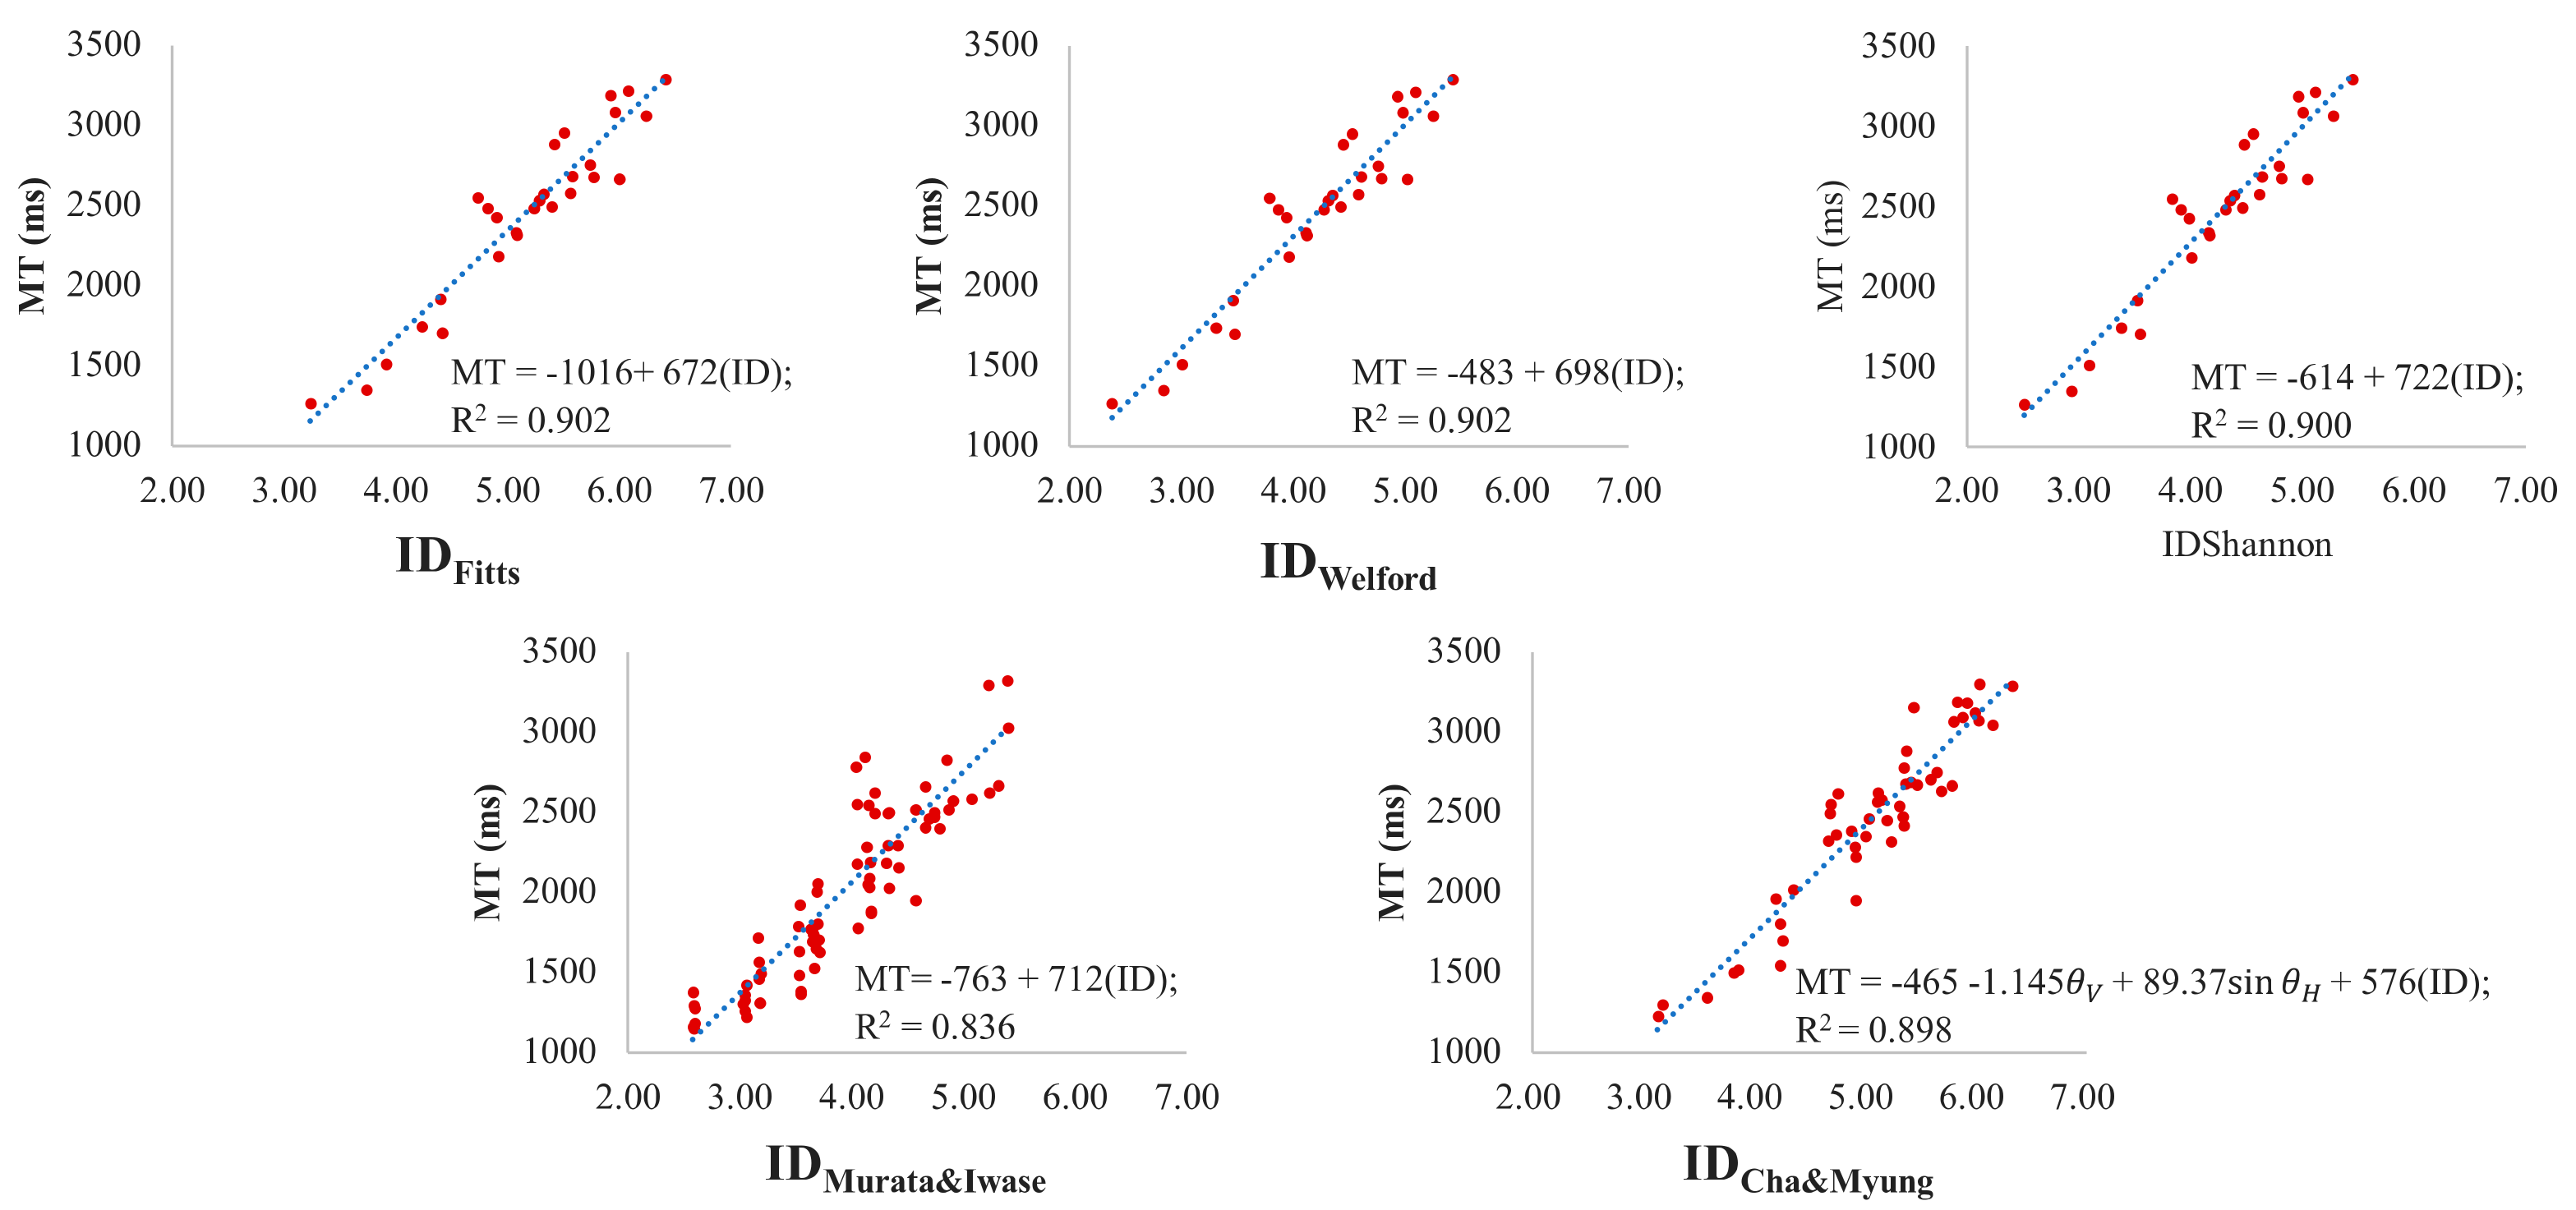
4.5. Application of Fitts’ Law

The correlation between the TCT and the index of difficulty can be analyzed using Fitts’ law. In order to calculate the ID, the distance (A) from the starting point to the target was substituted for the distance from the center of the current button to the center of the next button, and the size of the target (W) was substituted for the width of the button. Table 5 shows the average movement time according to the ID for each target selection method. Through this, a regression analysis was performed, and the results are shown in Table 6.
The result showed that the values of R2 were 0.71 in the gaze-selection method and 0.90 in the manual-selection method. Therefore, it turns out that Fitts’ law fits better when the target is selected by the manual-selection method.

5. Discussion

5.1. Factors Affecting the Task Performance

The size of the target was a major factor affecting the performance of tasks on other devices, such as mobile and touchpad [43,44,58]. In previous research, it was confirmed that the size of the target is a factor affecting the ER, and most research shows that the larger the target size, the faster the input task can be performed. In this study, we found a significant difference in task completion time between the two levels of target size. On the other hand, it is not a statistically significant factor in the ER, although more errors occurred when a small target was pressed. Therefore, if we extend the range of the target size further, it is expected that we can find the size of the target that can achieve minimum usability in terms of time and error.
The method of selecting the target also showed statistically significant results. The subjects could process tasks on average 500-ms faster than the gaze-selection when using manual-selection. Therefore, the manual-selection method was more advantageous for the content needing fast and continuous selection. However, the results in Figure 8 implies that the target selection task can be performed regardless of the size of the target in gaze selection, and the accuracy was affected more sensitively by the target size in the case of manual selection. It is noteworthy that, whereas the same operation was performed, the effect of the target size was small in the case of the gaze selection.
Both methods have a low error probability of less than 1%, but the target selection method has a statistically significant effect on the errors. The manual-selection method produced 9-times more errors than the gaze-selection method. As mentioned in Section 4.1, the manual-selection method had an advantage in terms of the task completion time. However, it was not in terms of accuracy. Factors such as hand trembling of participants and cursor deviation caused by head movement when pressing the touchpad may have affected the errors. Therefore, the gaze-selection method should be used in cases where accurate selection is required. Considering that most errors occurred in the gaze-selection method were wrongly selected the previous target without the subject noticing that the target had changed, it can be judged that the gaze-timing on the target may not be sufficient in certain situations or more clear feedback may be needed. These findings support the process of designing interfaces to perform accurate and fast tasks.

5.2. Influence of Target Position

The target position is also a factor that has a significant influence on the task completion time. Figure 8 shows that the time taken to select the targets close to the center was short and that the targets at the edges took much time. These results also seem to have affected the viewing angle. In this experiment, the FOV in which the targets were located was 127°, larger than the viewing angle provided by the HMD (96°). Therefore, not all targets were visible at once. However, targets located near the center were mostly exposed. It is therefore assumed that the centrally located targets were able to select relatively sooner than the target located at the edge. This is consistent with the results of other studies comparing the interaction between users and devices. Therefore, it is suggested that targets should be placed near the center when the input task requires quick selection in a virtual environment. For computer work using a mouse, because the edge of the screen is a boundary, pointing can be performed without finely adjusting the position of the pointer. However, the utility of the edge is relatively lower because all spaces can be utilized without a VR boundary.
In this study, it was found that the probability of choosing the wrong target was not related to the target’s position. When the user selected the button on the touchscreen by hand, most errors occurred when the button was located at the lower-right, and the fewest errors were found at the upper-left [59]. In the case of controlling the cursor via head tracking, it is expected that the target location may have less influence on the ER than when using the hand.

5.3. Application of Fitts’ Law

In this study, an experiment was performed to select a target continuously by wearing a head-tracking-type HMD. Therefore, we analyzed whether the data derived from this experiment conformed to Fitts’ law. To determine the best predictive power when the VR pointing task is applied to the formula reflecting the ID value dimension, the correlation of movement time per each ID value was analyzed. The target was a square shape with the same width and height. Therefore, the same results as with the Shannon formula by MacKenzie were obtained when the data were applied to the extended model proposed by Crossman [45], MacKenzie and Buxton [46], and Hoffman and Sheikh [47]. Additionally, the 3D extended formula proposed by Murata and Iwase [48] and Cha and Myung [49] included specific angles in the independent variables. Figure 12 shows the angles used for this study’s analysis.
Figure 13 shows the results of applying the data of this study to each model. Thus, the movement time can be estimated using the index of difficulty with relatively high reliability in all models. Consequently, the pointing task in the HMD also follows Fitts’ law. In addition, between the two 3D extended models, it was found that the model of Cha and Myung with two angular variables showed better predictive ability than Murata and Iwase’s model with one angular variable. Given that VR is a space representing three dimensions, the 3D extended model was expected to predict movement time more accurately. However, the lower-dimensional formulas showed better predictive power. Thus, it was found that the movement time of the pointing task of VR in a 3D environment was well explained by a 1D formula. VR provides a 3D visual environment but differs from the actual 3D work environment because it does not move to select objects far from the user. An input task in a VR can be performed by a 2-dimensional (2D) motion, which moves the cursor up, down, left, and right. The characteristics of such VR influenced these results.

5.4. Measuring VR Sickness through VRSQ

For both VRSQ component scores, there was more severe VR sickness when choosing a small target compared to selecting a large target (Figure 10). In all experimental conditions, the VRSQ score was higher when the experiments performed in this study were compared with Kim et al. [51]. The notable difference from this study is the magnitude of the viewing angle and the number of targets the subjects had to select in one experimental condition. Lin et al. [60] reported that FOV in VR was a factor affecting motion sickness. Additionally, the number of targets to be selected in this study was 2.5 times, and the distance between the targets increased because of the wide viewing angle. It thus took longer to carry out the experiment. Additionally, VR use time has been found to be a factor affecting VR sickness [4]. Therefore, it is considered that the time takes to carry out the continuous selection task by wearing the VR HMD also influenced this difference. Looking at another aspect, the number of repetitions of the task in this experiment was 25, which was more than that of the experiment performed by Kim et al. Therefore, the subjects may have felt more bored while conducting the experiment. It is expected that future experiments will determine whether the emotions felt while using virtual reality have also an effect on VR motion sickness.

6. Conclusions

In this study, we analyzed the effect of target position and task performance when a continuous target selection task was performed with a VR device. The experimental area was set larger than the maximum viewing angle represented by the VR HMD. The target size was divided into two levels. The target selection method consisted of the manual-selection method and the gaze-selection method. The results show that the effect of the target size on the task completion time was different according to the two selection methods. Additionally, the error rate was significantly higher at manual selection than at gaze selection, but it was analyzed that there was no effect by target size. The task completion time was different according to the target location, but it did not affect the error rate. Additionally, the degree of motion sickness was measured by the VRSQ to investigate the level of motion sickness during the target pointing task. It is considered that the extension of the viewing angle and the extended use time influenced motion sickness. Additional experiments are needed to clarify which factors are more influential because there were great differences when comparing the VRSQ scores of this study and Kim et al. [51].
As the research on virtual reality mainly focused on technology for commercialization, there were relatively few basic usability studies. Virtual reality also interacts with the user through the screen, but it is a platform that has distinguished characteristics than other devices with displays. Therefore, the results of this study are meaningful in that separate basic research is needed to reflect the unique characteristics of virtual reality. For example, virtual reality is visually expressed in three dimensions, but manipulation can be carried out in two dimensions, moving the head tracking-based cursor. These characteristics were once again confirmed by the fact that the data obtained from this study were better suited to the lower-dimensional Fitts’ law than the three-dimensional expansion formula. However, because the target width and height are the same, there is a limitation in that the result cannot be compared with the 2D Fitts’ law model reflecting the target area. We expect that the effects of size and shape of the target on the movement of the pointing task in the VR environment can be clarified by comparing the results obtained by experimenting with varying target distances or setting different widths and heights instead of squares or circles. Additionally, it is expected that the results of experiments can be compared by placing the targets at various distances and heights in order to reflect the characteristics of virtual reality further in future studies. Thus, it is possible to develop a new time prediction model by adding a variable that reflects the VR environment by searching for the relationship. Another limitation of this paper was that the recruited subjects were relatively young, so it was not possible to compare the results with the elderly. For example, there are research results showing that there is a statistically significant difference in the level of VR sickness by age group [61,62,63]. Considering that older people also use virtual reality technology for reasons such as treatment or education, it is necessary to analyze the results obtained from various age groups in the future.

Author Contributions

Conceptualization, software, data collection, analysis, and writing-original draft preparation M.C.; writing review and editing, supervision, and funding acquisition J.P.; writing review and editing, H.K.K. All authors have read and agreed to the published version of the manuscript.

Funding

This work was supported by Incheon National University Research Grant in 2021 (Grant No.: 20210226).

Institutional Review Board Statement

The study was conducted according to the guidelines of the Declaration of Helsinki, and approved by the Institutional Review Board of Incheon National University (IRB No. 7007971-201801-003-02).

Informed Consent Statement

Informed consent was obtained from all subjects involved in the study.

Data Availability Statement

The data presented in this study are available on request from the corresponding author.

Conflicts of Interest

The authors declare no conflict of interest.

References

  1. Porcino, T.M.; Clua, E.; Trevisan, D.; Vasconcelos, C.N.; Valente, L. Minimizing cyber sickness in head mounted display systems: Design guidelines and applications. In Proceedings of the 2017 IEEE 5th International Conference on Serious Games and Applications for Health (SeGAH), Perth, WA, Australia, 2–4 April 2017; pp. 1–6. [Google Scholar]
  2. Waltemate, T.; Senna, I.; Hülsmann, F.; Rohde, M.; Kopp, S.; Ernst, M.; Botsch, M. The impact of latency on perceptual judgments and motor performance in closed-loop interaction in virtual reality. In Proceedings of the 22nd ACM Conference on Virtual Reality Software and Technology, Munich, Germany, 2–4 November 2016; pp. 27–35. [Google Scholar]
  3. Cevette, M.; Stepanek, J.; Galea, A. Galvanic Vestibular Stimulation System and Method of Use for Simulation, Directional Cueing, and Alleviating Motion-Related Sickness. Google Patent 8,718,796, 6 May 2014. [Google Scholar]
  4. Ruddle, R.A. The effect of environment characteristics and user interaction on levels of virtual environment sickness. In Proceedings of the IEEE Virtual Reality 2004, Chicago, IL, USA, 27–31 March 2004; pp. 141–285. [Google Scholar]
  5. Groen, E.L.; Bos, J.E. Simulator sickness depends on frequency of the simulator motion mismatch: An observation. Presence 2008, 17, 584–593. [Google Scholar] [CrossRef]
  6. Lu, D. Virtual Reality Sickness during Immersion: An Investigation of Potential Obstacles towards General Accessibility of VR Technology. Master’s Thesis, Uppsala University, Uppsala, Sweeden, 2016. [Google Scholar]
  7. Marks, S.; Estevez, J.E.; Connor, A.M. Towards the Holodeck: Fully immersive virtual reality visualisation of scientific and engineering data. In Proceedings of the 29th International Conference on Image and Vision Computing New Zealand, Hamilton, New Zealand, 19–21 November 2014; pp. 42–47. [Google Scholar]
  8. Hou, X.; Lu, Y.; Dey, S. Wireless VR/AR with edge/cloud computing. In Proceedings of the 2017 26th International Conference on Computer Communication and Networks (ICCCN), Vancouver, BC, Canada, 31 July–3 August 2017; pp. 1–8. [Google Scholar]
  9. Wagner, D. Motion-to-Photon Latency in Mobile AR and VR. Available online: https://medium.com/@DAQRI/motion-to-photon-latency-in-mobile-ar-and-vr-99f82c480926 (accessed on 13 October 2021).
  10. Kundu, R.K.; Rahman, A.; Paul, S. A Study on Sensor System Latency in VR Motion Sickness. J. Sens. Actuator Netw. 2021, 10, 53. [Google Scholar] [CrossRef]
  11. Blum, T.; Wieczorek, M.; Aichert, A.; Tibrewal, R.; Navab, N. The effect of out-of-focus blur on visual discomfort when using stereo displays. In Proceedings of the 2010 IEEE International Symposium on Mixed and Augmented Reality, Seoul, Korea, 13–16 October 2010; pp. 13–17. [Google Scholar]
  12. Carnegie, K.; Rhee, T. Reducing visual discomfort with HMDs using dynamic depth of field. IEEE Comput. Graph. Appl. 2015, 35, 34–41. [Google Scholar] [CrossRef]
  13. Fernandes, A.S.; Feiner, S.K. Combating VR sickness through subtle dynamic field-of-view modification. In Proceedings of the 2016 IEEE Symposium on 3D User Interfaces (3DUI), Greenville, SC, USA, 19–20 March 2016; pp. 201–210. [Google Scholar]
  14. Wienrich, C.; Weidner, C.K.; Schatto, C.; Obremski, D.; Israel, J.H. A virtual nose as a rest-frame-the impact on simulator sickness and game experience. In Proceedings of the 2018 10th International Conference on Virtual Worlds and Games for Serious Applications (VS-Games), Würzburger, BY, Germany, 5–7 September 2018; pp. 1–8. [Google Scholar]
  15. Buhler, H.; Misztal, S.; Schild, J. Reducing vr sickness through peripheral visual effects. In Proceedings of the 2018 IEEE Conference on Virtual Reality and 3D User Interfaces (VR), Tuebingen/Reutlingen, Germany, 18–22 March 2018; pp. 517–519. [Google Scholar]
  16. Whittinghill, D.M.; Ziegler, B.; Case, T.; Moore, B. Nasum virtualis: A simple technique for reducing simulator sickness. In Proceedings of the Games Developers Conference (GDC), San Francisco, CA, USA, 2–6 March 2015. [Google Scholar]
  17. Won, J.-H.; Kim, Y.S. A Study on Visually Induced VR Reduction Method for Virtual Reality Sickness. Appl. Sci. 2021, 11, 6339. [Google Scholar] [CrossRef]
  18. Kim, J.-Y.; Son, J.-B.; Leem, H.-S.; Lee, S.-H. Psychophysiological alteration after virtual reality experiences using smartphone-assisted head mount displays: An EEG-based source localization study. Appl. Sci. 2019, 9, 2501. [Google Scholar] [CrossRef] [Green Version]
  19. Grassini, S.; Laumann, K.; Luzi, A.K. Association of Individual Factors with Simulator Sickness and Sense of Presence in Virtual Reality mediated by head-mounted displays (HMDs). Multimodal Technol. Interact. 2021, 5, 7. [Google Scholar] [CrossRef]
  20. So, R.H.; Griffin, M.J. Effects of a target movement direction cue on head-tracking performance. Ergonomics 2000, 43, 360–376. [Google Scholar] [CrossRef] [PubMed]
  21. Jagacinski, R.J.; Monk, D.L. Fitts’ Law in Two dimensions with hand and head movements movements. J. Mot. Behav. 1985, 17, 77–95. [Google Scholar] [CrossRef] [PubMed]
  22. Borah, J. Investigation of Eye and Head Controlled Cursor Positioning Techniques; Applied Science Labs: Bedford, MA, USA, 1 September 1995. [Google Scholar]
  23. Johnsgard, T. Fitts’ Law with a virtual reality glove and a mouse: Effects of gain. In Proceedings of the Graphics Interface, Canadian Information Processing Society, Banff, Alberta, Canada, 18–20 May 1994; pp. 8–15. [Google Scholar]
  24. Chen, J.; Or, C. Assessing the use of immersive virtual reality, mouse and touchscreen in pointing and dragging-and-dropping tasks among young, middle-aged and older adults. Appl. Ergon. 2017, 65, 437–448. [Google Scholar] [CrossRef]
  25. D’Errico, F.; Leone, G.; Schmid, M.; D’Anna, C. Prosocial virtual reality, empathy, and EEG measures: A pilot study aimed at monitoring emotional processes in intergroup helping behaviors. Appl. Sci. 2020, 10, 1196. [Google Scholar] [CrossRef] [Green Version]
  26. Baños, R.M.; Botella, C.; Rubió, I.; Quero, S.; García-Palacios, A.; Alcañiz, M. Presence and emotions in virtual environments: The influence of stereoscopy. Cyber Psychol. Behav. 2008, 11, 1–8. [Google Scholar] [CrossRef]
  27. Diemer, J.; Alpers, G.W.; Peperkorn, H.M.; Shiban, Y.; Mühlberger, A. The impact of perception and presence on emotional reactions: A review of research in virtual reality. Front. Psychol. 2015, 6, 26. [Google Scholar] [CrossRef] [PubMed] [Green Version]
  28. Cournia, N.; Smith, J.D.; Duchowski, A.T. Gaze-vs. hand-based pointing in virtual environments. In Proceedings of the CHI’03 Extended Abstracts on Human Factors in Computing Systems, Ft. Lauderdale, FL, USA, 5–10 April 2003; pp. 772–773. [Google Scholar]
  29. Piumsomboon, T.; Lee, G.; Lindeman, R.W.; Billinghurst, M. Exploring natural eye-gaze-based interaction for immersive virtual reality. In Proceedings of the 2017 IEEE Symposium on 3D User Interfaces (3DUI), Los Angeles, CA, USA, 18–19 March 2017; pp. 36–39. [Google Scholar]
  30. Lyons, D.M. System and Method for Permitting Three-Dimensional Navigation through a Virtual Reality Environment Using Camera-Based Gesture Inputs. Google Patents 6,181,343, 30 January 2001. [Google Scholar]
  31. Saenz-de-Urturi, Z.; Garcia-Zapirain Soto, B. Kinect-based virtual game for the elderly that detects incorrect body postures in real time. Sensors 2016, 16, 704. [Google Scholar] [CrossRef] [PubMed] [Green Version]
  32. Kim, S.; Kim, G.J. Using keyboards with head mounted displays. In Proceedings of the 2004 ACM SIGGRAPH International Conference on Virtual Reality Continuum and Its Applications in Industry, Singapore, 16–18 June 2004; pp. 336–343. [Google Scholar]
  33. Scheggi, S.; Meli, L.; Pacchierotti, C.; Prattichizzo, D. Touch the virtual reality: Using the leap motion controller for hand tracking and wearable tactile devices for immersive haptic rendering. In Proceedings of the ACM SIGGRAPH 2015 Posters, Los Angeles, CA, USA, 9–13 August 2015; p. 1. [Google Scholar]
  34. Khademi, M.; Mousavi Hondori, H.; McKenzie, A.; Dodakian, L.; Lopes, C.V.; Cramer, S.C. Free-hand interaction with leap motion controller for stroke rehabilitation. In Proceedings of the CHI’14 Extended Abstracts on Human Factors in Computing Systems, Toronto, ON, Canada, 26 April–1 May 2014; pp. 1663–1668. [Google Scholar]
  35. Sidorakis, N.; Koulieris, G.A.; Mania, K. Binocular eye-tracking for the control of a 3D immersive multimedia user interface. In Proceedings of the 2015 IEEE 1St workshop on everyday virtual reality (WEVR), Arles, Bouches-du-Rhône, France, 23 March 2015; pp. 15–18. [Google Scholar]
  36. Fitts, P.M. The information capacity of the human motor system in controlling the amplitude of movement. J. Exp. Psychol. 1954, 47, 381. [Google Scholar] [CrossRef] [PubMed] [Green Version]
  37. Welford, A.T. Fundamentals of Skill; Methuen & Co Ltd.: London, UK, 1968. [Google Scholar]
  38. MacKenzie, I.S. Fitts’ law as a research and design tool in human-computer interaction. Hum. Comput. Interact. 1992, 7, 91–139. [Google Scholar] [CrossRef]
  39. Card, S.K.; English, W.K.; Burr, B.J. Evaluation of mouse, rate-controlled isometric joystick, step keys, and text keys for text selection on a CRT. Ergonomics 1978, 21, 601–613. [Google Scholar] [CrossRef]
  40. Epps, B.W. Comparison of six cursor control devices based on Fitts’ law models. In Proceedings of the Human Factors Society Annual Meeting; SAGE Publications: Los Angeles, CA, USA, 1986; pp. 327–331. [Google Scholar]
  41. Poupyrev, I.; Okabe, M.; Maruyama, S. Haptic feedback for pen computing: Directions and strategies. In Proceedings of the CHI’04 Extended Abstracts on Human Factors in Computing Systems, Vienna, Austria, 24–29 April 2004; pp. 1309–1312. [Google Scholar]
  42. Colle, H.A.; Hiszem, K.J. Standing at a kiosk: Effects of key size and spacing on touch screen numeric keypad performance and user preference. Ergonomics 2004, 47, 1406–1423. [Google Scholar] [CrossRef]
  43. Parhi, P.; Karlson, A.K.; Bederson, B.B. Target size study for one-handed thumb use on small touchscreen devices. In Proceedings of the 8th Conference on Human-Computer Interaction with Mobile Devices and Services, Helsinki, Finland, 12–15 September 2006; pp. 203–210. [Google Scholar]
  44. Park, Y.S.; Han, S.H. Touch key design for one-handed thumb interaction with a mobile phone: Effects of touch key size and touch key location. Int. J. Ind. Ergon. 2010, 40, 68–76. [Google Scholar] [CrossRef]
  45. Crossman, E.R. The Measurement of Perceptual Load in Manual Operations. University of Birmingham: Birmingham, UK, 1956. [Google Scholar]
  46. MacKenzie, I.S.; Buxton, W. Extending Fitts’ law to two-dimensional tasks. In Proceedings of the SIGCHI Conference on Human Factors in Computing Systems, Monterey, CA, USA, 3–7 May 1992; pp. 219–226. [Google Scholar]
  47. Hoffmann, E.R.; Sheikh, I.H. Effect of varying target height in a Fitts’ movement task. Ergonomics 1994, 37, 1071–1088. [Google Scholar] [CrossRef]
  48. Murata, A.; Iwase, H. Extending Fitts’ law to a three-dimensional pointing task. Hum. Mov. Sci. 2001, 20, 791–805. [Google Scholar] [CrossRef] [Green Version]
  49. Cha, Y.; Myung, R. Extended Fitts’ law for 3D pointing tasks using 3D target arrangements. Int. J. Ind. Ergon. 2013, 43, 350–355. [Google Scholar] [CrossRef]
  50. Kennedy, R.S.; Lane, N.E.; Berbaum, K.S.; Lilienthal, M.G. Simulator sickness questionnaire: An enhanced method for quantifying simulator sickness. Int. J. Aviat. Psychol. 1993, 3, 203–220. [Google Scholar] [CrossRef]
  51. Kim, H.K.; Park, J.; Choi, Y.; Choe, M. Virtual reality sickness questionnaire (VRSQ): Motion sickness measurement index in a virtual reality environment. Appl. Ergon. 2018, 69, 66–73. [Google Scholar] [CrossRef]
  52. Plechatá, A.; Sahula, V.; Fayette, D.; Fajnerová, I. Age-related differences with immersive and non-immersive virtual reality in memory assessment. Front. Psychol. 2019, 10, 1330. [Google Scholar] [CrossRef]
  53. Gough, C. VR and AR Ownership and Purchase Intent among U.S. Consumers 2017, by Age. Available online: https://www.statista.com/statistics/740760/vr-ar-ownership-usa-age/ (accessed on 13 October 2021).
  54. Bababekova, Y.; Rosenfield, M.; Hue, J.E.; Huang, R.R. Font size and viewing distance of handheld smart phones. Optom. Vis. Sci. 2011, 88, 795–797. [Google Scholar] [CrossRef] [Green Version]
  55. Sesto, M.E.; Irwin, C.B.; Chen, K.B.; Chourasia, A.O.; Wiegmann, D.A. Effect of touch screen button size and spacing on touch characteristics of users with and without disabilities. Hum. Factors 2012, 54, 425–436. [Google Scholar] [CrossRef]
  56. Shin, H.; Lim, J.M.; Lee, J.U.; Lee, G.; Kyung, K.U. Effect of tactile feedback for button GUI on mobile touch devices. ETRI J. 2014, 36, 979–987. [Google Scholar] [CrossRef] [Green Version]
  57. Choe, M.; Choi, Y.; Park, J.; Kim, H.K. Comparison of gaze cursor input methods for virtual reality devices. Int. J. Hum. Comput. Interact. 2019, 35, 620–629. [Google Scholar] [CrossRef]
  58. Kim, H.K.; Park, J.; Park, K.; Choe, M. Analyzing thumb interaction on mobile touchpad devices. Int. J. Ind. Ergon. 2018, 67, 201–209. [Google Scholar] [CrossRef]
  59. Kim, H.K.; Choe, M.; Choi, Y.; Park, J. Does the Hand Anthropometric Dimension Influence Touch Interaction? J. Comput. Inf. Syst. 2019, 59, 85–96. [Google Scholar] [CrossRef]
  60. Lin, J.-W.; Duh, H.B.-L.; Parker, D.E.; Abi-Rached, H.; Furness, T.A. Effects of field of view on presence, enjoyment, memory, and simulator sickness in a virtual environment. In Proceedings of the IEEE Virtual Reality, Orlando, FL, USA, 24–28 March 2002; pp. 164–171. [Google Scholar]
  61. Saredakis, D.; Szpak, A.; Birckhead, B.; Keage, H.A.; Rizzo, A.; Loetscher, T. Factors associated with virtual reality sickness in head-mounted displays: A systematic review and meta-analysis. Front. Hum. Neurosci. 2020, 14, 96. [Google Scholar] [CrossRef] [PubMed] [Green Version]
  62. Hakkinen, J.; Vuori, T.; Paakka, M. Postural stability and sickness symptoms after HMD use. In Proceedings of the IEEE International Conference on Systems, Man and Cybernetics, Yasmine Hammamet, Tunisia, 6–9 October 2002; pp. 147–152. [Google Scholar]
  63. Arns, L.L.; Cerney, M.M. The relationship between age and incidence of cybersickness among immersive environment users. In Proceedings of the IEEE Proceedings. VR 2005. Virtual Reality, Bonn, North Rhine-Westphalia, Germany, 12–16 March 2005; pp. 267–268. [Google Scholar]
Figure 1. Smartphone-based virtual reality device.
Applsci 11 09846 g001
Figure 2. The process of converting the length of the target into an angle.
Applsci 11 09846 g002
Figure 3. Example of the experimental area. In (a) left panel: large target size; In (a) right panel: small target size; In (b): a screen that a subject actually sees with VR HMD.
Applsci 11 09846 g003
Figure 4. The touchpad of virtual reality headset.
Applsci 11 09846 g004
Figure 5. Sequence of target selection.
Applsci 11 09846 g005
Figure 6. Mean task completion time for each condition. (Circles show no statistically significant difference, and the y-axis does not start at zero).
Applsci 11 09846 g006
Figure 7. Task completion time for target location. (Different letters indicate statistically significant differences, Error bars refer to standard deviation).
Applsci 11 09846 g007
Figure 8. The distribution of mean task completion time for each condition: (a) large target size; (b) small target size; (c) manual-selection method; (d) gaze-selection method; (e) all conditions.
Applsci 11 09846 g008
Figure 9. The distribution of mean error rate for each condition: (a) large target size; (b) small target size; (c) manual-selection method; (d) gaze-selection method.
Applsci 11 09846 g009
Figure 10. VRSQ scores for target size.
Applsci 11 09846 g010
Figure 11. VRSQ scores for selection method.
Applsci 11 09846 g011
Figure 12. Angles used as independent variables of the regression.
Applsci 11 09846 g012
Figure 13. Correlations between index of difficulty (ID) and movement time (MT) in each model.
Applsci 11 09846 g013
Table 1. Index of Difficulty of Fitts’ law and extended models.
ModelIndex of Difficulty
Fitts et al. [36] log 2   2 A W  
Welford [37] log 2   A W + 0.5  
MacKenzie [38] log 2   A W + 1  
Crossman [45] log 2 A W + 1 + log 2 A H + 1
MacKenzie and Buxton [46] log 2 2 A min W , H + 1
Hoffman and Sheikh [47] log 2 A min W , H + 1
Murata and Iwase [48] log 2   A W + 1   + c sin θ
Cha and Myung [49] log 2   2 D W + F  
Table 2. Virtual Reality Sickness Questionnaire (VRSQ) and computation of VRSQ score.
VRSQ SymptomOculomotorDisorientation
General discomfortO
FatigueO
EyestrainO
Difficulty focusingO
Headache O
Fullness of head O
Blurred vision O
Dizzy (eyes closed) O
Vertigo O
Total[1][2]
ScoreOculomotor = ([1]/12) × 100
Disorientation = ([2]/15) × 100
Total Score = (Oculomotor score + Disorientation score)/2
Table 3. The task completion time and standard deviation according to the target size and selection method. (unit: ms).
Large SizeSmall SizeTotal
Manual selection1948 (±859)2316 (±997)2132 (±944)
Gaze selection2697 (±919)2719 (±885)2708 (±902)
Total2322 (±961)2518 (±963)2420 (±967)
Table 4. The range of task completion time according to the size of the target and the input method. (unit: ms).
Fast-SpeedMedium-SpeedSlow-Speed
Target size
(A)
LargeUnder 2040From 2040 to 2560Over 2560
SmallUnder 2242From 2242 to 2765Over 2765
Input method
(B)
ManualUnder 1977From 1977 to 2465Over 2465
GazeUnder 2443From 2443 to 2987Over 2987
A × BUnder 2100From 2100 to 2700Over 2700
Table 5. Mean task completion time (unit: s) by the index of difficulty in each selection method.
Gaze-SelectionManual-Selection
IDTCTIDTCTIDTCTIDTCT
2.511.9654.393.3272.511.2674.392.572
2.942.2084.463.3292.941.3514.462.496
3.101.9064.483.3173.101.5124.482.888
3.382.3564.563.2523.381.7444.562.955
3.532.5994.623.2883.531.9164.622.578
3.552.1404.643.1283.551.7054.642.688
3.843.2524.793.5073.842.5524.792.755
3.923.2224.823.1093.922.4834.822.678
3.993.0654.963.4453.992.4304.963.189
4.012.4665.013.2304.012.1855.013.088
4.162.7615.053.2264.162.3365.052.671
4.173.0845.123.4234.172.3205.123.218
4.313.5085.283.3724.312.4845.283.065
4.353.4125.453.4124.352.5385.453.292
Table 6. Regression analysis between the index of difficulty and task completion time.
.R2Fdf1df2p-Value a   β 0 b   β 1
Gaze-selection0.7164.493126<0.0000.5630.574
Manual-selection0.90234.270126<0.000−0.6140.722
Publisher’s Note: MDPI stays neutral with regard to jurisdictional claims in published maps and institutional affiliations.

