Article

Statistical Modeling of Cultural Differences in Adopting Autonomous Vehicles

Division of Industrial Management Engineering, Korea University, 145, Anam-ro, Seongbuk-gu, Seoul 02841, Korea
*
Author to whom correspondence should be addressed.
Appl. Sci. 2021, 11(19), 9030; https://doi.org/10.3390/app11199030
Submission received: 20 July 2021 / Revised: 7 September 2021 / Accepted: 23 September 2021 / Published: 28 September 2021
(This article belongs to the Special Issue State-of-the-Art in Human Factors and Interaction Design)

Abstract

:
As autonomous driving technology develops, the advantages and disadvantages of autonomous vehicles emerge. In order for automated vehicles to find a place in society, public opinion and acceptance are important, and a number of studies about public opinion and acceptance are underway. In this paper, we investigated the relation between cross cultural differences and public opinion on automated vehicles. Through a literature review, public opinion in various countries, including China, India, Japan, the U.S., the U.K., and Australia, was collected. Through these data, the influence of cross cultural differences in public opinion was identified, and statistical models for predicting public opinion about autonomous vehicles were developed. In addition, the prediction models were validated through the results of the survey conducted in this paper. As a result, the influence of cross cultural differences on public opinion about automated vehicles was confirmed.

1. Introduction

Automobiles are an indispensable part of our lives. At the same time, the problems associated with automobiles, such as accidents, pollution, and traffic jams, are inevitable [1,2,3]. Almost all accidents are associated with human error [2,4]. Traffic congestion costs, such as pollution, fuel problems, and travel delays, are increasing. There is growing attention paid to autonomous vehicles (AVs) as a means of sustainable transport to mitigate the negative social, economic, and environmental impacts of automobiles.
In the last decade, autonomous driving technology has attracted much attention from technical, academic, and policy perspectives. In particular, there is a growing interest in not only autonomous private vehicles, but also various new modes of transportation, including shared autonomous vehicles and self-driving taxis. Acceptance and preference for each mode of transportation are actively being studied [5,6,7,8]. However, in the current COVID-19 pandemic, people prefer personal autonomous vehicles over other types of transportation because of sanitation and the reduced risk of contagion [9,10]. In the post COVID-19 era, the preference for autonomous private vehicles as a mode of transportation will continue. In this situation, research on autonomous private vehicles must be conducted more thoroughly.
Autonomous vehicles offer several benefits that can solve current societal and environmental mobility problems [10,11]. If autonomous vehicles become widespread, traffic congestion, traffic accidents, and environmental pollution will be reduced, which will also have additional economic effects. However, recent studies have mentioned the negative aspects of AVs [12,13]. To mitigate these negative impacts, it is necessary to investigate public opinion on autonomous driving as well as developing AV technology. By examining the public expectations and concerns about AVs, we can solve problems that may arise when autonomous driving is introduced, and establish policies and guidelines. In addition, if the public does not properly accept and use the technology, there is no reason for the development of this technology, and abuse and misuse may occur. Therefore, investigating public opinion on AVs is essential to maximize the expected effects and to reduce the negative impacts of AVs.
Many survey studies have been conducted on public opinion about autonomous driving and models that represent preferences for autonomous vehicles or willingness to pay based on these surveys have been developed [14,15,16,17,18,19,20,21,22,23,24,25,26,27,28,29,30,31,32]. Some of these studies [24,25,26,27,28,29,30,31,32] developed statistical models of willingness to pay or intention to use through demographic factors (age, gender, education level, income, etc.) and psychological factors (perceived usefulness, perceived ease of use, etc.). The results of these studies showed that people’s perceptions of autonomous vehicles differ from country to country. For example, Schoettle and Sivak [19] conducted an online survey in various countries, including the U.S., the U.K., China, Japan, India, and Australia. They collected various opinions about topics such as familiarity, concerns, and willingness to pay for autonomous vehicles in each country to explain the differences among countries. In addition, Kyriakidis et al. [17] conducted a survey in 109 countries and investigated public opinion. They showed that public opinion changes with GDP.
Although the public opinion on AVs differs from country to country, studies conducted in a single country cannot be directly compared with other studies because of the differences in questionnaires and scales. On the other hand, in studies including various countries, the differences in public opinion among countries were analyzed qualitatively, or statistically through variables such as GDP. In other words, these studies found cultural differences in public opinion but did not account for these results in terms of cultural differences.
Cross cultural differences are the main factors that influence the adoption or acceptance of new technologies and innovation [31,32,33,34,35,36,37,38]. Thus far, several frameworks have been developed to account for cross cultural differences [39,40,41,42,43,44]. Specifically, Hofstede’s 6-D model [39,40] has been widely adopted in research explaining cross cultural differences. In the 6-D model, the cultural characteristics of countries are described in six dimensions, including Power Distance, Individualism, Masculinity, Uncertainty Avoidance, Long-Term Orientation, and Indulgence. A detailed description of each dimension appears in Table 1. Hofstede’s 6-D model has been used in various fields to explain the influence of cultural differences on technological innovation [45,46,47,48,49,50,51,52,53,54]. In particular, Hofstede’s 6-D model was also used for the application of transportation technologies, such as fuel-efficient vehicles, electric cars, and hybrid cars [45,46,49]. However, there have been only a few studies considering the cultural differences in the public opinion of automated vehicles. In addition, studies examining public opinion on autonomous vehicles in several countries did not quantitatively analyze the effects of cultural differences [17,19,25,55]. Therefore, to facilitate adopting AVs, it is necessary to analyze the perception of AVs through the cultural dimension. This study will confirm the relationship between AVs and cultural differences through the 6-D model because of its generality.
In summary, this paper aims to determine how cultural differences affect the adoption of AVs. Autonomous driving technology is not yet fully developed, and, in addition to the technology, policy development and infrastructure are needed to adopt AVs. To do this, identifying public opinion is essential, but public preferences change over time [29]. Investigating public opinion whenever it changes is inefficient in terms of time and cost. Therefore, it is important to predict public opinion through related factors. In this paper, first, we collected literature that investigated public opinion across nations. In particular, public opinion was identified through concerns about AVs and willingness to pay for them (WTP). As people are more sensitive to loss than gain, the concerns about AVs were identified more preferentially [56], and WTP was also identified to determine if people actually intended to use AVs. Then, we confirmed the correlation between public opinion and each dimension of the 6-D model based on the collected literature, and developed a model to predict public opinion about AVs. Finally, the developed model was evaluated through whether the questionnaires conducted in South Korea could accurately predict public opinion on self-driving cars, and whether the model could accurately predict public opinion about AVs.

2. Models for Public Opinion about AVs

2.1. Background

2.1.1. Public Opinion on AVs

To develop a statistical model for adapting AVs, we collected literature on public opinion, especially concerns about AVs and willingness to pay for them. Since the purpose of this paper is to investigate the influence of cultural differences, we first investigated the literature that was surveyed in various countries. A number of studies have confirmed public opinion through online surveys [14,15,16,18,20]. However, those papers were based on surveys conducted within a city or a country, and direct comparison was difficult because the scale and questions of the survey were different. In contrast, Kyriakidis et al. [17] and Schoettle and Sivak [19] were representative papers that surveyed drivers from various countries. These surveys contained various questions including “Concerns about AVs” and “Willingness to pay for AVs” (WTP). Concerns about AVs included safety, legal liability, security, and data privacy concerns. Furthermore, Willingness to pay indicated how much additional cost one was willing to pay for the purchase of an automated vehicle.
In Kyriakidis et al. [17], 5000 drivers from 109 countries responded to a questionnaire about public opinion on AVs. In particular, the authors examined cross national differences in public opinion. However, the differences were the result of economic differences among countries, and differences according to cultural values were not examined.
Next, Schoettle and Sivak [19] surveyed public opinion on AVs in China, India, Japan, the U.S., the U.K., and Australia. Respondents to the survey also responded to questions on concerns about AVs and WTP. Issues and degrees of concern differed from country to country. Willingness to pay for AVs was also different. Most respondents in China and India said they would pay extra money for AVs, while less than half of the respondents in the remaining countries said they would pay extra money. However, they did not provide an explanation of which factors caused the cross national differences.

2.1.2. Cultural Differences

Hofstede [39,40] defined culture as the collective programming of the mind that distinguishes the members of one group or category of people from others. There are a variety of individuals in each collective, and characteristics of individuals vary according to the cultural characteristics of each collective. There have been many attempts to explain cultural characteristics, and one of them is Hofstede’s 6-D model.
In the 6-D model, cultural differences are explained by six cultural dimensions: Power Distance, Individualism, Masculinity, Uncertainty Avoidance, Long-Term Orientation, and Indulgence. First, Power Distance (PDI) represents the degree to which less powerful members of a society accept the hierarchy or inequality in the society. In societies with high Power Distance, people are not hostile to inequality, and accept their place in the society. Second, Individualism (INDV) means the preference for a loosely knit social framework. People in individualistic cultures take care of themselves, while people in collectivistic cultures care more about the group than the individual. Third, Masculinity (MAS) represents the degree to which the members of a society pursue achievement and competition. A masculine society prefers achievement, heroism, and assertiveness. Fourth, Uncertainty Avoidance (UAI) expresses the degree to which the members of a society feel comfortable in novel and unknown situations; countries with strong Uncertainty Avoidance are less tolerant of ambiguity. Fifth, Long-Term Orientation (LTO) is a dimension of the society’s position on traditions and norms. Societies with high Long-Term Orientation encourage thrift and efforts for the future. Lastly, Indulgence (INDU) refers to a society in which the basic and natural human desires related to enjoying life are satisfied freely.
Hofstede’s 6-D model has been used mainly to explain how cultural differences affect the introduction of IT innovation [40,41,42,43,44,45,52,53], and it has also been recently applied to transportation technology [50,51,54]. Ang et al. [50] studied whether the cultural dimension, especially individualism, is related to the adoption of fuel efficient vehicles. They determined that collectivists are more inclined to adopt fuel efficient vehicles, which are related to solving environmental problems, because they tend to help the group’s interests or goals. They confirmed that UAI and MAS mediate the relationship between green self-identity and attitude toward electric car adoption. Finally, McLeay et al. [54] stated that the higher the UAI, the slower the hybrid car adoption.

2.2. Hypotheses

As mentioned before, collectivists are more cooperative and emphasize the group’s goals. People in nations with a collectivistic nature are dependent on others and show high levels of conformity. In fact, in a collectivistic culture, positive attitudes toward the adoption of technologies that are beneficial to society have been confirmed [50,51,52,54]. Autonomous driving is a technology that governments are also interested in, and people tend to follow it in collectivistic cultures. Therefore, we propose the following hypothesis:
Hypothesis 1.
INDV has a negative correlation with concerns.
The degree to which enjoyment is pursued is related to INDU. People are more likely to be involved in leisure activities or sports in indulgent cultures. They are free to satisfy basic and natural human desires related to enjoying life. If innovation threatens these desires, they will be reluctant to adopt the innovation. In contrast, if innovation helps them pursue enjoyment of life, they will easily adopt it. Autonomous driving will allow drivers to engage in various nondriving related tasks instead of tedious driving [17,57]. Therefore:
Hypothesis 2.
INDU has a negative correlation with concerns and WTP.
PDI is a dimension that indicates how inequality is regarded. In low PDI cultures, inequality is unacceptable. In contrast, people in high PDI cultures accept inequality and tend to follow the opinions of powerful leaders. Thus, PDI and INDV will have opposite effects on the adoption and diffusion of innovation:
Hypothesis 3.
PDI has a positive correlation with concern.
Next, UAI is a value that indicates how much uncertainty is tolerated, and countries with high UAI feel discomfort with uncertainty. UAI will have a significant impact on technology adoption, as the benefits and disadvantages of using the novel technology are not yet clear. In cultures with high UAI, the adoption of novel technologies will be considered as uncertainty, and they will be reluctant to adopt them:
Hypothesis 4.
UAI has a positive correlation with concerns and WTP.
Masculine values such as assertiveness and competitiveness distinguish societies with high MAS, while feminine values, such as nurturing, cooperation, and quality of life, distinguish feminine societies. Feminine societies are more interested in societal and environmental problems [39,40,47]. Therefore, people in feminine countries will be more prone to having concerns about the issues caused by adopting technologies. In addition, adopting autonomous driving is likely to improve quality of life and solve environmental problems, which are stressed in feminine society:
Hypothesis 5.
MAS has a negative correlation with concerns and WTP.
High LTO means that the society values thrift and effort as ways to prepare for the future, whereas low LTO means that the society prefers to maintain traditions and norms. Cultures with high LTO take a more pragmatic approach and focus on future rewards [39,40,49]. Given the future benefits of adopting AVs, people in a long term oriented culture are likely to purchase AVs. In addition, people in a short term oriented culture are sensitive to social trends in consumption and want to purchase AVs because of their recent popularity [47]:
Hypothesis 6.
There is no relationship between LTO and WTP.

2.3. Methods

2.3.1. Data Collection

At first, we collected public opinion data including concerns about AVs and WTP from Schoettle and Sivak [19]. The data are shown in Table 2. In Table 2, the corresponding concern values indicate the proportion of respondents who reported moderate concern or higher, and the average value in concerns is the average of all concerns. The WTP value represents the percentage of respondents who were willing to pay extra to purchase an autonomous vehicle. Of all the concern items, China had the highest value, but in WTP, China showed the second highest value. On the other hand, in Japan and Australia, there were relatively few concerns about AVs, but it can be seen that the WTP value was low.
In addition to the public opinion data, data on cultural differences were extracted based on Hofstede’s 6-D model (www.hofstede-insights.com. Retrieved 10 March 2021). For the six countries included in the collected literature and South Korea, which was obtained through the survey in this paper, the scores of the six dimensions of cross cultural differences were confirmed, and they are shown in Figure 1. In Korea, UAI and LTO were high, while INDV, MAS, and INDU had low values.

2.3.2. Analyses

Data analyses were performed with SAS 9.4. The relationship between the dimensions in Hofstede’s 6-D model and the concerns about AVs and WTP was identified through Pearson’s correlation coefficient and regression model. First, correlation was determined between each cultural dimension and public opinion data. Correlation coefficients were calculated according to Equation (1).
ρ   ( x , y ) = C o v   ( x ,   y ) σ x σ y .
After correlation analysis, we developed statistical models of the relationship between public opinion and cultural dimensions through regression analysis. Dependent variables included in each model were selected through correlation analysis and hypotheses set based on the existing literature. The model of average concerns contains INDU, PDI, and UAI. INDV was excluded because INDV had a strong negative correlation with PDI and had exact opposite effect to PDI on concerns. The WTP model contains INDU, and MAS. UAI was excluded because there was no significant relationship between UAI and WTP.

2.4. Results

2.4.1. Correlation Analysis

Before developing a model according to cross cultural differences, the correlation between each dimension of the 6-D model and the values in the survey results was analyzed. The results of the correlation analysis are shown in Table 3, and an asterisk means there was a significant correlation. Compared to the dimensions of cross cultural differences, PDI and LTO had positive correlations with concerns and WTP, while INDV, MAS, UAI, and INDU had negative correlations. Average concern and PDI had a significant positive correlation. It was found that the larger the PDI, the higher the average concern. However, there was not a significant correlation between UAI and concerns. WTP had a significant positive correlation with PDI, but showed a significant negative correlation with INDV, MAS, and INDU.

2.4.2. Regression Model

Regression models were developed with the survey data from the collected literature and the values of the dimensions in the 6-D model.
At first, the regression models for average concern about AVs were expressed as Equation (2). Countries with a higher PDI, lower UAI, and higher INDU had more concerns about AVs. The p-values of the variables included in the model were all less than 0.05, and the adjusted R-square was 0.9446, confirming that the model well represented the concern about AVs. Additionally, when the observed data from the survey and the value predicted by the regression model were compared through the paired t test, it was confirmed that the model could accurately predict the concern about AVs because there was no significant difference between the two groups (t(5) = 0.2629, p-value = 0.80).
Concern = 38.24 + 0.6097 × PDI − 0.1278 × UAI + 0.2340 × INDU.
Furthermore, the regression model for willingness to pay is shown in Equation (3). This showed that people in countries with lower MAS and INDU were more willing to pay extra for automated vehicles. The p-values of the variables included in the model were all less than 0.05, and the adjusted R-square was 0.9981, confirming that the model well represented willingness to pay for purchasing AVs. Additionally, when the observed data from the survey and the value predicted by the regression model were compared through the paired t test, it was confirmed that the model could accurately predict the WTP because there was no significant difference between the two groups (t(5) = −0.2451, p-value = 0.82).
WTP = −122.526 − 0.8241 × MAS − 0.6547 × INDU.

3. Online Survey in South Korea

3.1. Online Survey Design

To validate the statistical model, an online survey was conducted using www.moaform.com from 11 September to 1 December 2017. The survey was designed based on a survey conducted by Schoettle and Sivak [19]. The survey was distributed via SNS, email, and websites. The responses from participants who had a driving license were collected. The survey was divided into two main sections. First, demographic data and driving experience were collected; driving experience included driving frequency, mileage, and accidents. Next, the respondents answered questions about their attitudes toward automated driving. In this part, questions about the expected benefit of AVs, concerns about AVs, and willingness to pay for purchasing AVs were included in the survey.

3.2. Results of the Survey

3.2.1. Demographic Data

The questionnaire was answered by 287 participants. One participant who did not understand the instructions about the level of automation and two participants who did not have a driver’s license were excluded from the collected data; subsequently, data from 284 participants were analyzed. Of the participants, 68.5% were male, the mean age of the participants was 33.9 years, and the median was 27 years (max = 68, min = 20, SD = 14.3). Their driving experience was 10.43 years (SD = 10.52), and most of them had not experienced partially autonomous driving (61.5%) or known about autonomous driving (25.9%).

3.2.2. Concerns

In this survey, concerns about safety, legal liability, security, and data privacy violations were presented. Figure 2 shows the percentage of participants who said they were highly concerned about each item. For all items, over 60% of participants responded that they were concerned, moderately or higher, about the item (70.45, 80.55, 79.55, and 69.6% for safety, legal liability, security, and data privacy, respectively). In particular, respondents were most concerned about who would be liable for an accident caused by automated vehicles. On the other hand, it was found that there were relatively few worries about safety or data privacy violations.

3.2.3. Willingness to Pay

The survey asked how much more the respondents would be willing to pay for the automated driving system to be applied to a vehicle. The scale was set at KRW 5 million (approximately USD 4700) intervals. On average, we found that the participants were prepared to pay an additional amount of KRW 12.5 million (approximately USD 11,700) for a fully automated vehicle. A total of 17.8% of the respondents said they were not willing to pay additional costs even if a fully autonomous vehicle came out. This was significantly lower than those surveyed in other countries (up to 79.4 and at least 33.5%).

3.2.4. Model Validation

It was confirmed that the regression model could predict the results of a survey conducted in South Korea. The predicted value was obtained by substituting the value of dimensions in the 6-D model for Equations (2) and (3). Observed values and predicted values are presented in Table 4. When the observed values and predicted values were numerically checked, it was found that they had similar values, and when data from South Korea were added to the paired t test performed in Section 2.4.2, it was found that the p-value increased (0.99, 0.99, respectively).

4. Discussion

With the advent of autonomous driving technology, the various modes of transportation to which autonomous driving technology can be applied are emerging, and sustainable transportation, such as autonomous vehicles and shared autonomous vehicles, are receiving much attention. A number of studies that have investigated public opinion about AVs have been conducted over the last decade. Recently, studies have been conducted on perceptions of shared autonomous vehicles and self-driving taxis, and on preferences among innovative modes of transportation [5,6,7,8]. However, under and post-COVID-19 circumstances, people are more sensitive to sanitation and quarantine measures, so they prefer autonomous private vehicles to modes of transportation that require sharing a vehicle with others [8,9]. In order for autonomous private vehicles to be accepted without any problems, in line with this pandemic circumstance, it is necessary to thoroughly identify public opinion on the innovative technology.
Public opinion is an important factor in the adoption of innovation. Public opinion varies not only according to individual characteristics, but also according to cultural characteristics. In fact, studies are being conducted on how cultural differences affect the adoption of various technologies, including research on transportation technology [39,40,47]. However, in this regard, research on the adoption of autonomous private vehicles has not been conducted. Therefore, in this paper, we developed a regression model of cultural difference for adapting autonomous vehicles. We compared the dimensions of the Power Distance Index, Individualism, Masculinity, Uncertainty Avoidance Index, Long-Term Orientation, and Indulgence, included in Hofstede’s 6-D model, with the public’s concerns about AVs and their willingness to pay for AVs.
Prior to statistical modeling, literature reviews were conducted to posit hypotheses about the relationship between the cultural dimensions in Hofstede’s 6-D model and public opinion about AVs. The first hypothesis concerned the relationship between INDV and WTP. INDV is an individual’s preference for a social atmosphere, and people in societies with high INDV behave more independently and accept technology regardless of their surroundings. On the other hand, in countries with low INDV, individuals are more likely to act in accordance with national goals [39,40]. Autonomous driving is a technology that is being developed with interest from governments. Therefore, a society with a lower INDV will have a higher WTP, as it is more influenced by the social atmosphere. China and South Korea were among the countries with the lowest INDV, and their WTP was high compared to other countries. Additionally, there was a significant negative relation between INDV and WTP. These results support H1.
Second, there was negative relationship between INDU and concerns and WTP (H2). A high INDU society allows relatively free gratification of the basic and natural human drives related to enjoying life and having fun [33]. In other words, high INDU societies indicate a tendency to optimism, and people in high INDU societies will be optimistic about new technologies [53,58]. Therefore, in countries with high INDU, the values for concern and WTP were low. These countries had low concern and WTP values compared to other countries. Additionally, when investigating the relationship between INDU, concern, and WTP through correlation analysis, it was confirmed that there was a significant negative correlation.
Moreover, the higher the value of PDI, the higher the concern and WTP. PDI expresses the degree to which the people of a society accept that power is distributed unequally. In a society with a high level of PDI, people accept a hierarchy and tend to follow the leader’s opinion. As mentioned earlier, autonomous driving is a technology of interest not only to individuals but also to governments. Therefore, a country with a high PDI will have a high WTP. Additionally, the higher the PDI, the more important morals and norms tend to be. Therefore, individuals will be more concerned about the deviations from the norm caused by autonomous vehicles. Among the countries compared in this paper, China had the highest PDI and Japan had the second highest PDI. This trend was consistent with values of average concern, and both countries had high WTP values.
The fourth hypothesis is about relationship between UAI and public opinion about AVs. Countries with a high UAI feel uncomfortable with uncertainty. Therefore, people in countries with high UAI will feel repulsed by the uncertainty that innovative technologies bring. However, there was no significant relationship between UAI and concern, or UAI and WTP. This result may be due to the fact that autonomous driving technology has already been widely exposed through the media and, because of this, people were already familiar with it.
There are several limitations in this paper. First, there is a difference between when the data used to develop the model and the data used for validation were collected. Over time, public opinion about AVs will change [59]. Therefore, different results could have been derived if they were compared at the same time point. Second, in this paper, cultural differences were investigated through Hofstede’s 6-D model, while there are other frameworks that account for cultural differences, such as Schwartz’s framework or the GLOBE framework [42,44,60]. However, the cultural dimensions included in each framework are similar or extended, based on the 6-D model. Additionally, the 6-D model has been used in more studies than other frameworks, and has been validated in many domains. Therefore, the results of this paper using the 6-D model offer a sufficient contribution. In future studies, it will be necessary to predict public opinion using a different framework of cultural differences. Third, the data used to develop and validate the model were limited. Data from six countries were used to develop the model, which is a small data set. This is a limitation that occurred because the number of countries that conducted the same survey was insufficient. A more robust result could have been obtained if the model had been developed with data from more countries. Additionally, although the model was validated through the survey, the number of respondents was relatively small. However, the aim of this study was to develop a model to predict public opinion on AVs through cultural dimensions without conducting a survey. Although the model was developed with a small data set, it is very meaningful because we established that it is possible to make accurate predictions from additional survey results. Lastly, public opinion was modeled only through cultural differences, and it is unknown how public opinion affects the actual adoption of AVs in this study. There could be moderate effects of individual characteristics, such as gender, age, income, education level, etc. Even within a country, there are people with diverse personalities, and this should be fully considered. However, cultural dimensions represent the universal characteristics of each country, and identifying them will be very important in the early stages of adopting innovation. Moreover, it was difficult to ascertain the relationship between cultural differences and the adoption of AVs because autonomous driving has not yet become widespread. Therefore, in this study, it was analyzed through WTP instead of data on the actual adoption of AVs.

5. Conclusions

In summary, research was conducted to develop models that could predict public opinions about AVs through Hofstede’s 6-D model. Surveys conducted in various countries were collected and predictive models were developed based on the collected surveys. The model was validated through an additional survey conducted in South Korea. Through the developed model, concern about AVs and willingness to pay to purchase AVs could be predicted. This confirmed that cultural differences play an important role in the acceptance of autonomous vehicles. Additionally, through this study, the influence of the cultural dimension on public opinion about AVs was confirmed, and a more accurate predictive model can be developed through future research.

Author Contributions

Conceptualization, Y.Y., H.O. and R.M.; methodology, Y.Y.; validation, Y.Y.; formal analysis, Y.Y.; investigation, Y.Y.; data curation, Y.Y.; writing—original draft preparation, Y.Y.; writing—review and editing, Y.Y, and H.O.; supervision, R.M.; funding acquisition, R.M. All authors have read and agreed to the published version of the manuscript.

Funding

This Research was funded by Brain Korea 21 Four (I21SS7609052) and Basic Science Research Program through the National Research Foundation of Korea (NRF-2018R1D1A1A09084291) from Ministry of Education.

Institutional Review Board Statement

Ethical review and approval were waived for this study, due to the experiment were conducted on online and voluntarily.

Informed Consent Statement

Informed consent was obtained from all subjects involved in the study through online survey.

Conflicts of Interest

The authors declare no conflict of interest.

References

  1. Cho, H.; Lee, D.; Kim, Y.C. 2010 Traffic Congestion Costs: Estimation and Trend Analysis; The Korea Transport Institute Research Report; KOTI: Sejong City, Korea, 2013; pp. 1–102. [Google Scholar]
  2. Singh, S. Critical Reasons for Crashes Investigated in the National Motor Vehicle Crash Causation Survey; Traffic Safety Facts Crash Stats. Report No. DOT HS 812 506; National Highway Traffic Safety Administration: Washington, DC, USA, 2018. [Google Scholar]
  3. Schrank, D.; Eisele, B.; Lomax, T. TTI’s 2012 Urban Mobility Report; Texas A&M Transportation Institute, The Texas A&M University System: College Station, TX, USA, 2012; p. 4. [Google Scholar]
  4. Dingus, T.A.; Guo, F.; Lee, S.; Antin, J.F.; Perez, M.; Buchanan-King, M.; Hankey, J. Driver crash risk factors and prevalence evaluation using naturalistic driving data. Proc. Natl. Acad. Sci. USA 2016, 113, 2636–2641. [Google Scholar] [CrossRef] [Green Version]
  5. Ferrero, F.; Perboli, G.; Rosano, M.; Vesco, A. Car-sharing services: An annotated review. Sustain. Cities Soc. 2018, 37, 501–518. [Google Scholar] [CrossRef]
  6. Krueger, R.; Rashidi, T.H.; Rose, J.M. Preferences for shared autonomous vehicles. Transp. Res. Part C Emerg. Technol. 2016, 69, 343–355. [Google Scholar] [CrossRef]
  7. Tan, L.; Ma, C.; Xu, X.; Xu, J. Choice Behavior of Autonomous Vehicles Based on Logistic Models. Sustainability 2020, 12, 54. [Google Scholar] [CrossRef] [Green Version]
  8. Turoń, K.; Kubik, A.; Chen, F.; Wang, H.; Łazarz, B. A holistic approach to electric shared mobility systems development—Modelling and optimization aspects. Energies 2020, 13, 5810. [Google Scholar] [CrossRef]
  9. Marek, W. Will the Consequences of Covid-19 Trigger a Redefining of the Role of Transport in the Development of Sustainable Tourism? Sustainability 2021, 13, 1887. [Google Scholar] [CrossRef]
  10. Severino, A.; Curto, S.; Barberi, S.; Arena, F.; Pau, G. Autonomous Vehicles: An Analysis Both on Their Distinctiveness and the Potential Impact on Urban Transport Systems. Appl. Sci. 2021, 11, 3604. [Google Scholar] [CrossRef]
  11. Eugensson, A.; Brännström, M.; Frasher, D.; Rothoff, M.; Solyom, S.; Robertsson, A. Environmental, safety legal and societal implications of autonomous driving systems. In Proceedings of the International Technical Conference on the Enhanced Safety of Vehicles (ESV), Seoul, South Korea, 27–30 May 2013; Volume 334. [Google Scholar]
  12. Bahamonde-Birke, F.J.; Kickhöfer, B.; Heinrichs, D.; Kuhnimhof, T. A systemic view on autonomous vehicles: Policy aspects for a sustainable transportation planning. disP-Plan. Rev. 2018, 54, 12–25. [Google Scholar] [CrossRef]
  13. Greenblatt, J.B.; Shaheen, S. Automated Vehicles, on-Demand Mobility, and Environmental Impacts. Curr. Sustain. Energy Rep. 2015, 2, 74–81. [Google Scholar] [CrossRef] [Green Version]
  14. Bansal, P.; Kockelman, K.M.; Singh, A. Assessing public opinions of and interest in new vehicle technologies: An Austin perspective. Transp. Res. Part C Emerg. Technol. 2016, 67, 1–14. [Google Scholar] [CrossRef]
  15. Cunningham, M.L.; Ledger, S.A.; Regan, M.A. A survey of public opinion on automated vehicles in Australia and New Zealand. In Proceedings of the 28th ARRB International Conference, Brisbane, Australia, 29 April–2 May 2018. [Google Scholar]
  16. Howard, D.; Dai, D. Public perceptions of self-driving cars: The case of Berkeley, California. In Proceedings of the Transportation Research Board 93rd Annual Meeting, Washington, DC, USA, 12–16 January 2014; Volume 14. No. 4502. [Google Scholar]
  17. Kyriakidis, M.; Happee, R.; de Winter, J.C.F. Public opinion on automated driving: Results of an international questionnaire among 5000 respondents. Transp. Res. Part F Traffic Psychol. Behav. 2015, 32, 127–140. [Google Scholar] [CrossRef]
  18. Liljamo, T.; Liimatainen, H.; Pöllänen, M. Attitudes and concerns on automated vehicles. Transp. Res. Part F Traffic Psychol. Behav. 2018, 59, 24–44. [Google Scholar] [CrossRef]
  19. Schoettle, B.; Sivak, M. Public Opinion about Self-Driving Vehicles in China, India, Japan, the US, the UK, and Australia; University of Michigan, Ann Arbor, Transportation Research Institute: Ann Arbor, MI, USA, 2014. [Google Scholar]
  20. Sener, I.N.; Zmud, J.; Williams, T. Measures of baseline intent to use automated vehicles: A case study of Texas cities. Transp. Res. Part F Traffic Psychol. Behav. 2019, 62, 66–77. [Google Scholar] [CrossRef]
  21. Wu, J.; Liao, H.; Wang, J.-W.; Chen, T. The role of environmental concern in the public acceptance of autonomous electric vehicles: A survey from China. Transp. Res. Part F Traffic Psychol. Behav. 2019, 60, 37–46. [Google Scholar] [CrossRef]
  22. Payre, W.; Cestac, J.; Delhomme, P. Intention to use a fully automated car: Attitudes and a priori acceptability. Transp. Res. Part F Traffic Psychol. Behav. 2014, 27, 252–263. [Google Scholar] [CrossRef] [Green Version]
  23. Šinko, S.; Knez, M.; Obrecht, M. Analysis of public opinion on autonomous vehicles. In Challenges of Europe: International Conference Proceedings; Faculty of Economics, University of Split: Split, Croatia, 2017; pp. 219–230. [Google Scholar]
  24. Hohenberger, C.; Spörrle, M.; Welpe, I.M. How and why do men and women differ in their willingness to use automated cars? The influence of emotions across different age groups. Transp. Res. Part A Policy Pract. 2016, 94, 374–385. [Google Scholar] [CrossRef]
  25. Haboucha, C.J.; Ishaq, R.; Shiftan, Y. User preferences regarding autonomous vehicles. Transp. Res. Part C Emerg. Technol. 2017, 78, 37–49. [Google Scholar] [CrossRef]
  26. Daziano, R.A.; Sarrias, M.; Leard, B. Are consumers willing to pay to let cars drive for them? Analyzing response to auton-omous vehicles. Transp. Res. Part C Emerg. Technol. 2017, 78, 150–164. [Google Scholar] [CrossRef] [Green Version]
  27. Wang, S.; Jiang, Z.; Noland, R.B.; Mondschein, A.S. Attitudes towards privately-owned and shared autonomous vehicles. Transp. Res. Part F Traffic Psychol. Behav. 2020, 72, 297–306. [Google Scholar] [CrossRef]
  28. Shin, K.J.; Managi, S. Consumer Demand for Fully Automated Driving Technology: Evidence from Japan; RIETI: Tokyo, Japan, 2017. [Google Scholar]
  29. Bansal, P.; Kockelman, K.M. Forecasting Americans’ long-term adoption of connected and autonomous vehicle technologies. Transp. Res. Part A Policy Pract. 2017, 95, 49–63. [Google Scholar] [CrossRef]
  30. Panagiotopoulos, I.; Dimitrakopoulos, G. An empirical investigation on consumers’ intentions towards autonomous driving. Transp. Res. Part C Emerg. Technol. 2018, 95, 773–784. [Google Scholar] [CrossRef]
  31. Liu, P.; Guo, Q.; Ren, F.; Wang, L.; Xu, Z. Willingness to pay for self-driving vehicles: Influences of demographic and psycho-logical factors. Transp. Res. Part C Emerg. Technol. 2019, 100, 306–317. [Google Scholar] [CrossRef]
  32. Wintersberger, S.; Azmat, M.; Kummer, S. Are We Ready to Ride Autonomous Vehicles? A Pilot Study on Austrian Consumers’ Perspective. Logistics 2019, 3, 20. [Google Scholar] [CrossRef] [Green Version]
  33. Kumar, V. Understanding Cultural Differences in Innovation: A Conceptual Framework and Future Research Directions. J. Int. Mark. 2014, 22, 1–29. [Google Scholar] [CrossRef]
  34. McCoy, S.; Galletta, D.F.; King, W.R. Integrating national culture into IS research: The need for current individual level measures. Commun. Assoc. Inf. Syst. 2005, 15, 12. [Google Scholar] [CrossRef] [Green Version]
  35. Srite, M. Culture as an Explanation of Technology Acceptance Differences: An Empirical Investigation of Chinese and US Users. Australas. J. Inf. Syst. 2006, 14. [Google Scholar] [CrossRef]
  36. Straub, D.; Keil, M.; Brenner, W. Testing the technology acceptance model across cultures: A three country study. Inf. Manag. 1997, 33, 1–11. [Google Scholar] [CrossRef]
  37. Shane, S.A. Why do some societies invent more than others? J. Bus. Ventur. 1992, 7, 29–46. [Google Scholar] [CrossRef]
  38. Shane, S. Cultural influences on national rates of innovation. J. Bus. Ventur. 1993, 8, 59–73. [Google Scholar] [CrossRef]
  39. Hofstede, G. Cultures Consequences: International Differences in Work-Related Values; Sage: London, UK, 1980. [Google Scholar]
  40. Hofstede, G. Dimensionalizing cultures: The Hofstede model in context. Online Read. Psychol. Cult. 2011, 2, 8. [Google Scholar] [CrossRef]
  41. Engelen, A.; Brettel, M. Assessing cross-cultural marketing theory and research. J. Bus. Res. 2011, 64, 516–523. [Google Scholar] [CrossRef]
  42. House, R.J.; Hanges, P.J.; Javidan, M.; Dorfman, P.W.; Gupta, V. (Eds.) Culture, Leadership, and Organizations: The GLOBE Study of 62 Societies; Sage: London, UK, 2004. [Google Scholar]
  43. Magnusson, P.; Wilson, R.T.; Zdravkovic, S.; Zhou, J.X.; Westjohn, S.A. Breaking through the cultural clutter: A comparative assessment of multiple cultural and institutional frameworks. Int. Mark. Rev. 2008, 25, 183–201. [Google Scholar] [CrossRef]
  44. Schwartz, S.H. Beyond individualism/collectivism: New cultural dimensions of values. In Individualism and Collectivism: Theory, Method, and Applications; Kim, U., Triandis, H.C., Kâğitçibaşi, Ç., Choi, S.-C., Yoon, G., Eds.; Sage Publications: London, UK, 1994; pp. 85–119. [Google Scholar]
  45. Choi, J.; Geistfeld, L.V. A cross-cultural investigation of consumer e-shopping adoption. J. Econ. Psychol. 2004, 25, 821–838. [Google Scholar] [CrossRef]
  46. Choi, J.; Lee, H.J.; Sajjad, F.; Lee, H. The influence of national culture on the attitude towards mobile recommender systems. Technol. Forecast. Soc. Change 2014, 86, 65–79. [Google Scholar] [CrossRef] [Green Version]
  47. Dwyer, S.; Mesak, H.; Hsu, M. An Exploratory Examination of the Influence of National Culture on Cross-National Product Diffusion. J. Int. Mark. 2005, 13, 1–27. [Google Scholar] [CrossRef]
  48. Flight, R.L.; Allaway, A.W.; Kim, W.-M.; D’Souza, G. A Study of Perceived Innovation Characteristics Across Cultures and Stages of Diffusion. J. Mark. Theory Pract. 2011, 19, 109–126. [Google Scholar] [CrossRef]
  49. Lu, J.; Yu, C.-S.; Liu, C.; Wei, J. Comparison of mobile shopping continuance intention between China and USA from an espoused cultural perspective. Comput. Hum. Behav. 2017, 75, 130–146. [Google Scholar] [CrossRef]
  50. Ang, J.B.; Fredriksson, P.G.; Sharma, S. Individualism and the adoption of clean energy technology. Resour. Energy Econ. 2020, 61, 101180. [Google Scholar] [CrossRef]
  51. Barbarossa, C.; Beckmann, S.C.; De Pelsmacker, P.; Moons, I.; Gwozdz, W. A self-identity based model of electric car adoption intention: A cross-cultural comparative study. J. Environ. Psychol. 2015, 42, 149–160. [Google Scholar] [CrossRef]
  52. Negara, J.G.P.; Setyohadi, D.B. Uncertainty Avoidance and Individualism Collectivism on Acceptance of Smart City Mobile Applications. In Proceedings of the 4th International Conference on Informatics and Computational Sciences (ICICoS), Semarang, Indonesia, 10–11 November 2020; pp. 1–6. [Google Scholar]
  53. Orlando, B.; Ballestra, L.V.; Scuotto, V.; Pironti, M.; Del Giudice, M. The Impact of R&D Investments on Eco-Innovation: A Cross-Cultural Perspective of Green Technology Management. IEEE Trans. Eng. Manag. 2020, 1–10. [Google Scholar] [CrossRef]
  54. McLeay, F.; Yoganathan, V.; Osburg, V.-S.; Pandit, A. Risks and drivers of hybrid car adoption: A cross-cultural segmentation analysis. J. Clean. Prod. 2018, 189, 519–528. [Google Scholar] [CrossRef]
  55. Etzioni, S.; Hamadneh, J.; Elvarsson, A.B.; Esztergár-Kiss, D.; Djukanovic, M.; Neophytou, S.N.; Shiftan, Y. Modeling cross-national differences in automated vehicle acceptance. Sustainability 2020, 12, 9765. [Google Scholar] [CrossRef]
  56. Kahneman, D.; Tversky, A. Prospect theory: An analysis of decision under risk. In Handbook of the Fundamentals of Financial Decision Making: Part I; World Scientific: Singapore, 2013; pp. 99–127. [Google Scholar]
  57. Pfleging, B.; Rang, M.; Broy, N. Investigating user needs for non-driving-related activities during automated driving. In Proceedings of the 15th International Conference on Mobile and Ubiquitous Multimedia, Rovaniemi, Finland, 13–15 December 2016; pp. 91–99. [Google Scholar]
  58. Yildirim, E.; Barutçu, M.T. How uncertainty avoidance, power distance and indulgence affect social commerce expendi-ture? An investigation based on Facebook. Int. J. Sport Cult. Sci. 2016, 4, 403–421. [Google Scholar] [CrossRef]
  59. Krishna, R.V.; Sadowski, P. Dynamic Preference for Flexibility. Econometrica 2014, 82, 655–703. [Google Scholar] [CrossRef] [Green Version]
  60. Sadik-Rozsnyai, O. Willingness to pay for innovations: An emerging European innovation adoption behaviour. Eur. J. Innov. Manag. 2016, 19, 568–588. [Google Scholar] [CrossRef]
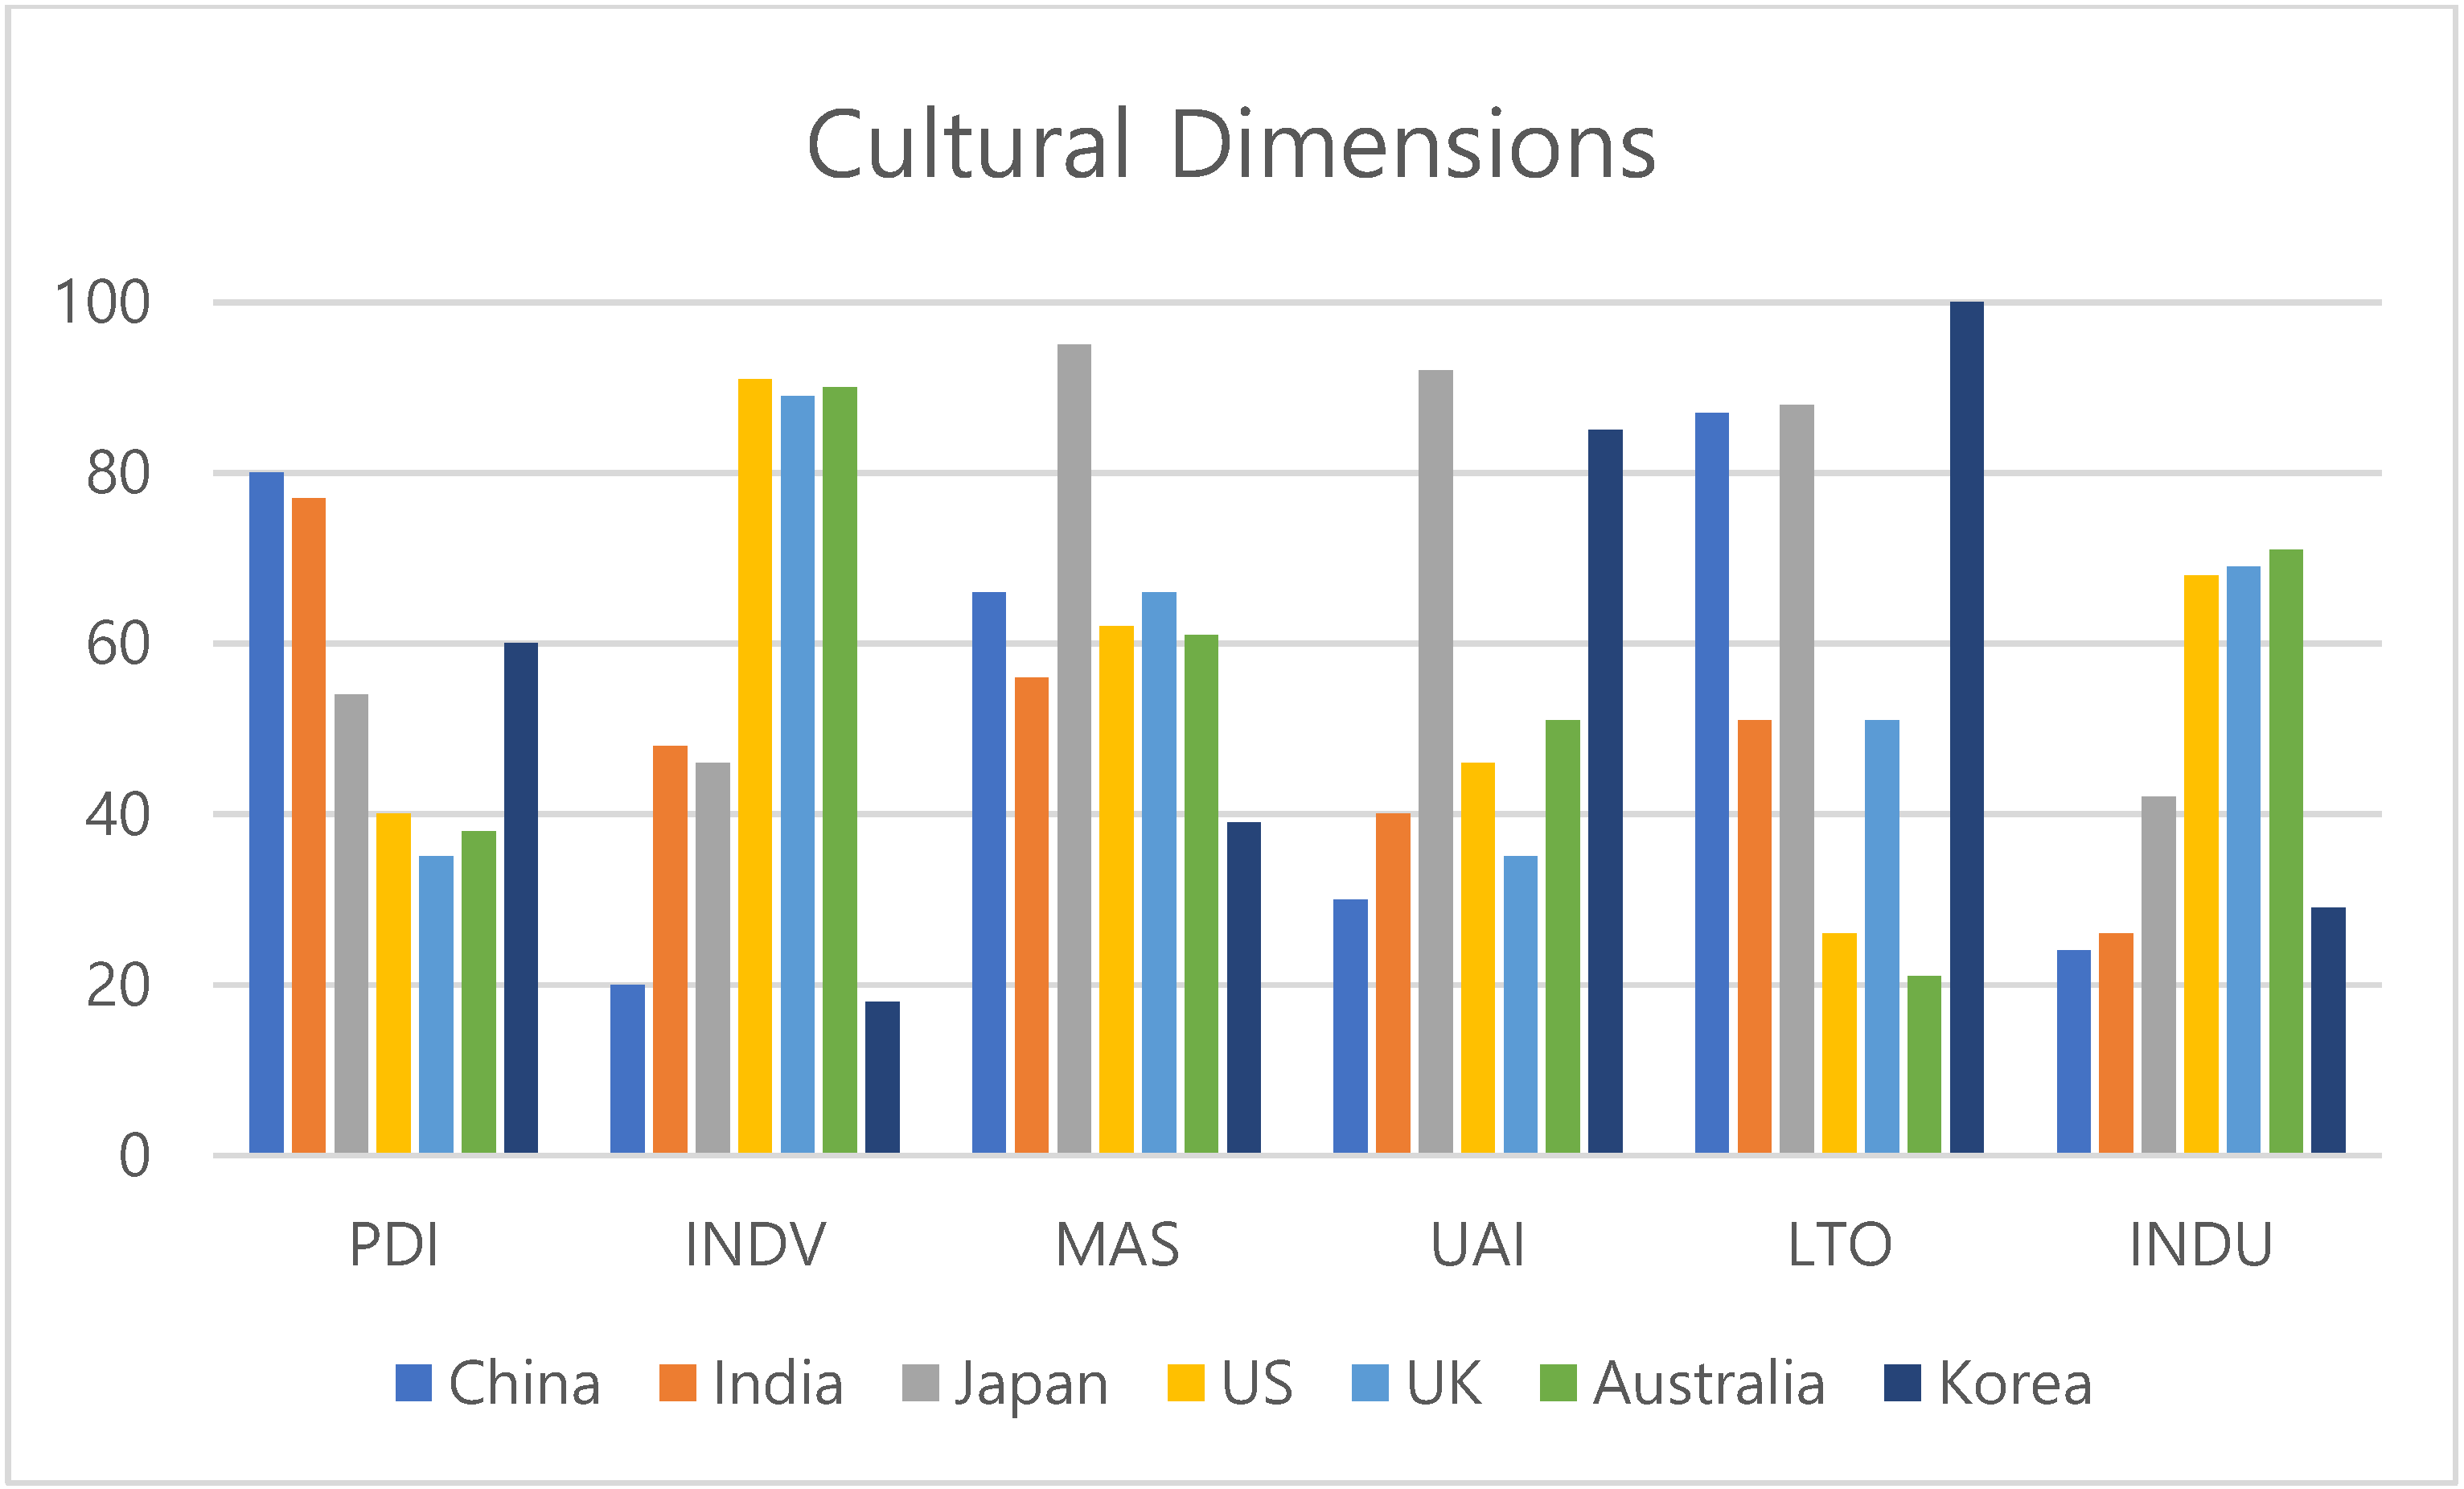
Figure 1. The value of the cultural dimensions for each country.
Applsci 11 09030 g001
Figure 2. Concerns about AVs in South Korea.
Applsci 11 09030 g002
Table 1. Descriptions of the dimensions in Hofstede’s 6-D model.
DimensionDescription
Power Distance Index (PDI)The degree to which the less powerful members of a society accept and expect that power is distributed unequally
Individualism/Collectivism (INDV)A preference for a loosely knit social framework in society, in which individuals can be expected to care for only themselves and their immediate families
Masculinity/Femininity (MAS)A preference in society for achievement, heroism, and material rewards for success
Uncertainty Avoidance Index (UAI)The degree to which the members of a society feel uncomfortable with uncertainty and ambiguity
Long-Term Orientation (LTO)Societies who score low on this dimension prefer to maintain time honored traditions and norms while viewing societal change with suspicion
Indulgence/Restraint (INDU)Indulgence stands for a society that allows relatively free gratification of the basic and natural human drives related to enjoying life and having fun
Table 2. Results in the literature and our survey.
(%)ChinaIndiaJapanThe U.S.The U.K.AustraliaSouth Korea
ConcernsSafety95.786.576.981.881.678.770.5
Legal Liability92.183.370.477.272.572.780.6
Security89.583.368.670.867.168.279.6
Data Privacy85.482.262.669.461.760.269.6
Average90.783.869.674.870.770.075.0
Willingness to PayWTP78.470.232.545.540.244.882.2
Table 3. Correlation between survey results and the 6-D model.
PDIINDVMASUAILTOINDU
ConcernsSafety0.7660 *−0.66780.1644−0.68500.3897−0.6710
Legal Liability0.8274 **−0.6923−0.4007−0.44180.3395−0.7240 *
Security0.9342 ***−0.8035 *−0.3803−0.27930.4787−0.8568 **
Data Privacy0.9081 **−0.7341 *−0.2701−0.43420.2946−0.8291 **
Average0.8843 **−0.7430 *−0.2447−0.51550.2859−0.7955 *
Willingness to PayWTP0.8435 **−0.6441 **−0.5440 *−0.65830.2336−0.7290 *
NOTE: *: 0.05 < p-value < 0.1; **: 0.01 < p-value < 0.05; ***: p-value < 0.01.
Table 4. Observed value and predicted value for public opinion in South Korea.
ItemsObserved ValuePredicted Value
ConcernAverage of Concerns75.070.75
Willingness to PayWTP82.289.31
Publisher’s Note: MDPI stays neutral with regard to jurisdictional claims in published maps and institutional affiliations.

