Article

Reflectometry Study of the Pyroelectric Effect on Proton-Exchange Channel Waveguides in Lithium Niobate

1
Perm Federal Research Center, Ural Branch, Russian Academy of Sciences, 614990 Perm, Russia
2
Perm State National Research University, 614990 Perm, Russia
3
Institute of Automation and Electrometry, Siberian Branch, Russian Academy of Sciences, 630090 Novosibirsk, Russia
*
Author to whom correspondence should be addressed.
Appl. Sci. 2021, 11(21), 9853; https://doi.org/10.3390/app11219853
Submission received: 7 September 2021 / Revised: 13 October 2021 / Accepted: 15 October 2021 / Published: 21 October 2021
(This article belongs to the Special Issue Advances in Photonic Technologies and Cryptographic Applications)

Abstract

:
This work is devoted to the study of the pyroelectric effect on the properties of optical waveguides formed in a lithium niobate crystal by proton exchange. In the present work, we studied the cessation effect of the radiation channeling during thermocycling of Y-splitters samples. We examined the spectral dependence of optical losses on the wavelength using an optical spectrum analyzer. The results demonstrate that in the range of 1530–1570 nm, all wavelengths are suppressed equally. The optical frequency domain reflectometry shows that the increase of optical losses is observed along the entire waveguide, but not only at the Y-splitting point, as supposed earlier.

Graphical Abstract

1. Introduction

Integrated-optical circuits based on proton-exchange channel waveguides are the basis of integrated-optical modulators (IOMs) of radiation used in fiber-optic communication lines and are also the heart of navigation systems based on fiber-optic gyroscopes [1]. In addition, such modulators are used in quantum cryptography for the transmission of quantum keys [2] and in single-photon detectors [3].
At the moment, the integrated optical circuits based on silicon [4], InP [5] and thin-film lithium niobate (LN) [6] are most actively developing. However, traditional diffusion technologies for the formation of waveguides in LN are the basis for commercial integrated-optical circuits, especially in the field of fiber-optic gyroscopes and navigation systems [7]. In addition, proton-exchange waveguides in LN are used for the creation of new types of compact gyroscopes [8]. This is due to both the relative simplicity of the process of forming waveguides, and their extremely high polarizing properties [9]. Despite the fact that proton-exchange waveguides are low-contrast and do not fit well with the modern ideology of integral photonics (which requires a high density of elements), low optical losses and a high operating modulation frequency (up to 100 GHz) prompt researchers to look for new ways to form more compact devices based on proton exchange technology in LN [10].
The undoubted importance of these IOMs applications requires their stable operation in a wide temperature range, typically from minus 60 to plus 80 °C. The study [11] shows that heating of the LN integrated-optical circuit, pre-cooled to low temperatures, can lead to a significant increase in optical losses in the channel or even complete cessation of radiation channeling. This phenomenon is most dangerous when using IOMs as part of a fiber-optic gyroscope since the conditions of “switching off” the waveguides may well be reproduced during actual system operation.
The essence of the phenomenon under study is that the action of the pyroelectric effect in a lithium niobate crystal results in a redistribution of the charged defects in the crystal lattice, leading to a local decrease Δn—the refractive index of optical waveguides with respect to the surrounding crystal. In some cases, the Δn value for waveguides may become so small that the conditions for channeling of the fundamental mode of radiation stop being fulfilled. This phenomenon, described theoretically in [12], was not observed in the experimental works before [11] due to relatively rare conditions of the experiment —cooling the sample to low temperatures and its rapid heating. Usually, IOMs are not tested under such conditions; for most commercially available IOMs, the operating temperature range declared is from 0 to 80 °C. Additionally, pyroelectric influence to proton exchanged waveguides was studied in [13] and it was shown that electrodes play huge role in changing waveguide optical properties.
The total the optical power at the IOM output only is analyzed in [11]. However, neither longitudinal character of losses (local or distributed) nor their localization within OIM length was determined. The present work aims to answer these questions and investigate in more detail the processes occurring inside the waveguide during a change in the crystal temperature. Several experimental approaches were used to solve the task. In the first stage, the IOM transmittance and their temperature dependence were analyzed. To study the backscattered signal, we used the distributed methods based on coherent frequency domain reflectometry (OFDR), which, in contrast to classical time-domain reflectometry, allows one to obtain micron spatial resolution [14]. Its principle is based on the spectral analysis of the interference signal arising from mixing the probing and scattered radiation. This analysis can be performed by sweeping the optical frequency of probing radiation. In this case, the spatial coordinate of the reflectors along the line under study is proportional to the frequency coordinate of the Fourier spectrum for the interference signal measured during optical frequency sweep. The essential element of an optical frequency domain reflectometer is a tunable source of radiation with a long coherence length. In this case, the spatial resolution is determined by the sweeping range of the probing laser wavelength. The high sensitivity of such a reflectometer to the reflection coefficient (better than 120 dB/mm) makes it possible to characterize refractive index inhomogeneities embedded in the optical fiber. In particular, this property makes it possible to use the small frozen-in fluctuations of the refractive index specific to conventional optical fibers for various sensing tasks [15]. Thus, OFDR is currently the most sensitive method for studying small optical elements with micron spatial resolution.

2. Experimental Procedure

2.1. Studied Samples and Temperature Tests Methodology

The studied samples were IOMs with the waveguide topology in the form of a Y-splitter with the electrodes placed on each side (Figure 1). In fact, with no applied voltage this IOM is a Y-branch, but taking into account the IOM’s design features and its application, in this paper we will use the term ‘modulator’. The modulator’s electrodes were made using X-cut congruent LN produced by Crystal Technology (USA). Channels were created using direct photolithography. Channel waveguides with a width of 6 μm were formed by proton exchange in benzoic acid. Proton exchange was performed in a closed zirconium reactor at 170 °C for 2 h, followed by cooling at a rate of 10 °C/min. Annealing was performed at 350 °C for 5.5 h, followed by cooling together with the furnace. As a result, optical channel waveguides with Δn = 0.017 were formed, measured by mode spectroscopy. The final step involved docking the chip with an optical fiber maintaining the polarization of radiation, type Panda. The pyroelectric effect in the samples was not suppressed. Before the experiment, the samples were thoroughly cleaned to remove possible surface contaminants. The physical length of the modulator is l = 35 mm. The waveguides in the modulator are located along the Y-axis in the X-cut plane. The waveguide optical losses at room temperature were measured as 1 dB/cm.
In all studies, the examined sample was subjected to temperature tests. For this purpose, the IOM was placed in the high/low-temperature chamber Espec 712R, where it was exposed to slow cooling to minus 60 °C at a rate of 0.5 degrees per minute, and then—to fast heating at a rate of 4 degrees per minute to 60 °C.

2.2. Study of Integral Characteristics

In the first stage, we studied the integral transmission characteristics of the IOM depending on the waveguide mode of operation. The temperature dependences of the output optical power and transmission spectrum were investigated. The measuring diagram is shown in Figure 2.
A source of spontaneous emission (ASE) with broadband spectrum from 1520 to 1570 nm was used as probing radiation. The signal ASE source was fed to the fiber input of the IOM with simultaneous registration of optical power coming out of two other channels of the IOM. The output signal was detected by two photodetectors PD1 and PD2 and then recorded by data acquisition (DAQ) units. The other part of the power from the upper channel was analyzed by optical spectrum analyzer (OSA). The dependence of the output power and temperature on time is shown in Figure 3.
Simultaneously with the optical power measurement we measured the optical transmission spectra of the IOM. Figure 4 shows two spectra: at room temperature and in the radiation channeling suppression mode. The spectrum consists of several peaks the highest of which has a wavelength near of 1530 nm that is typical for Erbium-doped ASE sources. Figure 5 in the form of a heat map shows the temporal dynamics of output spectrum normalized to the spectrum at the initial moment. It can be seen from Figure 5 and Figure 6 that cooling leads to a decrease in the transmittance of one of the IOM channels.

2.3. Study of Distribited Characteristics

Thus, the experiments on integral characteristics showed that there is a suppression of channeling at some temperatures/temperature gradients in the IOM. The similar results were observer early in [4]. However, neither longitudinal character of losses (local or distributed) nor their localization within OIM length was determined. For this purpose, the IOM was analyzed by using an OFDR method of distributed characterization of optical elements (Luna OBR 5T-50). The schematic of the experiment is presented in Figure 7.
A linearly tunable wavelength laser coherent signal was introduced into the IOM; the sweeping range was from 1530 to 1570 nm. To exclude the overlapping of signals from the two IOM arms, radiation was introduced only into one of the output ports of the IOM. The obtained signal–reflectogram represent the dependence of the backscattered power on the longitudinal coordinate within the waveguides of the studied sample. The OFDR reflectograms were recorded as the temperature of the IOM changed.
Typical traces in the IOM area at different moments of the thermal cycle are shown in Figure 8. The IOM trace is characterized by peaks corresponding to the points where the refractive index changes and Fresnel reflection occurs. In particular, the left peak (A) is due to the reflection of the radiation introduced from the fiber-waveguide interface of the IOM. The right peak (D) corresponds to the IOM-optical fiber interface. The measured length of the IOM as the distance between the peaks—35 mm is consistent with its physical length. The peaks and the specific areas between them (e.g., the area between B and C in Figure 8) are located inside the IOM. The temperature dynamics of the traces are presented as a heat map in Figure 9.

3. Discussion of the Obtained Results

The experiments showed a dramatic decrease in the output optical power being observed when the cooled sample is fast heating (Figure 3). The spectral analysis showed that the decrease occurs uniformly in the measured spectral range (Figure 6). It confirms the legitimacy of the used OFDR technique with tunable radiation. Reflectometric measurements demonstrated the changes in the intensities of the return signals in different parts of the IOM during the thermal cycle. Initially, it was assumed that a sharp change in the reflectogram would be observed in the waveguides branching area because it is there that the dislocation grid surrounding the waveguides has the greatest width, facilitating the movement of the charged defects, which affect the waveguide refractive index.
Further, we analyzed the temperature behavior in different areas of the IOM (Figure 10):
1.
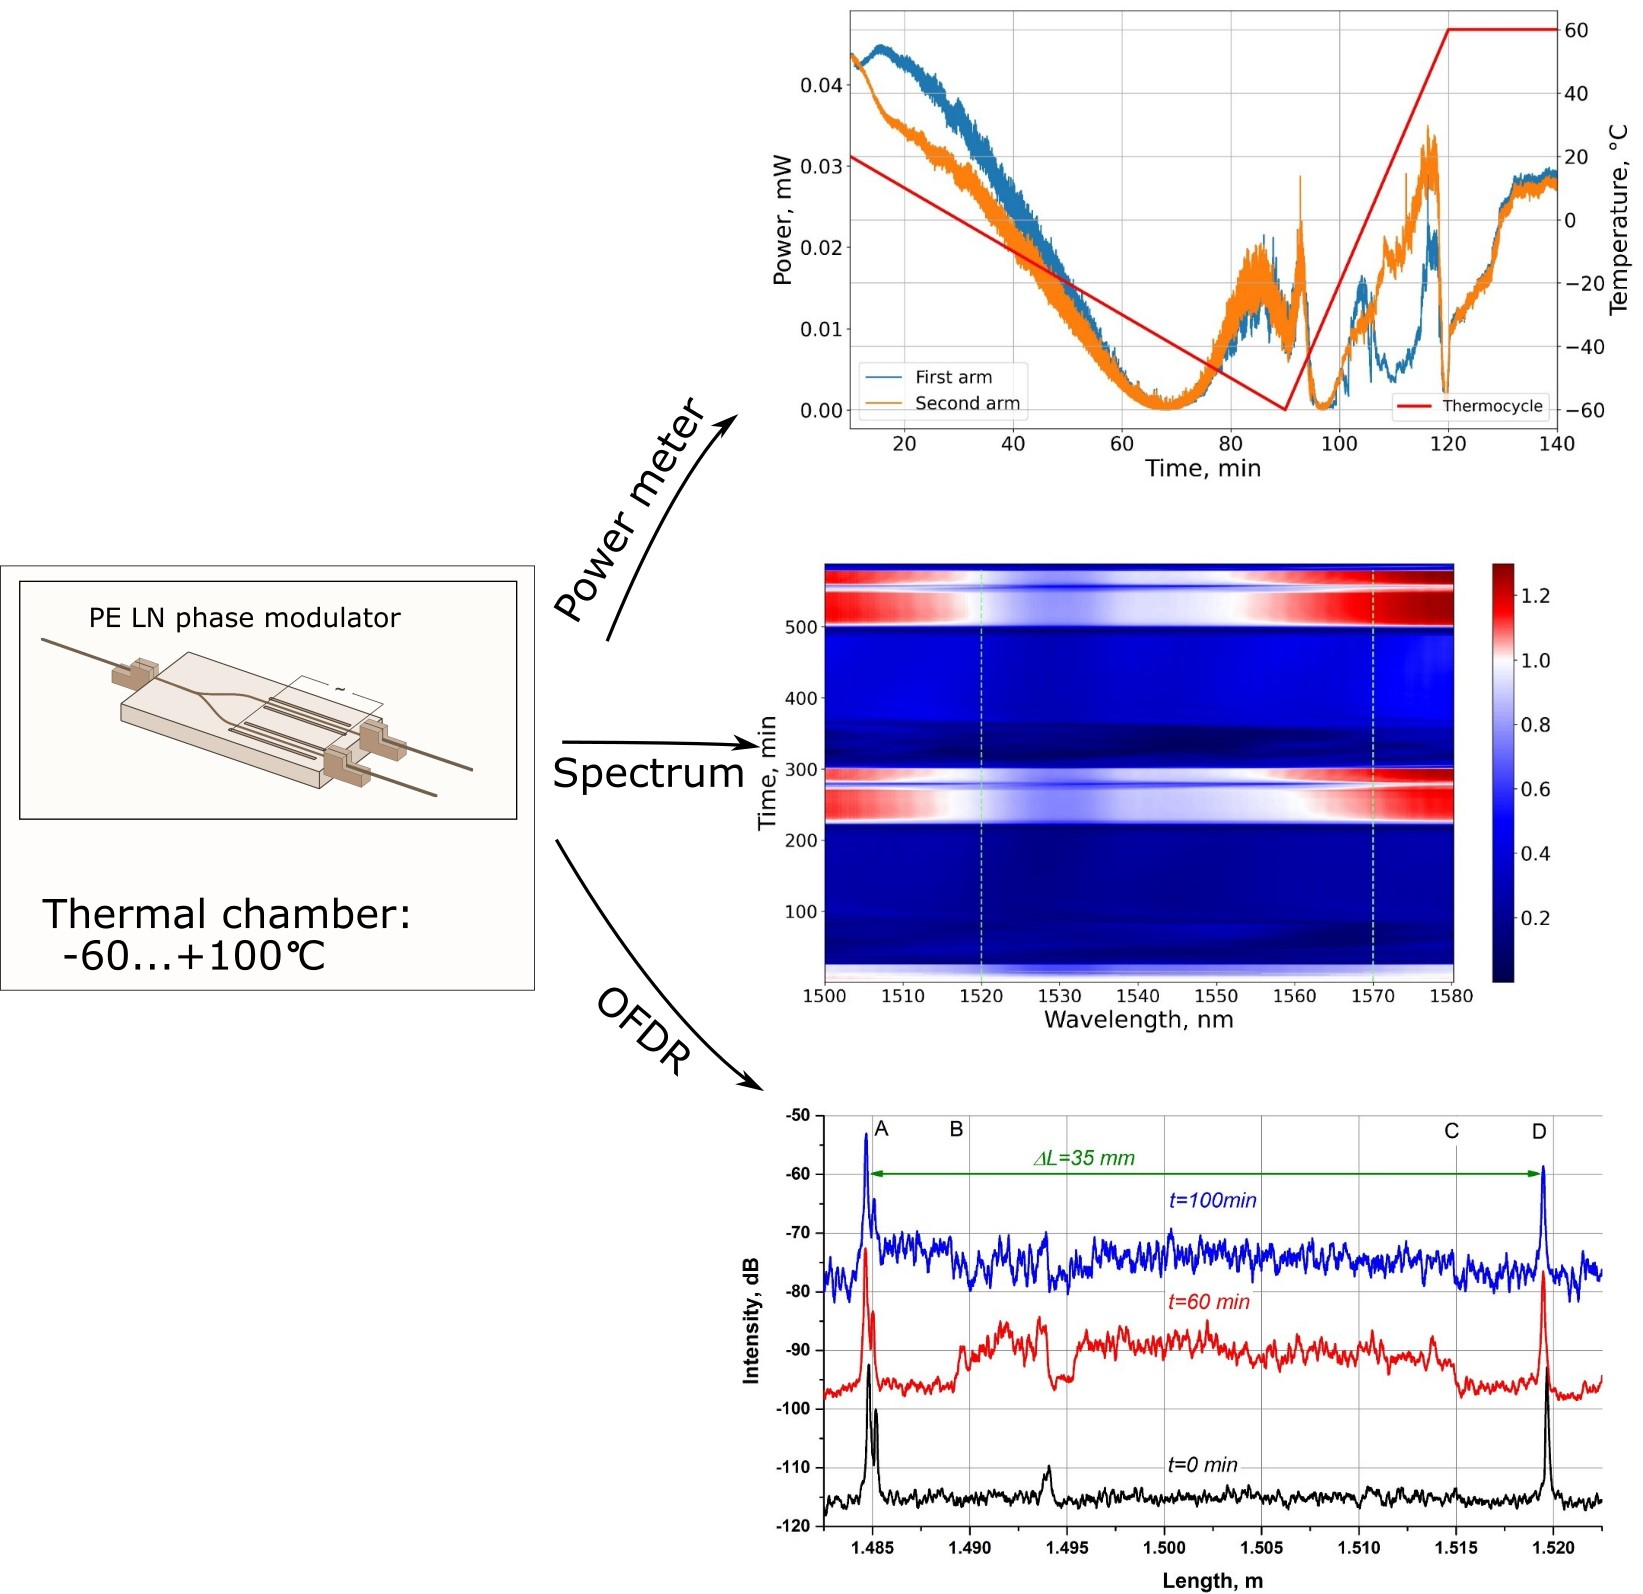
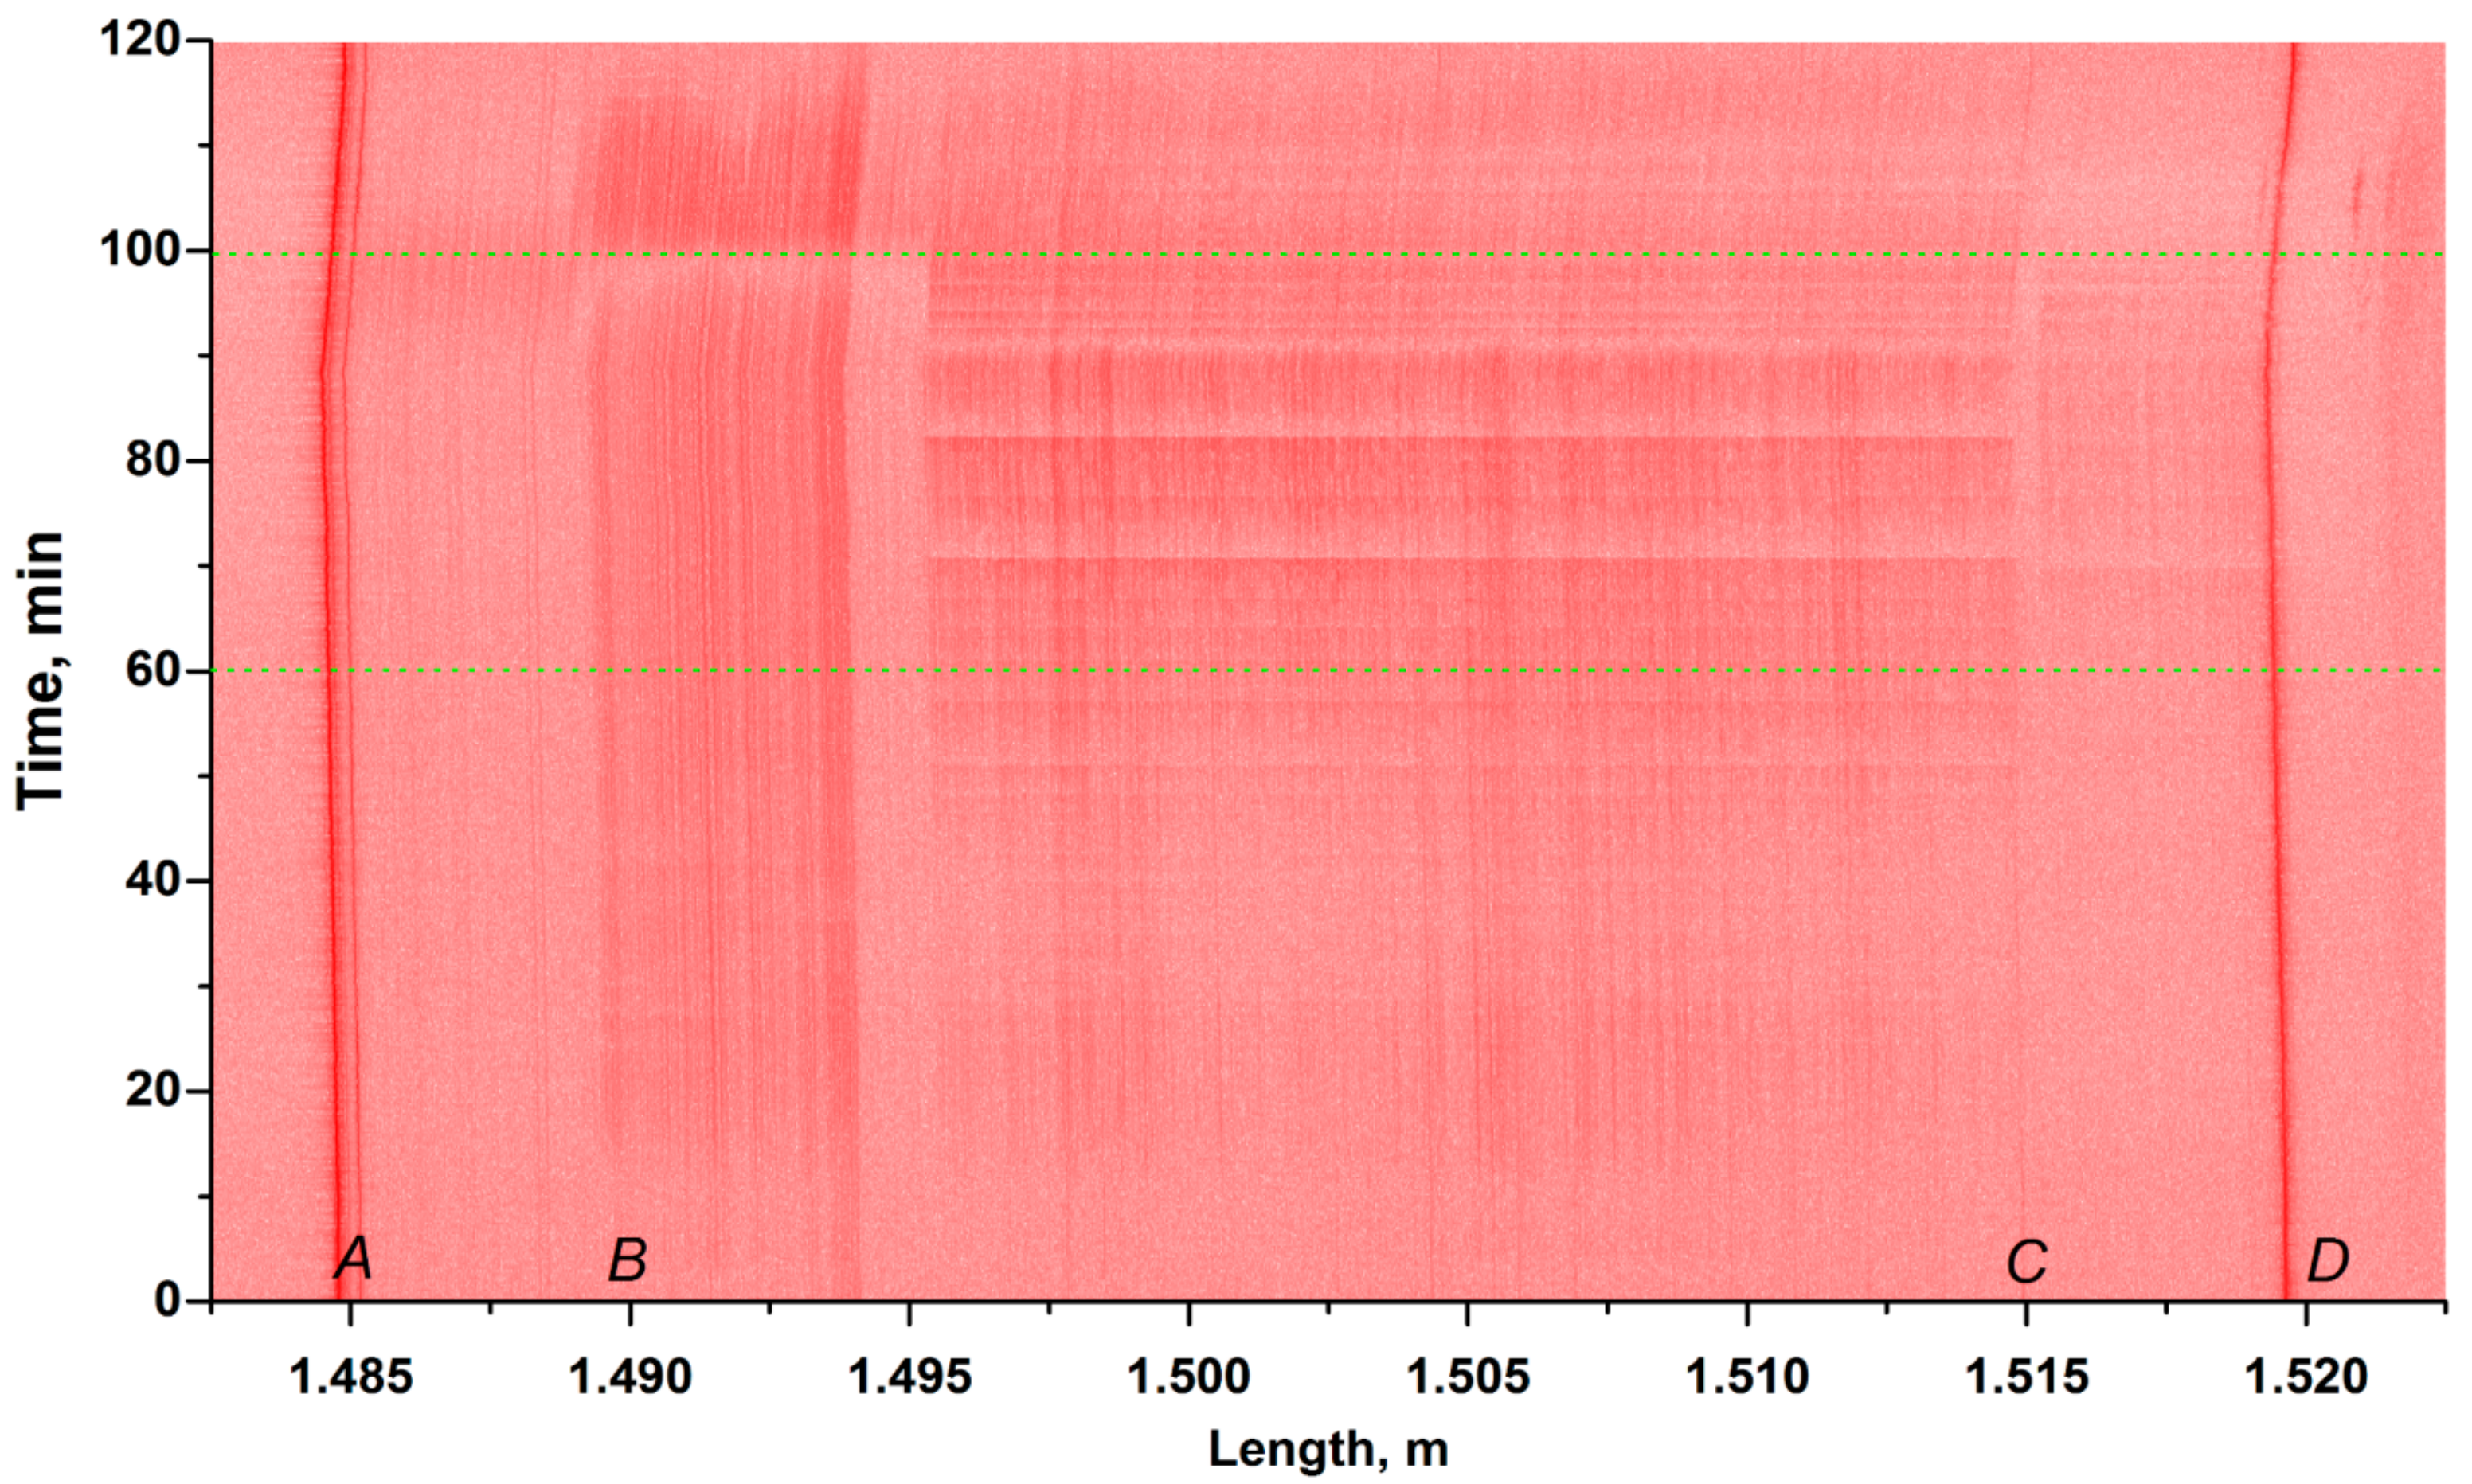
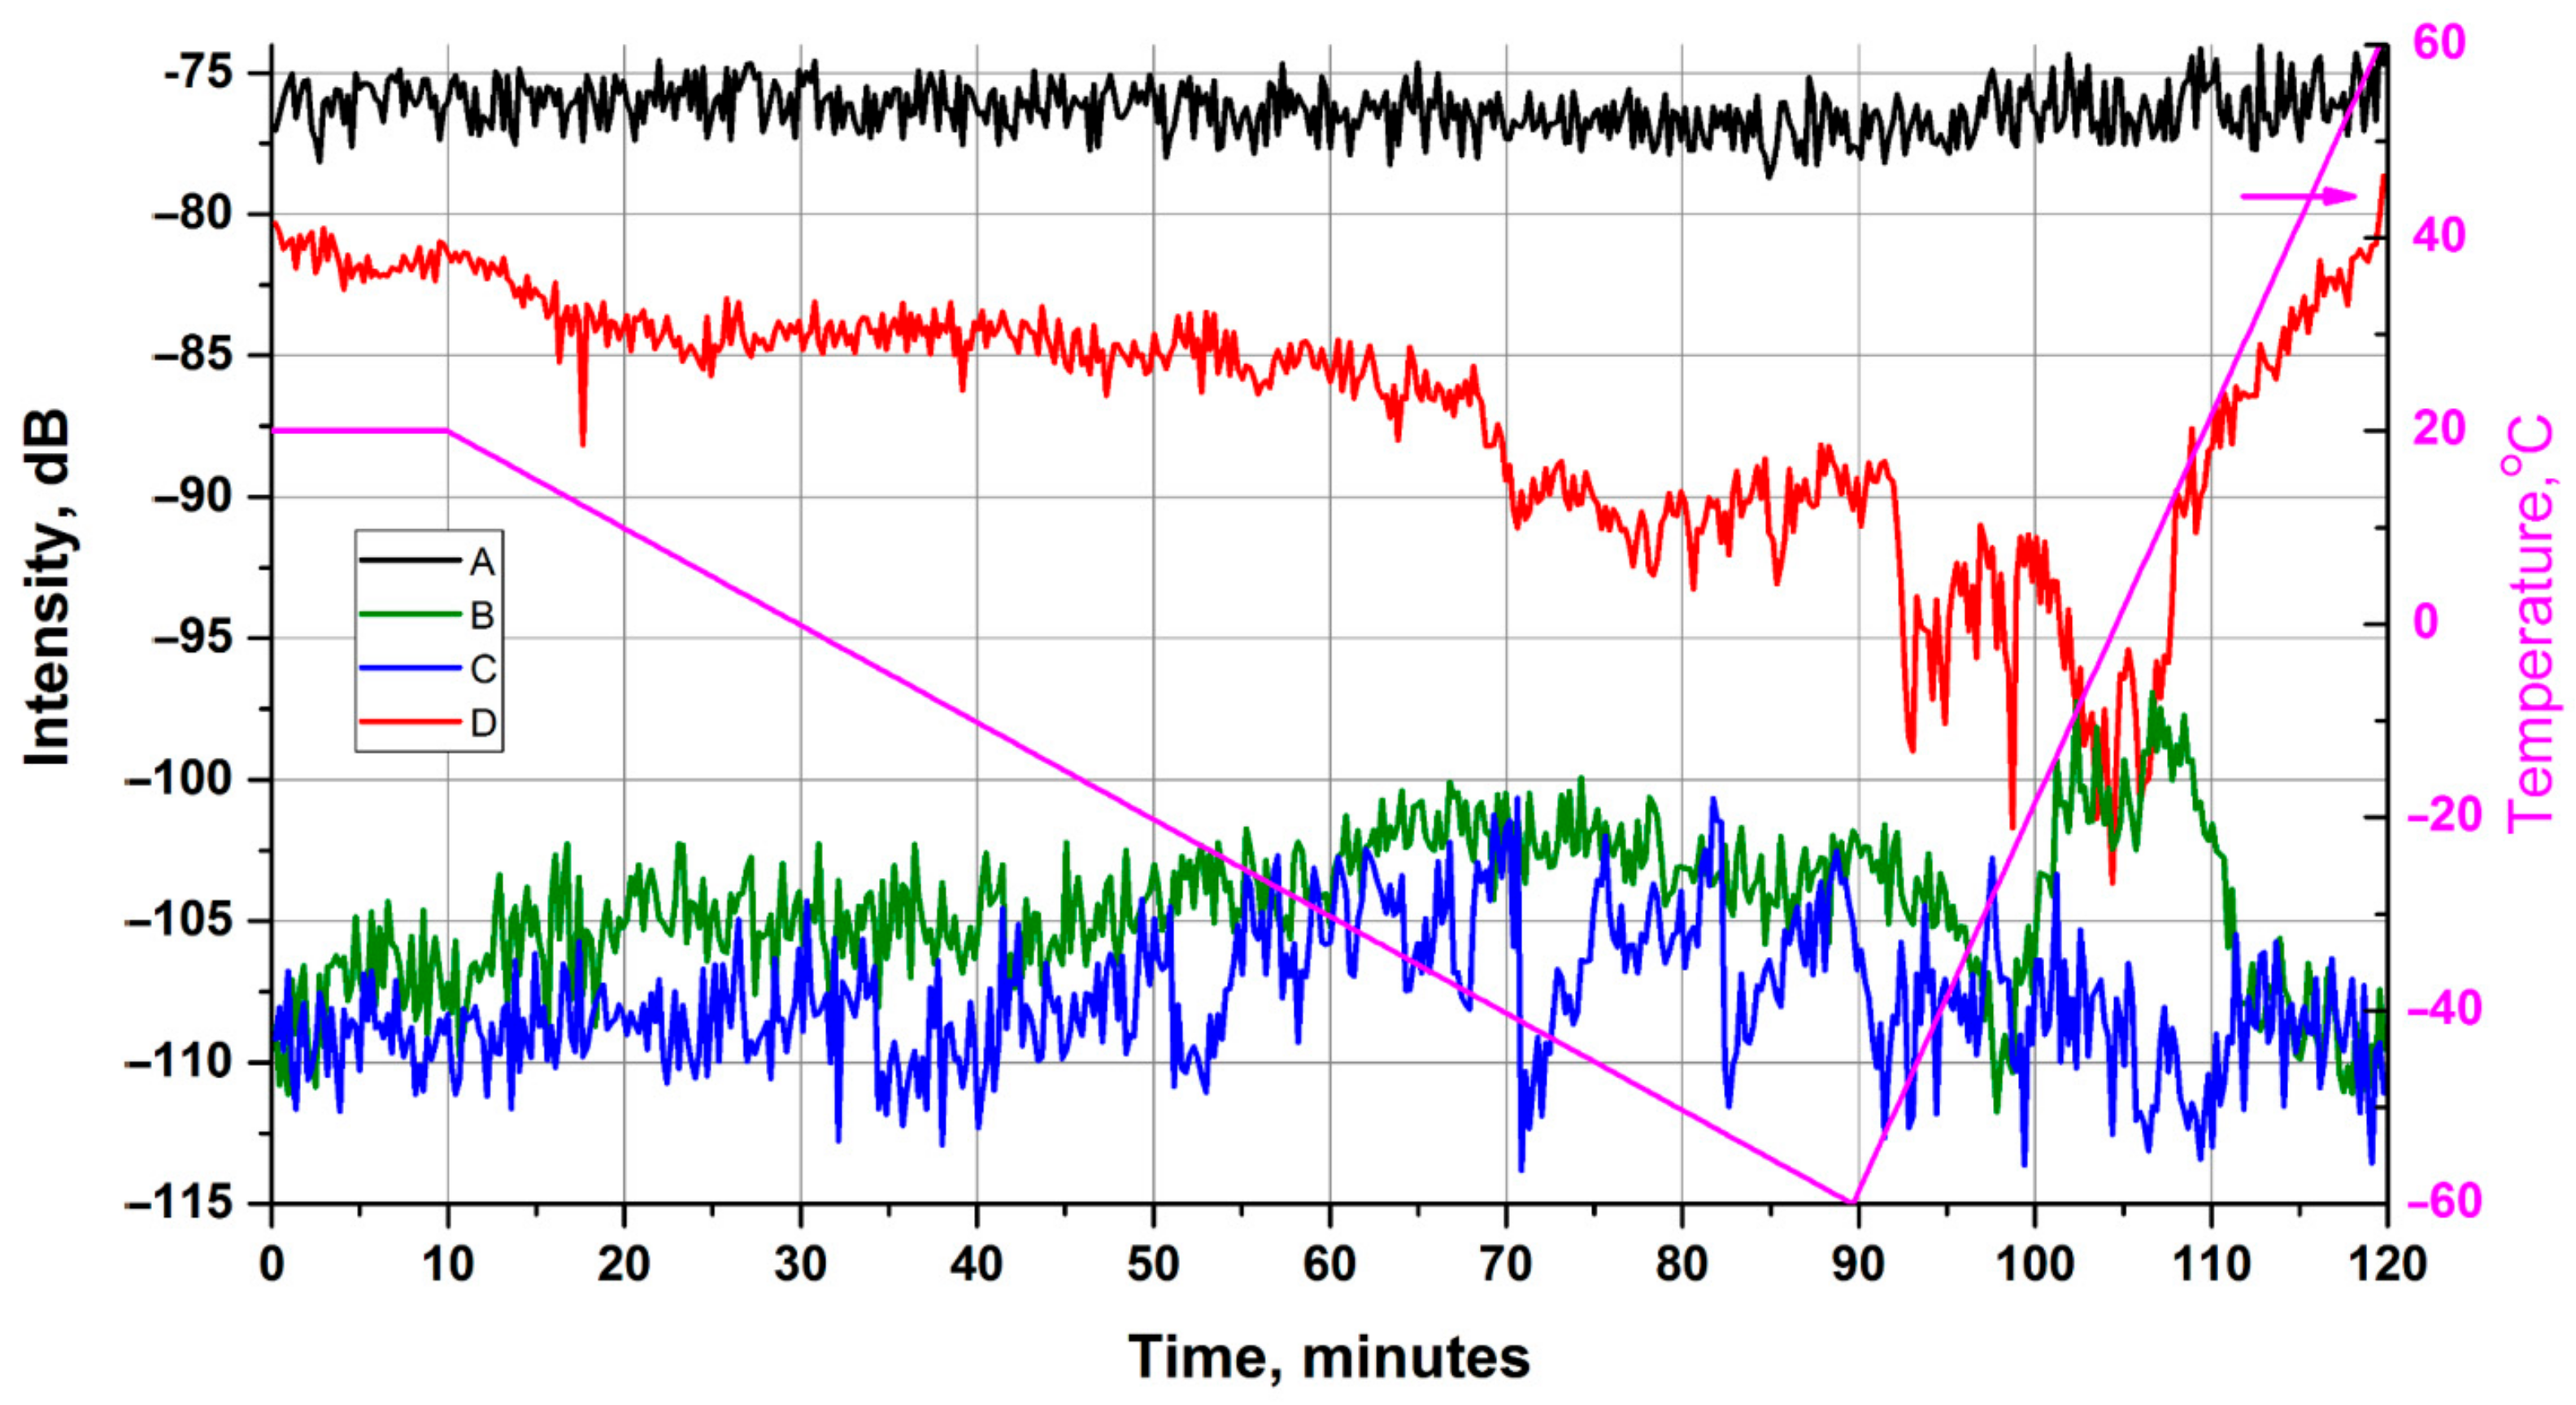
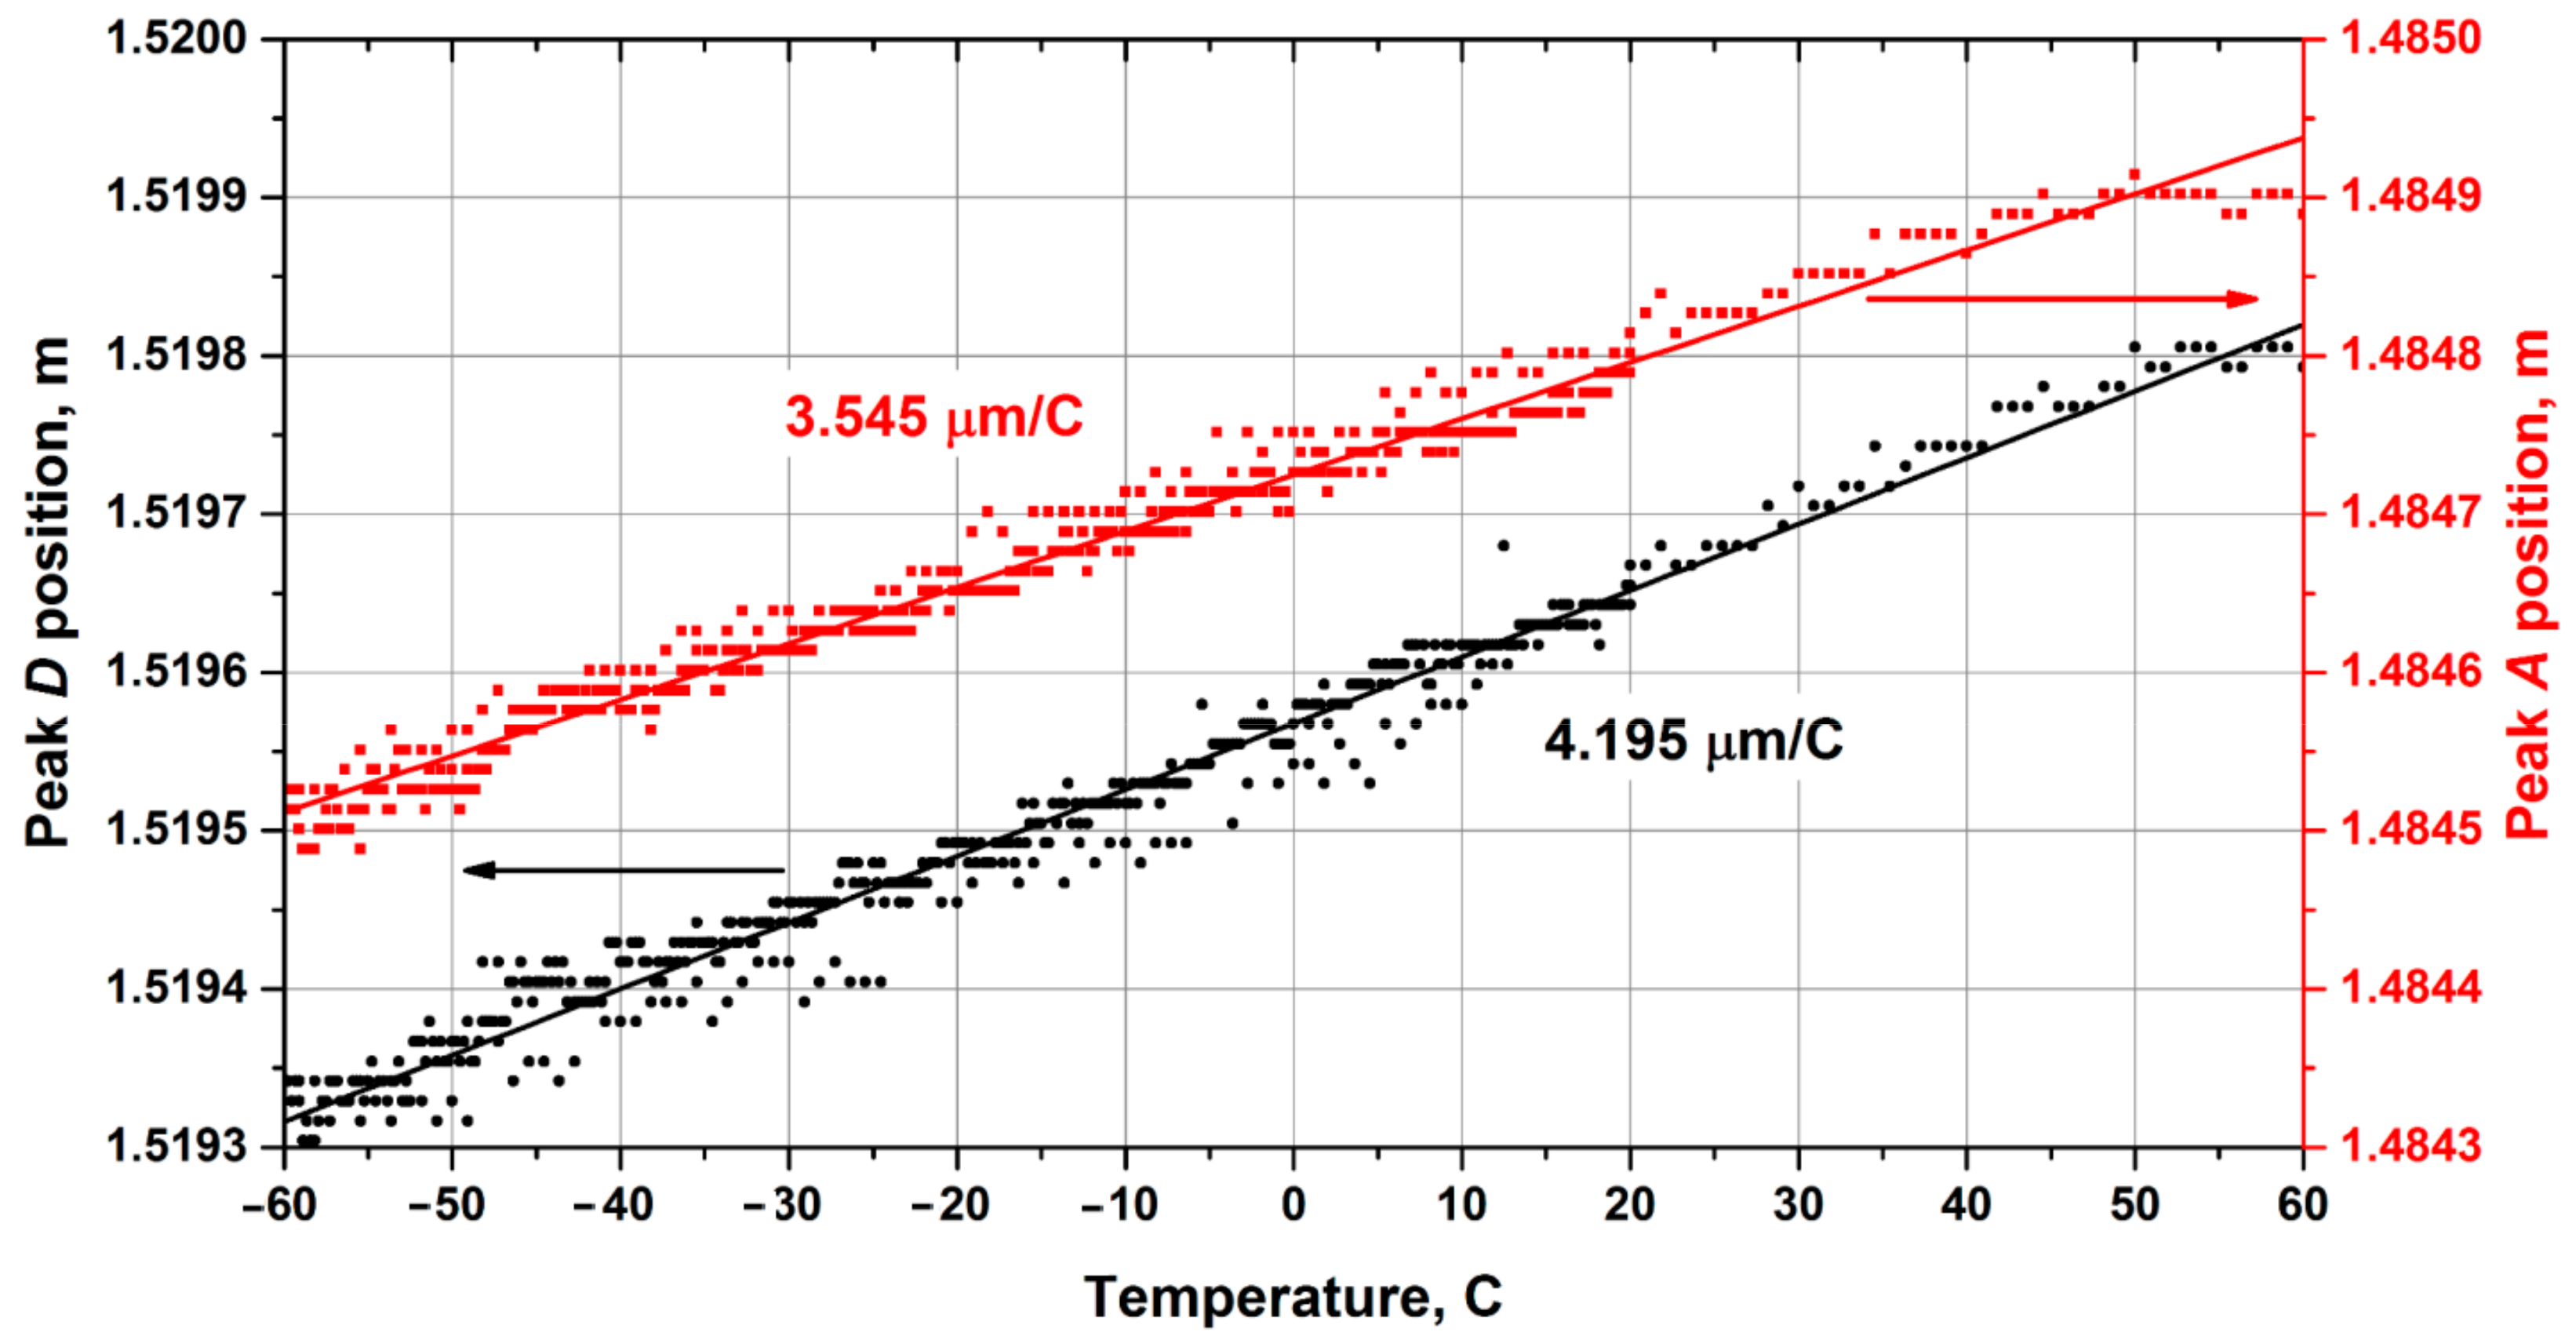
The input peak (A) corresponding to the transition from fiber to IOM. The magnitude of the peak has a relatively stable value at −90 dB and has no features. This behavior is because temperature changes do not affect the fiber feeding the IOM.
2.
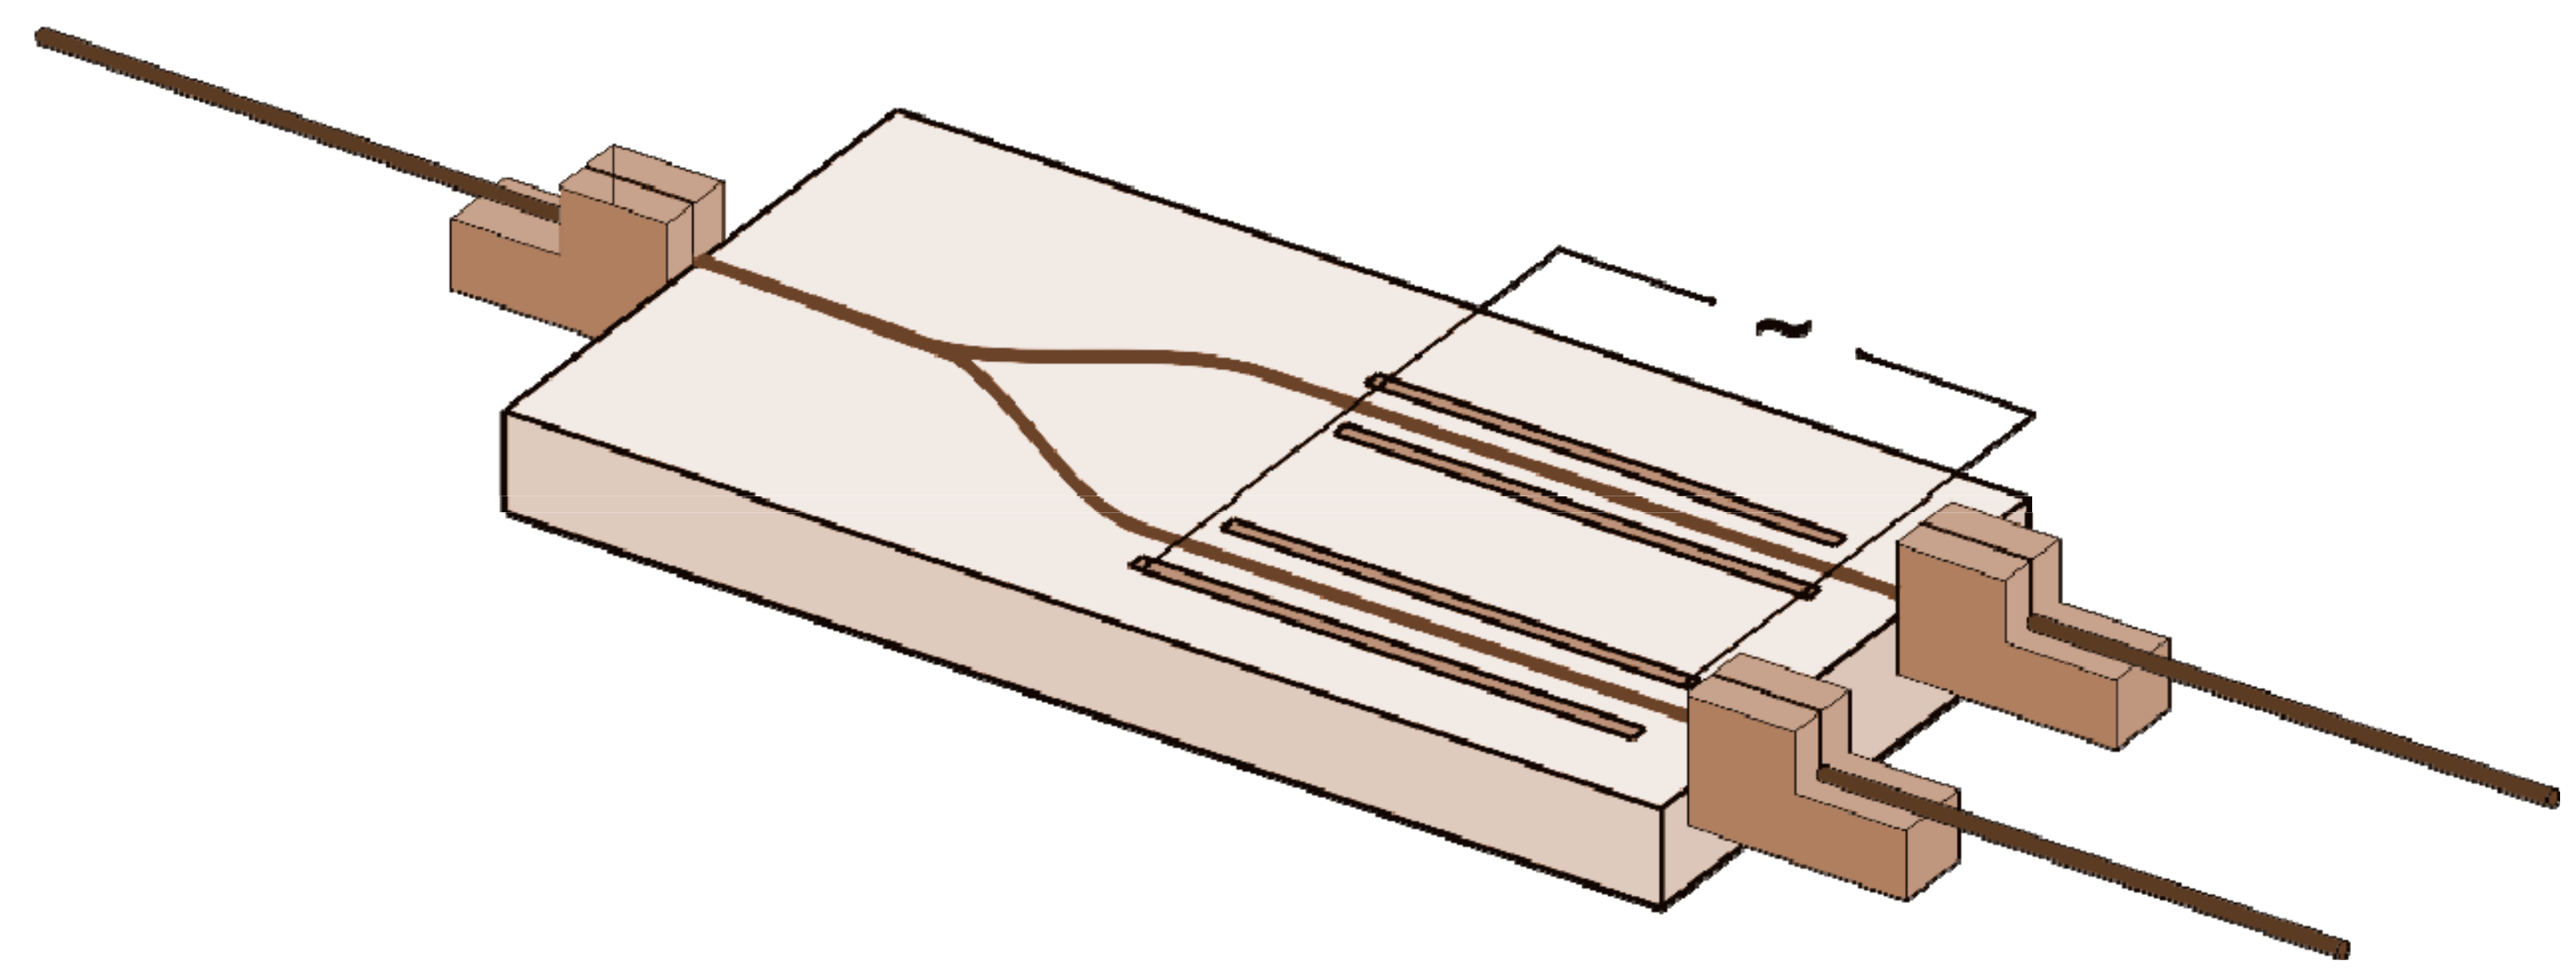
The input side of the IOM (B). During the period of uniform cooling from room temperature to −60 °C, the almost constant growth of the optical intensity in this location from −110 to 100 dB was observed. When changing cooling to heating, the dependence demonstrates at first a dip to −112 dB (at about 100 min) and immediately thereafter a rise to −97 dB (at about 110 min). It should be noted that topologically there are no significant events in the modulator in this location, such as channel splitting or a sharp drop in the refractive index. The length of the area with similar behavior is about 5 mm (Figure 8). We assume that the pyroelectric effect introduced the most remarkable surge of the refractive index at this location in this chip design. Further, the nature of the temperature behavior changes. The second area inside the IOM is about 20 mm and ends at the output side of the IOM.
3.
The output side of the chip (C). There is a topologically important point in this area, which is responsible for combining the channels. Previously, it was assumed that the pyroelectric effect could make the most significant changes in the waveguide properties of the chip precisely in this area. However, in both experiments conducted, the radiation intensity in this area has only a moderate correlation with the intensity in the input part of the chip and before the cooling is replaced by heating. During the period of sharp heating, the character of this curve does not change in both cases as well, which may indicate that the signal intensity in this area is not related to the pyroelectric effect. It should be noted, however, more intensive fluctuations of the signal (about 10 dB), the amplitude of which grows with cooling, and the character itself visually resemble a periodic one. This is quite clearly observed both on individual graphs and on the heat map. The authors cannot explain their nature now.
4.
The output peak (D) corresponds to the radiation output from the IOM into the optical fiber. It should be noted that the intensity of this peak has a solid and commensurate inverse relationship with the intensity of artifacts in the input part of the chip. At the start of intensive heating, the output peak significantly decreases in intensity, while the intensity in the assumed area of the pyroelectric effect grows just as sharply. That is, an anti-correlation is observed at line B and line D, especially between 100 and 110 min of experiment. This is explained by the fact that a significant portion of the radiation is scattered or reflected in this location and does not reach the output end of the IOM.
Based on the results obtained, it can be argued that significant losses occur in a particular location with a length of 5 mm (area C). That is, the effect of channeling suppression is not point-wise but distributed. At the same time, the losses are due to an increase in the backscattered signal in this area, which can be associated with a change in the refractive index. Most clearly, this increase occurs during rapid heating at sufficiently low temperatures.
Additionally, from Figure 9, we can notice the shift of all peaks during the thermal cycle. The analysis of the trace dynamics shows that all peaks translocate in proportion to the sample temperature, shifting to the right with increasing temperature and to the left with decreasing temperature. As can be seen from the trace diagrams, both prominent DUT peaks—both input and output shift as the temperature changes along the coordinate (Figure 11). It can be assumed that the principal shift of the coordinates of the peaks is due to a change in the refractive index of the light-feeding optical fiber, the length of which is much longer than the length of the modulator. Then, to study the processes occurring in the modulator waveguides, it is necessary to study the difference in coordinates of input and output peaks as a function of temperature. It is this difference that will characterize the thermo-optic effect and the linear thermal expansion of the crystal. It should be noted that, in this consideration, we neglect the minor effects due to the temperature gradient inside the modulator chip when it is heated unevenly. We are entitled to make such neglect due to the small volume and mass of the crystal compared to the volume of the thermal chamber, the relatively low heat capacity of lithium niobate, and the low rate of temperature change. When changing the modulator temperature, several phenomena simultaneously contribute to the shift of peak coordinates: a change in the crystal’s refractive index due to the thermo-optical effect Δlw and a change in the physical length of the crystal due to linear thermal expansion ΔlTE. Then Δlout − Δlin = Δlw + ΔlTE. Let us evaluate each of the above contributions for the temperature change ΔT = 120 °C. As indicated in [16], the coefficient of thermal expansion of LN for X- and Y-cuts depends little on the crystal composition and has insignificant changes in the temperature range from 220 to 553 K, which includes the range of temperature changes of the sample studied. For linear thermal expansion, we can use the relation ΔlTE = α·l·ΔT, where α is the coefficient of linear thermal expansion for a given direction, ΔT is the change in the crystal temperature. For the investigated crystal cut α = 13.4 × 10⁻⁶ 1/K [17], as a result, the change in physical length can be estimated as ΔlTE = α·l·ΔT = 61 µm. The change of optical path is 134 µm. The value of the average thermo-optical coefficient for the target temperature range is β = 3.35 × 10⁻⁵ 1/K for the extraordinary refractive index and the emission wavelength of 1523 nm [18,19]. The change in length associated with the thermo-optic effect can be calculated by the formula Δlw = l · Δn = l·(β·ΔT) = 152 µm. Thus, the total change in the optical path is 286 µm.
The experimental shift of peaks in the trace was associated with the sample temperature change (Figure 11) Δl = (4.195 − 3.545) · ΔT = 78 µm. The change in the optical path makes 171 µm.
The difference between the experimental results and calculation can be explained by shielding the waveguides of mobile charges from crystal lattice and decreasing of pyroelectric effect.

4. Conclusions

The influence of the pyroelectric effect on the characteristics of proton-exchange channel waveguides in lithium niobate has been studied using spectroscopic and distributed methods. It is confirmed that a rapid temperature change can lead to a sharp increase of optical losses in the channel waveguide up to 50 dB. The study results show that the suppression effect has no spectral selectivity in the wavelength range from 1530 to 1570 nm. Using the OFDR method, it is shown that during the suppression of channeling radiation, the reflection in the channel waveguide increases along almost its entire length, except for short segments near the ends of the chip. The data obtained confirm the validity of the proposed explanation for the waveguide ”off” effect, associated with the movement of the charged defects in the lattice of lithium niobate and the shielding of the waveguide relative to the surrounding crystal. The shift in the coordinates of the reflection peaks observed in the experiment, which does not coincide in magnitude with the calculated value, can also be explained by the fact that the waveguide and the surrounding crystal matrix do not change their refractive indices to the same degree under the action of the pyroelectric effect. The experiments were performed for six different IOMs. Three temperature cycles were performed for each IOM. The results were qualitatively reproduced for several IOMs as well as for different cycles. We hope to provide the more detailed studies with the commercial OFDR setups [20] as well as by using our own equipment to study the phase of the light near the area of waveguide ”switch off”.

Author Contributions

R.P. and I.L.—methodology, supervision; Y.K. and M.B.—experiment and discussion; D.S.—project administration. All authors have read and agreed to the published version of the manuscript.

Funding

The research regarding obtaining and analyzing of traces (Section 2.3) was done under the sponsorship of the Russian Foundation for Basic Research and the Perm region within the scientific project No. 19-48-590018 r_a; the study of samples spectral characteristics (Section 2.2) was performed within the state assignment No. AAAA-A19-119042590085-2.

Institutional Review Board Statement

Not applicable.

Informed Consent Statement

Informed consent was obtained from all subjects involved in the study.

Acknowledgments

We thank Claude D., the engineer of Photonics Lab PFRC UB RAS for his help in setting up the experiment and analyzing the results.

Conflicts of Interest

The authors declare no conflict of interest.

References

  1. Wooten, E.; Kissa, K.; Yi-Yan, A. A review of lithium niobate modulators for fiber-optic communications systems. Sel. Top. Quantum Electron. 2000, 6, 69–82. [Google Scholar] [CrossRef]
  2. Roberts, G.L.; Pittaluga, M.; Minder, M.; Lucamarini, M.; Dynes, J.F.; Yuan, Z.L.; Shields, A.J. Patterning-effect mitigating intensity modulator for secure decoy-state quantum key distribution. Opt. Lett. 2018, 43, 5110. [Google Scholar] [CrossRef] [PubMed]
  3. Liang, L.-Y.; Liang, J.-S.; Yao, Q.; Zheng, M.-Y.; Xie, X.-P.; Liu, H.; Zhang, Q.; Pan, J.-W. Compact all-fiber polarization-independent up-conversion single-photon detector. Opt. Commun. 2019, 441, 185–189. [Google Scholar] [CrossRef] [Green Version]
  4. Rahim, A.; Hermans, A.; Wohlfeil, B.; Petousi, D.; Kuyken, B.; Van Thourhout, D.; Baets, R. Taking silicon photonics modulators to a higher performance level: State-of-the-art and a review of new technologies. Adv. Photonics. 2021, 3, 024003. [Google Scholar] [CrossRef]
  5. Klamkin, J.; Zhao, H.; Song, B.; Liu, Y.; Isaac, B.; Pinna, S.; Sang, F.; Coldren, L. Indium Phosphide Photonic Integrated Circuits: Technology and Applications. In Proceedings of the 2018 IEEE BiCMOS and Compound Semiconductor Integrated Circuits and Technology Symposium (BCICTS), San Diego, CA, USA, 15–17 October 2018; pp. 8–13. [Google Scholar] [CrossRef]
  6. Xu, M.; He, M.; Zhang, H.; Jian, J.; Pan, Y.; Liu, X.; Chen, L.; Meng, X.; Chen, H.; Li, Z.; et al. High-performance coherent optical modulators based on thin-film lithium niobate platform. Nat. Commun. 2020, 11, 3911. [Google Scholar] [CrossRef] [PubMed]
  7. Wang, C.; Zhang, M.; Chen, X.; Bertrand, M.; Shams-Ansari, A.; Chandrasekhar, S.; Winzer, P.; Lončar, M. Integrated lithium niobate electro-optic modulators operating at CMOS-compatible voltages. Nature 2018, 562, 101–104. [Google Scholar] [CrossRef] [PubMed]
  8. Shang, K.; Lei, M.; Xiang, Q.; Na, Y.; Zhang, L. Tactical-grade interferometric fiber optic gyroscope based on an integrated optical chip. Opt. Commun. 2021, 485, 126729. [Google Scholar] [CrossRef]
  9. Liu, J.; Zhang, C.; Gao, F.; Song, J.; Xu, X.; Guo, Z. Method for improving the polarization extinction ratio of multifunction integrated optic circuits. Opt. Express. 2021, 29, 28096. [Google Scholar] [CrossRef]
  10. Rao, A.; Fathpour, S. Compact Lithium Niobate Electrooptic Modulators. IEEE J. Sel. Top. Quantum Electron. 2018, 24, 1–14. [Google Scholar] [CrossRef]
  11. Ponomarev, R.S.; Shevtsov, D.I.; Karnaushkin, P.V. “Shutdown” of the Proton Exchange Channel Waveguide in the Phase Modulator under the Influence of the Pyroelectric Effect. Appl. Sci. 2019, 9, 4585. [Google Scholar] [CrossRef] [Green Version]
  12. Integrated Optics; Tamir, T. (Ed.) Mir: Moscow, Russia, 1978; p. 344. [Google Scholar]
  13. Kostritskii, S.M.; Korkishko, Y.N.; Fedorov, V.A.; Yatsenko, A.V. Pyroelectric drift of integrated-optical LiNbO3 modulators. Ferroelectrics 2021, 574, 170–178. [Google Scholar] [CrossRef]
  14. MacDonald, R.I. Frequency domain optical reflectometer. Appl. Opt. 1981, 20, 1840. [Google Scholar] [CrossRef] [PubMed]
  15. Zhao, M.; Tu, G.; Benli Yu, B.; Lin, J. The analysis and comparison of cross-correlation and phase demodulation methods in an OFDR system for strain/temperature sensing. In Proceedings of the Advanced Sensor Systems and Applications VIII, International Society for Optics and Photonics, SPIE/COS Photonics Asia, Beijing, China, 11–13 October 2018; Volume 10821, p. 1082125. [Google Scholar] [CrossRef]
  16. Wong, K.K. Properties of Lithium Niobate; The Institution of Engineering and Technology: London, UK, 2002; 432p. [Google Scholar]
  17. Pignatiello, F.; De Rosa, M.; Ferraro, P.; Grilli, S.; De Natale, P.; Arie, A.; De Nicola, S. Measurement of the thermal expansion coefficients of ferroelectric crystals by a moiré interferometer. Opt. Commun. 2007, 277, 14–18. [Google Scholar] [CrossRef]
  18. Moretti, L.; Iodice, M.; Della Corte, F.G.; Rendina, I. Temperature dependence of the thermo-optic coefficient of lithium niobate, from 300 to 515 K in the visible and infrared regions. J. Appl. Phys. 2005, 98, 036101. [Google Scholar] [CrossRef]
  19. Fieberg, S.; Streit, L.; Kiessling, J.; Becker, P.; Bohaty, L.; Kühnemann, F.; Buse, K. Lithium niobate, San Francisco, California, United States. In Nonlinear Frequency Generation and Conversion: Materials, Devices, and Applications XIV; Vodopyanov, K.L., Ed.; International Society for Optics and Photonics: Bellingham, WA, USA, 2015; Volume 9347, p. 93471C. [Google Scholar] [CrossRef]
  20. Froggatt, M.E.; Gifford, D.K.; Kreger, S.; Wolfe, M.; Soller, B.J. Characterization of Polarization-Maintaining Fiber Using High-Sensitivity Optical-Frequency-Domain Reflectometry. J. Light. Technol. 2006, 24, 4149–4154. [Google Scholar] [CrossRef]
Figure 1. Schematic diagram of studied sample.
Applsci 11 09853 g001
Figure 2. The schematic diagram for measuring IOM transmission characteristics (where DAQ—data acquisition unit; OSA—optical spectrum analyzer; PD1 and PD2—photodetectors; ASE—amplified spontaneous emission source; DUT—device under test; T—temperature; t—time).
Applsci 11 09853 g002
Figure 3. Dependence of the output power in the two channels (orange and blue curves) of the IOM and the sample temperature on time.
Applsci 11 09853 g003
Figure 4. Transmitted radiation spectra for the IOM in the mode of regular operation and the radiation channeling suppression.
Applsci 11 09853 g004
Figure 5. Temporal dynamics of the output spectrum normalized to the spectrum at the initial moment.
Applsci 11 09853 g005
Figure 6. Temporal dependence of the normalized optical losses at wavelength of 1530 nm at different temperatures.
Applsci 11 09853 g006
Figure 7. Reflectometric characteristics measuring scheme. (where DAQ—data acquisition unit; OFDR—optical frequency domain reflectometer; PS-PD—polarization-sensitive photodetectors; WL-S LD—wavelength-sweeping laser diode; DUT—device under test; λ—radiation wavelength; t—time).
Applsci 11 09853 g007
Figure 8. Typical trace of the IOM studied at different moments of the thermal cycle. Traces are shifted relative to each other by 20 dB.
Applsci 11 09853 g008
Figure 9. The temperature dynamics of the reflectograms. The locations A,B,C,D correspond to the key positions of IOM which are discussed below.
Applsci 11 09853 g009
Figure 10. Temperature dynamics of the intensity in the IOM different areas. Locations A,B,C,D are presented at Figure 9.
Applsci 11 09853 g010
Figure 11. Displacement of coordinates of the beginning (A) and the end (D) of the IOM peaks. Locations A,D are presented at Figure 9.
Applsci 11 09853 g011
Publisher’s Note: MDPI stays neutral with regard to jurisdictional claims in published maps and institutional affiliations.

