
Energetic Valorization of Solid Wastes from the Alcoholic Beverage Production Industry: Distilled Gin Spent Botanicals and Brewers’ Spent Grains


Abstract
:Featured Application
Abstract
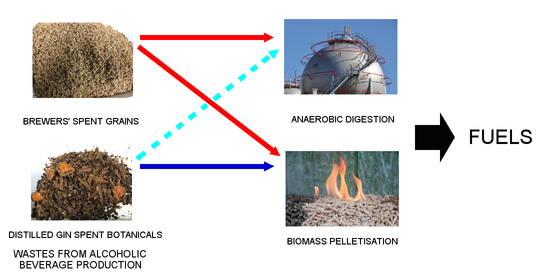
1. Introduction
2. Materials and Methods
2.1. Substrates
2.2. Inoculum and Conductive Material
2.3. Experimental Set-Up
2.3.1. BMP Experiments
2.3.2. Box Digesters
2.4. Analytical Techniques
2.5. Data Analysis
3. Results and Discussion
3.1. BMP Tests
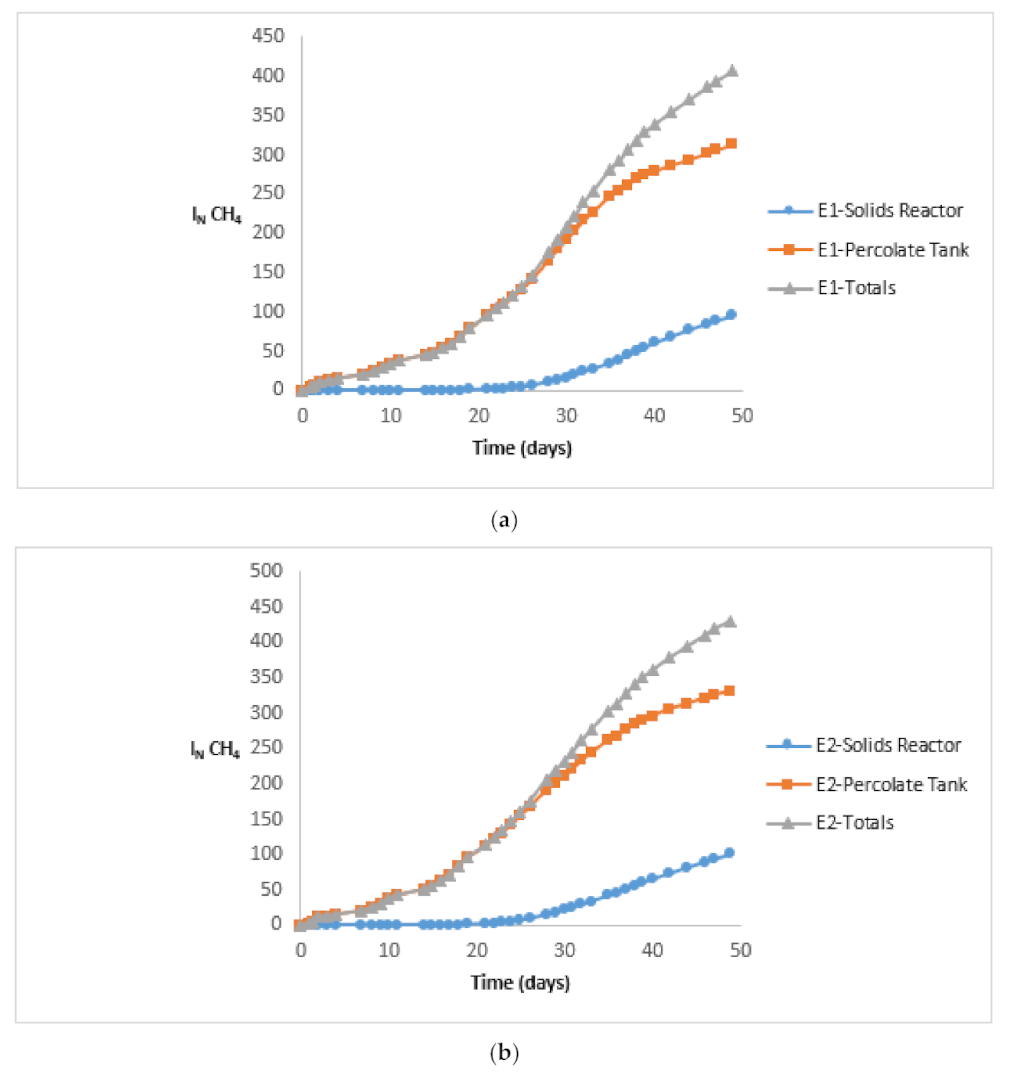
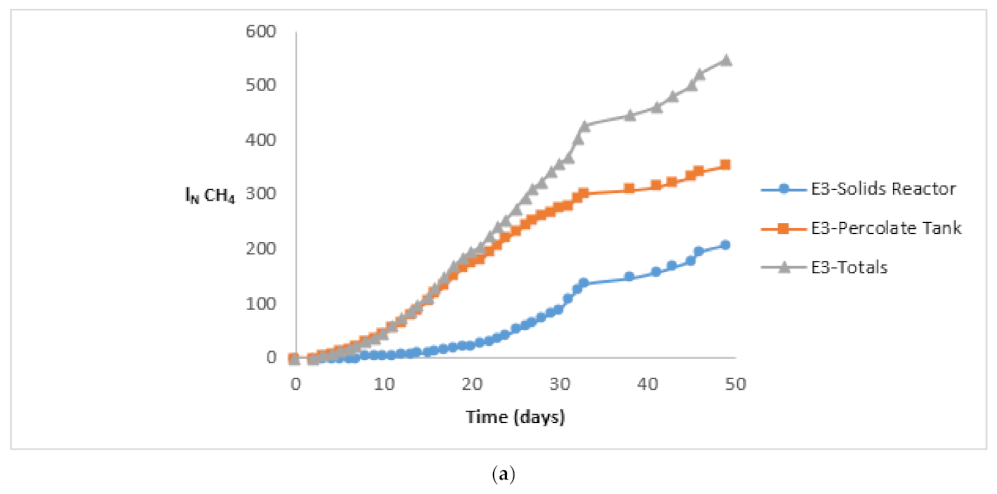
3.2. Box-Type Digester Assays
3.3. Calorific Value
3.4. Discussion
4. Conclusions
Author Contributions
Funding
Institutional Review Board Statement
Informed Consent Statement
Acknowledgments
Conflicts of Interest
Note from the Authors
References
- Fillaudeau, L.; Blanpain-Avet, P.; Daufin, G. Water, waste water and waste management in brewing industries. J. Clean. Prod. 2006, 14, 463–471. [Google Scholar] [CrossRef]
- Krishnamoorthy, S.; Premalatha, M.; Vijayasekaran, M. Characterization of distillery waste water—An approach to retrofit existing effluent treatment plant operation with phycoremediation. J. Clean. Prod. 2017, 148, 735–750. [Google Scholar] [CrossRef]
- Janhom, T.; Wattanachira, S.; Pavasant, P. Characterization of brewery waste water with spectrofluorometry analysis. J. Environ. Manag. 2009, 90, 1184–1190. [Google Scholar] [CrossRef]
- Cavert, W. The Environmental Policy of Charles I: Coal Smoke and the English Monarchy, 1624–1640. J. Br. Stud. 2014, 53, 310–333. [Google Scholar] [CrossRef]
- Environmental Protection Authority of the Government of South Australia. EPA Guidelines for Wineries and Distilleries [PDF]. Issued January 2004, Revised April 2017. ISBN 1-876562-66-8. Available online: https://www.epa.sa.gov.au/files/4771373_guide_wineries.pdf. (accessed on 10 August 2021).
- Agriculture and Resource Management Council of Australia and New Zealand and the Australian and New Zealand Environment and Conservation Council. Effluent Management Guidelines for Australian Wineries and Distilleries [PDF]. 1998. Available online: https://www.waterquality.gov.au/sites/default/files/documents/pub6-effluent-wineries-distilleries.pdf. (accessed on 10 August 2021).
- NetRegs UK. GPP 29 Microbreweries and Distilleries Guidance for Small Scale Breweries and Distilleries (March2019). Available online: https://www.netregs.org.uk/media/1687/gpp29-micro-breweries-and-distilleries.pdf (accessed on 10 August 2021).
- Olajire, A.A. The brewing industry and environmental challenges. J. Clean. Prod. 2020, 256, 102817. [Google Scholar] [CrossRef]
- Kubule, A.; Zogla, L.; Ikaunieks, J.; Rosa, M. Highlights on energy efficiency improvements: A case of a small brewery. J. Clean. Prod. 2016, 138, 275–286. [Google Scholar] [CrossRef]
- Sturm, B.; Butcher, M.; Wang, Y.; Huang, Y.; Roskilly, T. The feasibility of the sustainable energy supply from bio wastes for a small scale brewery—A case study. Appl. Therm. Eng. 2012, 39, 45–52. [Google Scholar] [CrossRef]
- Muster-Slawitsch, B.; Weiss, W.; Schnitzer, H.; Brunner, C. The green brewery concept—Energy efficiency and the use of renewable energy sources in breweries. Appl. Therm. Eng. 2011, 31, 2123–2134. [Google Scholar] [CrossRef] [Green Version]
- O’Shea, R.; Wall, D.M.; McDonagh, S.; Murphy, J.D. The potential of power to gas to provide green gas utilising existing CO2 sources from industries, distilleries and waste water treatment facilities. Renew. Energy 2017, 114, 1090–1100. [Google Scholar] [CrossRef]
- Skornia, K.; Safferman, S.I.; Rodriguez-Gonzalez, L.; Ergas, S.J. Treatment of winery wastewater using bench-scale columns simulating vertical flow constructed wetlands with adsorption media. Appl. Sci. 2020, 10, 1063. [Google Scholar] [CrossRef] [Green Version]
- Toscano, G.; Riva, G.; Duca, D.; Foppa Pedrretti, E.; Corinaldesi, F.; Rossini, G. Analysis of the characteristics of the residues of the wine production chain finalized to their industrial and energy recovery. Biomass Bioenergy 2013, 55, 260–267. [Google Scholar] [CrossRef]
- Da Ros, C.; Cavinato, C.; Bolzonella, D.; Pavan, P. Renewable energy from thermophilic anaerobic digestion of winery residue: Preliminary evidence from batch and continuous lab-scale trials. Biomass Bioenergy 2016, 91, 150–159. [Google Scholar] [CrossRef]
- Goodwin, J.A.S.; Stuart, J.B. Anaerobic digestion of malt whisky distillery pot ale using upflow anaerobic sludge blanket reactors. Bioresour. Technol. 1994, 49, 75–81. [Google Scholar] [CrossRef]
- Goodwin, J.A.S.; Finlayson, J.M.; Low, E.W. A further study of the anaerobic biotreatment of malt whisky distillery pot ale using an UASB system. Bioresour. Technol. 2001, 78, 155–160. [Google Scholar] [CrossRef]
- Buitrón, G.; Kumar, G.; Martinez-Arce, A.; Moreno, G. Hydrogen and methane production via a two-stage processes (H2-SBR + CH4-UASB) using tequila vinasses. Int. J. Hydrogen Energy 2014, 39, 19249–19255. [Google Scholar] [CrossRef]
- Espinoza-Escalante, F.M.; Pelayo-Ortíz, C.; Navarro-Corona, J.; González-García, Y.; Bories, A.; Gutiérrez-Pulido, H. Anaerobic digestion of the vinasses from the fermentation of Agave tequilana Weber to tequila: The effect of pH, temperature and hydraulic retention time on the production of hydrogen and methane. Biomass Bioenergy 2009, 33, 14–20. [Google Scholar] [CrossRef]
- Aylott, R.I. Vodka, Gin and Other Flavored Spirits. In Fermented Beverage Production, 2nd ed.; Lea, A.G.H., Piggott, J.R., Eds.; Springer: Boston, MA, USA, 2003; pp. 289–308. ISBN 978-0-306-47706-5. [Google Scholar] [CrossRef]
- EUR-LEX, Official Website of European Union Law. Available online: https://eur-lex.europa.eu/legal-content/EN/TXT/?qid=1556781080548&uri=CELEX:32008R0110. (accessed on 10 August 2021).
- Montes, J.A.; Leivas, R.; Martínez-Prieto, D.; Rico, C. Biogas production from the liquid waste of distilled gin production: Optimization of UASB reactor performance with increasing organic loading rate for co-digestion with swine wastewater. Bioresour. Technol. 2019, 274, 43–47. [Google Scholar] [CrossRef]
- Valero, D.; Alzate-Gaviria, L.; Montes, J.A.; Rico, C. Influence of a Conductive Material and Different Anaerobic Inocula on Biochemical Methane Potential of Substrates from Alcoholic Beverage Production. Waste Biomass Valoriz. 2020, 11, 5957–5964. [Google Scholar] [CrossRef]
- Rico, C.; Montes, J.A.; Lobo, A. Dry batch anaerobic digestion of food waste in a box-type reactor system: Inoculum preparation and reactor performance. J. Clean. Prod. 2020, 251, 119751. [Google Scholar] [CrossRef]
- Valero, D.; Montes, J.A.; Rico, J.L.; Rico, C. Influence of headspace pressure on methane production in Biochemical Methane Potential (BMP) tests. Waste Manag. 2016, 48, 193–198. [Google Scholar] [CrossRef] [Green Version]
- Holliger, C.; Alves, M.; Andrade, D.; Angelidaki, I.; Astals, S.; Baier, U.; Bougrier, C.; Buffiere, P.; Carballa, M.; DeWilde, V.; et al. Towards a standardization of biomethane potential tests. Water Sci. Technol. 2016, 74, 2515–2522. [Google Scholar] [CrossRef]
- Sežun, M.; Grilc, V.; Zupančič, G.D.; Logar, R.M. Anaerobic Digestion of Brewery Spent Grain in a Semi-Continuous Bioreactor: Inhibition by Phenolic Degradation Products. Acta Chim. Slov. 2011, 58, 158–166. Available online: https://scholar.google.com/scholar_lookup?title=Anaerobic%20digestion%20of%20brewery%20spent%20grain%20in%20a%20semi-continuous%20bioreactor%3A%20inhibition%20by%20phenolic%20degradation%20products&publication_year=2011&author=M.%20Se%C5%BEun&author=V.%20Grilc&author=G.D.%20Zupan%C4%8Di%C4%8D&author=R.M.%20Logar. (accessed on 10 August 2021). [PubMed]
- Montes, J.A.; Rico, C. Biogas Potential of Wastes and By-Products of the Alcoholic Beverage Production Industries in the Spanish Region of Cantabria. Appl. Sci. 2020, 10, 7481. [Google Scholar] [CrossRef]
- Klopfenstein, T.J.; Erickson, G.E.; Bremer, V.R. BOARD-INVITED REVIEW: Use of distillers by-products in the beef cattle feeding industry. J. Anim. Sci. 2008, 86, 1223–1231. [Google Scholar] [CrossRef] [PubMed]
- Stein, H.H.; Shurson, G.C. Board-invited review: The use and application of distillers dried grains with solubles in swine diets. J. Anim. Sci. 2009, 87, 1292–1303. [Google Scholar] [CrossRef] [PubMed] [Green Version]
- Lynch, K.M.; Steffen, E.J.; Arendt, E.K. Brewers’ spent grain: A review with an emphasis on food and health. J. Inst. Brew. 2016, 122, 553–568. [Google Scholar] [CrossRef]
- Gonçalves, I.C.; Fonseca, A.; Morão, A.M.; Pinheiro, H.M.; Duarte, A.P.; Ferra, M.I.A. Evaluation of anaerobic co-digestion of spent brewery grains and an azo dye. Renew. Energy 2015, 74, 489–496. [Google Scholar] [CrossRef]
- Weger, A.; Jung, R.; Stenzel, F.; Hornung, A. Optimized Energetic Usage of Brewers’ Spent Grains. Chem. Eng. Technol. 2017, 40, 306–312. [Google Scholar] [CrossRef]
- Wang, T.-T.; Wang, S.-P.; Zhong, X.-Z.; Sun, Z.-Y.; Huang, Y.-L.; Tan, L.; Tang, Y.-Q.; Kida, K. Converting digested residue eluted from dry anaerobic digestion of distilled grain waste into value-added fertilizer by aerobic composting. J. Clean. Prod. 2017, 166, 530–536. [Google Scholar] [CrossRef]
- Angioni, A.; Barra, A.; Russo, M.T.; Coroneo, V.; Dessí, S.; Cabras, P. Chemical composition of the essential oils of Juniperus from ripe and unripe berries and leaves and their antimicrobial activity. J. Agric. Food Chem. 2003, 51, 3073–3078. [Google Scholar] [CrossRef]
- Pepeljnjak, S.; Kosalec, I.; Kalodera, Z.; Blažević, N. Antimicrobial activity of juniper berry essential oil (Juniperus communis L., Cupressaceae). Acta Pharm. 2005, 55, 417–422. [Google Scholar] [PubMed]
- Joshi, R.K. Chapter 21—Angelica (Angelica glauca and A. archangelica) oils. In Essential Oils in Food Preservation, Flavor and Safety; Preedy, V.R., Ed.; Academic Press: London, UK, 2016; pp. 203–208. ISBN 9780124166417. [Google Scholar]
- Hersch-Martínez, P.; Leaños-Miranda, B.E.; Solórzano-Santos, F. Antibacterial effects of commercial essential oils over locally prevalent pathogenic strains in Mexico. Fitoterapia 2005, 76, 453–457. [Google Scholar] [CrossRef]
- Harada, H.; Uemura, S.; Chen, A.; Jayadevan, J. Anaerobic treatment of a recalcitrant distillery wastewater by a thermophilic UASB reactor. Bioresour. Technol. 1996, 55, 215–221. [Google Scholar] [CrossRef]
- Panjičko, M.; Zupančič, G.D.; Fanedl, L.; Marinšek Logar, R.; Tišma, M.; Zelić, B. Biogas production from brewery spent grain as a mono-substrate in a two-stage process composed of solid-state anaerobic digestion and granular biomass reactors. J. Clean. Prod. 2017, 166, 519–529. [Google Scholar] [CrossRef]
- Forest Research UK 2021. Typical Calorific Values of Fuels. Available online: https://www.forestresearch.gov.uk/tools-and-resources/fthr/biomass-energy-resources/reference-biomass/facts-figures/typical-calorific-values-of-fuels/ (accessed on 10 August 2021).
- Gupta, G.K.; Mondal, M.K. Chapter 15—Bioenergy generation from agricultural wastes and enrichment of end products. In Refining Biomass Residues for Sustainable Energy and Bioproducts, 1st ed.; Kumar, R.P., Gnansounou, E., Raman, J.K., Baskar, G., Eds.; Academic Press: London, UK, 2020; pp. 337–356. ISBN 9780128189962. [Google Scholar] [CrossRef]
- Constantinescu, M.; Bucura, F.; Ionete, E.I.; Ion-Ebrasu, D.; Sandru, C.; Zaharioiu, A.; Marin, F.; Miricioiu, M.G.; Niculescu, V.C.; Oancea, S.; et al. From Plastic to Fuel—New Challenges. Mater. Plast. 2019, 56, 721–729. [Google Scholar] [CrossRef]
- Constantinescu, M.; Bucura, F.; Ionete, R.; Niculescu, V.; Ionete, E.I.; Zaharioiu, A.; Oancea, S.; Miricioiu, M.G. Comparative Study on Plastic Materials as a New Source of Energy. Mater. Plast. 2019, 56, 41–46. [Google Scholar] [CrossRef]


| Wastes and By-Products | TS (%) | VS (%) | TKN (g/kg TS) | P (g/kg TS) |
|---|---|---|---|---|
| Gin spent botanicals | 35.6 | 34.3 | 1.56 | 0.17 |
| Brewers’ spent grains | 25.2 | 24.2 | 3.59 | 0.56 |
| Inoculum | |
|---|---|
| TS (%) | 2.23 |
| VS (%) | 1.16 |
| pH | 7.9 |
| Alkalinity (g CaCO3 L−1) | 12.1 |
| TAN (g NH4+-N L−1) | 2.7 |
Publisher’s Note: MDPI stays neutral with regard to jurisdictional claims in published maps and institutional affiliations. |
© 2021 by the authors. Licensee MDPI, Basel, Switzerland. This article is an open access article distributed under the terms and conditions of the Creative Commons Attribution (CC BY) license (https://creativecommons.org/licenses/by/4.0/).
Share and Cite
Montes, J.A.; Rico, C. Energetic Valorization of Solid Wastes from the Alcoholic Beverage Production Industry: Distilled Gin Spent Botanicals and Brewers’ Spent Grains. Appl. Sci. 2021, 11, 10158. https://doi.org/10.3390/app112110158
Montes JA, Rico C. Energetic Valorization of Solid Wastes from the Alcoholic Beverage Production Industry: Distilled Gin Spent Botanicals and Brewers’ Spent Grains. Applied Sciences. 2021; 11(21):10158. https://doi.org/10.3390/app112110158
Chicago/Turabian StyleMontes, Jesús A., and Carlos Rico. 2021. "Energetic Valorization of Solid Wastes from the Alcoholic Beverage Production Industry: Distilled Gin Spent Botanicals and Brewers’ Spent Grains" Applied Sciences 11, no. 21: 10158. https://doi.org/10.3390/app112110158