Article

High Purity of α-Lactalbumin from Binary Protein Mixture by Charged UF Membrane Far from the Isoelectric Point to Limit Fouling

1
Institute on Membrane Technology, CNR-ITM c/o University of Calabria, Via P. Bucci 17C, 87036 Rende, Italy
2
National Centre for Biotechnology, King Abdulaziz City of Science and Technology (KACST), P.O. Box 6086, Riyadh 11442, Saudi Arabia
*
Authors to whom correspondence should be addressed.
Appl. Sci. 2021, 11(19), 9167; https://doi.org/10.3390/app11199167
Submission received: 16 July 2021 / Revised: 21 September 2021 / Accepted: 24 September 2021 / Published: 2 October 2021
(This article belongs to the Special Issue Biowaste Treatment and Valorization)

Abstract

:
Separation and high recovery factor of proteins similar in molecular mass is a challenging task, and heavily studied in the literature. In this work, a systematic study to separate a binary protein mixture by charged ultrafiltration membranes without affecting membrane performance was carried out. α-lactalbumin (ALA, 14.4 kDa) and β-lactoglobulin (BLG, 18.4 kDa) were used as a binary model system. These two proteins are the main proteins of whey, a very well-known byproduct from the dairy industry. Initially, a systematic characterization of individual proteins was carried out to determine parameters (protein size and aggregation, zeta potential) which could influence their passage through a charged membrane. Then, the influence of operating parameters (such as initial protein concentration, pH, and critical pressure) on the UF process was investigated, so as to identify conditions that limit membrane fouling whilst maximizing protein recovery factor and purity. The study permitted to identify process conditions able to fully separate ALA from BLG, with high purity (95%) and recovery factor (80%), in a single UF step. Compared to studies reported in literature, here, the main approach used was to carry out a charged UF process far from proteins isoelectric point (pI) to limit protein aggregation and membrane fouling.

1. Introduction

Fractionation of proteins by ultrafiltration (UF) is efficient when proteins differ in molecular mass by at least a factor of 10. To this aim, various membrane processes were investigated focusing on (i) tuning pH and ionic strength to maximize differences in the hydrodynamic size of particles in solution, (ii) using electrical charged membranes to retain charged proteins [1,2,3,4], (iii) diafiltration process [5], and (iv) selective aggregation of proteins using thermal process [6].
The careful control of pH and ionic strength of bulk proteins’ solutions might result in an improved performance of protein fractionation by ultrafiltration.
Different protein mixtures were fractionated by charged UF process [7,8,9,10,11,12,13,14,15] by using both organic and inorganic membranes, achieving maximum transmission of the protein being at its isoelectric point (pI) and high retention of the one that had the same electrical charge as the membrane.
The overall observation was that large increase in protein transmission through membranes can be reached using charged membranes, but the protein at its isoelectric point can create membrane fouling [16,17,18,19,20,21,22,23]. Membrane fouling, in the mentioned conditions, increases when the protein is at the isoelectric point, since protein aggregation easily occurs [24,25,26].
A good compromise between high selectivity and low fouling must be found. Strategies to overcome the permeability–selectivity trade-off were published by Arunkumar et al. [4], in which a 300 kDa regenerated cellulose membrane positively charged was used for the fractionation of α-lactalbumin (ALA) from a binary protein mixture. Using a two-stage process, 87% of pure ALA was obtained in the permeate with a flux of 170 L·h−1·m−2 [4]. The same work was carried out [27] using milk serum permeate (MSP) as feed solution, obtaining 87% of ALA purity with a three-stage system. Another research group [15] achieved the complete separation of bovine serum albumin (BSA, 66.5 kDa) in one step, starting from a binary protein mixture with lactoferrin (LF, 78 kDa) by using diafiltration process and charged membranes.
Despite the research efforts and knowledge promoted on the separation of proteins with similar size by charged UF membrane processes, some aspects (such as preventing irreversible fouling) need further insights and improvements.
The novelty of this work, with respect to the current literature, is to promote proteins separation with similar molecular weight, but in conditions in which irreversible fouling can be prevented or limited. Besides, a deep study of protein aggregation state and charge density, when both proteins bore same charge of the membrane, was carried out for the first time, in order to have high purity of the separated protein in a single stage, currently carried out by multistage processes [4,27]. In order to identify operating conditions that might prevent irreversible fouling, as well as guarantee high purification efficiency, we speculated that using binary protein mixture in bulk conditions far from their isoelectric points and having both proteins with the same electrical charge as the membrane would promote the target improvements, since electrical repulsion and then low adsorption between proteins and membrane is promoted. We also aimed at achieving purification in a single step. To easily compare results with literature data, the well-studied β-lactoglobulin and α-lactalbumin binary mixture was used as a model system. Charged regenerated cellulose ultrafiltration membrane was applied.
The work started with a systematic characterization of single protein solutions to determine parameters which could affect their separation (zeta potential, protein size, and tendency to aggregate). The abovementioned characterization at pH around 3 was carried out, since both proteins (ALA IP: 4.4; BLG IP: 5.2–5.4) are positively charged; this limits the proteins/positively charged membrane interaction during UF and then irreversible membrane fouling.
Then, the influence of operation variables (initial binary mixture protein concentration, pH, critical pressure) to limit fouling during charged UF process and to maximize the difference between the two proteins was studied. The obtained results were then used to identify conditions in which to carry out UF process in concentration mode using binary protein mixture.

2. Materials and Methods

2.1. Chemicals

Phosphoric acid (H3PO4) (Fluka, Milan, Italy) and sodium phosphate monobasic anhydrous (NaH2PO4) (Sigma Aldrich, Milan, Italy) were used to prepare buffer solutions; NaCl (Sigma Aldrich) was used to keep constant ionic strength to 0.1 M. Regenerated cellulose flat membranes of 30 kDa nominal molecular weight cut-off (NMWCO) (Millipore) were used. The structure of this kind of membranes is asymmetric. The membrane surface area was 1.25 × 10⁻³ m2. Prior to permeability test, membranes were first washed with ultrapure water (PurelabTM Classic, UF) to remove soluble additives normally used to preserve the membranes. The membrane was mounted in a homemade cross-flow ultrafiltration system (glossy side toward solution) and rinsed by filtering ultrapure water for 10 min at 170 kPa. BLG (cod. L3908) and ALA (cod. L6010) were purchased from Sigma Aldrich (Milan, Italy). To study protein size and to carry out ultrafiltration tests around pH 3, 25 mM sodium phosphate was prepared with phosphoric acid (H3PO4) (Fluka, Milan, Italy) and sodium phosphate monobasic anhydrous (NaH2PO4) (Sigma Aldrich, Milan, Italy).

2.2. Protein Quantification

The bicinchoninic acid protein assay kit (BCA, QuantiPro™ BCA Assay Kit, Sigma-aldrich, Milan, Italy) used to measure protein concentration (1–20 µg/mL) was purchased from Sigma-Aldrich (Milan, Italy). In solutions in which both ALA and BLG were present, the protein amount was calculated by one-dimensional SDS-PAGE electrophoresis on precast protein gel (NuPAGE® Novex® 4–12% Bis-Tris Gels, 1.0 mm, 1 well, ThermoFisher scientific, Monza, Italy). The gel has a continuous 4 to 12% gradient gel zone. The buffer system used was MES (50 mM MES, 50 mM Tris Base, 0.1% SDS, 1 mM EDTA, pH 7.3). Sample treatment: 8 µL of sample, 5 µL of Nu PAGE LDS sample buffer (4×), and 2 µL of Nu PAGE reducing agent (10×) were added to 5 µL of water to a final volume of 20 µL. Each sample was loaded onto a separate lane of the gel containing 20 μL of sample. The gels were stained with silver staining (Sigma-Aldrich, sensitivity: low nanogram range). In order to evaluate the mass of the protein, gel images were captured by scanner and analyzed by GelQuant Express Analysis Software (Life Technologies, Monza, Italy), which facilitate identification of both molecular weights (MW) and concentration of each band on the gel. The MWs of the proteins of unknown samples were calculated from the logarithm curve fitting, which relate the standard MWs with the relative mobility as pixel position by using calibration kit proteins.

2.3. Protein Size and Charge Measurement

Size measurements of protein aggregates and determination of molecular weight, as well as protein charge, was carried out by Zetasizer Nano ZS (Alfatest, Milan, Italy). The Zetasizer system determines the particles size by measuring the Brownian motion of the particles in a sample using dynamic light scattering (DLS). The size range is from 0.3 nm to 10 µm. DLS provides a fast, noninvasive, and sensitive method to determine the size of a protein [28]. The molecular weight was determined by static light scattering (SLS) measuring the sample at different concentrations and applying the Rayleigh equation, which describes the intensity of light scattered from a particle, in static conditions, in solution. The protein charge was measured using a combination of two measurement techniques: electrophoresis and laser Doppler velocimetry. This method measures how fast a particle moves in a liquid when an electrical field is applied. The velocity of particle measured, and the electrical field applied, considering viscosity and dielectrical constant of the solution, work out the zeta potential. A total of 15 different consecutive measurements were carried out for single protein solution at the different pH, and the error reported is the one obtained from the average and standard deviation between the measurements carried out at 25 °C.

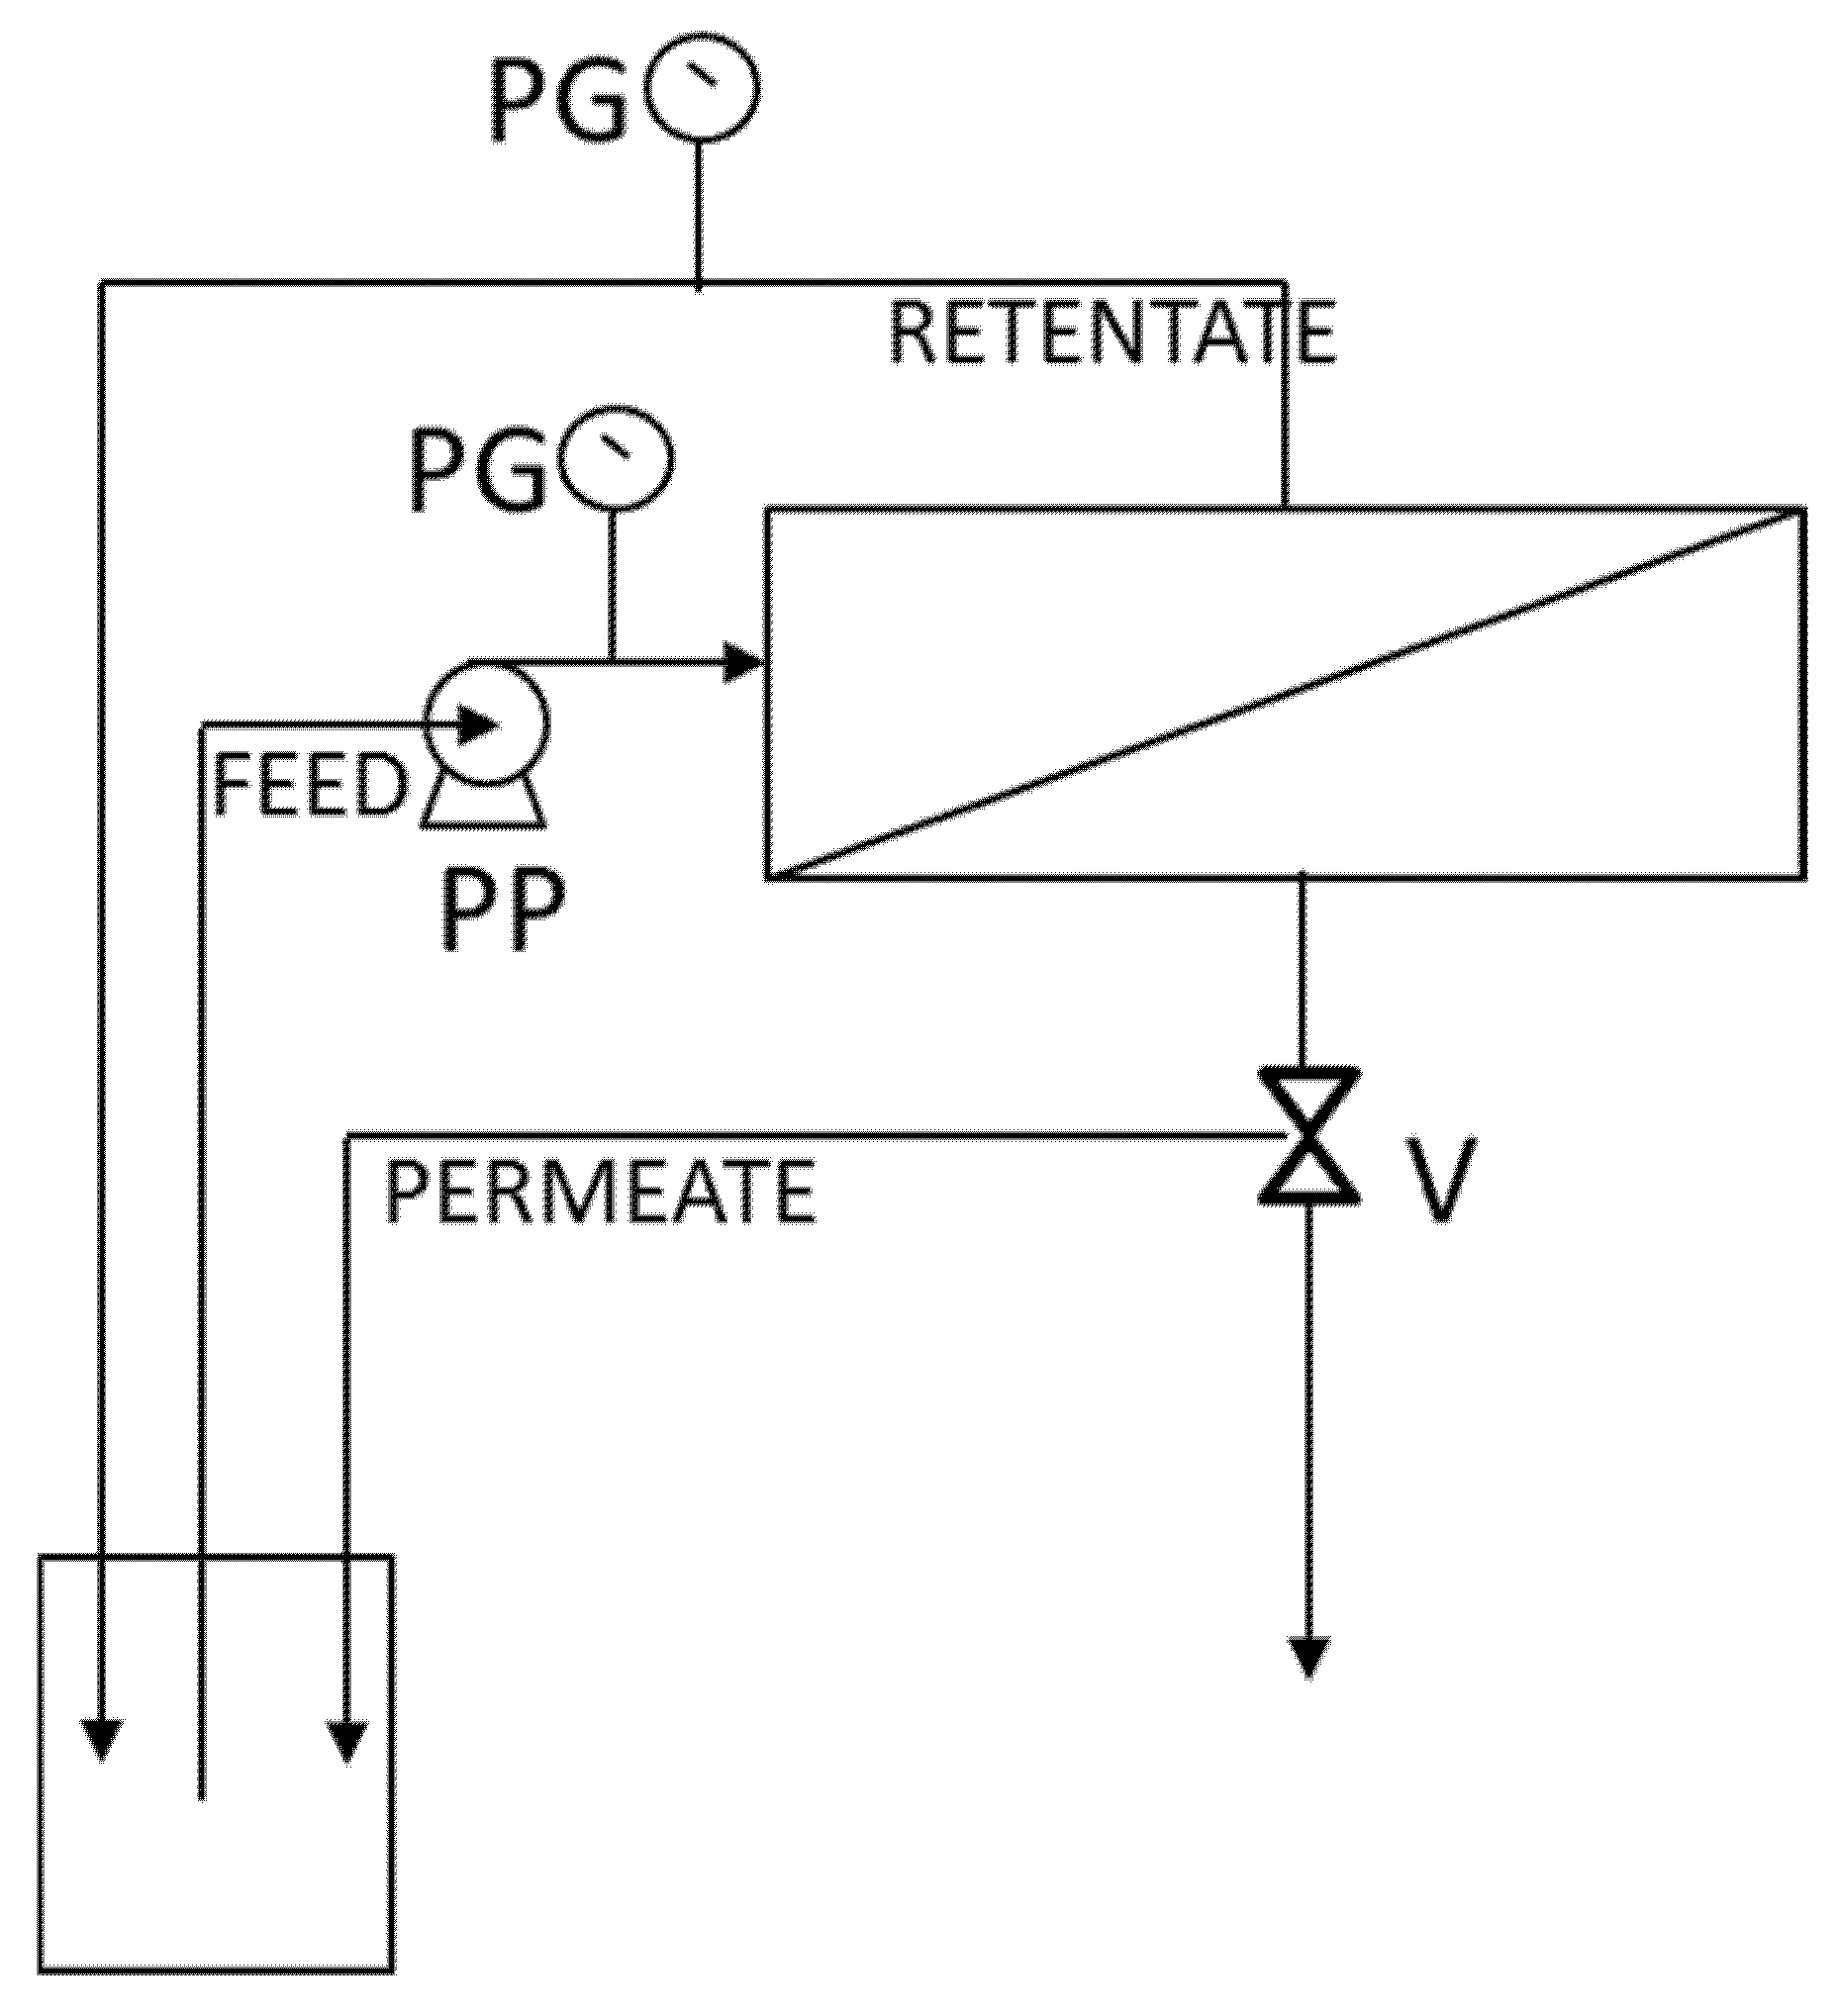
2.4. Experimental Setup

Functionalized membranes were assembled in a cross-flow ultrafiltration cell system (schematic representation in Figure 1). The system was composed of a stainless-steel module, which contained the membrane, two pressure gauges (Wika, Klingenberg, Germany) to measure inlet and outlet pressure, a feed tank, and a peristaltic pump (Masterflex, Chongqing, China) to feed the protein solution to the membrane. Before ultrafiltration experiments, the membrane was characterized by measuring the pure water permeance (m·Pa−1·s−1) (Lp). The permeate flux as function of time at different transmembrane pressure (TMP) values was measured; the steady-state values of flux were then plotted versus TMP, and, from the slope of the straight line obtained, the pure water permeance was calculated from Equation (1).
J = Lp∙∆P
where J is the permeate flux (L·h−1·m−2), and ∆P is the TMP (bar). The reason for measuring this parameter pertains to the need to check the initial membrane performance as reference for subsequent use of membrane after protein fractionation experiments. Furthermore, pure water permeance was necessary to evaluate hydraulic resistances, adsorption, and irreversible fouling caused by the different protein solutions with respect to the initial condition. The effect of protein solutions on membrane fouling at different TMP was evaluated by a resistance in series model described by Equation (2):
Rtot = Rm + Rirr + Rrev
where Rm is the hydraulic resistance of the membrane itself, Rirr is the hydraulic resistance due to irreversible fouling, Rrev is the hydraulic resistance due to reversible fouling (concentration polarization and reversible deposited material), and Rtot is the total resistance given by the sum of different contributions. The membrane hydraulic resistance Rm can be calculated by the following equation [29,30]:
R m = 1 L p μ
Here, Lp is the pure water permeance (m·Pa−1·s−1) of virgin membrane, and μ (Pa s) the viscosity of the solution. The hydraulic resistance due to irreversible fouling is given by the pure water permeance of the used membrane (that is, membrane after ultrafiltration test and rinsed with water). The total hydraulic resistance is calculated by the membrane permeance using the given working solution and the viscosity of that solution. The reversible hydraulic resistance is calculated by difference from Equation (2). The purity of the protein in the collected fraction is calculated by Equation (4):
Purity = [ C A ] [ C A ] + [ C B ]
where CA and CB are the concentration of the protein A and B in a given stream/solution. The recovery factor is calculated by Equation (5):
R . F . = m g A P m g A F
where mgAP is the amount (mg) of the protein A in the permeate, and mgAF is the amount of the same protein in the feed.

2.5. Ultrafiltration Experiments

Ultrafiltration experiments aimed at identifying the critical flux at the different pH tested, recirculating the permeate back to the feed tank so as to keep the feed volume and concentration constant, were carried out. The critical flux value allowed the identification of the maximum pressure to be used in order to limit fouling. Beyond this value, no further linear increase of flux would be obtained. The critical flux was measured by using protein solution dissolved in 25 mM phosphate buffer at pH 3 and 3.4. Each experiment was carried out in triplicate by using the same membrane. Between the different experiments, the membrane was washed with water to remove reversible fouling.
When binary protein mixture was used, the UF process was carried out in concentration mode (that is, the permeate was removed and the volume of the retentate correspondingly reduced). The ultrafiltration experiments by using binary protein mixture were monitored by measuring the permeate flux at different TMP. In a first step, the TMP was initially increased and subsequently decreased. Results obtained in terms of critical flux at a given pH were then used to carry out UF in concentration mode. Ultrafiltration of binary protein mixture in concentration mode was carried out by varying the initial protein concentration from 0.5 to 2 g·L−1. Sieving coefficient and membrane resistance were determined together with recovery factor and protein purity as a function of the volume reduction factor (VRF = ratio of the initial feed volume with respect to the final retentate volume). Each experiment was carried out in triplicate, and membrane cleaning was carried out by using a 0.1 M NaOH. Conductivity was fixed at 1.5 (±0.2) mS/cm.

2.6. Imparting Positive Charge to Regenerated Cellulose Membranes

A number of 30 kDa regenerated cellulose membranes (Millipore), 1.25 × 10⁻³ m2, were functionalized using the method previously described by van Reis et al. [31]. Briefly, membranes were rinsed with 0.1M NaOH recirculating along membrane surface and across the membrane, applying a TMP of 0.5 bar and a cross-flow velocity of about 0.014 m/s. After this passage, the membrane reacted with (3-bromopropyl) trimethylammonium bromide (Sigma-Aldrich, Cat. No. 347604, Milan, Italy) in 0.1 M NaOH for 21 h at room temperature. By a nucleophilic substitution, the alkyl ammonium group was covalently attached to the membrane. Washing steps were then performed by using ultrapure water and followed with 1% of acetic acid solution in phosphoric acid (0.12 M). The hydraulic permeance was measured before and after membrane functionalization.

3. Results

The aim of this work is to promote the separation of proteins with similar molecular weight (when present as monomers) and charge by charged UF process far from their isoelectric point, preventing membrane fouling. For this purpose, the ALA and BLG (IP: 4.4 and 5.4, respectively, Supplementary Figure S1) binary protein mixture was used just as the model system, since their separation is already fully developed at an industrial scale.

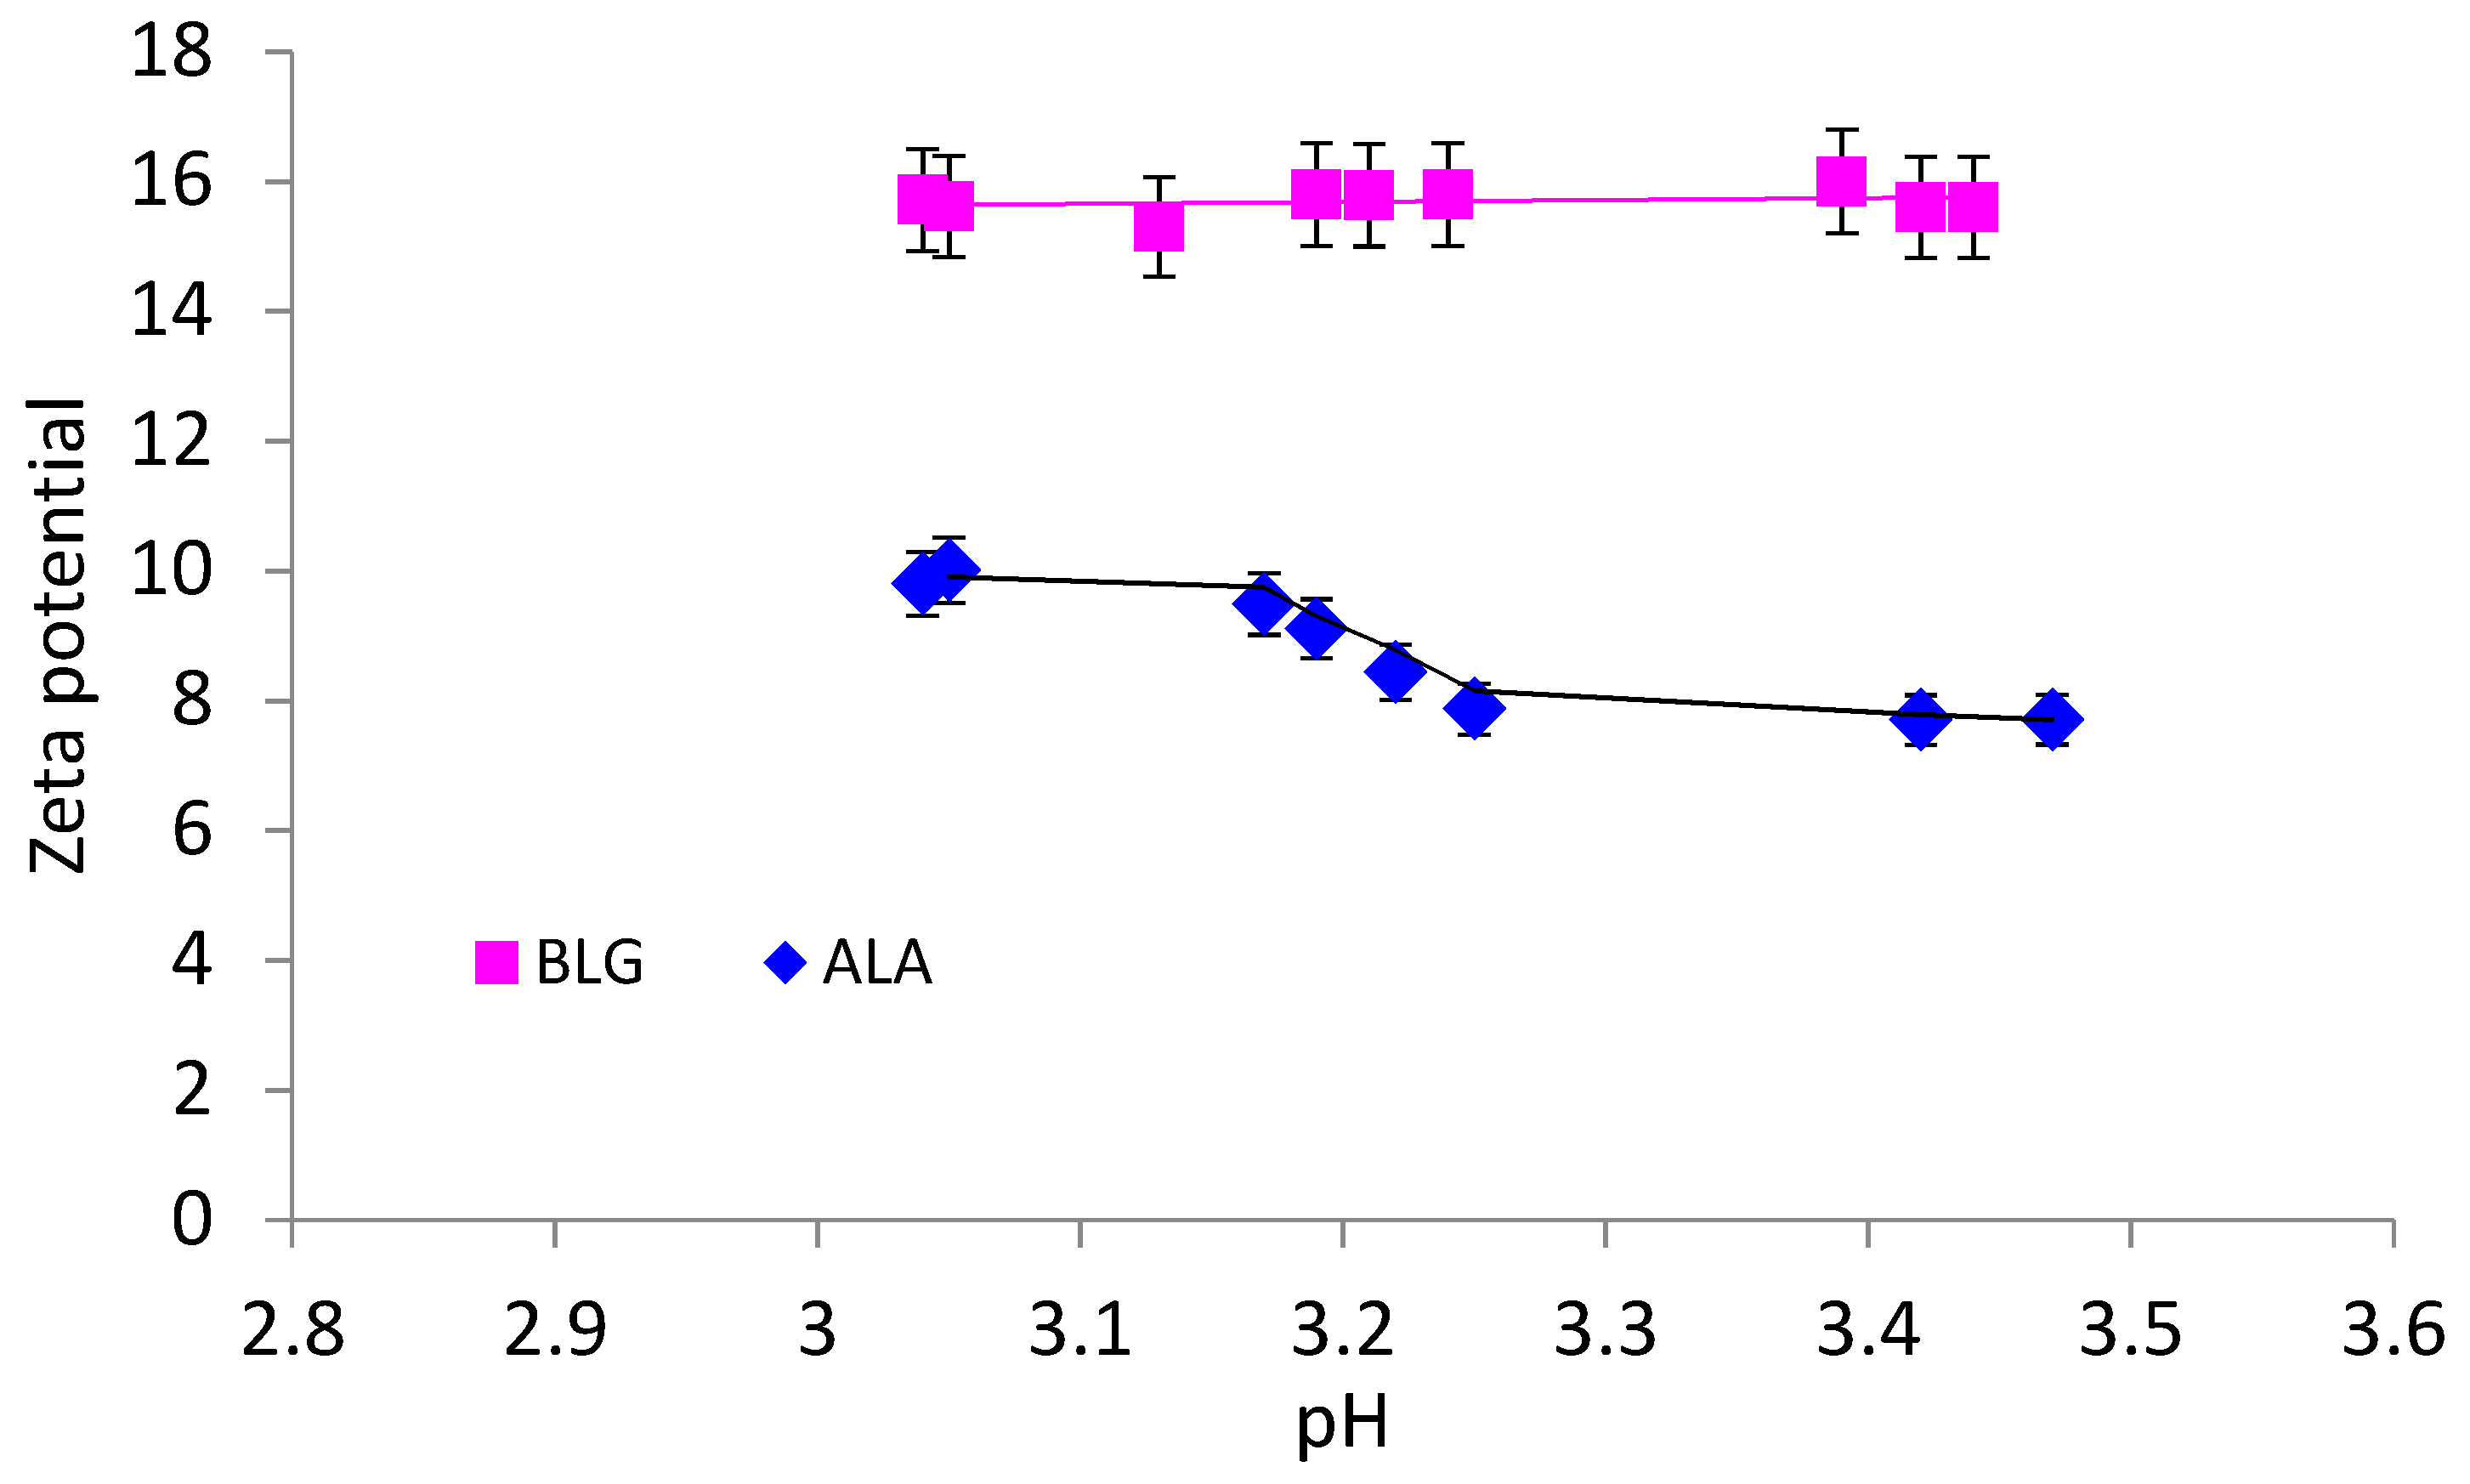
3.1. Properties of Individual Proteins in Bulk Solution

Zeta potential measurements, as well as protein size determination, were carried out on single protein solutions using different initial protein concentration (0.5, 1, 2 g·L−1). This kind of characterization was carried out in order to find differences between the two proteins, in terms of aggregation state and charge density, in conditions in which they both bore positive charge as the membrane. In particular, pH around 3 was analyzed, since both proteins (IP: 4.4 and 5.4, respectively) are positively charged as the membrane; this will promote low membrane/proteins interaction and then irreversible fouling prevention. In Figure 2, the trend of zeta potential of the two proteins varying the pH around 3 and by using a concentration of 1 g·L−1 was reported as an example, since a similar trend for the other two concentration was obtained.
BLG is positively charged and did not change its value of zeta potential for all the analyzed pH values (16 mV) and initial protein concentration tested (Figure 2). On the contrary, although ALA bore always positive charge, its zeta potential at pH 3 was 63% lower (10 mV) compared to that for BLG at pH 3 (16 mV), and it dropped further at pH 3.17. A further decrease of ALA zeta potential at around 3.2 was observed, reaching about 50% of BLG value (8 mV) from 3.25–3.50. In Table 1, proteins’ size and molecular weight were reported at pH 3.0, 3.2, and 3.4. At these pH values, the difference in zeta potential between the two proteins is most representative. As it is possible to see, ALA is present as a monodisperse monomer at all the pH values analyzed, while BLG is present as monodisperse monomer at pH 3, as a monodisperse monomer and dimer at pH 3.2, and as polydisperse monomer and dimer at pH 3.4. The higher polydispersity in the last case is a clear demonstration of the increase of protein aggregation state, which means a higher presence of dimers [31]. Comparing the results between the two proteins (Figure 2 and Table 1), at pH 3, both proteins are present as monomer and have about 16 and 10 mV of zeta potential, respectively; while at pH 3.4, ALA is still present as monomer, while BLG is present as polydisperse dimer solution. In addition, in this last case, both proteins are positively charged but BLG showed a higher charge density (16 mV) with respect to ALA (8 mV) and to the situation observed at pH 3. So, in order to study the effect of protein aggregation state and charge on the UF separation performance, these two values of pH were considered for further investigation.

3.2. Determination of Critical Pressure

In this work, both the two analyzed proteins have the same charge as the membrane, and this means that electrical repulsion occurs among them and the membrane. However, during ultrafiltration, a pressure is applied as driving force to promote transport through the membrane.
When the applied pressure overcomes the electrical repulsion, proteins approach the membrane surface and may gelify on it, if the local concentration in the boundary layer reaches the gelling conditions, creating membrane fouling. In order to limit fouling phenomena during ultrafiltration process in concentration mode, the critical pressure at the two selected pH values and at protein concentration from 0.5 to 2 g·L−1 was investigated. The critical pressure was 0.2 bar when the initial protein concentration was 0.5 or 1 g·L−1, and it decreased down to 0.1 bar when the initial concentration was increased up to 2 g·L−1 (Table 2). However, in all the analyzed cases, on the basis of hydraulic resistance measurements (Table 2), no significant irreversible fouling was caused.

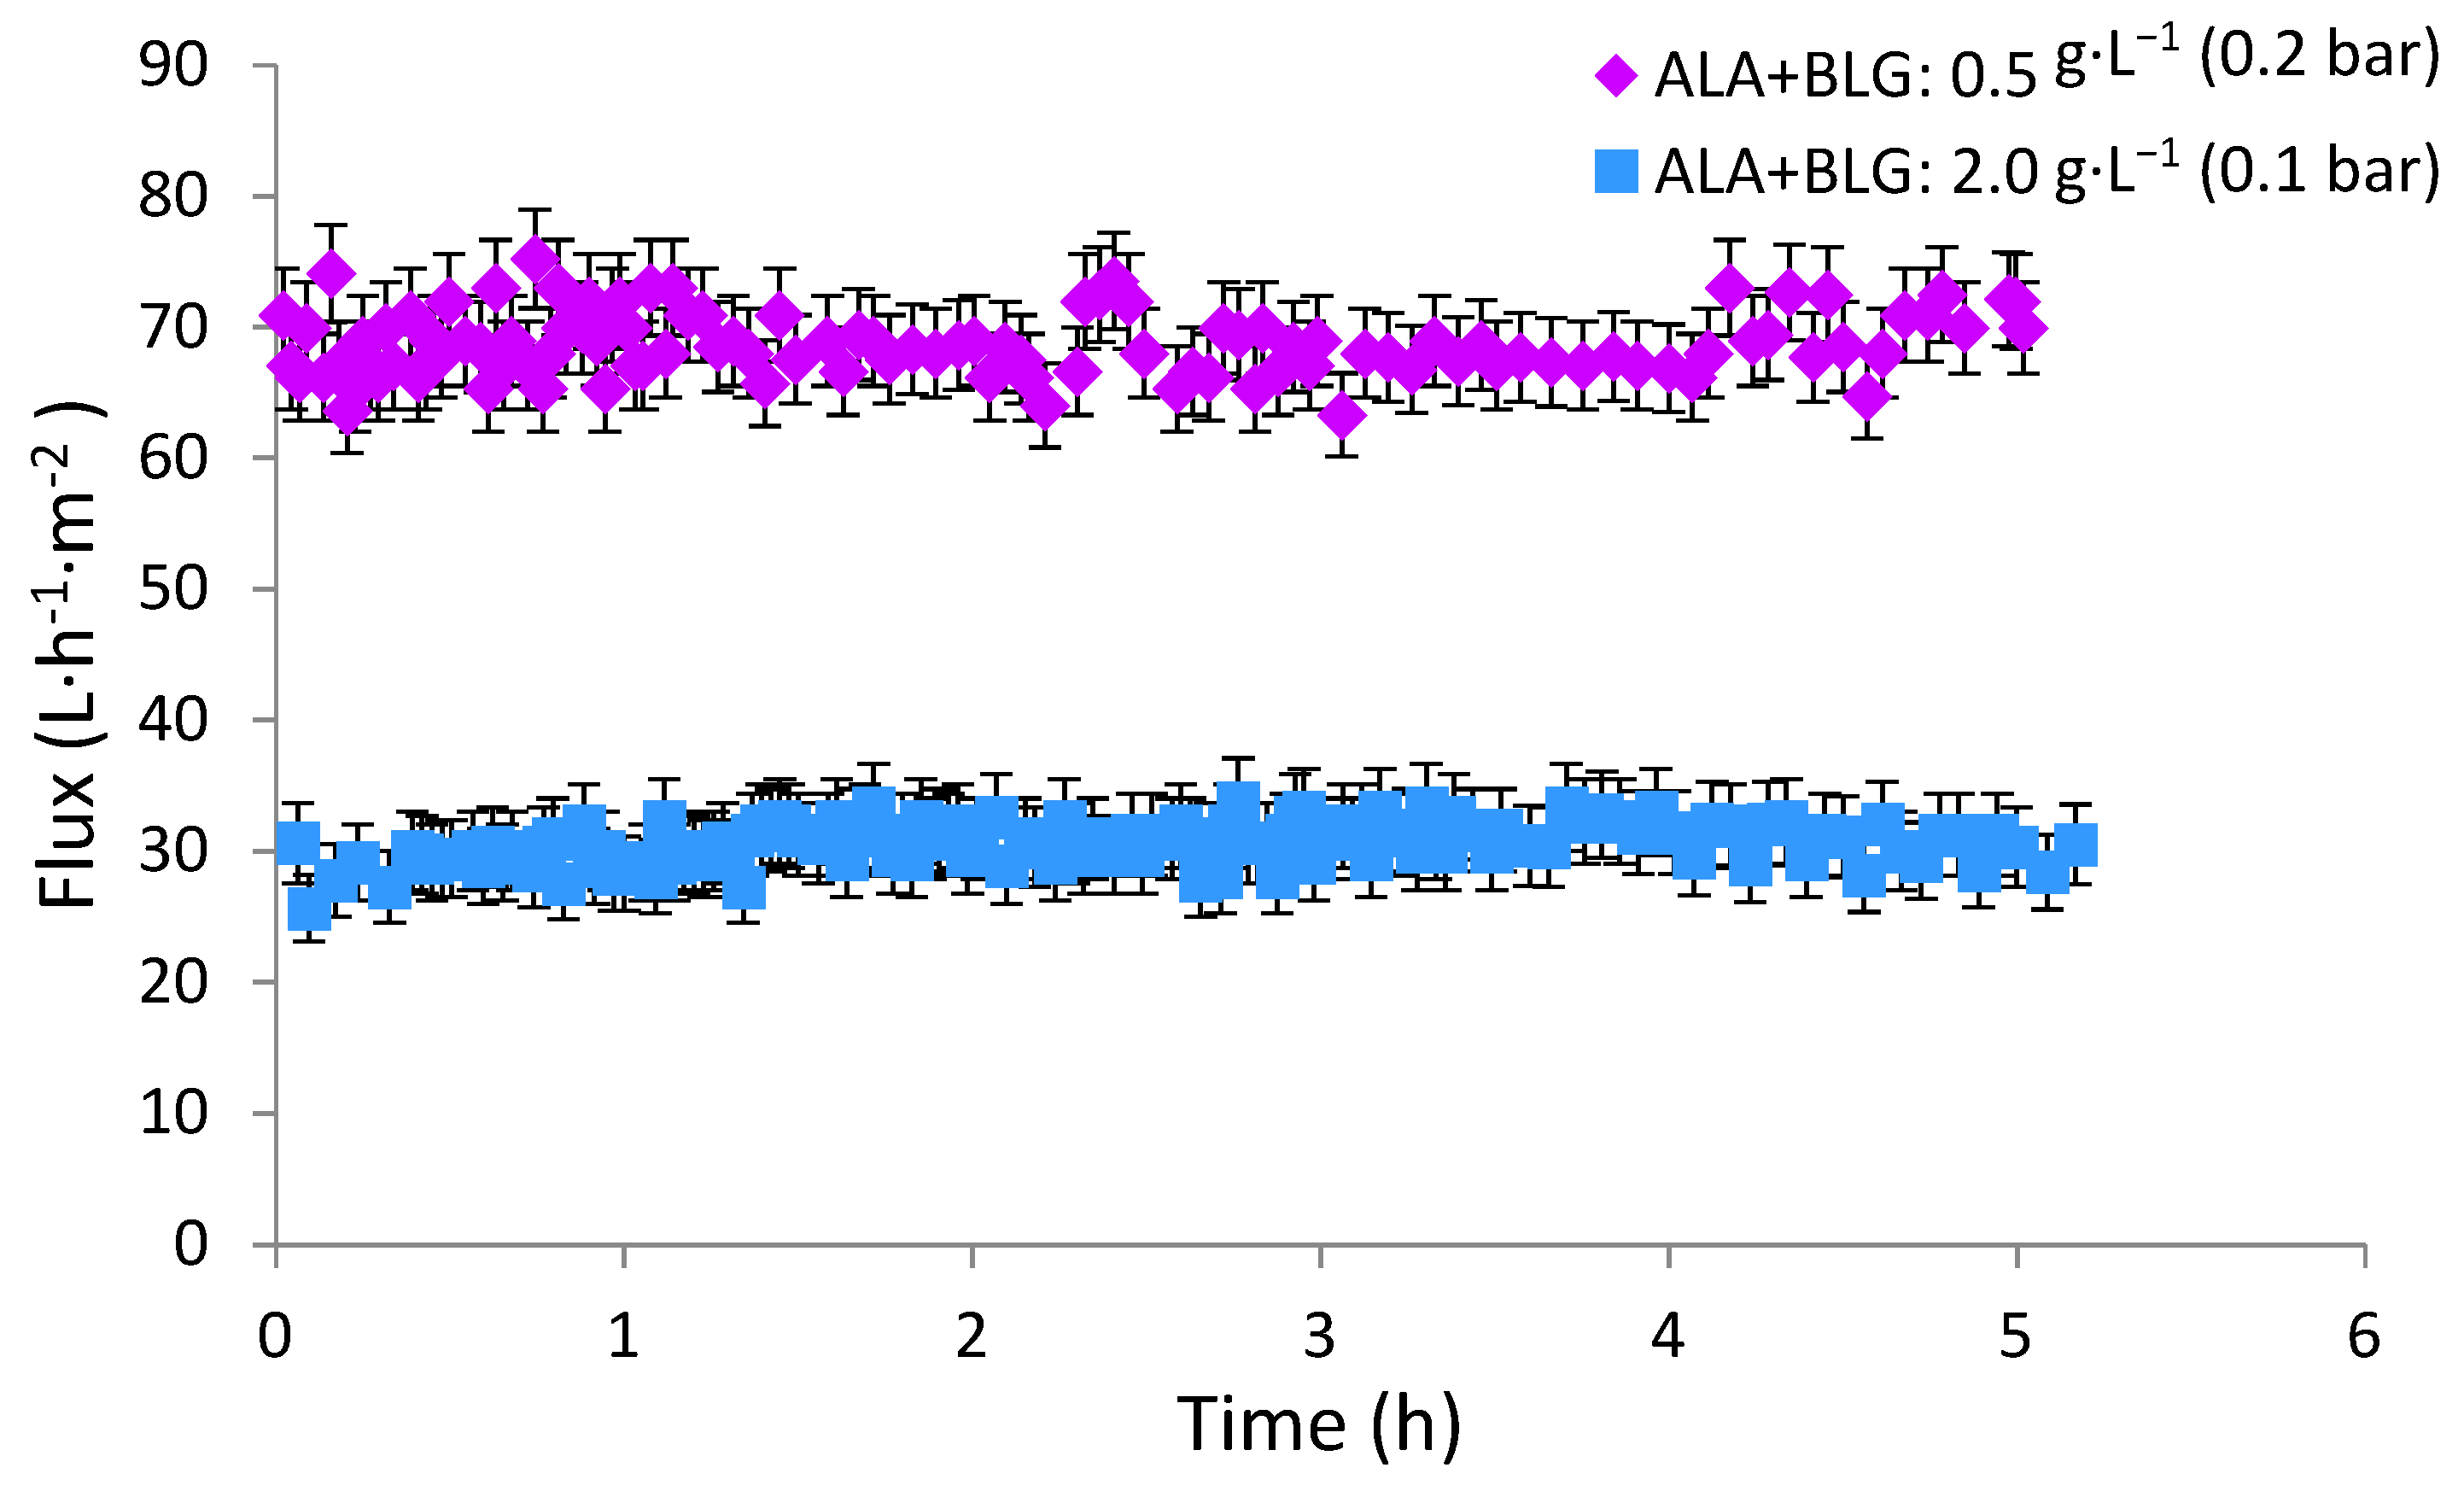
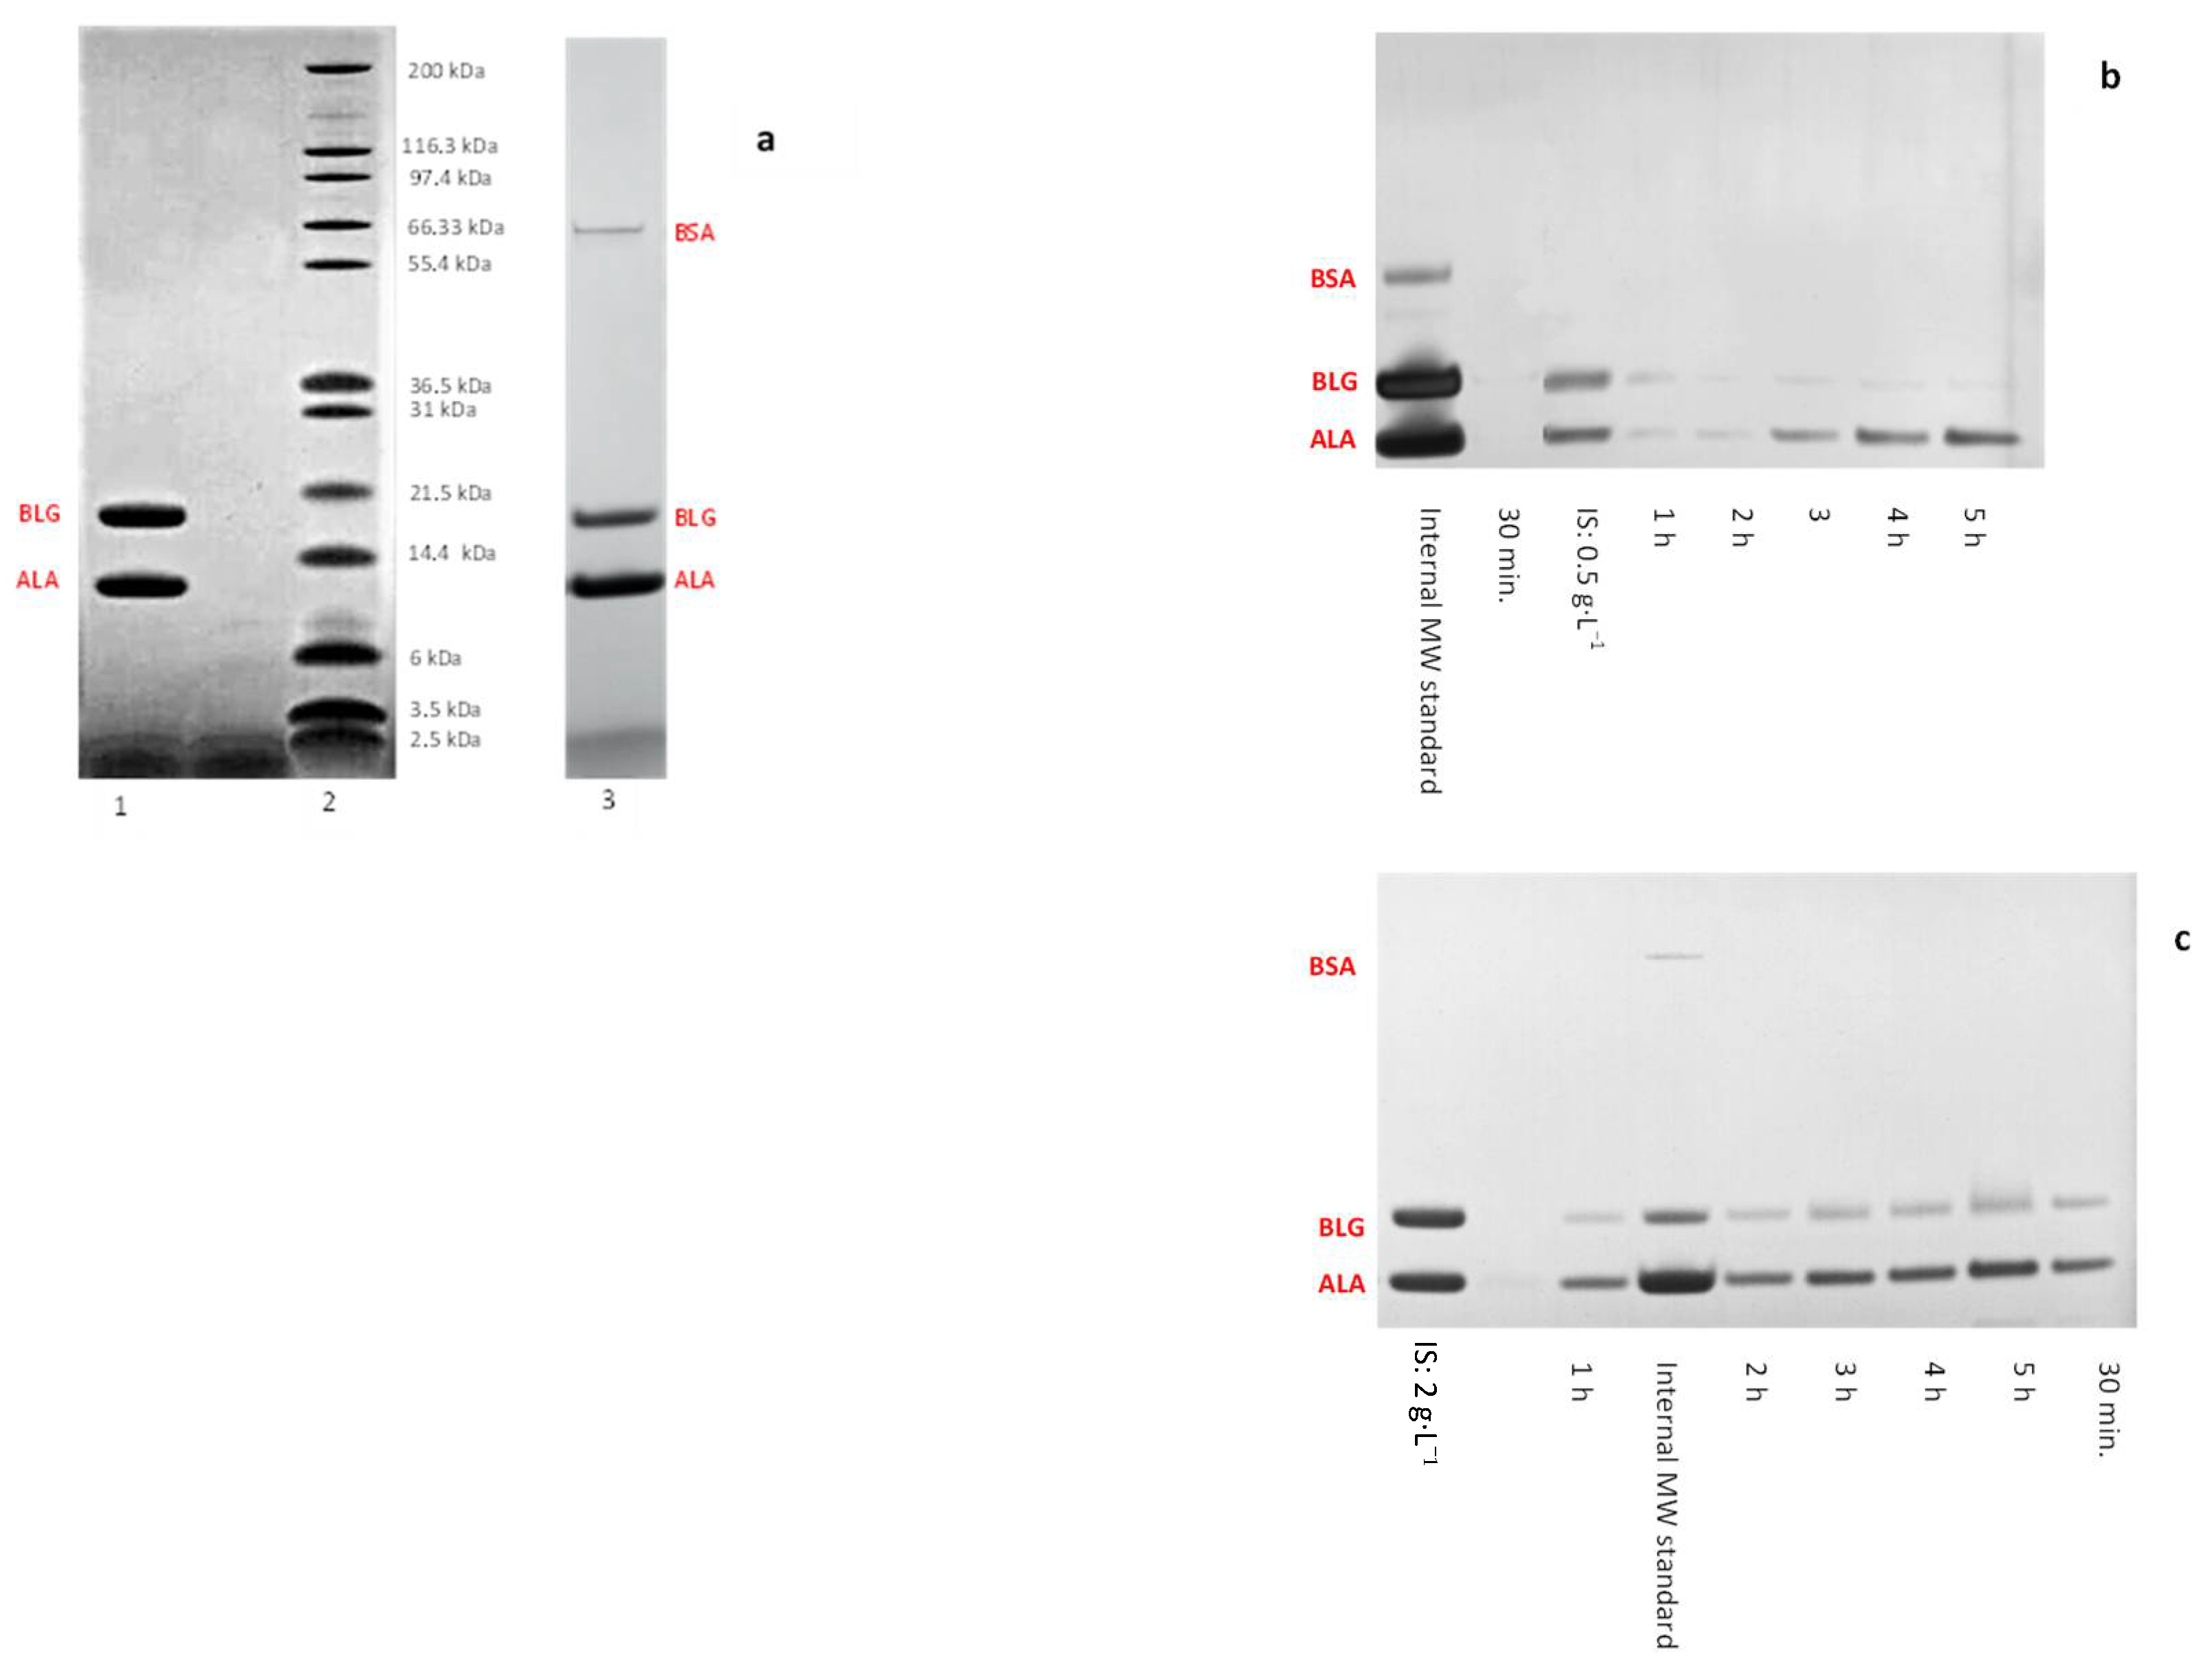
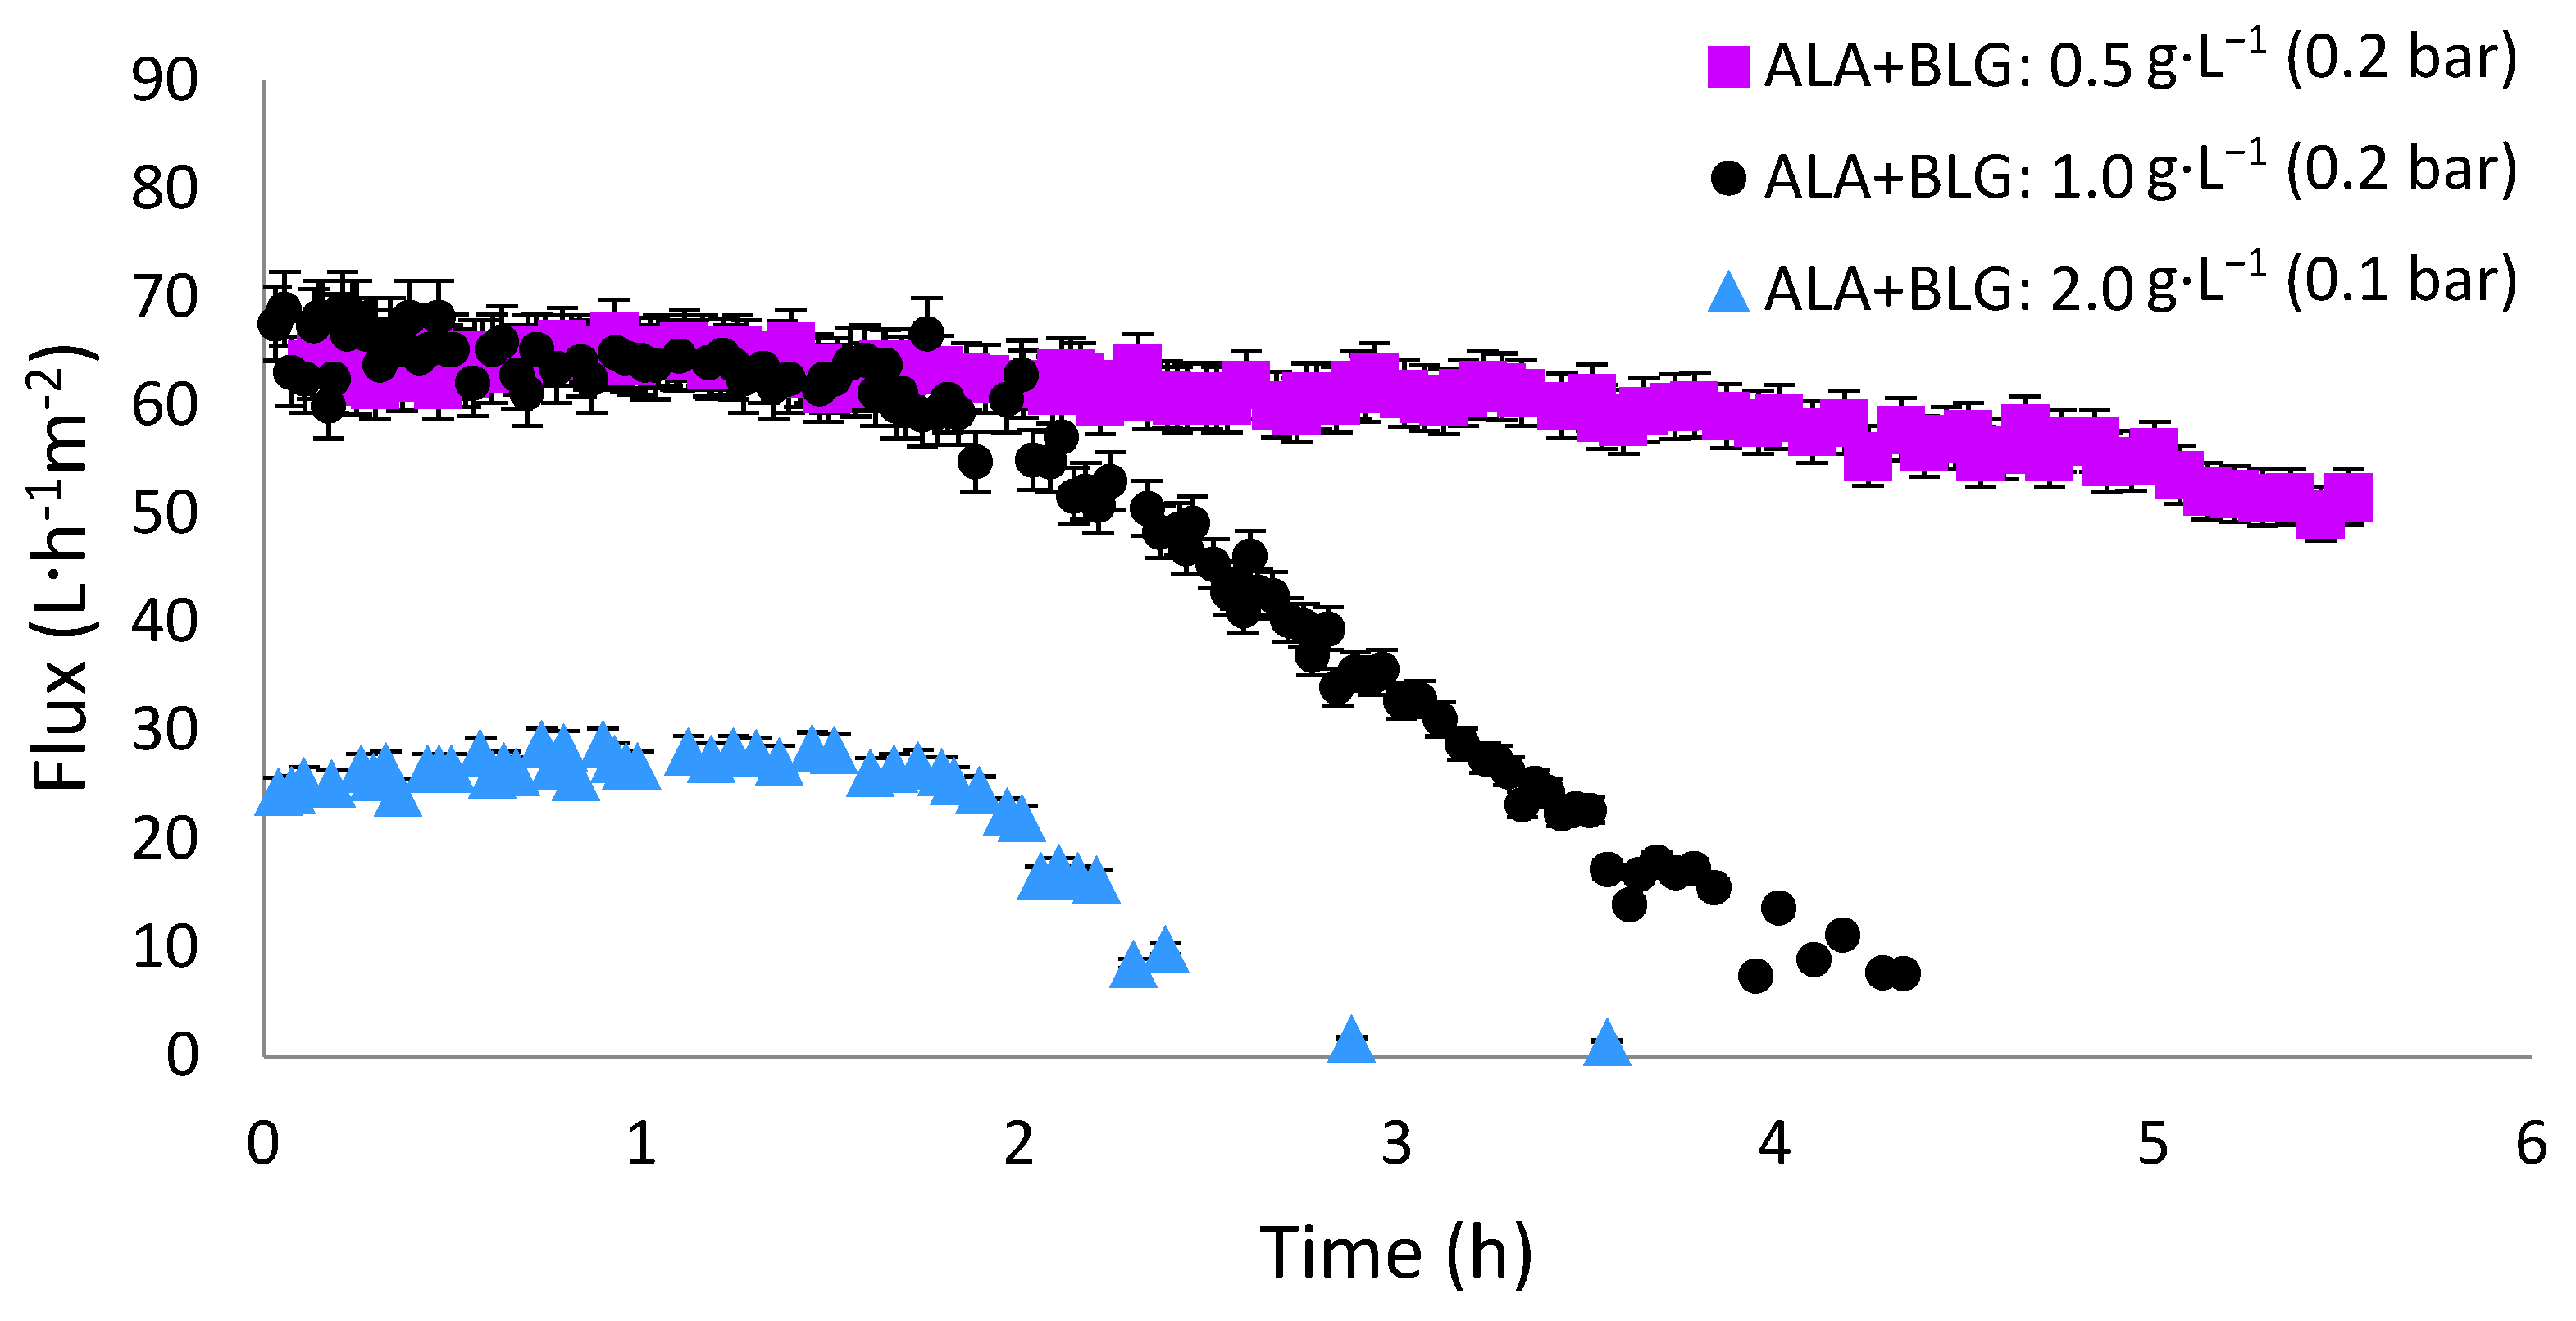
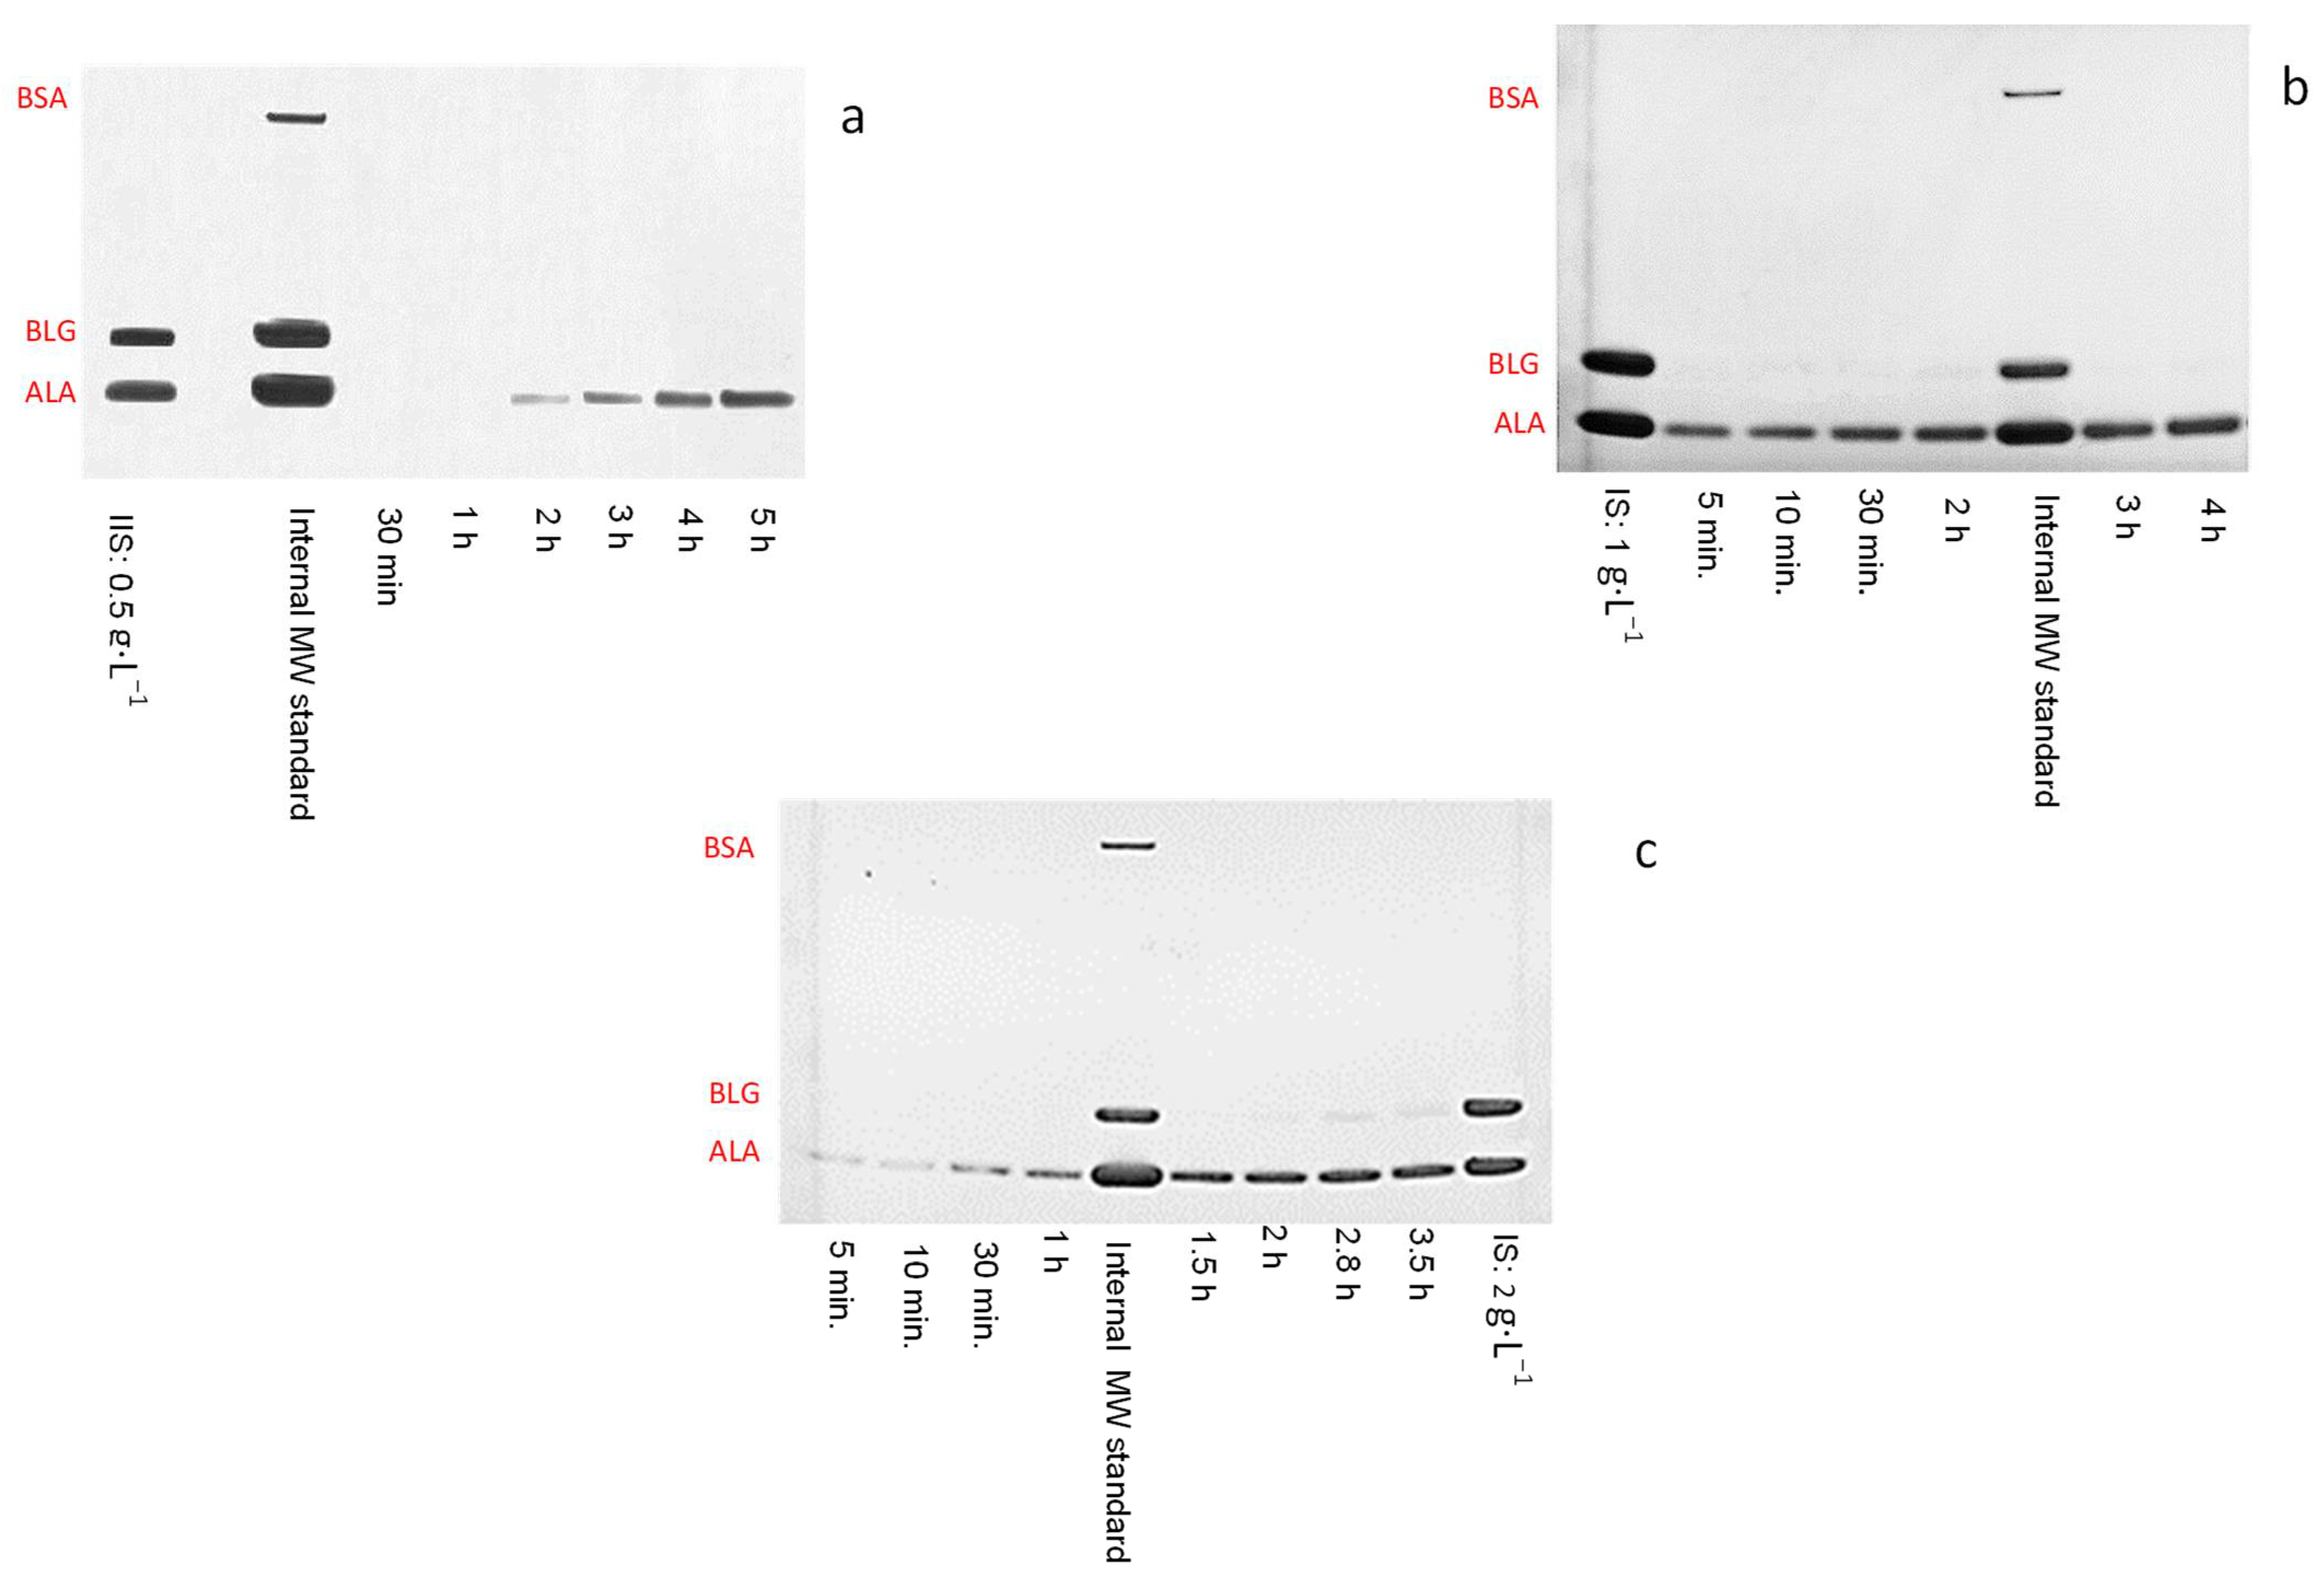
3.3. Binary Protein Mixture Ultrafiltration at pH 3 in Concentration Mode

As already mentioned in the Materials and Methods section, the ultrafiltration of binary protein mixtures was carried out in concentration mode. A constant flux as a function of time was observed when the ultrafiltration process was carried out using initial protein concentrations of 0.5 or 2 g·L−1 (Figure 3). In particular, using an initial protein concentration of 0.5 g·L−1 and applying a TMP of 0.2 bar, a steady-state flux of 68 (±5) L·h−1·m−2 was obtained, while using an initial protein concentration of 2 g·L−1 and applying a TMP of 0.1 bar, a steady-state flux of 30 (±2) L·h−1·m −2 was obtained. The similar flux obtained operating in concentration mode (Figure 3) or at constant feed volume (Table 2) is a further confirmation that no significant fouling is observed, since just reversible fouling is obtained, which can be easily removed by washing steps. The TMP values were selected according to the results of the critical pressure study. Furthermore, in this series of experiments, the initial pure water permeance (6.70 × 10⁻⁸ (±1.68 × 10⁻⁹) mPa−1·s−1 was also completely restored after UF with protein solutions (6.65 × 10⁻⁸ (±2.52 × 10⁻⁹) mPa−1·s−1). In Figure 4, the electrophoretic profile of samples analyzed as a function of ultrafiltration time were reported together with the MW standards of used proteins (Figure 4a). Analyzing the electrophoresis of permeates collected as a function of time (Figure 4b,c), it is possible to note that both proteins can pass through the membrane; however, ALA (that at this pH value has a lower charge density) is less rejected by the positively charged membrane. This is clear evidence that at pH 3 the membrane cannot be used to purify one protein with respect to the other, since both can pass through the membrane. Similar results were obtained for both initial protein concentrations used (Figure 4b,c).

3.4. Binary Protein Mixture Ultrafiltration at pH 3.4

In Figure 5, the fluxes obtained during the ultrafiltration of binary protein mixture (0.5, 1.0, 2.0 g·L−1) at pH 3.4 are reported. When the initial protein concentration was 0.5 g·L−1, a constant flux was observed for about three hours (65 L·h·m−2); after that, the flux starts to decrease, reaching a value of 50 L·h·m−2 after 5 h of continuous UF process in concentration mode. However, after washing the membrane with the buffer, the initial pure water permeance (6.70 × 10⁻⁸ (±1.68 × 10⁻⁹) m·Pa−1·s−1) was restored (6.68 × 10⁻⁸ (±1.60 × 10⁻⁹) m·Pa−1·s−1), demonstrating that in this case also, no irreversible fouling did occur. If the initial protein concentration was doubled to 1 g·L−1, a constant flux was observed (Figure 5) (64 L·h−1·m−2) for about two hours; after that it started to decrease, reaching a value of about 10 L·h−1·m−2 after 4.3 h of UF process. If the initial protein mixture concentration was further increased to 2 g·L−1, a constant flux was observed for about 1.8 h; after that, a severe flux decrease was observed (Figure 5).
Although a flux decrease was observed for both the highest concentrations used, the initial pure water permeance, also in this case, was completely recovered. The absence of irreversible fouling can be attributed to proteins and membrane electrostatic repulsion which avoids a possible chemical interaction between membrane and protein. The flux decrease was mainly due to reversible fouling, caused by the accumulation of the most retained protein on the retentate side of the membrane. In Figure 6, the electrophoretic profile related to permeates collected as a function of time for all the three initial protein concentrations tested is reported. When 0.5 g·L−1 was used (Figure 6a), just ALA can pass through the membrane, increasing its concentration as a function of time. Until a VRF of about 1.5, 95% of pure ALA was obtained with a recovery factor of 33% (Table 3).
Using 1 g·L−1 as initial protein concentration, in this case just ALA was also present in all the collected permeates (Figure 6b), and its concentration increased as a function of time. Despite the abovementioned flux decrease after two hours of UF, no BLG was present in the permeate, but it was retained on the retentate side of the membrane, causing reversible fouling and flux decrease. Nevertheless, the membrane did not change its selectivity throughout the whole process, reaching 80% recovery factor of ALA in the permeate with 95% purity after 4.4 h. On the contrary, BLG is concentrated in the retentate (see Supplementary Figure S2, and due to the presence of concentrated ALA, it cannot be purified by charged UF process similar to ALA, but a diafiltration process is needed. When the charged UF process was carried out using 2 g·L−1, during the timeframe that the flux was constant, only ALA was present in the collected permeates (Figure 6c) with a purity of 95%, and a recovery factor of 33% at a VRF of 1.4. However, as soon as the flux started to decrease, BLG appeared in the permeate also. In case the UF process was carried out at pH 3.4, even though proteins were positively charged, ALA could pass through the membrane because it had a lower charge density (8 mV) compared to BLG, and a lower size (~14 kDa) compared to the membrane pore size (30 kDa), as it was present as monomeric form. BLG was completely rejected because it had a higher density of positive charge and larger molecular size, BLG being prevalently present in dimeric form. Considering BLG dimer size (~36 kDa) and charge density (16 mV), compared to the pore size (30 kDa) and surface positive charge of the membrane, it is reasonable to expect a high retention due to electrostatic repulsion and size sieving mechanisms. Furthermore, BLG, being prevalently present in dimeric form, is also retained from the membrane, but when the initial protein concentration is further increased, the reversible fouling, due to the accumulation of the most rejected protein, also increases, causing the passage of BLG monomer. The higher passage of ALA through the membrane, before BLG concentration increase in the retentate, was also given by an associative affect between the two positively charged proteins due to the Donnan effect, as already reported in the UF of different binary protein mixtures [2,32,33]. In this particular condition, the largely retained BLG (prevalently in dimer form) tends to push the more transmittable ALA (present as monomer, and less charged) through the membrane to permit charge balance. The positively charged membrane used repulsed the positively charged ALA and did not interact with it, ensuring low fouling, but thanks to the convection flow through the membrane promoted by the applied pressure, the repulsive interaction between the membrane and ALA was overcome, permitting the selective passage of the protein through the membrane. Overall, results demonstrate that the initial protein concentration of 2 g·L−1 is not suitable to achieve high recovery factor of purified proteins.

4. Conclusions

In this work, the possibility to separate ALA from a binary protein mixture of proteins having similar MW (when present as monomers) and charge by charged UF process was demonstrated. Compared to current literature, here, the UF process was carried out far from the isoelectric point of both proteins and in conditions where they both bore the same charge as the membrane. This was performed in order to limit fouling and to achieve ALA separation on the basis of electrostatic repulsion, Donnan exclusion, and size exclusion.
The work identified the operating conditions leading to high recovery factor and protein purity in the absence of irreversible fouling. When the ultrafiltration of the binary protein mixture was carried out at pH 3.4, and with initial protein concentration of 1 g·L−1, a fractionation of ALA with respect to BLG was obtained with a recovery factor of about 80% and a purity of 95%. The pure water permeance of the membrane was fully recovered after protein separation by simply rinsing the membrane with buffer solution. Measurements of hydraulic resistance confirmed that reduction of flux with increasing of VRF was due to reversible fouling. Even though, in the presence of real whey, antifouling properties might change due to the presence of proteins with different charge, this study provides a solution tuned for protein pairs after their easy separation from larger/smaller proteins that differ by at least a factor of 10 in terms of molecular weight.

Supplementary Materials

The following are available online at https://www.mdpi.com/article/10.3390/app11199167/s1, Figure S1: Zeta potential measurement as a function of pH of ALA and BLG (1 g·L−1). Figure S2: SDS-page carried out on final retentate (4.4. h) after UF by using binary protein mixture (1 g·L−1) pH 3.4 and charged regenerated cellulose membrane. 1: IS (1 g·L−1); 2: internal MW standard; 3: retentate obatained n the UF process after 4.4 h.

Author Contributions

R.M.: conceptualization, performing experiments, data curation, writing, review and editing; A.M.S.: performing experiments, data curation; E.D., M.A.-F. and M.A.A.: funding review and editing; L.G.: funding, writing, review, and editing. All authors have read and agreed to the published version of the manuscript.

Funding

This work was financially supported by the project “Membrane systems in regenerative medicine, tissue engineering, and biotechnology” AGREEMENT No. KACST-ITM-CNR/03.

Institutional Review Board Statement

Not applicable.

Informed Consent Statement

Not applicable.

Data Availability Statement

Not applicable.

Conflicts of Interest

The authors declare no conflict of interest.

References

  1. Bhushan, S.; Etzel, M.R. Charged ultrafiltration membranes increase the selectivity of whey protein separations. J. Food Sci. 2009, 74, E131–E139. [Google Scholar] [CrossRef]
  2. Saxena, A.; Tripathi, B.P.; Kumar, M.; Shahi, V.K. Membrane-based techniques for the separation and purifi cation of proteins: An overview. Adv. Colloid Interface Sci. 2009, 145, 1–22. [Google Scholar] [CrossRef] [PubMed]
  3. Rohani, M.M.; Mehta, A.; Zydney, A.L. Development of high performance charged ligands to control protein transport through charge-modified ultrafiltration membranes. J. Membr. Sci. 2010, 362, 434–443. [Google Scholar] [CrossRef]
  4. Arunkumar, A.; Etzel, M.R. Fractionation of α-lactalbumin from β-lactoglobulin using positively charged tangential flow ultrafiltration membranes. Sep. Purif. Technol. 2013, 105, 121–128. [Google Scholar] [CrossRef]
  5. Cheang, B.; Zydney, A.L. Separation of α-lactalbumin and β-lactoglobulin using membrane ultrafiltration. Biotechnol. Bioeng. 2003, 83, 201–209. [Google Scholar] [CrossRef]
  6. Toro-Sierra, J.; Schumann, J.; Kulozik, U. Impact of spray-drying conditions on the particle size of microparticulated whey protein fractions. Dairy Sci. Technol. 2013, 93, 487–503. [Google Scholar] [CrossRef] [Green Version]
  7. Ratnaningsih, E.; Reynard, R.; Khoiruddin, K.; Wenten, I.G.; Boopathy, R. Recent Advancements of UF-Based Separation for Selective Enrichment of Proteins and Bioactive Peptides—A Review. Appl. Sci. 2021, 11, 1078. [Google Scholar] [CrossRef]
  8. van Reis, R.; Brake, J.; Charkoudian, J.; Burns, D.; Zydney, A. High-performance tangential flow filtration using charged membranes. J. Membr. Sci. 1999, 159, 133–142. [Google Scholar] [CrossRef]
  9. Rabiller-Baudry, M.; Chaufer, B.; Lucas, D.; Michel, F. Ultrafiltration of mixed protein solutions of lysozyme and lactoferrin: Role of modified inorganic membranes and ionic strength on the selectivity. J. Membr. Sci. 2001, 184, 137–148. [Google Scholar] [CrossRef]
  10. Chun, K.-Y.; Stroeve, P. Protein transport in nanoporous membranes modified with self-assembled monolayers of functionalized thiols. Langmuir 2002, 18, 4653–4658. [Google Scholar] [CrossRef]
  11. Ebersold, M.F.; Zydney, A.L. Separation of protein charge variants by ultrafiltration. Biotechnol. Prog. 2008, 20, 543–549. [Google Scholar] [CrossRef] [PubMed]
  12. Striemer, C.C.; Gaborski, T.R.; McGrath, J.L.; Fauchet, P.M. Charge- and size-based separation of macromolecules using ultrathin silicon membranes. Nature 2006, 445, 749–753. [Google Scholar] [CrossRef] [PubMed]
  13. Mahlicli, F.Y.; Altinkaya, S.A.; Yurekli, Y. Preparation and cha racterization of polyacrylonitrile membranes modified with polyelec trolytedepositionfor separatin g simil ar sized proteins. J. Membr. Sci. 2012, 415–416, 383–390. [Google Scholar] [CrossRef] [Green Version]
  14. Sorci, M.; Gu, M.; Heldt, C.L.; Grafeld, E.; Belfort, G. A multi-dimensional approach for fractionating proteins using charged membranes. Biotechnol. Bioeng. 2013, 110, 1704–1713. [Google Scholar] [CrossRef] [PubMed]
  15. Valiño, V.; San Román, M.F.; Ibañez, R.; Ortiz, I. Improved separation of bovine serum albumin and lactoferrin mixtures using charged ultrafiltration membranes. Sep. Purif. Technol. 2014, 125, 163–169. [Google Scholar] [CrossRef]
  16. Fane, A.G.; Fell, C.J.D.; Suki, A. The effect of the pH and ionic environment on the ultrafiltration of protein solutions with retentive membranes. J. Membr. Sci. 1983, 16, 195–210. [Google Scholar] [CrossRef]
  17. Fane, A.G.; Fell, C.J.D.; Waters, A.G. Ultrafiltration of protein solutions through partially permeable membranes—The effect of adsorption and solution environment. J. Membr. Sci. 1983, 16, 211–224. [Google Scholar] [CrossRef]
  18. Kelly, S.T.; Zydney, A.L. Mechanisms for BSA fouling during microfiltration. J. Membr. Sci. 1995, 107, 115–124. [Google Scholar] [CrossRef]
  19. Ricq, L.; Narçon, S.; Reggiani, J.-C.; Pagetti, J. Streaming potential and protein transmission ultrafiltration of single proteins and proteins in mixture: B-lactoglobulin and lysozyme. J. Membr. Sci. 1999, 156, 81–96. [Google Scholar] [CrossRef]
  20. Martín, A.; Martinez, F.; Calvo, J.I.; Prádanos, P.; Palacio, L.; Hernández, A. Protein adsorption onto na inorganic microfiltration membrane solute-solid interactions and surface coverage. J. Membr. Sci. 2002, 207, 199–207. [Google Scholar] [CrossRef]
  21. Kujundzic, E.; Greenberg, A.R.; Fong, R.; Hernandez, M. Monitoring Protein Fouling on Polymeric Membranes Using Ultrasonic Frequency-Domain Reflectometry. Membranes 2011, 1, 195–216. [Google Scholar] [CrossRef] [Green Version]
  22. Portugal, C.A.M. Functional membranes for control of protein-surface interactions and transport properties. Curr. Org. Chem. 2017, 21, 1725–1739. [Google Scholar] [CrossRef]
  23. Aguero, R.; Bringas, E.; Román, M.S.; Ortiz, I.; Ibañez, R. Membrane processes for whey proteins separation and purification. A review. Curr. Org. Chem. 2017, 21, 1740–1752. [Google Scholar] [CrossRef]
  24. Bramaud, C.; Aimar, P.; Daufin, G. Whey protein fractionation: Isoelectric precipitation of a-lactalbumin under gentle heat treatment. Biotechnol. Bioeng. 1997, 56, 391–397. [Google Scholar] [CrossRef]
  25. Salgin, S.; Salgin, U.; Bahadir, S. Zeta potentials and isoelectric points of biomolecules: The effect of ion types and ionic strengths. Int. J. Electrochem. Sci. 2012, 7, 12404–12414. [Google Scholar]
  26. Yan, Y.; Seeman, D.; Zheng, B.; Kizilay, E.; Xu, Y.; Dubin, P.L. pH-dependent aggregation and disaggregation of native β-lactoglobulin in low salt. Langmuir 2013, 29, 4584–4593. [Google Scholar] [CrossRef]
  27. Arunkumar, A.; Etzel, M.R. Fractionation of α-lactalbumin and β-lactoglobulin from bovine milk serum using staged, positively charged, tangential flow ultrafiltration membranes. J. Membr. Sci. 2014, 454, 488–495. [Google Scholar] [CrossRef]
  28. Chayen, N.; Dieckmann, M.; Dierks, K.; Fromme, P. Size and shape determination of proteins in solution by a noninvasive depolarized dynamic light scattering instrument. Ann. N. Y. Acad. Sci. 2004, 1027, 20–27. [Google Scholar] [CrossRef] [PubMed]
  29. Mazzei, R.; Drioli, E.; Giorno, L. Biocatalytic membrane reactor and membrane emulsification concepts combined in a single unit to assist production and separation of water unstable reaction products. J. Membr. Sci. 2010, 352, 166–172. [Google Scholar] [CrossRef]
  30. Mazzei, R.; Drioli, E.; Giorno, L. Comprehensive Membrane Science and Engineering. Biocatal. Membr. Membr. Bioreact. Compr. Membr. Sci. Eng. 2010, 3, 195–212. [Google Scholar]
  31. van Reis, R.D. Charged Filtration Membranes and Uses Therefor. U.S. Patent 7,001,550B2, 26 December 2006. Available online: https://app.dimensions.ai/details/patent/US-7153426-B2 (accessed on 21 September 2021).
  32. Filipe, C.D.; Ghosh, R. Effects of protein–protein interaction in ultrafiltration based fractionation processes. Biotechnol. Bioeng. 2005, 91, 678–687. [Google Scholar] [CrossRef] [PubMed]
  33. Holland, B.; Kackmar, J.; Corredig, M. Short communication: Isolation of a whey fraction rich in α-lactalbumin from skim milk using tangential flow ultrafiltration. J. Dairy Sci. 2012, 95, 5604–5607. [Google Scholar] [CrossRef] [PubMed]
Figure 1. Schematic representation of cross-flow ultrafiltration system used. PG: pressure gauges, PP: peristaltic pump, V: valve. The same system was used to work in recycle mode (recirculating the permeate) and in concentration mode.
Applsci 11 09167 g001
Figure 2. Zeta potential measurement of pure BLG and ALA solutions within pH range 3.0–3.5: ionic strength 0.1 M.
Applsci 11 09167 g002
Figure 3. Time course of the UF carried out in concentration mode through charged membrane, by using different initial binary protein mixture concentration; pH: 3, T: 25 °C, ionic strength: 0.1 M.
Applsci 11 09167 g003
Figure 4. SDS-PAGE carried out on (a) standard solutions used to carry out molecular weight (MW) determination and quantification of proteins in binary protein mixture. 1: solution containing both ALA and BLG (1 g·L−1); 2: wide range molecular weight marker (1:20 dilution); 3: internal molecular weight standard (formed by ALA, BLG, and BSA); (b,c) on permeates collected as a function of time, when UF process was carried out at pH 3. IS: initial solution concentration. The dilution of permeates samples and IS of (c) is: 1:2.
Applsci 11 09167 g004
Figure 5. Time course of the UF flux of binary protein mixture (ALA + BLG), carried out in concentration mode through charged membrane by using different initial mixture concentration; pH: 3.4, T: 25 °C, ionic strength: 0.1 M.
Applsci 11 09167 g005
Figure 6. SDS-PAGE carried on permeates collected as a function of time when the UF process was carried out at pH 3.4. IS: initial solution concentration. (a) IS: 0.5 g·L−1; (b) IS: 1 g·L−1; (c) IS: 2 g·L−1 (IS and samples dilution: 1:2).
Applsci 11 09167 g006
Table 1. Protein diameter and molecular weight of ALA and BLG, varying pH from 3 to 3.4.
pHProtein Diameter (nm)Molecular Weight (kDa)Pd (%) *
ALA3.03.62 (±0.60)13.5 (±4.5)14.7
3.23.62 (±0.48)13.5 (±3.9)15.2
3.43.62 (±0.36)13.5 (±5.3)16.0
BLG3.04.19 (±0.71)19.0 (±5.4)15.4
3.24.19 (±0.99)26.7 (±10.1)19.5
3.44.89 (±1.36)26.7 (±6.5)27.1
* Polydispersity Pd (%): Pd < 20 = monodisperse; %Pd > 20 = polydisperse.
Table 2. Critical pressure, hydraulic resistance of membrane, and fouling components obtained by ultrafiltration of binary protein mixture at different initial concentration and pH.
Protein Mixture
(g·L−1)
pHCritical Pressure (bar)Critical Flux
(L·h−1·m−2)
Rtot
(m−1)
Rm
(m−1)
Rfrev
(m−1)
Rfirr
(m−1)
0.5 3.00.268 (±5)1.00 × 10¹² (±3.00 × 10¹⁰)9.67 × 10¹¹ (±5.80 × 10¹⁰)3.34 × 10¹⁰ (±2.34 × 10⁹)0
3.40.264 (±5)1.24 × 10¹² (±7.44 × 10¹⁰)1.01 × 10¹² (±5.00 × 10¹⁰)1.64 × 10¹¹ (±2.40 × 10¹⁰)2.20 × 1010 *
1 30.270 (±3)1.18 × 10¹² (±9.44 × 10¹⁰)8.29 × 10¹¹ (±5.80 × 10¹⁰)3.50 × 10¹¹ (±2.45 × 10¹⁰)0
3.40.268 (±3)1.68 × 10¹² (±1.01 × 10¹⁰)8.7 × 10¹¹ (±5.22 × 10¹⁰)8.10 × 10¹¹ (±4.86 × 10¹⁰)0
2 3.00.135 (±5)1.16 × 10¹² (±6.96 × 10¹⁰)9.20 × 10¹¹ (±4.60 × 10¹⁰)2.15 × 10¹¹ (±2.60 × 10¹⁰)2.56 × 1010 *
3.40.125 (±5)1.68 × 10¹² (±8.40 × 10¹⁰)9.73 × 10¹¹ (±5.84 × 10¹⁰)6.79 × 10¹¹ (±4.75 × 10¹⁰)2.62 × 10¹⁰ *
Rm = hydraulic resistance due to the membrane; Rtot = hydraulic resistance due to membrane and fouling; Rfirr = hydraulic resistance due to irreversible fouling; Rfrev = hydraulic resistance due to reversible fouling. * It is worth underlining that the Rfirr is within the error range of Rm and Rtot; this confirms its negligible contribution to Rtot.
Table 3. ALA recovery factor and purity in the permeate as a function of initial protein mixture concentration and constant flux during UF carried out at pH 3.4.
Initial Binary Protein Mixture
Concentration (mg/mL)
ALA Recovery Factor (%)ALA Purity (%)
0.53395
1.032
2.033
Publisher’s Note: MDPI stays neutral with regard to jurisdictional claims in published maps and institutional affiliations.

