1. Introduction
The use of biogas as a fuel comprises three essential aspects. Biogas is a renewable fuel that is produced from the anaerobic digestion of wastes such as animal manure, food, agricultural, domestic wastes, and sewage sludge. This gas contains methane (CH
4) and carbon dioxide (CO
2) as major components, with the latter reaching concentrations up to 40% or even more depending on reactor conditions. Methane content in biogas has average values between 51–55% [
1]—data reported from the evaluation of Italian biogas plants treating different organics—the high CO
2 levels adversely affect the heating value of biogas, combustion characteristics and composition of emitted gases [
2]. The valorization of this gas to produce energy aids in climate change mitigation and reduces the use of fossil fuels. The digestion process also generates a digestate, that can be treated as a residue or as a valuable by-product used as an organic amendment [
3,
4], allowing nutrient recycling.
A great emphasis has been placed on increasing the efficiency in biogas production as a second-generation biofuel [
5,
6]. The continuous increase in the global energy demand and the fact that the primary energy resources available, such as oil, natural gas, coal and nuclear fuel are not renewables, forces the scientific community to search for alternative sources and increase the efficiency of conversion processes for producing bioenergy. Anaerobic digestion can also contribute to reducing the environmental impact and emission of CH
4 as it allows targeting conversion processes, eliminating uncontrolled degradation and dispersed emission of pollutants. In this way, the valorization of biogas can be achieved in waste treatment plants for producing energy or upgraded to achieve a quality similar to that of natural gas [
7].
Several studies have focused on improving digestion performance of sewage sludge by the application of different techniques, through the addition of supplements [
8,
9,
10], the application of pre-treatments [
11,
12,
13], and co-digestion [
14,
15,
16] as a way of enhancing biogas production and benefiting from the common utilization of plant equipment. The introduction of a pre-treatment unit in an existing digestion plant causes changes in the electrical and thermal demand because of the additional equipment installed.
There is an increasing concern about the energy demand and emissions derived from the use of fossil fuels, creating social pressure for making alternative fuels more accessible and economically feasible in accordance with sustainability criteria. Renewable sources offer a wide range of attractive options, as they are unlimited, but the degree of dispersion that this type of energy production has may condition their feasibility [
17]. Digestion plants for treating sewage sludge, livestock, food and agricultural wastes to produce biogas have been installed worldwide. However, several studies reported that the plant scale closely affects techno-economic viability, which is associated with the availability of financial incentives such as feed-in tariffs and electricity selling price [
18,
19]. Levelized costs related to electricity production are lower for large-scale plants because large-scale devices have more efficient conversion coefficients and lower capital costs per unit of electricity produced [
20]. Additionally, energy performance studies should consider the whole plant configuration and the energy demand linked with each specific process unit. Otherwise, any attempt to increase biogas yields may lead to a disappointing global performance because of the extra energy demand [
21].
The use of biogas in engines and boilers has become the most common way of valorizing biogas. The use of combined heat and power (CHP) engines for heat and electricity production shows better performance in terms of greenhouse gas (GHG) emission reduction due to the on-site use of electricity [
22]. However, this option is not always feasible based on the geographical location of the plant and the performance of the digestion process [
23]. Biogas composition affects engine efficiency in different ways. Feroskhan and Ismail [
24] studied an engine in dual fuel mode with diesel as pilot fuel and biogas as the main fuel for which different methane compositions were evaluated. These authors suggested that exhaust gas temperature and air–fuel ratio were the key engine parameters affected, with the latter exhibiting a marginal increase with methane enrichment. However, when evaluated as a single fuel in compression engines, the presence of CO
2 showed detrimental engine performance with increasing content.
Gupta and Mittal [
25] indicated that increasing levels of CO
2 in biogas leads to a decrease in the brake thermal efficiency, whereas the flame initiation and combustion durations were increased. Nitric oxide (NOx) emissions were reduced, but as a detrimental effect, these authors reported an increase in hydrocarbon and carbon monoxide (CO) emissions. On the other hand, the high CO
2 content in biogas gives it a greater resistance to detonation, the latter being a phenomenon that, if it occurs during combustion, adversely affects the efficiency, emissions and durability of engines [
26]. Hydrogen sulfide (H
2S) is another common component of biogas. Its presence may have negative consequences to human health and impacts equipment durability [
27]. Therefore, it is usually removed by different methods such as reaction with iron oxides or by biological techniques [
28,
29].
Turbocharging is an efficient technology available for increasing the effectiveness of engines and output power [
30]. Turbochargers are widely used in internal combustion reciprocating engines, as they increase power thanks to the compression effect, allowing a greater mass of air to flow into the cylinder whilst recovering a proportion of the exhaust gas energy [
31,
32]. Since cylinder capacity is increased, keeping size constant, this action is known as downsizing [
33]. The basis of turbocharging is to increase engine power by introducing a greater amount of air and fuel into the cylinders, as the air–fuel ratio is restricted to a very narrow range to achieve complete combustion. Standard petrol engines operate with compression ratios between 6:1 and 10:1 [
34], to avoid self-ignition of the air–fuel mixture. Increasing the compression ratio to 16–18 improves the efficiency and power output. This can be attained when biogas is used as fuel due to its good detonation resistance [
35]. The use of biogas using a dual-fuel turbocharged engine was evaluated by Ahmed et al. [
36]. These authors concluded that the presence of biogas did not adversely affect brake thermal efficiency.
The present manuscript aimed to analyze the energy balance of turbocharged biogas engines operating at the Burgos wastewater treatment plant (WWTP), where thermal hydrolysis sludge pre-treatment units are installed. Biogas is used for producing electricity and thermal energy. The energy efficiency of the plant was evaluated considering the addition of a co-substrate to enhance biogas production and analyze its effect on the energy balance. The engine thermal circuits were studied to establish the efficiency of the global energy system and its improvement. A sensitivity analysis of the main operating parameters of the engines and cooling circuits was carried out.
The analysis performed considered the operating point of the WWTP and assumed the production of biogas from thermally pre-treated sludge as a baseline scenario. A comparison regarding electricity production was made if a co-substrate was available to enhance digestion performance and take advantage of the high treatment capacity of the plant. It was essential to consider the hypothesis that the characteristics of the co-substrate regarding digestibility could prevent the system from reaching energy autarky.
2. Materials and Methods
2.1. General Operating Conditions
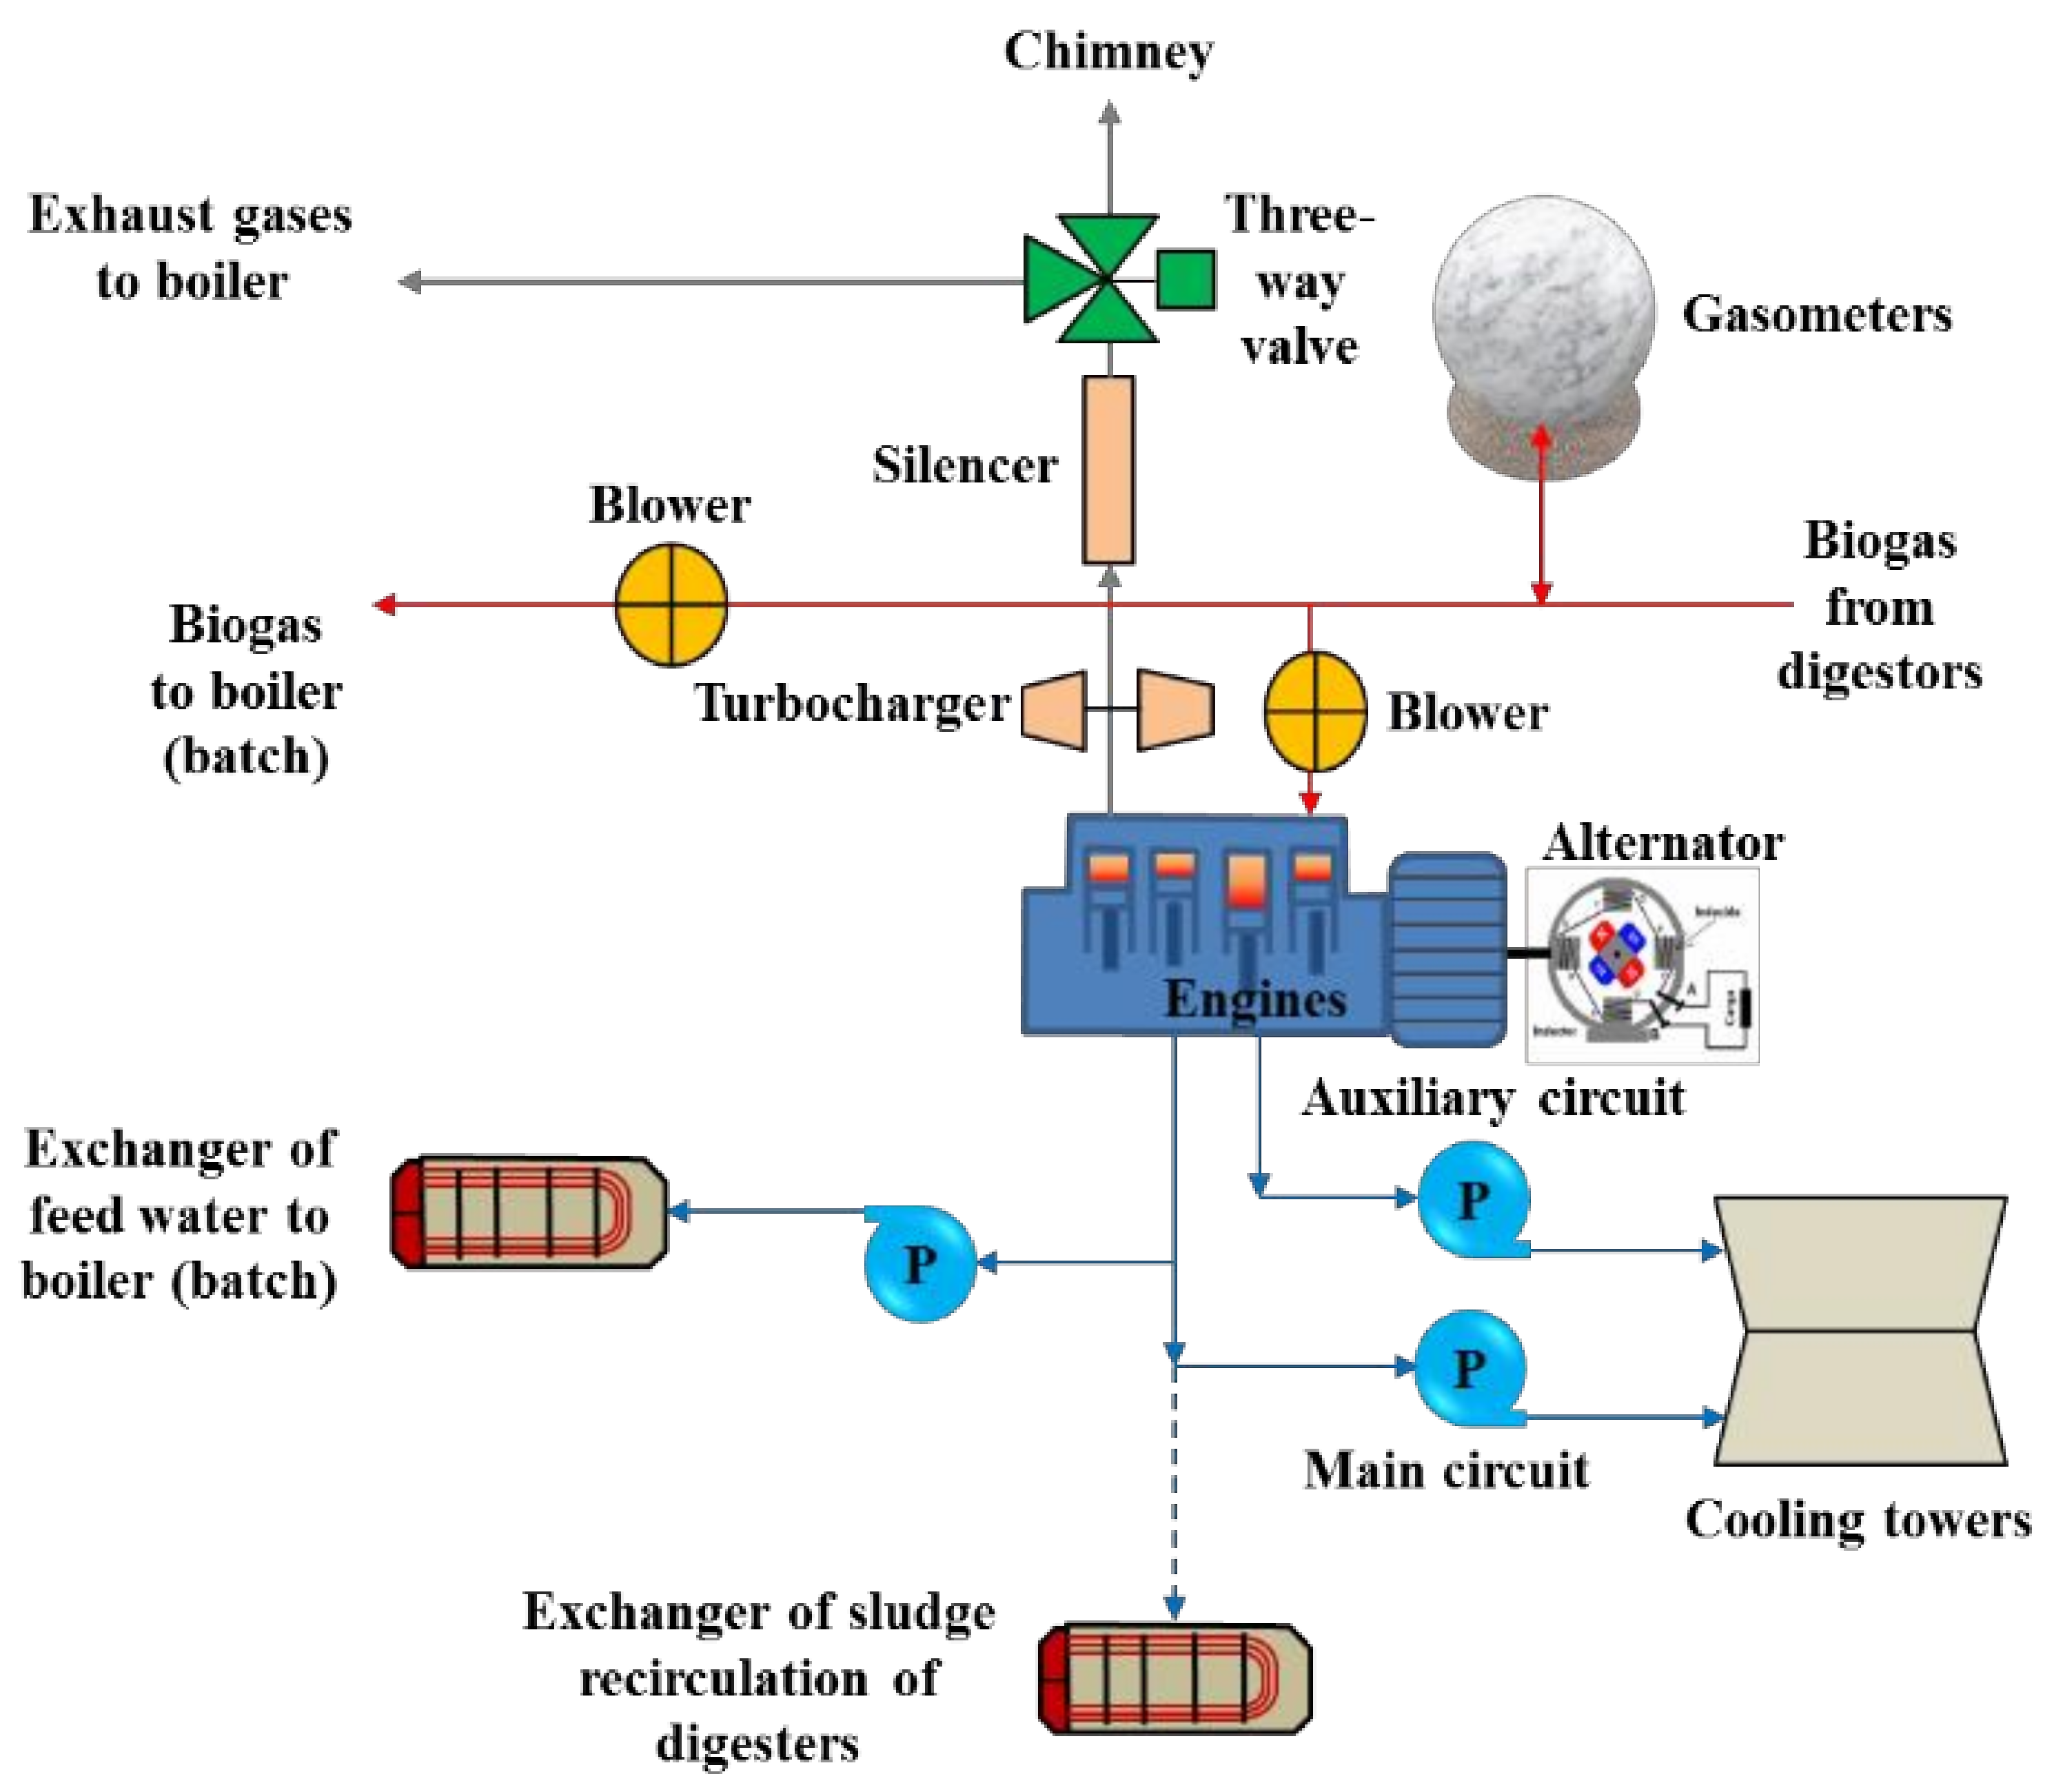
Figure 1 shows the operating diagram of biogas engines in the WWTP of Burgos (Spain). The WWTP treats domestic wastewater from the surrounding area. The treatment capacity is 156,504 m
3/d and 1,056,692 e.i. (equivalent inhabitant). The plant has the following sections: (1) pretreatment, where greater size objects, sand and grease are removed, (2) primary decanters, (3) secondary treatment consisting of the conventional activated sludge system, and (4) tertiary treatment consisting of lamellar decanters, ozone and ultraviolet rays.
The primary sludge is sent to a gravity thickener to increase solid concentration. Waste activated sludge (WAS) is concentrated by air flotation thickeners. The sludge line is composed of the thickening, anaerobic digestion, conditioning and digestate dewatering section. Biogas is produced from mesophilic digesters. The sludge is a mixture of primary sludge and WAS. Sludge is preheated by thermal hydrolysis (165 °C) and then cool to 50 °C. This temperature takes into account heat losses by thermal transmission in pipework and digesters. The plant uses Cambi thermal pre-treatment technology, which is a batch-type process using flash steam preheating [
21]. The hydraulic retention time (HRT) of the digestion reactor is 17 days and the temperature is 41 °C. Four rotary vane biogas compressors are used for mixing the digester content, with a flow capacity of 448 m
3/h each (measured at standard temperature and pressure conditions). Four gasometers with a capacity of 703 m
3/each are available for biogas storage and four biogas engines for electricity production.
The mixed recovery boiler also consumes a small quantity of biogas to generate steam for the thermal hydrolysis unit. The exhaust gas from the engines at the turbocharger’s outlet is sent to the silencers, then to the recovery boiler and finally, to the stack. The thermal energy from the auxiliary cooling circuit is dissipated in cooling towers. A fraction of the energy from the main circuit is sent to the boiler heat exchanger to preheat the feeding water. Energy surplus is dissipated in cooling towers. The thermal energy of the main circuit is only used for heating the digesters when thermal hydrolysis is not operating. Gasometers are used to store biogas, maintain the system pressure and supply biogas to the boiler—when steam injection stage takes place—and to the gas engines.
2.2. Wastewater Treatment Plant (WWTP) Parameters
Table 1 presents data regarding biogas production and consumption of Burgos WWTP. Values correspond to the operating point of the plant reported in García-Cascallana et al. [
21], where a detailed description is given. This operating point is based on biogas consumption of the boiler and engines. This point also considers the use of engine exhaust gases in the mixed recovery boiler during an average operating cycle, where injection and no injection stages of steam are evaluated.
The theoretical analysis of the biogas line was also evaluated considering the addition of a co-substrate for increasing electricity production. The recovery of thermal energy in the plant is also analyzed under this configuration. Mass and energy balances were performed for the co-digestion scenario assuming the availability of readily degradable co-substrate and also the application of thermal hydrolysis to a complex co-substrate.
2.3. Engines
The plant has four internal combustion engines, namely spark ignition, Otto cycle, four strokes, cooled by a water circuit. The engines are Guascor type SFGLD360s one step turbocharging and intercooling, having a V two-rows of six-cylinder disposition and operating under lean-burn conditions—(λ) of 1.3–1.7—. The engines are of the square type with a stroke/bore ratio close to unity. Carburetion is electronic, blowing the lean mixture into the turbocharger and inlet manifolds to the cylinders. The biogas is sent from the gasometers or digester head to the engines—at 100.7 kPa and 30 °C—by four side channel blowers equipped with frequency converters. The blower nominal flow rate is 300 m3/h at 2800 rpm, raising the pressure to 115 kPa and the temperature to 55 °C, before being introduced into the biogas ramp and carburetor, where it is mixed with the admission air, compressor and inlet manifolds before entering the combustion chamber. The operating principle of the carburetor is a Venturi effect. Air flows through the carburetor creating a vacuum proportional to the air velocity, causing biogas to enter and homogenously mix with air. The pressure in the carburetor cannot be higher than atmospheric pressure 101 kPa, a restriction achieved by an electronic controller.
According to the indications of the load/speed controller, a throttle valve at the outlet of the intercooler regulates the air–biogas ratio and the engine power. The intercooler lowers the temperature of the cylinder inlet air, thus preventing uncontrolled detonation and increasing its density. The compression ratio of turbocharging is usually 2–4. The exhaust gases enter the turbine radially and leave it axially, whereas, it is the other way around for the compressor—the air inlet is axial and the outlet radial—. The centripetal turbine is driven by the exhaust gases and is mechanically coupled at the same centrifugal compressor shaft. The engines are cooled by water in closed circuits using plate-type heat exchangers.
The engine is a four-stroke and every two crankshaft turns (angle of rotation 2 × 360°) causes one drive stroke in each of the cylinders. Therefore, there is a driving stroke in the cylinders each 120° (720°/6 = 120°), with a firing order of sequence 1-8-5-10-3-7-6-11-2-9-4-12, achieving good smoothness when running. The alternator converts mechanical energy into electrical energy by a synchronous generator of 753 kVA, 400 V. A pair of poles keep synchronism rotating at 1500 rpm, frequency 50 Hz and allows a power variation factor of 0.8–1.
The residual thermal energy of the engine exhaust gases is used in the mixed recovery boiler. A fraction of the thermal energy from the main cooling circuits is used for preheating the boiler feed water. At the Burgos WWTP, the maximum degree of loading at which engines operate is 90% of the rated power as a preventive maintenance requirement to extend engine service life and reduce the frequency and number of maintenance stops for spark plug replacements.
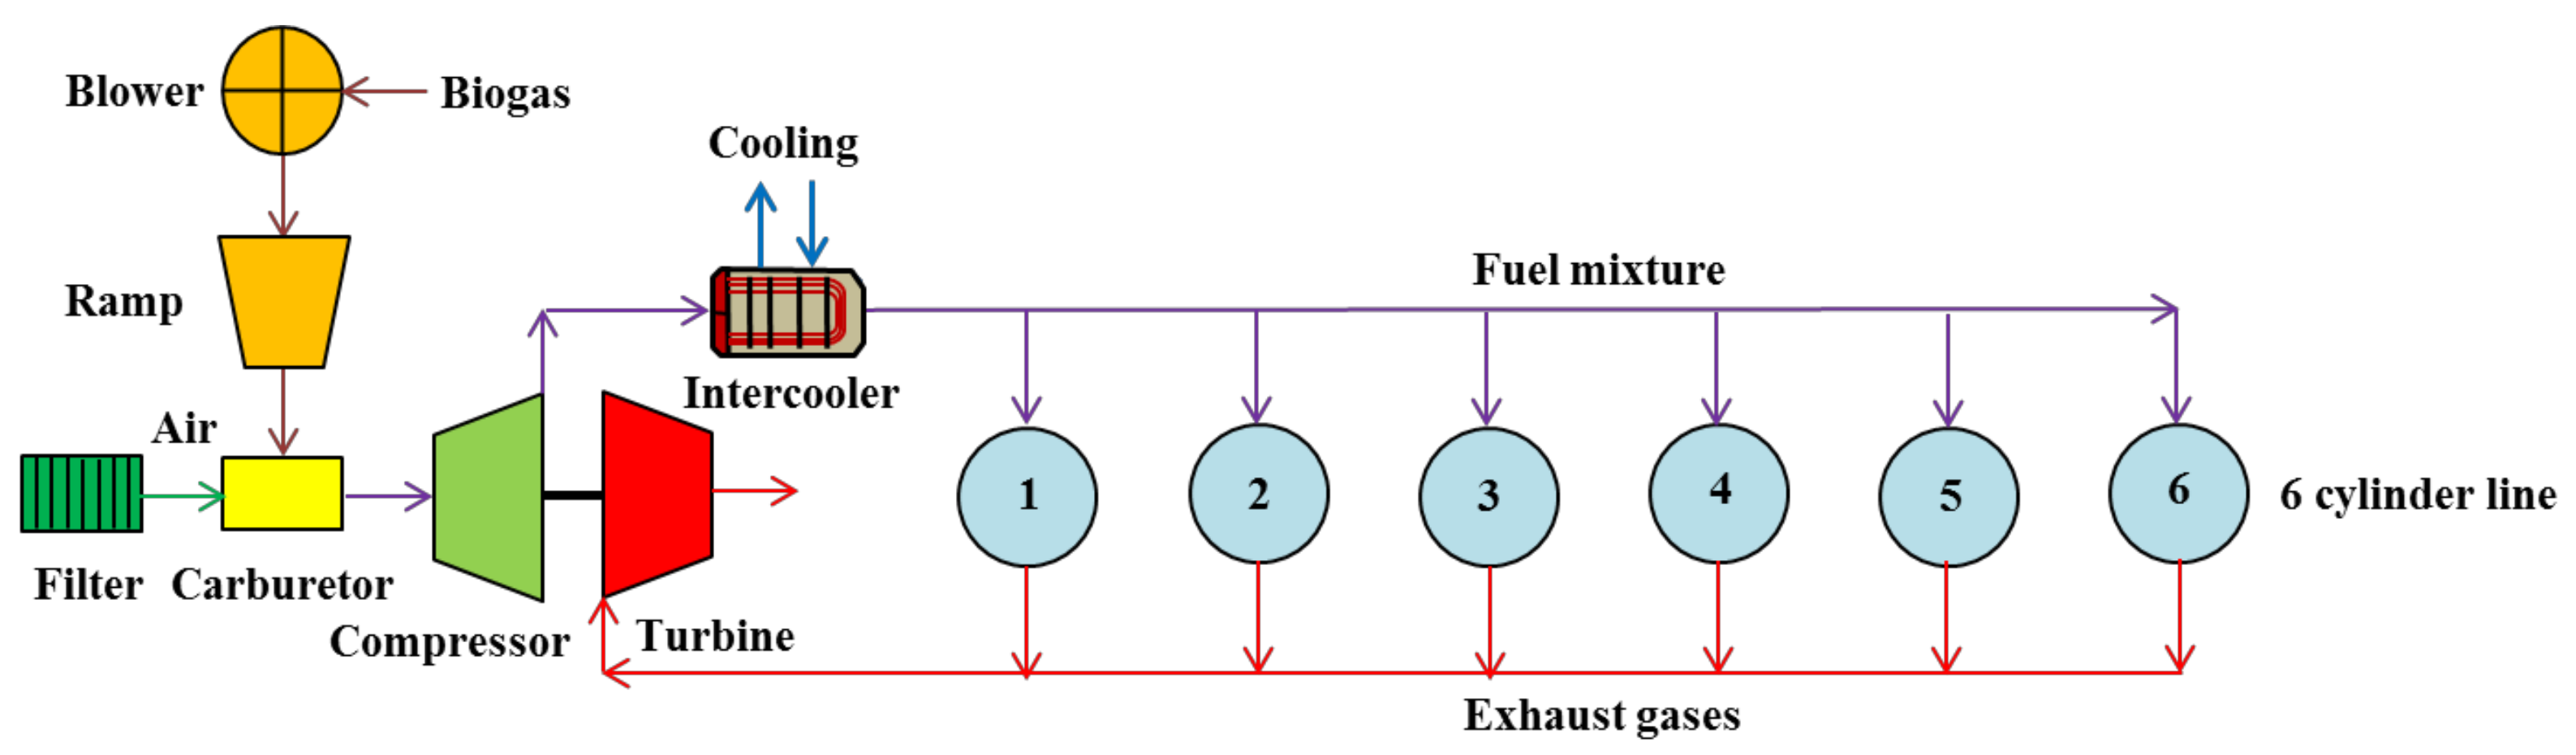
Figure 2 shows a diagram of one of the six cylinders’ lines of the engines. Each engine has two lines of this type accounting for 12 cylinders. The electrical power generated depends on the conditions of the inlet air, such as temperature, pressure, humidity and the backpressure of the exhaust gas circuit and biogas composition.
The reference conditions for the engine parameters ISO 3046/1 are: 100 kPa ambient pressure, 25 °C ambient temperature and 30% relative humidity. The tolerances at 100% of degree of loading are: biogas consumption ±5%, main, auxiliary and emergency cooling circuits and exhaust gases ±15%, mechanical losses and radiation ±25%, exhaust gas temperature ±20 °C, and air and gas mass flow ±10%.
Table 2 shows the key parameters of the biogas engines analyzed.
The biogas ramp for controlling the cylinder biogas supply has a pressure regulation between 112.8 and 116.3 kPa. The engines are equipped with an exhaust gas silencer with 30 dB sound attenuation and an exhaust gas distribution valve (three-ways). This valve sends the gas flow to the boiler heat recovery zone or directly to the atmosphere through the chimney.
Table 3 shows the different values obtained for the operating parameters of the engines based on the loading degree. The engine rotation speed is constant for any degree of loading to maintain synchronism with the alternator speed.
The mechanical power is affected by the inlet air density, which varies with the altitude and ambient temperature. Equation (1) calculates the engine mechanical efficiency losses (
Lossesη-a) due to altitude. Equation (2) estimates losses (
Lossesη-T) due to the inlet air temperature [
37] and finally, Equation (3) is used to calculate the air atmospheric pressure (p
atm) as a function of altitude:
where
z represents the altitude measured at sea level and expressed in m, T
env is the temperature of the location, and p
atm-0 stands for the atmospheric pressure at sea level.
a and
b are constants (a = 2.2557 × 10
−5 m
−1, b = 5.2559). The altitude of Burgos is 859 m above the sea level, but the engines of the WWTP are at 830 m above sea level, so the real atmospheric pressure considered in the present manuscript for evaluating engine performance was 91.7 kPa with an air density of 1.07 kg/m
3 at 25 °C.
2.4. Engine Cooling System
Each engine has three different cooling systems. The main system is comprised of the block, crankcase and cylinder cooling jacket and it is refrigerated by two circuits, the primary and the secondary circuit, separated by a plate heat exchanger. The secondary cooling system supplies the energy needed for preheating the boiler feed water (batch operation) and the surplus heat is dissipated in cooling towers. The second cooling system is known as Auxiliary. This circuit is composed of the intercooler and lubricating oil circuit, also having two internal circuits, as in the previous case. This cooling system keeps the air–fuel mixture temperature at 65 °C to limit the risk of detonation before combustion takes place in cylinders. The heat absorbed from the air–fuel mixture is dissipated in the cooling towers. The oil outlet temperature of the heat exchanger is between 75 and 90 °C.
The third cooling system is the Emergency system. This system aids in cooling the block, crankcase and cylinder jackets, and it is deployed when the main circuit is not capable of removing all the heat. The primary circuit of this system is located in series with the main cooling system, and the secondary circuit is located in series with the auxiliary circuit. Since each engine has two lines of six V-cylinders, there are two blocks of cooling systems for the crankcase and cylinder jacket, and two others for the intercooler and oil exchangers. In calculations, they were considered to be arranged in parallel. The three circuits consist of plate heat exchangers, expansion vessels, three-way thermostatic valves (to allow a regulation of 8–10 °C temperature), temperature probes, manometers, and circulation pumps for the primary and secondary circuits. The fluid used in the heat exchanger of the primary circuit is a mixture of water and 20% glycol. Secondary cooling systems and cooling towers use water as fluid. The efficiency of the cooling exchangers was assumed as unity.
The WWTP has a total of seven cooling towers with forced draught, having a nominal thermal power of 274 kW each, making a total of 1918 kW of install nominal cooling capacity. Four towers are used to cool the main system, two for the auxiliary and one in reserve.
Table 4 shows the parameters of the three cooling systems.
2.5. Engine Parameters and Efficiency
Equation (4) is used to calculate the average linear piston speed (
Ceng), Equation (5) for the effective biogas consumption (
geff), and Equation (6) for the volumetric efficiency of the engine (
ηv):
where
St is the stroke length (m),
n represents the rotation speed in revolutions per minute (rpm) at which the engine is running. The density of biogas (ρ
biogas) was assumed as 1.15 kg/m
3 at standard temperature and pressure conditions. The mechanical efficiency of the engine (
ηmec-eng) is a parameter considered as a function of the degree of loading. The mass of air–fuel mixture (
Mmix) is used for estimating
ηv, using as density (ρ
ref-mix) a variable value calculated based on the impulsion pressure, and outlet temperature of the mixture exiting the turbocharger.
Vt corresponds to the cylinder displacement volume and
nstroke is the number of strokes per cycle.
The electrical efficiency (
ηel-eng) is calculated using Equation (7).
EP and
TP in the formula stand for electrical and thermal power. Equation (8) calculates the thermal efficiency (
ηthermal-eng) based on the ratio between the useful thermal power of the engine (
TPuseful-eng) and the thermal power contained in biogas and consumed by the engine (
TPbiogas-eng). Equation (9) estimates the energy efficiency (
ηenergy-eng), and Equation (10) estimates the usable thermal energy factor of the engine (
UTEF) considering the thermal power that has application in the WWTP, that is, the power used (
TPusable-eng) against the value of the thermal power susceptible of application. Equation (11) estimates the work/heat ratio of engine
(W/Q)eng, as the ratio between the mechanical power of the engine (
MPeng) and
TPuseful-eng:
Equation (12) estimates the ratio of the stoichiometric mass of air (
Astoich) for biogas combustion considering molar fraction of methane in biogas (
XCH4) and the molecular weight of biogas and air (MW
biogas, MW
air). Equation (13) estimates the stoichiometric ratio (
Fstoich) for biogas–air:
The ratio of biogas–air (F) at the engine operating conditions is obtained from Equation (14) in terms of the mass flow of exhaust gases (
Meg) and the mass of air (
Mair). The ratio of Air per unit of fuel (
Areal) is given by Equation (15) and the mass of excess air is estimated using Equation (16):
The Guascor engines work with a biogas–air ratio of approximately 9.6%. This translates into a large excess of combustion air over stoichiometric conditions, resulting in an average O2 content in the exhaust gas of about 9%. It is assumed that the exhaust gas enthalpy is about the same as that of air under the same conditions, as these gases have, as main components, N2 followed by CO2, O2 and traces of water vapor. All these compounds have specific heat values very similar to air for the temperatures considered, except for water vapor, but this has a negligible effect because of its small content in exhaust gases.
Equation (17) is a NASA polynomial equation valid for temperatures between 200–1000 K [
38] and allows calculating specific heat values for air (
Cp-air) as a function of the temperature (K) (
Tair). In this equation, R
g is an ideal gas constant with a value of 0.287 kJ/kg K. Equation (18) and Equation (19) are used to calculate the specific enthalpy of air (
hair), equivalent to that of the mixture air–biogas (
hmix), and the enthalpy of exhaust gases (
heg). Equation (20) establishes the equivalence for
Cp-air and the specific heat values of gas mixture and exhaust gases (
Cp-mix, Cp-eg). Equation (21) is used to calculate the specific entropy:
2.6. Electricity Production
The degree of loading is calculated from Equation (22) considering the ratio between the mechanical power of the engine (
MPeng) and its nominal value (
MPeng-nom) and expressed as percentage. Equation (23) estimates the installed electrical capacity utilization factor (
IECUF) as the ratio between the electrical power generated by the engines (
EPeng) and the electrical power installed (
EPinst). Equation (24) estimates the degree of electrical power self-consumption (
DSC) in the WWTP as the ratio between the
EPeng and the electrical power consumed in the plant (
EPconsumed):
Savings obtained from electricity self-consumption were estimated by considering the price of electricity in Spain for medium voltage. A value of 92 €/MWh was used for electricity for the range of 2000–20,000 MWh/year [
39].
2.7. Turbocharging
Each of the two rows of cylinders has a turbocharger with a centrifugal compressor driven by a centripetal turbine from the exhaust gases and an intercooler. Equations (25) and (26) calculate
MPeng developed by the internal combustion engine:
where
ηet is the engine effective efficiency. Equation (27) calculates the pressure ratio of the compressor (
rc), neglecting the pressure losses in filter, intercooler and inlet manifold to cylinders. This equation considers the outlet pressure of the compressor (
p1) and the isentropic outlet pressure as equivalent (
p1S):
Equation (28) is used to calculate the temperature of the isentropic mixture at the compressor outlet (
T1S), and the isentropic efficiency (
ηis-C) is calculated from Equation (29), considering the compressor outlet temperature (
T1) and the inlet temperature (
T0). γ is the adiabatic index:
The thermal power of the compressor (
TPC) is estimated using the temperature difference between the outlet and inlet temperature as well as the specific heat value for the gas mixture (
Cp-mix) as shown in Equation (30):
In a similar way, the thermal power of the intercooler (
TPIC) is also estimated using Equation (31) with the outlet theoretical temperature (
T2S) included in the temperature difference term:
The efficiency of the intercooler (
ηIC) is calculated as:
where
T2 is the temperature of the mixture at the intercooler outlet. The mechanical power of the turbine (
MPT) is calculated from Equation (33) using the temperature difference between the exhaust gases’ inlet (
T3) and outlet (
T4) stream. The isentropic efficiency of the turbine (
ηIS-T) is given by Equation (34) denoting the outlet isentropic temperature of turbine exhaust gases as (
T4S):
Equation (35) expresses the pressure relationship for the turbine under isentropic conditions, with
p4S denoting the pressure of the outlet exhaust gases’ stream under isentropic conditions and
p3 representing the pressure of the gas stream entering the turbine. The expansion of the exhaust gases in the turbine is assumed as an irreversible flow due to the adiabatic assumptions based on the small contact surface and the short residence time, considering also steady flow at the inlet and outlet zone. Compressors have three boundary zones, pumping, blocking and over speed zones whilst turbines have none. To achieve the necessary exhaust back-pressure, the turbine opposes to the flow of gases. For this reason, its effective passage area must be small enough, and this feature is called permeability. The turbine discharge pressure is obtained from summing up the reference pressure of the inlet gas mixture to the compressor (
p0) and the outlet back-pressure of exhaust gases (
pbp), see Equation (36). Equation (37) represents the turbine expansion ratio (
rexpansion):
The turbine is subjected to pulses from the cylinder gases, and a shaped volute configuration is used to attain better efficiency. The twinning between compressor-turbine must achieve the equality for mechanical powers considering performance losses. Equation (38) represents the relationship between the two mechanical powers of the compressor and turbine given by the mechanical efficiency
ηmec-T. The equality for the rotation speed of the two turbomachines (
nC,
nT) is given by Equation (39):
The increase in back pressure in a turbocharged system causes a decrease in pressure ratio across the turbine. Therefore, the engine has to pump the gases out of the cylinder against a higher pressure, reducing the efficiency and increasing fuel consumption [
40]. The back pressure must be kept to the minimum value necessary to achieve higher turbine efficiency and thus higher engine efficiency [
41].
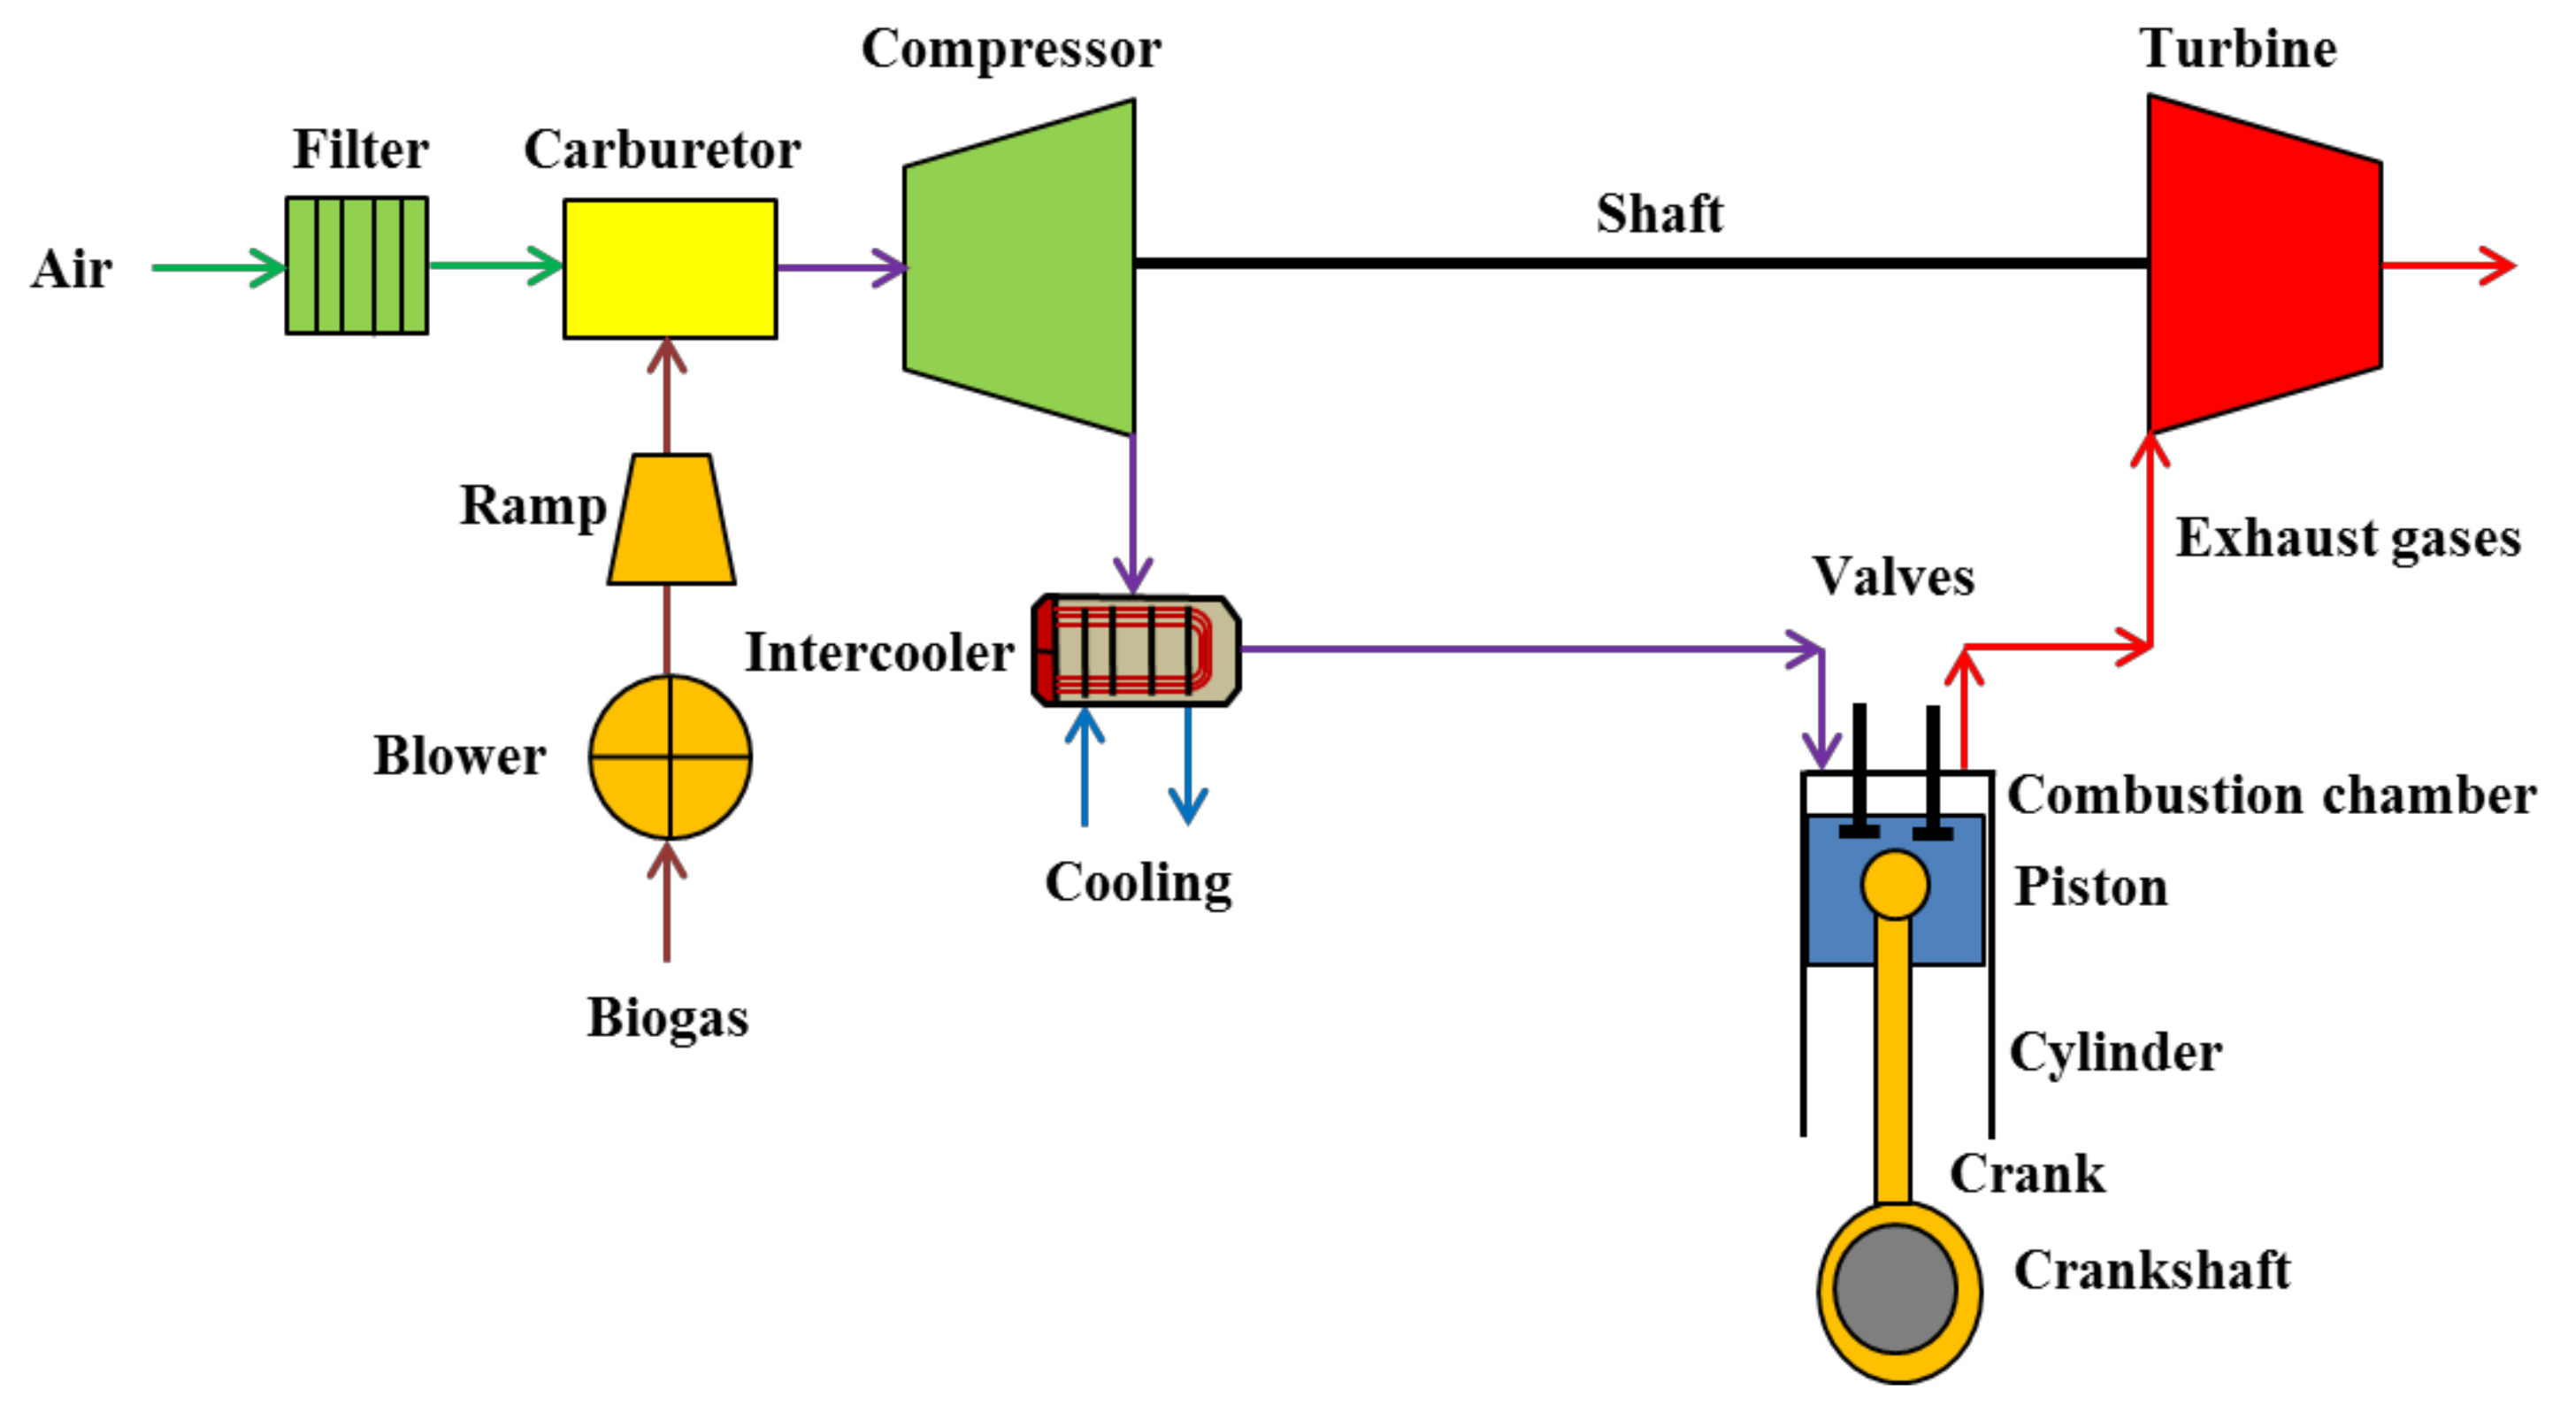
Figure 3 shows a diagram of a turbocharger. The compression of the inlet air is driven by the turbine through the exhaust gases. The main components are: air filter, compressor, intercooler, common coupling shaft, and turbine.
Table 5 shows the values required for calculating the compressor and the turbine parameters for the turbocharger. The thermodynamic parameters of a turbocharger are calculated by means of performance maps, which are usually generated experimentally on test benches and are used as a look-up table for engine models [
42].
2.8. Sensitivity Analysis
The energy parameters of the engines were evaluated by considering the effect on the output at varying values of the input variable. The degree of loading was selected as the independent input variable varying in a range between 40 and 100%. Sensitivity analysis is an instrument for the assessment of the input parameters and their impact on the model output [
43]. Sensitivity analysis and model validation are linked in that these techniques attempt to assess the appropriateness of a particular model specification and to establish the strength of the conclusions drawn from the model [
44]. Different variables measuring engine performance were selected as the response variable of the model. Regression methods are usually used to replace high complex models and regression coefficients provide a means of applying sensitivity rankings to input parameters [
45]. The R
2 value was calculated to estimate the adequacy of the model to data. This parameter is a summary statistic that represents the proportion of total variance of the response. The R
2 has a range from 0 to 1, where values close to 0 indicate that the model does not appreciably summarize the behavior of the response, and values close to 1 indicate that a high proportion of the variance is explained by the regression model [
44].
3. Results and Discussion
The engine energy parameters were evaluated considering the range associated with the minimum degree of loading and maximum operating value. Once the response of the system is established, it is subsequently analyzed by the effect of coupling multiple engines as the availability of biogas increases. The engine energy balance was also studied in detail along with the associated cooling circuit to establish particular points where energy recovery should be improved. Finally, the hypothetical addition of a co-substrate is studied considering energy equations previously formulated to analyze if the electrical and thermal demand of the overall plant can be fully covered by energy valorization of biogas.
3.1. Sensitivity Analysis of Biogas Engines
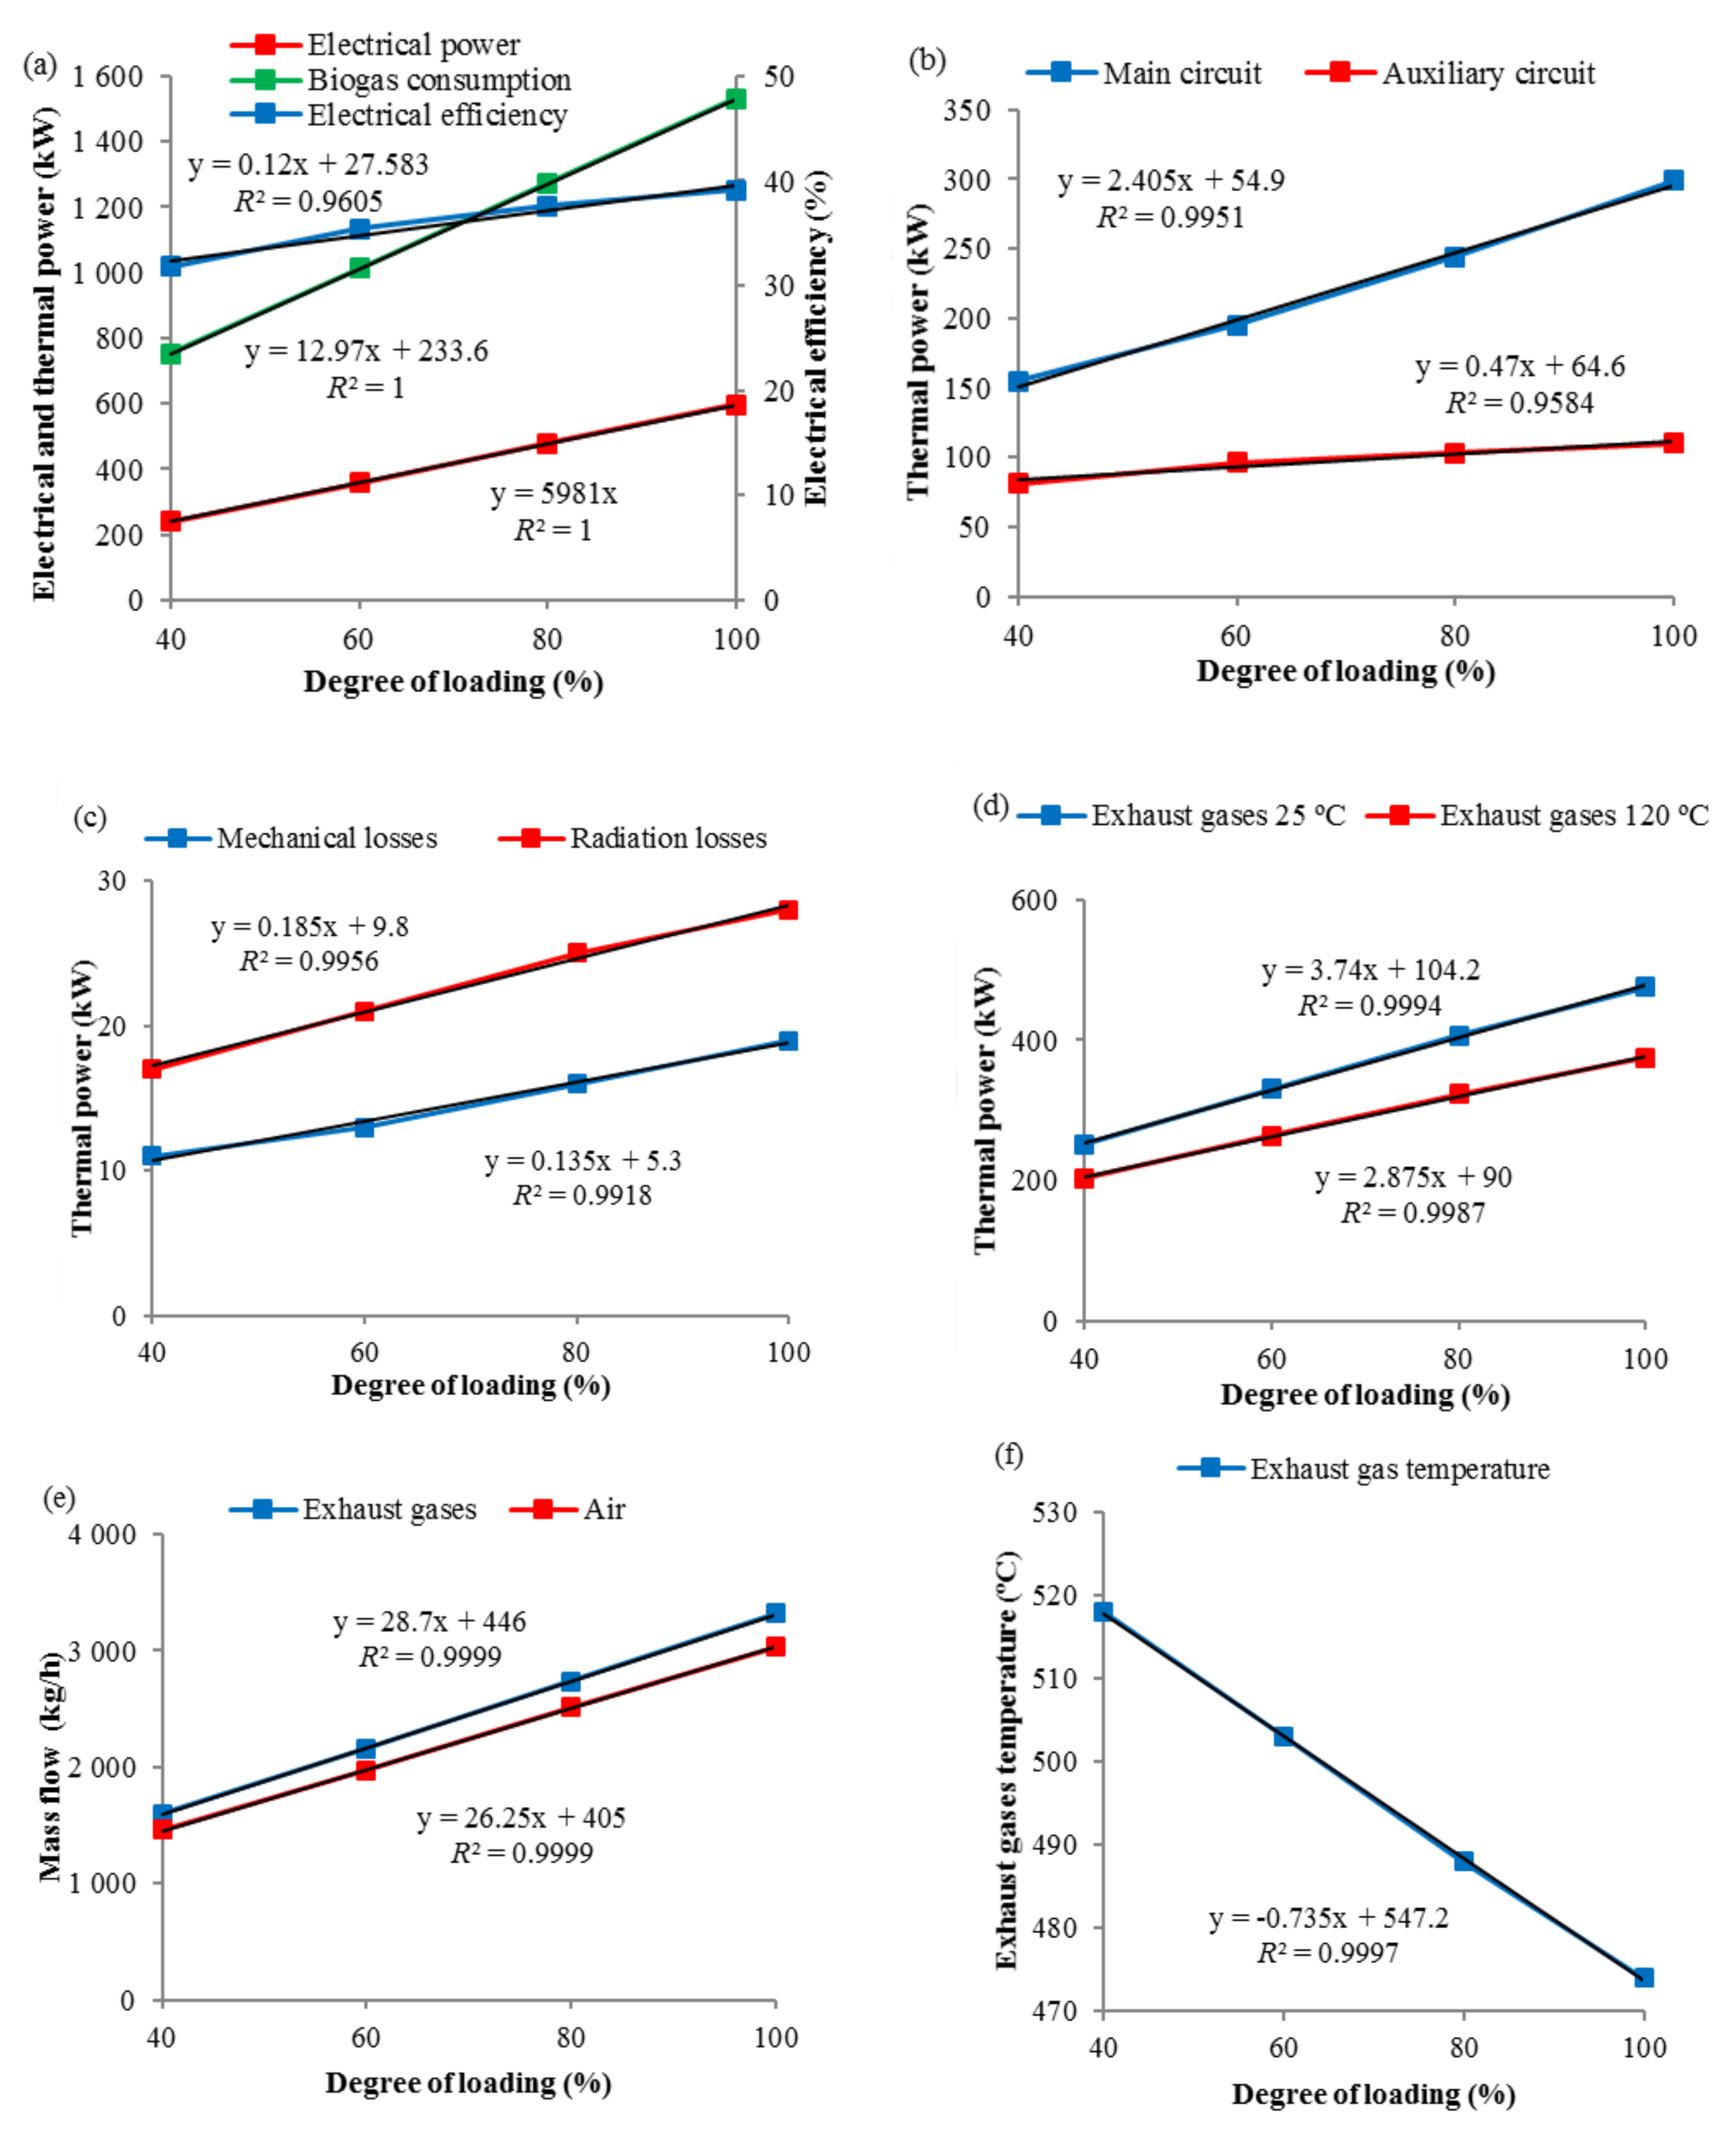
The energy parameters of the engines are shown in the following figures. Values were calculated from the minimum operating point corresponding to a 40% degree of loading at working conditions established at the WWTP, until the maximum value of 100% (full load). Electrical and thermal efficiencies were obtained based on these trend lines.
Figure 4a–f shows the key parameters of the engines. All curves were approximated to a linear behavior and R
2 (coefficient of determination) was estimated along with the resulting equation, which is indicated in each graph.
The increase in the degree of loading brings with it an associated steep rise in biogas consumption, and therefore, in the input energy. However, the electrical power does not follow the same slope, experiencing a minor increase due to the engine efficiency, which increases with the degree of loading, attaining 40.3% as the maximum value. The maximum power and torque regime in this type of engine are developed at full load. The difference in rotational speed between these two parameters is zero since the engine always rotates at a constant speed to maintain synchronism, so these engines have no elasticity. Explosion ignition engines allow minimal variations of the air–fuel ratio between minimum and full load. Quantitative regulation of this ratio is necessary and this is achieved by throttling the inlet at the carburetor butterfly valve. For this reason, the pumping losses are increased at a low degree of loading as the mixture inlet pressure is reduced and therefore, the efficiency decreases. The power at a full degree of loading is generally proportional to the mass of air admitted per unit of time. The efficiency of this type of engine is a function of the filling or renewal volume into the cylinders. The engine volumetric efficiency thus decreases with the decrease in the degree of loading, as well as the power output.
The turbocharger increases the mass of the mixture (air–biogas) entering into the cylinders compared to atmospheric aspirated engines, attaining a volumetric efficiency of 102.2%. However, the exhaust gas back-pressure increases the turbine inlet pressure from 140.2 to 144.7 kPa (3.2%), lowering the average effective pressure and causing a loss of power. Losses are those derived from mechanical and radiation losses. The first one corresponds mainly to those caused by friction and derived from the various auxiliary elements (oil and water pumps, fans, etc.). They present slight variations between minimum and full load because the engine rotates at constant speed. Radiation losses follow an upward trend with the degree of loading. However, they do not vary significantly because the temperature of the engine block is controlled by the cooling system.
The thermal power associated with cooling circuits has different behavior. The auxiliary circuit has cooling components related to the air compression system and the lubricating oil circuits. Thus, it is not affected as much as the main circuit, which is directly linked to the performance of the engine. Increasing biogas consumption brings, as a consequence, a greater release of heat, which the main circuit should absorb to keep the crankcase and cylinders at the proper temperature.
The intercooler cools down the mixture, increasing its density in an isobaric way (neglecting the small pressure losses). The compressor-turbine assembly is independent of the drive shaft, which gives a greater degree of freedom in terms of efficiency. The rise in exhaust gas back-pressure causes a decrease in the pressure ratio across the turbocharger, resulting in lower mass flow through the components and less air available for the engine [
46], adversely affecting the performance.
The density of the mixture inside a combustion chamber of a naturally aspirated engine is 1.07 kg/m
3 at 25 °C, whereas, for a turbocharged engine, the density of the mixture leaving the intercooler is 1.78 kg/m
3 (65 °C). This higher density translates into a greater mass, increasing by 66.3%. This is a crucial aspect of large power engines for centralized treatment of wastes. The conversion of biogas into energy is more favorable for large-scale systems given the greater power and efficiency CHP units can provide, due to the compression of the inlet gas mixture and the recovery of heat from different engine stages. On the contrary, decentralized digestion plants have to deal with greater thermal losses and higher electrical demand [
47,
48]. If biogas is valorized in situ, small engines should be used with lower electrical efficiency, generally using atmospheric air intake systems and having limited capacity for heat recovery.
Mechanical requirements impose engine cooling to limit the temperature of the different engine elements, and cooling should be compatible with correct lubrication, allowing a moderate expansion. As the degree of loading increases, so does the heat transmission per unit area, the temperature difference between gases and cooling fluid, so that cooling requirements are increased, and also mechanical losses but to a minor degree.
The cylinder head is the part of the engine that has the most exigent needs for cooling. Cooling by lubricating oil is necessary to keep engine temperature within the correct values. This task is performed along with the lubrication of piston-sleeve, piston-connecting rod, connecting rod-crank, camshaft-pusher, and exhaust valve assemblies without the oil losing its properties. Cooling requirements by lubricating oil vary little from minimum to full load in absolute value. The cooling of the intake mixture to the cylinders at the turbo outlet is small at either minimum or maximum load due to the low energy content of the exhaust gases because gases have low density and low Cp value.
All parameters, previously analyzed, increase in value with the degree of loading. However, the exhaust gas temperature follows the opposite trend. Efficiencies at low loading levels are lower for the reasons indicated above, which causes the exhaust gas outlet temperature to be higher than that expected at full load. This effect increases the exhaust gas losses due to the higher temperature gradient.
Table 6 presents other calculated parameters for the engines having relevance in the global analysis. Reducing the degree of loading significantly affects engine performance. Therefore, installing several engines operating close to full loading is better than having a single one with low flexibility when biogas production is significantly reduced.
3.2. Coupling of Biogas Engines
Maximum efficiency is achieved when all engines are working at 100% loading. However, this is not always the case since the coupling of engines is based on biogas availability and boiler and engine demand. In addition, coupling of engines takes place after one of them reaches 100% loading. When the degree of loading slightly exceeds the nominal value, an additional engine comes into operation. Thus, the fuel is distributed between the operating set at a much lower loading, decreasing the efficiency significantly. In this way, a higher biogas availability causes an additional engine to start up and reduces the efficiency of the whole set.
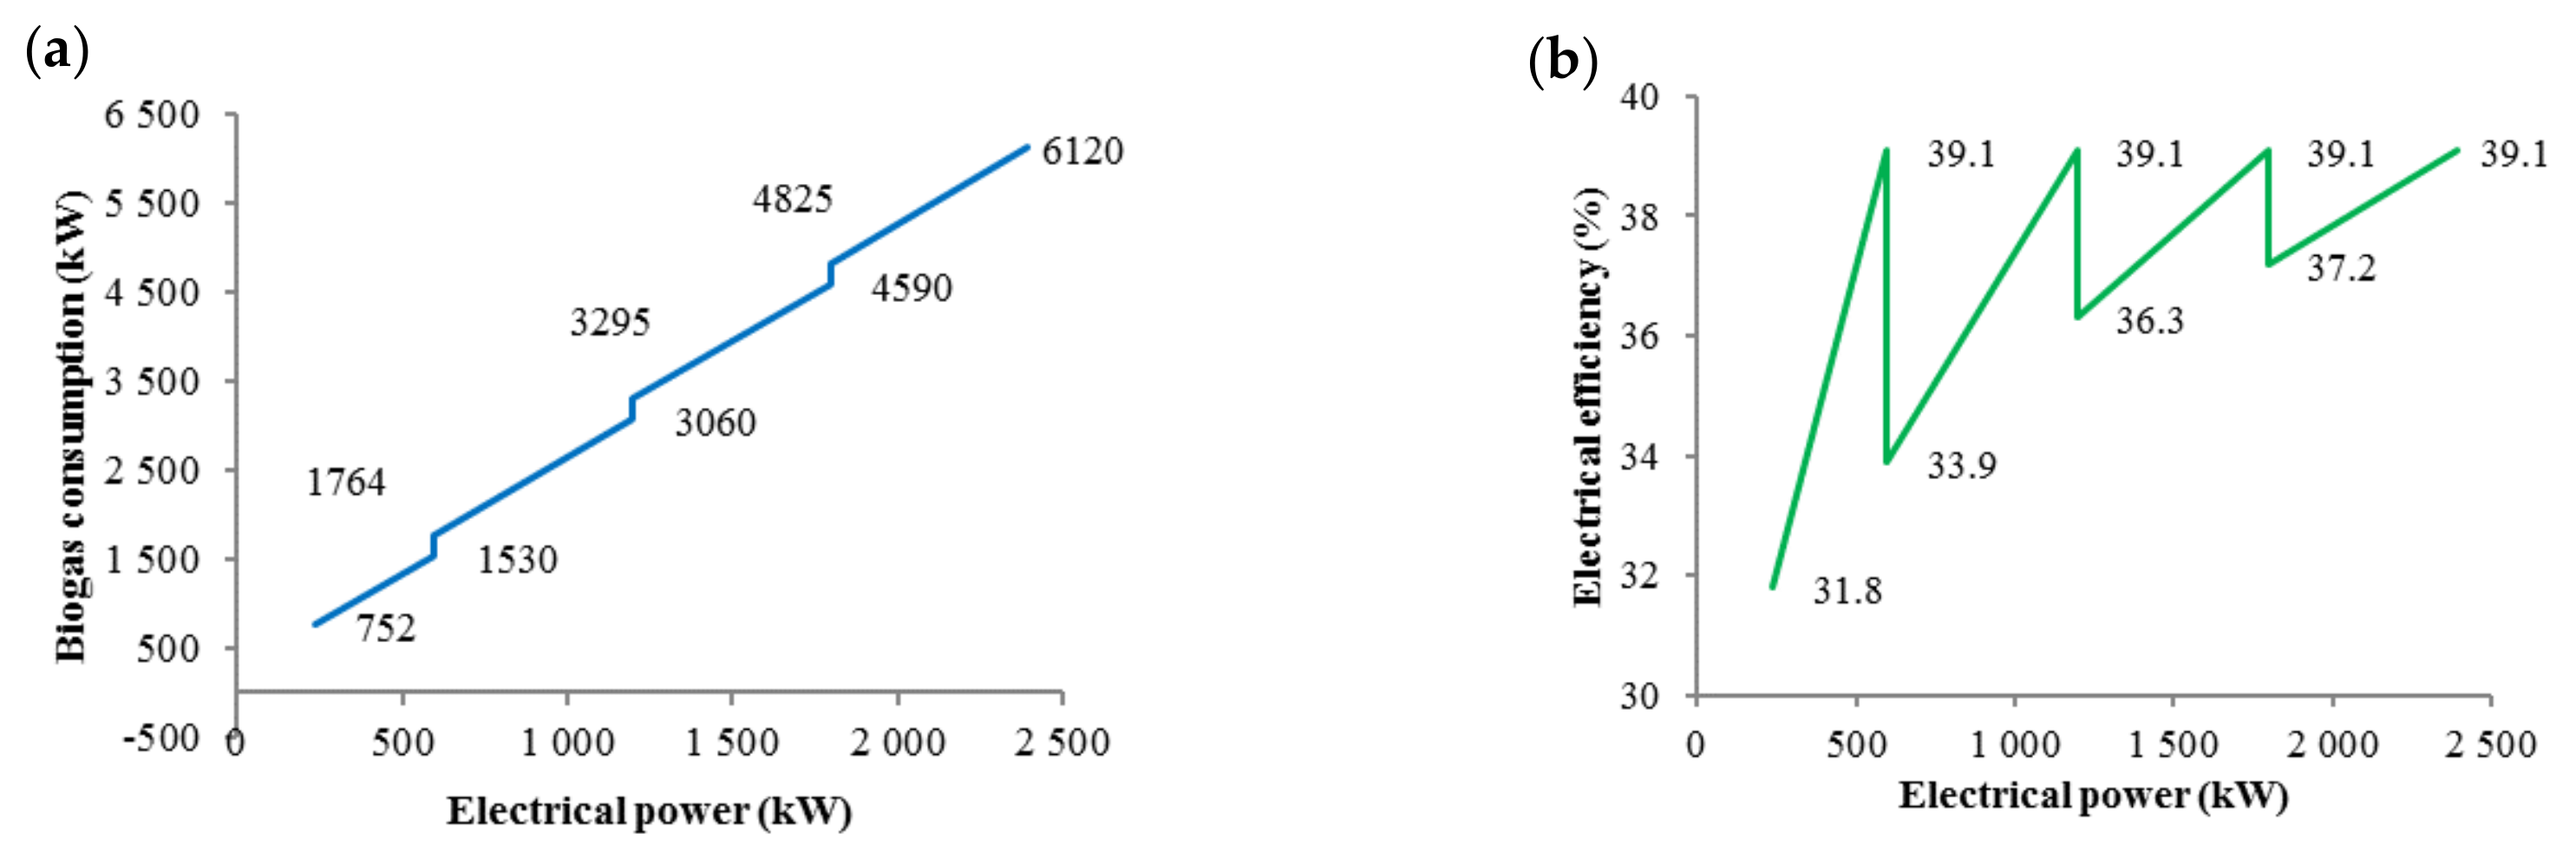
Figure 5a,b demonstrates the abovementioned behavior. In these figures, the electrical power produced and biogas consumption are represented. The steep increase in biogas consumption is associated with the incoming operation of the additional engine. This behavior is indicated in
Figure 5b, where a saw-teeth diagram represents the electrical efficiency. The steep decrease in efficiency when reducing the loading is explained by how biogas is distributed between the engines. The first point of operation in these diagrams corresponds with the engine working at a 40% degree of loading, which is the minimum possible for these engines.
The efficiency decreases as the number of operating engines increases until coupling the last one, leading to an efficiency decrease of 5.2, 2.8 and 1.9%. This is explained by the values of the engine loading moving from 50, 66.7 and 75% in each engine. This feature is a critical operational characteristic of the daily WWTP operation. For specific electrical power values, starting up a new engine may decrease the global efficiency sharply. Better efficiency is in some cases obtained by burning the excess biogas in a flare. If engines work at 90% loading, as recommended by the manufacturer, the problem may be aggravated at these so-called singular operating points.
3.3. Engine Energy Balance
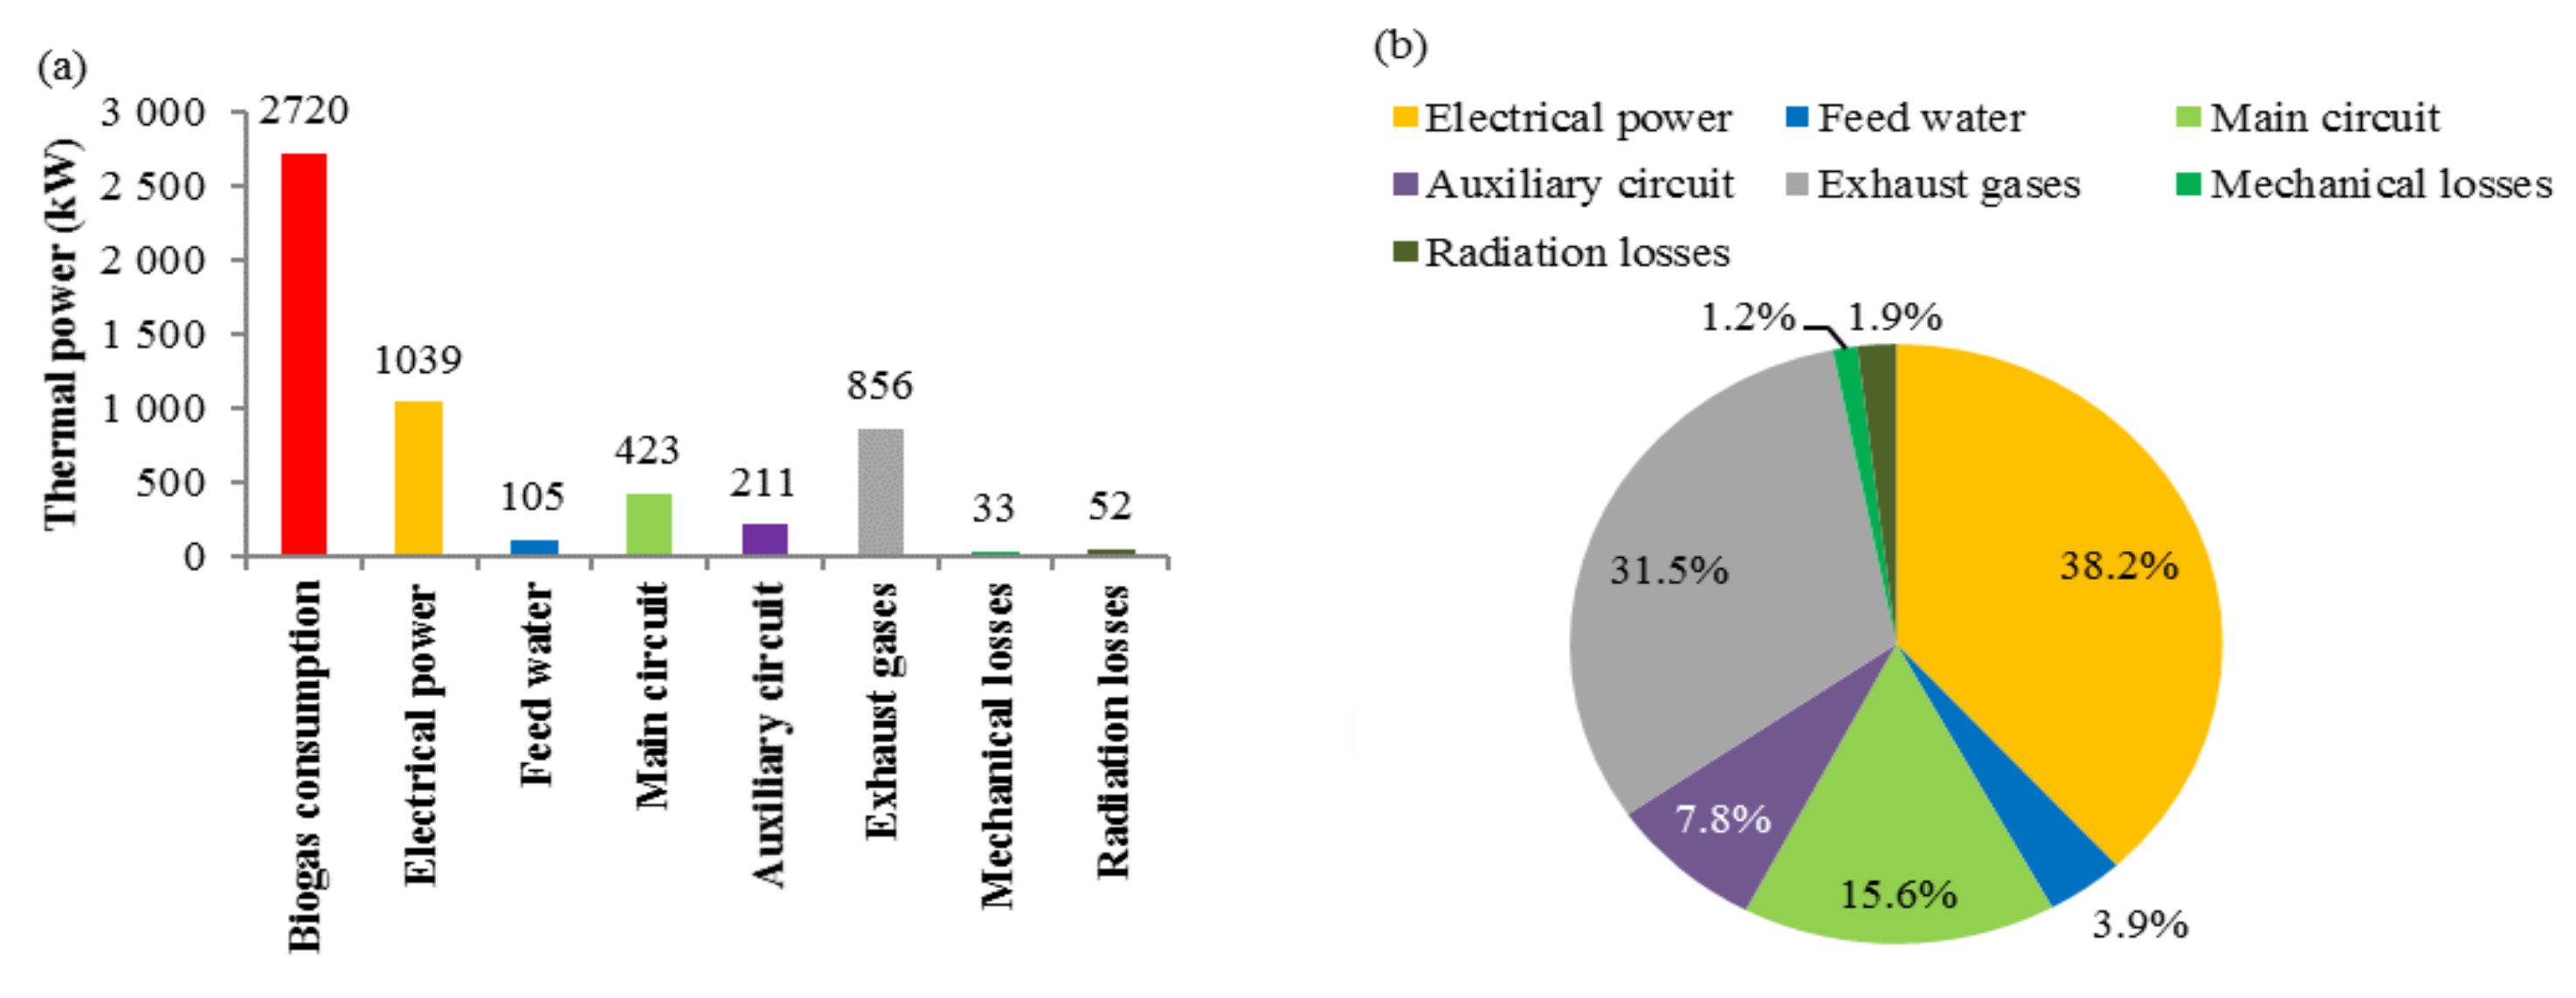
Figure 6a shows the energy balance of the engines at the operating point (see
Table 1).
Supplementary Material contains the thermodynamics diagram of the turbocharger as a function of specific entropy (
Figure S1).
Figure S2 represents mass and energy balance of one cylinder in biogas engines. Heat capacity and specific enthalpy of the fluid flowing through the compressor, intercooler and turbine are shown in
Table S1.
Table S2 contains energy parameters of these same elements. A loading of 86.9% was assumed for each engine (two units coupled). A fraction of the thermal power from the main cooling circuit, 19.9%, is used to raise the temperature of the boiler feed water from 15 to 80 °C. This boiler produces the steam needed in the thermal pre-treatment unit. The remaining thermal power of this circuit is dissipated in the cooling towers, 80.1%, and there is no possibility of using this heat in the sludge recirculation exchanger. However, when the digesters operated without hydrolysis pre-treatment, this heat was used to keep the mesophilic temperature of digesters. Introducing a thermal pre-treatment unit into the digestion section creates different heat demands. Therefore, sludge is heated up during thermal pre-treatment and subsequently cooled down to the desired temperature to cover for any thermal losses associated with digester conditions and sludge piping line, being no longer necessary to adjust the temperature by the heat sludge recirculation exchanger. This waste heat has a negative impact on the energy efficiency of the process. The demand of the thermal pre-treatment unit is covered by the boiler and engine exhaust gases, giving rise to a different heating circuit where no other use is given to that of the engine main cooling circuit.
Figure 6b shows the energy balance represented as a percentage. Biogas consumption was used as base (expressed as thermal power). The available thermal energy of the main cooling circuit represents a significant share of the thermal distribution. Therefore, the gain associated with the higher efficiency of the turbocharged engine should translate into full use of the available thermal energy to take full advantage of the energy contained in biogas. In this graph, about 31% of the energy is in exhaust gases and about 23% in the cooling circuits. Thus, finding full use of this energy in the WWTP is imperative for increasing the efficiency of the global process.
Table 7 shows the values obtained for the useful thermal power associated with engine operation, broken down into different efficiencies. Absolute and relative values are reported. The values obtained from nominal engine operation were used as base. Excess air at 59.4% is observed, which gives an indication of the operating performance of these engines under lean-burn conditions. This condition allows increasing the mass flow of gases and, as a consequence, their energy. The useful thermal power represents the power capable of finding use in different equipment. Therefore, mechanical losses and radiation losses are discarded, and it is considered for calculation heat transfer from exhaust gases until a minimum temperature of 142 °C is reached. A value for
UTEF of 84.4% indicates that this type of engine achieves a high level of energy recovery.
3.4. Cooling Circuit Energy Balance
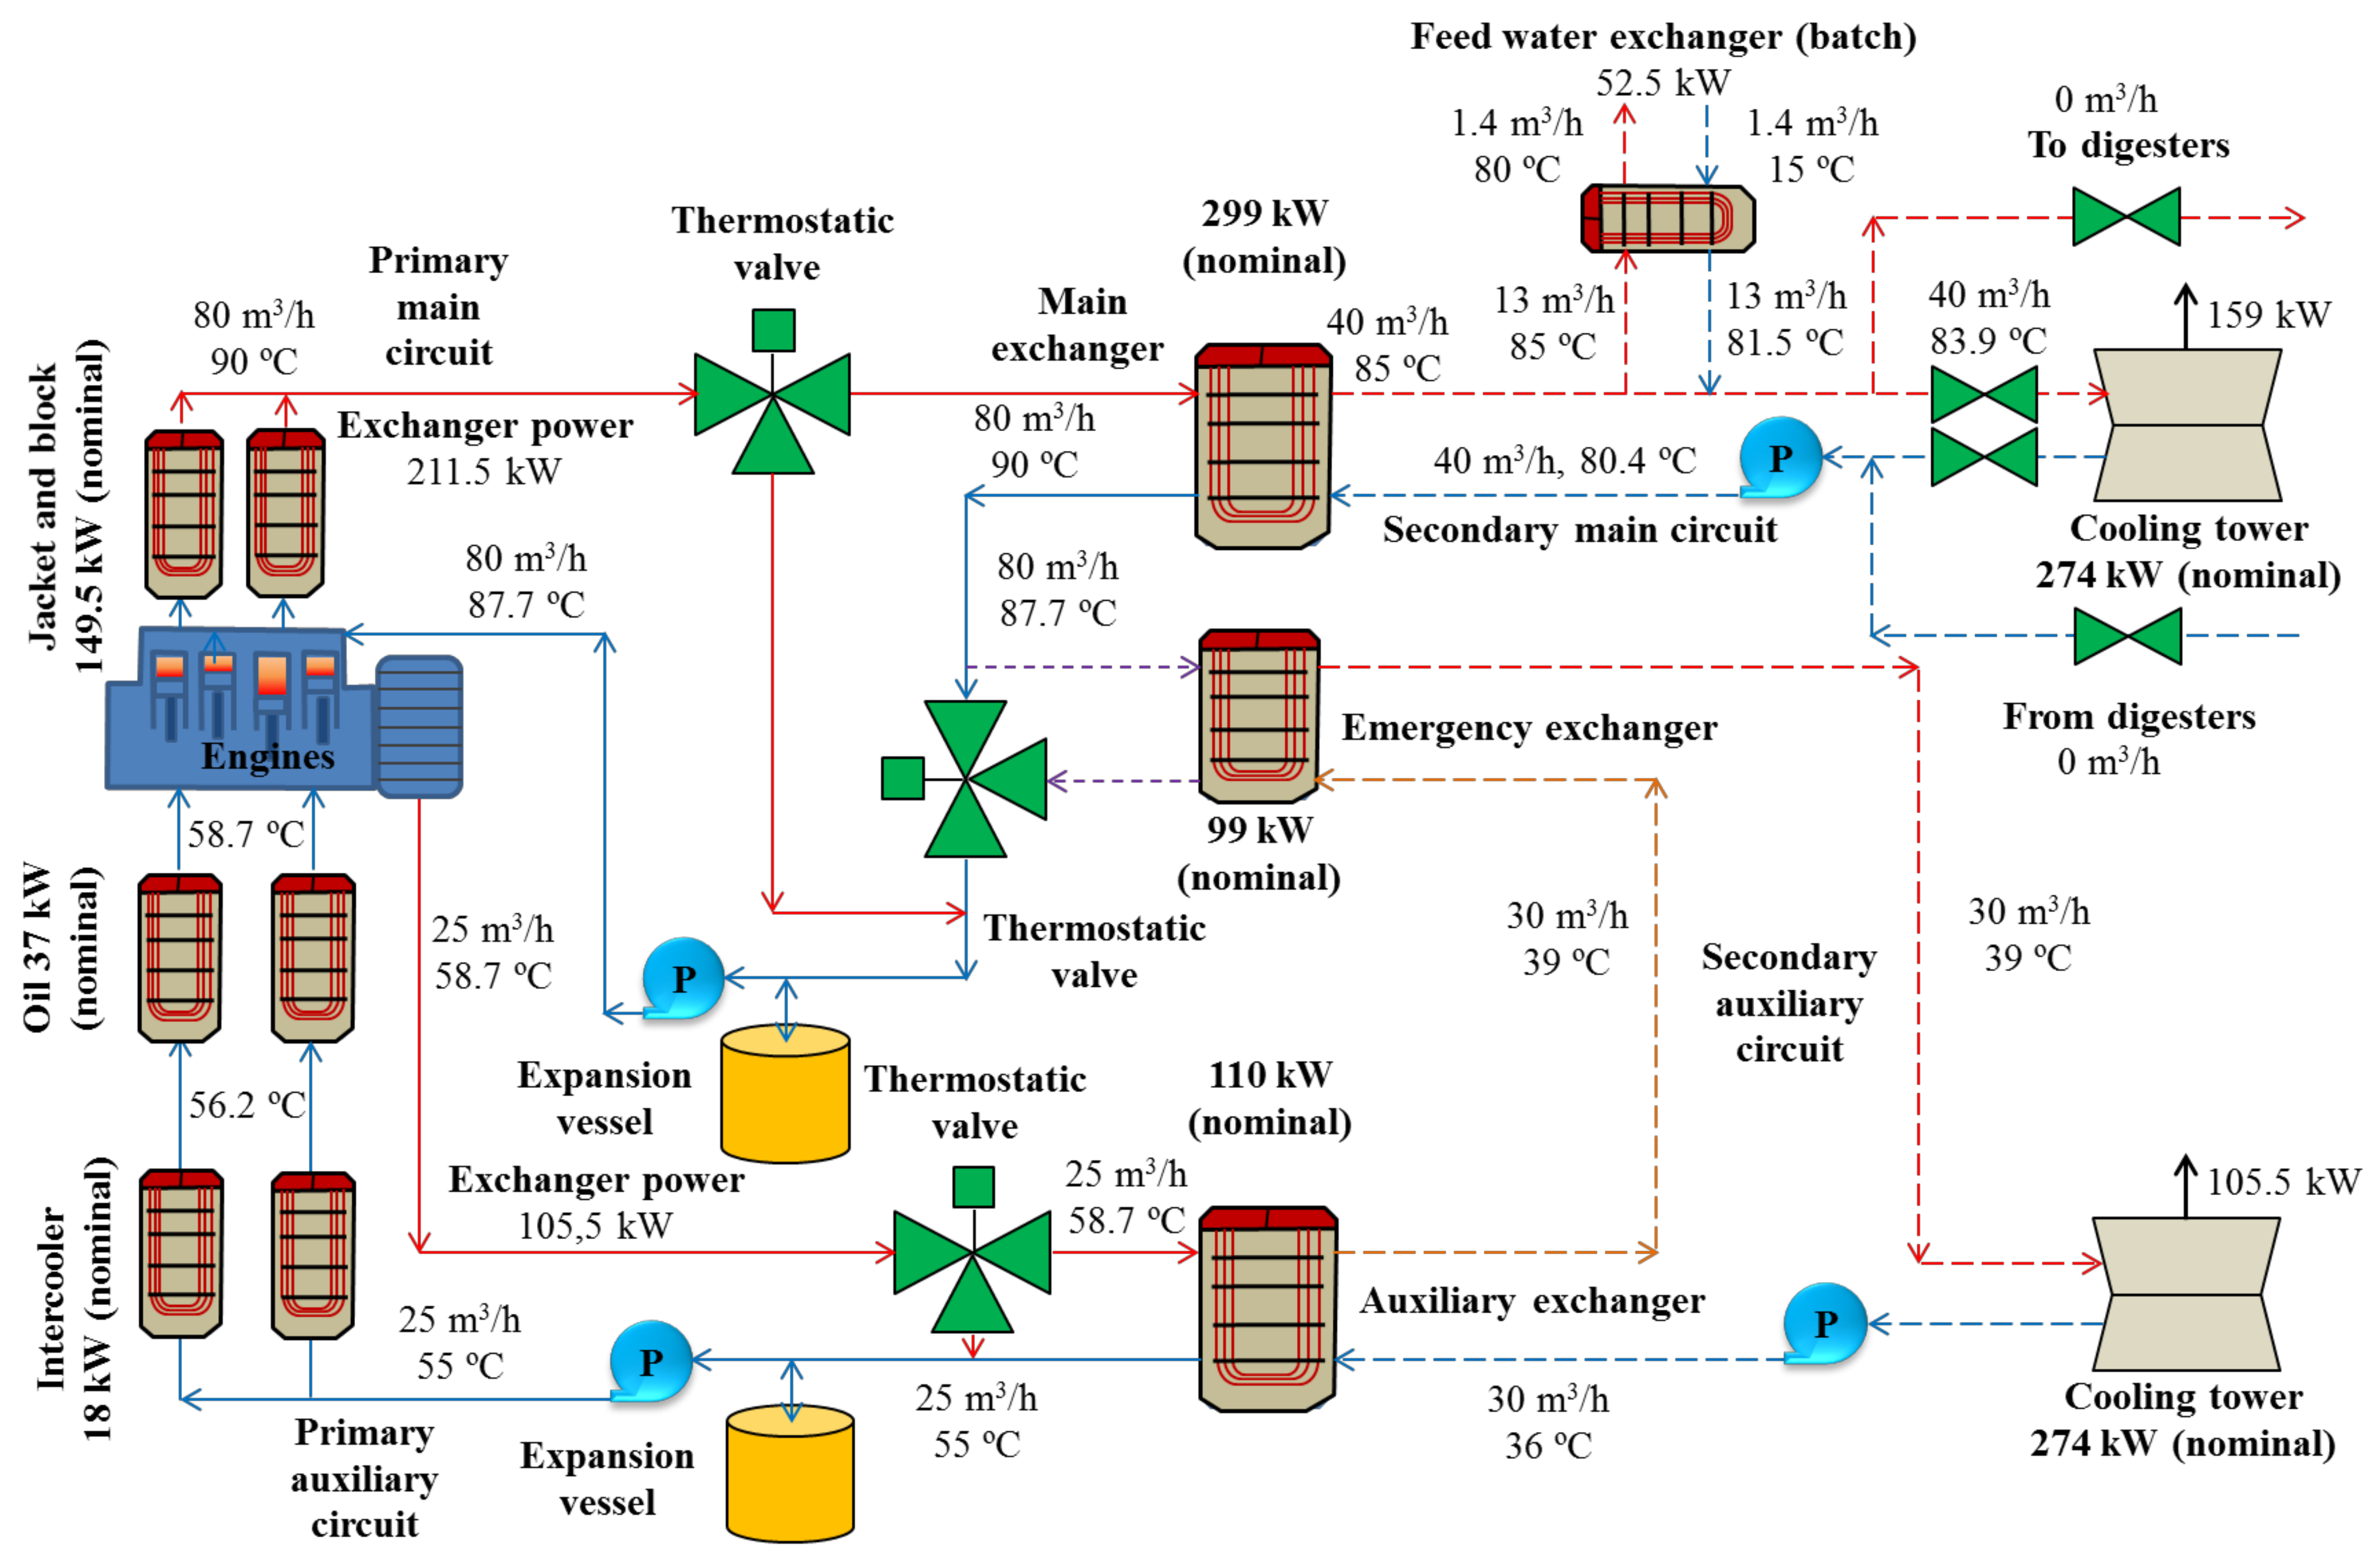
Figure 7 shows the diagram of the main, emergency and auxiliary cooling circuits of the engines. Each circuit consists of a primary and a secondary section as previously described, both separated by a plate heat exchanger. When the digestion section worked as a conventional mesophilic system, the energy from this circuit was used to increase the sludge temperature and keep the digester at 37 °C. However, after installing the thermal pre-treatment unit, this heat recovery was no longer needed. Part of the energy available in the main circuit—secondary section—is now used to preheat the feeding water of the recovery mixed boiler. The exceeding heat is dissipated in cooling towers. Due to the physical proximity between the exchangers of the main cooling circuit and the boiler feed water preheating circuit, the minimum approach point considered for calculations was 5 °C. A significant amount of low-grade energy does not find any application in the WWTP when the thermal hydrolysis unit is operating. This assessment highlights the relevance when evaluating biogas production enhancement. All sets of additional equipment must be considered, along with changes in heat recovery and the quality of the energy needed after implemented modifications.
The emergency exchanger only comes into service in the event of insufficient power, breakdown, or failure of the primary exchanger. In contrast, its secondary circuit is cooled by water coming out of the secondary exchanger from the auxiliary circuit, both being positioned in series and fully cooled in cooling towers. The secondary section of the auxiliary circuit also dissipates its energy in cooling towers.
The three-way thermostatic valves in both the main and auxiliary circuits allow the water temperature to be kept at 90 °C at the outlet and 55 °C at the inlet of the engine, by recirculating water through the existing bypasses without going through any of the heat plate exchangers located in the two cooling circuits. The heat exchangers of the block, crankcase and cylinder jackets are shown in
Figure 7 as external independent units for the sake of simplicity to facilitate process description. This representation eases heat transfer calculation and aids in understanding the different circuits considered. The cooling water is fed at the bottom part of the engine, where the crankcase is located, and it circulates up through the cylinder jackets, exiting through the cylinder heads. All these components are located inside the engine. The thermal efficiency of plate heat exchangers was assumed to be unity.
Table 8 shows results from the energy balance, considering electrical energy production. The gross electrical power generated was 1039 kW, which translates into 9102 MWh/year, equivalent to 837,384 €/year. This energy is completely consumed at the plant. The value of the resulting utilization factor is 43.4%, not reaching 50% of the installed capacity, which is too low to guarantee the installation reaches profitability limits. The plant installed capacity for producing electricity is much greater than that produced by the engines. The inclusion of thermal hydrolysis for enhancing sludge stabilization and reducing sludge volume modifies the global energy balance because steam is now needed along with the additional equipment operating at higher temperatures. This modification, in an already operating WWTP, results in enhanced performance of digestion, but it does not necessarily lead to a better energy balance given all the additional equipment needed for the extra units and the lower capacity for finding use of low-temperature streams. However, the extra digester capacity is advantageous due to the shorter time required for sludge stabilization. This improvement in reactor capacity allows the treatment of co-substrates with high methane potential, thus producing more biogas to be valorized in the existent engines.
High-strength organics considered suitable co-substrates include waste cooking oil, residual glycerin, or cheese whey from the food industry [
49,
50,
51,
52,
53,
54]. The organic fraction of municipal solid wastes has been extensively studied as co-substrate [
55,
56,
57], but it has the risk of increasing the amount of inert material [
58], deteriorating sludge agronomic quality.
3.5. Energy Balance: Co-Digestion Case
Cheese whey and residual glycerol both have high methane yields (446 mL CH
4/g VS, reported by Papirio et al. [
59] for cheese whey and 561.3 mL CH
4/g VS reported by González et al. [
60] for glycerol). In the present case, 2302 kW of extra biogas can be valorized based on the plant installed capacity. Therefore, if considering characteristics for these substrates similar to those reported by de Albuquerque et al. [
61], with whey having a concentration of 70 g COD/L and glycerol a concentration of 1520 g COD/L (COD: chemical oxygen demand), the WWTP could treat a stream of 366 m
3/d in the case of cheese whey, but for glycerol, this amount is reduced to 16 m
3/d. A similar analysis can be performed for the use of waste cooking oil, also characterized by high methane yield (922 mL CH
4/g VS, methane yield reported by Marchetti et al. [
62]). However, in this latter case, complexities regarding the appearance of possible inhibitory conditions due to long-chain fatty acid accumulation need to be carefully evaluated. In addition, storage and handling of waste cooking oil may be more problematic because of additional heating systems needed to avoid pipe clogging.
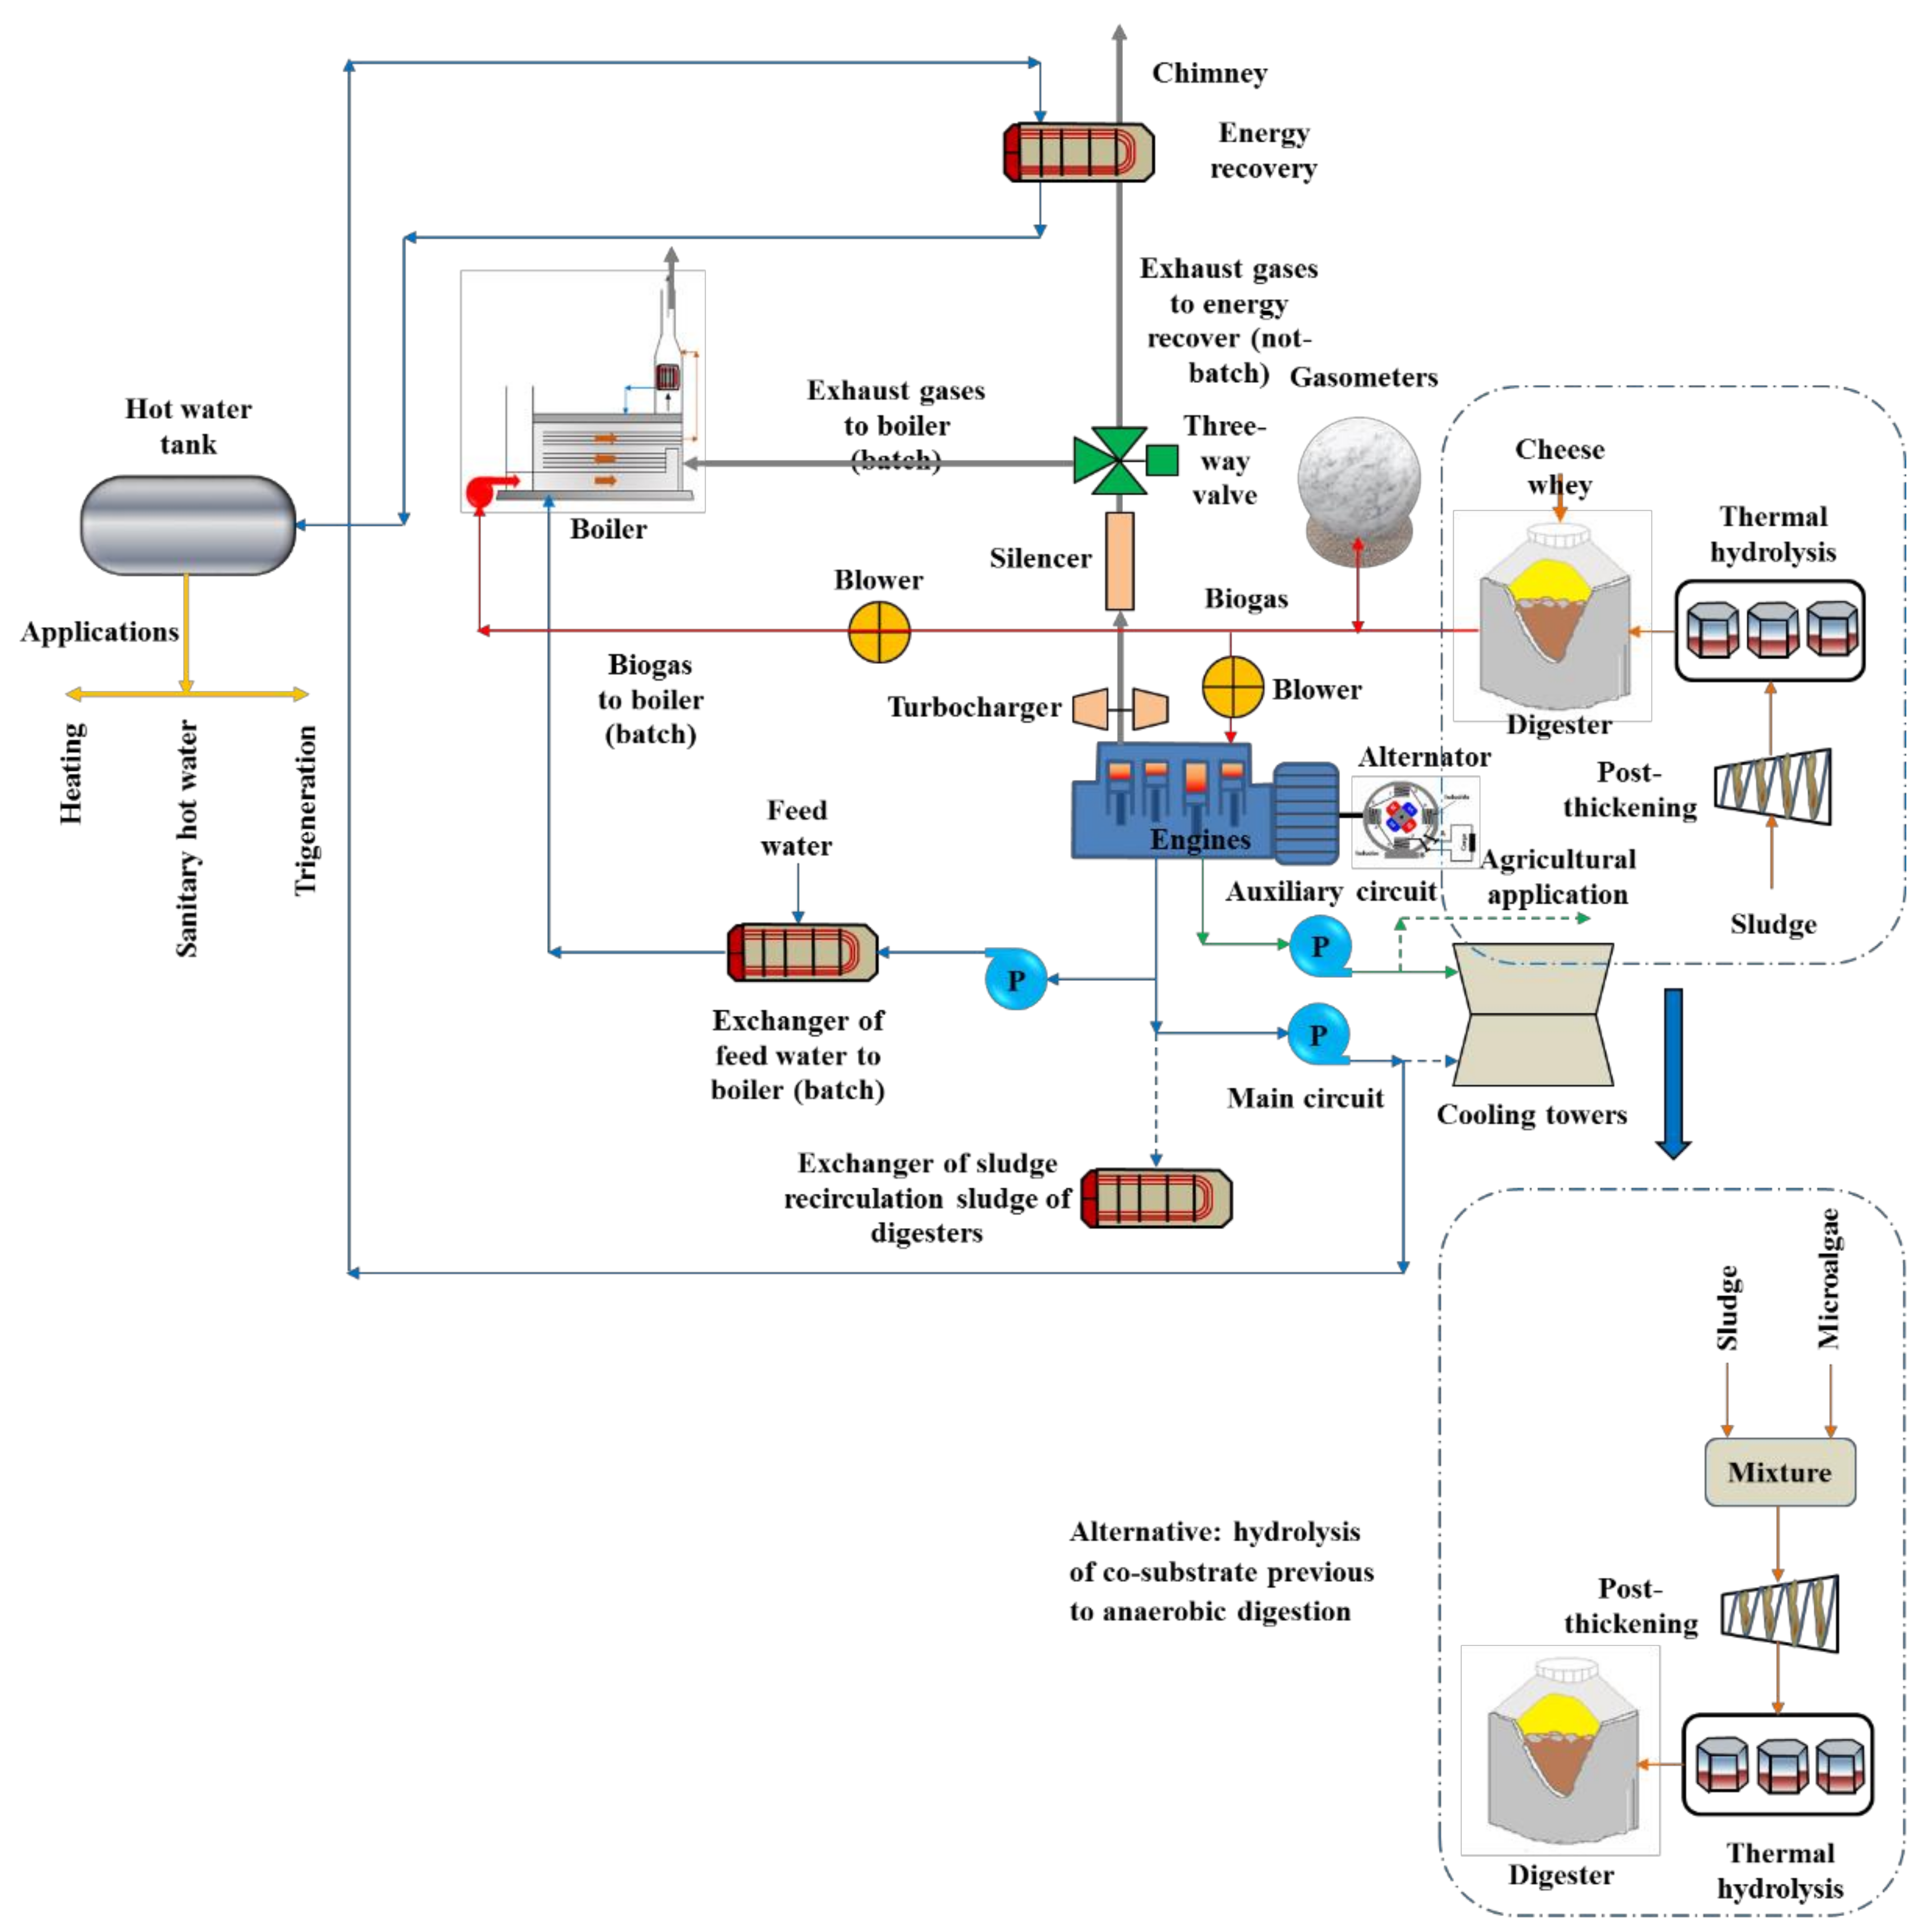
Figure 8 shows the co-digestion configuration. The degree of electrical self-consumption is now 55.1%, still a low value. However, it should be taken into account that the WWTP has a tertiary treatment system based on lamellar decantation and the use of O
3 and ultraviolet rays for final polishing of the treated water, significantly rising the energy demand of the whole plant. Co-digestion with cheese whey could add an extra 2302 kW of biogas, summing to 5892 kW. A fraction of this power, 870 kW, would be used by the recovery boiler for producing steam to cover the demand of the thermal hydrolysis pre-treatment (Cambi THP B6.2, two reactors of 6 m
3). The remaining amount (5022 kW) could be used as fuel in engines.
Co-digestion is a suitable option for increasing biogas production and reactor productivity. The energy balance is positively affected in the hypothetical case of adding cheese whey as co-substrate since this material is readily degraded and does not require any pre-treatments. The greater availability of biogas affects engines’ performance, increasing the mass of exhaust gases and improving the recovery boiler energy balance.
Table 9 shows the results of the energy balance under co-digestion configuration. This table also shows results from the hypothetical case of adding a hydrolyzed co-substrate. This latter configuration is also schematized in
Figure 8 as an alternative treatment option. For this second valorization scheme, a volumetric flow of microalgae biomass was hydrolyzed with sludge. The methane yield for hydrolyzed microalgae biomass reported by Ometto et al. [
63] was 223 mL CH
4/g VS, whereas a value of 339.1 mL CH
4/g VS was reported by Méndez et al. [
64]. Thus an average value of 281 mL CH
4/g VS was used for evaluating the energy balance. A microalgae volumetric flow of 410 m
3/d (TS content of 7%, VS percentage of 91%) was considered to keep previous assumptions consistent. Biogas produced would be, in this case, equivalent to 6253 kW. The thermal hydrolysis unit would demand 1231 kW, leading to the same amount of biogas available as fuel in engines (5022 kW). Electricity production would be increased until reaching energy self-sufficiency (1885 kW), obtaining savings valued at 1,519,160 €/year. However, the application of the microalgae co-digestion strategy requires the installation of an additional hydrolysis unit to cover the higher flow.
For both cases studied, the hydrolyzed substrate contains enough energy to provide the thermal demand of digestion. Therefore, the thermal energy available from the engine cooling circuit is not needed. The main cooling circuit has a thermal power of 873 kW in the cheese whey co-digestion case and 778 kW in the micro-algae case with a temperature of the hot fluid stream of 84.2 °C. This stream could supply domestic hot water and heating to the office building of the WWTP, or be used in a trigeneration system by installing an absorption chiller to cover cooling needs in summer. The auxiliary cooling circuit has similar power for both co-digestion cases, with a hot fluid maximum temperature of only 49 °C (the approach temperature between fluids was 10 °C). This value is too low to produce any work. The low temperature of this stream and, therefore, the low amount of energy stored prevent its use as residual thermal energy in any process having direct application in the WWTP. However, given the large quantity of these low sources in urban areas, future research efforts should be performed to find efficient ways for this type of heat recovery [
65].
The residual energy of exhaust gases is 981 kW, considering an outlet temperature of 142 °C, from which just 323 kW are used in the recovery boiler, with the remaining being wasted by emission directly into the atmosphere. If this energy is used to raise the water temperature in the main cooling circuit, the usable power for heating, domestic hot water, or trigeneration, could be considerably increased to 1531 kW.
Table 10 presents the results from the energy balance. A similar analysis for the hydrolysis case leads to a slightly lower amount of residual energy contained in exhaust gases. In this latter case, the value is 978 kW, but a greater amount is needed in the recovery boiler because of the increment in steam demand. Thus, 567 kW are used in this unit. The remaining amount (411 kW) is wasted. Just as previously analyzed, if this power were used, the amount available for domestic hot water applications or trigeneration would be 1189 kW.


 ,
, 


