1. Introduction
Evolutionary algorithms (EAs) are a valuable tool for solving many multidimensional and NP-hard [
1] practical problems, mainly because they outperform traditional methods, whose high space complexity often disqualifies them from being used to solve complex problems. EAs are a large and diverse family of algorithms that find solutions to problems in continuous and discrete domains. Among the prominent classes of EAs, the Estimation of Distribution Algorithms (EDAs) [
2] can be listed, in which the probabilistic model mechanism realizes the evolution mechanism.
One of the more straightforward and well-known EDAs initially used to solve discrete problems is the Population-Based Incremental Learning (PBIL) algorithm, first proposed by Baluja in [
3]. This algorithm owes its simplicity to the fact that the probability distribution of the subsequent bits in the chromosome is independent, so both the point generation and the learning process can be performed separately for each variable. For these reasons, PBIL is popular and various modifications of the algorithm have been developed, introducing, among others, the probability vector multiplication [
4,
5], elite strategy [
6] and non-parametric approach [
7].
A different approach than EDAs in the EAs family is evolutionary strategies (ES). Their leading representative is the Covariance Matrix Adaptation Evolution Strategy (CMA-ES) algorithm proposed in [
8]. Initially, CMA-ES was invented to find solutions to continuous domain problems, but later, modifications dedicated to discrete problems were developed [
9]. Whereas CMA-ES, such as EDAs, uses a probability distribution to describe the population—a multivariate normal distribution—, they differ in other aspects. The key among them is how the parameters are updated—in EDAs, learning considers a set of points, while CMA-ES considers a set of steps [
10]. CMA-ES outperforms the EDA family of algorithms in many problems [
10].
In this paper, we propose a modification of the PBIL algorithm, which, inspired by CMA-ES, introduces information about correlations between variables into the probability distribution model. In some actual applications, taking the correlations between decision variables into account can bring real benefits, e.g., a faster algorithm convergence. For instance, one can imagine a given problem with two global optima with significantly different realizations. By adding a covariance matrix, the algorithm can detect such a situation and distinguish between these solutions. Knapsack problems with a varying item parameter correlation [
11] were chosen to compare the modified and standard PBIL algorithms. The selected test case is a well-known NP-hard optimization problem commonly applied to compare algorithms solving discrete tasks.
The rest of the paper is organized as follows: In
Section 2, we detail investigated PBILs, including our proposed modification. Next, in
Section 3, we present the test environment consisting of knapsack problems. Then, in
Section 4, results and a discussion are provided. Finally,
Section 5 gives out a summary of the research findings.
2. PBIL Algorithm
In algorithms from the family of EDAs, each population is represented by a probability distribution. In the case of PBIL [
3], this is a vector consisting of the probabilities of obtaining a value of one at each position in the chromosome (
1).
In each iteration, a population of M individuals was generated based on the probability distribution using the
sample. The solutions were, then, evaluated according to the adopted objective function, and the N best solutions were selected (
select). Based on the obtained
subset, a vector of probabilities was updated in the
update function. The algorithm ran in a loop until the assumed stopping condition was not met. The code is presented in Algorithm 1.
| Algorithm 1 PBIL |
| 1: |
| 2: |
| 3: while do |
| 4: |
| 5: |
| 6: |
| 7: |
| 8: |
| 9: end while |
The method of updating the probability vector was described in Formula (
2), where
a is a learning rate and
is a binary vector representing a single solution to the problem. In each iteration of the algorithm, the vector is modified according to the frequency of ones on each gene in the set of
N best solutions.
The stop condition could be customized for the problem under study. Typically, a maximum number of iterations () is specified. Additionally, the algorithm is assumed to stop when the probability vector stabilizes, i.e., if all vector elements are in a fixed neighbourhood of zero or unity ().
Proposed Modifications
The algorithm introduced in [
3] assumes the independence of the individual genes in the chromosome. Inspired by the CMA-ES algorithm described in [
8], a Covariance Matrix Adaptation Population-Based Incremental Learning (CMA-PBIL) algorithm that attempts to account for correlations between variables was proposed.
In the CMA-PBIL algorithm, the probability distribution of population was described by two parameters: the covariance matrix (
) and the probability vector (
). The CMA-PBIL pseudocode is presented in Algorithm 2. The steps of the modified algorithm correspond to its original version. The changes only relate to how the points are generated and how the probability distribution parameters are updated.
| Algorithm 2 CMA-PBIL |
| 1: |
| 2: |
| 3: while do |
| 4: |
| 5: |
| 6: |
| 7: |
| 8: end while |
The procedure for updating the covariance matrix is outlined in Formula (
3). It employs the same learning factor
a as during the modification of the vector
. The coefficient
a was squared as the variance was the second central moment.
The matrix
was computed at each iteration according to Formula (
4), where the vector
consists of the frequencies of ones on each bit in the set
.
The method of updating the vector did not change.
3. Experiments
As a test case, multiple variants of knapsacks problems were chosen. The task aimed to select from a set of
n items a subset that maximizes the overall value of the knapsack within the capacity limit (
). Each item
i was described by two parameters—weight (
) and value (
). The decision of whether the item was included or not in the knapsack was represented by variable
. The main task is defined in Equation (
5), while the limit is defined in Formula (
6).
The fitness was evaluated using Formula (
7), where
P is the penalty coefficient. The objective function considered both the goals, which was to maximize the values of the items and the constraint.
The problem was investigated on six different knapsack problems generated as proposed in [
11,
12]. Problems with different correlation intensities (uncorrelated, moderately correlated, and strongly correlated) and with different capacities were examined. As reported in [
11], the higher the correlation, the more challenging the knapsack problem was expected to become. The sets consisted of
items with a maximum weight
and maximum offset
. The method by which the weights, values and capacities were generated sequentially for the following test cases is shown in
Table 1. The
represents the continuous uniform distribution within the range of
.
The initialization method for vector
and matrix
was adapted to the test case. Typically, in the PBIL algorithm, the computation starts with a vector
. For the experiments performed, the elements of the vector
contained values calculated using Formula (
8).
The initial probability distribution was assumed to be uncorrelated. Therefore, matrix
was a diagonal matrix with the variances computed according to Formula (
9) located on the diagonal.
Test Environment
Since CMA-PBIL requires the generation of binary vectors with a given correlation, it was important to select an algorithm that provided this. There are several types of algorithms for this [
13,
14,
15]. One of them was proposed by Demitras and is a modification of the Emrich and Piedemont algorithm. An implementation of the algorithm from the MultiOrd package [
16] in R was adopted in the experiments. The algorithm uses a correlation matrix instead of a covariance matrix, on which a constraint (
10) is imposed, where
is described by Formula (
11).
In the PBIL algorithm, three parameters could be specified:
M—the number of solutions generated;
N—the number of solutions taken into account when updating the distribution parameters;
a—the learning rate. In addition, the penalty factor
P was introduced for the knapsack problem.
and
parameters determined the stop condition of the algorithms. The value of the factor prevented solutions exceeding the knapsack constraint from being selected. Parameter settings are listed in
Table 2.
4. Results and Discussion
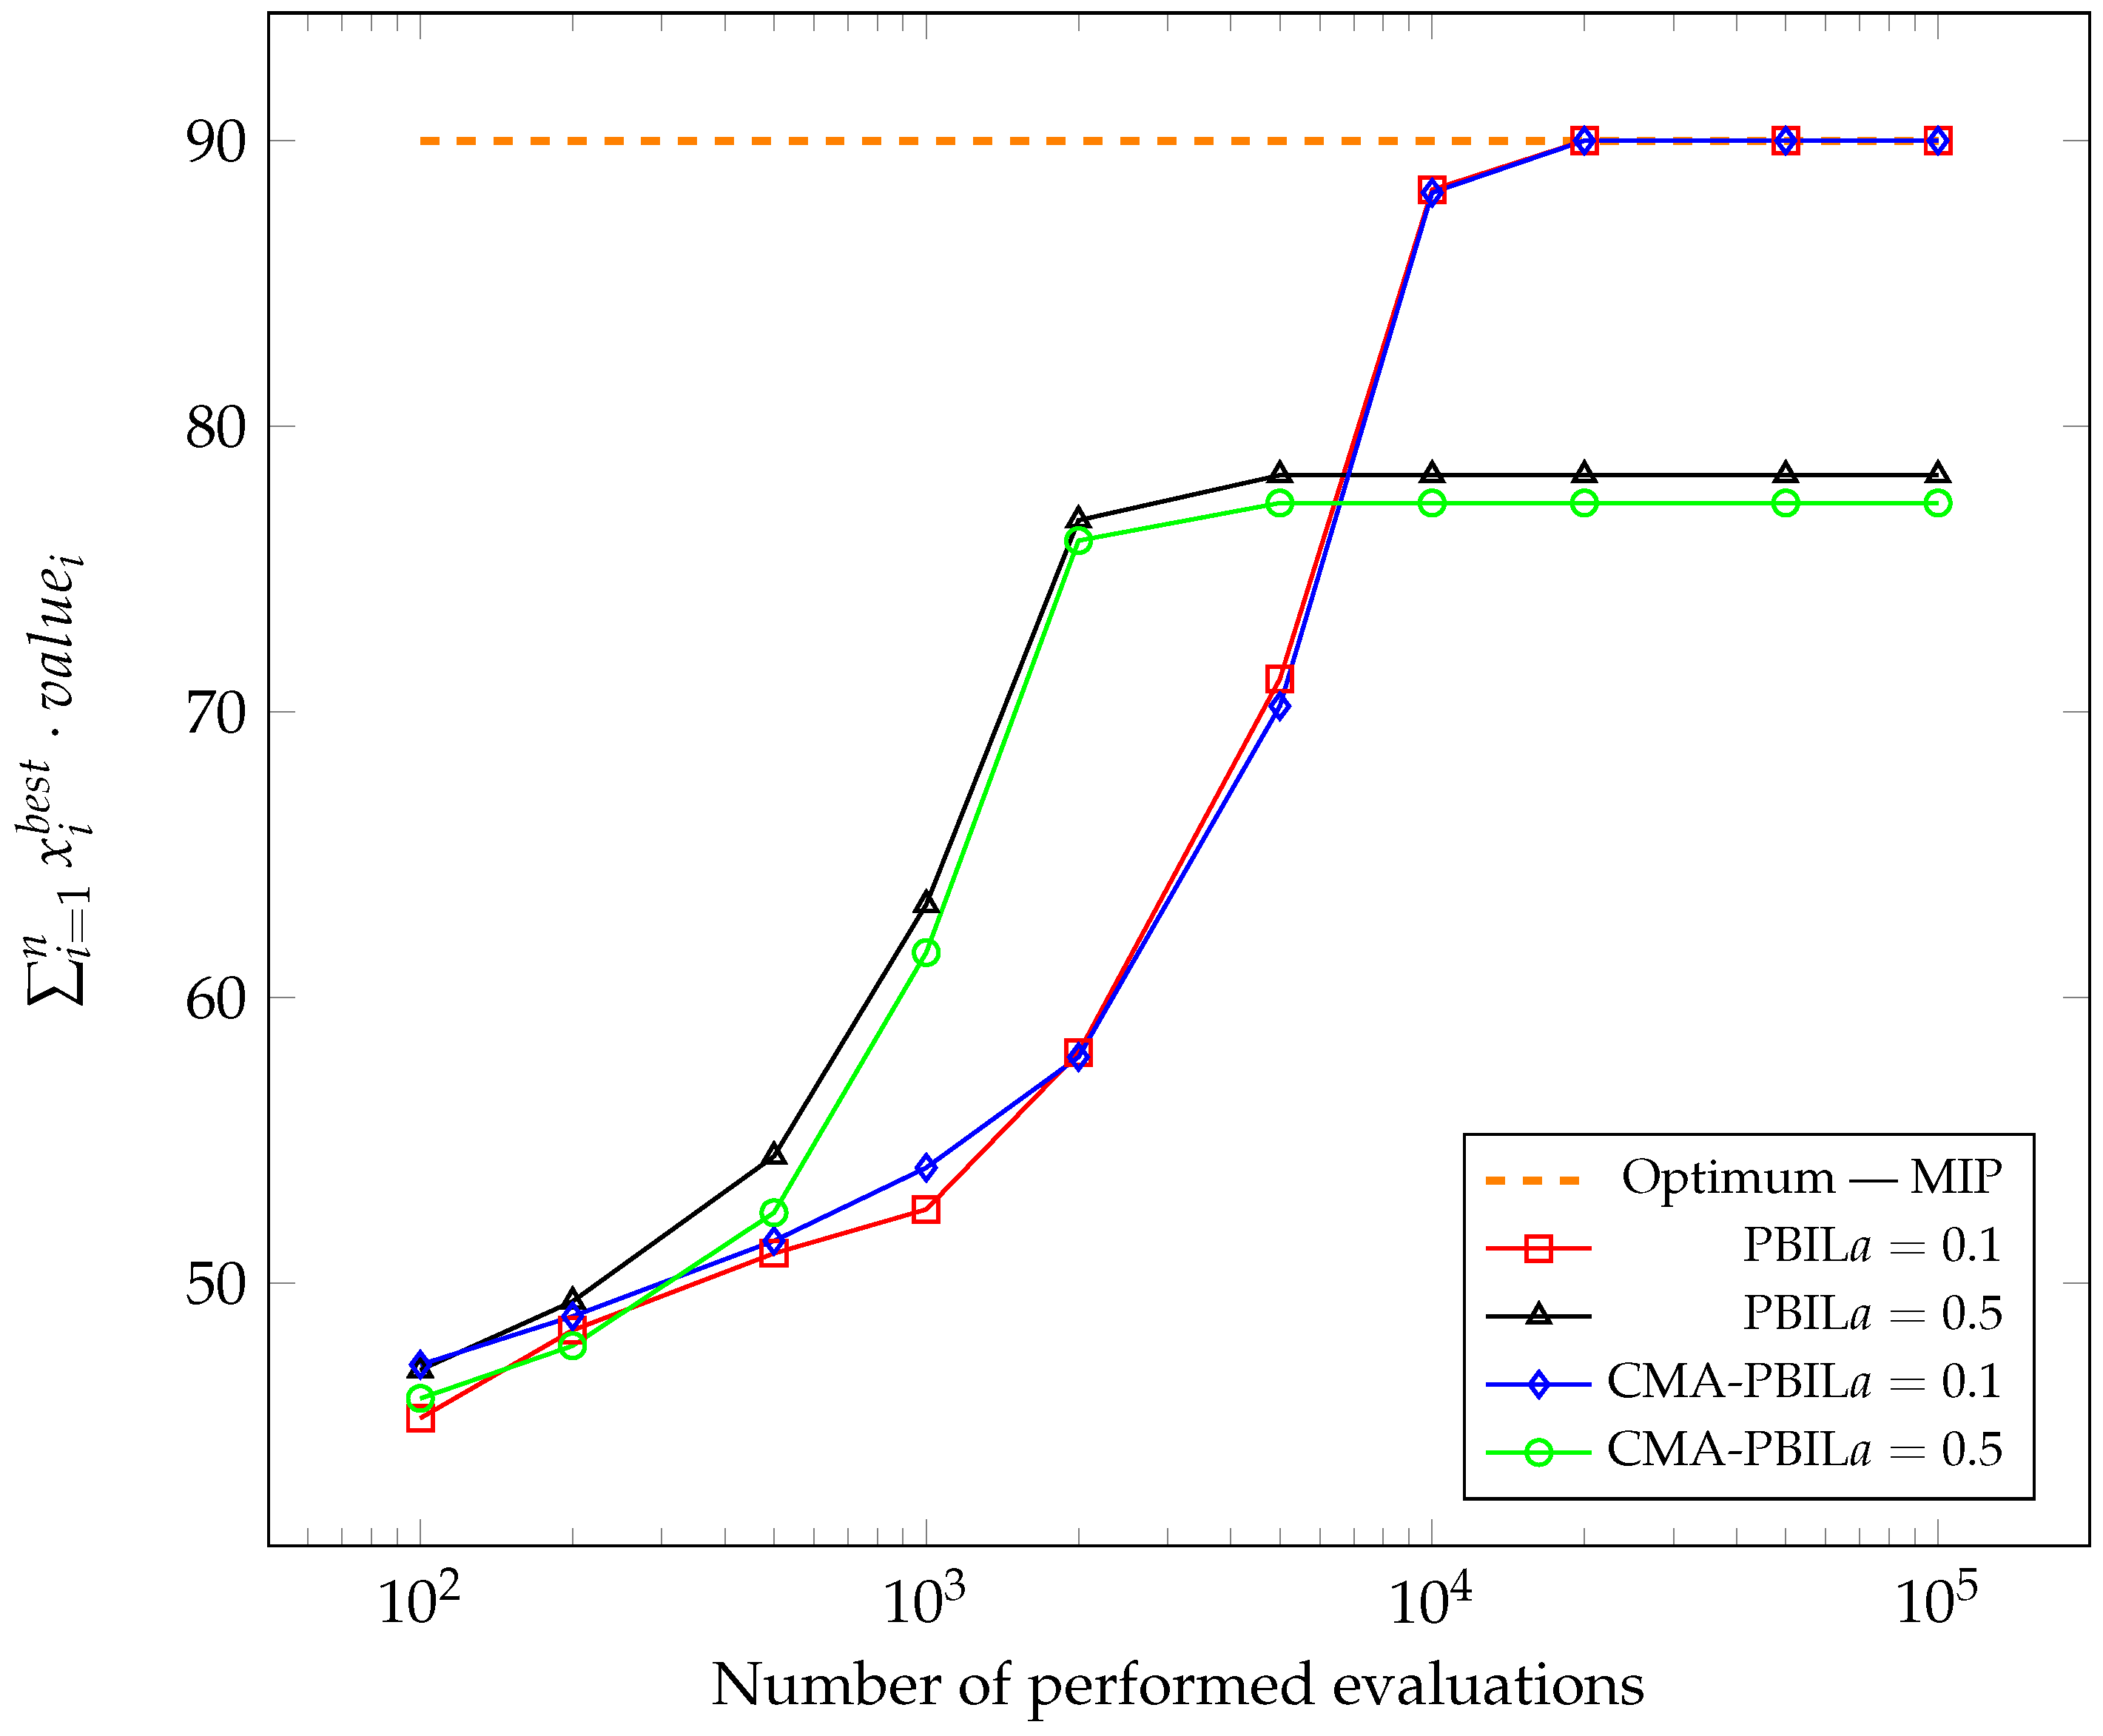
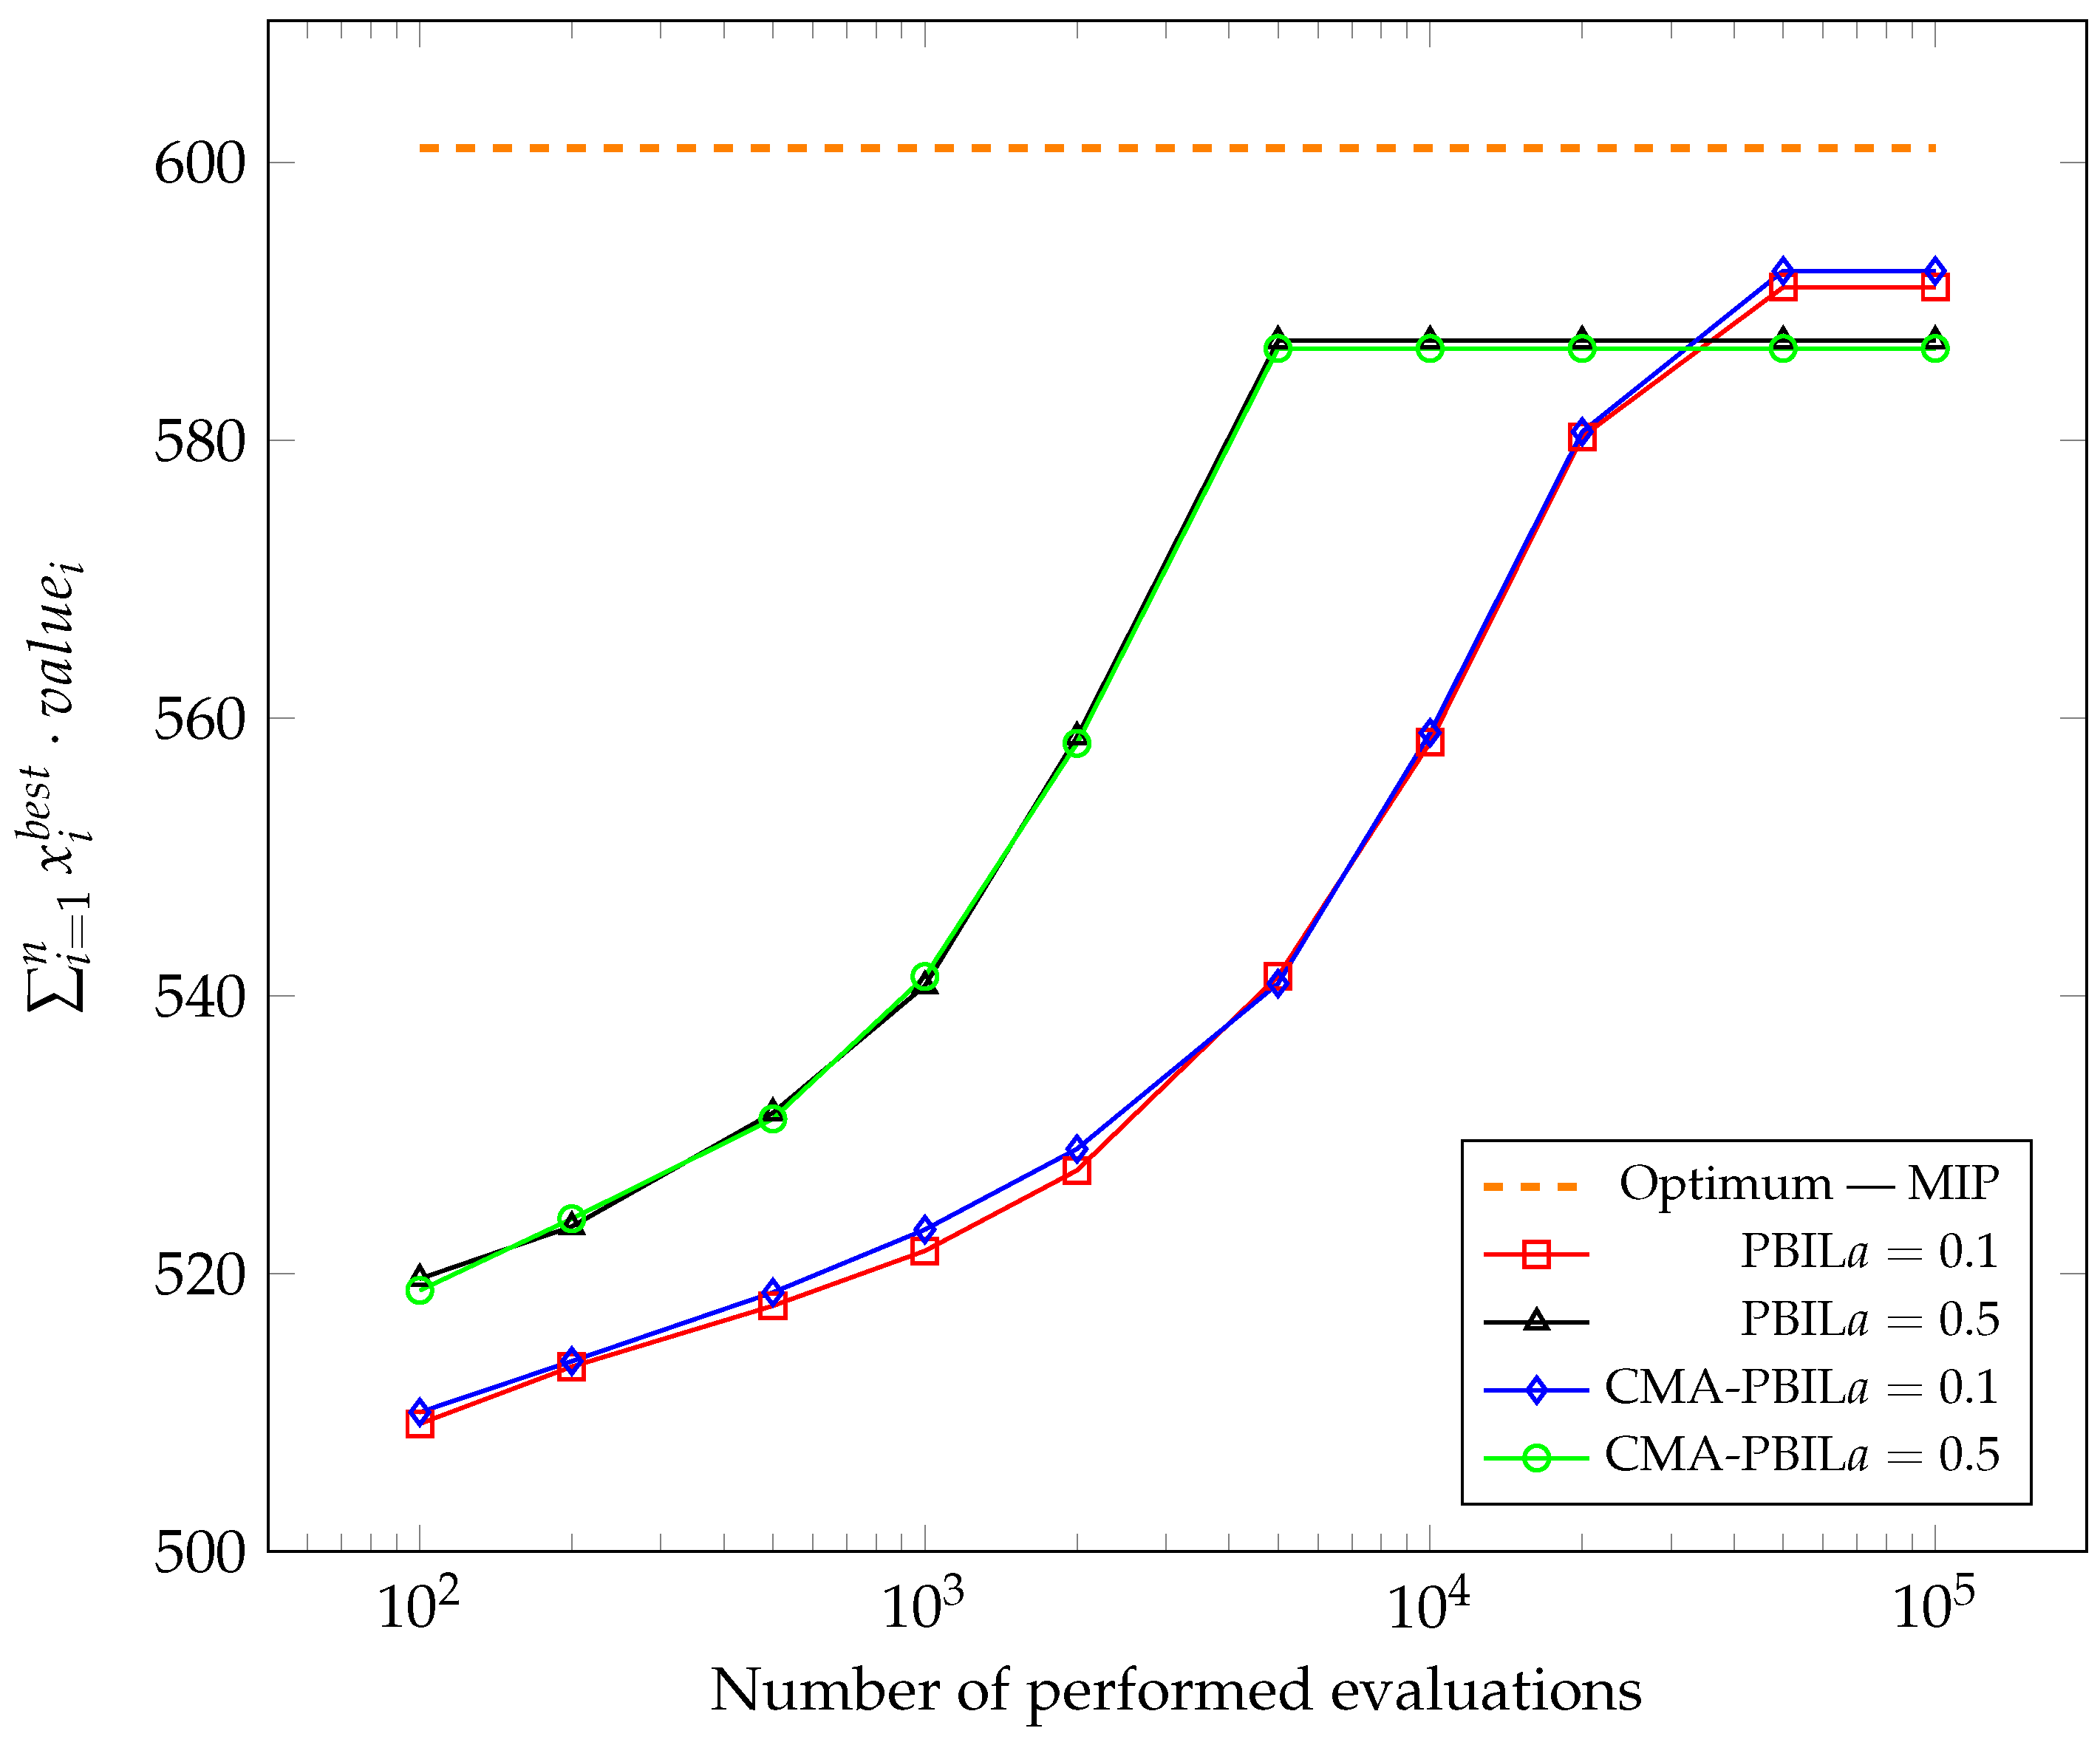
Each experiment was conducted 50 times.
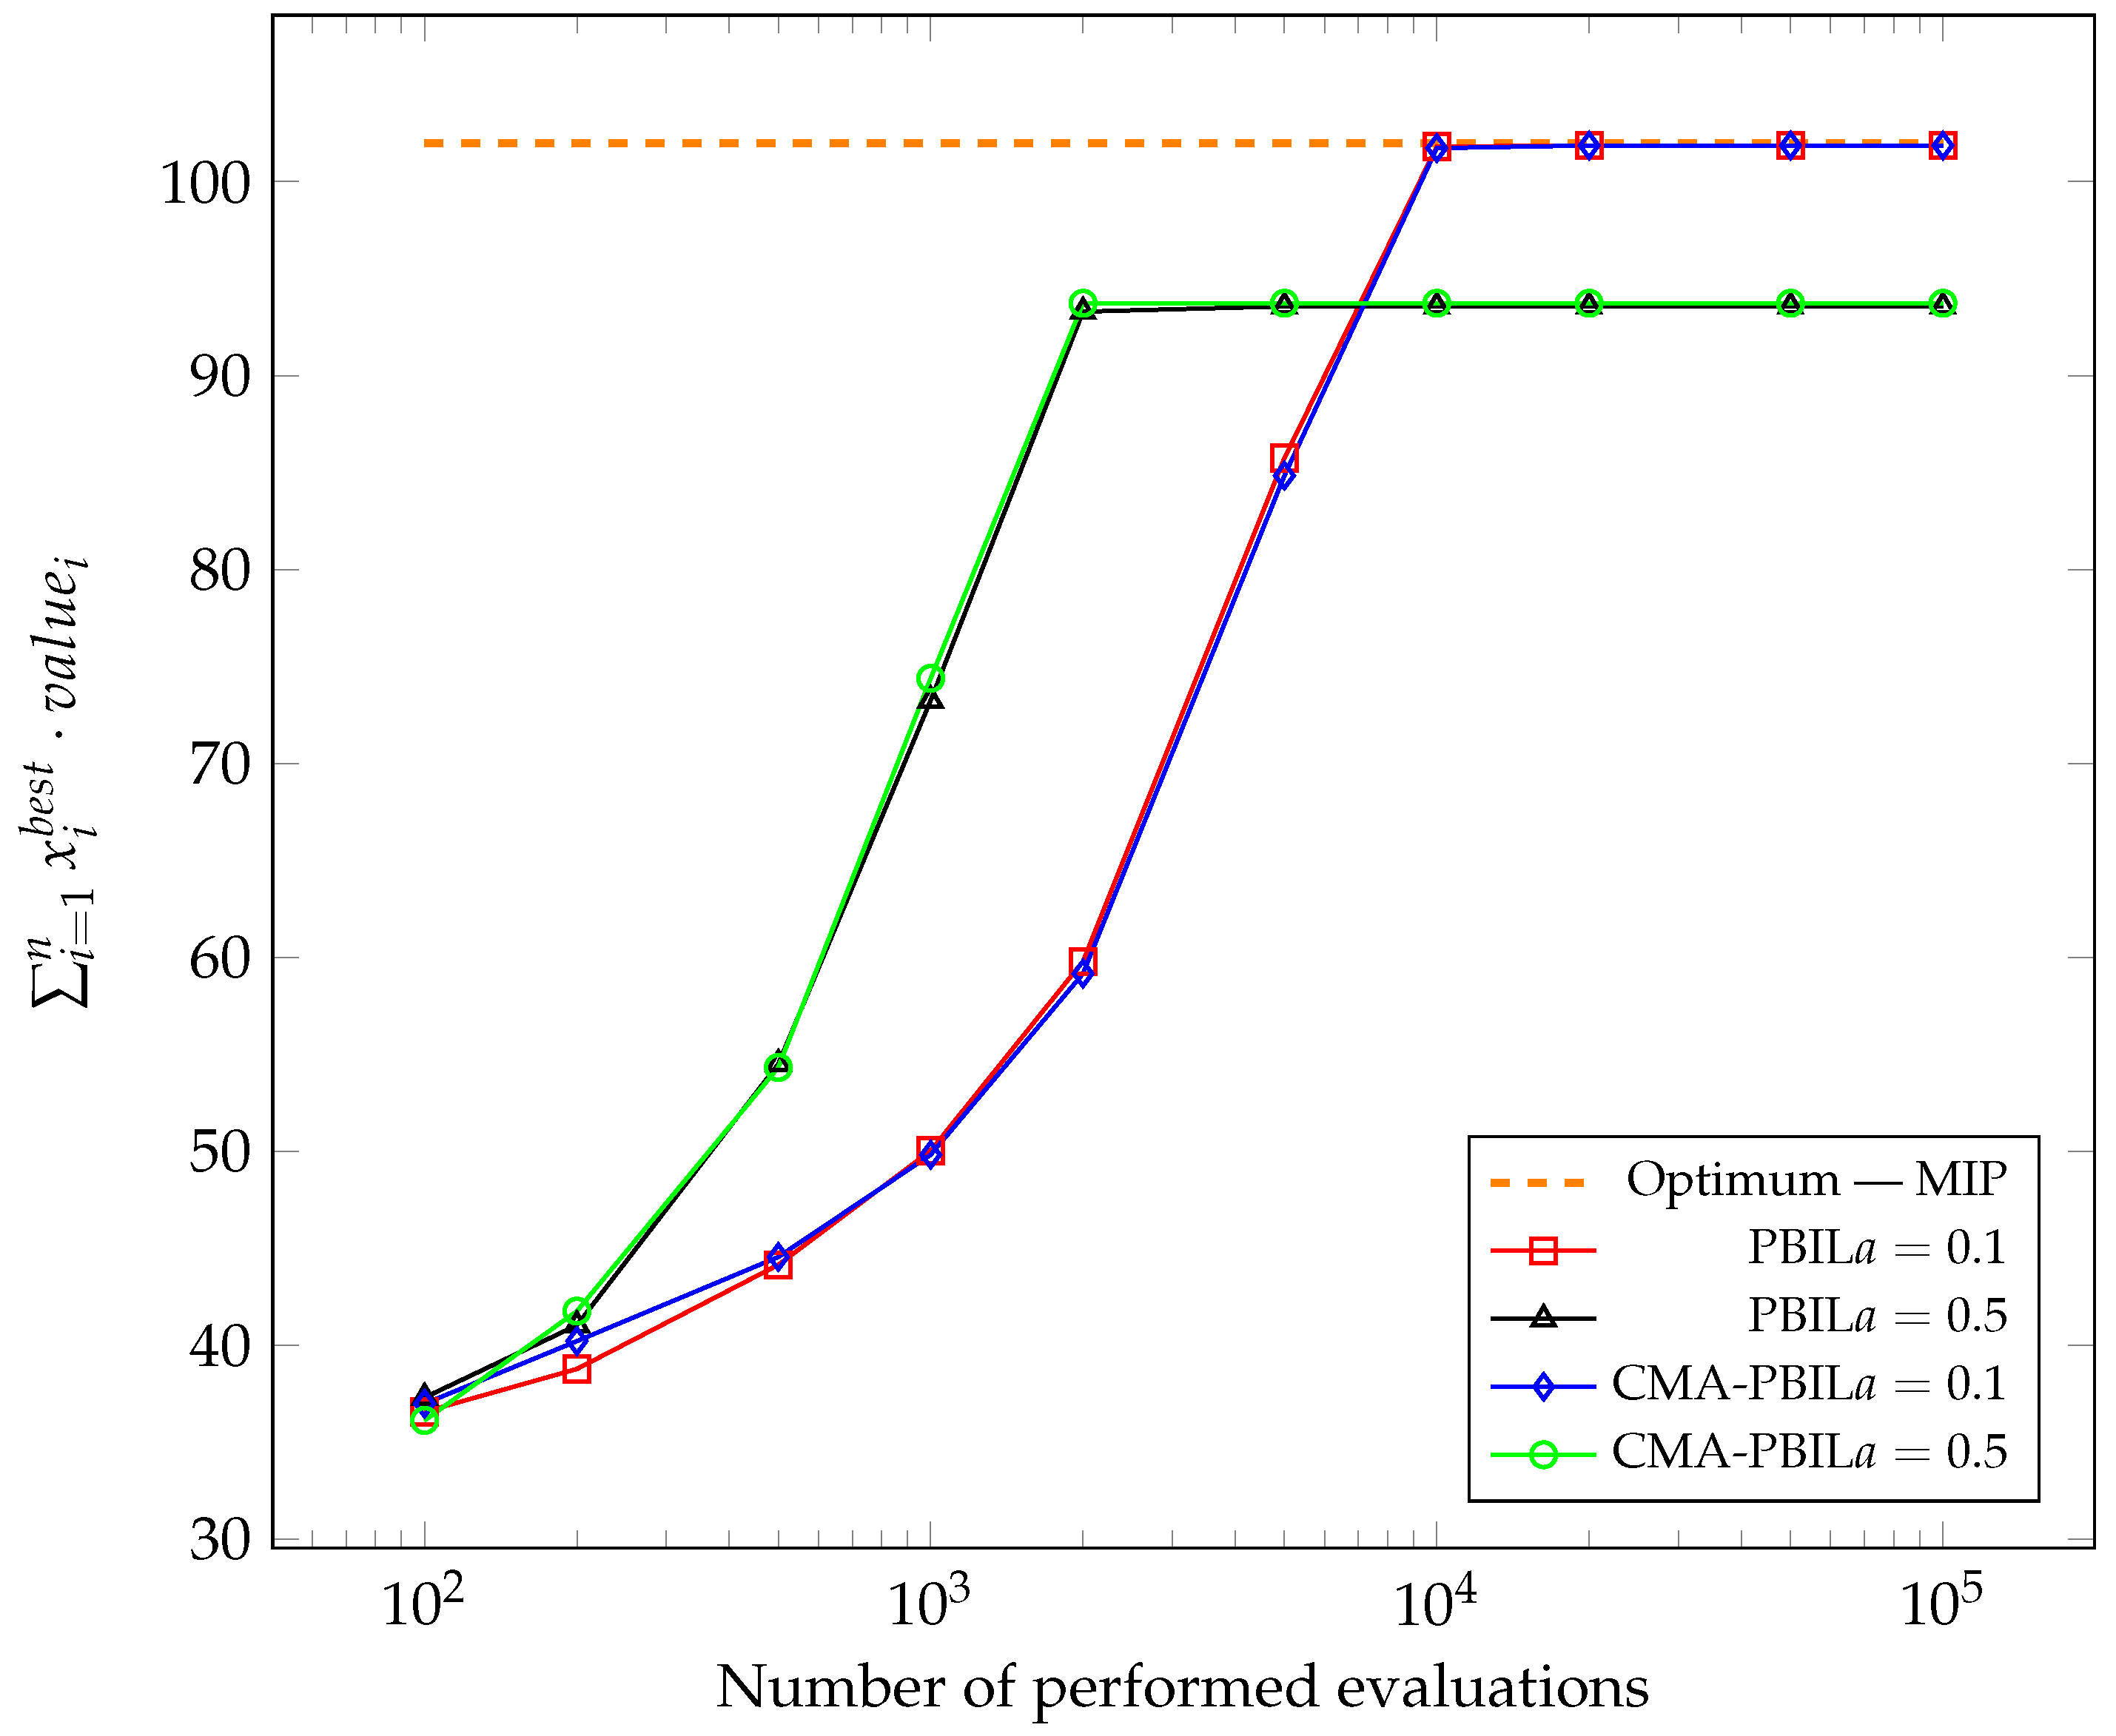
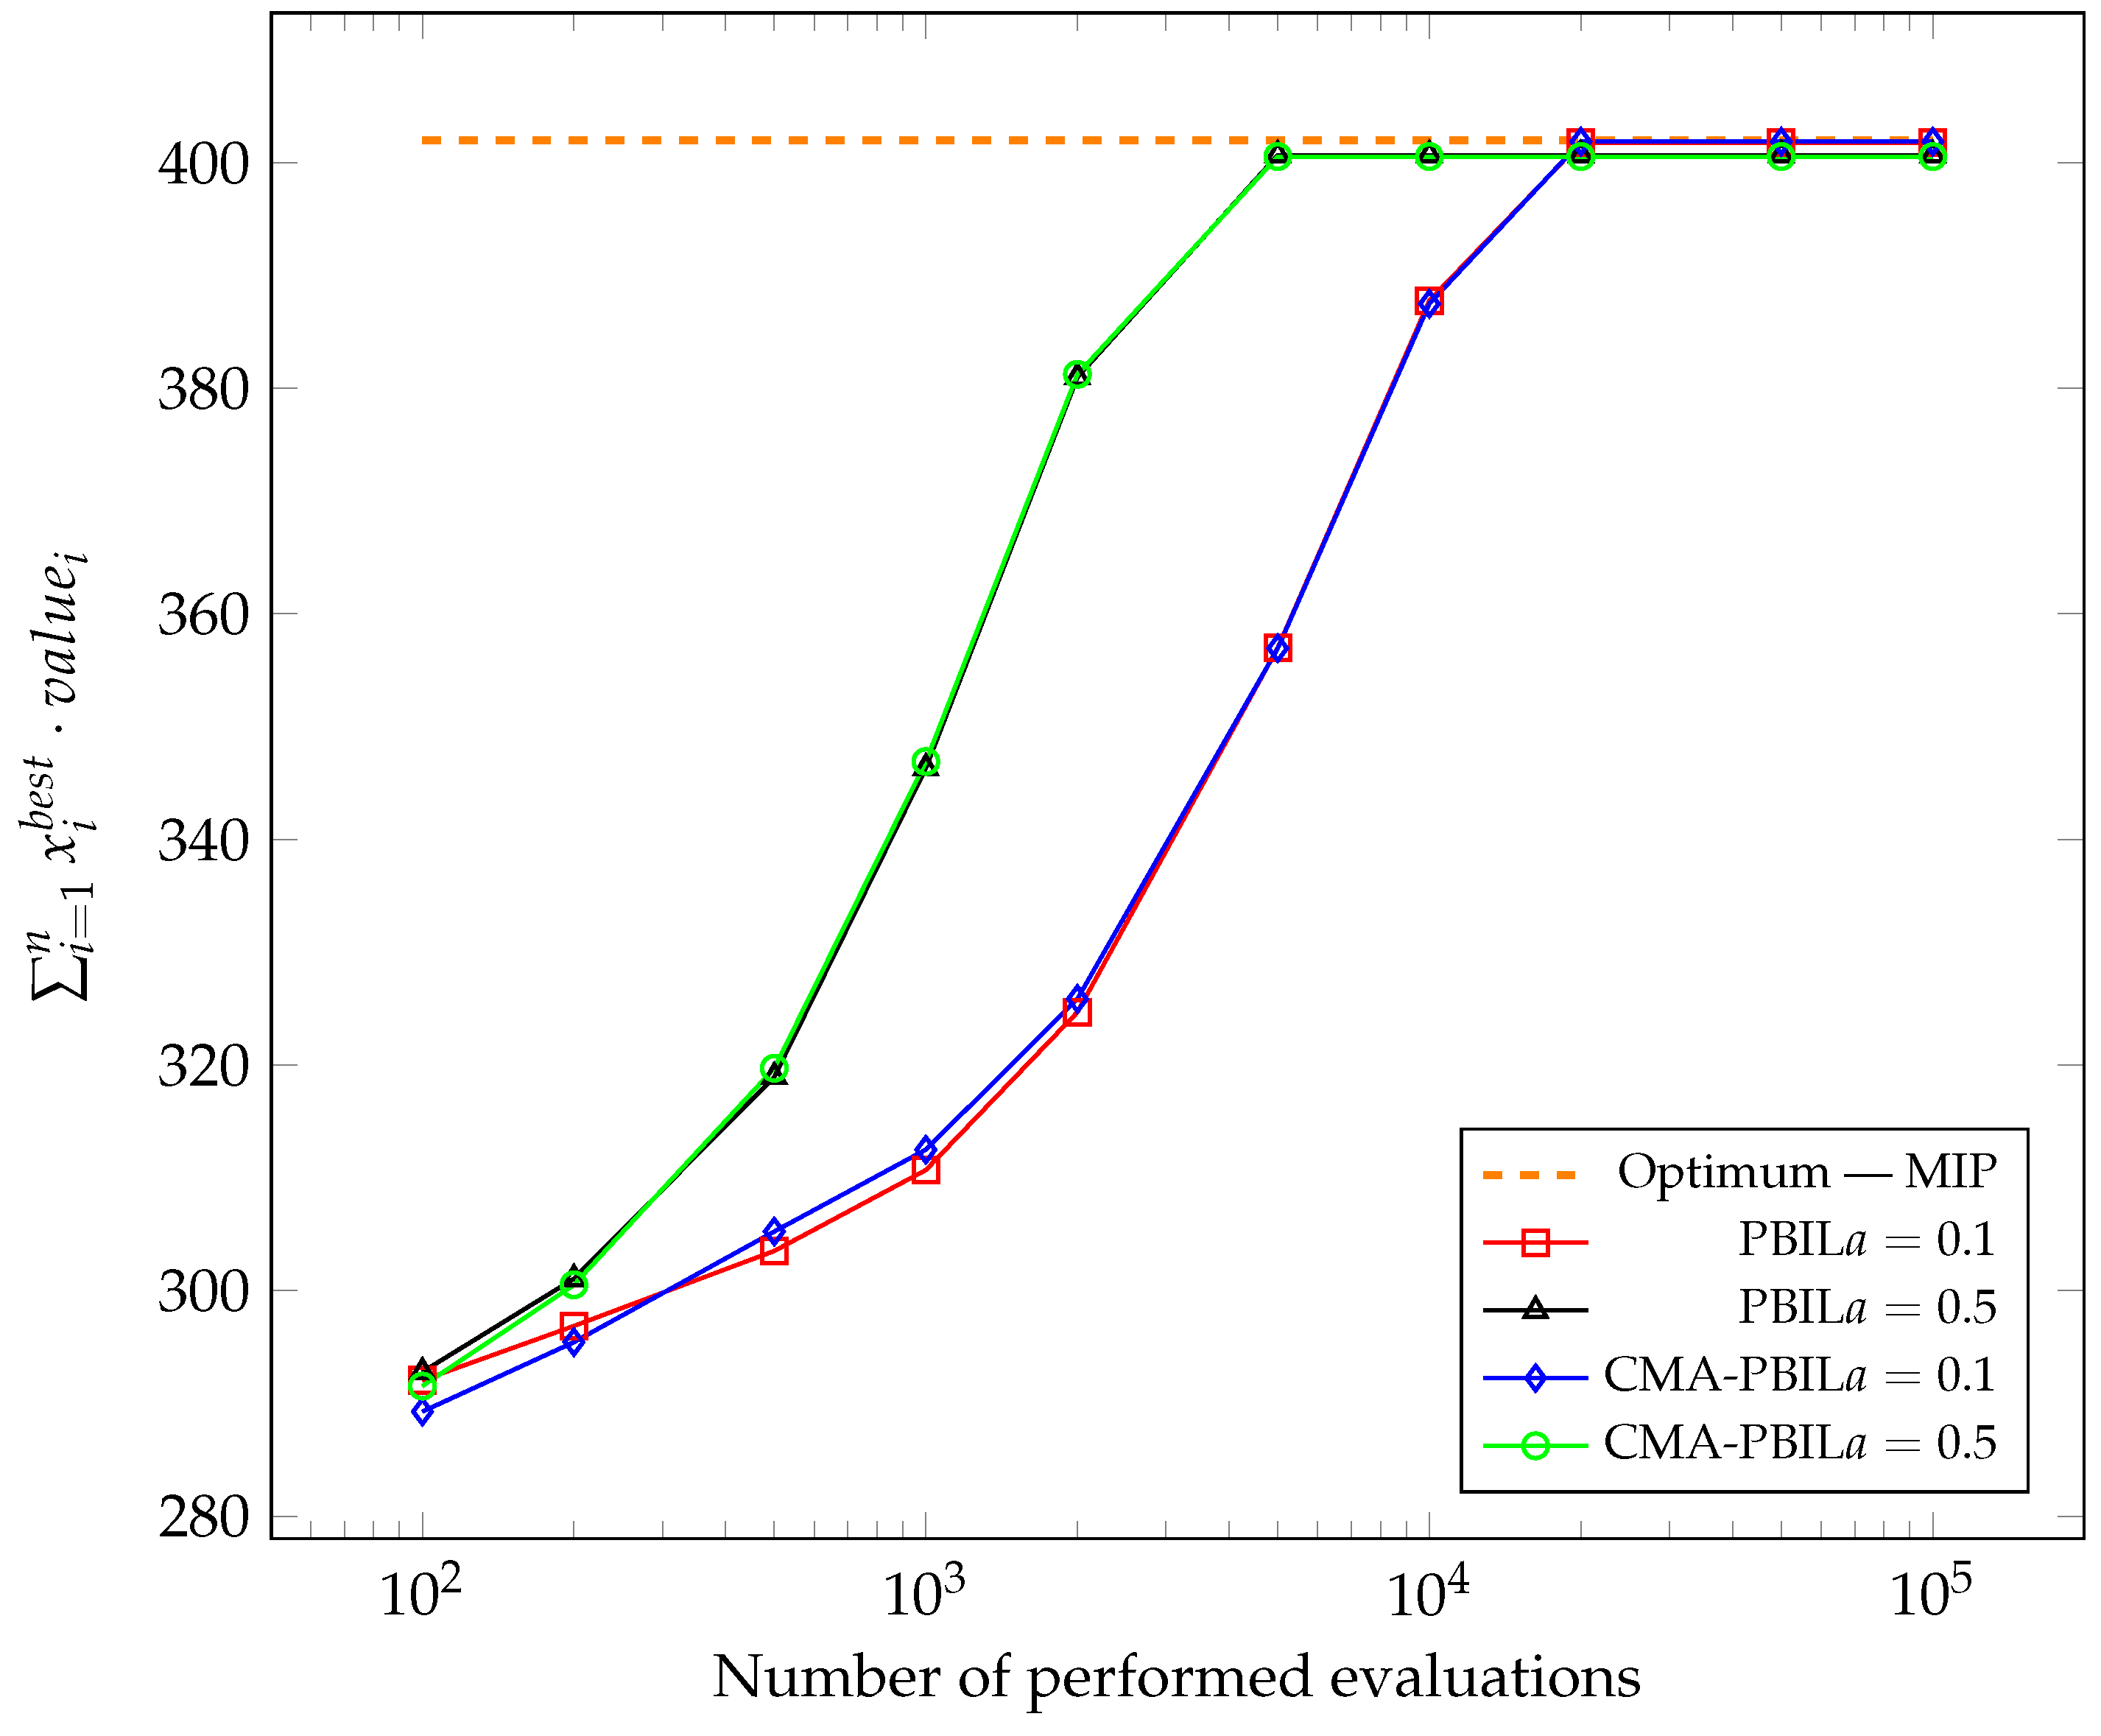
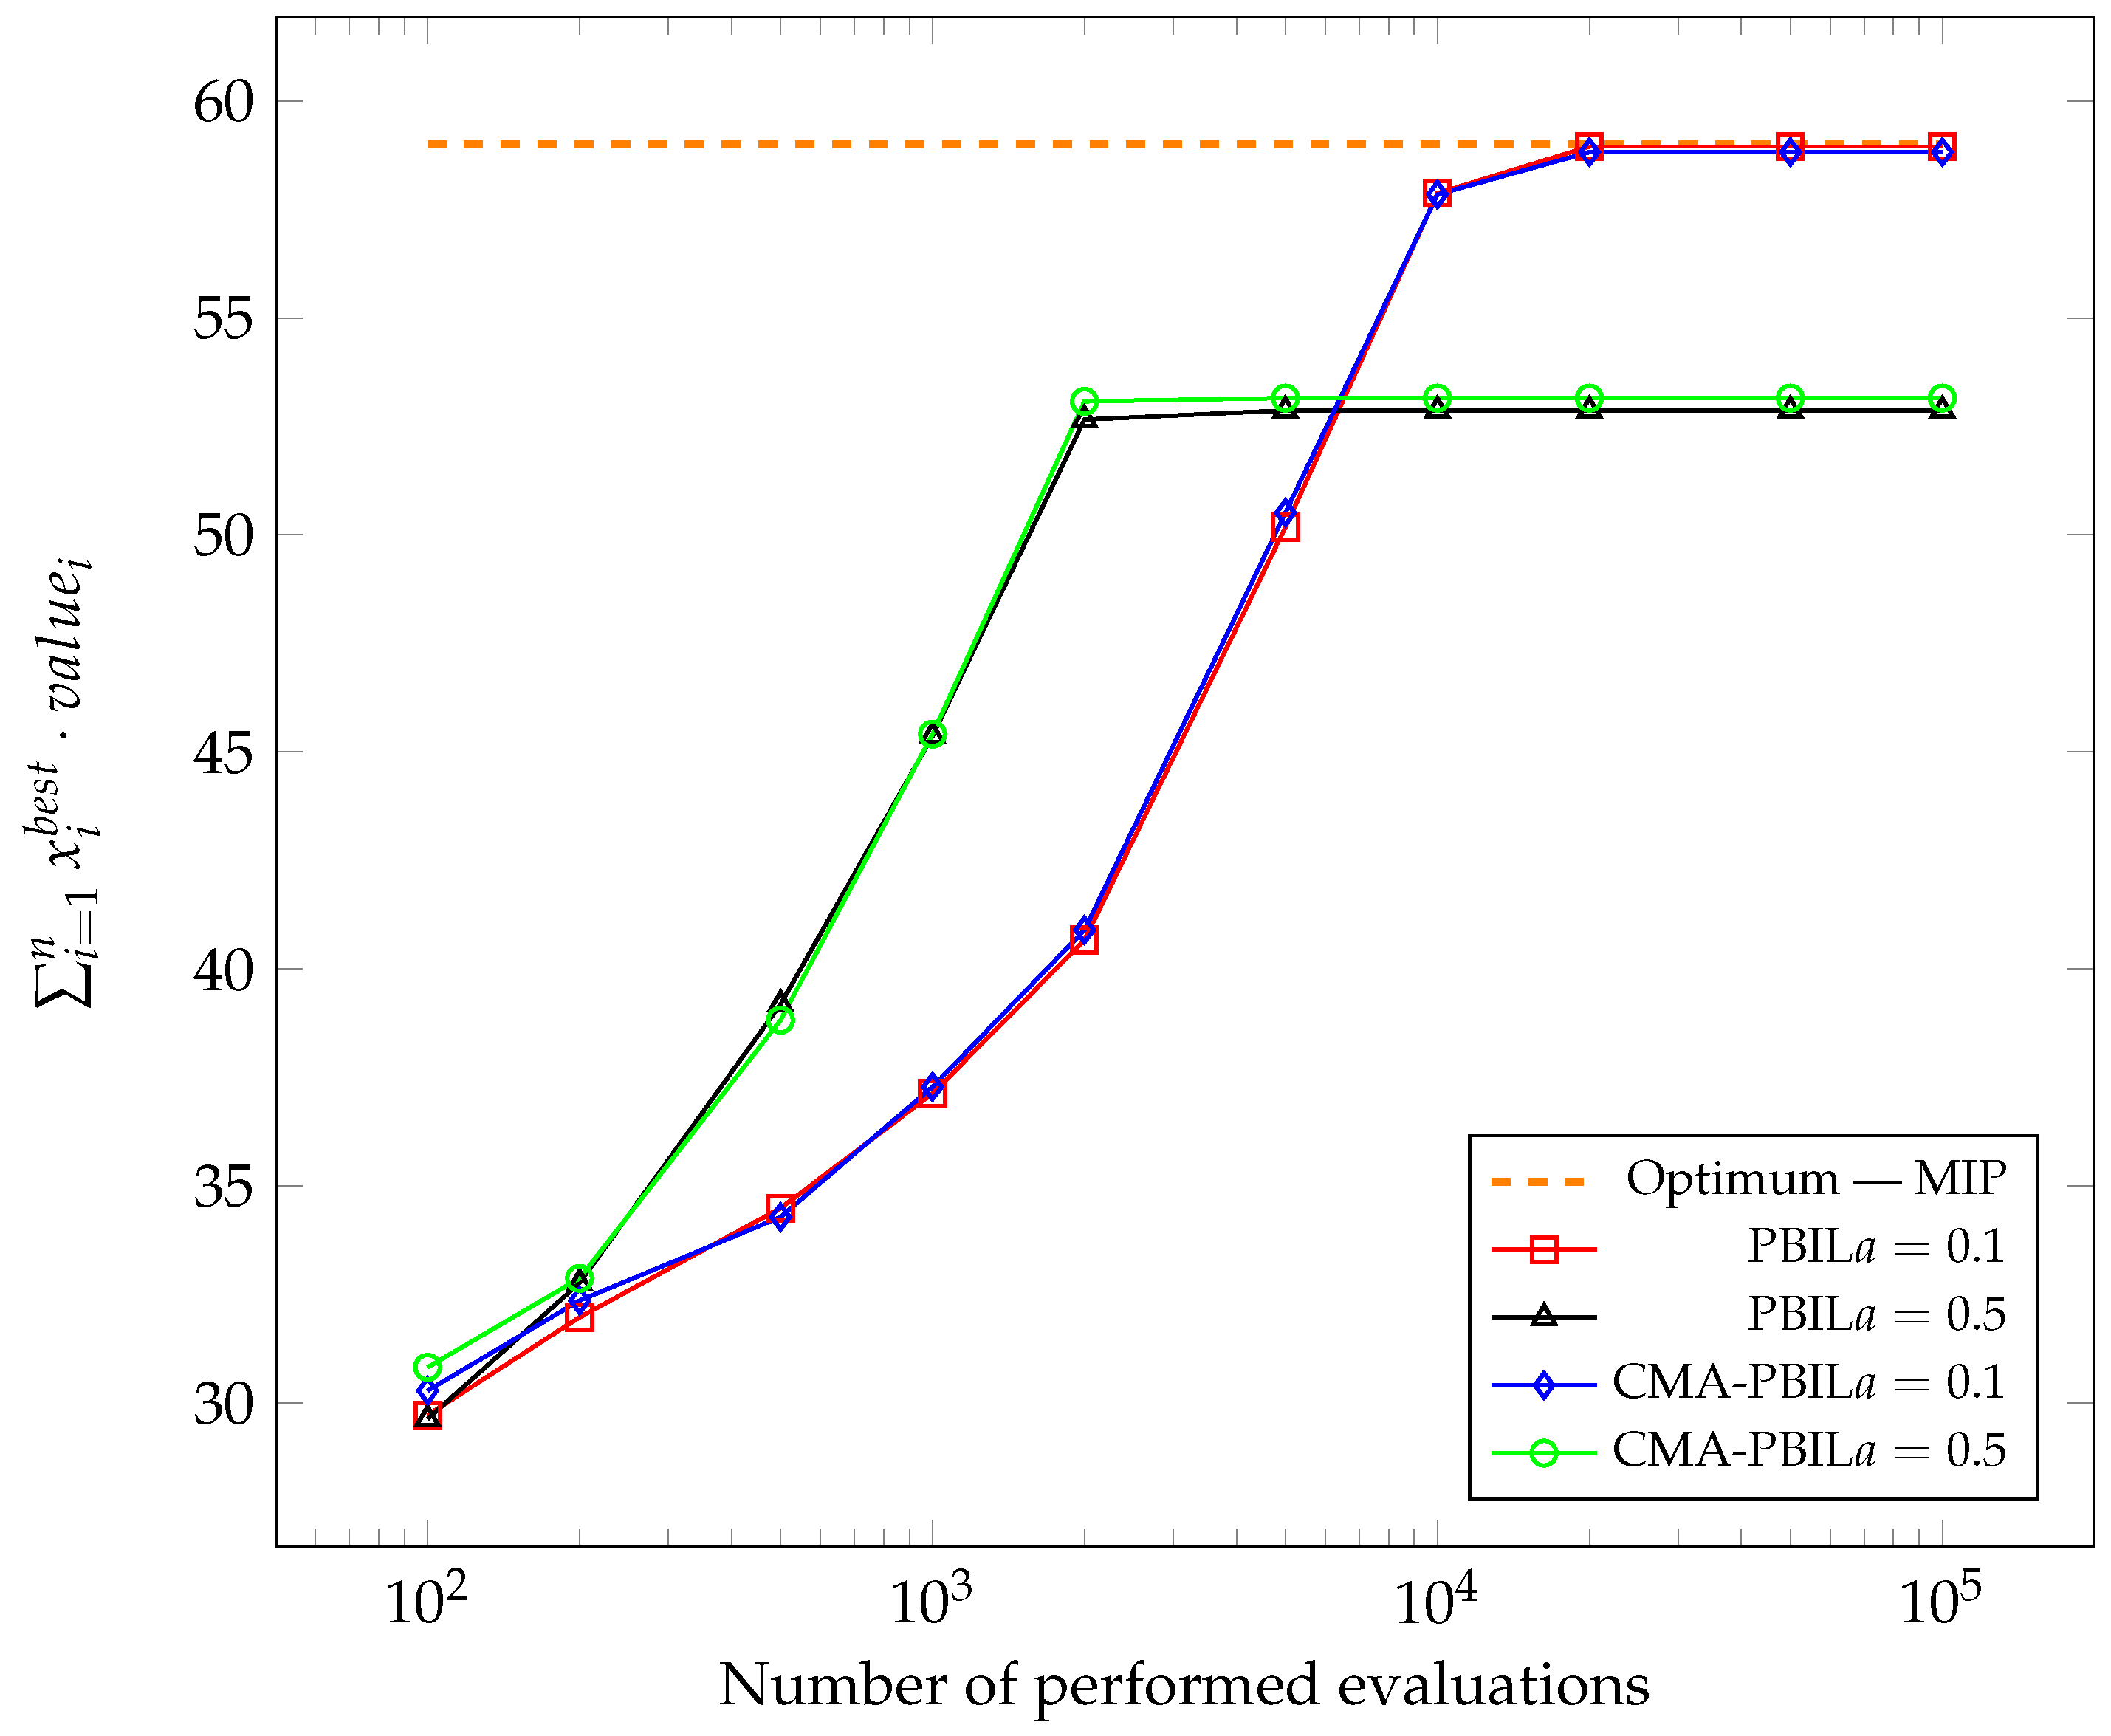
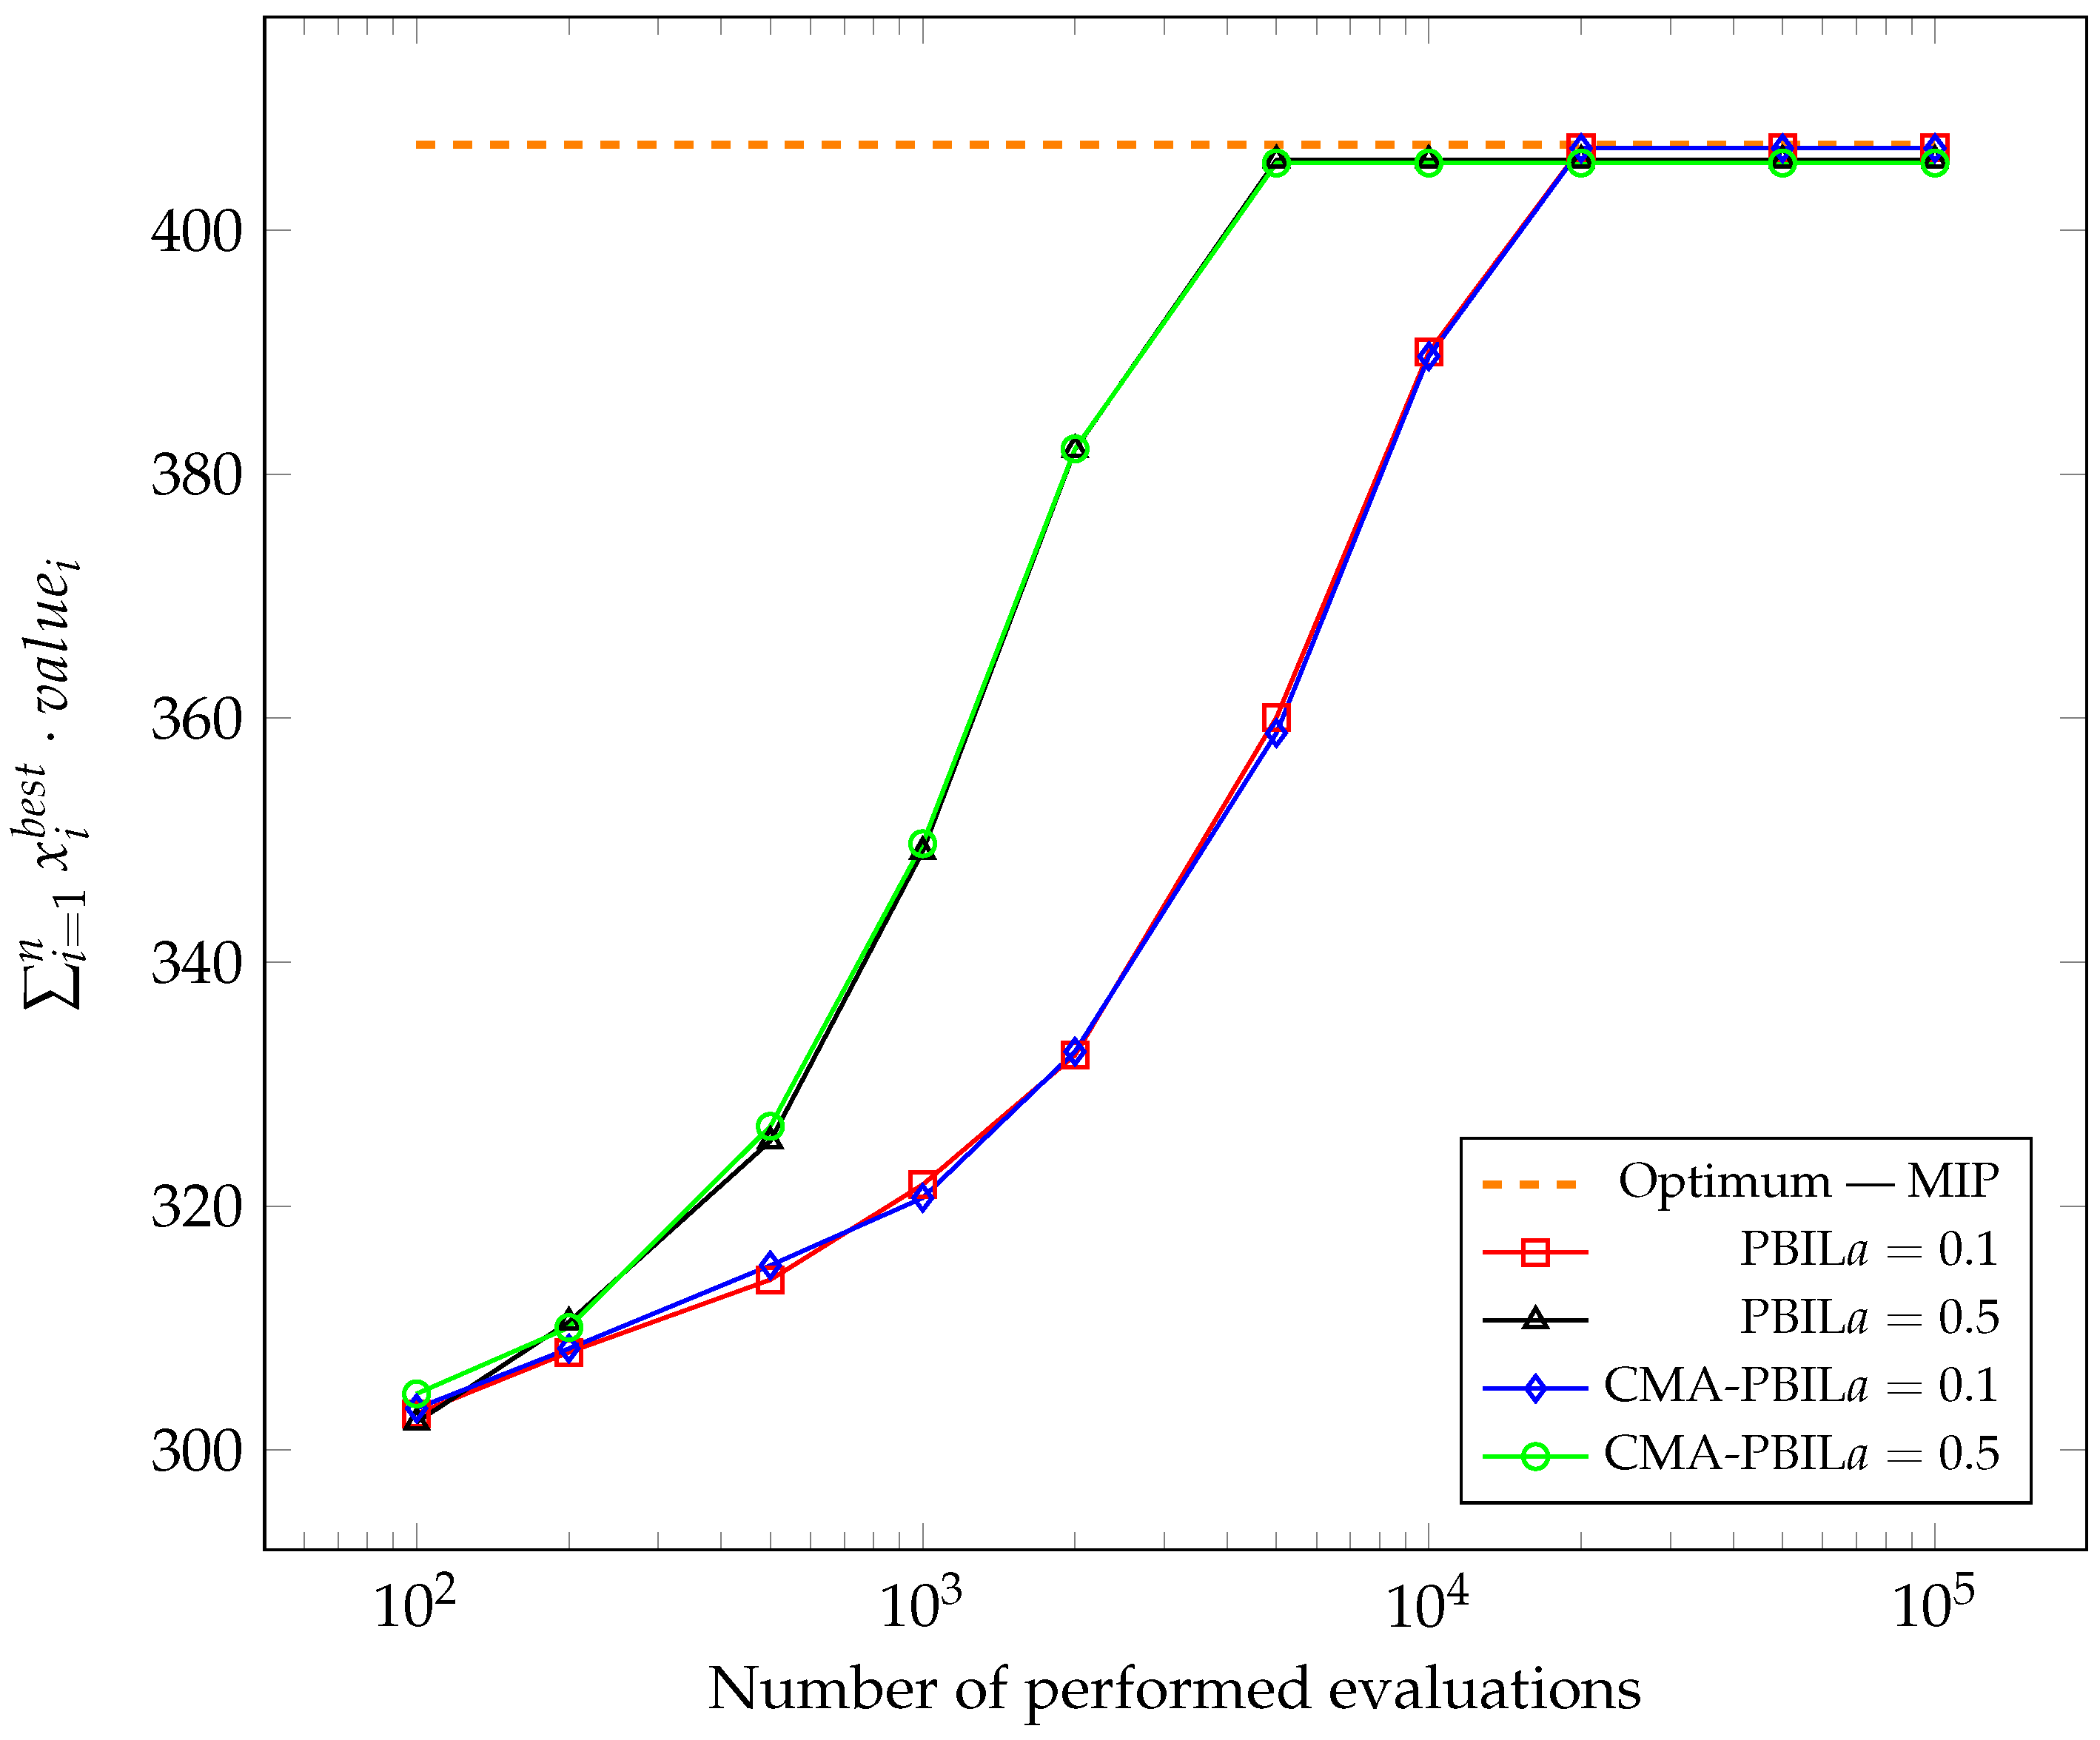
Figure 1,
Figure 2,
Figure 3,
Figure 4,
Figure 5 and
Figure 6 show the changes in the average of the maximum obtained values of the objective function so far during the subsequent evaluation. The best solutions found so far were captured after 100, 200, 500, 1000, 2000, 5000, 10,000, 20,000, 50,000 and 100,000, performing the objective function calculation and average for each test case after all experiments. To compare the results with the global optimum, the problem was also solved using Mixed-Integer Programming (MIP).
It was apparent from the presented graphs that both algorithms performed very similarly. For most test cases carried out, higher achieved values for the CMA-PBIL algorithm could be observed in the initial phases.
In addition,
Figure 1,
Figure 3 and
Figure 5 noticeably show that, for knapsacks of capacity equal
for both tested algorithms at a learning rate of
, the computation terminated prematurely by converging to a local extreme.
Table 3 and
Table 4 show the mean values and standard deviations of the objective function and the number of its evaluation in each test case. The last column in each table contains the
p-value of the Wilcoxon–Mann–Whitney test, which was selected since the results did not come from a normal distribution. The most significant difference favouring the CMA-PBIL algorithm could be observed for test case number five, a knapsack problem with a strong correlation between weights and item values and a small capacity and a learning rate of
. For both algorithms, the final average value of the test case’s objective function was identical, while the CMA-PBIL algorithm required about 1700 less evaluations of the objective function. For no other test case did the PBIL algorithm perform noticeably better—the differences, sometimes in favour of the reference version and sometimes in favour of the modified version, were marginal.
The modifications that were proposed have in no case resulted in an evident degradation of the results. On the contrary, it was possible to identify a case for which the consideration of the covariance matrix in the probability distribution yielded an improvement in the convergence of the vector.
The covariance matrix was intended to benefit only in specific test cases, particularly where there were strongly competing solutions. Such instances introduce a high correlation between the variables themselves, as in test problem number five. If one looked closely at how items were generated there, it would be clear that many items with identical parameters were generated. When looking at the value of the objective function, it was irrelevant which of the identical objects was included in the solution and, moreover, the constraint may cause that both at the same time should not be packed. Taking correlation into account allowed for a quicker separation of solutions giving the same result.
Potential Applications
Nowadays, optimization issues arise in almost every area of science, engineering and economics. Model-based optimization using probabilistic modelling of the search space is a potential area for research of evolutionary algorithms. The PBIL is one of the algorithms that has been extensively applied to many optimization problems, both in the continuous and discrete domains. The CMA-PBIL algorithm proposed in the paper gave satisfactory results in the knapsack problem. Therefore, we will apply it to a similar problem concerning simulation and analysis methods of logistics networks for the postal operator. It will be our continuation and future work of application of the CMA-PBIL algorithm. The postal problem is a kind of composite of two problems. Firstly, it is a logistics problem, which considers how to determine the optimal set of routes with a fleet of vehicles to meet customer demands at the lowest possible cost. It is a generalization of the well-known travelling salesman problem. In addition, each car has to carry many items that can be distributed among the machines in very many ways. Secondly, the question is the same as in the knapsack problem—how to allocate the goods so that their total weight and size do not exceed the vehicle’s capacity and the total value transport is as high as possible.
Another problem in the discrete solution space where CMA-PBIL will find a potential application is the problem of optimizing node resources in a Dense Wavelength Division Multiplexing (DWDM) optical network, described in [
17]. The main objective of the optimization is to minimize capital expenditure, which includes the costs of optical node resources, such as transponders and amplifiers used in a new generation of optical networks. A model, taking into account the physical phenomena in the optical network, was proposed.
The problems mentioned above were, in our view, appropriate where the CMA-PBIL algorithm would be competitive with the methods used there. Preliminary studies supported our thesis.
5. Conclusions
This paper investigated the impact of modifying the PBIL algorithm to include dependencies between variables on convergence and performance. The idea behind the CMA-PBIL algorithm was to introduce a covariance matrix to describe the probability distribution that represents the populations, which was inspired by the CMA-ES algorithm. To the best of the authors’ knowledge, no studies attempted to add a covariance matrix to the binary distributions in the PBIL algorithm.
The focus of the experiments investigating CMA-PBIL was to determine how the modification affected the quality of the resulting solutions. The intention was that the CMA-PBIL algorithm should perform no worse than the standard PBIL and find a solution faster in specific cases. Both algorithms were tested on different types of knapsack problems, differing in the level of correlation between object attributes and knapsack capacity. The results confirmed the assumption, and for the highly correlated case having equivalent solutions, the CMA-PBIL algorithm completed it with a reduced number of calculation of the objective function, reaching the optimal result. While CMA-PBIL only benefited a specific class of problems, it is notable that it did not visibly degrade the result if the problem did not fit into this class.
In practical applications, some problems could also reach the same state in many equivalents and equally costly ways. Therefore, it is worthwhile to consider the CMA-PBIL algorithm for their solving since, similarly, as shown on the knapsack problem, if there are indications that there are strong correlations between the decision variables, a faster convergence can be achieved.
Author Contributions
Conceptualization, J.A. and S.K.; methodology, J.A., S.K., M.K. and A.P.; software, M.K. and A.P.; validation, S.K. and J.A.; formal analysis, S.K. and J.A.; investigation, J.A., S.K., A.P. and M.K.; resources, J.A. and S.K.; data curation, A.P. and M.K.; writing—original draft preparation, M.K., A.P. and S.K.; writing—review and editing, S.K. and J.A.; visualization, A.P. and M.K.; All authors have read and agreed to the published version of the manuscript.
Funding
This research was funded by the National Center for Research and Development under grant POIR.04.01.04-00-0054/17-00). LAS Project under the title Simulation and analysis methods of logistics networks for postal operators. Funding of The National Centre for Research and Development in Poland.
Institutional Review Board Statement
Not applicable.
Informed Consent Statement
Not applicable.
Data Availability Statement
Not applicable.
Acknowledgments
The authors would like to thank the anonymous reviewers for their insightful, relevant and valuable comments.
Conflicts of Interest
The authors declare no conflict of interest.
Abbreviations
The following abbreviations are used in this manuscript:
| EA | Evolutionary Algorithm |
| EDA | Estimation of Distribution Algorithm |
| PBIL | Population-Based Incremental Learning |
| ES | Evolution Strategy |
| CMA-ES | Covariance Matrix Adaptation Evolution Strategy |
| CMA-PBIL | Covariance Matrix Adaptation Population-Based Incremental Learning |
| DWDM | Dense Wavelength Division Multiplexing |
| MIP | Mixed-Integer Programming |
References
- Garey, M.R.; Johnson, D.S. Computers and Intractability; A Guide to the Theory of NP-Completeness; W. H. Freeman & Co.: New York, NY, USA, 1990. [Google Scholar]
- Larrañaga, P.; Lozano, J.A. Estimation of Distribution Algorithms: A New Tool for Evolutionary Computation; Springer Science & Business Media: New York, NY, USA, 2001; Volume 2. [Google Scholar]
- Baluja, S. Population-Based Incremental Learning. A Method for Integrating Genetic Search Based Function Optimization and Competitive Learning; Technical Report; Carnegie-Mellon University Pittsburgh Pa Department of Computer Science: Pittsburgh, PA, USA, 1994. [Google Scholar]
- Servais, M.; De Jaer, G.; Greene, J. Function optimization using multiple-base population based incremental learning. In Proceedings of the Eighth South African Workshop on Pattern Recognition, Makhanda, South Africa, 1997. [Google Scholar]
- Yang, S.; Yao, X. Experimental study on population-based incremental learning algorithms for dynamic optimization problems. Soft Comput. 2005, 9, 815–834. [Google Scholar] [CrossRef]
- Zhang, Q.; Wu, T.; Liu, B. A population-based incremental learning algorithm with elitist strategy. In Proceedings of the Third International Conference on Natural Computation (ICNC 2007), Haikou, Hainan, China, 24–27 August 2007; Volume 3, pp. 583–587. [Google Scholar]
- Caldas, G.; Schirru, R. FPBIL: A Parameter-Free Evolutionary Algorithm; INTECH Open Access Publisher: Brasilia, Brazil, 2008. [Google Scholar]
- Hansen, N.; Müller, S.D.; Koumoutsakos, P. Reducing the time complexity of the derandomized evolution strategy with covariance matrix adaptation (CMA-ES). Evol. Comput. 2003, 11, 1–18. [Google Scholar] [CrossRef] [PubMed]
- Benhamou, E.; Atif, J.; Laraki, R. A Discrete Version of CMA-ES. 2018. Available online: https://arxiv.org/pdf/1812.11859.pdf (accessed on 25 September 2021).
- Hansen, N. The CMA Evolution Strategy: A Comparing Review. In Towards a New Evolutionary Computation: Advances in the Estimation of Distribution Algorithms; Lozano, J.A., Larrañaga, P., Inza, I., Bengoetxea, E., Eds.; Springer: Berlin/Heidelberg, Germany, 2006; pp. 75–102. [Google Scholar] [CrossRef]
- Toth, P.; Martello, S. Knapsack Problems: Algorithms and Computer Implementations; Wiley: Chichester, UK, 1990. [Google Scholar]
- Michalewicz, Z.; Arabas, J. Genetic algorithms for the 0/1 knapsack problem. In International Symposium on Methodologies for Intelligent Systems; Springer: Berlin/Heidelberg, Germany, 1994; pp. 134–143. [Google Scholar]
- Emrich, L.J.; Piedmonte, M.R. A method for generating high-dimensional multivariate binary variates. Am. Stat. 1991, 45, 302–304. [Google Scholar]
- Leisch, F.; Weingessel, A.; Hornik, K. On the Generation of Correlated Artificial Binary Data; WU (Vienna University of Economics and Business): Wien, Austria, 1998. [Google Scholar]
- Demirtas, H. A method for multivariate ordinal data generation given marginal distributions and correlations. J. Stat. Comput. Simul. 2006, 76, 1017–1025. [Google Scholar] [CrossRef]
- MultiOrd CRAN Package. Available online: https://cran.r-project.org/package=MultiOrd (accessed on 16 July 2021).
- Kozdrowski, S.; Żotkiewicz, M.; Wnuk, K.; Sikorski, A.; Sujecki, S. A Comparative Evaluation of Nature Inspired Algorithms for Telecommunication Network Design. Appl. Sci. 2020, 10, 6840. [Google Scholar] [CrossRef]
| Publisher’s Note: MDPI stays neutral with regard to jurisdictional claims in published maps and institutional affiliations. |
© 2021 by the authors. Licensee MDPI, Basel, Switzerland. This article is an open access article distributed under the terms and conditions of the Creative Commons Attribution (CC BY) license (https://creativecommons.org/licenses/by/4.0/).


