1. Introduction
Nickel-based superalloys show an excellent combination of properties. Among these, the most important property is to retain high strength at high temperatures. This characteristic makes this class of material suitable for applications in which the components could be exposed to temperatures even higher than 800 °C [
1] during services. Thus, nickel-based superalloys are well suited to the aerospace, aviation, marine, nuclear, chemical, and power generation industries. Focusing on the aerospace field, nickel-based alloys are widely used to manufacture aeroengine parts [
2], for which the resistance to impact loads also needs to be evaluated. In the case of impact, high deformation of components, or even their failure, occurs in a short time. This loading condition underlines that for the safe design and realization of high-performance engine parts, it is mandatory to understand the plastic behavior in case of combined high temperature and high strain rate conditions.
Additive manufacturing (AM) technology represents a good alternative for the manufacturing of components made of nickel-based superalloys. When conventional machining methods are employed, processes with high costs, long delivery times, and a high wasting ratio for material can emerge [
3,
4,
5]. Conversely, AM limits these aspects and introduces the important advantages of having the possibility to repair the components or to renovate their geometry. The main disadvantage of the AM technique is represented by the need for a specific heat treatment to improve the poor mechanical properties that characterize the as-deposited (aD) condition. In fact, the resulting microstructure is completely different from that obtained with traditional manufacturing methods.
In this study, the plastic flow behavior of Inconel 718 superalloy produced by laser metal deposition (LMD) is investigated in tension. Different loading conditions were explored in terms of both the strain rate and temperature: the experimental testing campaign covered a wide range of temperatures at a high strain rate, whereas in the quasi-static condition, only tests at room temperature were performed. In addition, the influence of the heat treatment, and consequently, that of the material microstructure, was investigated. The final aim of the present study was to define a strength material model that can correctly predict the material response.
In the scientific literature, many studies have investigated the mechanical response of the as-cast Inconel 718 alloy as a function of several parameters, such as the type of loading (e.g., [
6,
7]), temperature, and strain rate (e.g., [
8,
9,
10,
11]). In some cases, the aim of the studies was the calibration or proposal of a strength model suitable for the prediction of the material response (e.g., [
12,
13]). Conversely, to the authors’ knowledge, only a few studies have been performed on the investigation of the mechanical response for additively manufactured Inconel 718, especially in the case of combined high strain rate and high-temperature tensile loading conditions and for heat-treated materials. Some examples of similar studies are listed below, but none of these works completely cover all the mentioned aspects. In [
14], quasi-static compression tests were performed at high temperatures. In [
15], the quasi-static tensile behavior was investigated between 20 °C and 650 °C. In [
16], the influence of the heat treatment on the quasi-static response was investigated in tension. In [
17], the strain rate sensitivity was evaluated in compression for as-deposited and heat-treated conditions. Finally, in [
18], the combined high strain rate and medium-high temperature conditions were explored in tension on aD materials by varying the printing parameters.
2. Material under Investigation
The material under investigation was produced in the form of bars by LMD technology in the State Key Laboratory of Solidification Processing at Northwestern Polytechnical University (NPU) in China [
19]. Three different heat treatment conditions were examined to estimate their influence on the microstructure and the consequent improvement in the mechanical properties in relation to those obtained in the aD condition, in which no stress-relieving heat treatment was applied after the printing process [
2,
3,
4]. The other two conditions were direct-aged (DA) and aged after homogenization and solution (HT). Both were chosen in relation to their possible applications. The DA condition corresponds to the case in which manufactured parts are obtained to repair components. Here, it consisted of heating the sample at 720 °C for 8 h; then, the sample was cooled to 620 °C and kept at this temperature for another 8 h. The process ended with a fast cooling down of the sample to room temperature. The HT condition refers to the process needed to manufacture a new part, and the heat treatment described for the DA condition was preceded by heating at 1100 °C for 1.5 h, quick cooling at room temperature, and a second cycle of heating at 980 °C for 1.5 h, followed by another quick cooling at room temperature. The investigation of the compression behavior at different strain rates and temperatures was performed in [
19,
20]: The aim of the present work was to extend those studies to cover the tensile regime.
Microstructural Analysis
The microstructure of the samples with and without heat treatments was investigated in [
20], where a detailed report of the obtained results was provided. In the present work, no further microstructural analyses on the raw materials were performed, but the authors summarized the main results obtained in [
20] in this section. These results are of great importance for the comprehension of the experimental findings in this study.
The analysis performed on the aD bars showed that during the LMD process, several aspects affected the microstructure, which was quite complex because of the rapid cooling rate, the high-power input, the lack of mechanical pressure, and the directional heat flux. In addition, it must be considered that the solidified parts are subjected to multiple thermal cycles when the next layers are deposited, which could increase the heterogeneity of the microstructure, redistribute the solutes, and increase the precipitation of phases. The microstructure of the aD samples was characterized by columnar crystals with a length of several millimeters oriented along the printing growth direction, which grow across the deposition layers. In the printing plane, the grains were smaller and more equiaxed because there was no preferential growth direction in the plane orthogonal to the build direction. The dendrite structure was clearly observed. The microstructure contained a small percentage in volume of the strengthening γ’’ particles and was characterized by micro-segregation, anisotropy, and initial defects. The combination of all these aspects could be identified as the reason for the poor mechanical properties in LMD Inconel 718 in the aD condition. The DA heat treatment was not sufficient to completely solute the dendrite structure, preserving the anisotropic microstructure, even if a higher number of strengthening phase precipitates was observed. In specimens after homogenization, solution, and aging, small grains and a great number of strengthening phases were observed.
3. Experimental Procedure
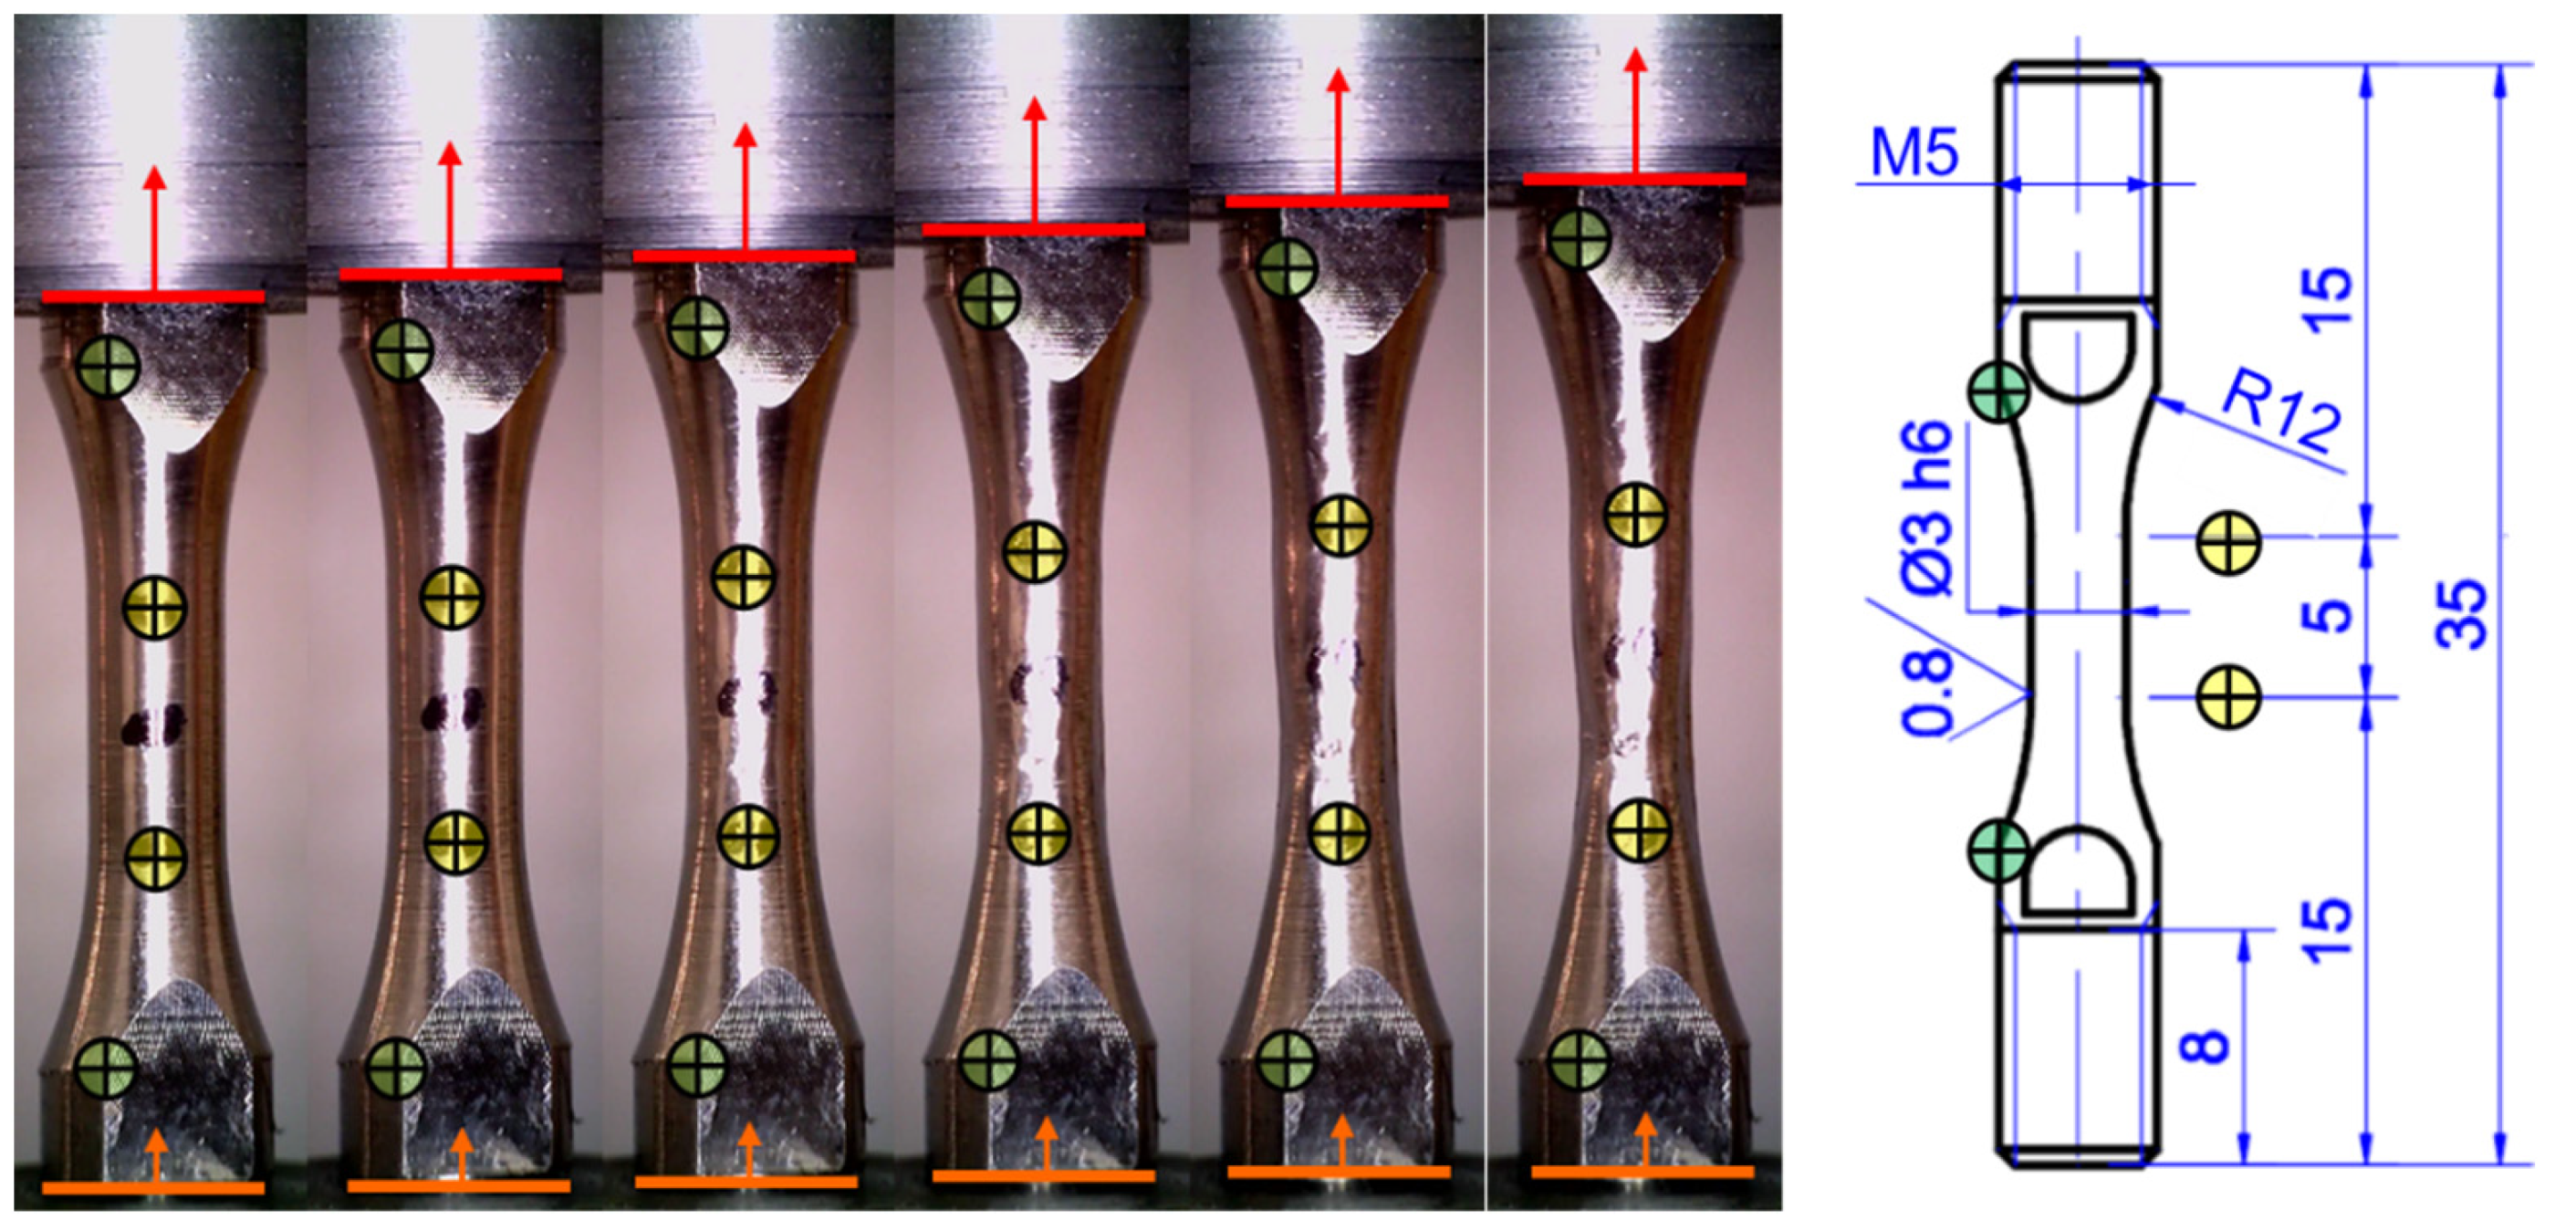
The plastic flow behavior of Inconel 718 was investigated by performing tensile tests on cylindrical dog-bone specimens with a gauge diameter of 3 mm and a gauge length of 5 mm with threaded ends. The dog-bone specimens for the tensile tests were machined from the raw bars with the longitudinal axis (i.e., the loading direction), which was the deposition direction (i.e., the direction of height increase during manufacturing). The same geometry was used both for quasi-static and high strain rate tests to avoid introducing geometrical effects and make possible a direct comparison of the results.
Quasi-static and high strain rate tests were carried out at the DYNLab of Politecnico di Torino in Italy. The nominal strain rates were 0.001 and 1500 s−1, respectively.
The quasi-static tests were performed at room temperature on a standard electromechanical testing machine—a Zwick Z100. The testing speed applied was 0.005 mm/s. The deformation applied to the specimen was evaluated by digitally analyzing the sequence of images recorded using a DINO-LITE digital microscope with a high resolution (2592 × 1944 pixels) at 2 fps. More specifically, the deformation was obtained from the displacement time history of some specific points on the samples (see
Figure 1), where the motion was tracked using the DICe software program [
21].
3.1. High Temperature and High Strain Rate Setup
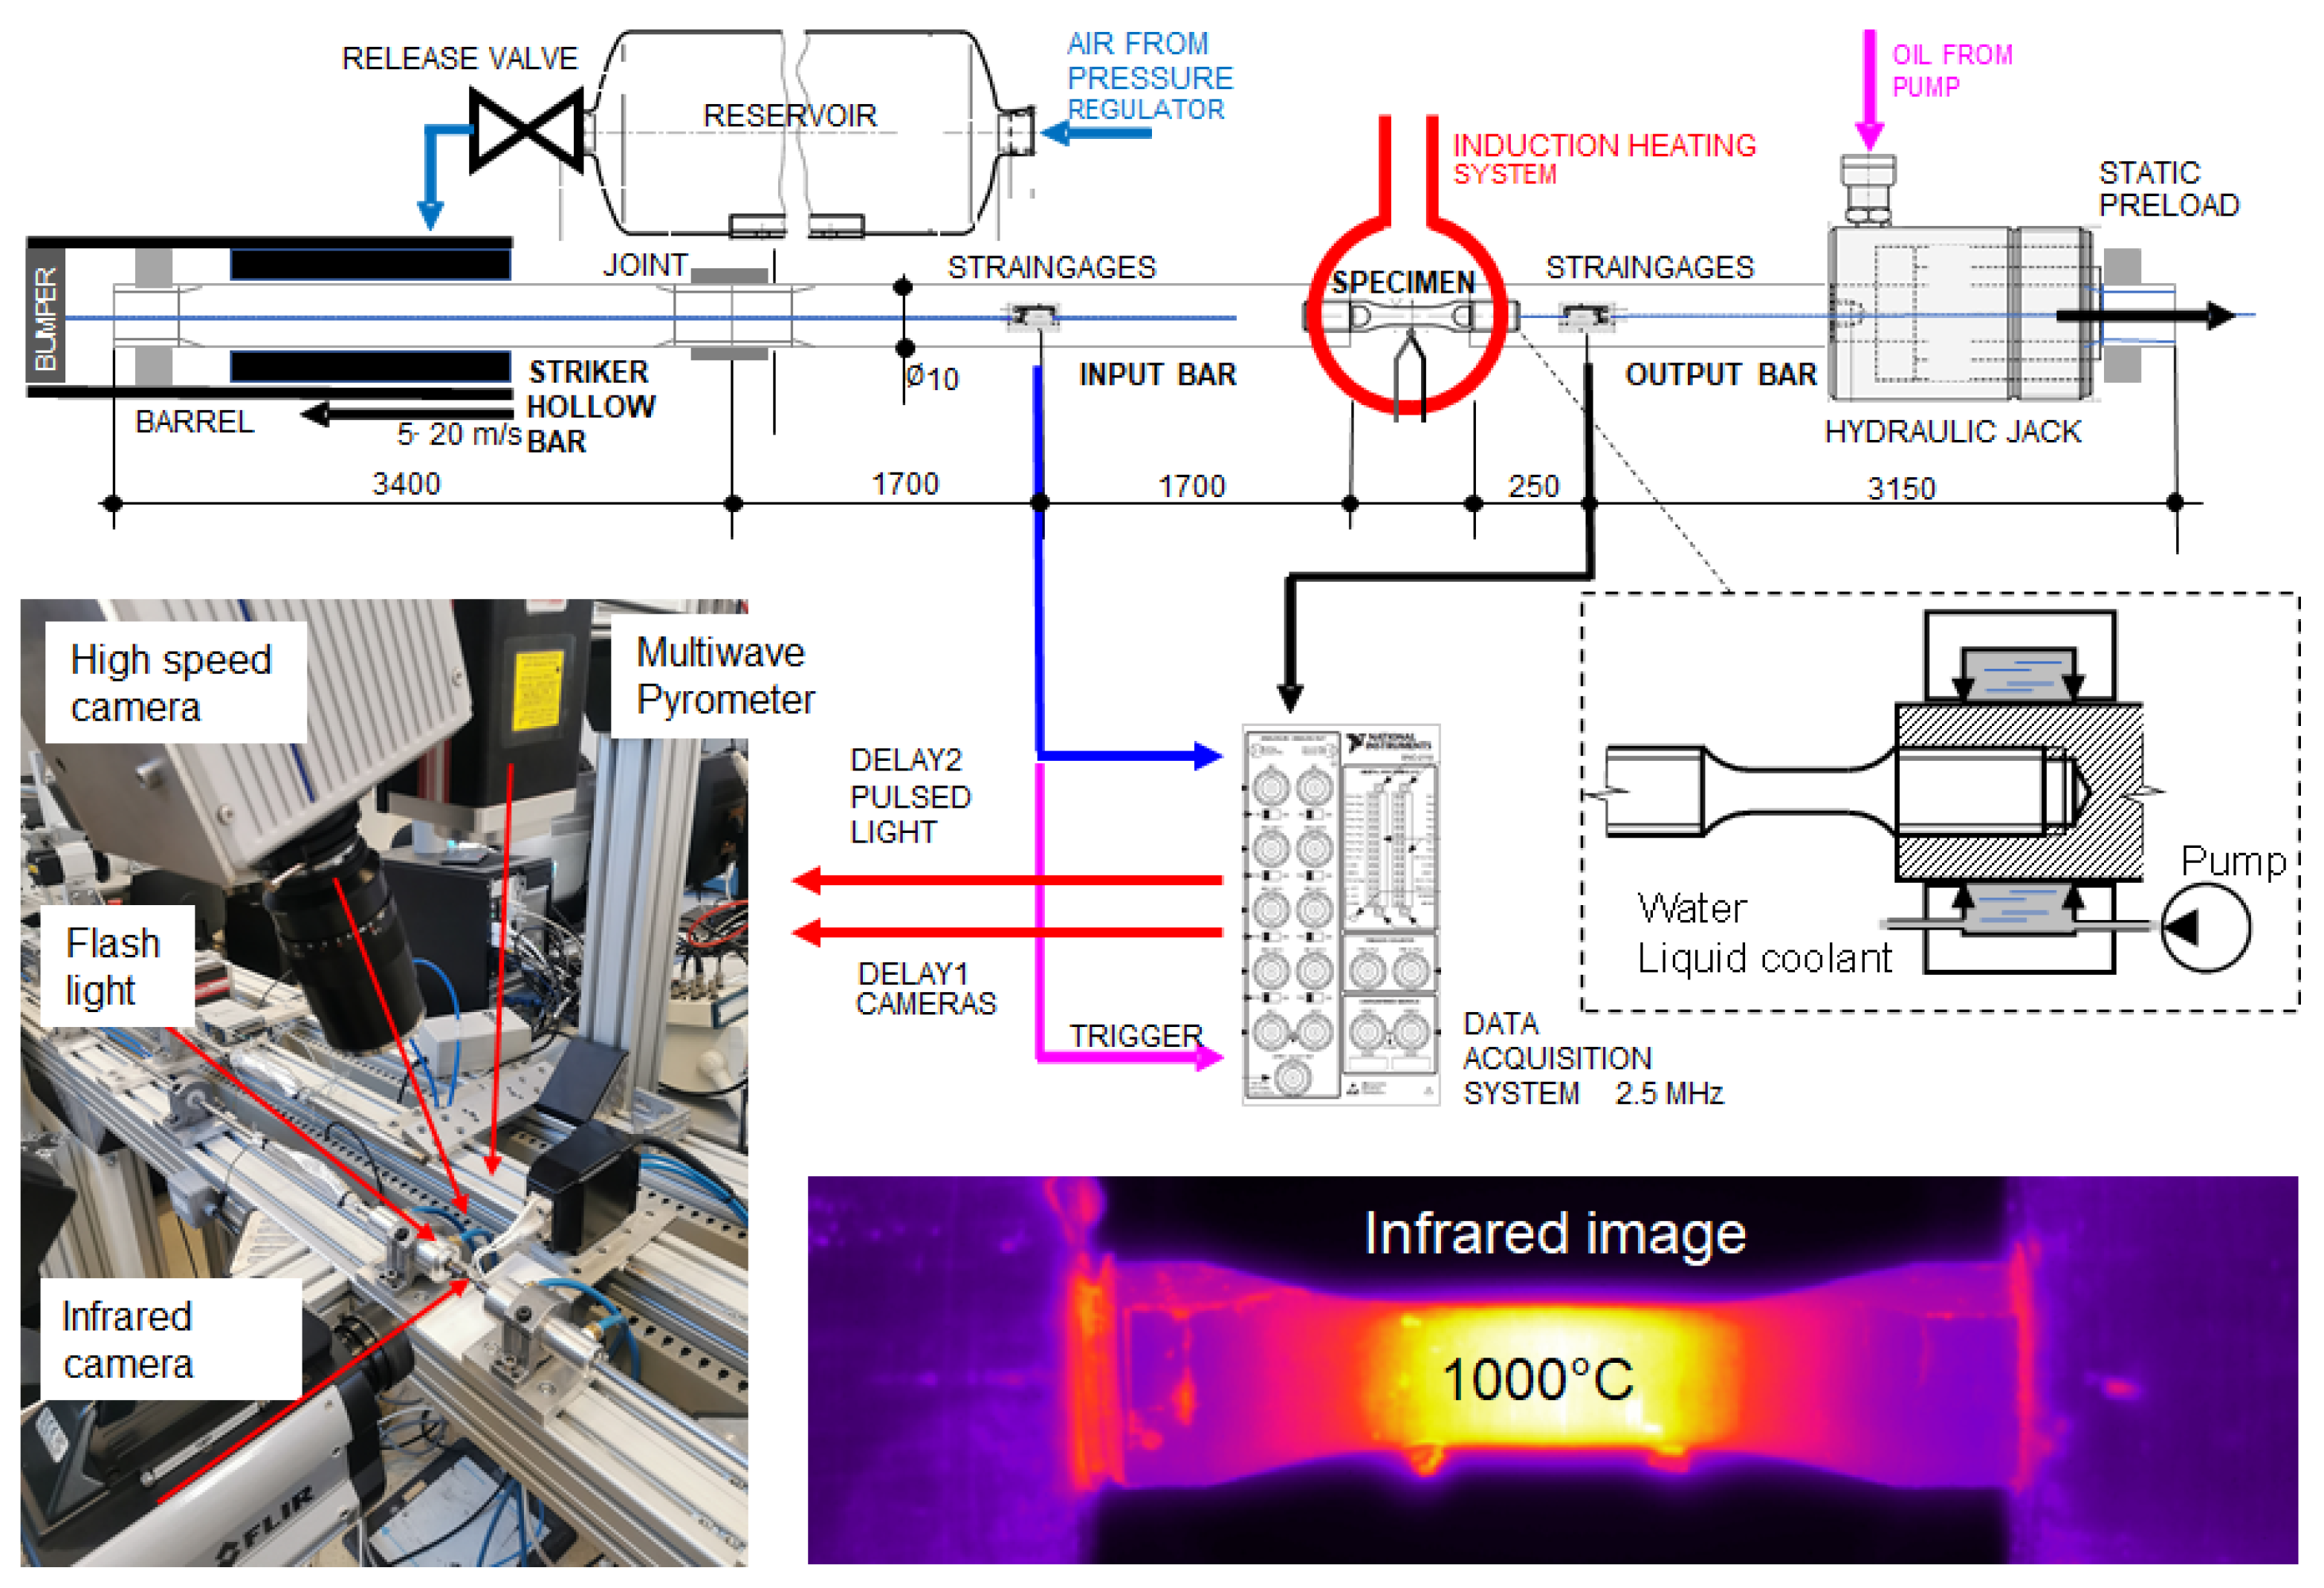
The high strain rate tests were performed on a Hopkinson bar setup in the direct configuration. A scheme of the setup developed at DYNLab is reported in
Figure 2, and the complete description was reported in [
22,
23]. Below, the main characteristics are summarized.
The direct tensile condition was generated by a hollow striker bar, which was launched by compressed air against the anvil placed at one end of the input bar. The incident stress level depends on the pressure of the compressed air, which was adjusted as a function of the testing temperature to maintain as stable a nominal strain rate as possible. For the used configuration, the time duration of the incident wave was about 600 μs. The strain in the bars was recorded by means of semiconductor strain gauges, for which the nonlinear relationship was calibrated. The alignment of the system and the avoidance of internal and initial clearance were guaranteed by imposing a static preload on the entire system with a hydraulic jack. The preload was measured using a piezoelectric cell.
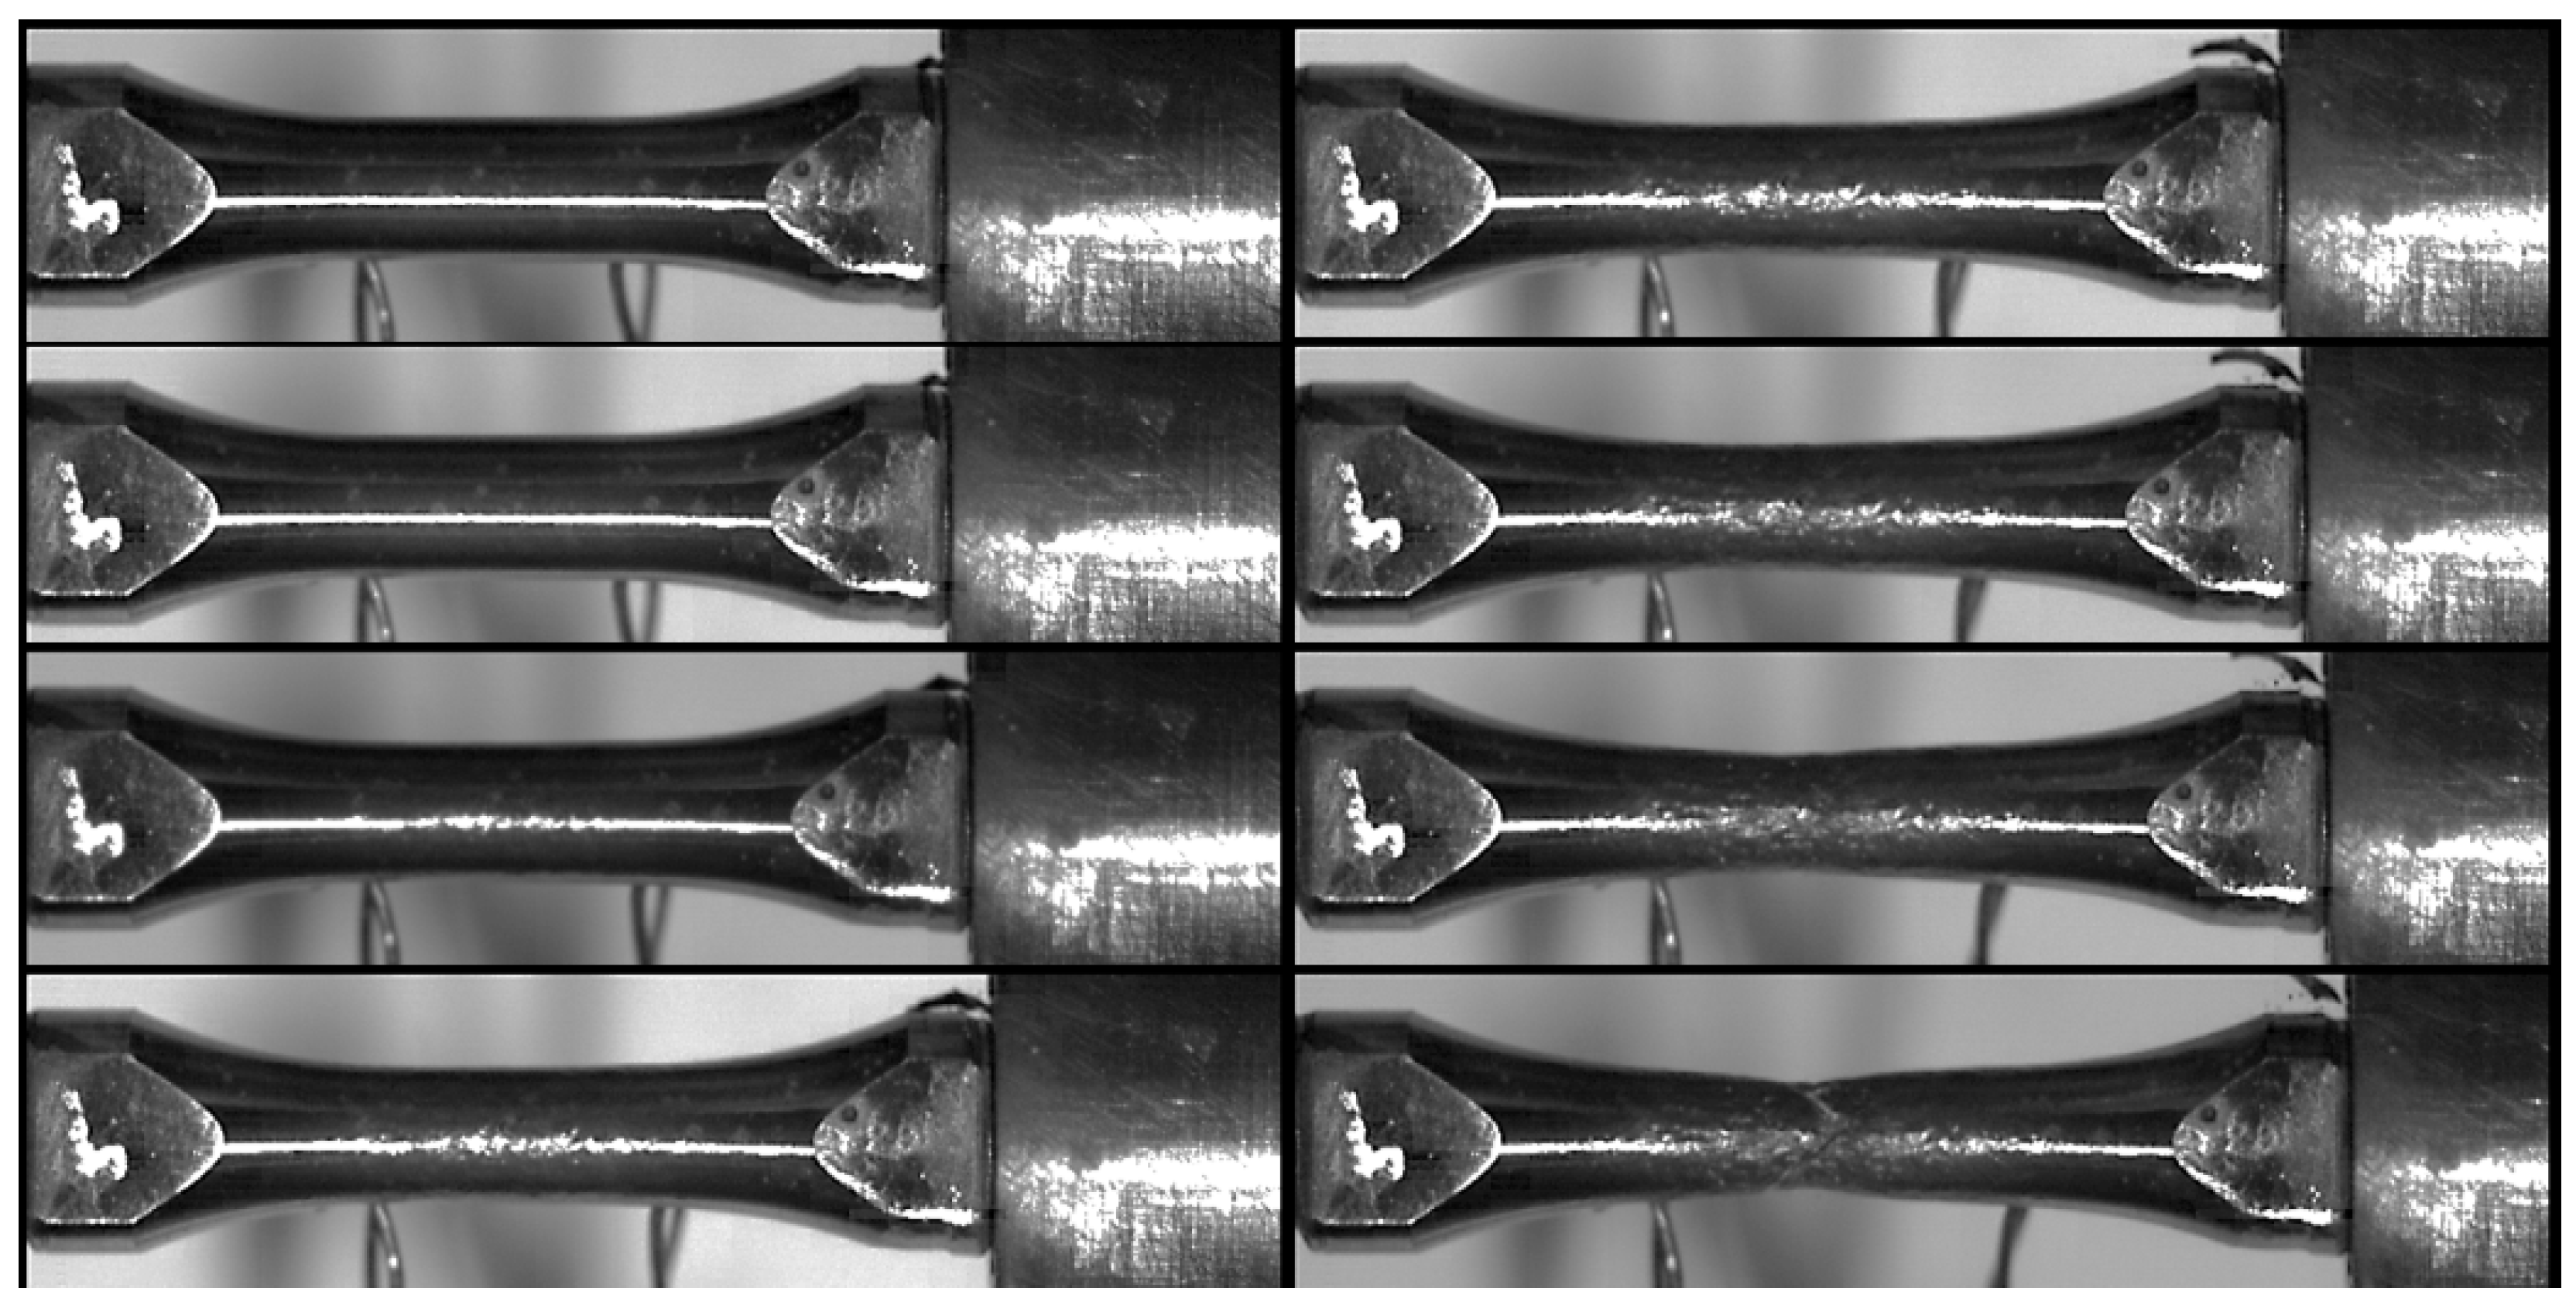
The Hopkinson testing system was coupled with a high-speed camera to record the video of each test and obtain the sequence of images needed to directly measure the deformation on the sample. For the testing campaign, a PHOTRON SA5 high-speed camera was used at 100,000 frames per second and at a resolution of 512 × 128 pixels. The high level of light required was obtained using a pulsed light system able to release sufficiently constant light for about 1 ms, which was longer than the entire test duration. The starting of the camera was imposed by the strain-gauge signal on the input bar, which was used as a trigger. A delay was added for the activation of the lightening system to synchronize the constant level of light with the arrival of the incident wave on the specimen. The sequence of images obtained for a high strain rate test at 850 °C is reported in
Figure 3. The same methodology of analysis previously explained for quasi-static tests was also applied for high strain rate tests. Each high frame rate video was digitally elaborated to obtain information about the kinematic quantities directly from the specimen (more details are given in the next section).
In accordance with the results obtained from compression tests as performed in [
20] on the same materials, the range of temperatures investigated was between room temperature and 1000 °C. The specimens were heated using an induction system (CEIA PowerCube 32/900) with a maximum power of 2 kW, which was scaled depending on the temperature condition to reach in each test. The solenoid was made by an open coil; this solution was adopted to have complete optical access to the specimen. The coil could be moved along the longitudinal direction of the specimens to be centered with the gauge length. To avoid problems of heating up of the experimental setup, water-cooled supports were placed near the bar/specimen interfaces (see
Figure 2). Each specimen was held to the target temperature for 5 min before the test, as performed in [
20]. The tests were performed in atmospheric air because no problems of oxidation were experienced even at very high temperatures for the investigated materials, as clearly visible from the images in
Figure 3. To avoid any electromagnetic disturbance on the strain-gauge signals, the heating system was switched off by a trigger signal (i.e., the strain-gauge signal on the input bar). The time interval between this moment and the test start was about 250 μs, which was not enough to induce a temperature decrease on the specimen.
3.2. Temperature Measurement
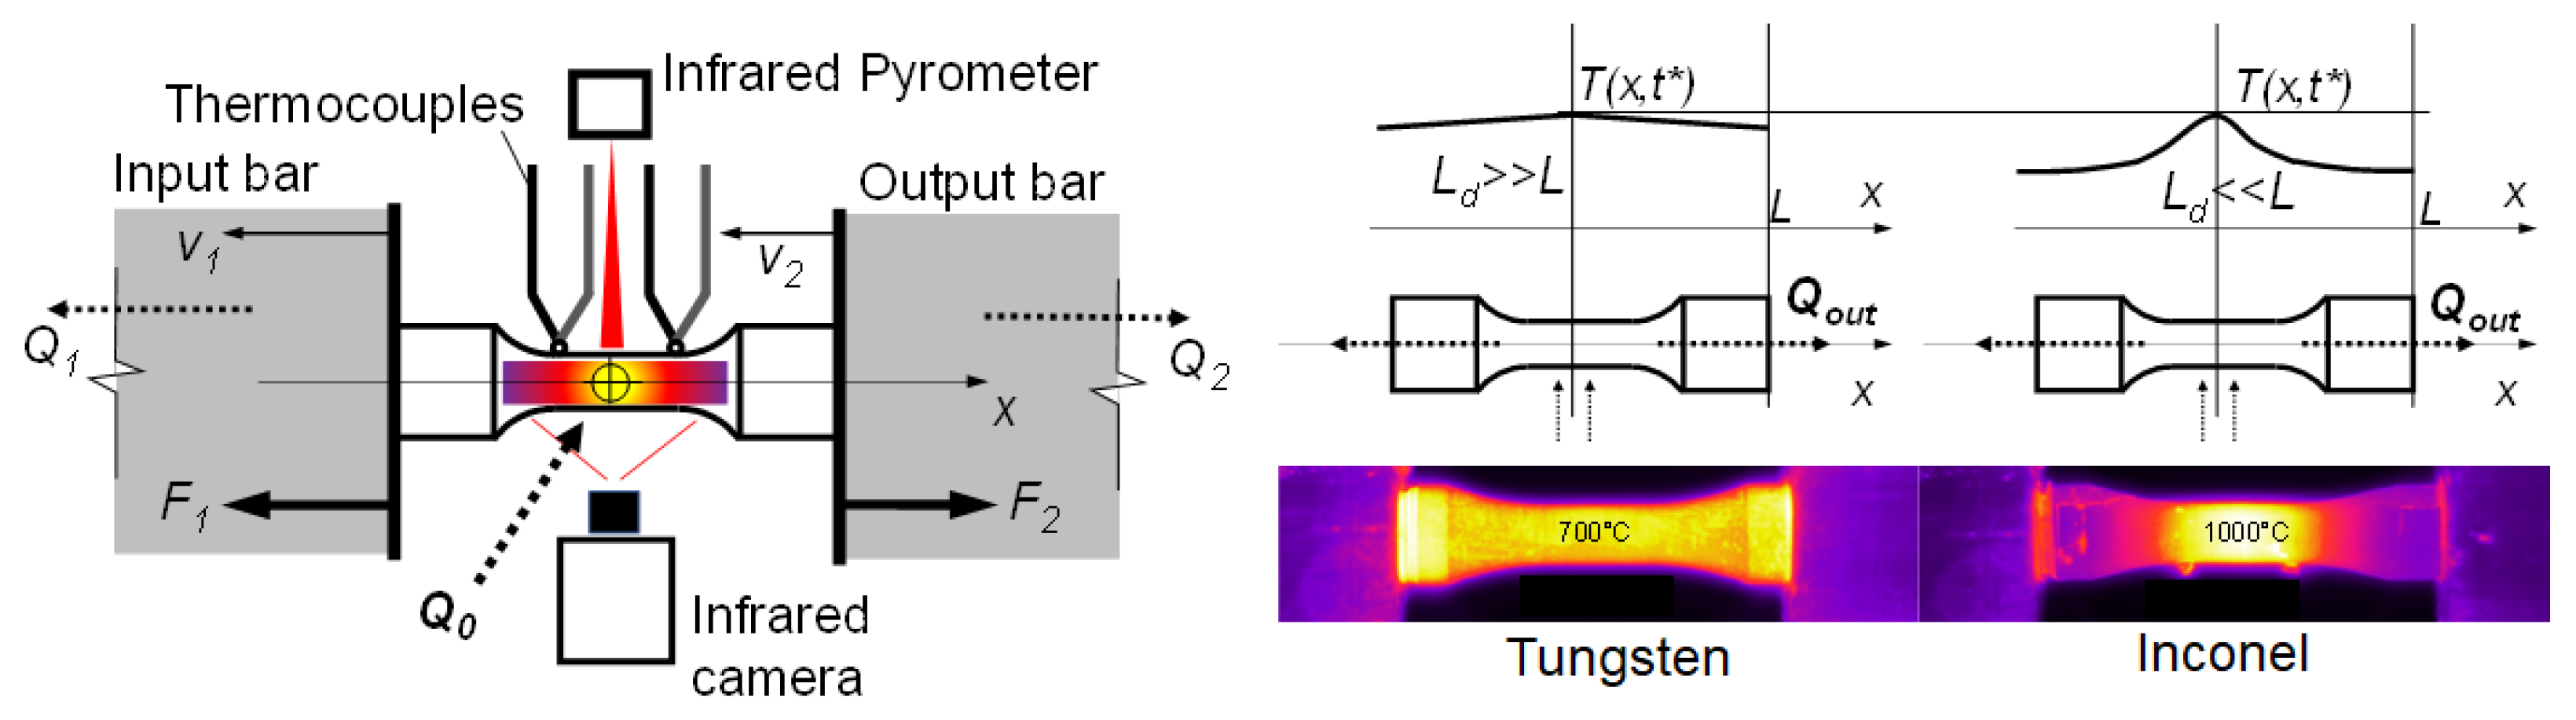
Temperature control was performed using three different measuring systems, as illustrated in
Figure 2. Two K-type thermocouples were directly welded on the specimen surface at the ends of the gauge length. Their signals were acquired by the National Instruments data acquisition system NI cRIO-9211. Multi-wave infrared pyrometers were used to measure the maximum temperature in the gauge length. Depending on the testing temperature, a specific pyrometer was adopted: the Williamson Pro MW-20-5-C was used for tests with temperature in the range of 150–475 °C, and the Williamson Pro MW-10-20-C was used for tests with temperature in the range of 475–1750 °C. The third measuring system was the FLIR X6900SC high-speed infrared camera. As extensively discussed in [
24], each instrument has advantages and disadvantages. For this reason, the adopted solution was the simultaneous use of all of them. This guaranteed the redundancy of the measurements. In addition, it allowed for the possibility of checking the consistency between the performed measurements.
The problems related to thermocouples regard the reliability of the measurement: it depends on the quality of the welding and can be affected by the electromagnetic field generated by the heating system. The other important aspect to be considered is that the measurement is local. Hence, in the used configuration, the thermocouples measured the temperature at the ends of the gauge length. Finally, they are slow and consequently not suitable to appreciate the temperature increment that is due to adiabatic self-heating occurring during a dynamic test.
The measurement performed with the infrared camera requires setting the emissivity of the material. This property needs to be calibrated. In this study, a high-speed infrared camera was adopted, which can also be suitable to obtain information on the adiabatic heating during the tests. To perform this, proper calibration is needed because the emissivity varies with the temperature; hence, it could change during a dynamic test. Another important advantage of this measuring system is that it outputs the spatial distribution of the temperature over the focused area. This information can be used to check the uniformity of heating along the specimen.
The multi-wave infrared pyrometer can provide temperature measurement without knowing the emissivity of the material. The problem, in this case, was that the spot over which the temperature was measured was bigger than the specimen dimensions. This implied that the signal strength had to be adjusted to perform the measurement, but this procedure reduced the range of measurable temperatures. In the used configuration, the pyrometers gave the maximum value of temperature measured over the spot as output; hence, it was a local measurement.
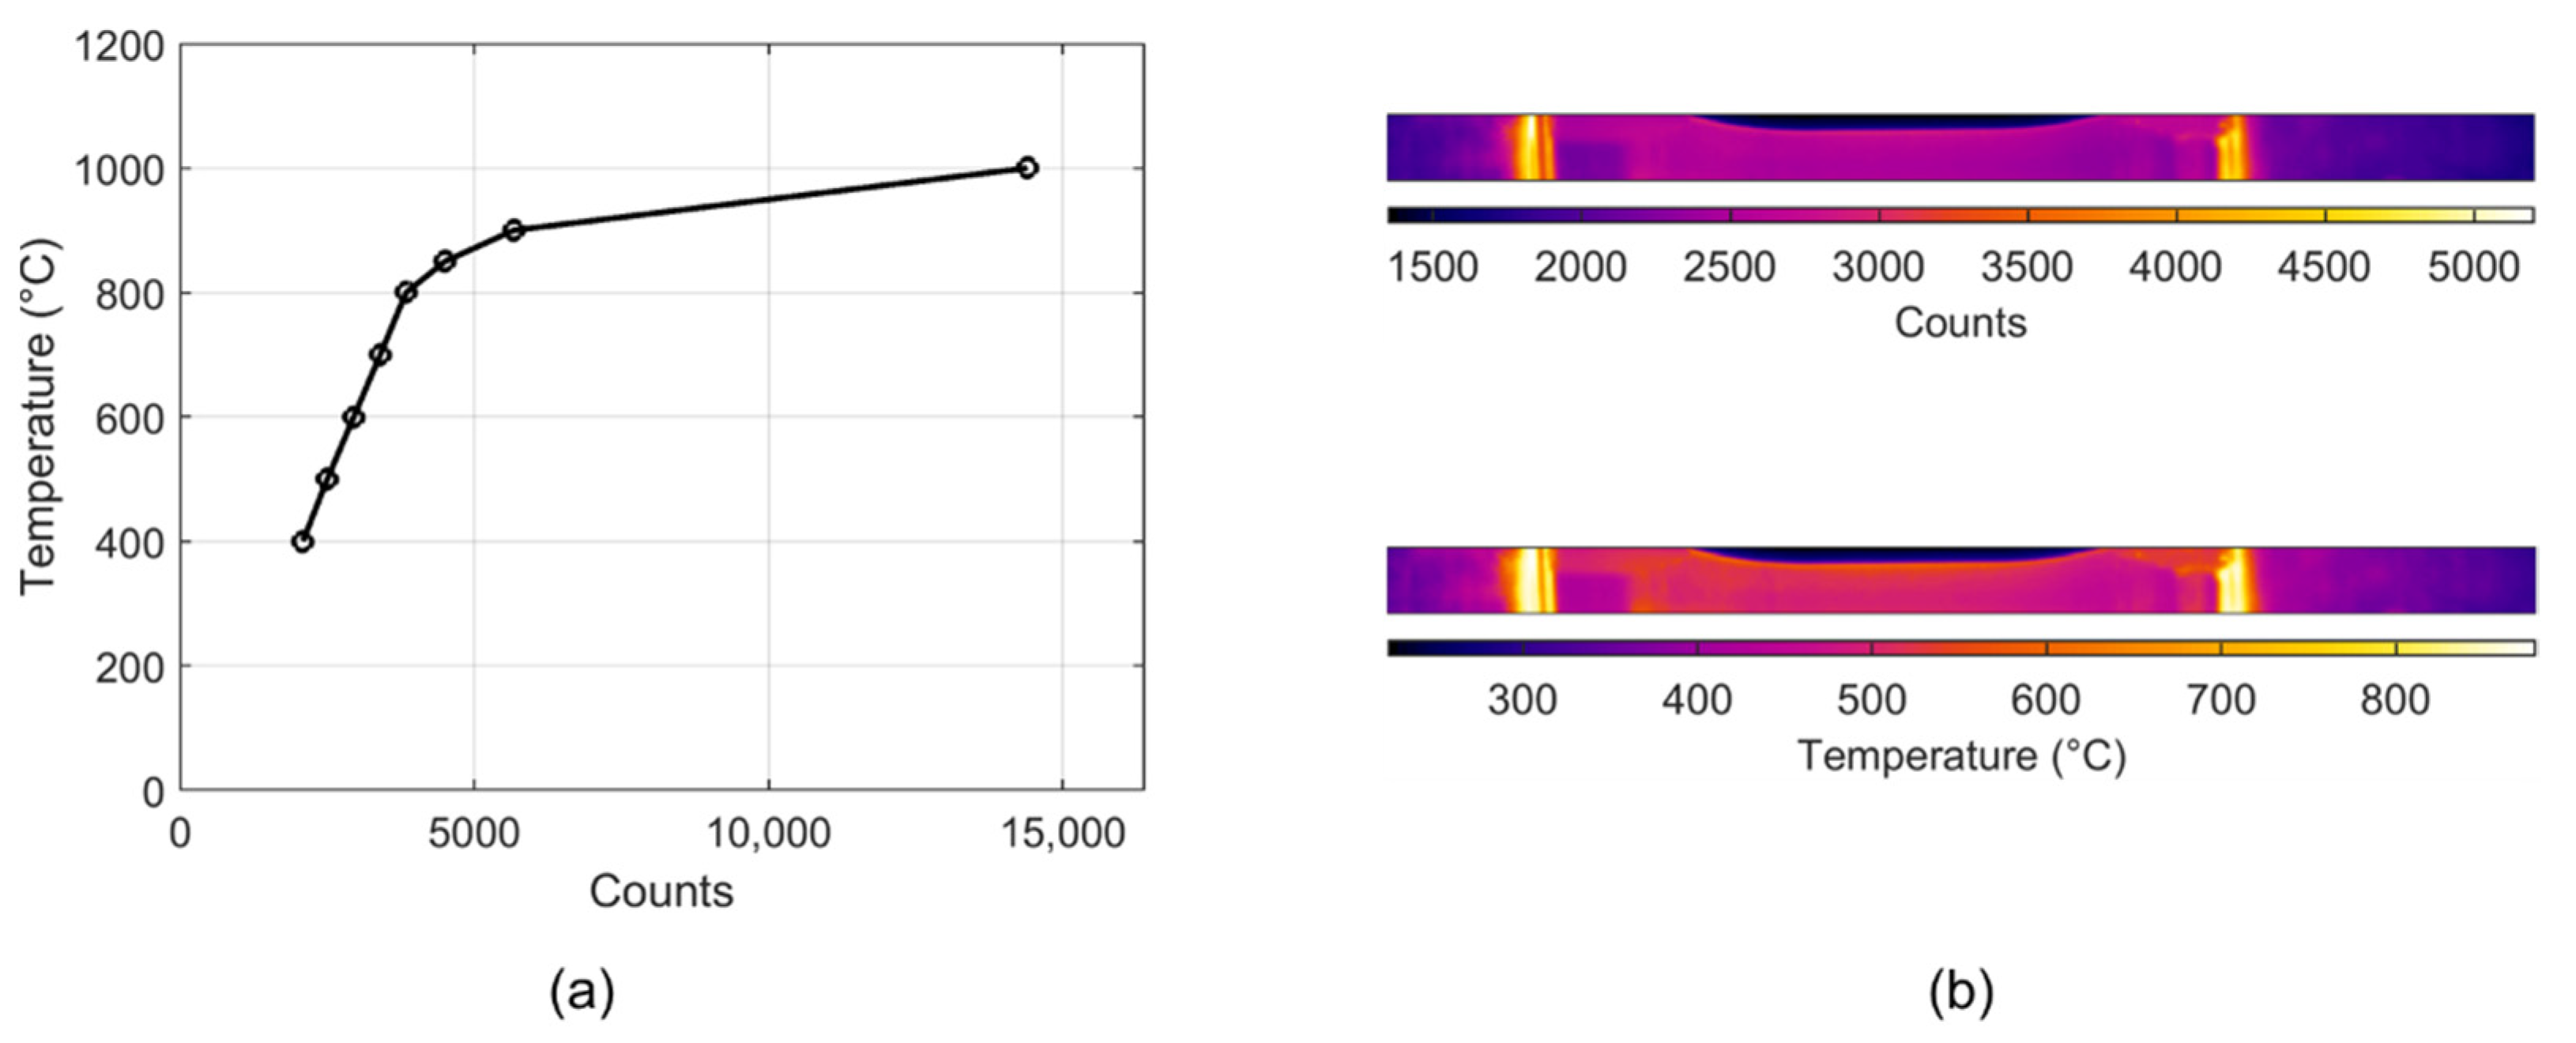
In
Figure 4, the calibration of the infrared camera is reported. The temperature values measured by the two thermocouples and the pyrometer were averaged and used to calibrate the raw data obtained by the infrared camera. The raw data were expressed in counts that measure the collected energy on each pixel of the detector during the integration time: the more infrared energy incident on the detector, the higher the digital count, which was between 0 and 16,383. The process to obtain the temperature map should imply the conversion of the count values into radiance values, and then, if the camera is properly calibrated, the conversion into temperature values using the known or measured emissivity of the target object. Because of the problems related to emissivity, as previously discussed, the thermocouples and pyrometer data were used to directly convert the counts into a temperature. This operation was performed for the entire range of temperatures of interest for the testing campaign. In
Figure 4, the calibration procedure was applied to the thermal image obtained for a specimen tested at 500 °C. An aspect to be underlined, which is clearly visible in any thermal image, was the error in temperature evaluation at the interfaces between the bars and the specimen. The apparent high temperature measured was due to the cavity effect, nevertheless, the real surface temperature was lower.
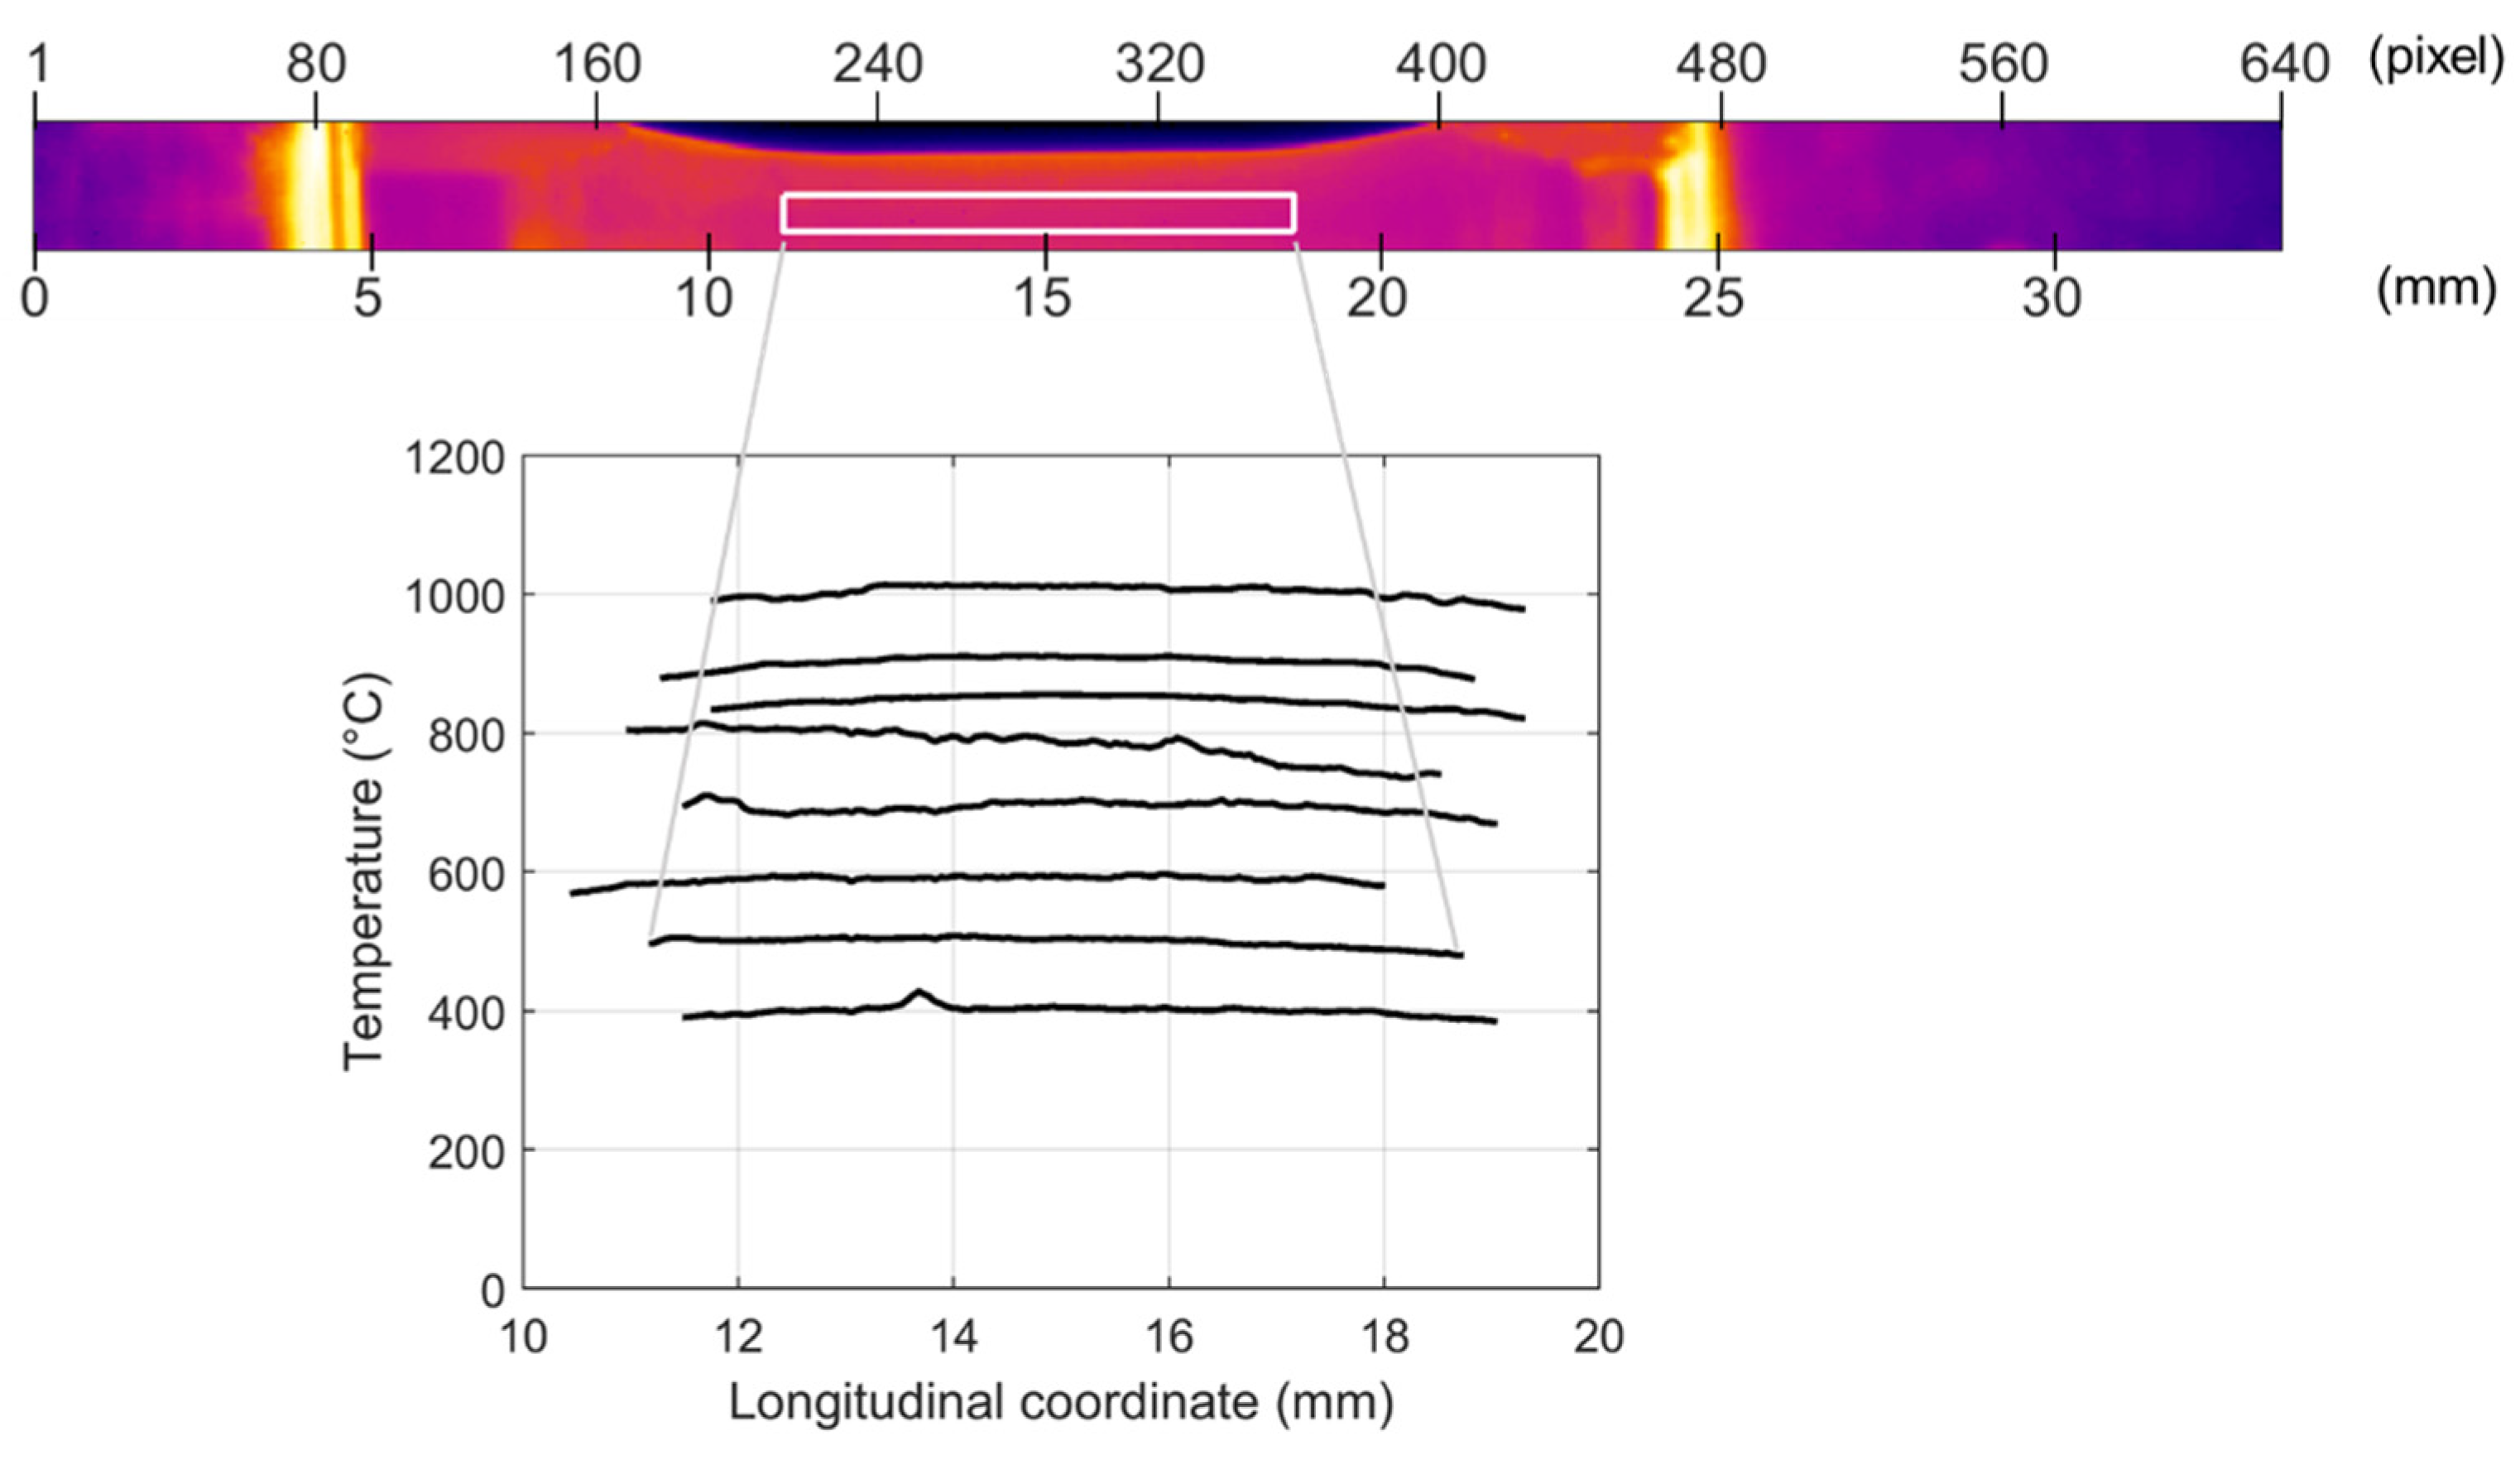
The uniformity of the heating was checked by analyzing the temperature distribution along the specimen length. This operation was performed just before the start of the test (i.e., on the undeformed condition), and it was repeated for each loading condition varying the temperature. In
Figure 5, the undeformed thermal image of a test performed at 500 °C (on the HT specimen) is reported. The image had a resolution of 640 × 36 pixels. A portion of the image indicated by the white box, including the gauge length, was considered. The dimension of the box was maintained constant for all the tests, but its position was adapted for each test because it depended on the specimen position with respect to the infrared camera (given the experimental setup, the position of the samples in relation to the infrared camera could vary by about ±0.5 mm). Once the box was defined at each longitudinal coordinate, the average value of the temperature was evaluated and reported in the diagram. By analyzing the curves reported in the diagram, it was possible to conclude that the initial temperature was constant in all the performed tests. The same procedure was performed for the DA specimens.
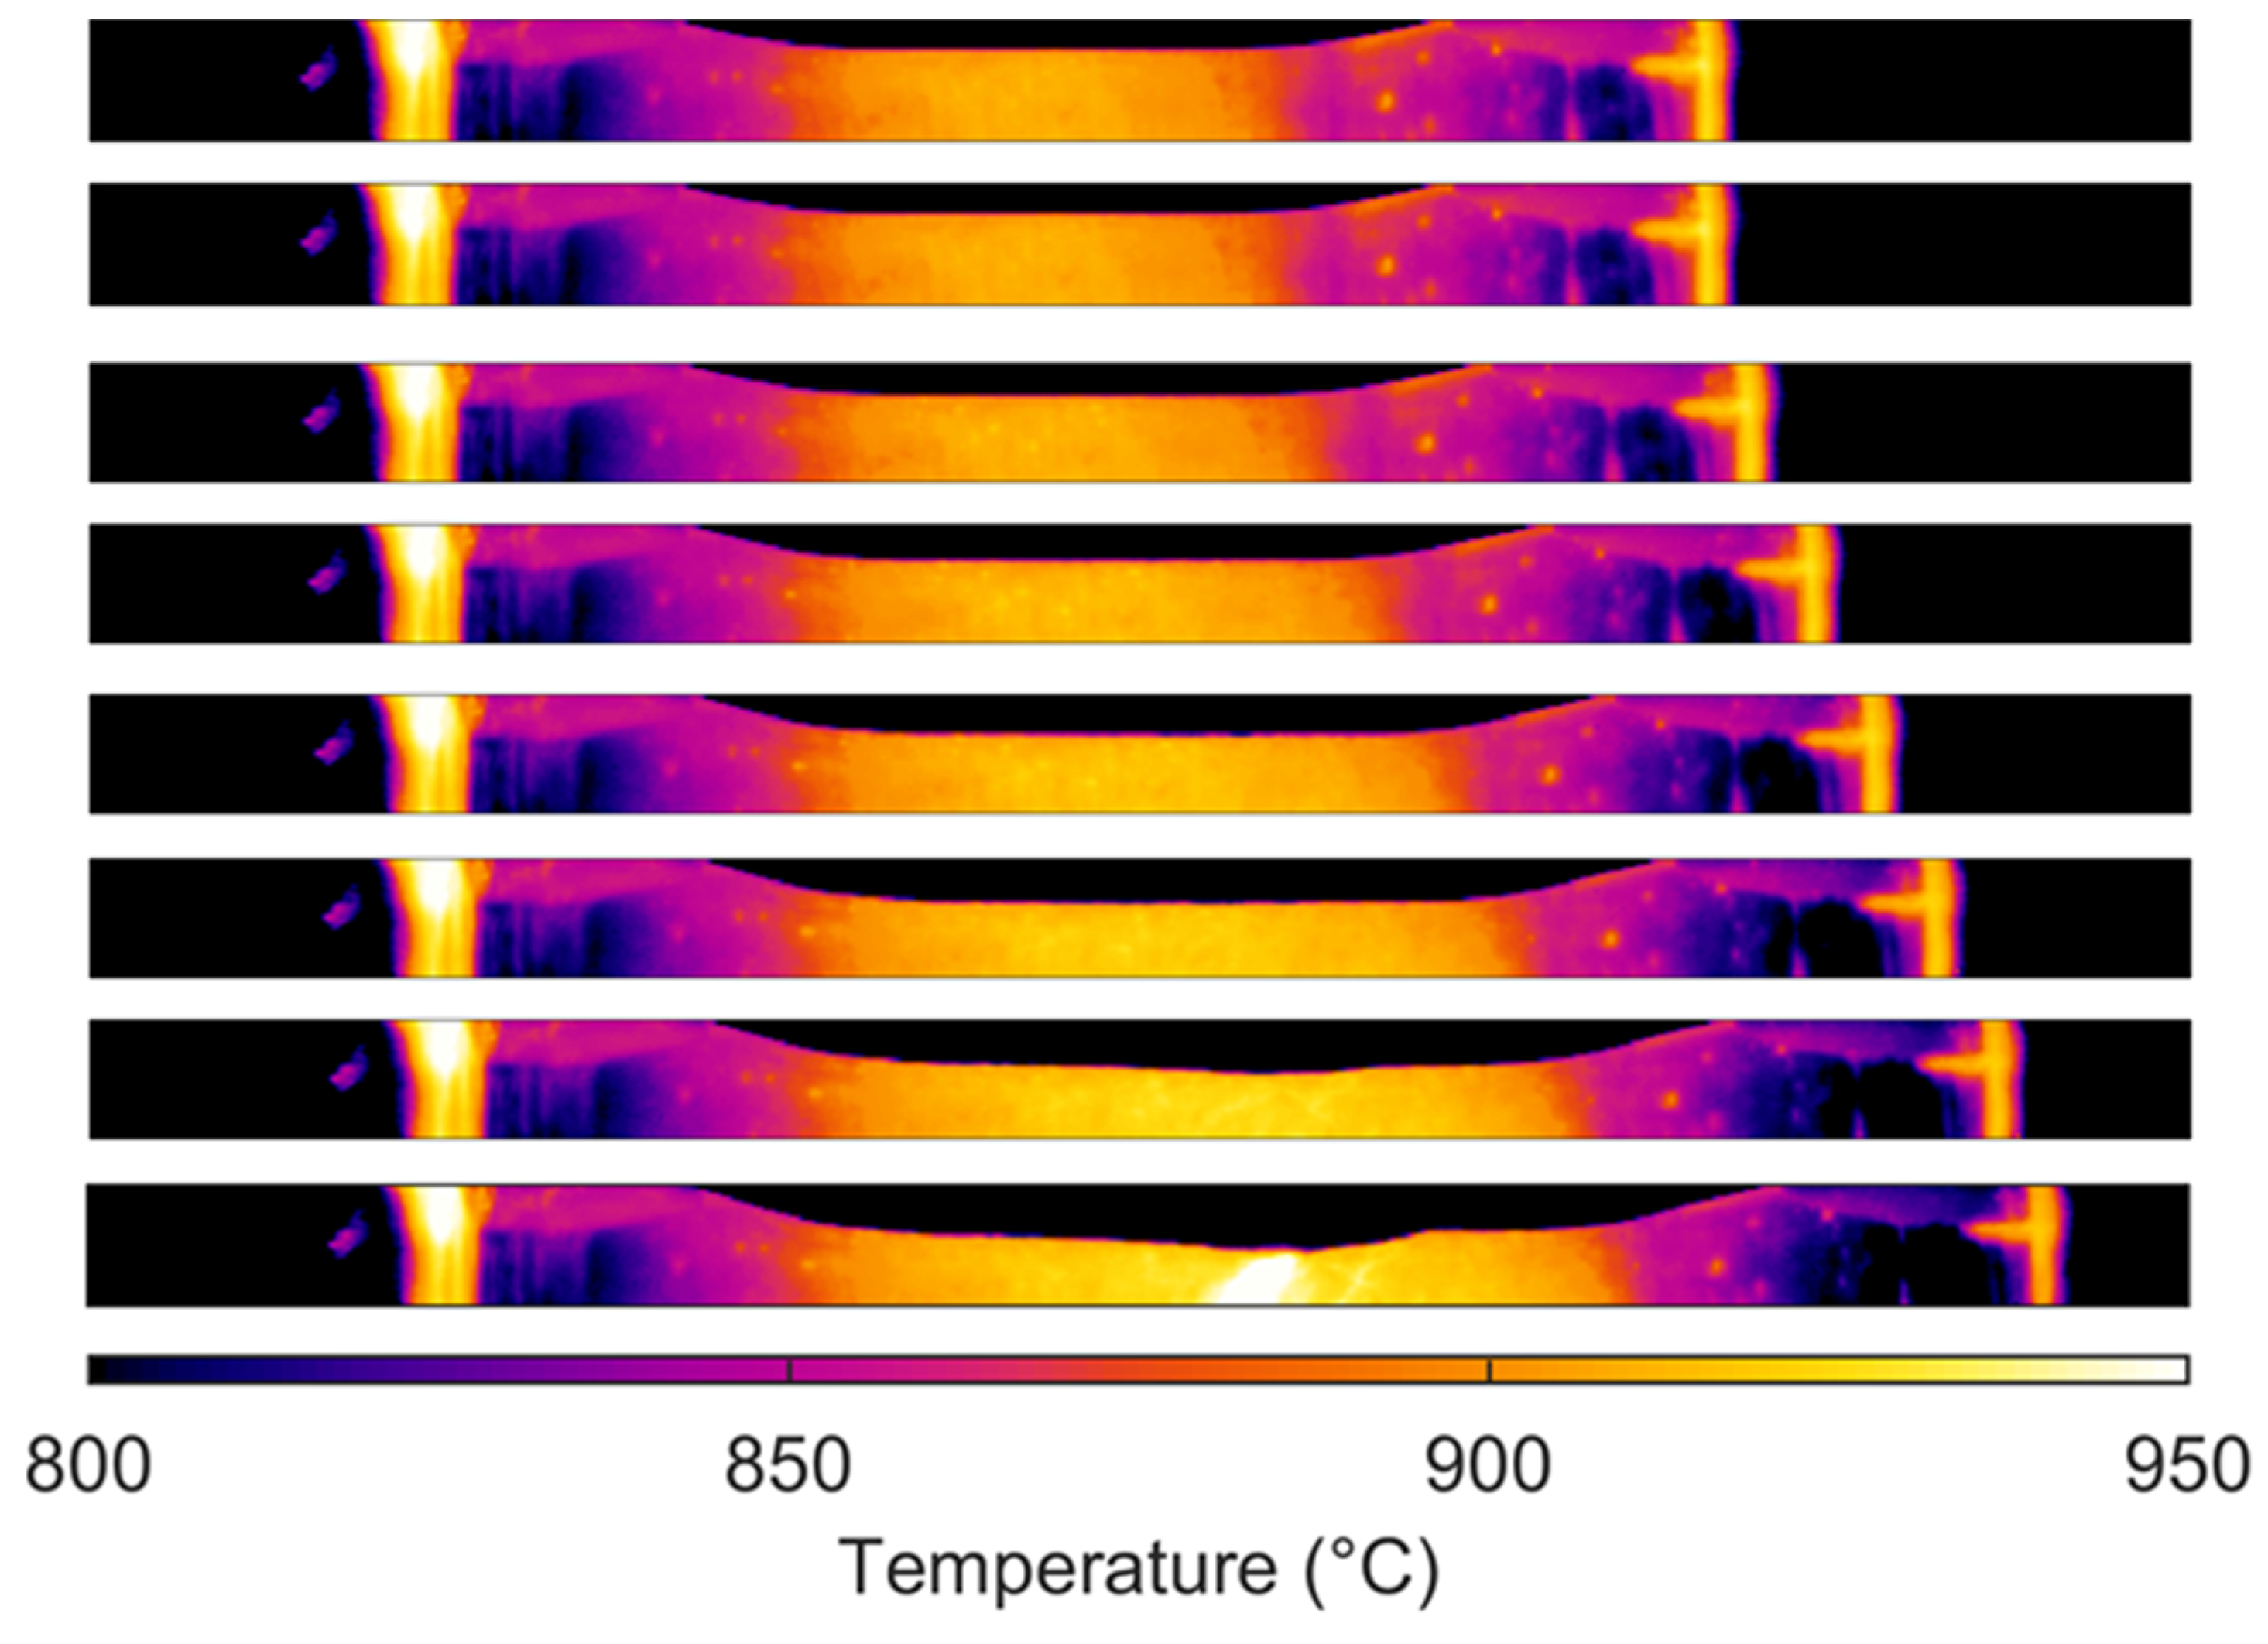
The analysis of uniformity was limited to a portion of the specimen slightly longer than the gauge length of the specimen because of the thermal diffusivity. When the characteristic width is much shorter than the characteristic system size, the temperature can differ drastically from one part of a sample to another. Gradients can be very large, and temperature is highly time-dependent. A large increase in temperature localized in one region of the sample will not be able to induce the same temperature increment in far regions if the time is short enough to maintain the diffusion length to be small. The thermal inertia of the specimen depends on the thermal diffusivity: in a material with high thermal diffusivity, the heat moves rapidly through it because the material conducts the heat quickly relative to its volumetric heat capacity or “thermal bulk.” This means that in such a material, the uniform condition is easy to reach, but the maximum achievable temperature is low for a fixed heating power. The opposite happens in the case of materials with low thermal diffusivity. The thermal diffusivity of Inconel is low, which corresponds to a short characteristic width. This concept is summarized in
Figure 6, in which the heat distribution obtained in a test performed at 1000 °C on Inconel 718 was compared with that obtained during a test performed at 700 °C on pure tungsten, which has a higher thermal diffusivity (for the same heating power). In the same figure, a scheme of the heating process and of the positioning of the temperature measuring systems is also reported.
4. Experimental Results and Data Analysis
As mentioned above, the engineering strain was evaluated starting from the displacement time history profile obtained from the digital image analysis of the recorded videos. For each loading condition, the kinematic quantities (e.g., displacements and velocities at the two sides of the specimen) were compared with those obtained from the standard signal processing for the Hopkinson setup. For the latter, an algorithm for the correction of the wave dispersion was applied, and the wave signals were properly synchronized based on the strain-gauge positions along the bars. No further operation was needed: thanks to the water-cooled supports, the heated portions of the bars were very small, and no effects were induced on the wave propagation [
24]. The comparison is reported in
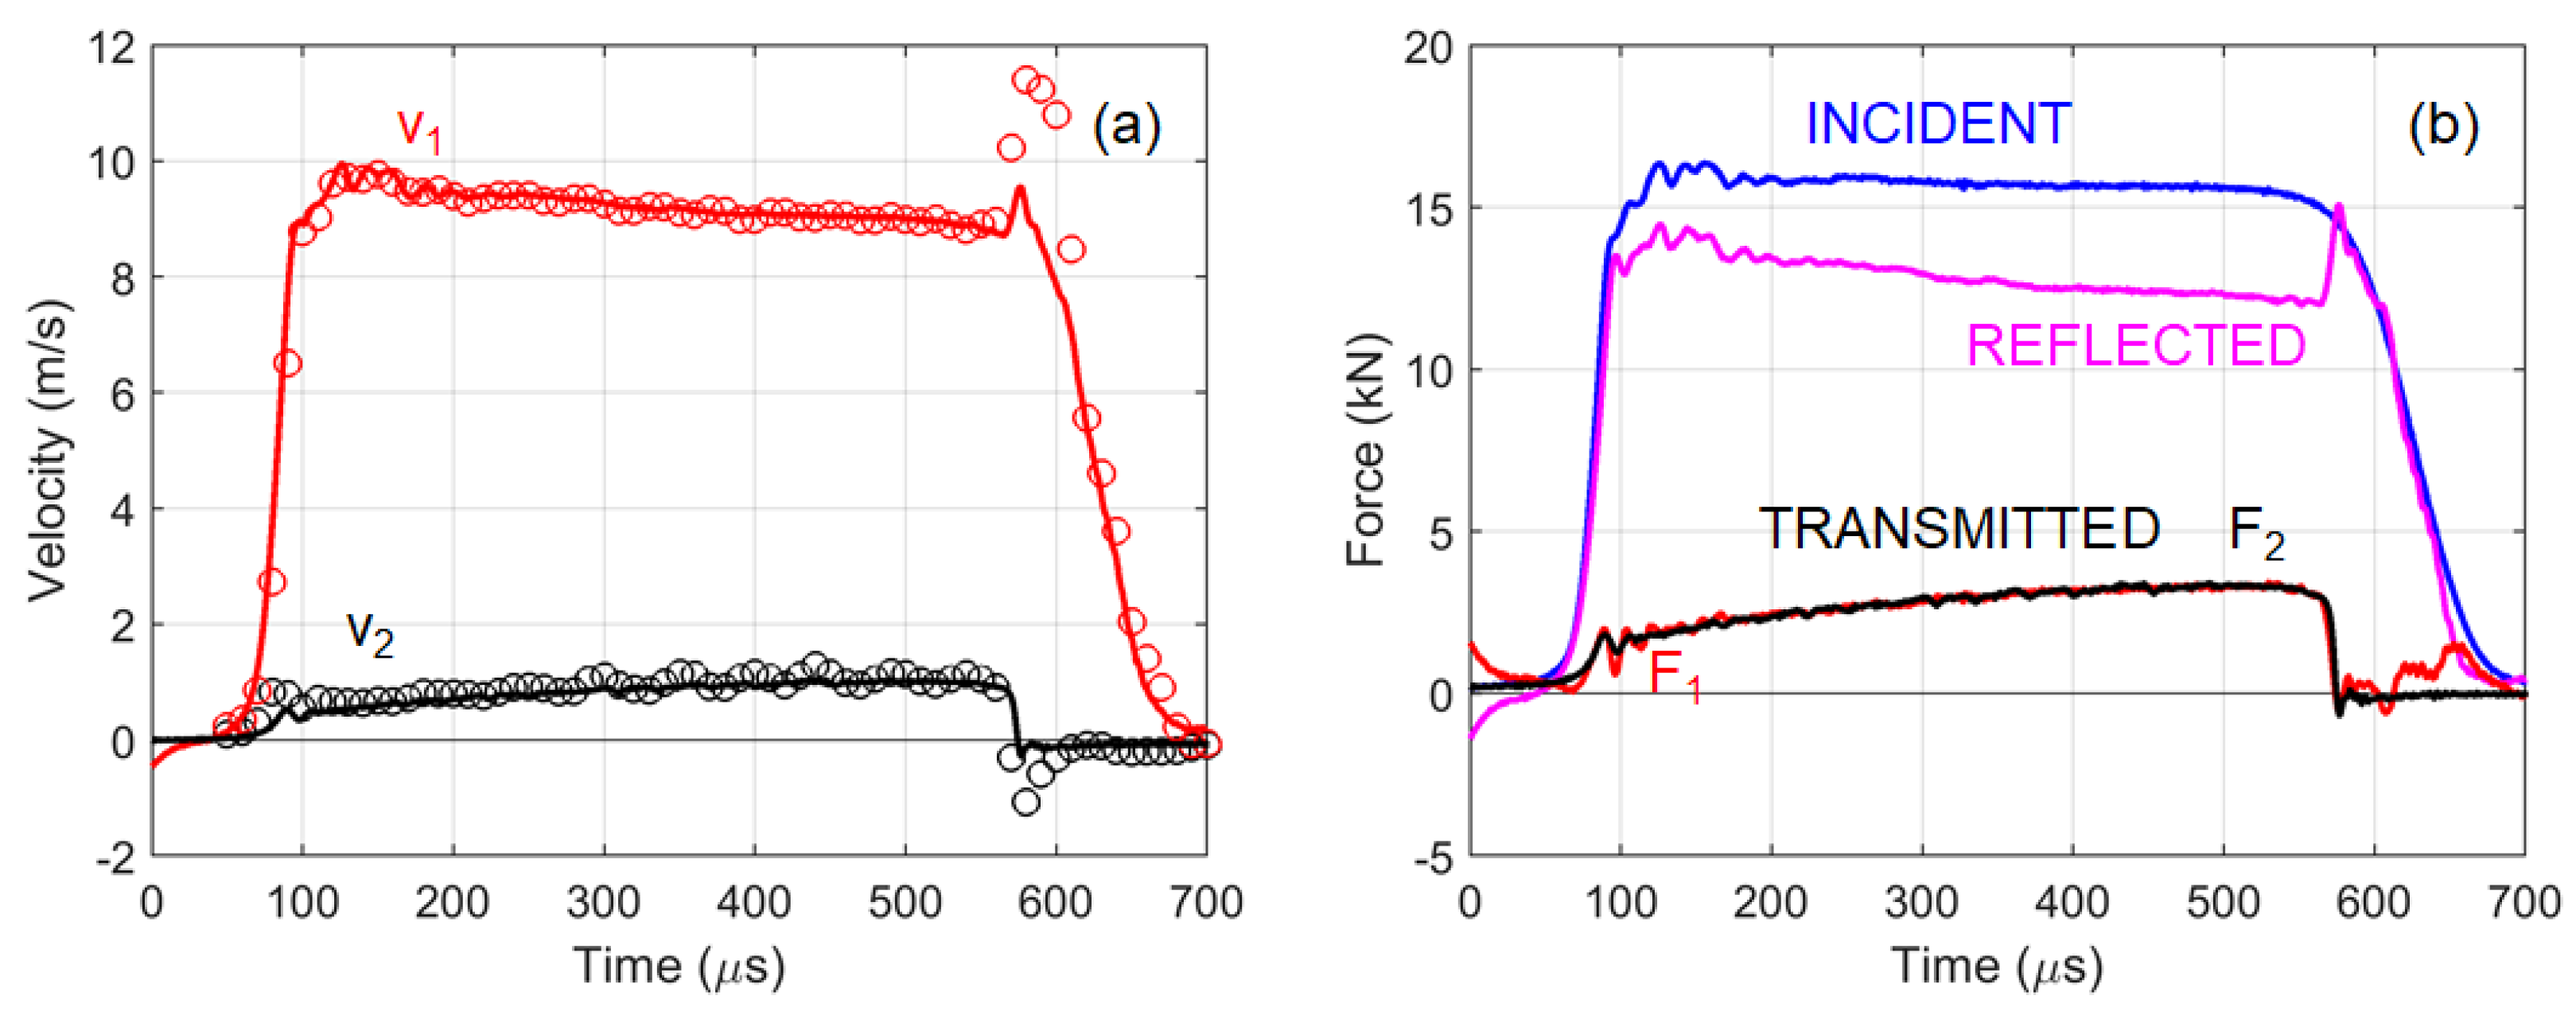
Figure 7a in terms of velocity profiles at the two sides of the specimen obtained for a high strain rate test performed at 1000 °C. The curve indicated with v
1 is the velocity measured on the input side, whereas the curve indicated with v
2 is the velocity measured on the output side of the specimen. The solid lines represent the measurements performed starting from the strain-gauge signals, while the markers represent the measurements performed starting from the video analysis. Of course, the time resolution of the video was lower: the interval between the images was 10 μs (100,000 fps), whereas the strain-gauge signals were acquired at 2.5 MHz. In any case, it was possible to conclude that the time resolution of the video was sufficient to well appreciate the quantities’ evolution. The evaluation of the kinematic quantities from videos has the advantage of not being affected by problems related to wave dispersion and of not requiring corrections in case bar heating modifies wave propagation. The velocity profiles obtained with the two methodologies differed considerably only in the phase in which the specimen breaks: the springback of the material produces a fast movement of the two portions of the sample in the direction of the bars with a consequent oscillation phase.
Figure 7b shows the check of the equilibrium condition for the same test. This operation was performed for all the tests by comparing the forces on the input (referred to as F
1) and output (referred to as F
2) sides of the specimen. In this case, the force signals were evaluated with standard wave equations [
25]. A further consideration was about the high quality of the signals: the curves reported in the diagrams were not filtered, and the noise to signal ratio was very low.
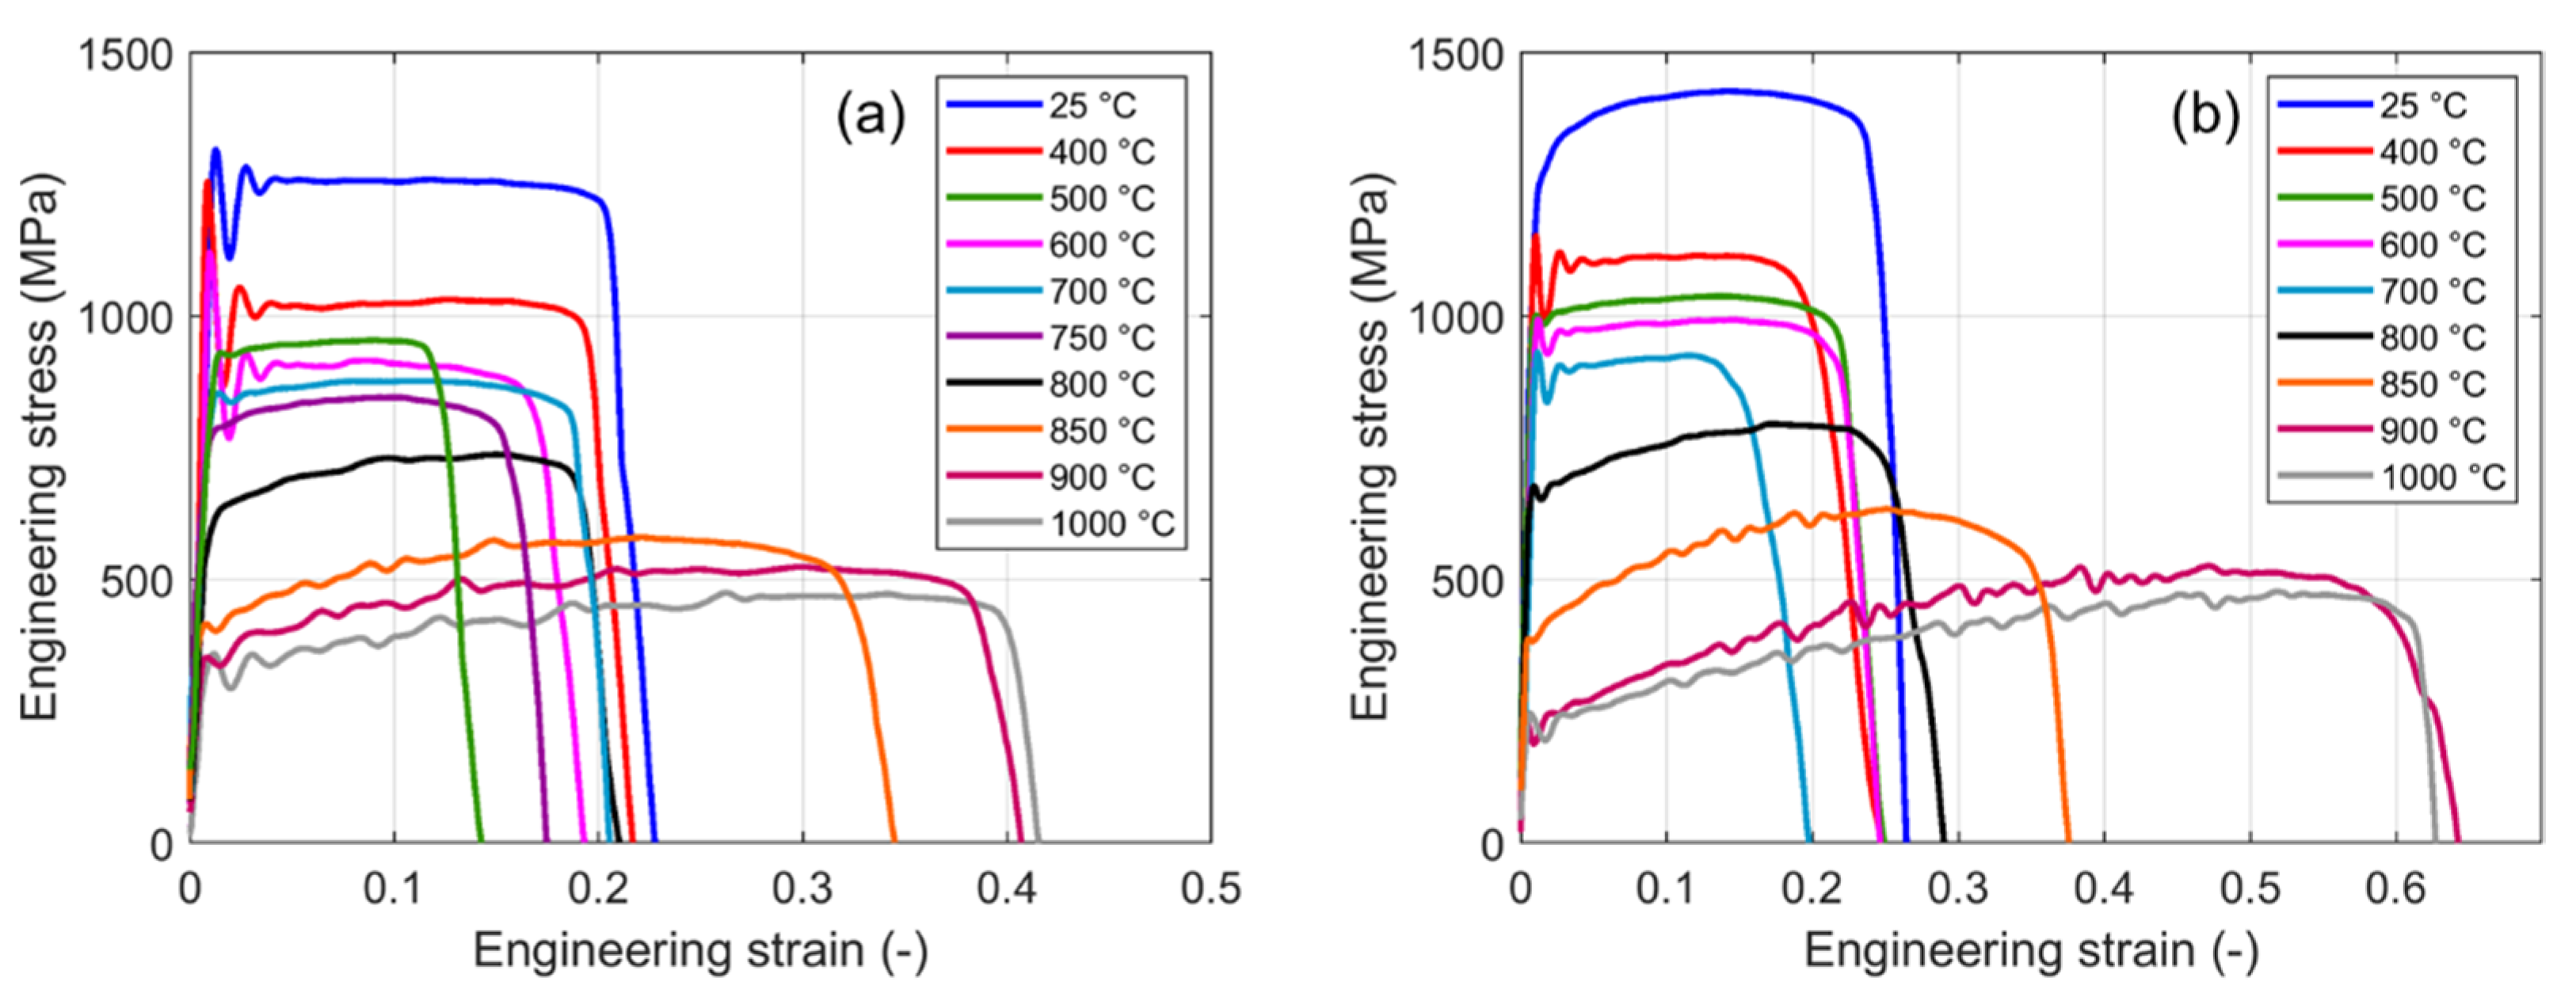
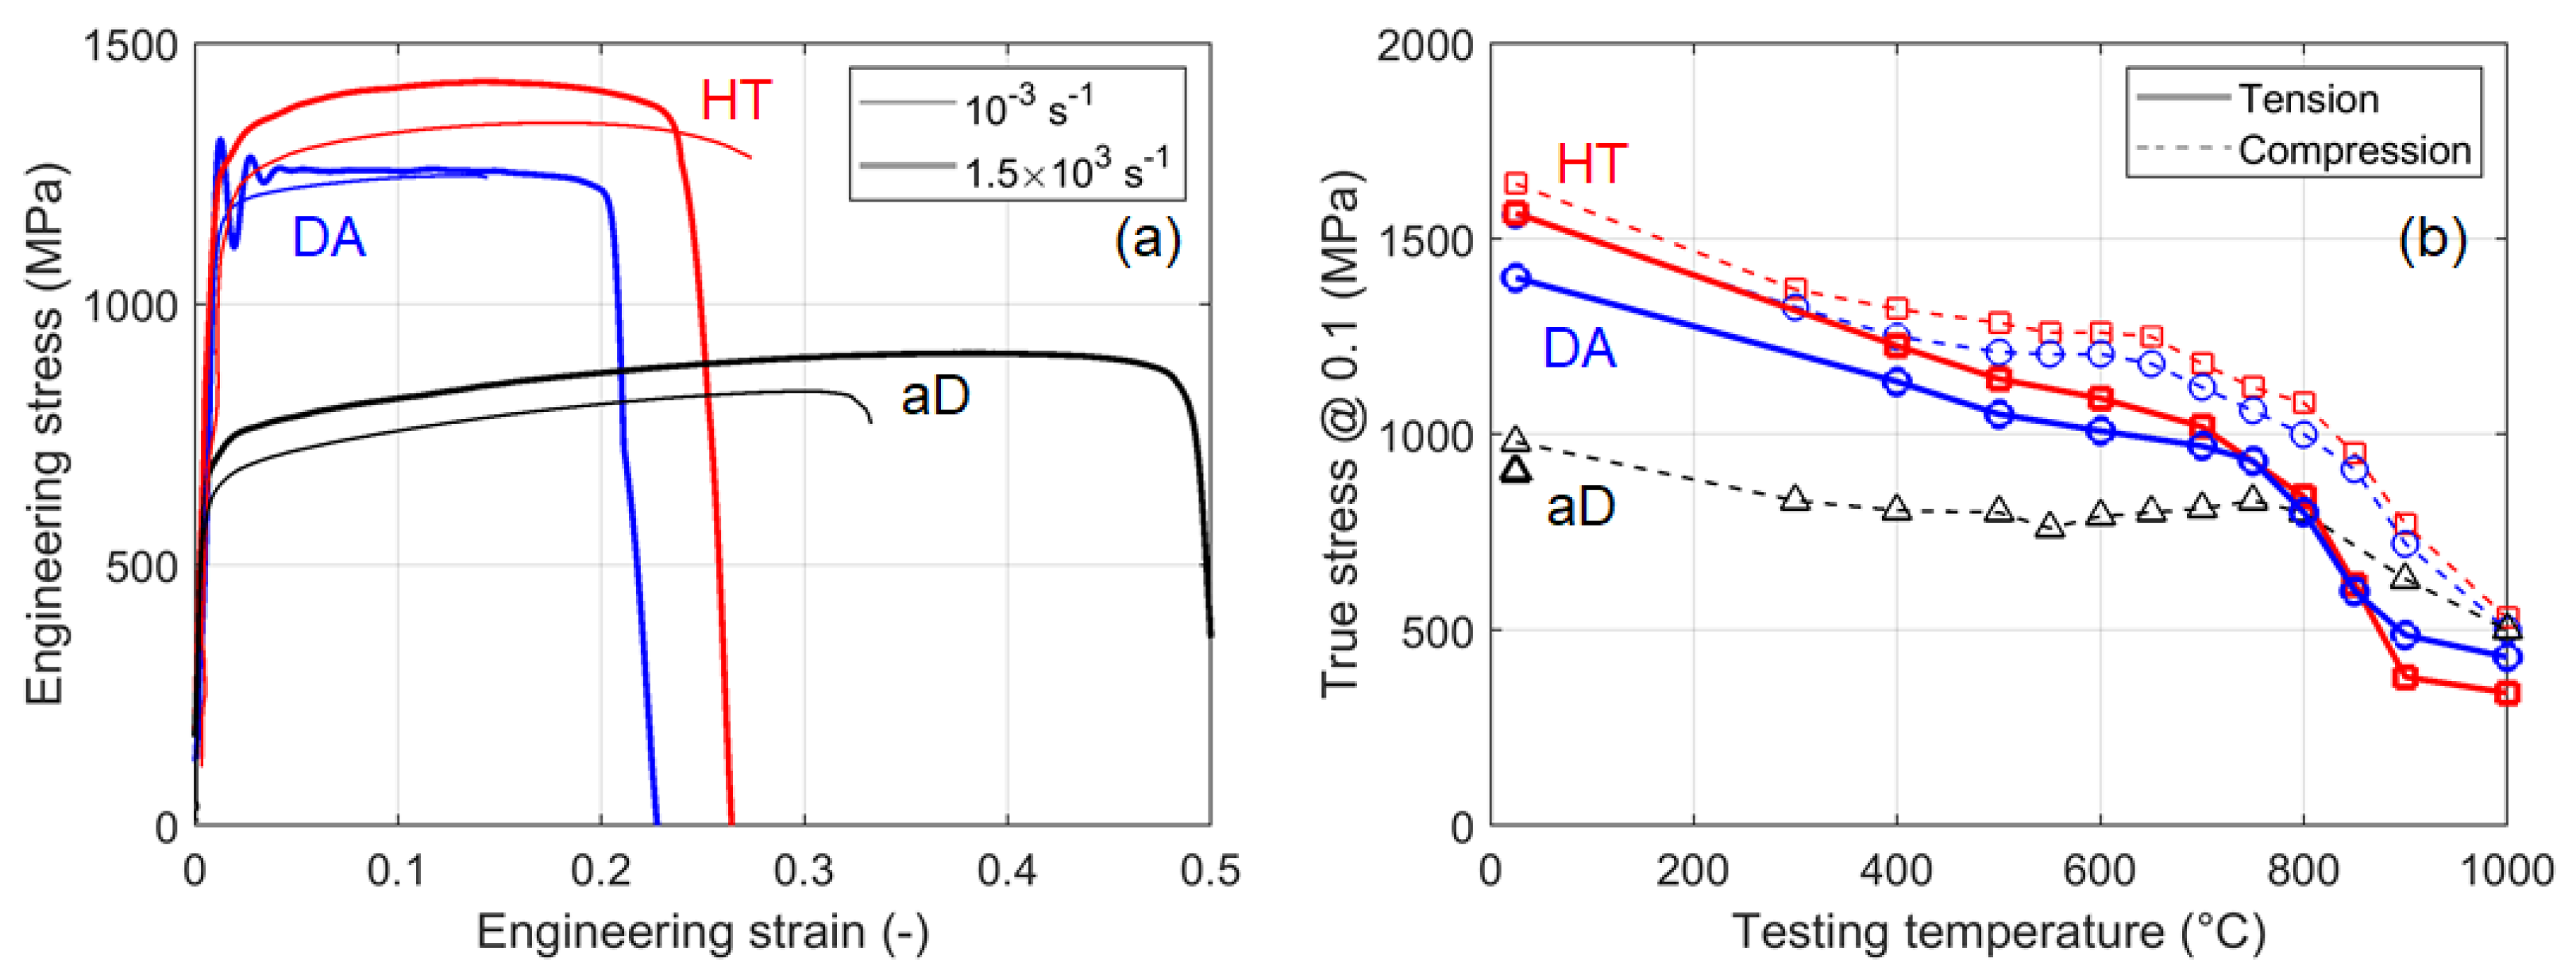
The tensile response at various temperatures obtained in high strain rate tests on DA and HT specimens are reported in
Figure 8. As previously mentioned, specimens in the aD condition were not tested because interest in such a condition is negligible, stemming from its poor mechanical properties. In the diagrams in
Figure 8, the results are shown in terms of engineering stress versus engineering strain. For each loading condition, only one repetition is shown for the sake of clarity. As expected from the results of the microstructure analyses, the HT specimens had a higher strength. In any case, for both sets of specimens, the results showed that the mechanical strength of the material was reduced by increasing the temperature. For temperatures up to 750 °C the reduction was limited, and the material behavior was characterized by low strain-hardening. In the temperature range of 800–900 °C, there was a significant drop in mechanical strength, while at 900–1000 °C the further reduction was limited.
The serrated flow stress as observed in the diagrams of
Figure 8 for temperatures higher than 800 °C could be related to the Portevin–Le Chatelier (PLC) effect. As widely known, PLC manifests as an unstable plastic flow that occurs during tensile tests of some nickel-based superalloys in a certain range of temperatures and strain rates. As reported in [
26], if the diffusivity of the dissolved atoms is increased by heating, the diffusion speed becomes so large that they can move to dislocation as soon as it stops. There is an alternation between tearing off and re-pinning of the dislocation, causing a serrated flow curve. Another consequence of this effect is that when the strain rate is increased, the dissolved atoms may not be fast enough to catch up with the dislocation and pin it. In this case, the yield strength of the material could become smaller when the strain rate increases, in contrast to the usual behavior, and the serration of the flow curve vanishes. Consequently, the final material behavior at a certain strain rate and temperature is a complex result of the interaction between solute atoms and dislocations, and the effect of temperature is not limited to the thermal activation for overcoming the dislocation obstacle but also to the solute diffusion.
Figure 9a shows the engineering stress versus engineering strain curves obtained for aD, DA, and HT specimens at room temperature in quasi-static and high strain rate loading conditions. Again, as expected, by comparing the three materials, it is possible to conclude that the aD specimens have lower mechanical strength because of the microstructure. The strain rate sensitivity obtained covering six orders of magnitude was very limited or at least negligible at room temperature. As previously mentioned, the final mechanical response is the result of the combined effects induced by the temperature and strain rate. This implies that the effect of the strain rate obtained at room temperature could not be useful to describe the material behavior in a different temperature/strain rate condition. This was the reason for specifically performing tests at various temperatures at the strain rate of interest. In
Figure 9b, the flow stress at 0.1 of the true strain is reported as a function of the testing (initial) temperature. The significant decrease of the mechanical strength in the range between 800 °C and 900 °C can easily be appreciated, as well as the stable and low reduction between 400 °C and 750 °C. In the same diagram, the results obtained for compression tests, obtained in [
20], are also shown. Compression and tension tests were carried out on the same materials with identical heat treatments (aD, DA, and HT), at an equal nominal strain rate (1500 s
−1) and in the same range of temperatures (from 25 °C to 1000 °C). An in-depth understanding of the results requires further investigation, but
Figure 9b reveals the asymmetry of the tension-compression behavior, as expected for Ni-based superalloys [
27].
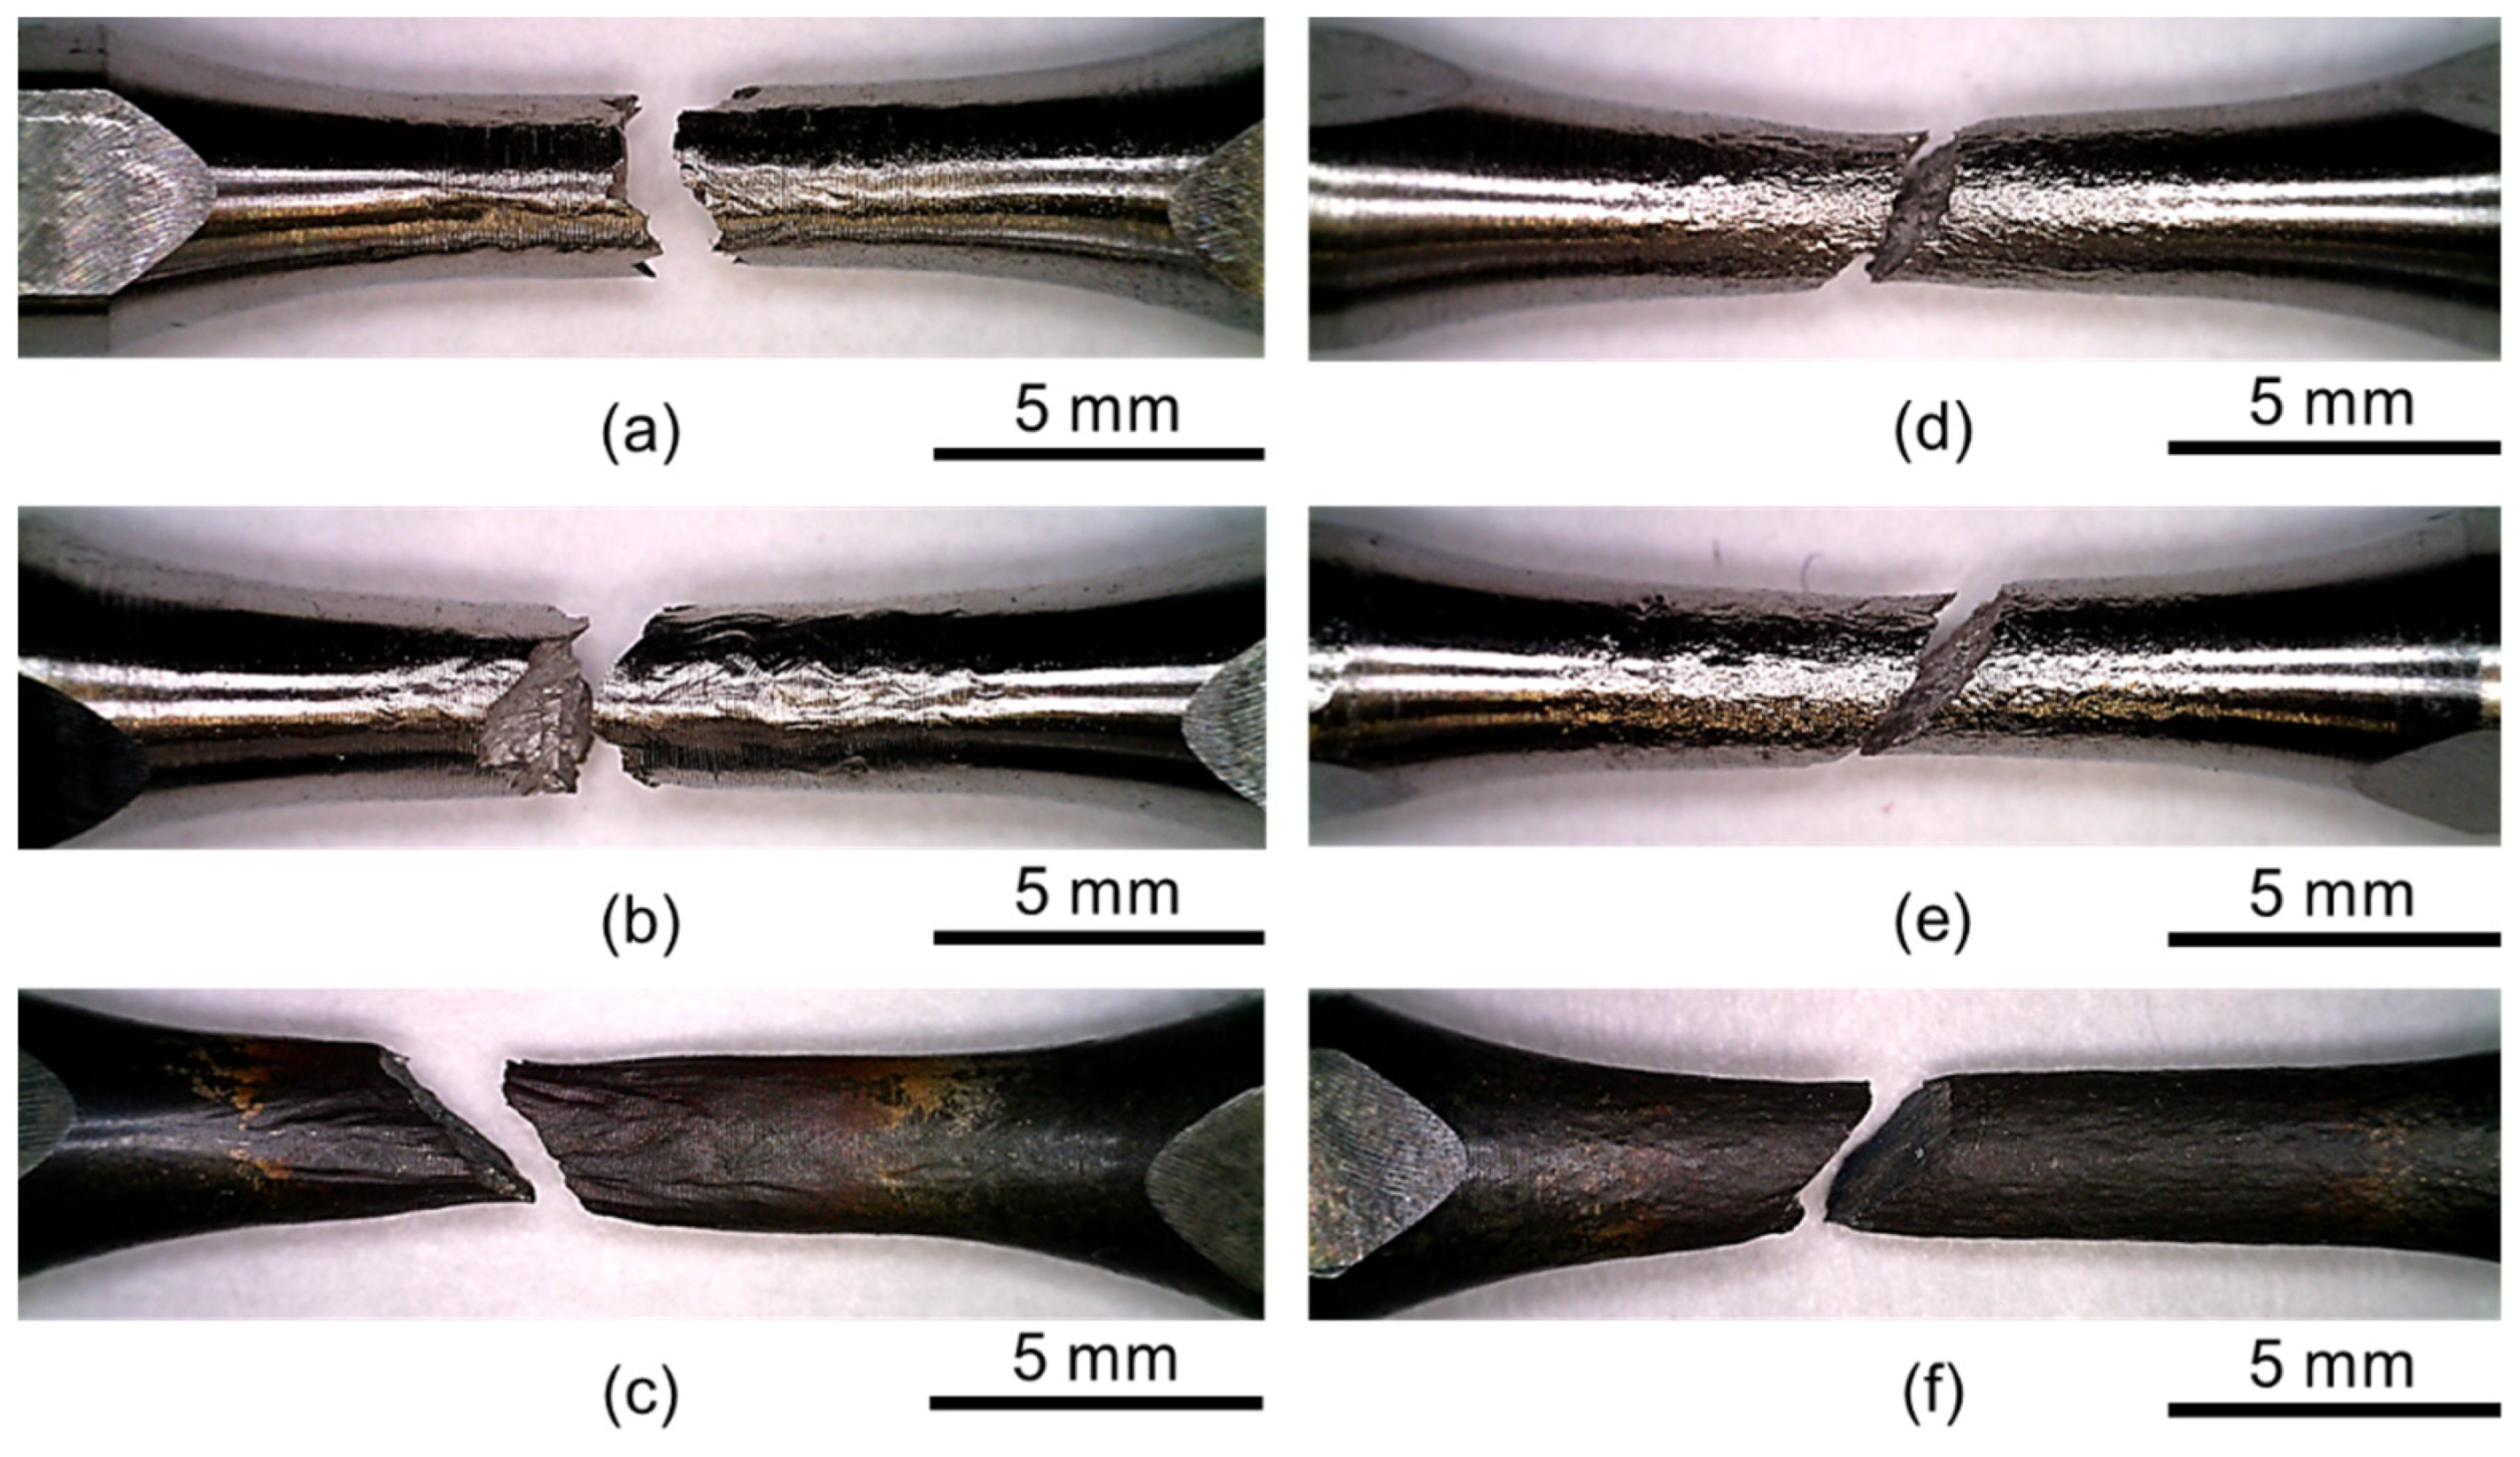
A preliminary analysis of the fracture was performed by observing the fracture surfaces. A summary of the results is reported in
Figure 10 and
Figure 11. In
Figure 10, the longitudinal views are reported both for DA and HT specimens at different loading conditions. For both materials, the fractured specimens are shown in three different loading conditions, which are as follows: quasi-static at room temperature, high strain rate at room temperature, and high strain rate at 1000 °C. Except for the DA specimens tested at room temperature, the specimens showed a fracture surface oriented at 45° with respect to the loading direction.
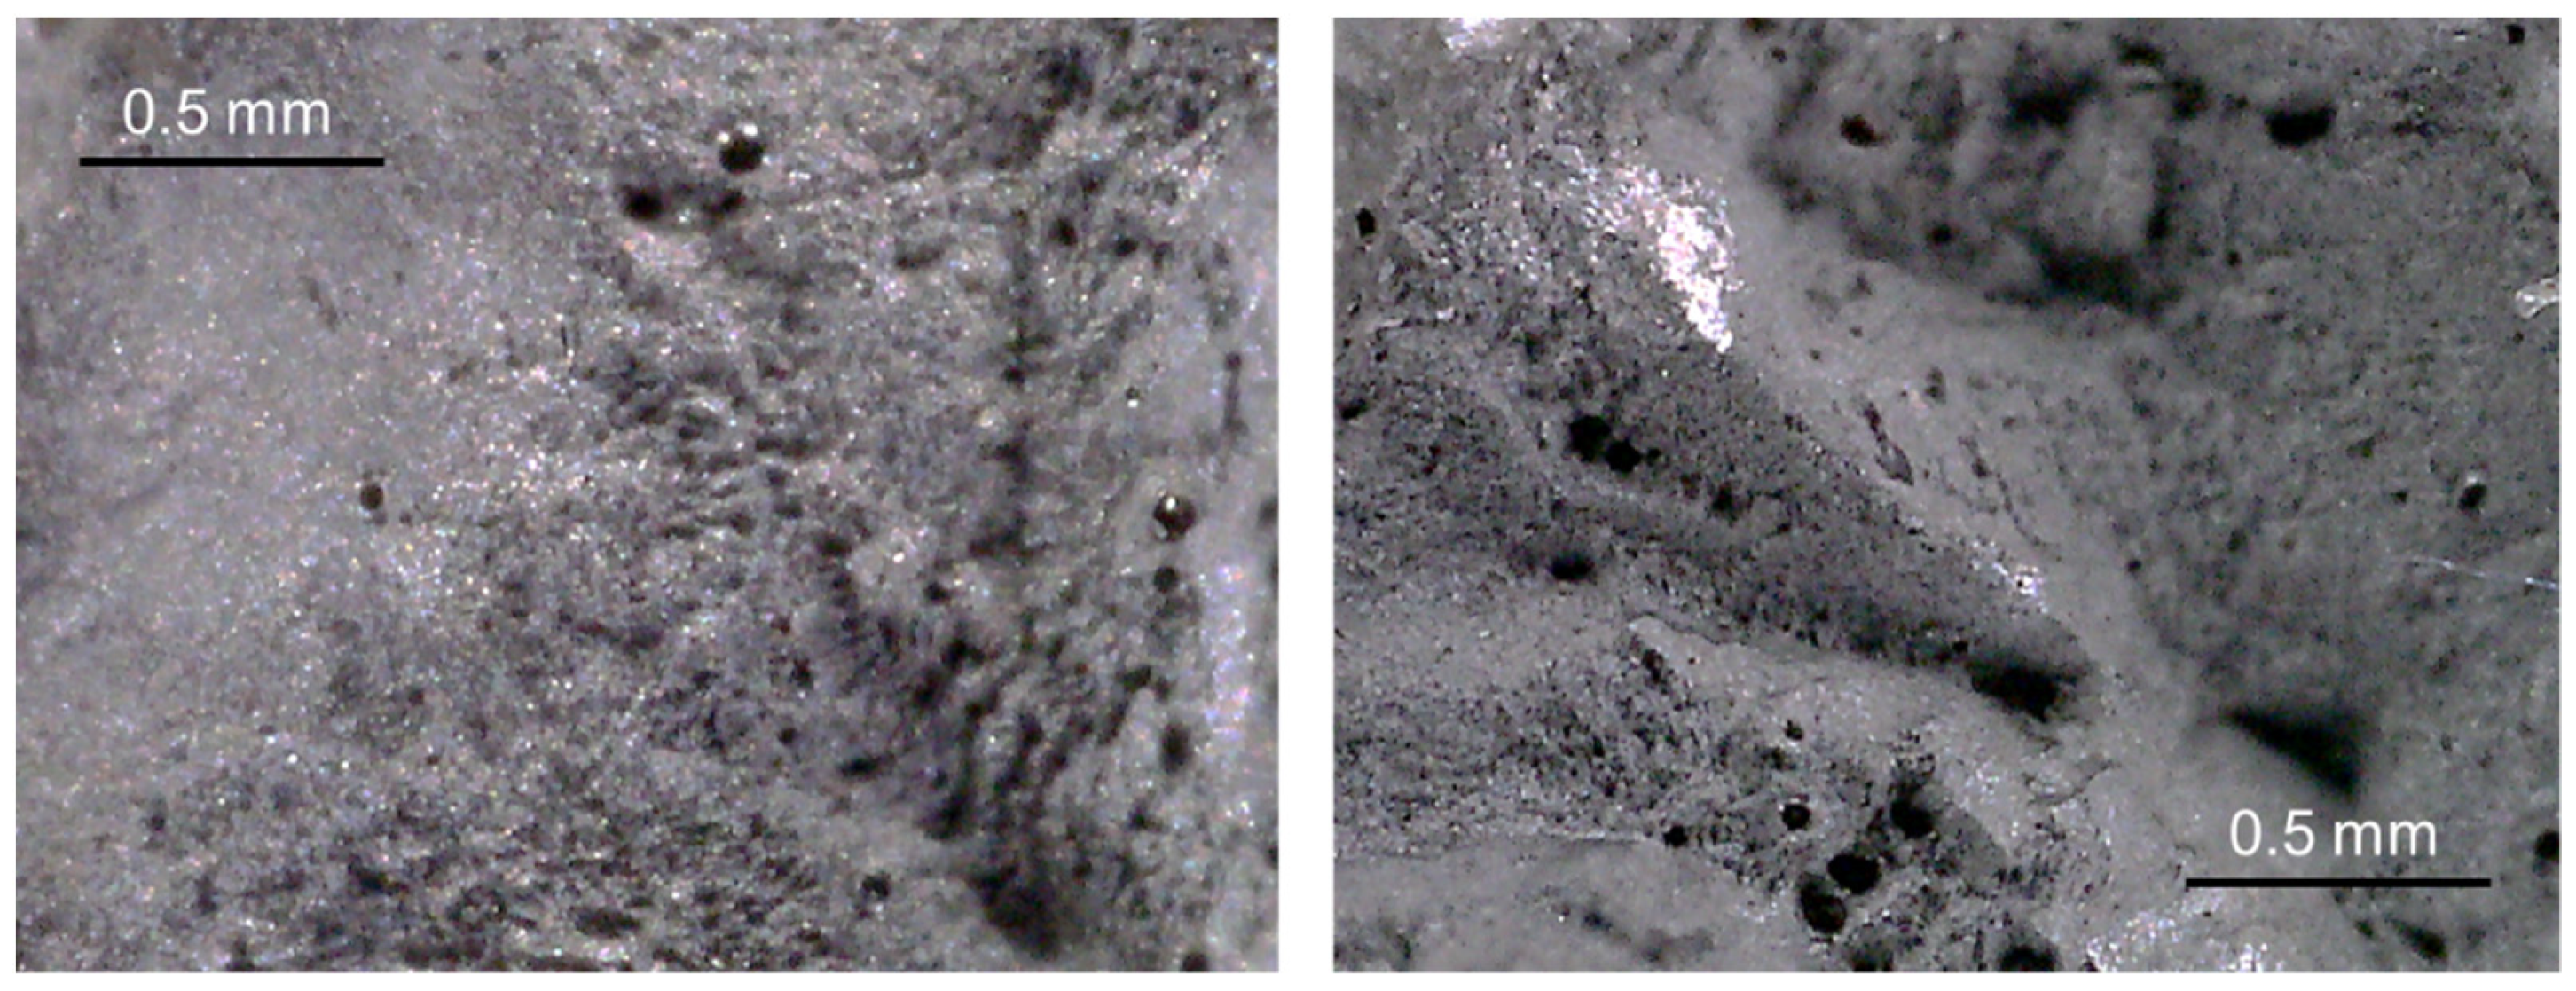
Figure 11 depicts the frontal view of the fracture surface obtained using a digital microscope, which revealed the main characteristics of a ductile fracture and the presence of voids inside the structure. Because of the aim of deeply understanding the mechanisms at the basis of the materials’ failure, the preliminary analysis of the fracture mode was not exhaustive, and this topic will require further investigation.
Adiabatic Self-Heating
As mentioned above, in the present study, the high-speed infrared camera FLIR X6900SC was used. The camera was set to a resolution of 640 × 36 pixels and was used to record the temperature map on one-half of the specimens. With this configuration, a maximum frame rate of 10,000 fps was achieved with an integration time of 6.1 μs. The synchronization system was tuned to obtain at least one image before the time in which the incident wave reached the specimen and as many images as possible during the test before the fracture of the specimen. The total number of images that can be recorded once the frame rate and the starting of the record are fixed depends on the duration of the test. The first image is required to check the temperature value just before the start of the deformation and to check the temperature uniformity. The thermal images during the deformation of the specimen, if properly calibrated, are necessary to follow the evolution of the specimen temperature as a function of the adiabatic self-heating.
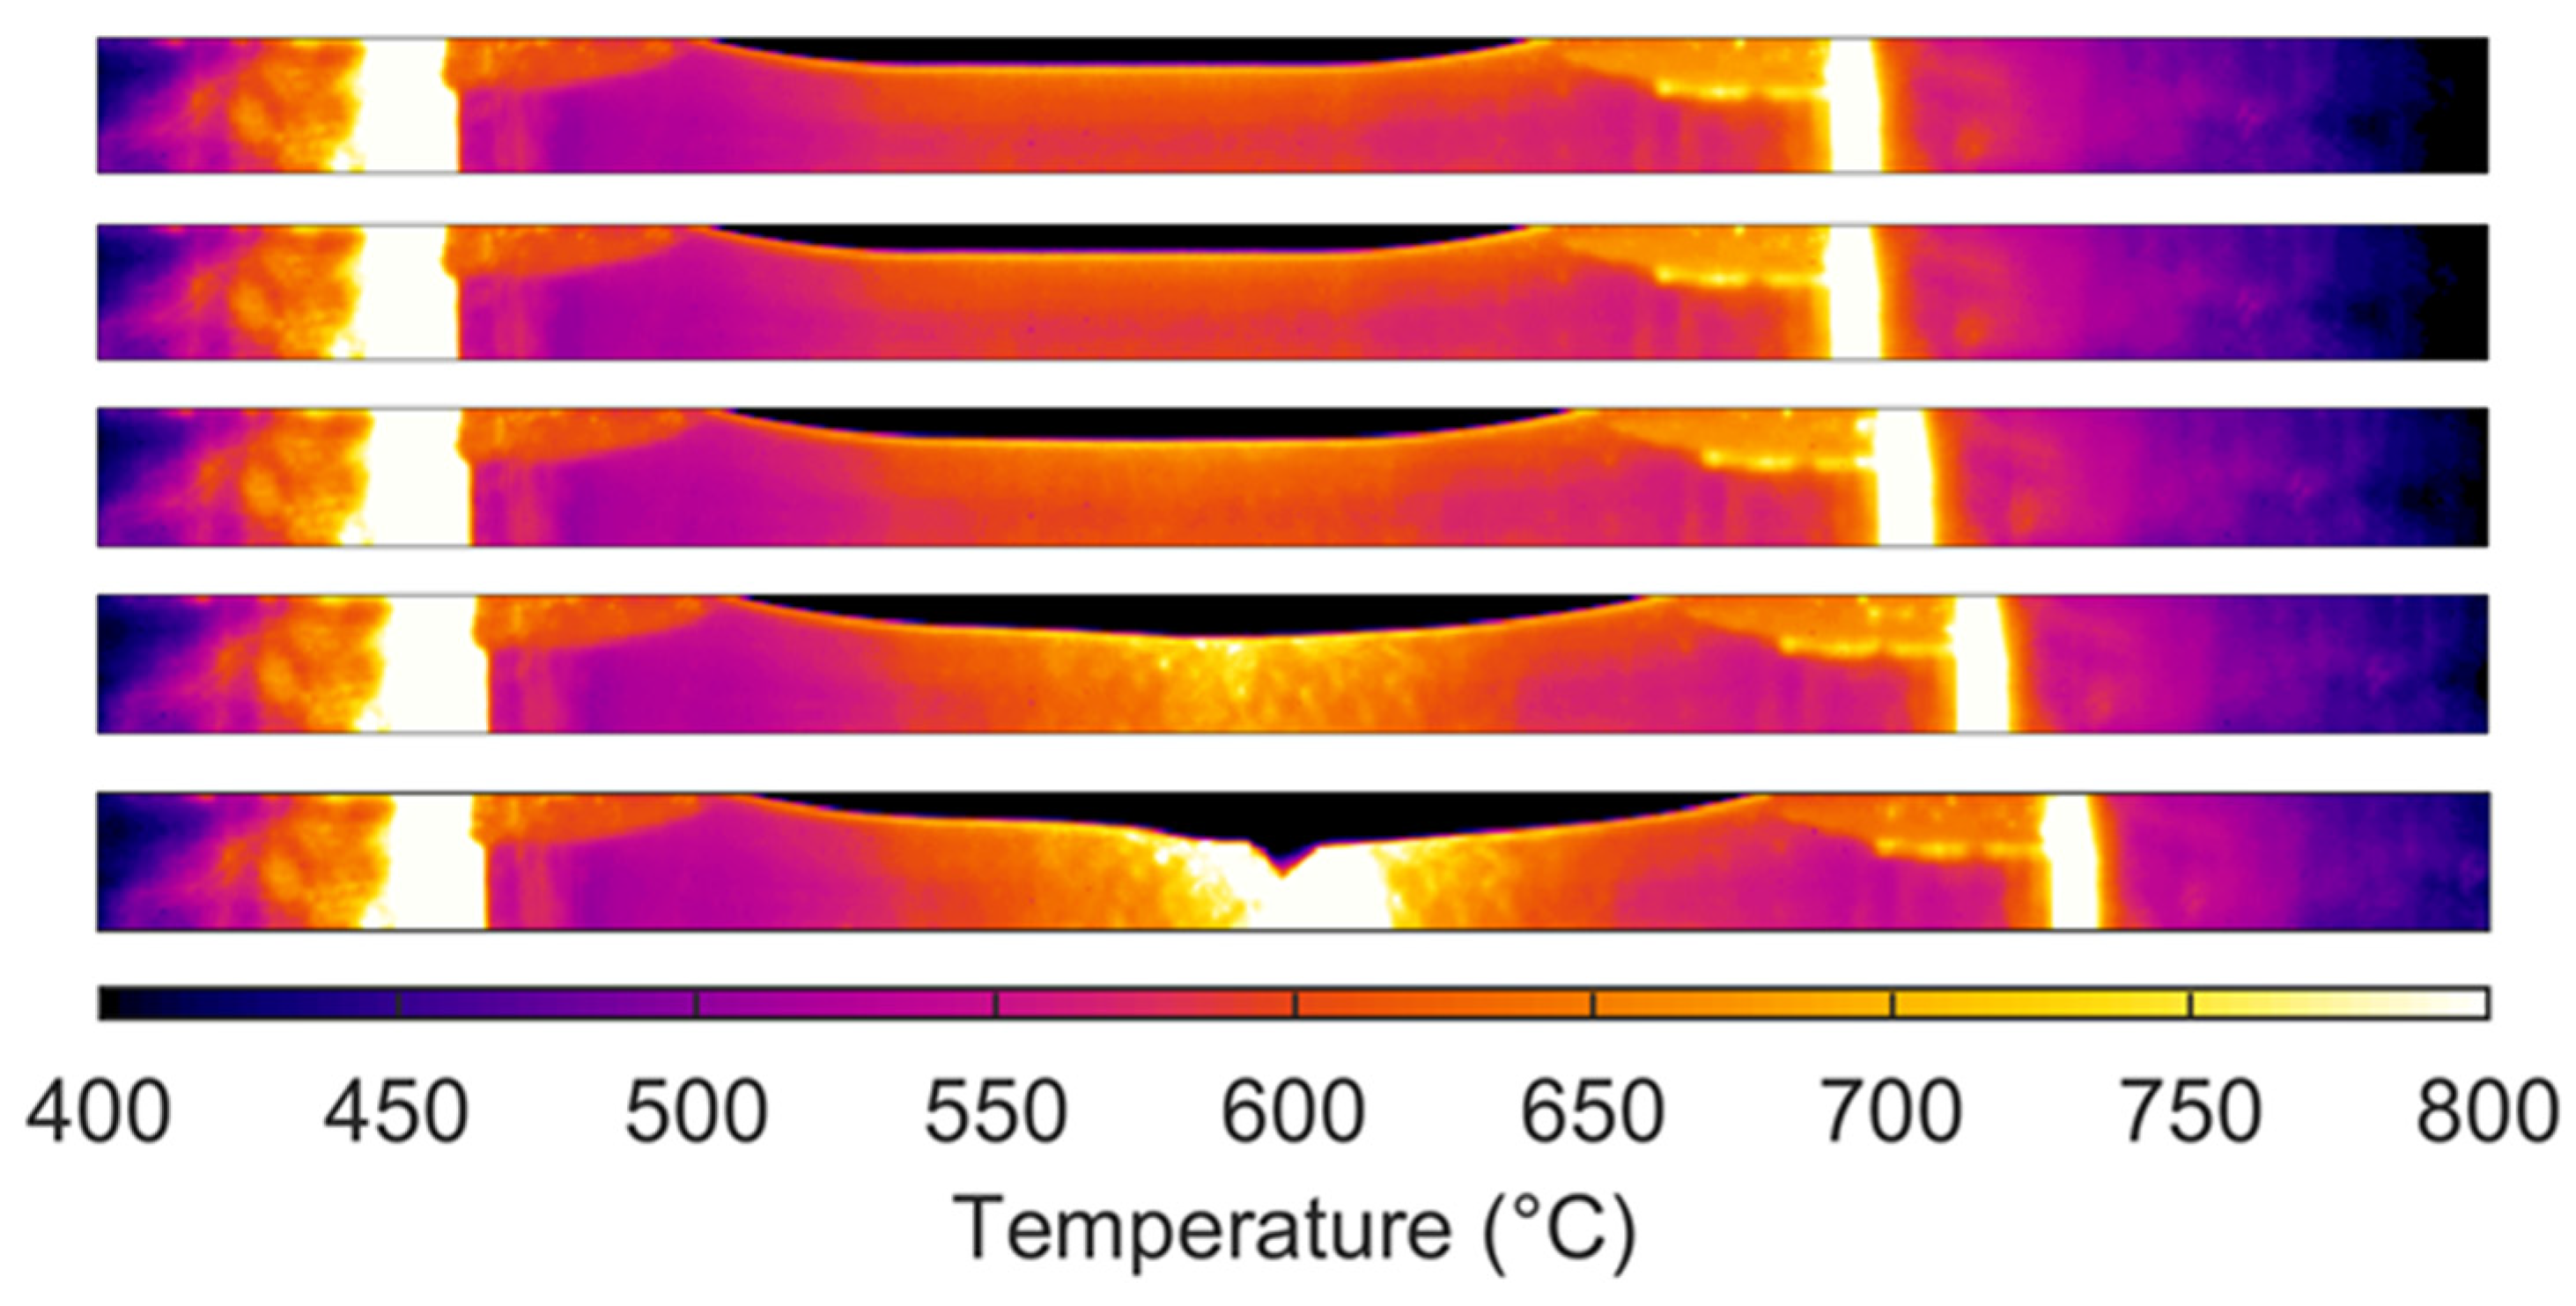
Figure 12 and
Figure 13 report two sequences obtained for tests performed at 600 °C and 900 °C, respectively. For the test at 600 °C, five frames were recorded: two images were captured before the test started, two images during the deformation, and the last frame when the specimen was already fractured. By checking the synchronization of the thermal images with the corresponding stress–strain curve, it was possible to conclude that one of the two images recorded during the test was inside the uniform deformation range, whereas the second one was in the necking region. The analysis of the thermal images revealed that during the uniform elongation, the temperature increment because of self-heating was limited (less than 15 °C); however, as expected, it became more significant during the necking phase because of the strain localization. By looking at the last frame, it is possible to observe that when the fracture occurred, a strong increment in temperature was evaluated as the result of the combination of two effects—the self-heating of the material and the cavity effect. The combination of the two makes the data analysis difficult to perform.
In
Figure 13, the image sequence for the test at 900 °C is reported. In this case, since the fracture occurred at high levels of deformation, the number of images increased. Indeed, eight images were acquired. As before, the first and second frames were captured before the start of the test and the last frame after the fracture of the specimen. The other five frames were distributed along the deformation of the specimen, and as before, they revealed that the temperature in the central portion of the specimen increased slightly with uniform deformation. An in-depth analysis of the temperature distribution, coupled with the evaluation of the effective strain, could be used to quantify the self-heating capability of the material.
5. Material Modeling
As is well known, it is of fundamental importance to properly identify a strength model that can predict materials’ response. This is especially important for obtaining reliable results when numerical simulations are performed. The best result when strength model identification is conducted is obtaining a unique formulation with the smallest set of parameters able to predict the material response as accurately as possible in several loading conditions.
Some considerations are needed to understand the solutions proposed by the authors in the present work for the calibration of the strength model. As previously discussed, the final material behavior for Inconel 718 is the result of the combination of different effects related to a complex deformation process, which is a function of strain rate and temperature. The conclusion previously obtained was that temperature sensitivity needs to be investigated at the strain rate of interest because different combinations of the two variables could produce a very different material response. The applications considered in the present work are mainly related to the high-rate or even impact scenarios: this caused the authors to completely neglect the quasi-static experimental results in the material model identification.
Another consideration directly relates to temperature sensitivity. By looking at the results reported in the diagram of
Figure 9b, it appears evident that the behavior of such materials could not be properly modeled with a simple strength model over the entire range of temperatures. This is mainly related to the S-shaped trend of the strength, which cannot be reproduced with most of the models typically implemented in commercial finite element (FE) codes (e.g., the Johnson–Cook model [
28], which is widely used in impact and high strain rate fields). Of course, one possibility could be to implement a user-defined routine in the FE codes, but as is well known, this may not be simple or even possible. A simpler solution could be using a tabular model in which the material response is directly defined in terms of equivalent stress versus equivalent plastic strain in several nominal loading conditions. Alternatively, a reduction in the extension of the range of variability of the loading conditions could be sufficient to model the material response with a simple and unique model. The problem related to this approach is the validity of the identified model outside the range on which it was calibrated. Both solutions are examined below.
5.1. Tabular Model
In this section, the use of a tabular-defined model is proposed. The same approach was adopted by the authors in [
29] to model the behavior of pure niobium.
The approach consists of the definition of some specific paths on a (hyper)surface from which the stress could be obtained as a function of all the involved variables (e.g., effective plastic strain, temperature, and strain rate). Each path represents the material response expected for a particular loading condition, which can be easily obtained with a good level of matching from the corresponding experimental data. This step can be performed in several ways, but the most suitable one depends on the material response and needs to be evaluated case by case once the experimental data are analyzed.
For the present study, the results presented in the diagrams in
Figure 8 suggested that most of the test was in the uniform deformation range, whereas the necking occurred only at the end of the test in most of the loading conditions, especially for the DA specimens. This allowed us to directly obtain the effective stress versus effective plastic strain curve from the engineering data, limiting the investigated range in strain to remain in the uniform deformation. Under this assumption, the strain rate increase during the test can be neglected, as can the temperature increment because of self-heating. The last assumption was also validated by the analysis of the temperature increment; as previously reported, this was limited, especially before necking. Conversely, if the necking involves a considerable part or even most of the curve, as found in [
22] for pure tungsten, a numerical inverse method based on FE simulations is needed to correctly compute the strain, strain rate, temperature, and triaxiality effects on the material response.
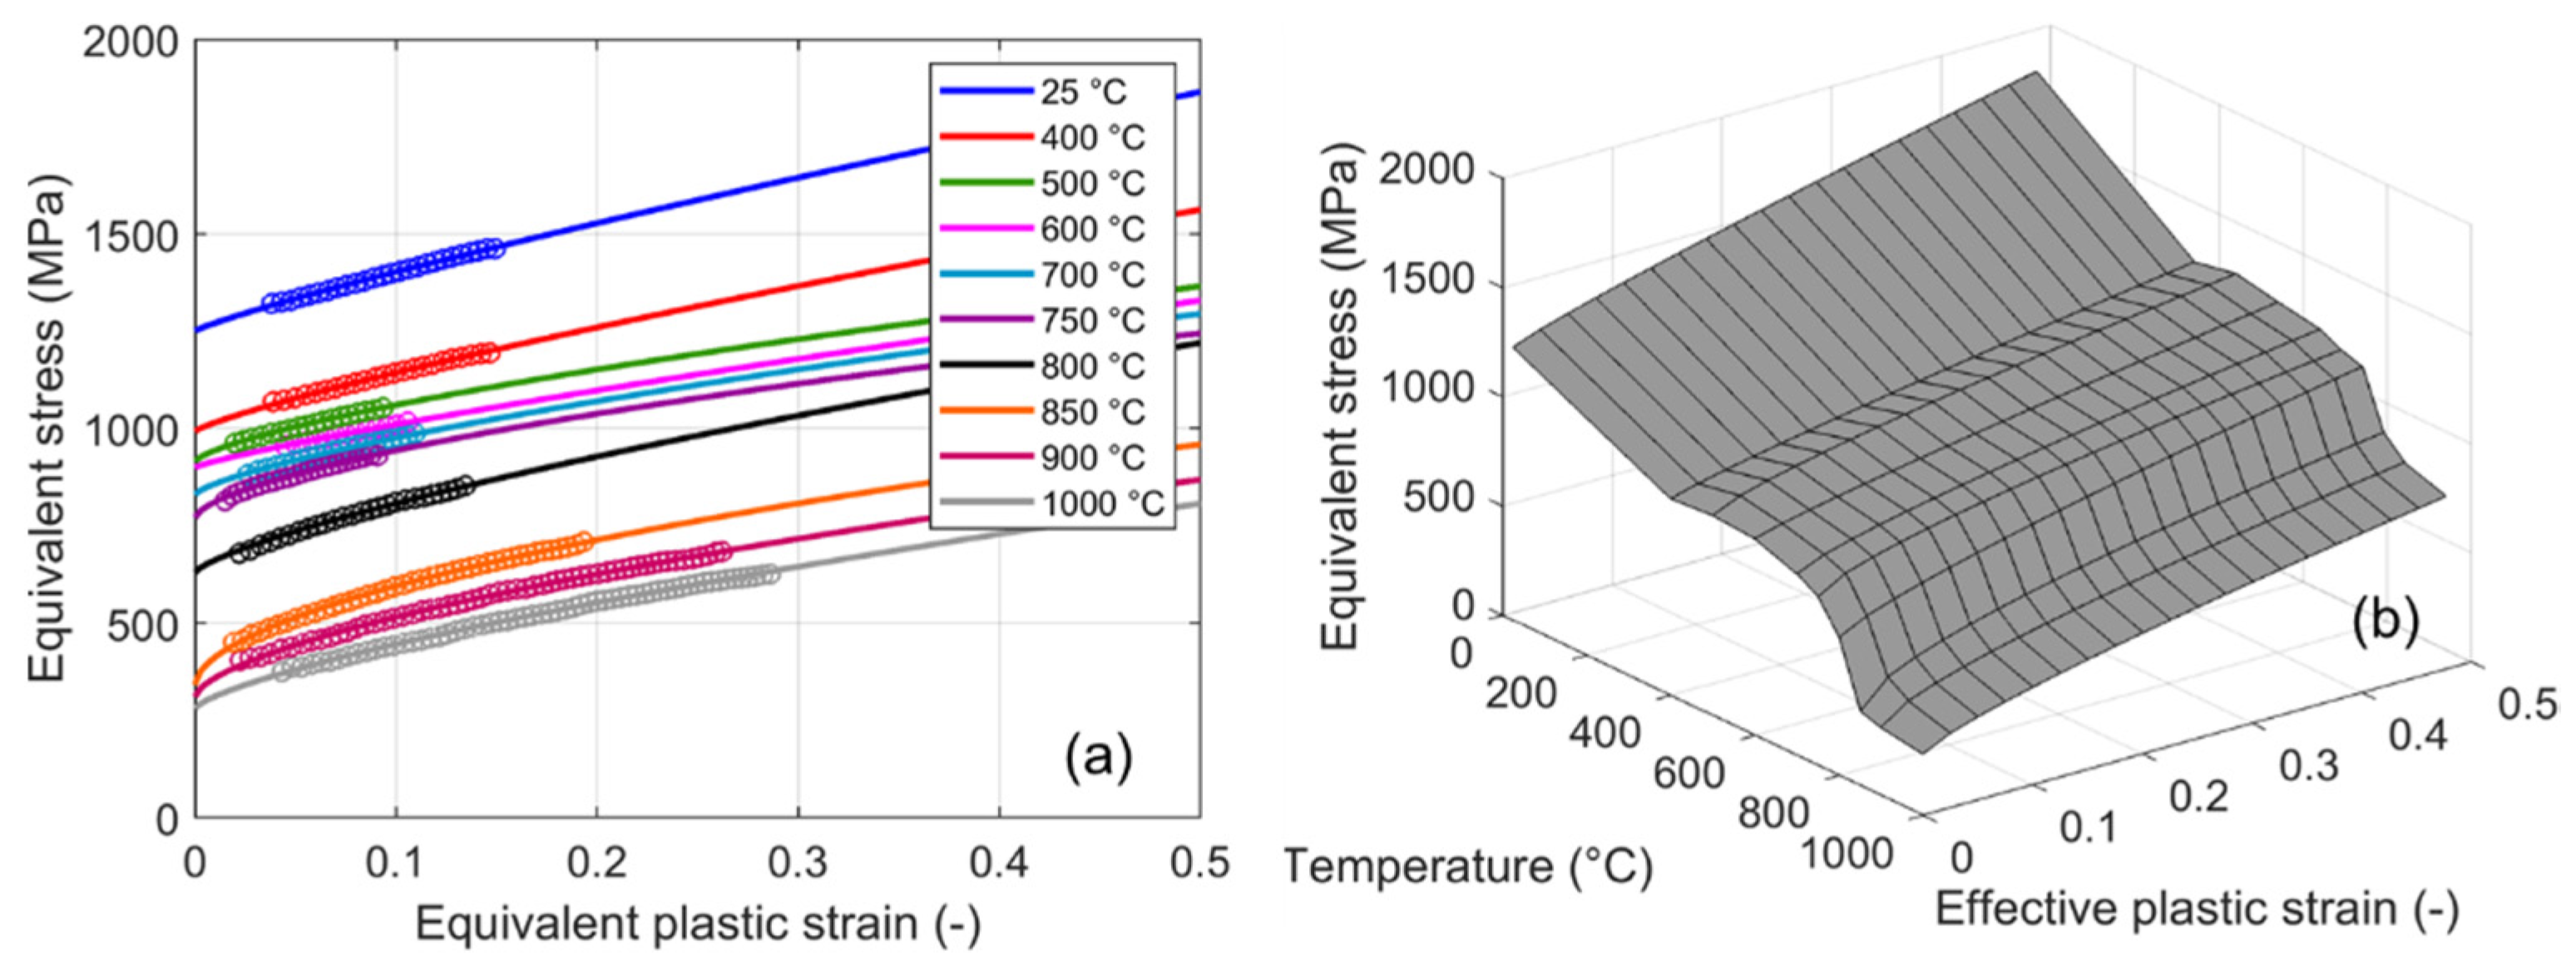
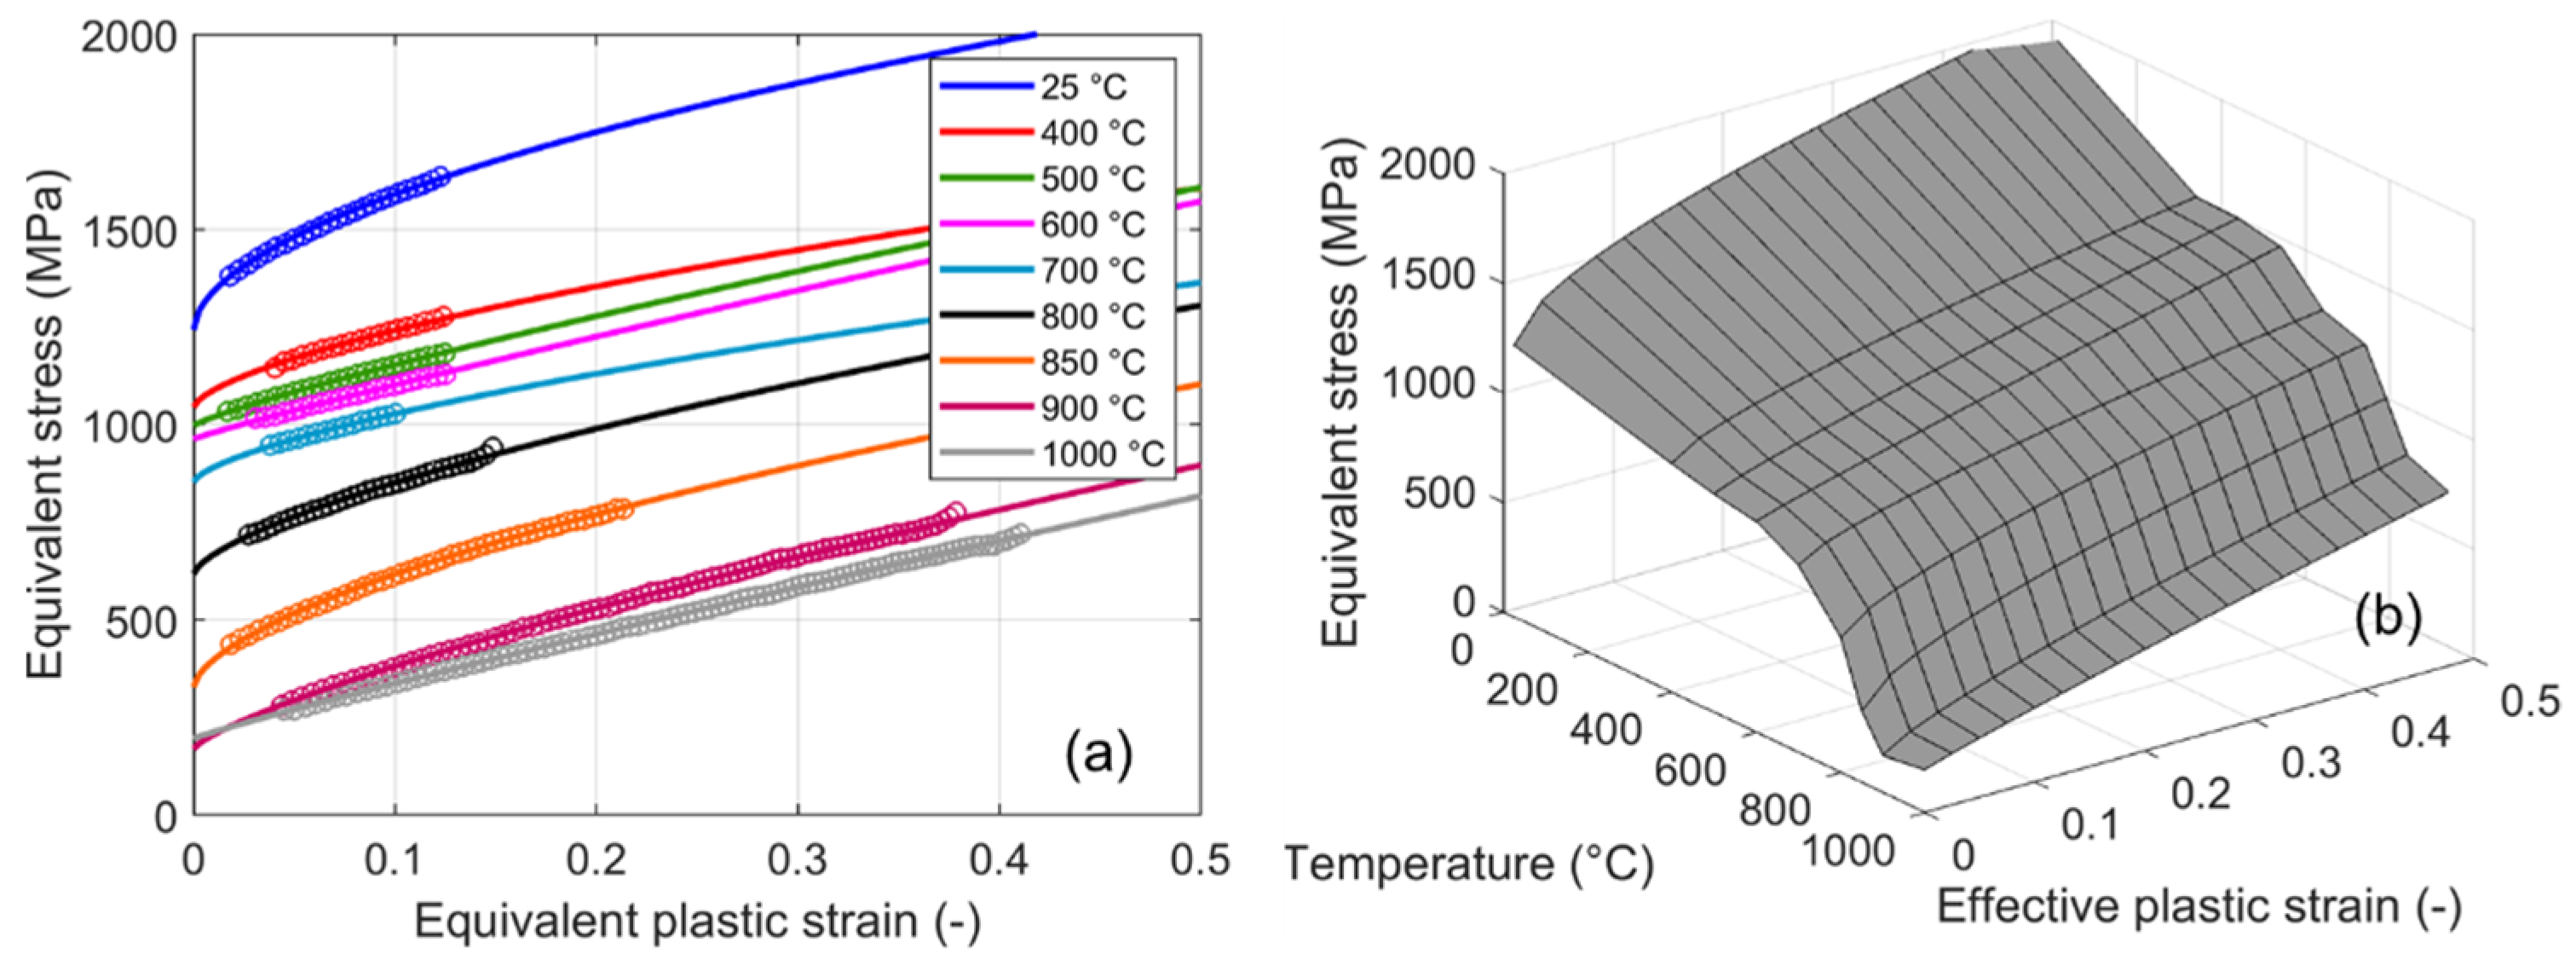
In view of the above, the first proposal was to use a tabular model including all the testing conditions at high strain rates and at various temperatures. The results are reported in
Figure 14 and
Figure 15 for the DA and HT specimens, respectively. In more detail, the procedure implied obtaining the effective stress versus effective plastic strain curves remaining in the uniform deformation regime from the engineering data. The initial part of the curves was not considered because it was affected by oscillations that were related not to material behavior but to inertial effects introduced by the experimental system. Instead of directly using the experimental data, each curve was numerically fit with a mathematical model to obtain smoother stress–strain relationships. The operation was performed independently for each curve. Strain rate and temperature variation during the deformation were neglected (isothermal approach). The chosen mathematical formulation was based on the hardening part of the Johnson–Cook model [
28] (
σy =
A +
Bεn, where
A,
B, and
n are the parameters to be identified), but this was without loss of generality of the method. The comparisons between the experimental data (represented with markers) and the models (represented with lines) are shown in
Figure 14a and
Figure 15a for the two materials. At the end of the process, the stress–strain–temperature surface predicting the high strain rate response of the materials was obtained (see
Figure 14b and
Figure 15b).
5.2. The Johnson–Cook Model
In this section, the authors propose the use of a unique simple model, namely, the Johnson–Cook formulation [
28], by excluding the temperatures at which the sharp decrease of strength occurred from the parameter identification procedure. For both the materials, this meant considering only temperatures below 800 °C. As mentioned above, the problem with such an approach is the use of the identified material model outside the range of calibration. In the identification procedure, the original formulation of the Johnson–Cook model was simplified: as also performed for the tabular model definition, the strain rate was neglected, and an isothermal approach was applied.
The material model identification required the determination of five parameters (
A,
B,
n,
m, and
Tm) in accordance with the formulation
σy = (
A +
Bεn)(1 −
T*m), where
T* = (
Ttest −
Tr)/(
Tm −
Tr),
Tr is the room temperature (25 °C), and
Ttest is the starting temperature of each loading condition considered in the optimization process. The obtained parameters are reported in
Table 1 for both sets of specimens.
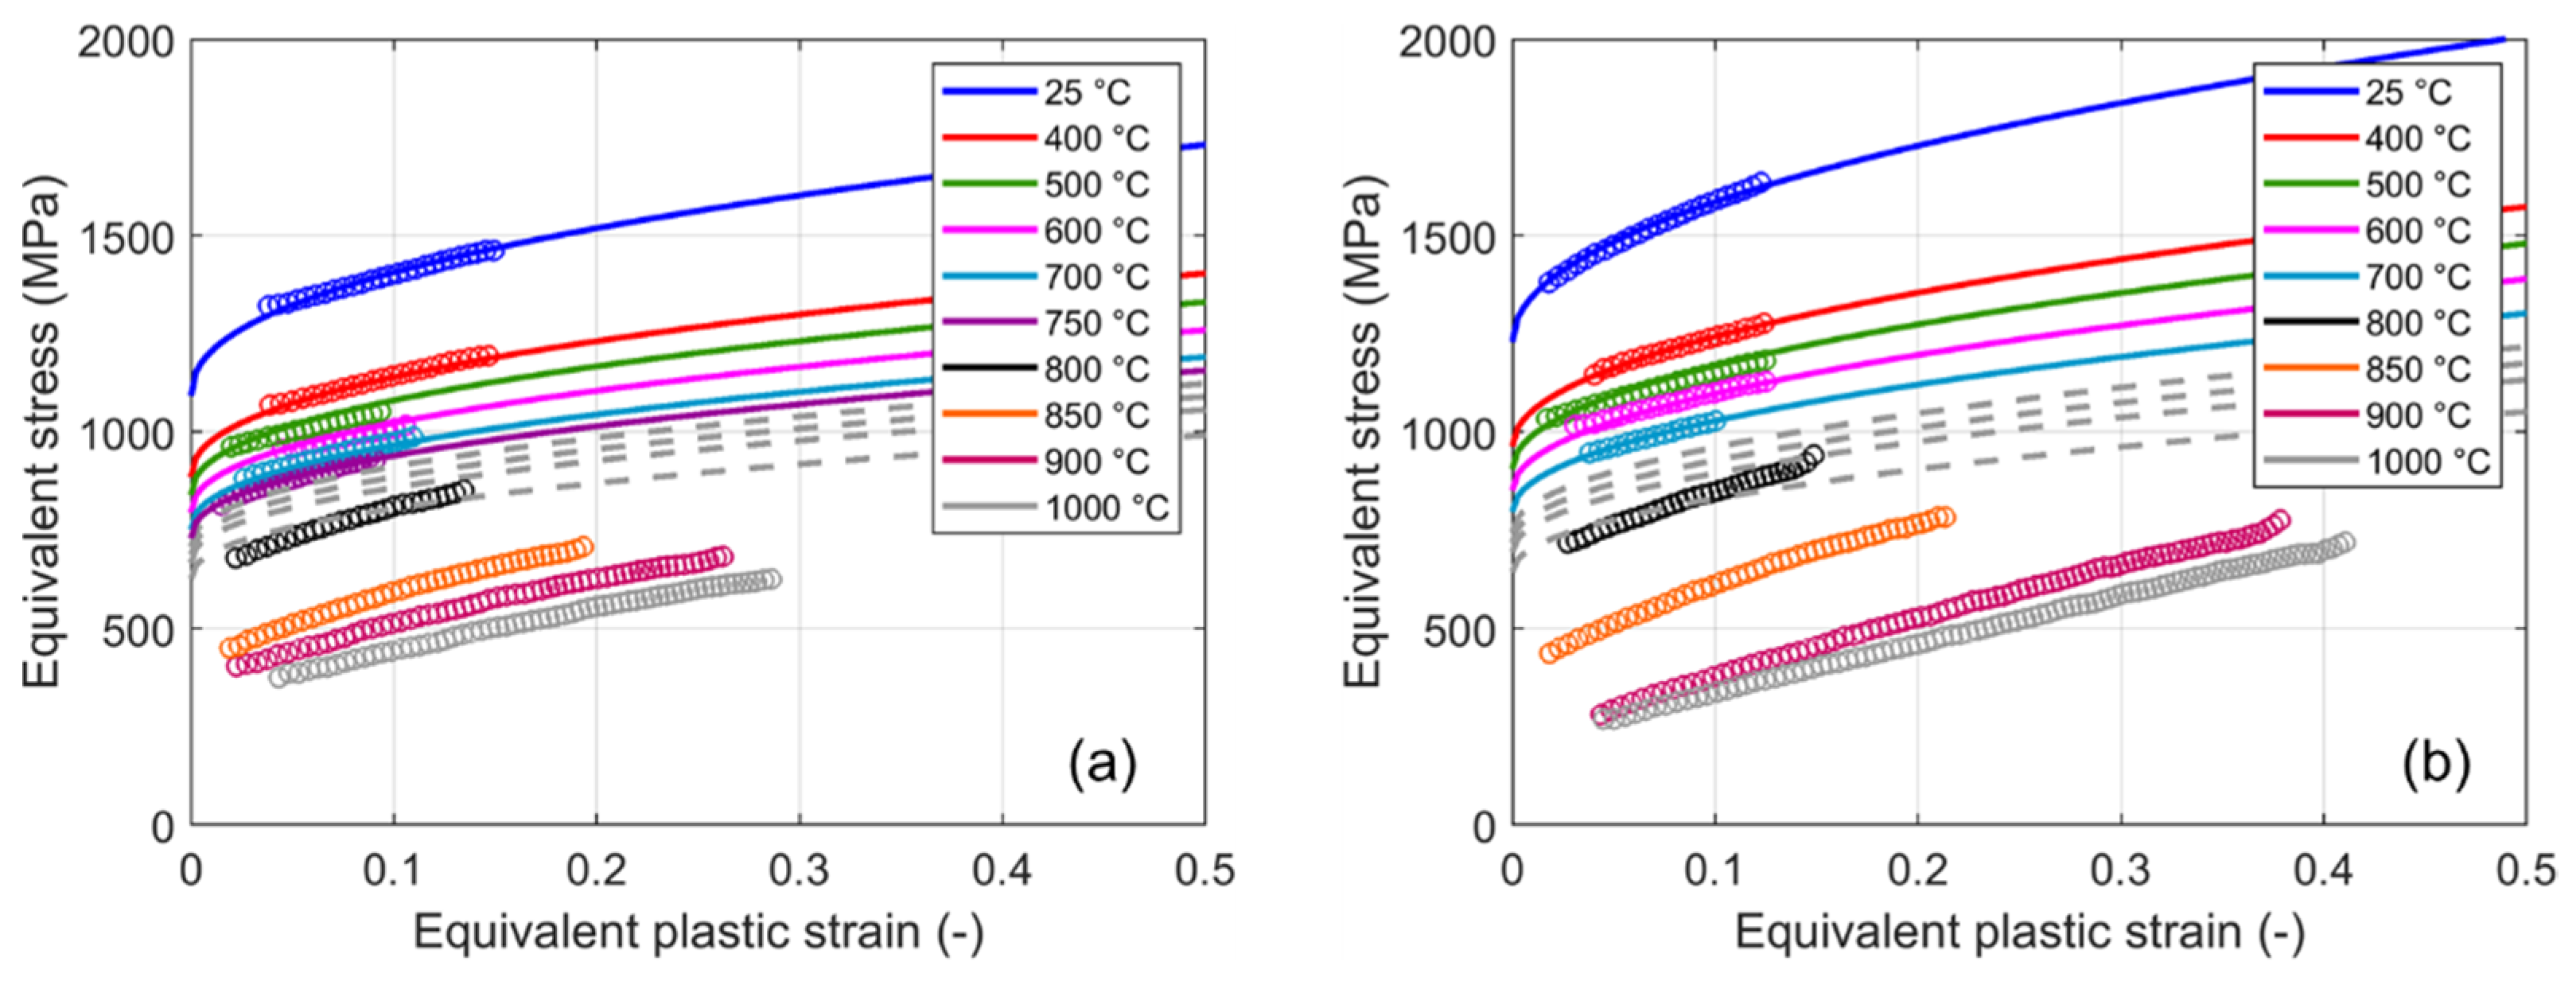
The comparison between the experimental equivalent stress versus equivalent plastic strain data (represented with markers in the diagrams) and the model predictions (represented with lines in the diagrams) is reported in
Figure 16a,b for the DA and HT specimens, respectively. The dashed lines represent the predictions of the model for the temperatures outside of the calibration range. As the figure panels show, the material model prediction in these conditions is completely different from the expected behavior. One possibility for overcoming this limitation is defining two separate Johnson–Cook models, one for temperatures lower and the other for temperatures higher than that of the sharp transition in strength. This solution was proposed by the authors in [
23] to predict the behavior of pure iridium, which was affected by recrystallization at a temperature inside the range of the investigated temperatures. This solution only partially solved the problem because it moved the problem to the possibility of implementing and properly switching between one model and the other in a numerical simulation as a function of the computed real temperature.
6. Conclusions
In this study, the high strain rate tensile mechanical property as a function of temperature for Inconel 718 was investigated. The need to test the material in combined high temperature and dynamic conditions came from the numerous applications in which this material is used for components that operate in high-temperature environments while also being exposed to (accidental) high dynamic mechanical stresses.
Cylindrical dog-bone specimens were machined, starting from raw bars manufactured using LMD. The tensile loading direction was the deposition direction during manufacturing. Three different heat-treated conditions were analyzed (aD, DA, and HT).
The nominal strain rate was 1500 s−1, and the investigated temperature varied between 25 °C and 1000 °C. The tests were performed at the DYNLab of Politecnico di Torino using a Hopkinson setup with a direct configuration. The specimens were heated using an induction system, and three different measuring systems were adopted and compared for the temperature control (thermocouples, a pyrometer, and a high-speed infrared camera.
The analysis of the experimental results showed that the mechanical strength slowly decreased with temperatures up to 750 °C, whereas a significant drop was found between 800 °C and 900 °C. The analysis of the experimental results also underlined the complexity of the mechanisms at the basis of deformation. As a result, the need to investigate the temperature sensitivity at a particular strain rate of interest was followed up.
Finally, the experimental data were used to calibrate the strength material models to be used in FE simulations. Two different approaches were proposed to solve the problem related to the impossibility of using a unique, simple, and widespread material model on the entire range of the investigated temperatures. The first approach was the identification of a (hyper)surface defining the material strength as a function of independent variables, such as plastic strain and temperature. The surface was defined by paths directly obtained, considering all the experimental results in the different loading conditions. The second approach was the identification of a unique simple model, the Johnson–Cook model, which required the reduction of the range of the temperatures to be considered. In both approaches, the analysis was limited to the uniform deformation regime, and the material models were identified under the hypothesis of isothermal deformation by neglecting adiabatic self-heating, as suggested by the analysis of the thermal images.


