Article

Influence of Local Properties on Fatigue Crack Growth of Laser Butt Welds in Thin Plates of High-Strength Low-Alloy Steel

by
Patricio G. Riofrío
1,2,
Joel de Jesus
2,*,
José A. M. Ferreira
2 and
Carlos Capela
2,3
1
Departamento de Ciencias de la Energía y Mecánica, Universidad de las Fuerzas Armadas-ESPE, Av. General Rumiñahui S/N, Sangolqui 171103, Ecuador
2
Centre for Mechanical Engineering, Department of Mechanical Engineering, Materials and Processes (CEMMPRE), University of Coimbra, 3004-516 Coimbra, Portugal
3
Department of Mechanical Engineering, Polytechnic Institute of Leiria, School Tech and Management, Morro do Lena-Alto Vieiro, 2400-901 Leiria, Portugal
*
Author to whom correspondence should be addressed.
Appl. Sci. 2021, 11(16), 7346; https://doi.org/10.3390/app11167346
Submission received: 3 July 2021 / Revised: 3 August 2021 / Accepted: 4 August 2021 / Published: 10 August 2021
(This article belongs to the Special Issue Focus on Fatigue and Fracture of Engineering Materials)

Abstract

:
In this work, local properties such as hardness and fatigue crack grow rate in the heat-affected zone of four laser-welded butt joints in thin high-strength low-alloy steel were examined, so as to explain and predict fatigue lives at high stress levels through the fracture mechanics approach. The different welded series presented a similar fatigue crack growth rate in the heat-affected and fusion zones, but lower than base metal due to the higher hardness of the bainitic–martensitic microstructure verified in the welded series. The results showed that at high stress levels in the as-welded condition, the fatigue initiation stage can be neglected and assume some types of cracks, with an initial crack of 0.07 mm and appropriate fatigue crack growth rates, estimates of fatigue life close to the experimental results were obtained.

1. Introduction

The fatigue behavior of steel welds has been widely studied, but there are still gaps in the knowledge of this complex subject due to several factors that affect the fatigue strength and even more so due to concerns related to thin thicknesses and unconventional welding processes. The weld quality, the residual stresses and the material, among others, are pointed out as the main factors that affect the fatigue strength [1,2]. It has been shown that weld quality control [3], or the use of post-weld treatments [4,5,6,7] in welded joints with high strength steels, increases the fatigue strength by reducing the severity of its inherent imperfections; this fact is recognized in design guides. However, when allowing the increase in fatigue assessment classes of welded joints (FAT), when the imperfections have been verified with nondestructive testing (NDT) or when an improvement method has been used [8], there is no differentiation in the increase according to the tensile strength of the materials. The foregoing has been explained in [9], due to the fact that the crack growth dominates the fatigue life of the welded joints and because the fatigue crack growth rate (FCGR) is insensitive to the mechanical strength of the material. However, as counterpart in [10], it was shown that when the weld quality is high, in high-strength steels for example, the fatigue strength is positively correlated to tensile strength.
The general effect of notches and residual stresses on fatigue strength of welded joints is well known as their combined effect was analyzed in various studies. However, in almost all works, thick plates and conventional welding processes were used [11,12,13,14]. Microstructural details such as grain size, phases and hardness also affect the fatigue behavior of the welded joints. The crack propagation generally occurs in the heat-affected zone (HAZ) and in the fusion zone (FZ) because the properties of these zones are usually different from base metal (BM). The use of local properties such as hardness and fatigue crack growth parameters can be useful to improve the analyses and predictions of fatigue strength [15,16,17].
The increase in the thickness of the plates in welded joints decreases the fatigue strength. For the same nominal stress, thicker welded plates have lower fatigue strength than thinner welded plates. In [18] it is explained that the above is due to the fact that the stress in the crack depends on the relationship between the crack depth and the thickness, this effect being greater in crack growth for thick plates than for thin plates. While in [9] it is pointed out that the effect of stress concentration on the weld toe is greater in a crack in a thick plate. A reduction factor is applied to fatigue strength if the thickness plates exceed 25 mm [8], however if the plates’ thickness is lower, there is no rule for the fatigue strength increase. In [19] the increase in fatigue limit due to the decrease in the thickness of the plate was estimated for thicknesses less than 25 mm as a function of the initial crack size. This work highlights that for thicknesses less than 6 mm, the opposite effect occurs when the initial crack size is greater than 0.3 mm.
The presence of defects acting as a fatigue pre-crack are the main reason to a substantial reduction in fatigue strength in welded joints. This determines that the initiation period can be neglected [8,18] and that fracture mechanics seem to be the appropriate approach to determine the fatigue life [9]. In various works where the assessment and prediction of fatigue life are based in fracture mechanics, the basic procedure takes as base the Paris law and the stress intensity factor (SIF) applied to imperfections in all ranges of stress levels. However, due to the small size of cracks or low stress levels, the initiation stage is also considered [19,20]. Additionally, refinements or variants to the Paris law are applied to predict or analyze the fatigue life of welded joints [21,22]. Based in fracture mechanics, Murakami [23] proposed an expression for fatigue limit predictions of materials containing small defects or cracks as a function of the hardness and the size of small defects; Åman et al. [24], in a recent work, modified the aforementioned expression in order to analyze the consequence of a small defect at the notch root.
To define the welded joint the use of imperfections previously described as semi-elliptical cracks, corner cracks and extended cracks is common practice, whereby the guides and standards that use the fracture mechanics approach contain information of crack growth parameters, recommendations about the crack sizes and the appropriate expressions for the calculation of SIFs and factors [8,25]. In the so-called IBES approach [26], based on fracture mechanics, it is observed that, among other aspects, the determination of fatigue strength is obtained statistically by considering the variation of weld bead along the weld axis as well as the local properties of the fusion zone (FZ) and heat-affected zone (HAZ).
As was previously mentioned, the influence of the main factors on fatigue strength and the application of fracture mechanics for welded joints with thin elements, is a topic that lacks information. This study started from a previous work [27] where the weld bead geometry, imperfections and weld quality level of welds were determined according to the ISO13919-1 standard [28]. In the present study the influence of welding parameters on fatigue crack growth rate (FCGR) of laser butt welds in thin plates of high-strength low-alloy steel were analyzed. The local properties for the FCGR were determined and used in order to predict the fatigue life through the failure analysis and fracture mechanics approach, disregarding the fatigue initiation period for fatigue life at high stress levels. The FCGR parameters were obtained through fatigue crack growth tests and complementary tests and analysis such as metallographic, hardness, crack closure and fractography were also performed.

2. Materials and Methods

HSLA Strenx® 700MCE steel plates, with a thickness of 3 mm, were used in order to perform butt-welded joints. This steel is composed of a fine-grain ferritic–bainitic microstructure. The chemical composition can be consulted in Table 1 and this material showed a yield strength of 808 MPa, a tensile strength of 838 MPa and 15% of elongation at failure [29].
Five series were welded using the parameters presented in Table 2. The series S1–S4 were welded with a single pass in one side of the plates (top side) while the S5 series was welded by applying two passes: one in each plates’ side (top and bottom side). The welding equipment used was a disk laser Trumpf TruDisk 2000 with laser maximum output of 2000 W, beam wavelength of 1020 ηm, beam parameter product of 2 mm-mrad, fiber diameter of 200 µm and focus diameter of 350 µm. The equipment was used in continuous mode and did not use filler material.
It is important to mention that in the S5 series the welding speed on the top side was different for each sample (1.75, 1.80, 1.90, 1.95 and 2.00 m/min) while the weld pass on the bottom side was constant for all samples (2.50 m/min). The heat inputs used in welding were chosen to achieve different hardnesses in the welded series, but at the same time were maintained at a low heat input to obtain small HAZs, low softening and similar tensile mechanical properties to the BM as shown in [29].
The fatigue crack growth tests were carried out in a Dartec hydraulic machine using the ASTM E647-13a standard [30] as a guideline. The FCGR rate determination for the BM and welded series was achieved with constant load range ∆P tests (∆K increasing) and M(T) specimens’ geometry was used. The samples’ geometry used in the FCGR test can be consulted in Figure 1. As is possible to see in Figure 1, pre-cracks were machined by electrical discharge machining (EDM) and were localized on the underfill (see Figure 2). The specimens were loaded perpendicularly to the weld direction at stress ratio R = 0, at room temperature and with 15 Hz of frequency. The FCGR tests were performed in three conditions: not welded (BM), excess weld removed and both sides removed.
The crack length was measured by optical observation through a travelling microscope (45×) with digital micrometers and the crack growth rates were calculated according to the 5-point incremental polynomial method, following the ASTM E647-13a standard [30]. Once the specimen had a minimum crack size of 1 mm, at intervals with crack size increments (∆a) of 0.25 mm, the number of cycles was registered. During the test, it was verified that the measurements of the lengths of the two cracks did not differ more than 1.25 mm. The stress intensity factor range (SIFR) was calculated according the expression that corresponds to the M (T) specimen given in [30]. The results were displayed as da/dN vs. ΔK curves, only for regime II of the Paris law, for each condition.
In order to consider the crack closure effect on the FCGR, at regular intervals during the crack growth the crack opening displacement (COD) between the two holes localized in the centerline of the specimen (see Figure 1) was recorded using a pin microgauge extensometer. These results were plotted in load vs. COD and the tangent point method was applied to determine the load for which the crack remains fully open, Pop [31].
S–N curves were obtained from dogbone-like shaped specimens with a rectangular cross section of 12.5 × 3 mm. The fatigue tests were performed in the same machine and with the same conditions where the FCGR tests were conducted.
The metallographic analysis was completed through polishing and etching the cross section of the samples. Afterwards, the samples were observed through an optical microscope Leica DM4000 M LED. The reagent used for the etching process was Nital at 2%. The Vickers hardness tests were performed using a Struers Type Duramin-1 microhardness tester, applying 0.5 kg over a 10 s period. Finally, the fatigue fracture surfaces were observed using a stereo microscope and the measurements of the defects were achieved using a profilometer and a microscope equipped with micrometers.

3. Results and Discussion

3.1. Welding Defects and Hardness

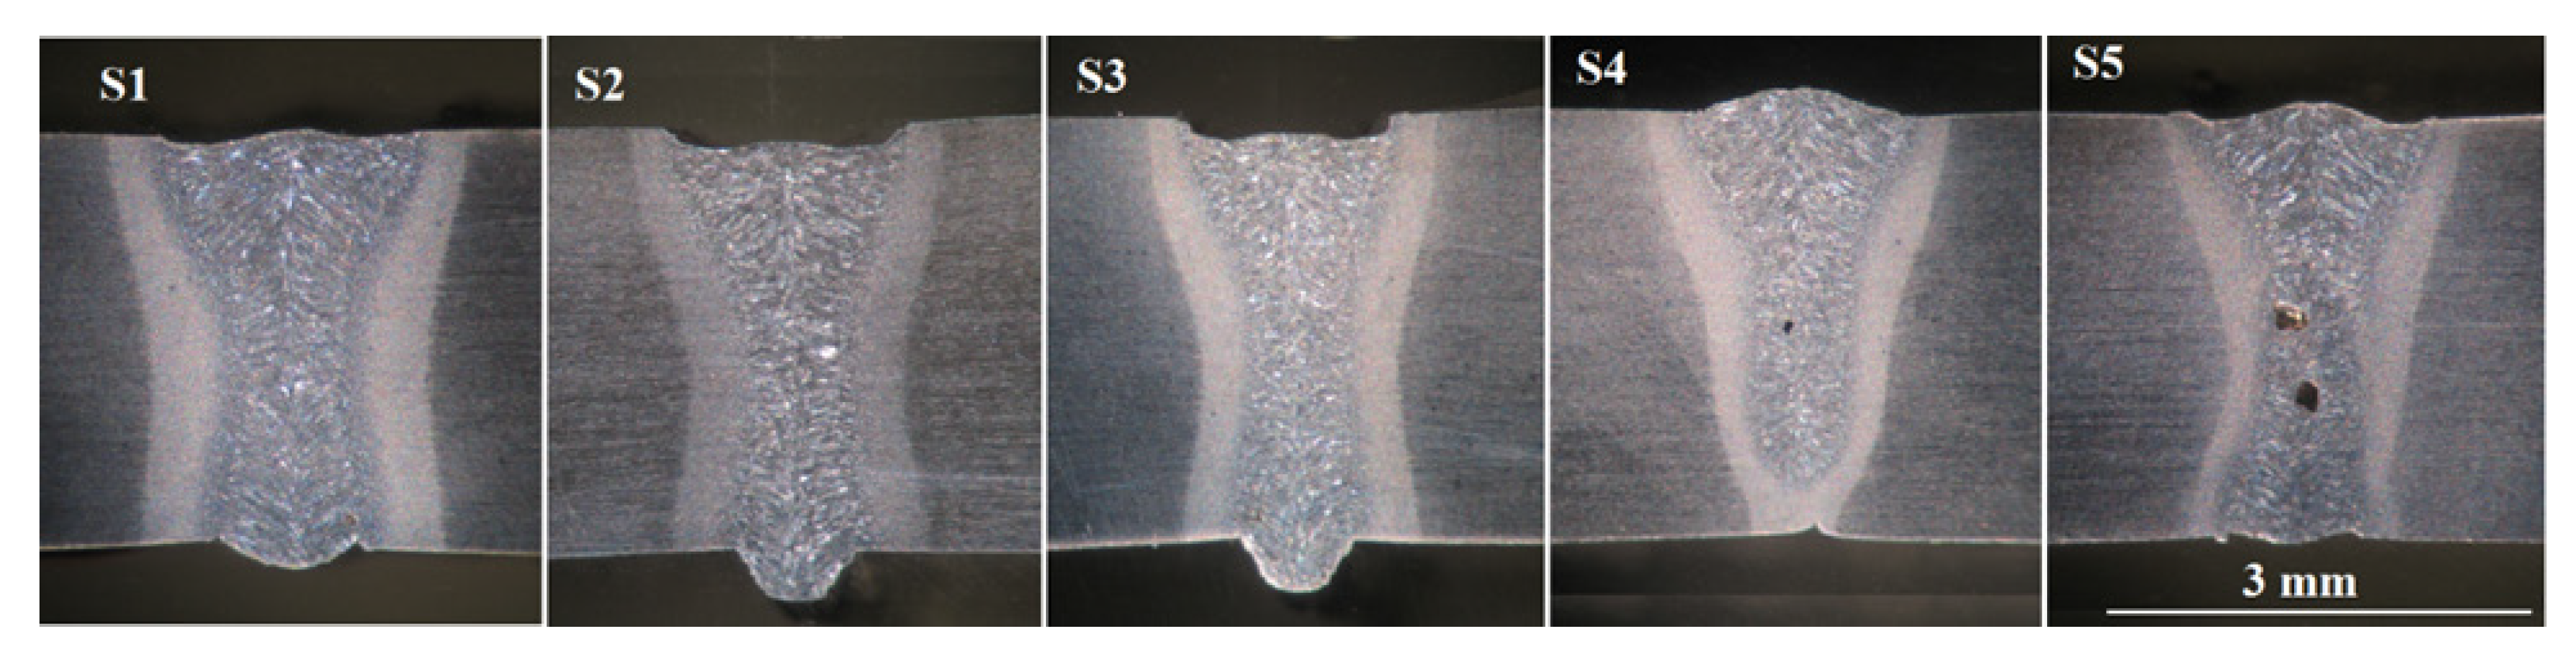
Figure 3 illustrates the macrograph analysis of the welded series, where a different morphology in each series was obtained. The main imperfections noted were: excess weld in the bottom side of the S1, S2 and S3 series and in the top side of the S4 and S5 series; undercuts at the weld root in the bottom side of the S1 and S3 series and underfill and porosity in all series. In [27] it was reported that the series presented quality levels B and D according to the ISO 13919-1 welding quality standard and the imperfection sizes and morphology can be considered as crack-like imperfections. More details about the weld profile and imperfections of the welded series can be found in the previous reference. Due to the S4 series not reaching full penetration it will be omitted in the next sections.
The fatigue cracks occurred in the FZ and the HAZ, for this reason the microstructure, hardness and morphology need to be examined in these zones. 
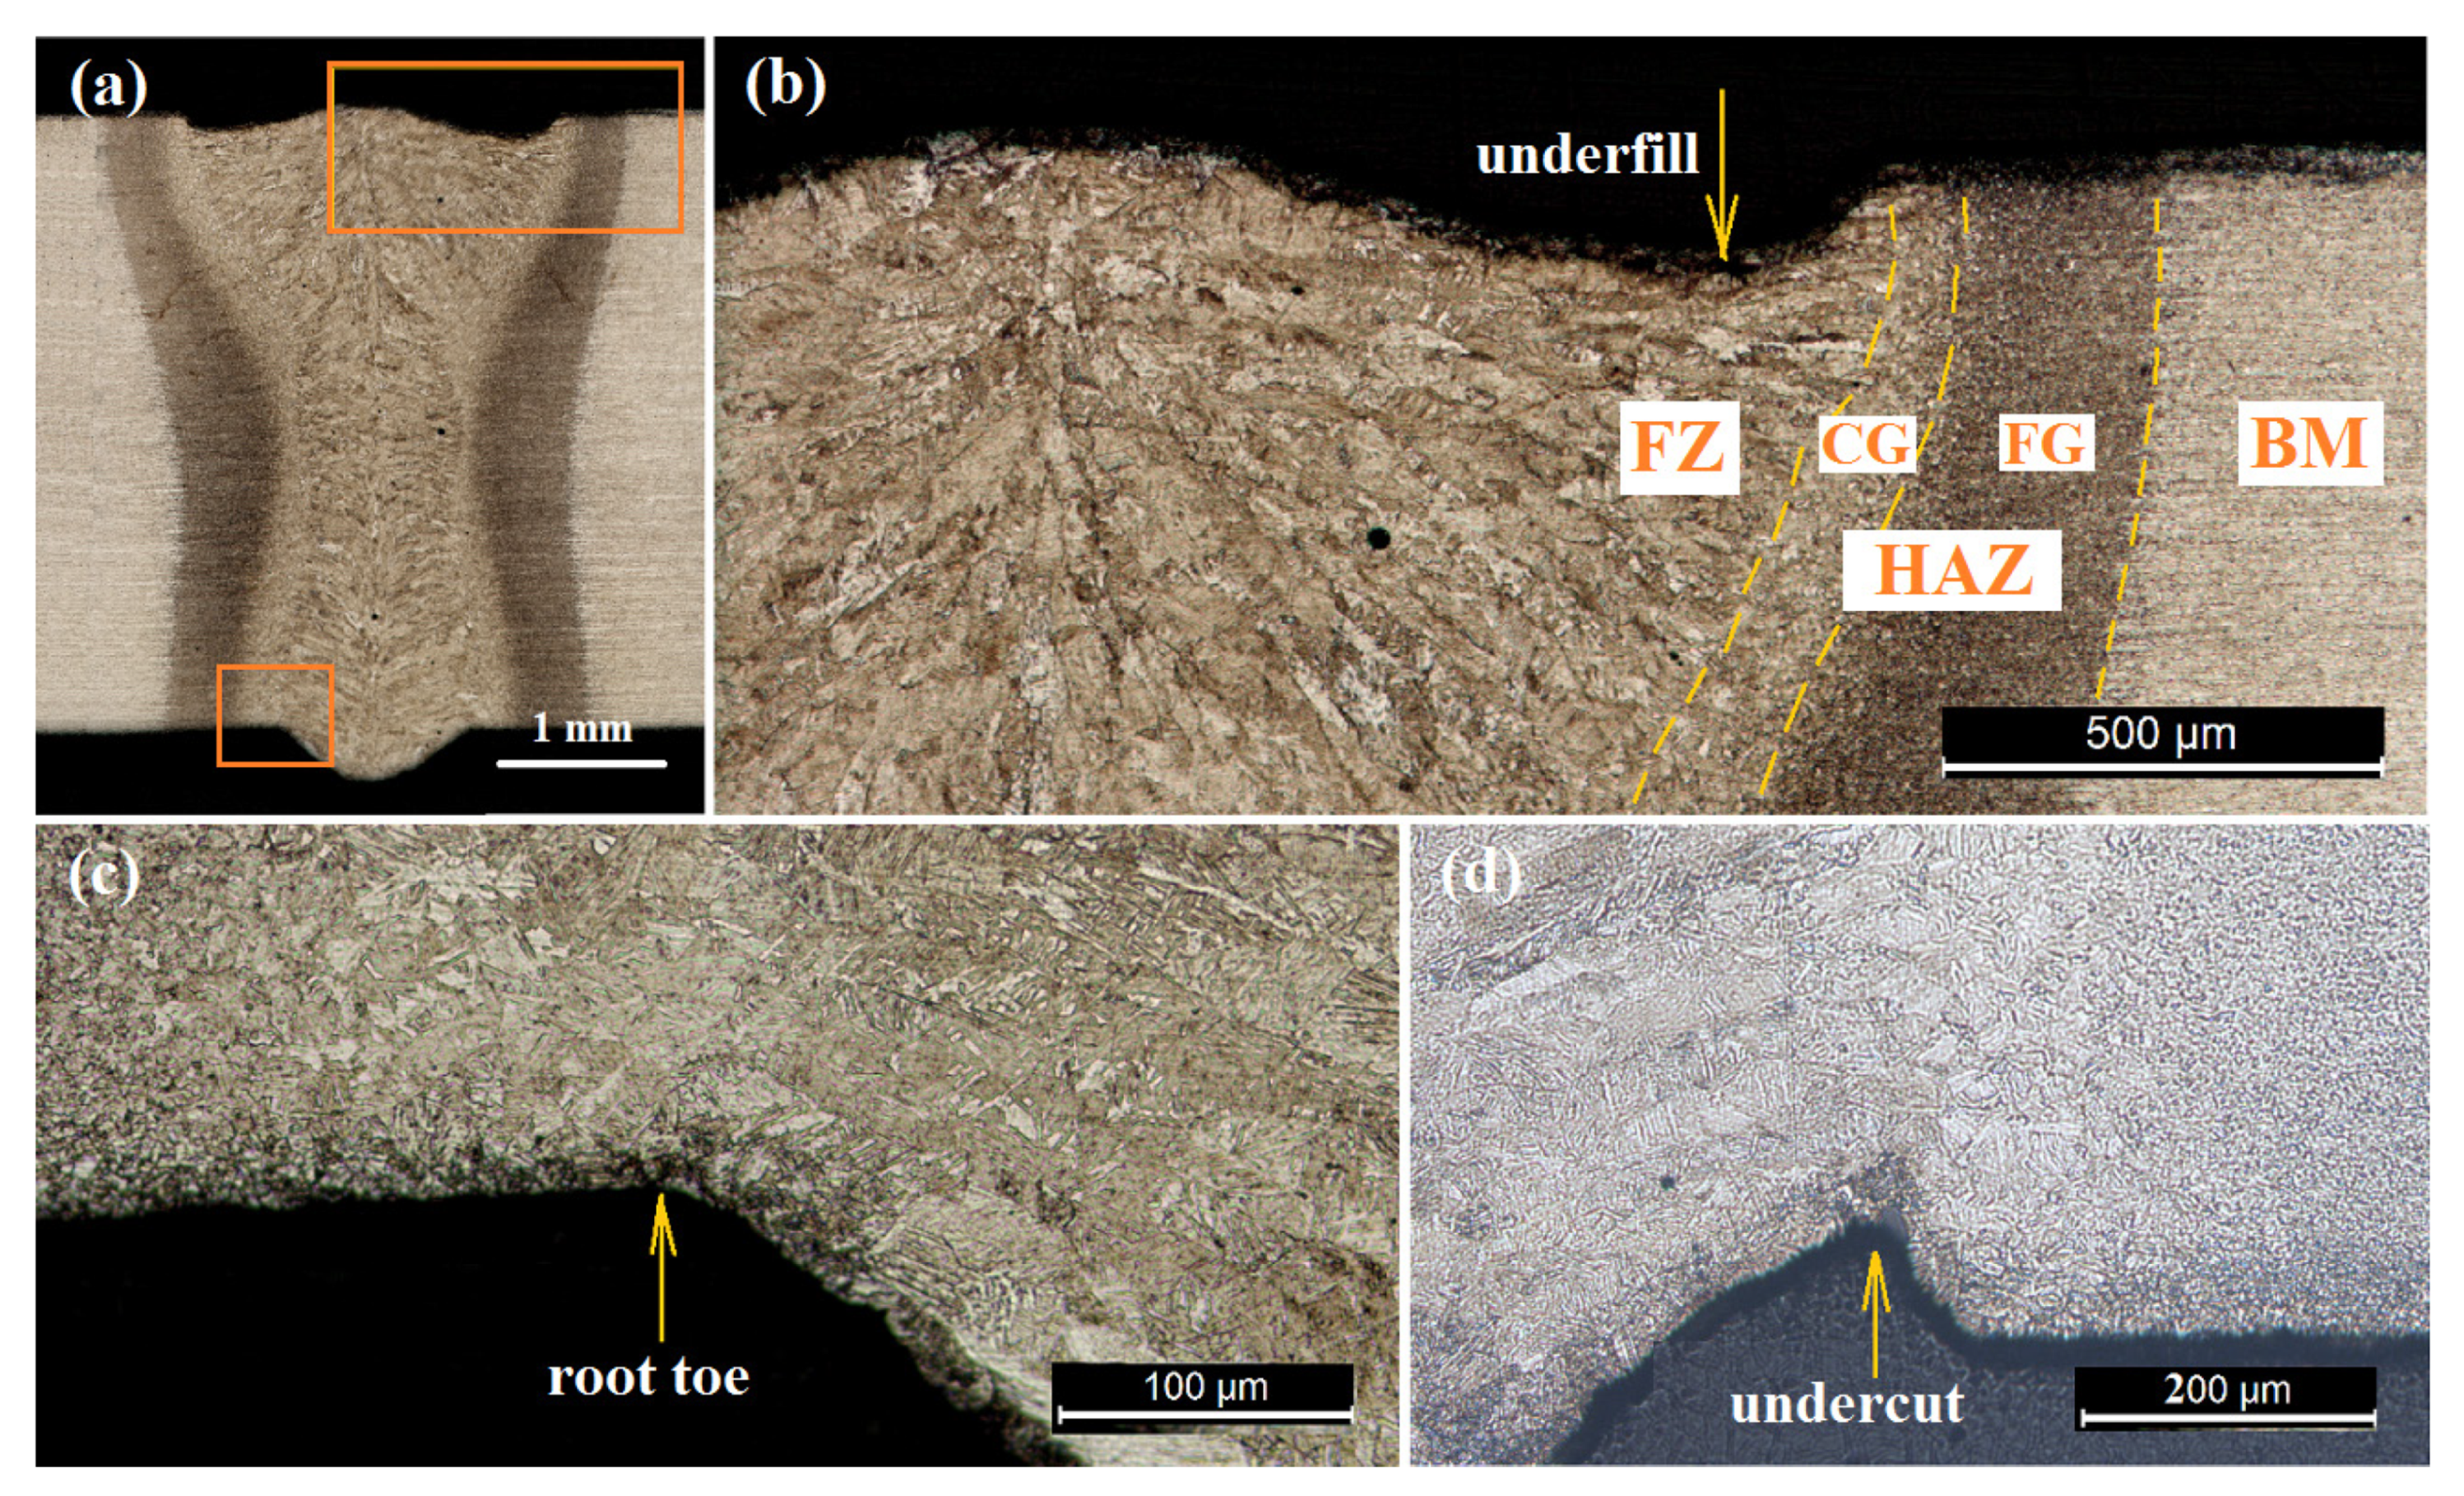
Figure 2 presents a representative example of metallographic analysis where Figure 2b corresponds to underfill defect, Figure 2c shows the toe of the weld root and Figure 2d illustrates an undercut defect. For the heat input range used in the present work, Figure 2b showed that the HAZ was divided into two important zones: softened ferritic–bainitic with fine grain (FG) and bainitic–martensitic with coarse grain (CG) as was found in [29]. Figure 2b also shows the macrostructure of the FZ and the BM.
According to the fracture analysis, the fatigue starts in the weld root and in undercuts located in the boundary between the columnar grains of the FZ and the CG, as well as in the underfill located in the columnar grains of the FZ but very close to the HAZ and in pores located in the FZ. If fatigue crack paths depart from defects as underfill, undercuts and weld root (toe), they could enter the FG that is generally a soft zone.
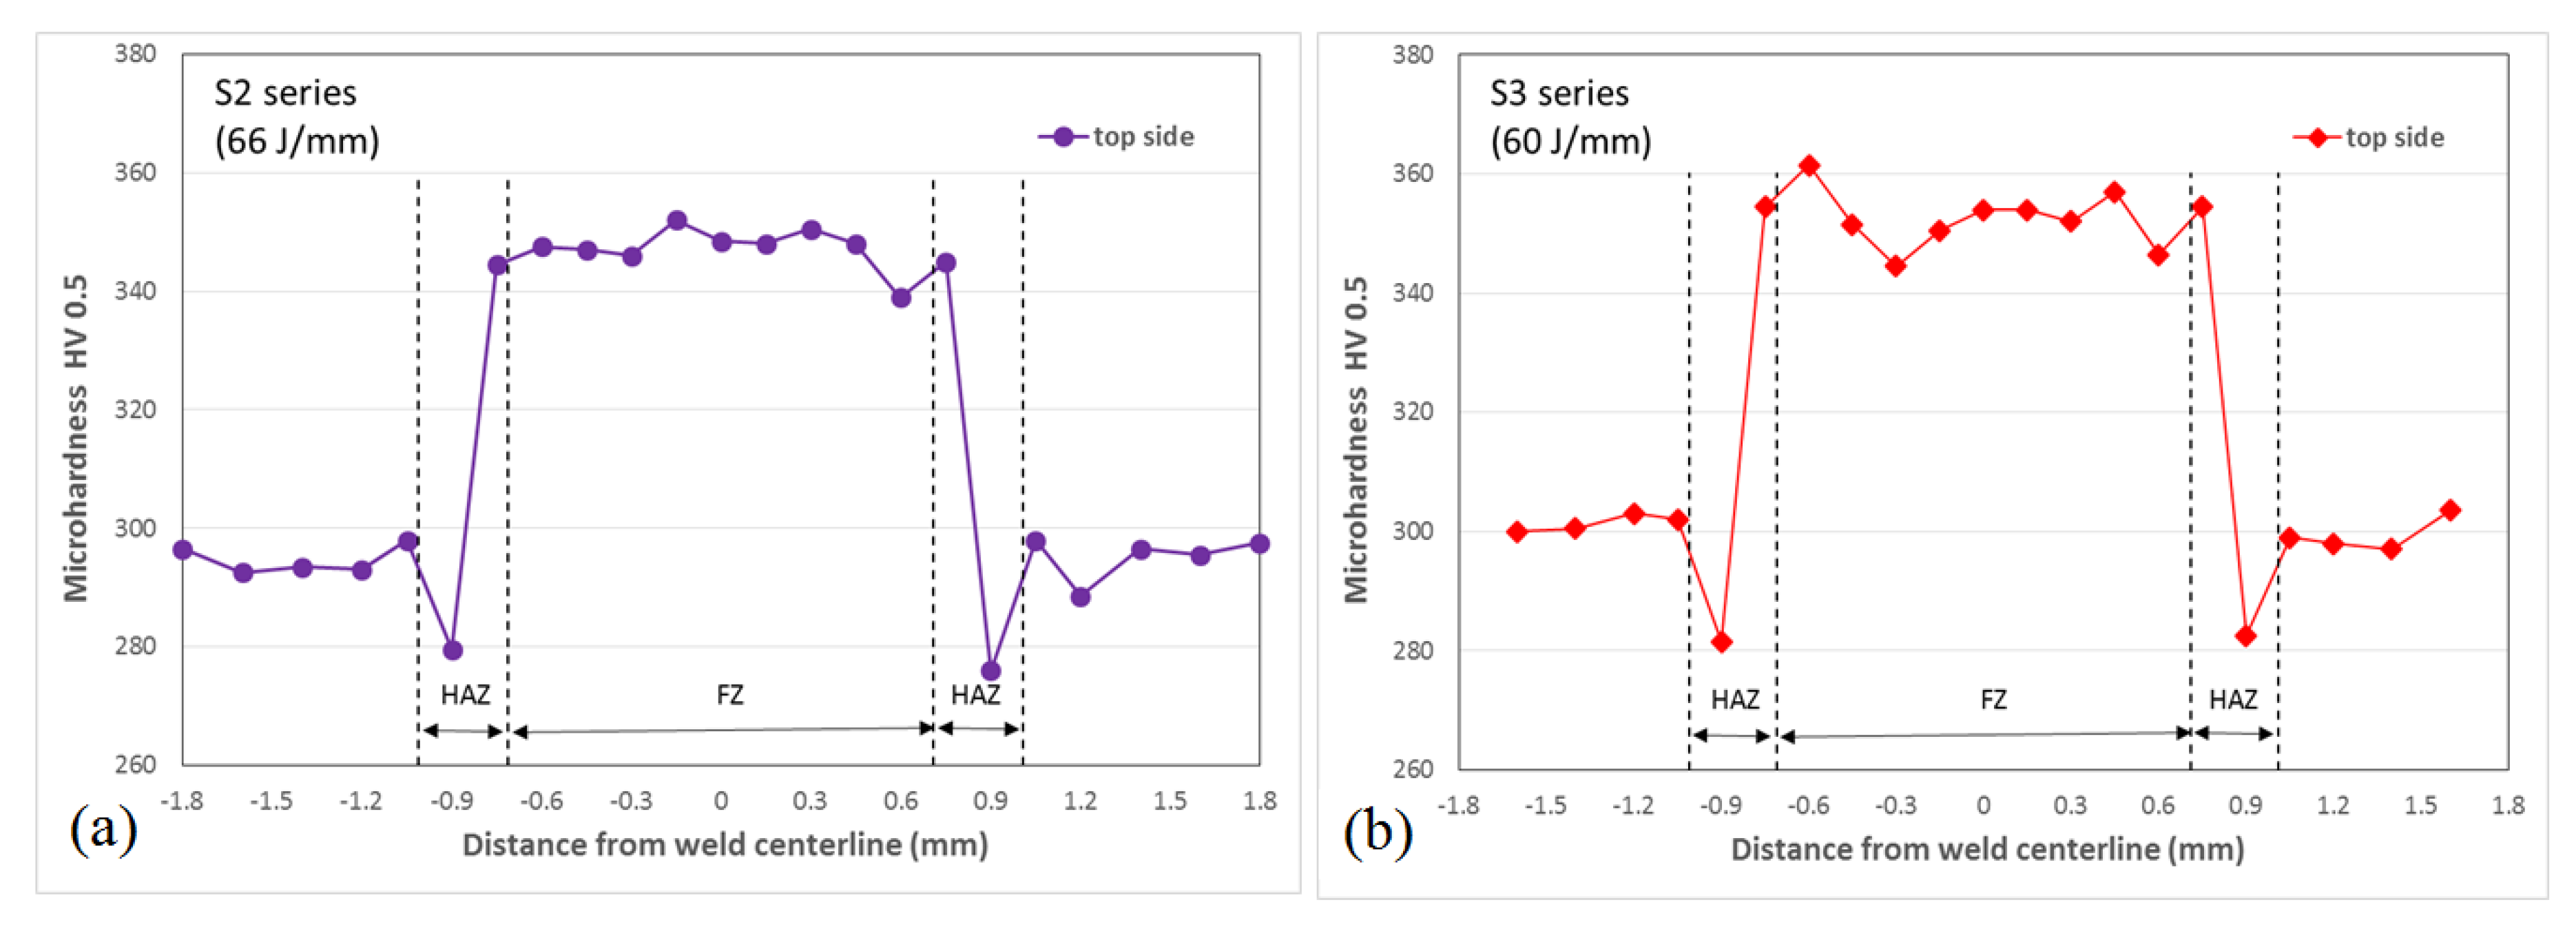
The microhardness presents similar profiles for the different series; a very small softening in the FGHAZ was verified as illustrated in Figure 4 with the hardness profiles of the S2 and S3 series. The hardness increased with the heat input decrease at the FZ and the CGHAZ, but the difference in hardness is minimal in the sites where the fatigue started. For the fatigue start locations, the approximated hardness values were: 335, 345, 350 and 370 HV for the welded series S1, S2, S3 and S5 respectively, and approximately 295 HV for the BM. This increase in hardness can be explained by the quick cooling in the FZ and CG which allowed the bainitic–martensitic microstructural transformation while the FG zone cool down slower modifying the BM microstructure to a softened ferritic–bainitic microstructure.

3.2. S–N Curves

The S–N curves obtained can be analyzed observing Figure 5. The BM presented higher fatigue strength than all the welded series due to a condition that was free of defects and free of stress concentration points. Generally speaking, all series presented a similar fatigue behavior, although the scatter is high and there is some difference in the fatigue limits of the welded series. In Table 3, the S–N parameters, log C and m of the mean curves and the fatigue limits are shown. The fatigue limits were assumed as the maximum stress range values reached by the specimens that exceeded two million cycles (run-outs).
Although each series presented several fatigue failure modes due to the presence of different imperfections in the top and bottom sides, as well as on the lateral side and inside the weld bead due to the presence of pores; a dominant failure mode, strongly related to the imperfection with the highest stress concentration factor, was observed for each series.

3.3. Fatigue Crack Growth

Figure 6 shows the FCGR found for each series using two specimens in which the notches were cut on the underfill of the weld beads, seeking to agree with the sites where the failure occurred in the fatigue testing. As can be seen for the S1, S2 and S3 series, the specimens that were smoothed on both sides (two-sides-removed condition) showed a slightly slower crack growth rate than specimens smoothed only on one side (excess-weld-removed condition). In the case of the S5 series, even though the two specimens were prepared as the other series, the initial equality and subsequent greater difference (from the dotted line in the S5 series) observed in the crack growth rates could be explained once the crack paths and fractured surfaces were examined. For the specimen with faster crack growth rate, it was found that the direction of the growth of the cracks gradually deviated from the FZ towards the BM and therefore the crack growth rate of the upper part of the curve correspond to the BM. In what concerns the specimen with a slower crack growth rate, the change in the slope was due to a large difference between the crack sizes (exceeding the limit for the test validity) as one of the crack fronts was affected by porosity while the other was not.

3.4. Crack Opening Displacement and Crack Closure

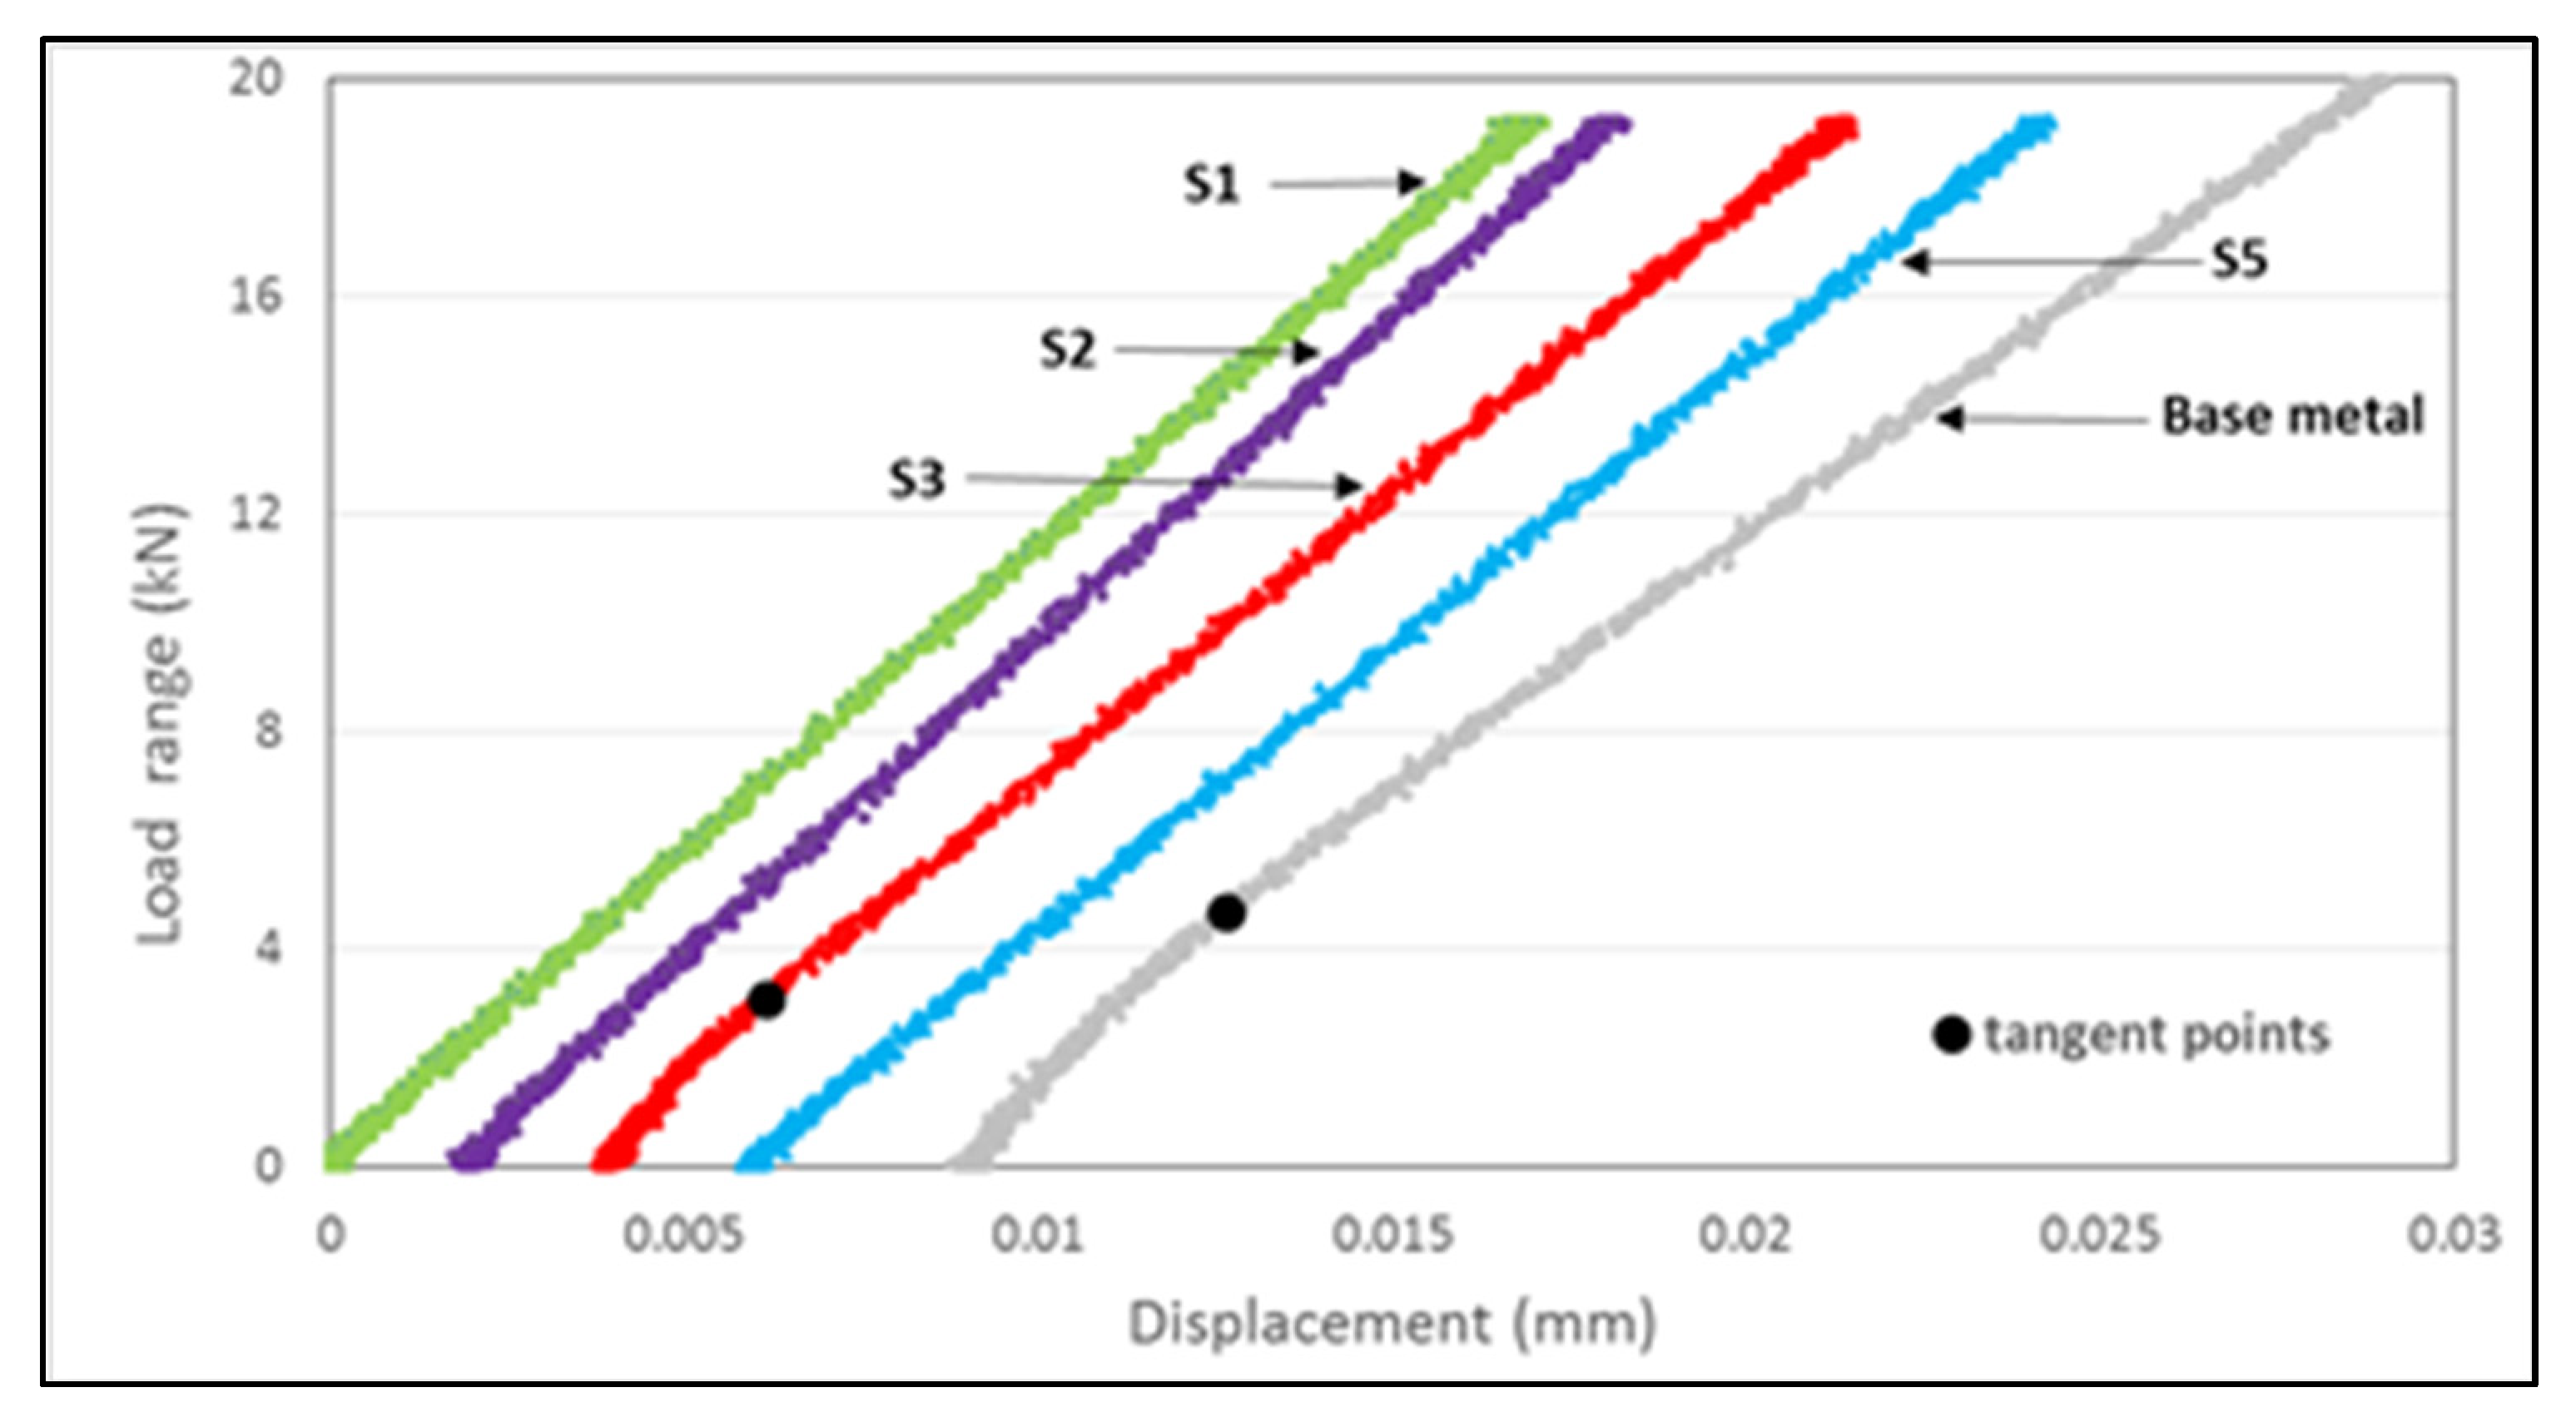
The ∆P-COD example curves of the welded series and the BM plotted in Figure 7, where the non-linear part of the curves were marked by the tangent points, illustrate a different behavior in relation to the crack closure phenomenon: the S1 and S5 series did not present crack closure, in the S2 series it was so minimal that in practice it can be considered null, while in the S3 series and in the BM this phenomenon was presented, but, in a different way. In the crack size range of 1–12 mm, for the BM, the load range at which the point of tangency occurred was approximately constant, meanwhile, for the S3 series, the load range increased and subsequently decreased.
Should the crack tip plasticity be assumed as the main cause of the crack closure, the behavior observed could be explained considering the hardness and ductility of the microstructures. The BM has low hardness and good ductility while the welded series had propagation paths in the HAZ and the FZ where the hardness was high and therefore the ductility was low. On other hand, it has been explained in [32] that due to the presence of residual tensile stresses, there is no crack closure. The particular behavior of the S3 series could be caused by the crack path that also crossed the FGHAZ (which is softer) since the weld bead size was smaller than in the other series, and there could be residual compressive stresses presents in this series that contribute to the crack closure as reported in [32].
According to the above results, and considering the average of the load ranges values ∆P where the tangent points were observed for the crack sizes from 1 to 12 mm, the crack opening stress range ∆Sop and the ∆Keff/∆K ratio were calculated for the BM and the S3 series. The results are respectively: 24.43 MPa, 0.82 and 15.94 MPa, 0.89; meanwhile for the series S1, S2 and S5, the values of ∆Sop were assumed equal to zero and therefore the ∆Keff/∆K ratio equal to one.
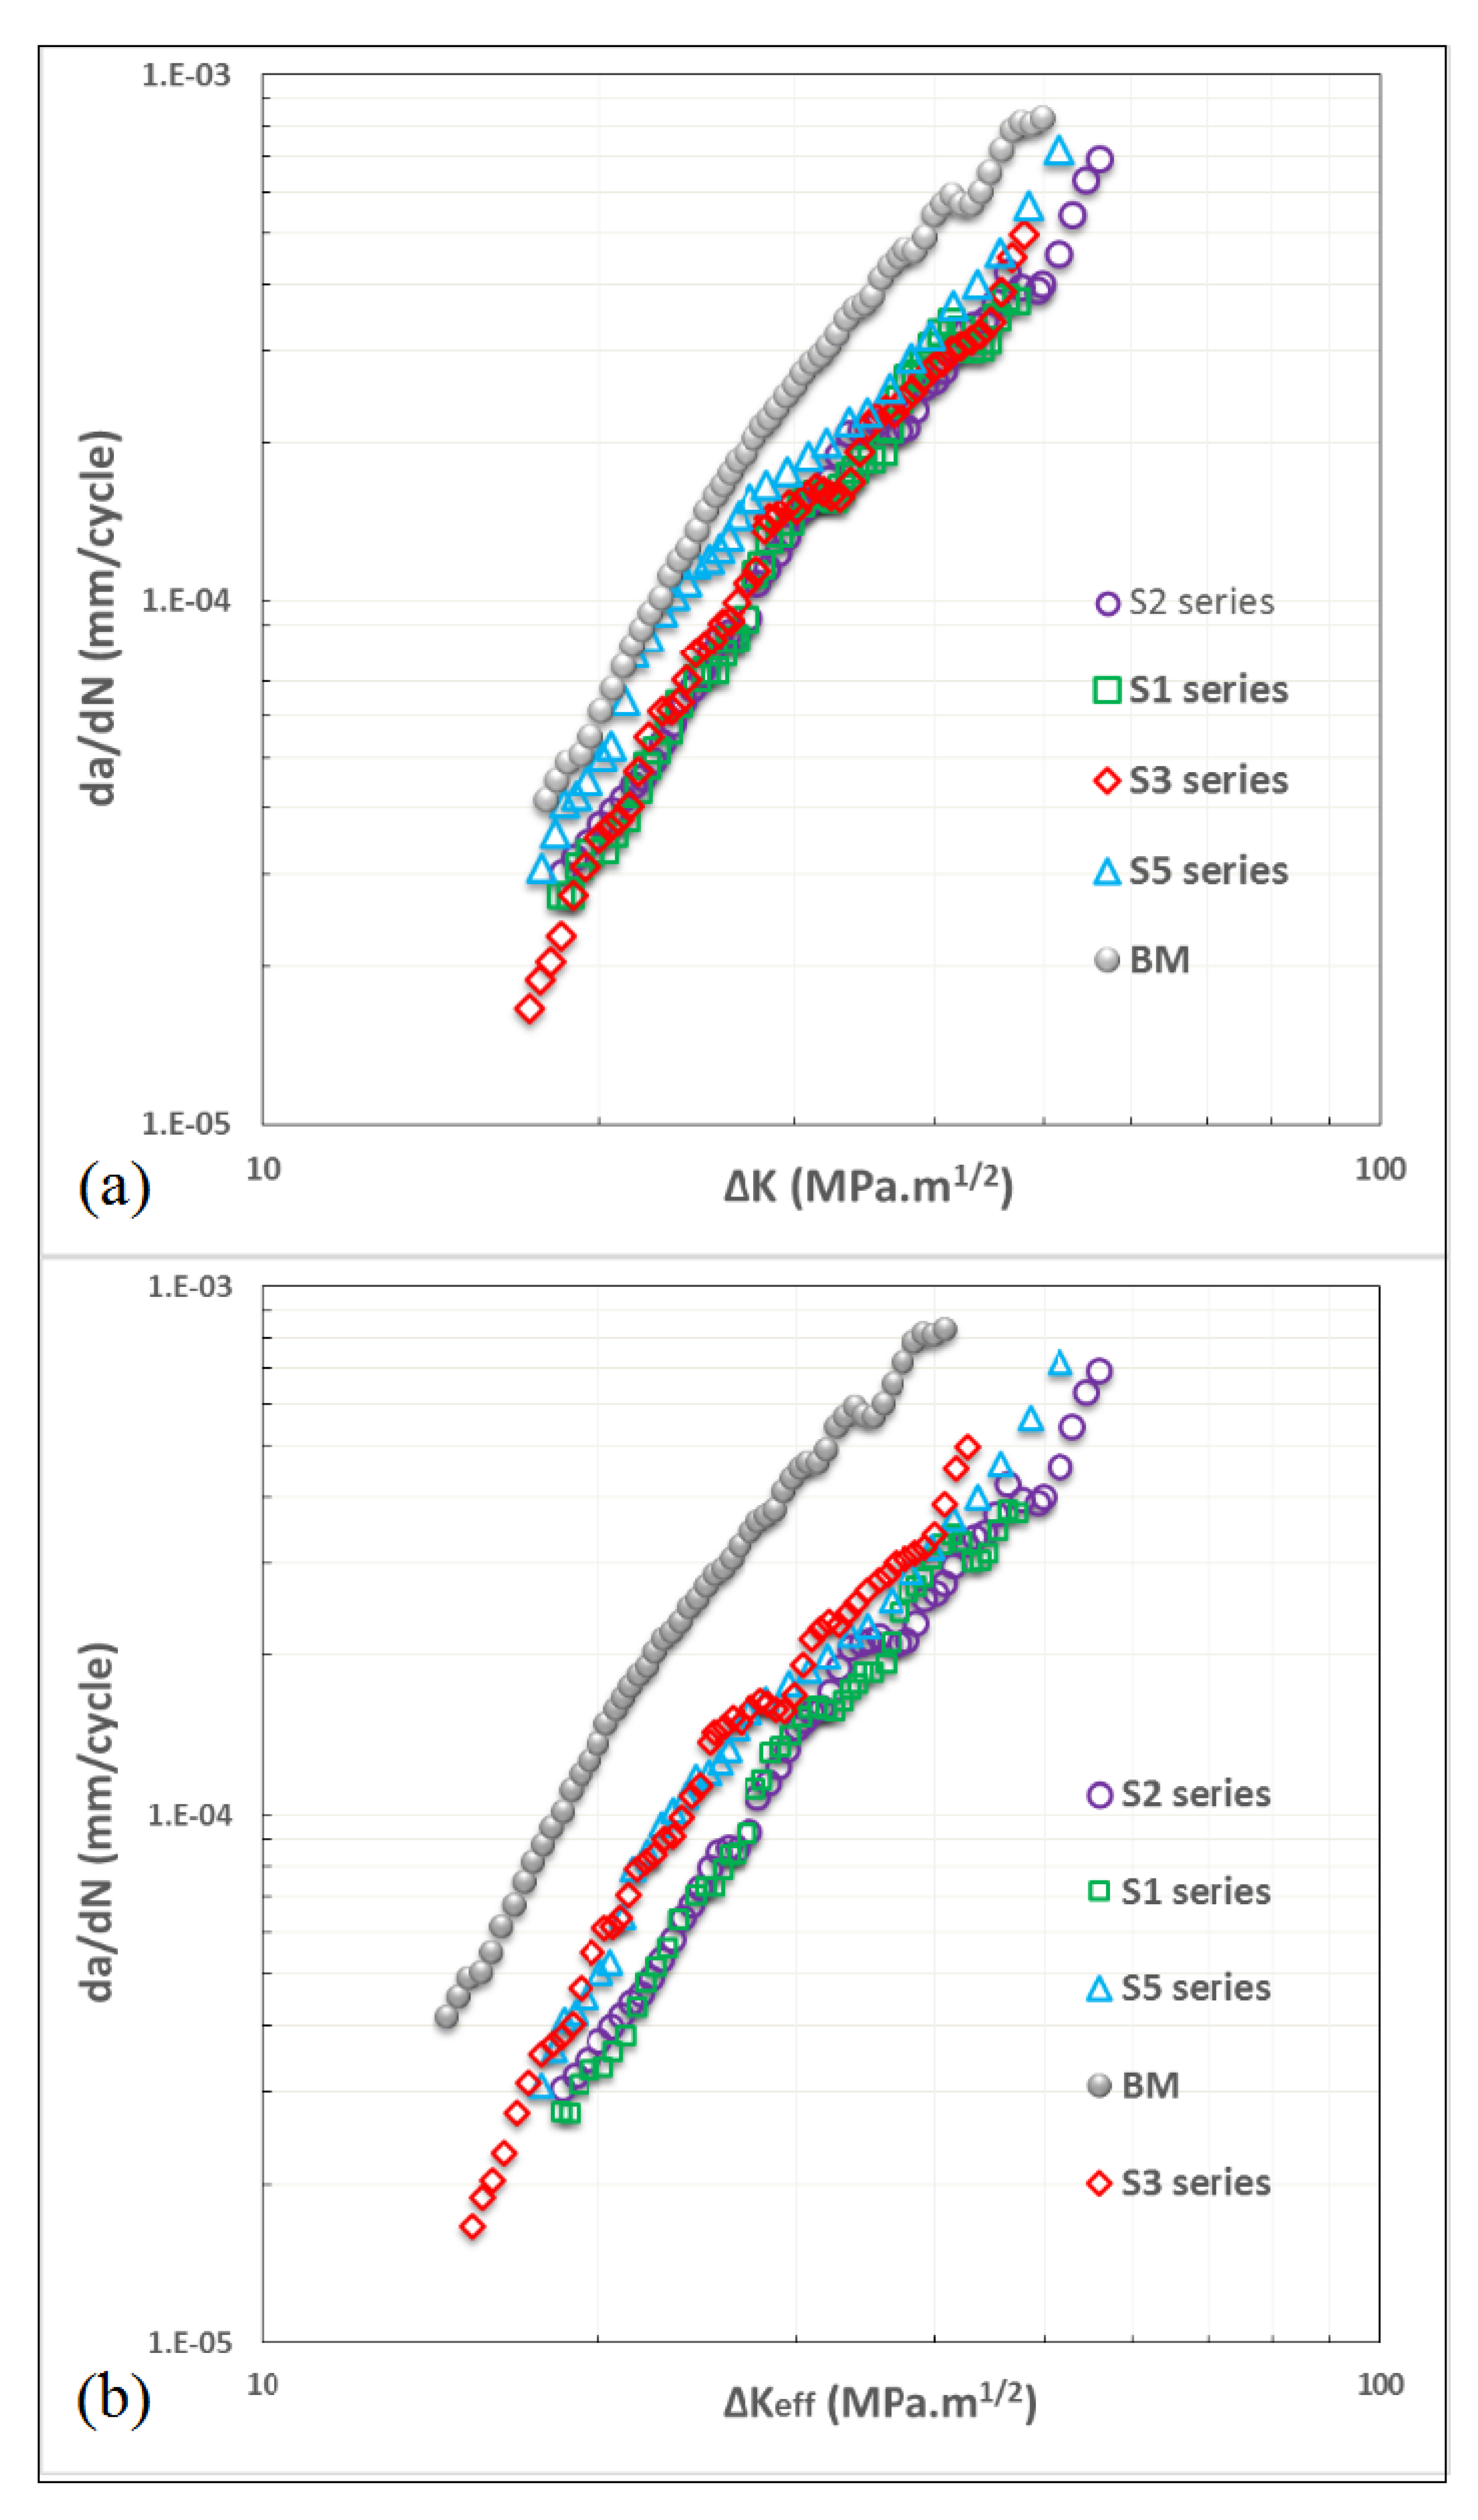
The crack growth rates in the function of the stress intensity factor range (SIFR), of the specimens from which the excess weld was removed and of the BM, are shown in Figure 8a. As can be seen, the S1, S2 and S3 series had practically the same crack growth rate, the S5 series had a slightly higher rate than the previous ones, while the BM had the highest crack growth rate due to having a lower hardness as was described previously. With the ∆Keff/∆K ratio already obtained, for the BM and welded series the effective SIFR, ∆Keff, was determined and the da/dN-∆Keff curves were redrawn (Figure 8b). Table 4 shows the parameters A and n of the Paris law for the welded series and the BM.
The results found for the welded series suggest that weld ripples, porosity, residual stress and the microstructure were factors that influenced the crack growth rate. In relation to weld ripples, even though the effect was very small, their size and shape can modify a more or less straight path to a zigzag one and therefore the propagation line [33]. Since the BM microstructure was constituted of ferrite–bainite, while the welded series basically constituted of mixtures of bainite–martensite [29], there is a clear effect of a decrease in the crack growth rate that can be attributed to the microstructure due to the higher proportion of bainite and the presence of martensite. This agrees with the works [34,35] where a retarding effect was reported in the growth of cracks due to the presence of hard phases such as martensite and bainite. Regarding porosity, this factor requires a better study since, as noted, only one of the cracks was affected by this factor. In summary, since it is recognized that the phenomenon of crack growth is more influenced by the bulk properties than by the surface properties, the microstructure, the hardness and residual stresses could affect the crack growth rate to a greater degree while the effect of weld ripples was minimal.

3.5. Effect of Imperfections at High Stress Levels

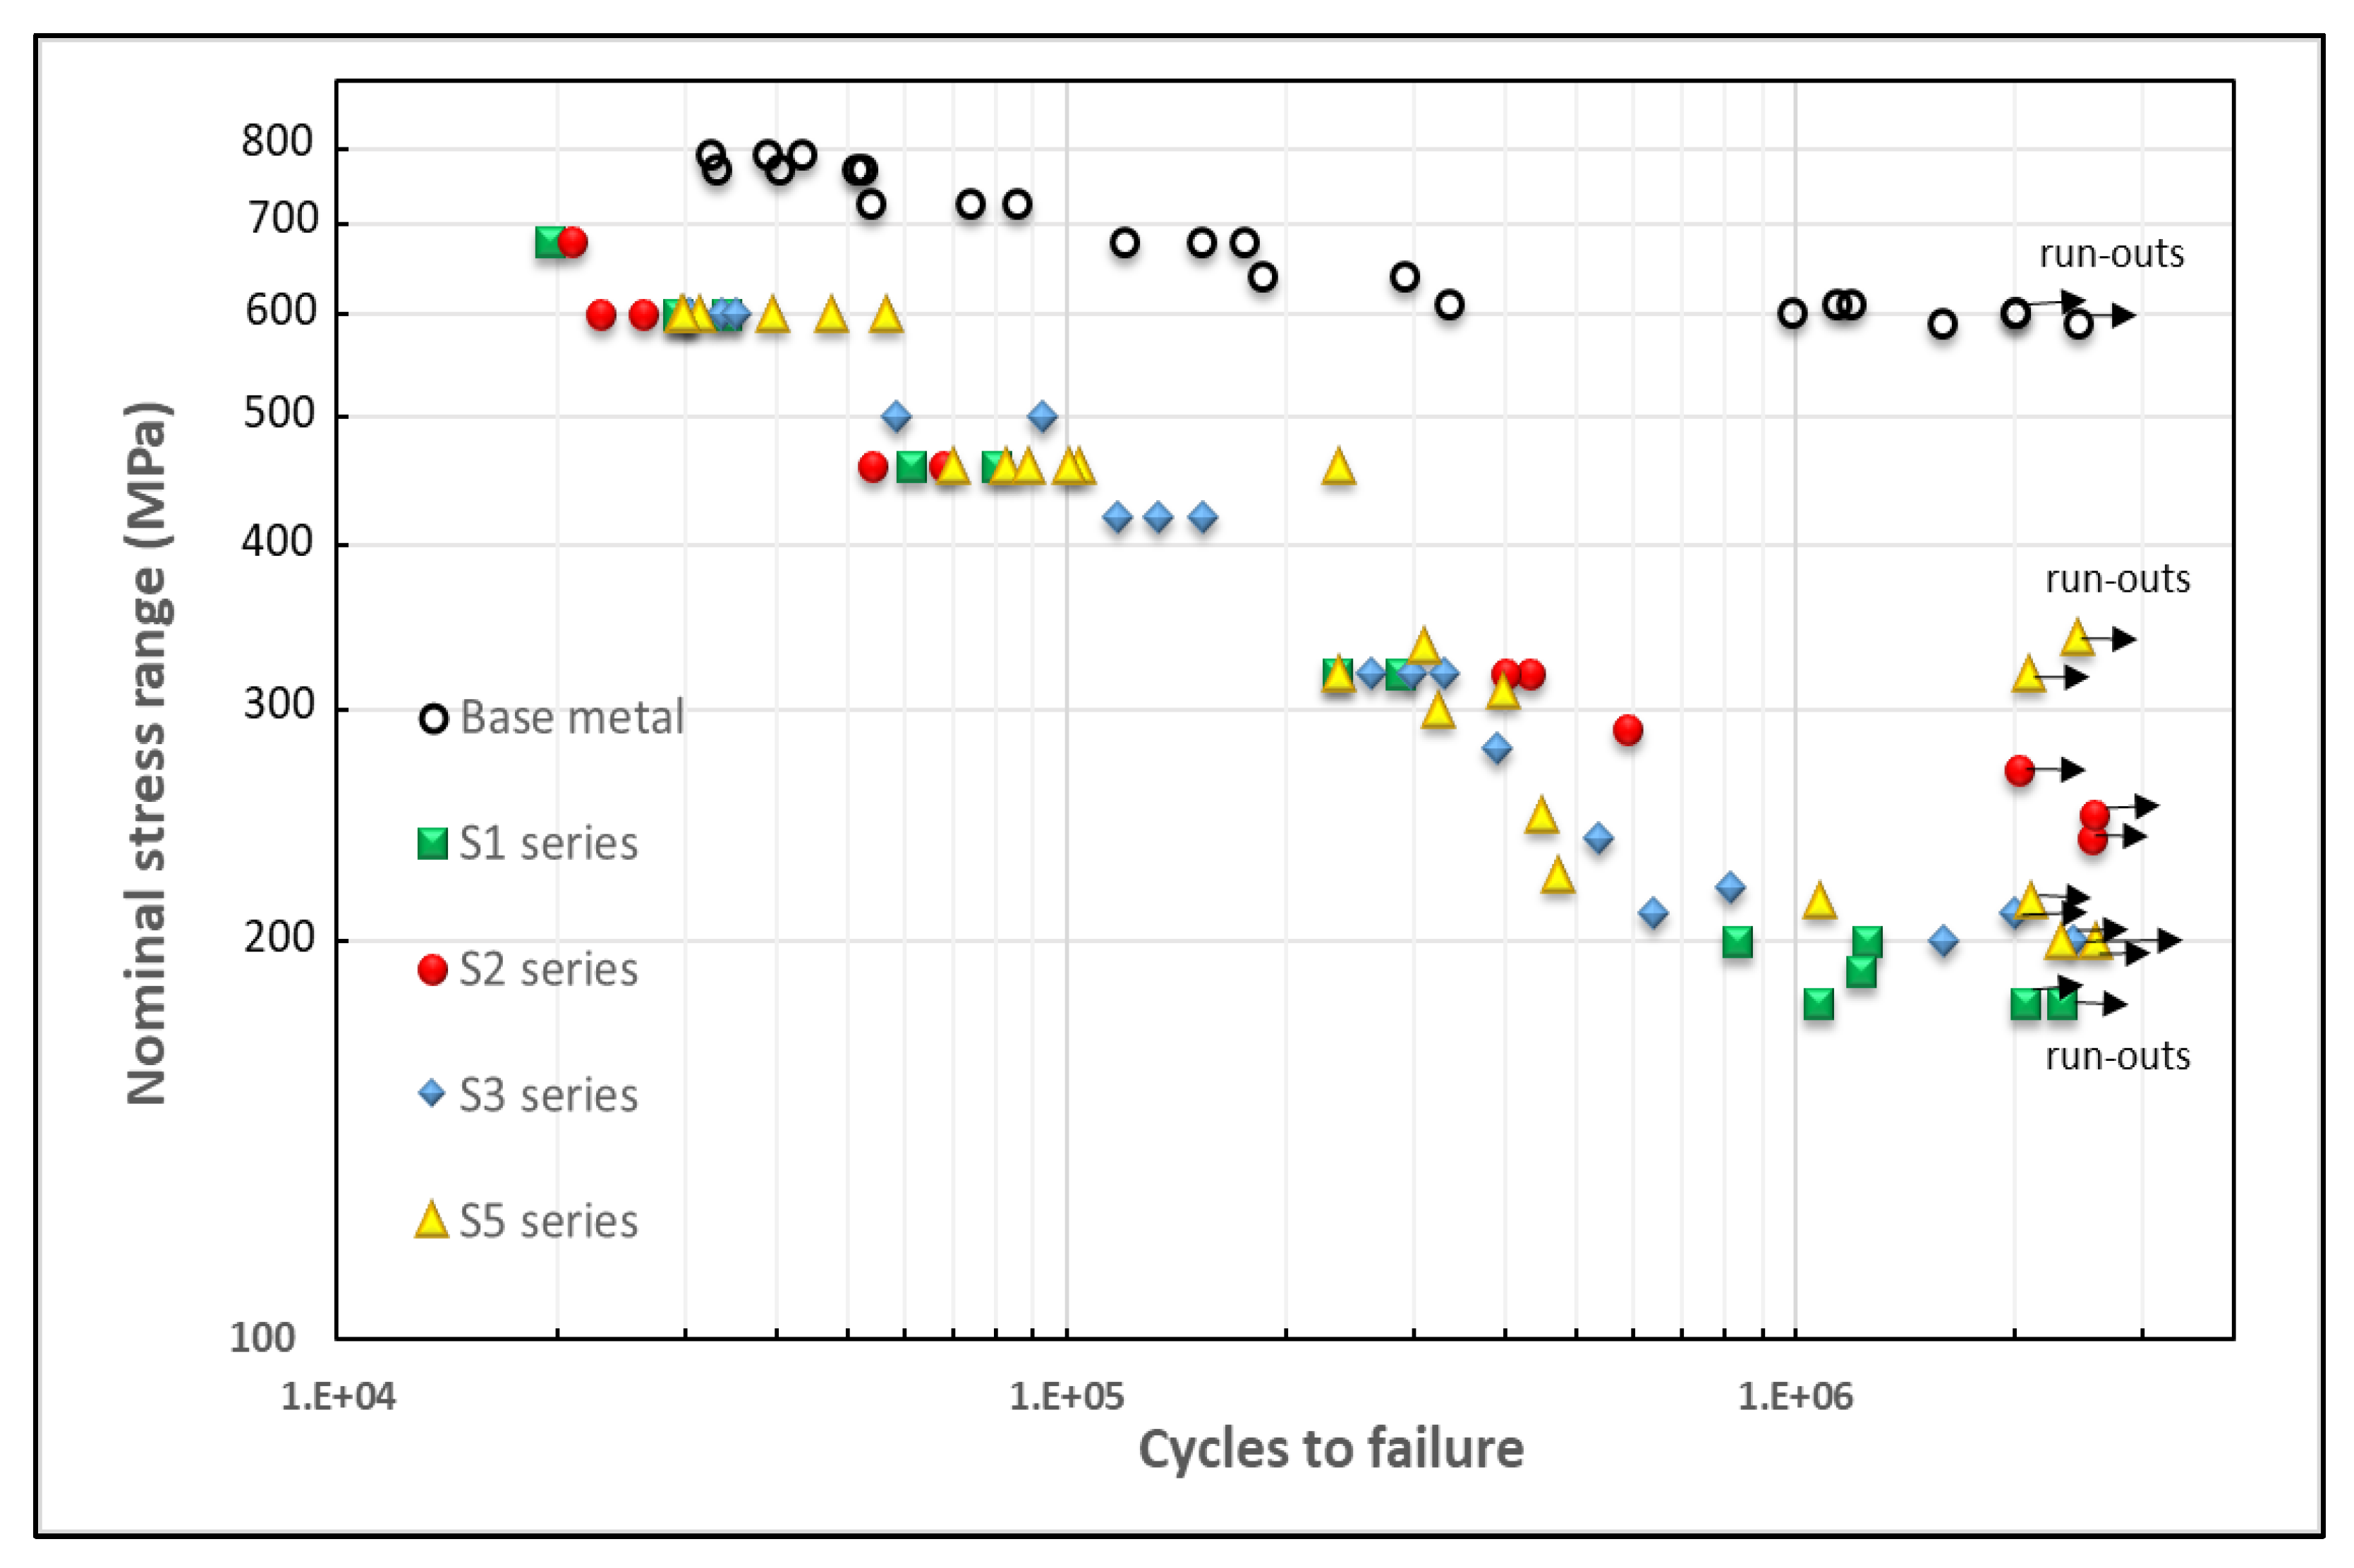
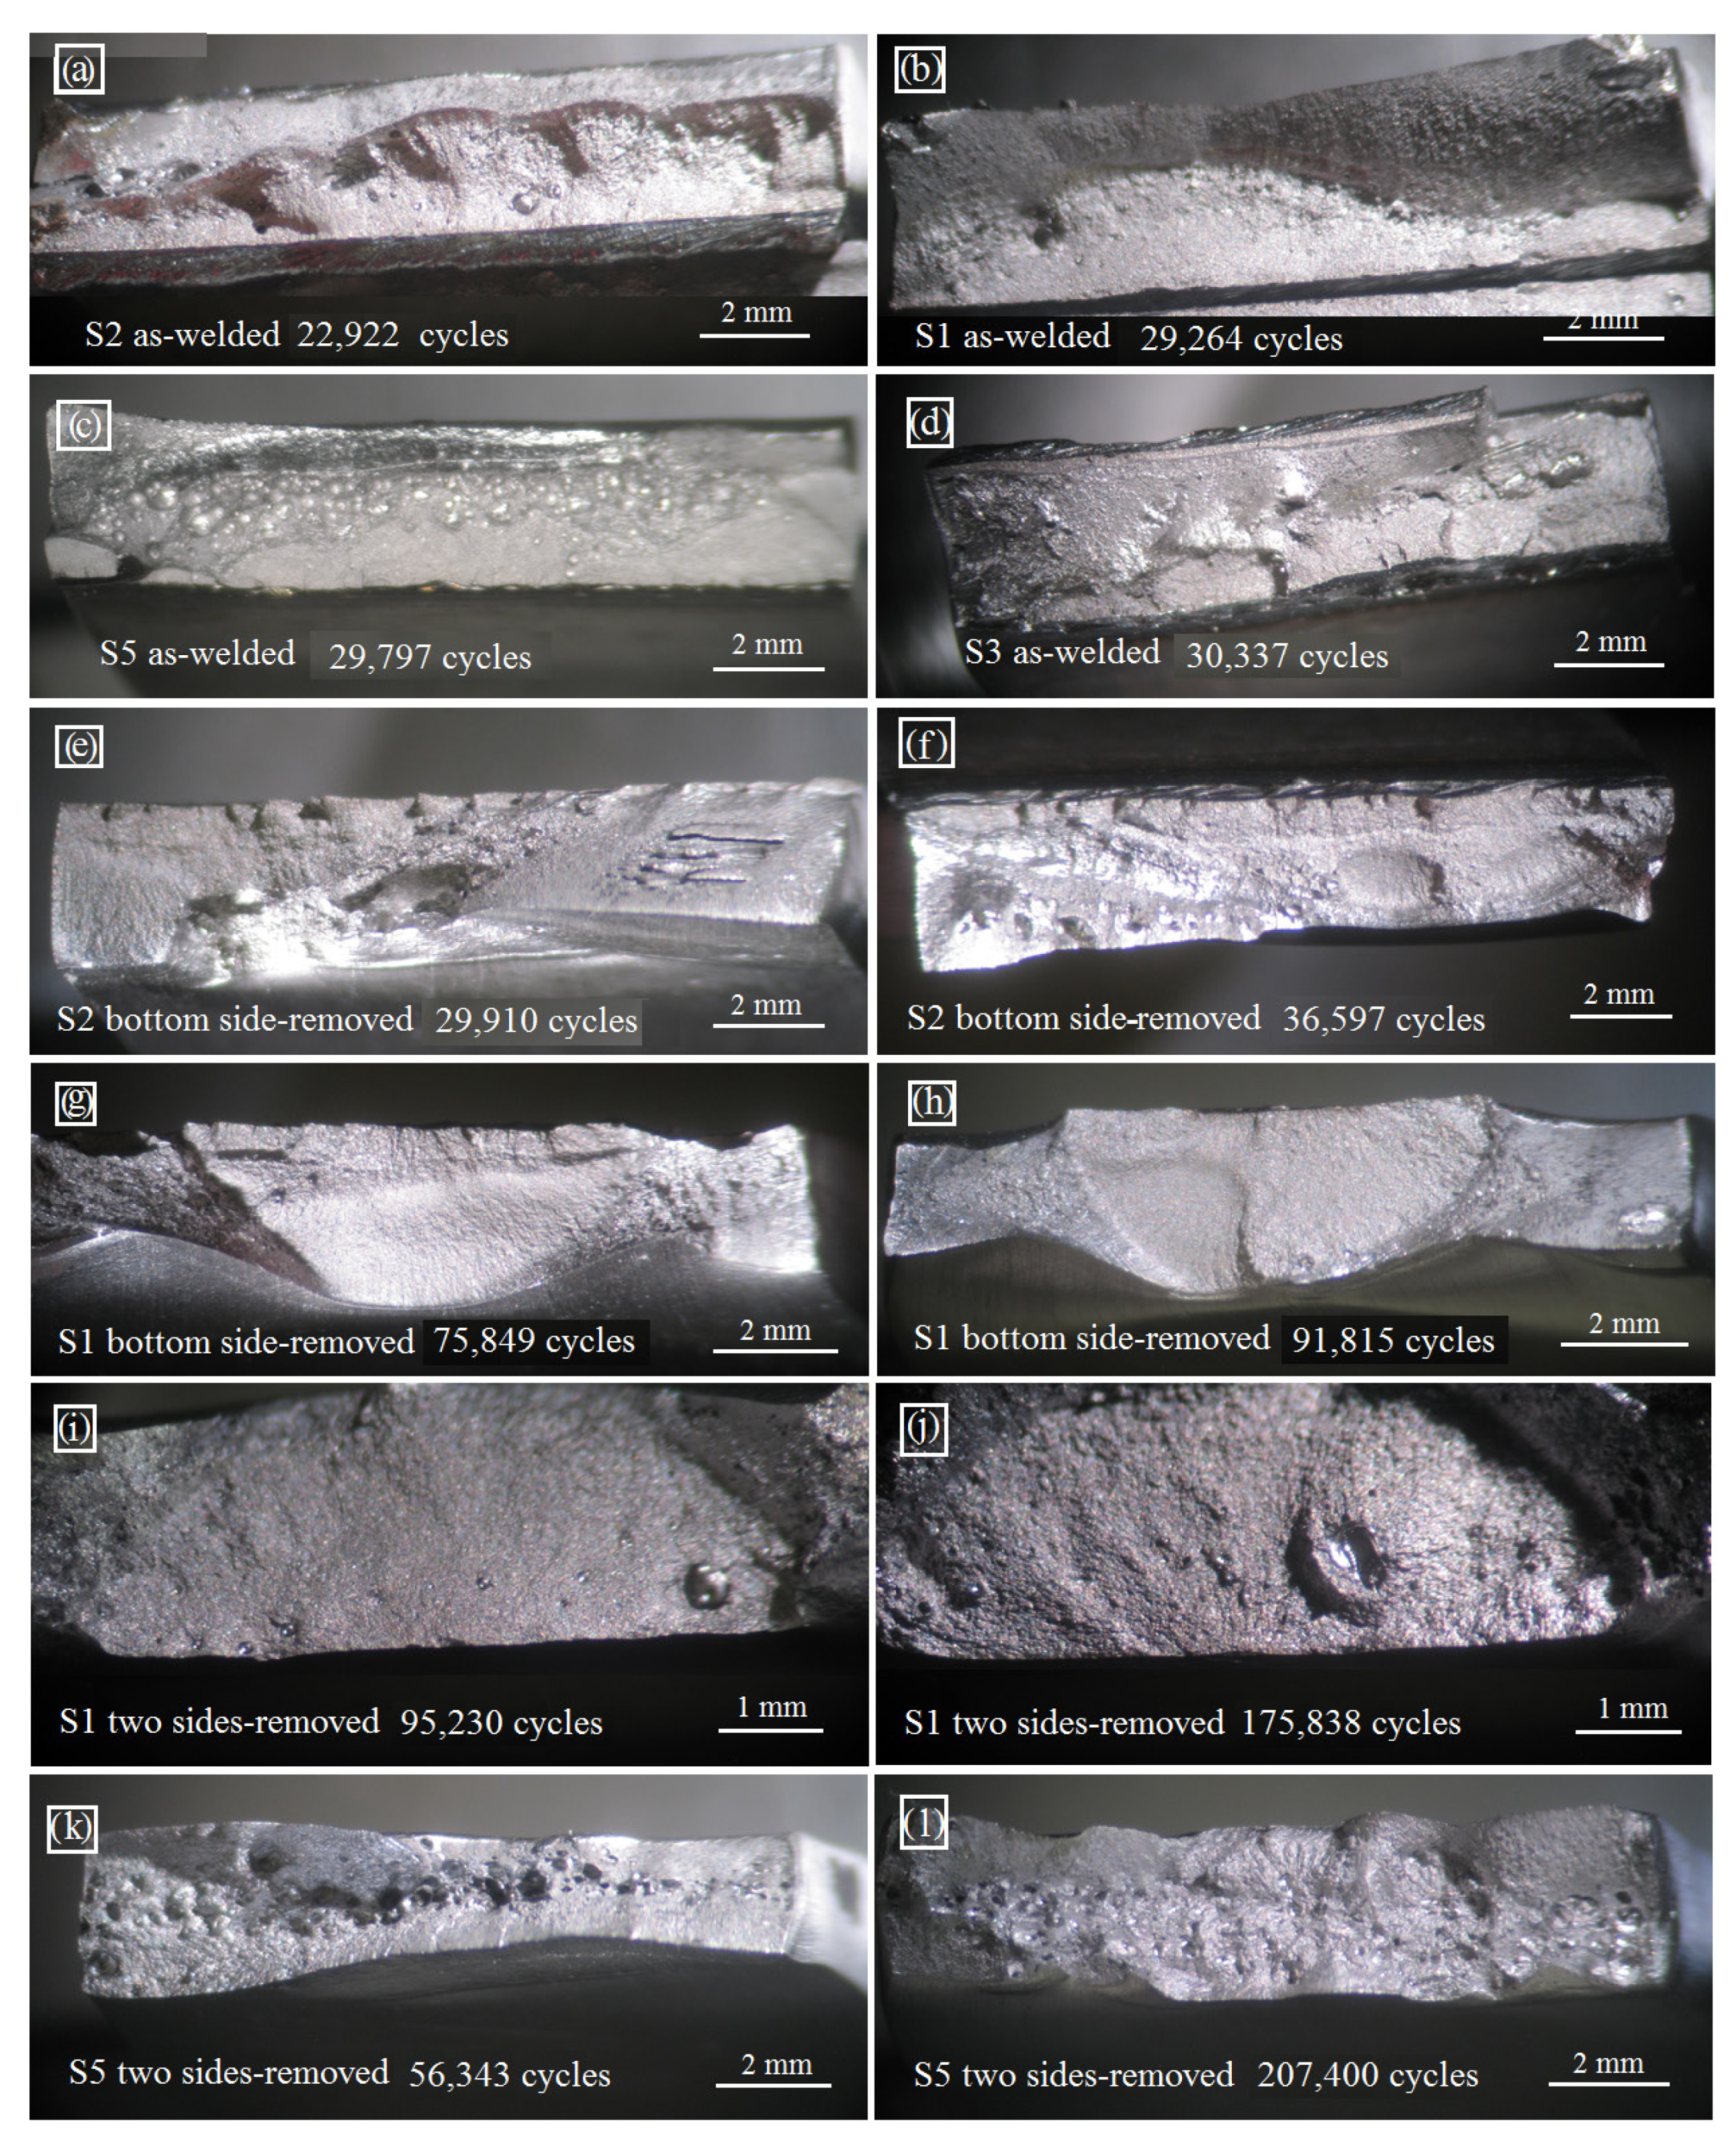
As already mentioned, the welded series presented several imperfections that can be considered as crack-like imperfections; there were fatigue beginnings at the weld root in the toe and in the undercuts, as well as in the underfill and pores. The fractured surfaces of all specimens at the stress level of 600 MPa were examined and it was found that the size, quantity and the location of imperfections are important to explain their fatigue lives, as described below with the specimens shown in Figure 9.
In Figure 9a–d, the specimens of all series in the as-welded condition show, as a principal characteristic, that the fatigue failure occurred covering the entire width of the specimens and the fatigue lives were similar with the exception of specimens of the S2 series, which had a shorter life. The latter is due to the fact that unlike the other series, where the starting points of fatigue were observed in cracks that grew semi-elliptically, in the S2 series, the growth of this type of crack was not evident and there was practically only one crack front growing in depth along the width of the specimens. A similar failure mode was reported in [36] where by the high density of undercuts, one straight-fronted crack was the cause of the great reduction in fatigue strength.
In Figure 9e,f, the factor that seems to influence the shorter life (29,910 cycles) of one of the two specimens of the S2 series in the bottom-side-removed condition is the location of the failure starts toward the corner and the principal fracture surface on the lateral side of the specimen. Meanwhile, although the specimen with the longest life (36,597 cycles), presents fatigue starts that cover almost the entire width of the specimen, it was possible to observe a small growth until it coalesced and then a single semi-elliptical crack grew to the fracture. This last fact marks the difference of this specimen with the others of lesser lives, see Figure 5.
In Figure 9g–j, the fatigue lives of these specimens increased considerably in relation to the previous specimens presenting large and semi-elliptical fatigue cracks located centrally. The differences observed in the fatigue lives between the two specimens in the bottom-side-removed condition are: the size and number of fatigue starts. The specimen with the longest life (91,815 cycles) had a single large visible start while the one with the shortest life (75,849 cycles) had several starts that were smaller that coalesced. However, it can be seen that the width after coalescence is greater than the width of the start of specimen with the longest life and there is also a little difference in the final aspect ratios (depth/length). The increase in the fatigue lives of the specimens presented in Figure 9i,j and the differences between them are explained in a similar way to the previous specimens: they are due to the fact that the size of the fatigue starts decreased significantly, which, as seen in the photographs, are a bit more difficult to identify despite the higher magnification. For these specimens it should be clarified that although the elimination of imperfections on both sides of the weld beads was verified through the microscope, the small imperfections that appear in the photographs may correspond to subsurface imperfections that did not disappear through the grinding applied to the specimens. In the work of [20] this issue was also reported.
In the last specimens of the S5 series shown in Figure 9k,l, it is relevant that once the imperfections on both sides of the weld beads were removed, the fatigue failure corresponded to pores; surface pores located on the lateral side for the specimen with shorter life (56,343 cycles) and internal pores for the specimen with longer life (207,400 cycles). The apparent scatter previously mentioned for these specimens is actually the effect of the location of the pores in the specimens, as reported in the literature for pores near the surface and for internal pores [37,38]. From the previous review on fractured surfaces, for the stress level examined, it can be inferred that in the fatigue life the type and shape of the imperfections are less important than the size, quantity and location, and there was a certain order in the fatigue lives of the specimens, from the lowest to the highest: a continuous very small surface imperfection along of the width of specimen; various surface imperfections covering the width of the specimens or imperfections near to the border that produce fatigue in the lateral side, but growing semi-elliptically; surface pores or pores near to the surface in the lateral side; one big or a few small surface imperfections that do not cover the width of the specimen, that growth as one semi-elliptical crack; a condition similar to the previous one but with very small imperfections and one or various internal imperfections (pores). It should also be noted that specimens from all welded series, conditions and type of imperfections (undercuts, underfill, excess weld and pores) were included in the analysis carried out.
In summary, for the as-welded condition, due to the crack-like imperfections present in the top and bottom sides of the weld beads, the fatigue starts increased at high stress levels as reported in [36,39,40], and the phenomena of coalescence and growth of cracks had a greater influence on the fatigue life of the welded series and therefore also the local stress concentration at underfill or excess weld can influence the crack propagation.

3.6. Fatigue Lives Predictions

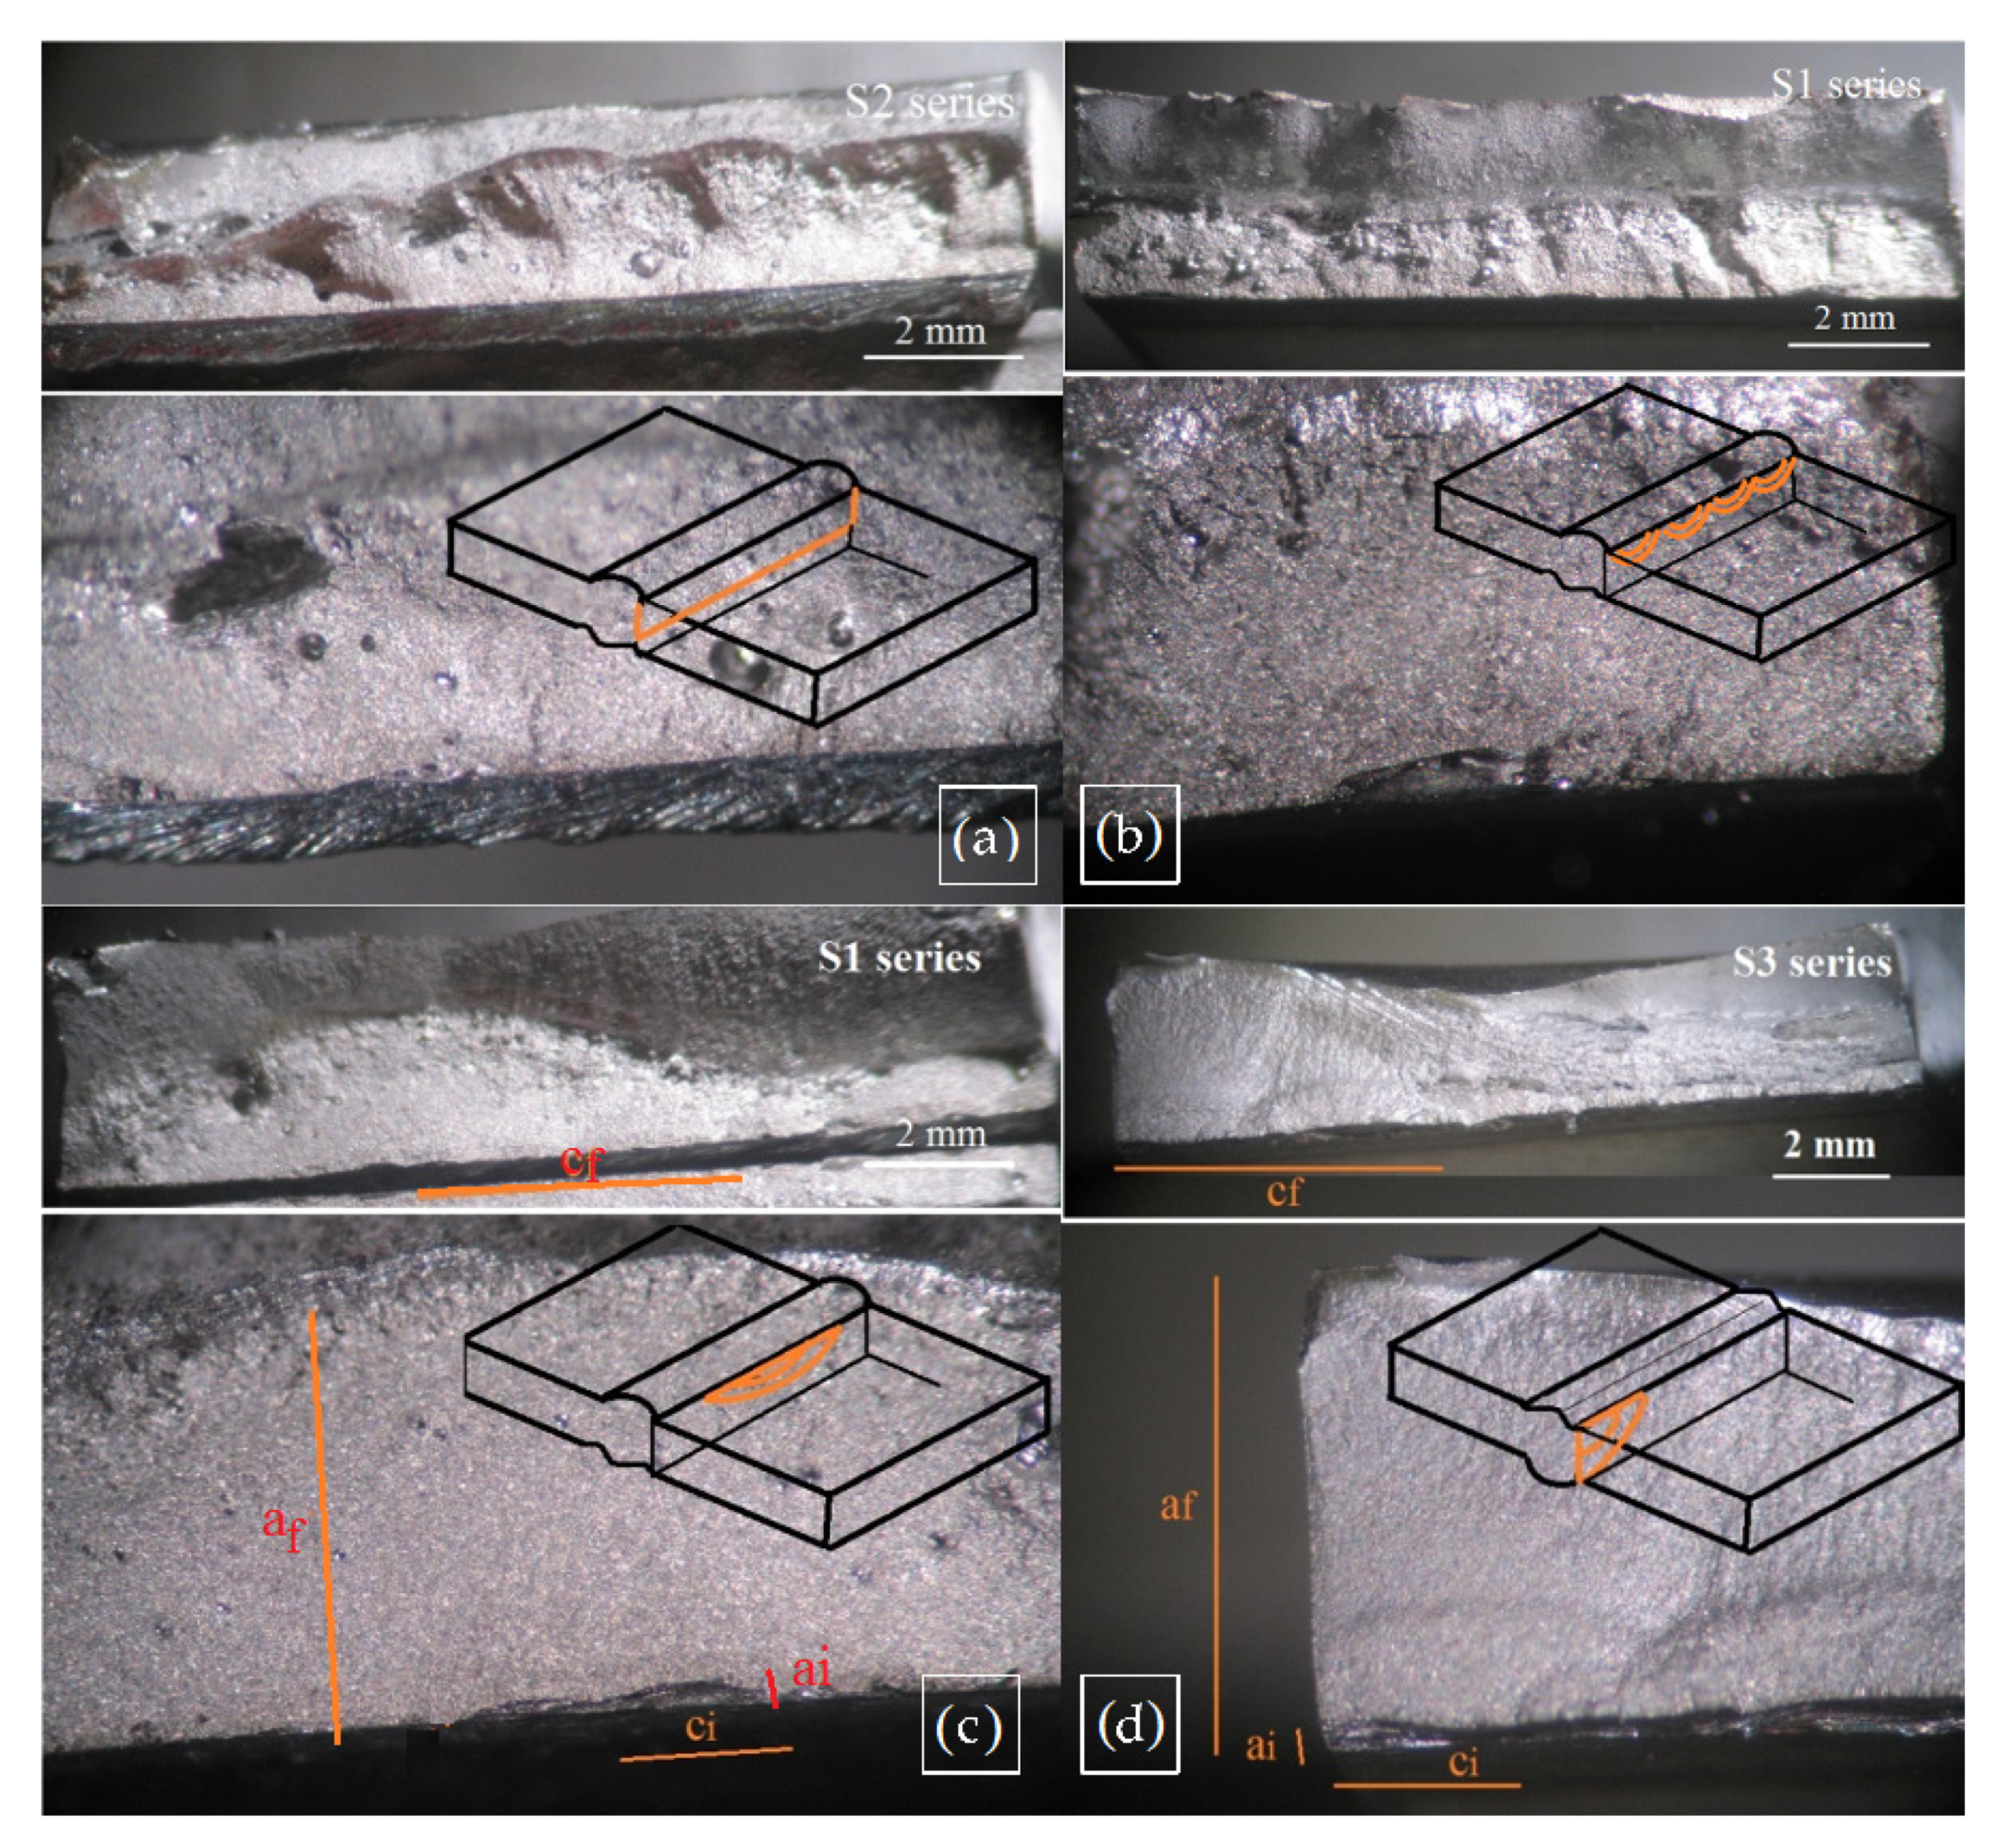
The previous analysis showed for the specimens in the as-welded condition, that at high stress levels, due to the presence of small imperfections, several fatigue starts are activated and coalesce rapidly, presenting conditions to neglect the fatigue initiation stage and therefore for the application of the fracture mechanics approach. The general procedure consists, first, in identifying the failure modes of the specimens with characteristic types of cracks and subsequently estimating the fatigue lives, N, according to well-known relationships of Paris law and SIFR, ΔK:
N = a i a f da A   Δ K n
Δ K = Y   M k   Δ σ π a
Figure 10a–d shows four fractured specimens of the as-welded condition with details of the fatigue starts and schemes of crack types associated to the failure modes. Therefore, for the S2 series, a continuous surface crack corresponds to a failure due to multiple small imperfections along the weld root, for the S1 series, semi-elliptical surface cracks correspond to the failure due to the undercuts and for the S3 series, a corner crack corresponds to a failure in the underfill near at the border of the specimen. Failure is assumed to occur when, from an initial crack size, the final crack size is reached that corresponds to a critical fracture condition. For the S1 series when the semi-elliptical cracks (in Figure 10b,c) grow from the initial aspect ratios, (ai/ci), until they coalesce and cover the entire width, allows the determination of the fatigue lives of the specimens. In the case of the S3 series, when the initial crack depth grows to the thickness of the specimen (Figure 10d) and for the S2 series specimens, from a very small initial crack depth to the depth as observed in the fractured surface (Figure 10a).
Table 5 contains geometric data of the cracks for five specimens (the four shown in Figure 10 and an additional specimen similar to the one shown in Figure 10a), parameters used to estimate the fatigue lives, the respective experimental results and the relations between the experimental lives and the corresponding estimated values, meanwhile, Table 6 corresponds to predictions. It should be clarified how the crack sizes shown in Table 5 and Table 6 were established: the estimates were measured on the fractured surfaces of the specimens (as illustrated in the Figure 10c,d), meanwhile, predictions are based on the sizes of the imperfections reported in [27]. In both cases, where applicable, the sizes are the mean values of the imperfections.
The following observations point out aspects of the crack sizes of each series. For the S2 series estimations, since there were multiple small imperfections along the width of the specimens, 12.5 mm was assumed as the initial and final lengths. Meanwhile for predictions, the final crack sizes, af and cf, were determined as described as follows. The crack depth af for the straight crack corresponding to the S2 series, was assumed as half the plate thickness (1.5 mm), as is recommended in [8], and the final crack length cf was assumed to be 12.5 mm, because it corresponded to an extended crack. The value, af of 3 mm in the S3 series, corresponds to the failure critical condition assumed for the corner crack, meanwhile, the value 4.81 mm, corresponds to the same aspect ratio a/c as in Table 5. The af = 0.96 mm and cf = 1.56 mm values, for the S1 series, were set considering that the critical condition occurs when the semi-elliptical cracks grow until their crack length ends meet and cover the width of the specimen as observed in Figure 10b,c. Therefore, based on the reported imperfections data [27]: the number of undercuts was 38 in 100 mm and the undercut average length size was 1.11 mm; four undercuts were located evenly spaced across the width (12.5 mm) of the specimen, this allowed the estimation of the 2cf value as 12.5/4 mm and assuming the same a/c relationship as in Table 5, the af = 0.96 value was obtained.
Due to the fact that fatigue lives are calculated by means of the parameters A and n of the da/dN-ΔK curves and initial crack sizes ai in Table 5 and Table 6 or, with ai = 0.1 mm (for all specimens) according to the recommendation in [8] or also used in [13], this generally underestimated the fatigue lives of the specimens. The initial crack size was slightly decreased to 0.07 mm (for all cases) and the parameters A*, n* were determined only with the first fifteen points using the same data of da/dN-ΔK curves. The previous adjustments are in line with the practical procedure that establishes the initial crack size, adapted from the S–N data, for its application with the da/dN-ΔK curve, as indicated in [26], where it is also pointed out that the initial crack size, rather than a physical size, is a model parameter and this could lead to limits of transferability to other component geometries. The adjustments can be justified due to the small sizes of the fatigue starts and growing cracks, and the thin thickness of the plate in the present work.
Due to the sensitivity of the initial crack value ai, for a better estimation of the fatigue life to final crack size af, ten steps were used in the integration between ai and af, where the first steps were of less crack increase than the last steps and the effect of the variation of crack aspect ratios a/c and a/t was also considered, assuming a linear relationship between these two. The previous assumption considers roughly what was reported in [41] for the growth of cracks with a large initial aspect ratio a/c as was the case of the crack aspect ratios found in the present work. The Y values and Mk factors displayed in Table 5 and Table 6 correspond to the average of the first five steps of the integration and were calculated with expressions from the literature, [8,25] was consulted for the Y value and [42] for the Mk factor. As can be seen in Table 5 and Table 6, the Mk factor that considers the effect of local stress concentration, due to the excess weld on cracks starting from the undercuts, had a small effect, mainly due to the small width of the weld beads. For the case of cracks starting from the underfill, the Mk factor were assumed equal to one. The Mk factor according to an expression in [42], considers the weld bead features: flank angle, attachment, excess-weld high and joint thickness.
As observed in Table 5, fatigue lives were generally underestimated, being less than 25%, although the relation between the experimental results and the predictions of the fatigue lives achieved in Table 6 can be considered acceptable for the data, parameters and assumptions used; the analysis showed that at high stress levels the appropriate values of parameters A, n and initial crack depth, ai, must be used with a correct assignment of the type of crack to a given failure mode, as long as the initiation and coalescence stages can really be neglected. For specimens of the S5 series there were no predictions of the fatigue life due to the FCGR not being appropriate, as was described in Section 3.3 and Section 3.4.

4. Conclusions

The effects of local properties, hardness and microstructure for four laser welded butt joints in thin HSLA steel were considered to explain fatigue crack growth behavior. Estimates and predictions of fatigue lives were also made. The main conclusions drawn are:
  • Although the differences were small, each welded series presented at the crack start and propagation sites (CGHAZ and FZ) had higher hardness than the BM. The hardness range for the welded series was 335–370 HV and the hardness for the BM was 295 HV;
  • The welded series presented similar FCGR rates in the HAZFZ, but lower than in the BM. This was due to lower hardness being present in the BM because it was verified as a bainitic–ferritic microstructure, while, in the welded series it was observed as a bainitic–martensitic microstructure in the CGHAZ and the FZ. Crack closure was observed only in the BM and in the S3 series, which can be attributed mainly to the crack tip plasticity for the BM and the effect of compressive residual stresses for the S3 series. The welding parameters did not influence in the FCGR rates;
  • At higher stress levels, fatigue life is strongly influenced by the quantity, size and location of the imperfections. The presence of crack-like imperfections located in critical positions, such as near to the lateral edge or several along the width of the specimen, favor the initiation and coalescence of cracks so that the fatigue initiation period can be neglected;
  • It has been shown that estimations and predictions of welded series’ fatigue life are very sensitive to the adjustment of the initial crack size and the crack growth rates, and to an adequate identification of imperfections and assumptions of a type of superficial crack.

Author Contributions

Author Contributions: Conceptualization, P.G.R. and J.A.M.F.; methodology, P.G.R., C.C. and J.A.M.F.; acquisition, analysis and interpretation of data, P.G.R., C.C. and J.A.M.F.; writing—original draft preparation, P.G.R.; writing—review and editing, P.G.R. and J.d.J. All authors have read and agreed to the published version of the manuscript.

Funding

This research is sponsored by national funds through FCT—Fundação para a Ciência e a Tecnologia, under the project UIDB/00285/2020.

Institutional Review Board Statement

Not applicable.

Informed Consent Statement

Not applicable.

Data Availability Statement

The data presented in this study are available on request from the corresponding author. The data are not publicly available due to privacy.

Acknowledgments

The authors acknowledge the support provided by the Universidad de las Fuerzas Armadas-ESPE with the Ph.D. scholarship and to Mário Da Costa Martins and Fernando Meireles of the Orthopedia Médica company where the laser welding was performed.

Conflicts of Interest

The authors declare no conflict of interest.

References

  1. Maddox, S.J. Fatigue Strength of Welded Structures; Abington Publishing: Cambridge, UK, 2002. [Google Scholar]
  2. Fricke, W. Fatigue strength assessment of local stresses in welded joints. In Fracture and Fatigue of Welded Joints and Structures; Woodhead Publishing: Cambridge, UK, 2011; pp. 115–138. [Google Scholar]
  3. Lieurade, H.P.; Huther, I.; Lefebvre, F. Effect of Weld Quality and Postweld Improvement Techniques on the Fatigue Resistance of Extra High Strength Steels. Weld. World 2008, 52, 106–115. [Google Scholar] [CrossRef]
  4. Gerritsen, C.; Vanrostenberghe, S.; Doré, M. Diode laser weld toe re-melting as a means of fatigue strength improvement in high strength steels. Procedia Eng. 2013, 66, 171–180. [Google Scholar] [CrossRef] [Green Version]
  5. Cheng, X.; Fisher, J.; Prask, H.; Yen, B.; Graunapel-Herold, T.; Roy, S. Residual stress modification by post-weld treatment and its beneficial effect on fatigue strength of welded structures. Int. J. Fatigue 2003, 25, 1259–1269. [Google Scholar] [CrossRef]
  6. Lefebvre, F.; Peyrac, C.; Elbel, G.; Revilla-Gomez, C.; Verdu, C.; Buffière, J. Understanding of fatigue strength improvement of steel structures by hammer peening treatment. Procedia Eng. 2015, 133, 454–464. [Google Scholar] [CrossRef] [Green Version]
  7. Marquis, G.; Barsoum, Z. A guideline for fatigue strength improvement of high strength steel welded structures using high frequency mechanical impact treatment. Procedia Eng. 2013, 66, 98–107. [Google Scholar] [CrossRef]
  8. Hobbacher, A.F. Recommendations for Fatigue Design of Welded Joints and Components; Springer: London, UK, 2016. [Google Scholar]
  9. Maddox, S. Fatigue Design Rules for Welded Structures, in Fracture and Fatigue of Welded Joints and Structures; Woodhead Publishing: Cambridge, UK, 2011; pp. 168–207. [Google Scholar]
  10. Lillemäe, I.; Remes, H.; Liinalampi, S.; Itävuo, A. Influence of weld quality on the fatigue strength of thin normal and high strength steel butt joints. Weld. Word 2016, 60, 731–740. [Google Scholar] [CrossRef]
  11. Watanabe, O.; Matsumoto, S.; Nakano, Y.; Saito, Y. Fatigue strength of welded joints in high strength steel Effects of stress concentration factor and welding residual stress. Weld. Int. 1996, 10, 201–206. [Google Scholar] [CrossRef]
  12. Harati, E.; Karlsson, L.; Svensson, L.-E.; Dalaei, K. The relative effects of residual stresses and weld toe geometry on fatigue life of weldments. Int. J. Fatigue 2015, 77, 160–165. [Google Scholar] [CrossRef]
  13. Nguyen, N.; Wahab, M. The Effect of Undercut and Residual Stresses on Fatigue Behaviour of Misaligned Butt Joints. Eng. Fract. Mech. 1996, 55, 453–469. [Google Scholar] [CrossRef]
  14. Shiozaki, T.; Yamaguchi, N.; Tamai, Y.; Hiramoto, J.; Ogawa, K. Effect of weld toe geometry on fatigue life of lap fillet welded ultra-high strength steels joints. Int. J. Fatigue 2018, 116, 409–420. [Google Scholar] [CrossRef]
  15. Kucharczyk, P.; Madia, M.; Zerbst, U.; Schork, B.; Gerwien, P.; Münstermann, S. Fracture-mechanics based prediction of the fatigue strength of weldments. Material aspects. Eng. Fract. Mech. 2018, 198, 79–102. [Google Scholar] [CrossRef]
  16. Ravi, S.; Balasubramanian, V.; Babu, S.; Nasser, S.N. Influences of MMR, PWHT and notch location on fatigue life of HSLA steel welds. Eng. Fail. Anal. 2004, 11, 619–634. [Google Scholar] [CrossRef]
  17. Wang, Q.; Yang, S.; Liu, X.; Dong, Z.; Fang, H. Understanding of fatigue crack growth behavior in welded joint a new generation Ni-Cr-Mo-V high strength steel. Eng. Fract. Mech. 2018, 194, 224–239. [Google Scholar] [CrossRef]
  18. Gurney, T. Cumulative Damage of Welded Joints; Woodhead Publishing Ltd: Cambridge, UK, 2006. [Google Scholar]
  19. Chapetti, M.; Jaureguizahar, L. Fatigue behavior prediction of welded joints by using an integrated fracture mechanics approach. Int. J. Fatigue 2012, 43, 43–53. [Google Scholar] [CrossRef]
  20. Zhang, Y.-H.; Maddox, S. Fatigue life prediction for toe ground welded joints. Int. J. Fatigue 2009, 31, 1124–1136. [Google Scholar] [CrossRef]
  21. Javaheri, E.; Hemmesi, K.; Tempel, P.; Farajian, M. Fatigue assessment of the welded joints containing process relevant imperfections. Weld. World 2019, 63, 249–261. [Google Scholar] [CrossRef]
  22. Goyal, R.; Bogdanov, S.; El-zein, M.; Glinka, G. Fracture mechanics based estimation of fatigue lives of laser welded joints. Eng. Fail. Anal. 2018, 93, 340–355. [Google Scholar] [CrossRef]
  23. Murakami, Y. Metal Fatigue: Effects of Small Defects and Nonmetallic Inclusions; Elsevier Science Ltd: Oxford, UK, 2002. [Google Scholar]
  24. Åman, M.; Tanaka, Y.; Murakami, Y.; Remes, H.; Marquis, G. Fatigue strength evaluation of small defect at stress concentration. Struct. Integr. Procedia 2017, 7, 351–358. [Google Scholar] [CrossRef]
  25. FITNET. FITNET Fitness-for-Service. Vol. II Annex; FITNET: Geesthacht, Germany, 2008. [Google Scholar]
  26. Zerbst, U.; Madia, M.; Schork, B.; Hensel, J.; Kucharczyk, P.; Ngoula, D.; Tchuindjang, D.; Bernhard, J.; Beckmann, C. Fatigue and Fracture of Weldments; Springer: Basilea, Switzerland, 2019. [Google Scholar]
  27. Riofrío, P.; Capela, C.; Ferreira, J. Imperfections and Modelling of the Weld Bead Profile of Laser Butt Joints in HSLA Steel Thin Plate. Metals 2021, 11, 151. [Google Scholar] [CrossRef]
  28. ISO. Welding-Electron and Laser-Beam Welded Joints-Guidance on Quality Levels for Imperfections. Part 1: Steel; ISO 13919-1(1996); ISO: Geneva, Switzerland, 1996. [Google Scholar]
  29. Riofrío, P.; Capela, C.; Ferreira, J.; Ramalho, A. Interactions of the process parameters and mechanical properties of laser butt welds in thin high strength low alloy steel plates. J. Mater. Des. Appl. 2020, 234, 665–680. [Google Scholar] [CrossRef]
  30. ASTM International. Standard Test Method for Measurement of Fatigue Crack Growth Rates. E647-13a (2013); ASTM International: West Conshohocken, PA, USA, 2013. [Google Scholar]
  31. Yisheng, W.; Schijve, J. Fatigue Crack Closure Measurements on 2024-T3 Sheet Specimens. Fatigue Fract. Eng. Mater. Struct. 1995, 18, 917–921. [Google Scholar] [CrossRef] [Green Version]
  32. Ohta, A.; Suzuki, N.; Maeda, Y.; Hiraoka, K.; Nakamura, T. Superior fatigue crack growth properties in newly developed weld metal. Int. J. Fatigue 1999, 21, S113–S118. [Google Scholar] [CrossRef]
  33. Chapetti, M.D.; Otegui, J.L. Importance of toe irregularity for fatigue resistance of automatic welds. Int. J. Fatigue 1995, 17, 531–538. [Google Scholar] [CrossRef]
  34. Guan, M.; Yu, H. Fatigue crack growth behaviors in hot-rolled low carbon steels: A comparison between ferrite–pearlite and ferrite–bainite microstructures. Mater. Sci. Eng. A 2013, 559, 875–881. [Google Scholar] [CrossRef]
  35. Li, S.; Khan, Y.; Kuang, S. Effects of microstructure on fatigue crack growth behavior in cold-rolled dual phase steels. Mater. Sci. Eng. A 2014, 612, 153–161. [Google Scholar] [CrossRef]
  36. Bell, R.; Vosikovsky, O.; Bain, S. The significance of weld toe undercuts in the fatigue of steel plate T-joints. Int. J. Fatigue 1989, 11, 3–11. [Google Scholar] [CrossRef]
  37. Kim, D.Y.; Hwang, I.; Jeong, G.; Kang, M.; Kim, D.; Seo, J.; Kim, Y. Effect of Porosity on the Fatigue Behavior of Gas Metal Arc Welding Lap Fillet Joint in GA 590 MPa Steel Sheets. Metals 2018, 8, 241. [Google Scholar] [CrossRef] [Green Version]
  38. Biswal, R.; Syed, A.; Zhang, X. Assessment of the effect of isolated porosity defects on the fatigue performance of additive manufactured titanium alloy. Addit. Manuf. 2018, 433–442, 23. [Google Scholar] [CrossRef]
  39. Schijve, J. Fatigue Predictions and Scatter. Fatigue Fract. Eng. Mater. Struct. 1994, 17, 381–393. [Google Scholar] [CrossRef]
  40. Verreman, Y.; Nie, B. Early Development of Fatigue Cracking at Manual Fillet Welds. Fatigue Fract. Eng. Mater. Struct. 1996, 19, 669–681. [Google Scholar] [CrossRef]
  41. Nair, P. Fatigue Crack Growth Model for Part-Througn Flaws in Plates and Pipes. J. Eng. Mater. Technol. 1979, 101, 53–58. [Google Scholar] [CrossRef]
  42. Lie, S.; Vipin, S.; Zhao, H. New weld toe magnification factors for semi-elliptical cracks in plate-to-plate butt-welded joints. Fatigue Fract. Eng. Mater. Struct. 2016, 40, 207–220. [Google Scholar] [CrossRef]
Figure 1. Specimen geometry used in FCGR tests, dimensions in mm.
Applsci 11 07346 g001
Figure 2. Metallographic and morphologic analyses. (a) S1 series macrograph, (b) Metallographic analysis and underfill defect, (c) toe of weld root, (d) undercut defect.
Applsci 11 07346 g002
Figure 3. Cross-sections macrographs of the welded series.
Applsci 11 07346 g003
Figure 4. Hardness profiles of the welded series. (a) S2 series and (b) S3 series.
Applsci 11 07346 g004
Figure 5. S–N curves.
Applsci 11 07346 g005
Figure 6. Fatigue crack growth rate at Paris regime for series (a) S1, (b) S3, (c) S2 and (d) S5.
Applsci 11 07346 g006
Figure 7. ∆P-COD example curves of each welded series and BM.
Applsci 11 07346 g007
Figure 8. Fatigue crack growth rate at Paris regime. (a) da/dN-∆K and (b) da/dN-∆Keff.
Applsci 11 07346 g008
Figure 9. Fractured surfaces of specimens at 600 MPa, from the shortest life (a) to the longest life (l).
Applsci 11 07346 g009
Figure 10. Fatigue failure modes with details and corresponding types of cracks. (a) extended crack, (b) semi-elliptical multicracks (c) semi-elliptical crack and (d) corner crack.
Applsci 11 07346 g010
Table 1. Chemical composition of base material (wt %).
CMnSiPSCrVNbNiCuAlMoTiCoFe
0.071.690.010.0120.0060.030.020.0460.040.0110.0440.0160.1170.016balance
Table 2. Welding parameters used in the experimental work.
SeriesLaser Power (kW)Welding Speed (m/min)Heat Input (J/mm)
S12.001.6075.0
S21.751.6065.6
S32.002.0060.0
S41.752.0052.5
S5top side weld pass
1.751.75–2.0052.5–60.0
bottom side weld pass
1.252.5030.0
Table 3. S–N curves parameters and fatigue limits.
Serieslinear Modellog CmFatigue Limits
S1no rejected13.463.23180
S2no rejected16.214.25270
S3no rejected13.253.12210
S5no rejected13.473.21215
Table 4. A, n parameters of the FCGR 1 curves as a function of ∆Keff.
SeriesAn
S16 × 10−92.9147
S21 × 10−82.7374
S34 × 10−93.0276
S52 × 10−82.6565
BM2 × 10−82.9556
1 (da/dN in mm/cycle and ∆Keff in MPa m1/2).
Table 5. Data and parameters for the estimation of the fatigue life.
Series-Crack Type (Figure)Crack SizesFCGR Parameters 1Mk FactorY ValueFatigue Life
ai, ci (mm)af, cf (mm)A*, n*Experimental (Cycles)Estimated (Cycles)Ratio
S2-extended (Figure 10a)0.02, 12.50.96, 12.52 × 10⁻⁹, 3.20171.081.1322,92220,7921.10
S2-extended (Figure 10a)0.02, 12.51.22, 12.52 × 10⁻⁹, 3.20171.081.1326,22521,0431.25
S1-semi-elliptical (Figure 10b)0.15, 0.461.62, 2.617 × 10⁻¹⁰, 3.59651.051.1029,26425,4851.15
S1-semi-elliptical (Figure 10c)0.10, 0.692.01, 4.837 × 10⁻¹⁰, 3.59651.011.0134,12738,6420.88
S3-corner crack (Figure 10d)0.21, 1.153.00, 4.816 × 10⁻¹¹, 4.41751.001.1533,76235,0650.96
1 (da/dN in mm/cycle and ∆K in MPa m1/2); * parameters calculated with 15 points of the corresponding curves of Figure 8.
Table 6. Data and parameters for the predictions of the fatigue life.
Series-Crack TypeCrack SizesMk FactorY ValueFatigue Life at 600 MPa
ai, ci (mm)af, cf (mm)Experimental (Cycles)Predicted (Cycles)Ratio
S1-semi-elliptical crack0.04, 0.560.96, 1.561.121.1029,26423,2391.26
S2-extended crack0.02, 12.51.5, 12.51.061.1526,22521,4871.22
S3-corner crack0.15, 1.583.00, 4.811.001.2133,76229,9041.13
Publisher’s Note: MDPI stays neutral with regard to jurisdictional claims in published maps and institutional affiliations.

