Article

Detection of Respiratory Phases in a Breath Sound and Their Subsequent Utilization in a Diagnosis

1
Department of Anatomy and Biomechanics, Faculty of Physical Education and Sport, Charles University, José Martího 269/31, 162 52 Prague 6, Czech Republic
2
Department of Peadiatrics, 2nd Faculty of Medicine and University Hospital Motol, Charles University, V Úvalu 84, 150 06 Prague 5, Czech Republic
3
Institute of Physiology of the Czech Academy of Sciences, Vídeňská 1084, 142 20 Prague 4, Czech Republic
4
Department of Designing and Machine Components, Faculty of Mechanical Engineering, Czech Technical University in Prague, Technická 4, 166 07 Prague 6, Czech Republic
5
Department of Information and Communication Technology in Medicine, Faculty of Biomedical Engineering, Czech Technical University in Prague, nám. Sítná 3105, 272 01 Kladno 2, Czech Republic
*
Authors to whom correspondence should be addressed.
Appl. Sci. 2021, 11(14), 6535; https://doi.org/10.3390/app11146535
Submission received: 1 May 2021 / Revised: 1 July 2021 / Accepted: 7 July 2021 / Published: 16 July 2021
(This article belongs to the Special Issue Application of Image Processing in Medicine)

Abstract

:
Detection of lung sounds and their propagation is a powerful tool for analysing the behaviour of the respiratory system. A common approach to detect the respiratory sounds is lung auscultation, however, this method has significant limitations including low sensitivity of human ear or ambient background noise. This article targets the major limitations of lung auscultation and presents a new approach to analyse the respiratory sounds and visualise them together with the respiratory phases. The respiratory sounds from 41 patients were recorded and filtered to eliminate the ambient noise and noise artefacts. The filtered signal is processed to identify the respiratory phases. The article also contains an approach for removing the noise that is very difficult to filter but the removal is crucial for identifying the respiratory phases. Finally, the respiratory phases are overlaid with the frequency spectrum which simplifies the orientation in the recording and additionally offers the information on the inter-individual ratio of the inhalation and exhalation phases. Such interpretation provides a powerful tool for further analysis of lung sounds, simplifythe diagnosis of various types of respiratory tract dysfunctions, and returns data which are comparable among the patients.

1. Introduction

The detection and analysis of respiratory sounds are a great tool for the identification of bronchial obstructions. The pathogenesis of bronchial obstructions, i.e., reduction of airway diameter which leads to airflow limitation, is very heterogeneous, however, the type of obstruction is often temporarily linked to the respiratory phase. The most common examination when suspecting a bronchial obstruction is lung auscultation [1].
A respiratory sound is defined as a sound in the frequency range of tens to thousands of Hz [2,3]. The respiratory sound originates as the air flows through the airways to the alveoli and then passes through the lung parenchyma and the chest wall to a membrane of a phonendoscope. Depending on the position of the phonendoscope during lung auscultation, the sound is classified as the sound detected on the chest wall at the frequency between 60 Hz and 1000 Hz or as the sound detected over the trachea. The sound detected over the trachea usually contains higher-frequency components up to 1200 Hz because the signal is less filtered by the tissue [2,3,4,5,6]. It is important to realize that the digitalized signal carries certain modifications as the sound propagates through the tissue, for example, the lung parenchyma acts acoustically as a low-pass filter or through the detection equipment [5]. These modifications directly influence the significant frequencies for the analysis which mostly lies bellow 250 Hz [2,5]. In addition to these modifications, there are other significant sources of noise in the sound such as the sounds from the respiratory muscles (~20 Hz) and from the heart (~50 Hz) [2,4,5,7]. As indicated above, not only do the tissue affect the signal, but also the equipment can negatively influence the recording while using a poor quality sensors and electronics. The common methods to eliminate the noise in the recording are based on ambient noise reduction, which is very difficult in a general practitioner’s office, on correct manipulation with the equipment or on the proper design and selection of the electronics and hardware including solid acoustic shielding or suitable sensors [8]. On the other hand, the recording is always affected by some unwanted noise which originates either form from the patient’s body, the surrounding or from the equipment.
To reduce the unwanted noise and obtain relevant and useful information from the recording, it is necessary to filter the respiratory sound recording. The common approach to reduce the noise in the recording is the application of the high-pass and low-pass filters of nth order [6,9,10]. The properties of such a filter reflect the type of obstruction that the physician suspects during the examination. The cutoff frequency for the low-pass filter can reach 100–500 Hz and the cutoff frequency for the high-pass filter can be set between 800–5000 Hz [6,9,10]. Some studies even adopted voice activity detection (VAD) to filter the signal [11]. Sadly, none of these approaches is sufficient to detect the respiratory phases, and therefore the algorithm requires additional features, for instance, observation of multiple sound parameters [6] or creation of recording’s envelope [9].
It is known that the respiratory tract of a healthy person produces a normal respiratory sound without adventitious sounds. The sound from normal lung parenchyma detected on the chest wall (called the vesicular breathing) is characterized by a quiet low-frequency noisy sound during inspiration and it is hardly audible during expiration. The sound detected on the trachea (so called tracheal breath sound) is characterized by a broader spectrum of noise and it is audible both during inspiration and expiration [2,4]. However, breath sounds may be abnormal in certain pathological conditions of the airways or lungs [2,5]. The respiratory diseases can affect the timing of sound transmission from the airways to the chest surface (typically prolonged expiratory phase or cessation of breath [12]) and also it can change amplitude composition of the frequency spectrum of breathing due to the presence of bronchial obstruction in the airways [2,5]. The respiratory sound then carries adventitious sounds with high frequencies and amplitudes called wheezes, crackles, rhonchus or snores [2,5].
The mechanisms of genesis of these noises, their frequency range and duration times can vary. The wheezes, caused by airway wall flutter and vortex shedding [2], are sounds, at the bandwidth of 100 to 1600 Hz with the common duration from 80 to 250 ms [2,5,13]. On the other hand, the crackles are discontinuous adventitious lung sounds in frequency range from 100 to more than 2000 Hz and with the duration less than 20 ms [2,4,5,8,13]. It is very important to diagnose these adventitious sounds correctly to be able to start treatment as early as possible. Before detecting any adventitious sounds, the automatic detection of respiratory phases (areas of inspiration and expiration) in the sound of breath is very useful. If the detected borders of the respiratory phases are plotted over the frequency spectrum it allows an easier orientation in the frequency spectrum of the sound recording (see Section 3). Detection of the respiratory phases also offers a possibility to create a specific character of the respiratory sound which can be further compared with another recording. This approach also enables the automatic detection of respiratory phaseseven in the recordings with chaotic characteristics. This article introduces a simple and computationally inexpensive method for detecting the respiratory phase during lung auscultation and further discusses the possibility of using the alternation of inspiratory and expiratory phases based on the movement of air in the airways while the air movement is minimal or zero. This graphical interpretation is a great help for physicians while detecting the bronchial obstructions and relaying on temporal information.

2. Materials and Methods

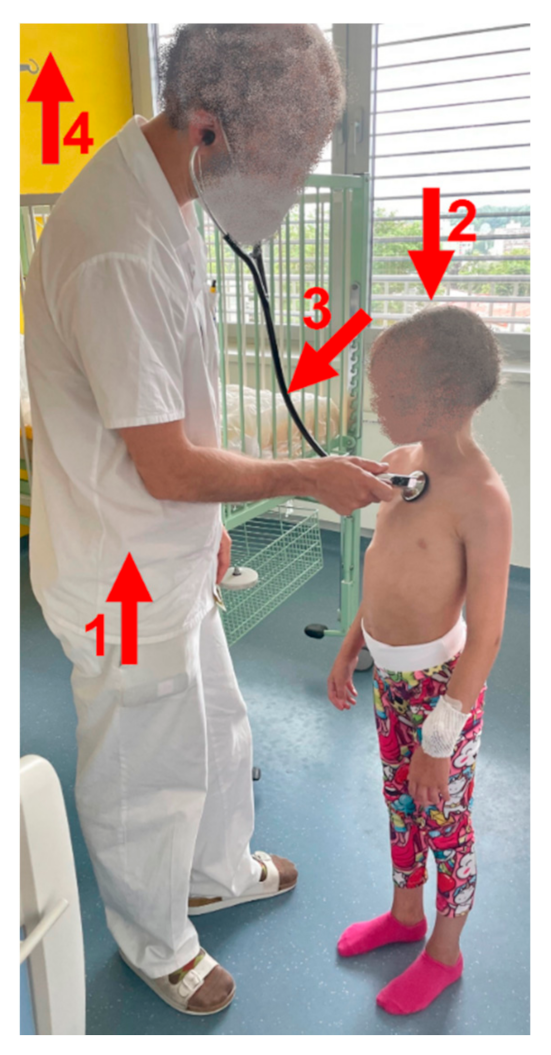
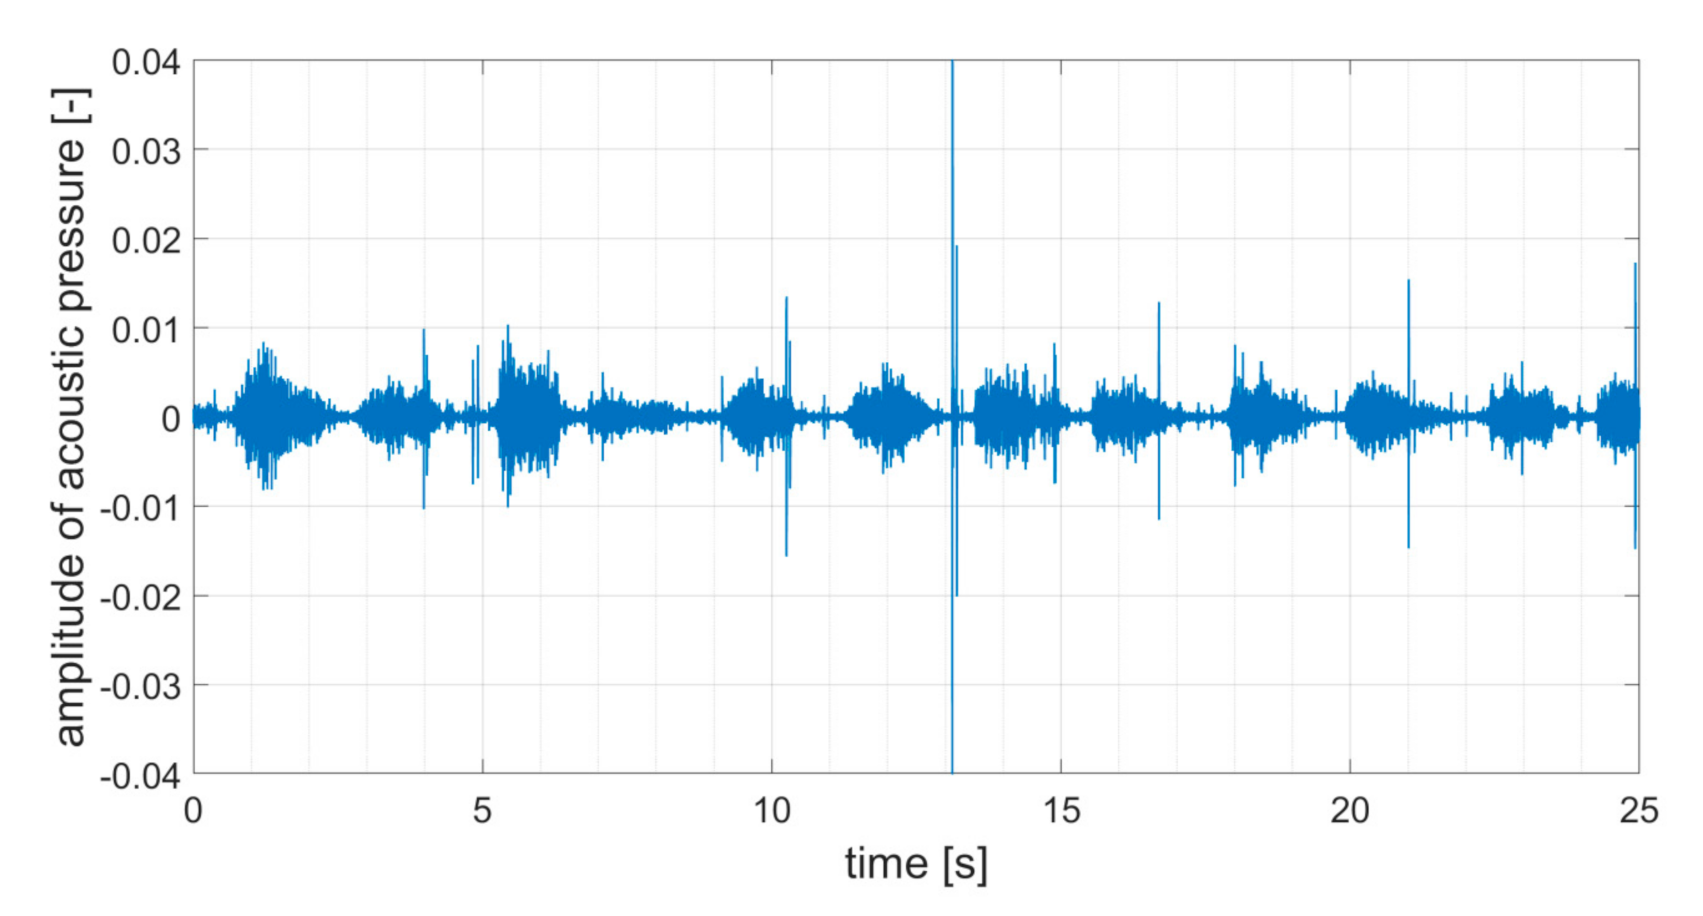
2.1. Respiratory Sound Recording

Respiratory sounds were acquired by a trained physician in performing lung auscultation (Figure 1). The auscultation was performed using a phonendoscope Littmann 3200 (3M, Maplewood, MN, USA). The phonendoscope was placed at patient’s jugulum and used in the Extended Range mode with the sampling frequency of 4000 Hz according to the Nyquist sampling theorem. The low pass filter was used to eliminate aliasing. The sound data were collected on 41 participants between 6 and 18 years old. The group of participants consisted of healthy controls and confirmed asthmatic cases of different severity. The presence and severity of bronchial obstruction was verified using spirometry. To stimulate and highlight the features in the respiratory sounds, a half of the participants (n = 24) underwent second lung sound recording after performing 15 squats. The minimum length of the records that were forwarded for the analysis was 3 complete respiratory cycles.

Ambient and Patient’s Body Noise

The final recording is affected by the environmental aspects as the breath sound travels from its origin through the body organs and the ambient space. The ambient noise was limited by using the soundproof room for the physician, the phonendoscope with a high quality of shieldingand also the physician was trained in manipulation with the phonendoscope to limit on-skin movements. The noise is partially removed by applying a low-pass filter and high-pass filter according to Section 2.2.1. The final recordings were divided into 3 groups according to the quality of the recording (see Section 3, Table 1). The criterion was based on the level of noise artefacts in the recording. The recordings were acquired in a soundproof room, and therefore the noise artefacts were mostly generated by the phonendoscope on-skin movement. The noise artefacts were further identified as a short amplitude peaks with the duration of 0.1 s and frequency range of 300–1100 Hz. The first group—very good—represents a clean signal without the noise artefacts. The second group—with significant noise—includes the recordings with a random noise artefacts that occur once in three seconds. The last group—very poor—contains the recordings with a constant appearance of the noise artefacts in the whole recording with the average frequency of two occurrences per a second.

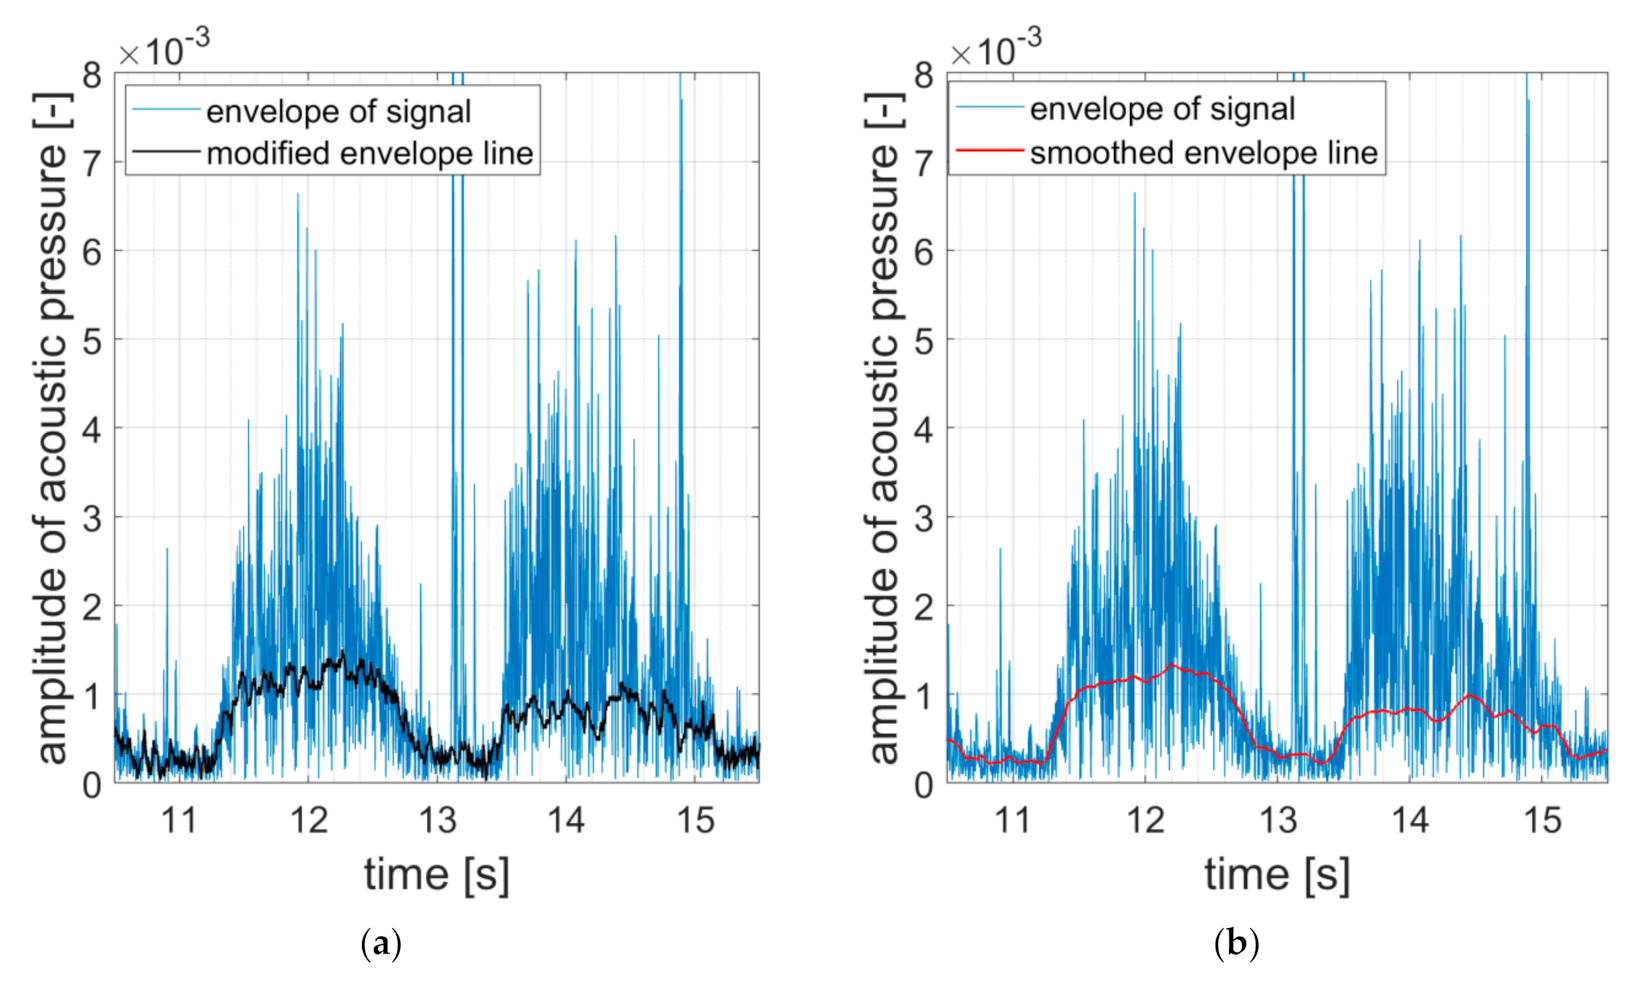
2.2. Signal Processing

The signal processing is graphically illustrated in the flow chart (Figure 2). The processing algorithm was developed in Matlab R2020b (MathWorks, Natick, MA, USA).

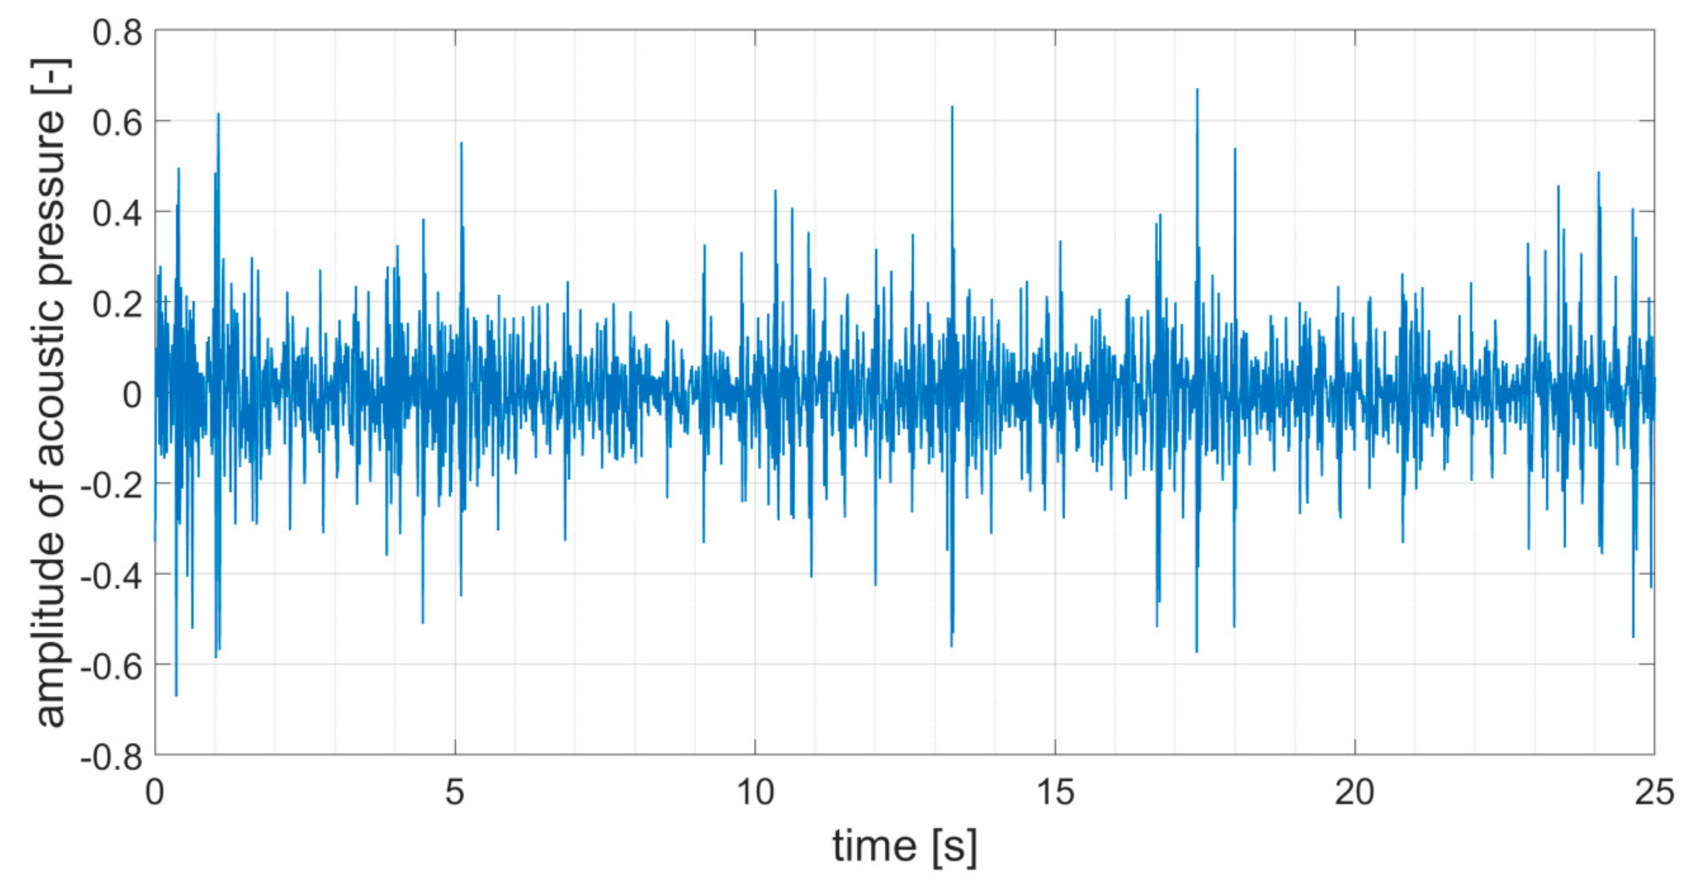
2.2.1. Basic Filtering

The recording always contains a certain level of noise, and therefore the raw sound signal is very chaotic (Figure 3). Such a signal is much disorganized and moreover the searched respiratory phases and adventitious sounds are suppressed in the sound due to higher amplitude levels from the ambient noise.
To reduce the level of noise in the raw sound signal, the signal is filtered using high-pass and low-pass filter based on finite impulse response (FIR) filter of 5th order. The best results were achieved when the high-pass filter was set to 500 Hz and the low-pass filter was set to 1600 Hz. The setting of the high-pass filter helped to eliminate the muscle, heart and other low-frequency sounds. The setting of the low-pass filter was set to 1600 Hz in order to eliminate aliasing and increase the quality of the lower airway sounds. As was mentioned previously, the recordings contained some noise created by tapping or rubbing the sensor against the skin or hair. This noise is aperiodic and sudden of a length of tens of millisecond, with high amplitudes and wide frequency ranges, and therefore needs to be reduced by a different approach.

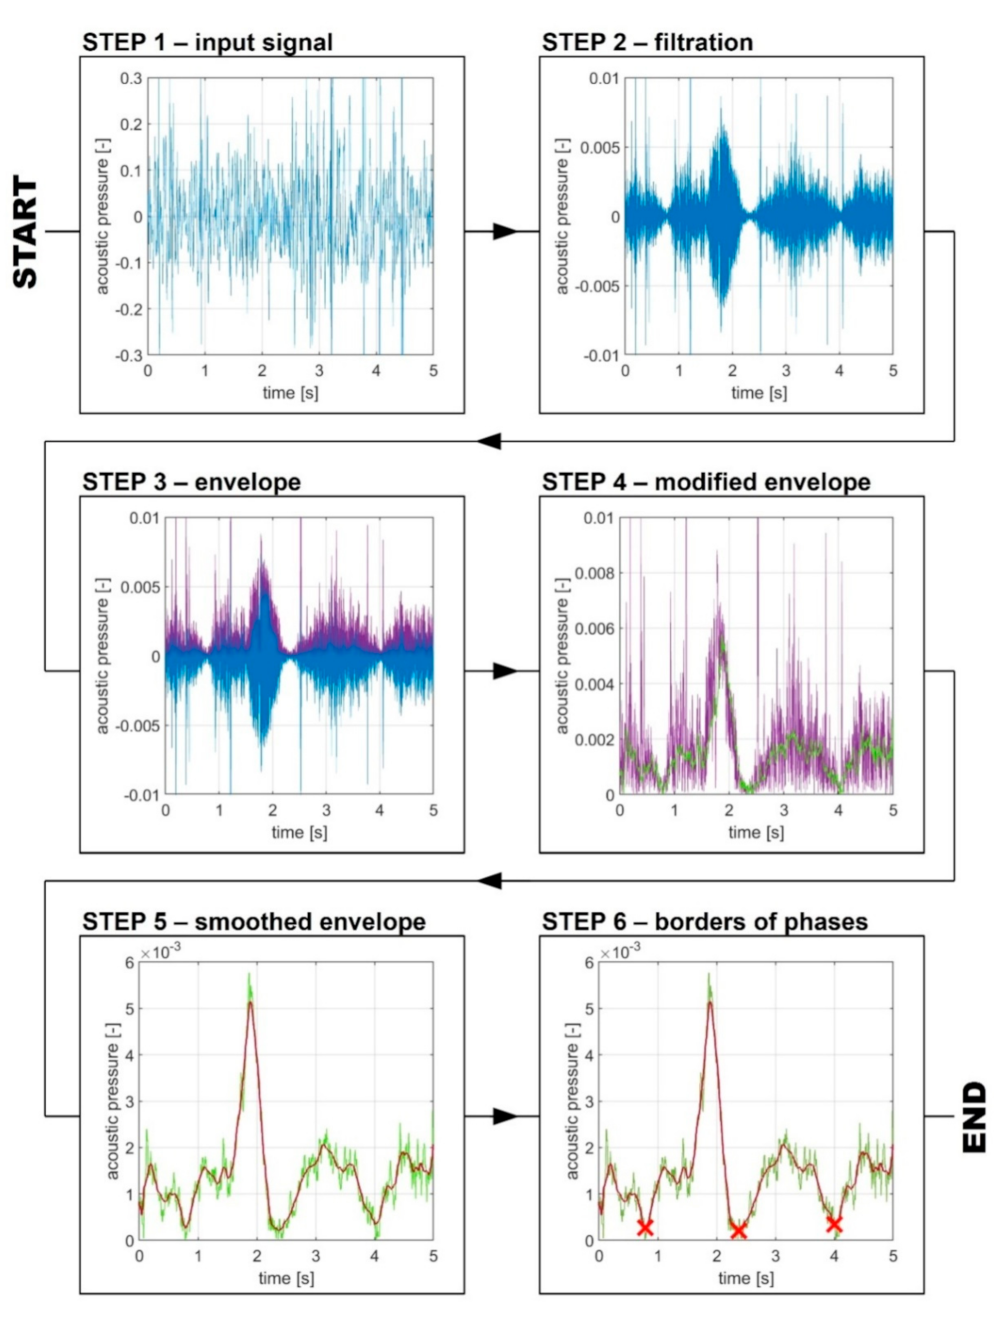
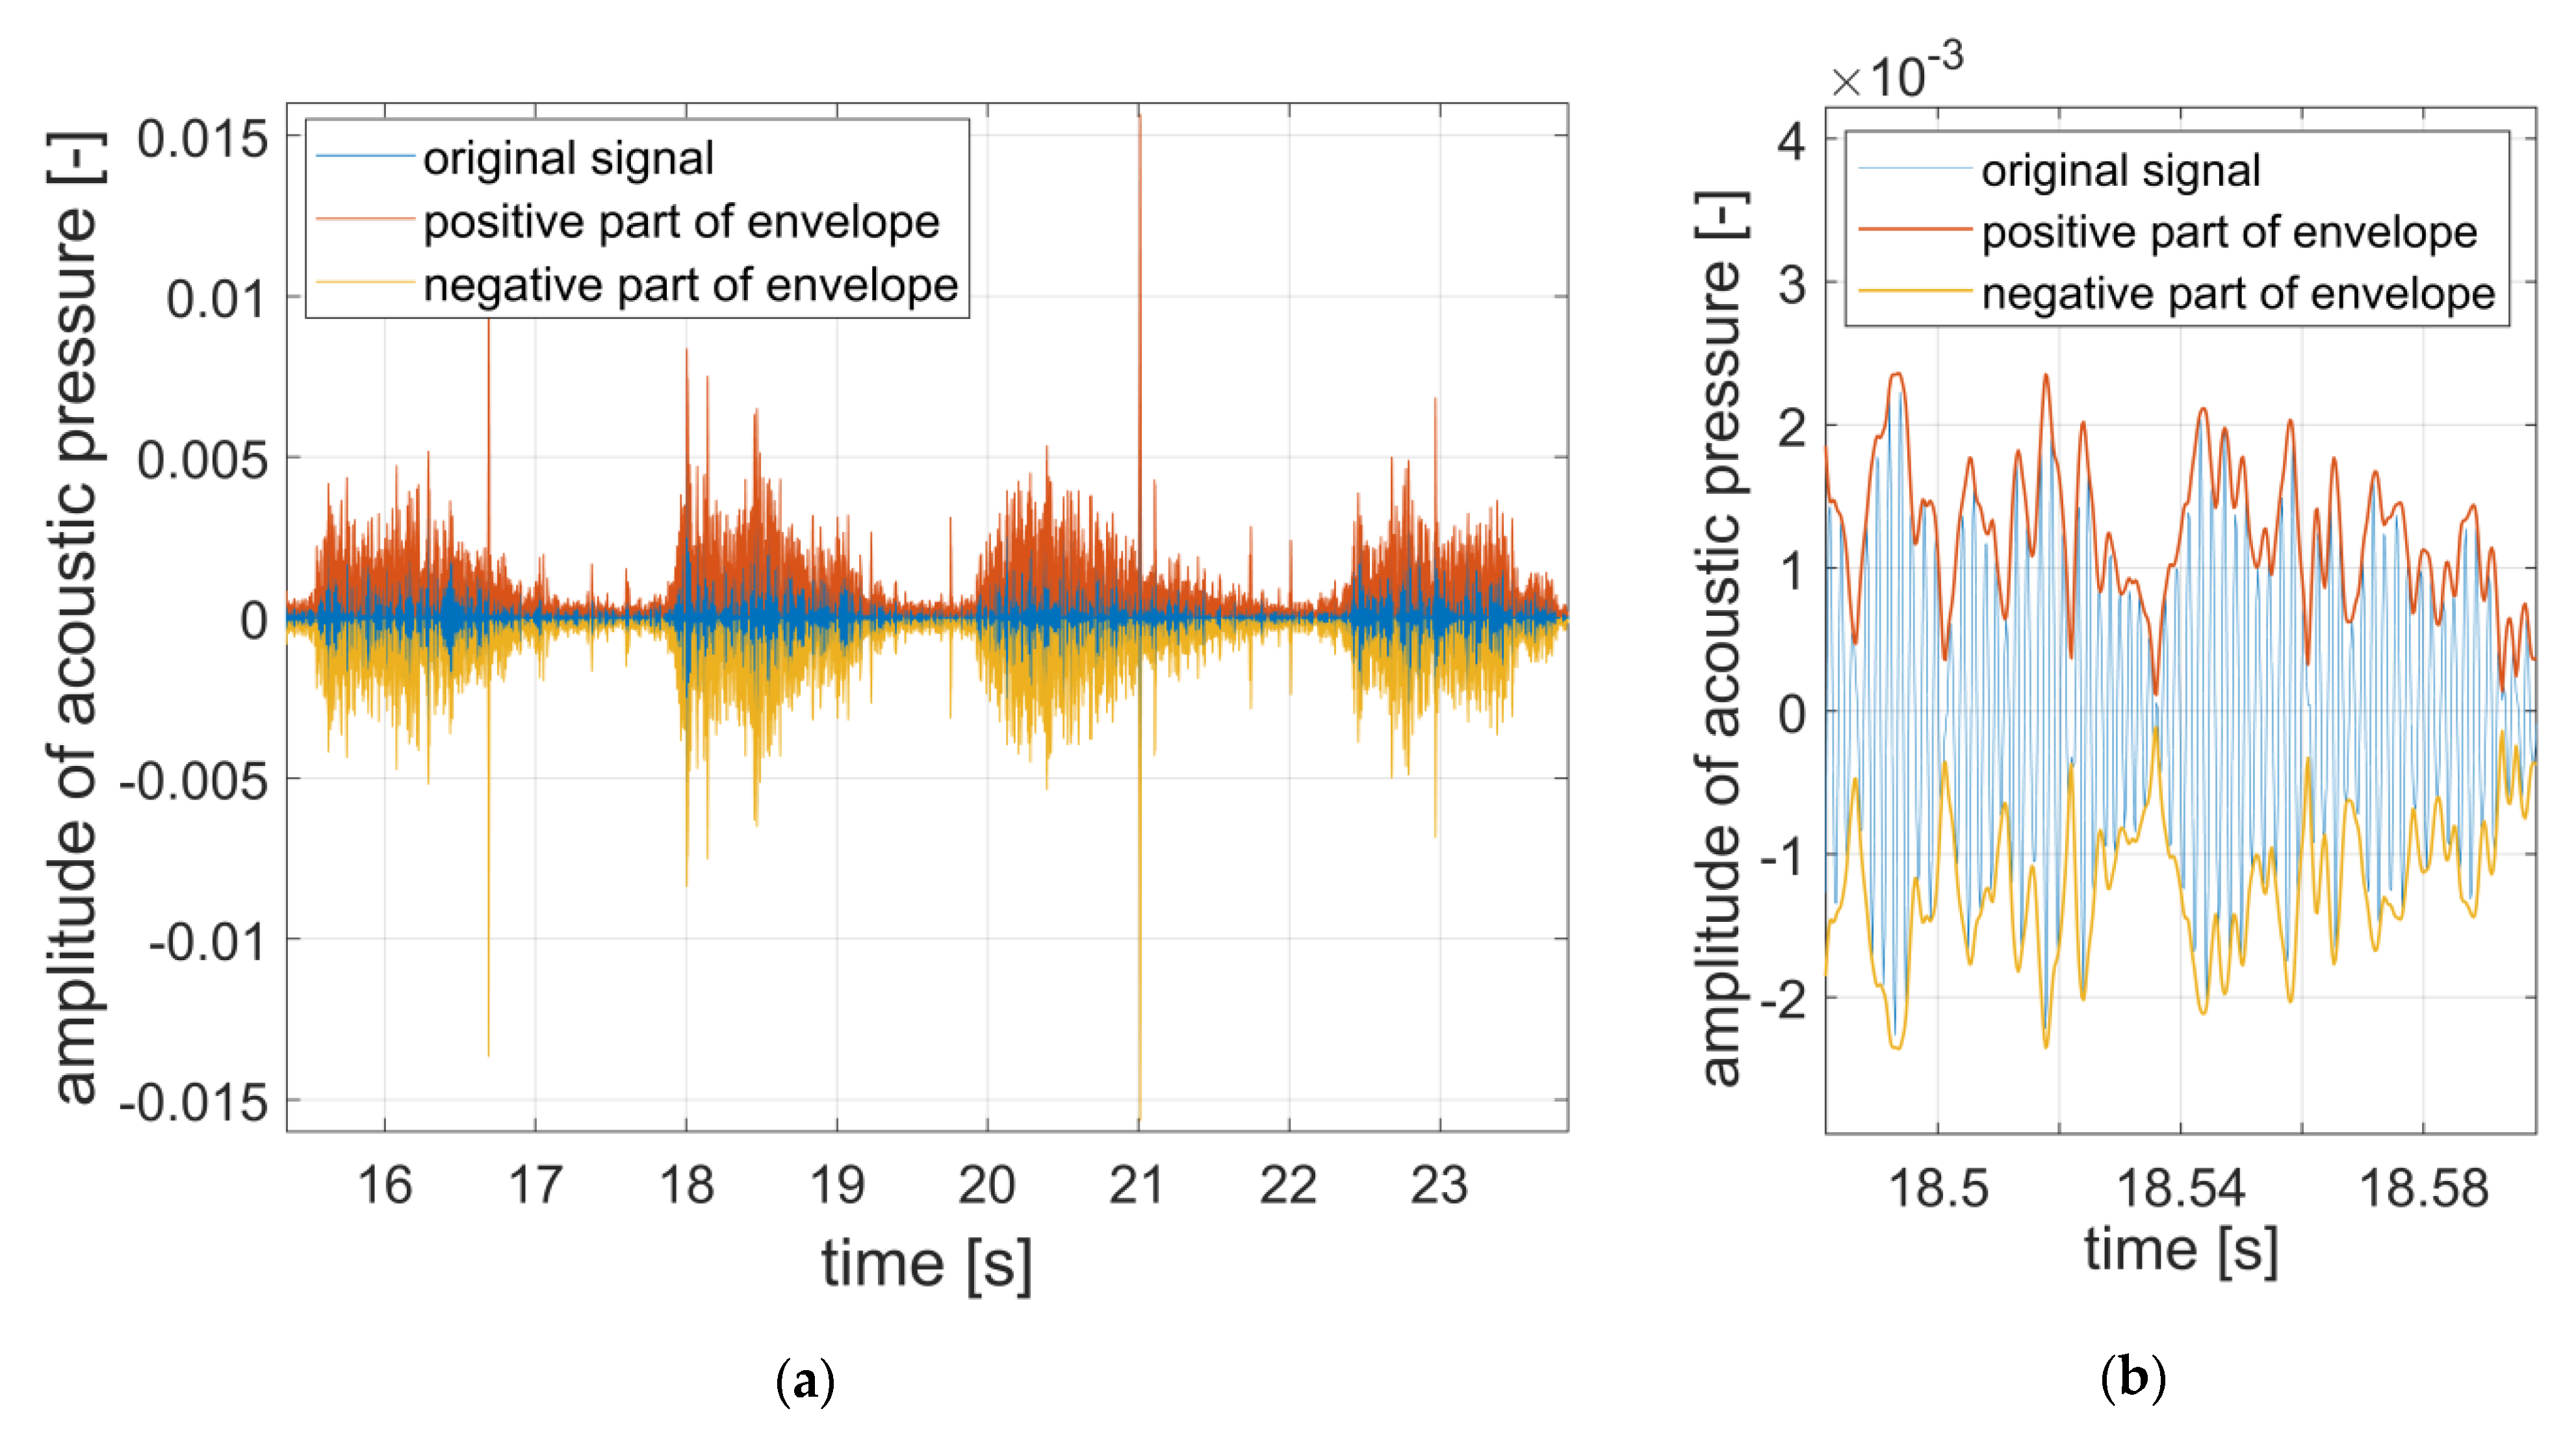
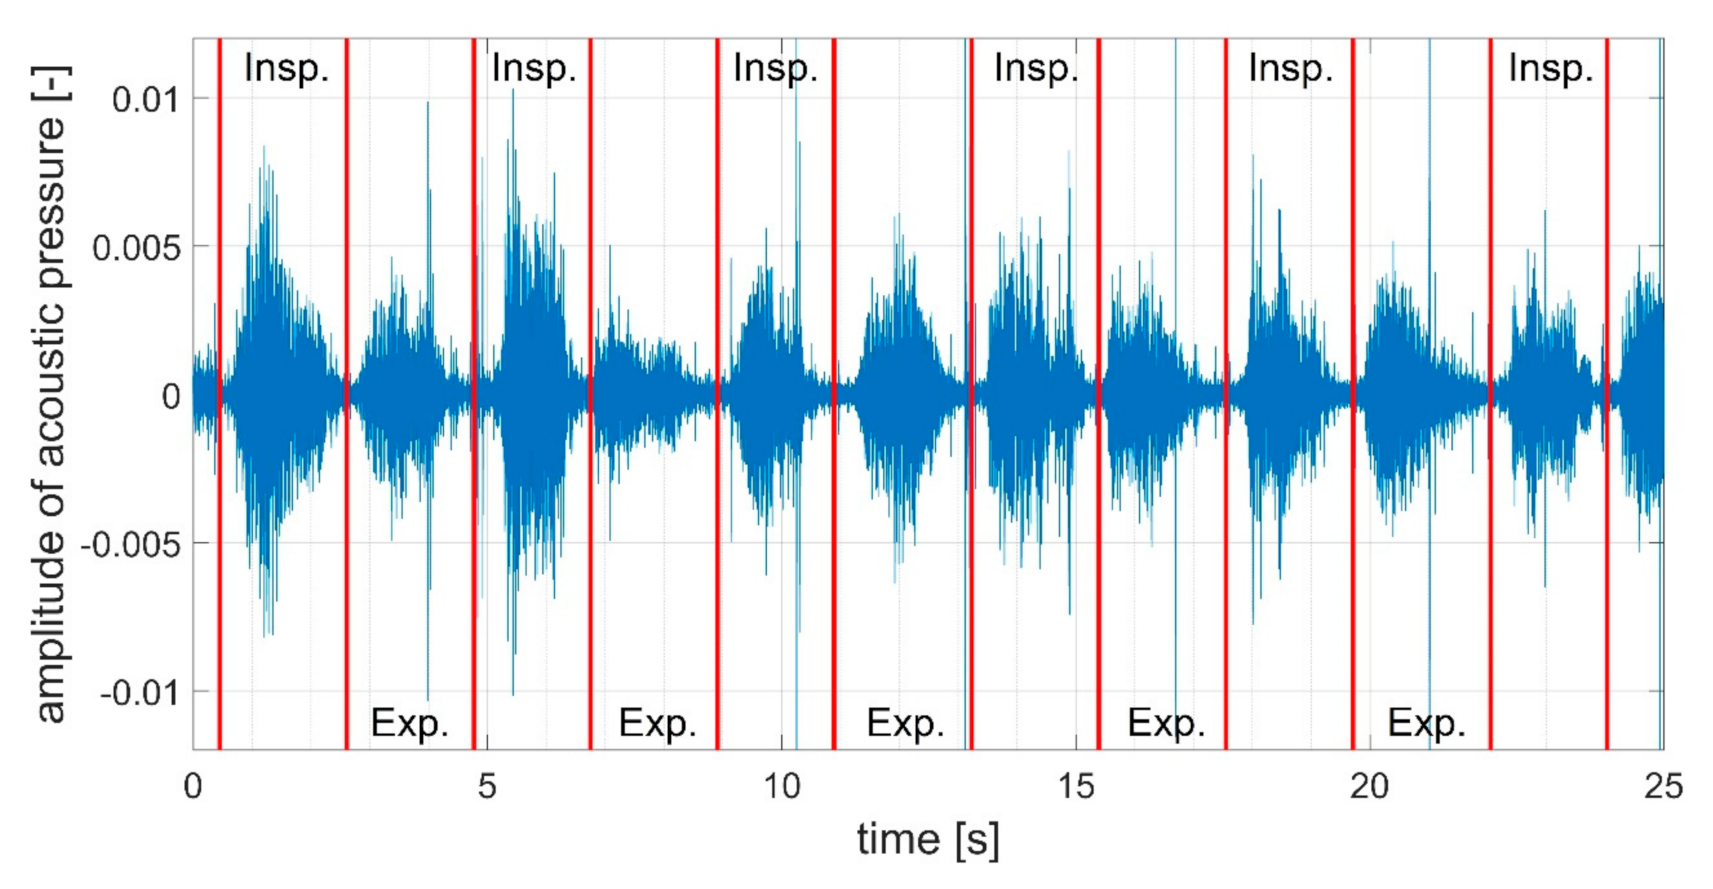
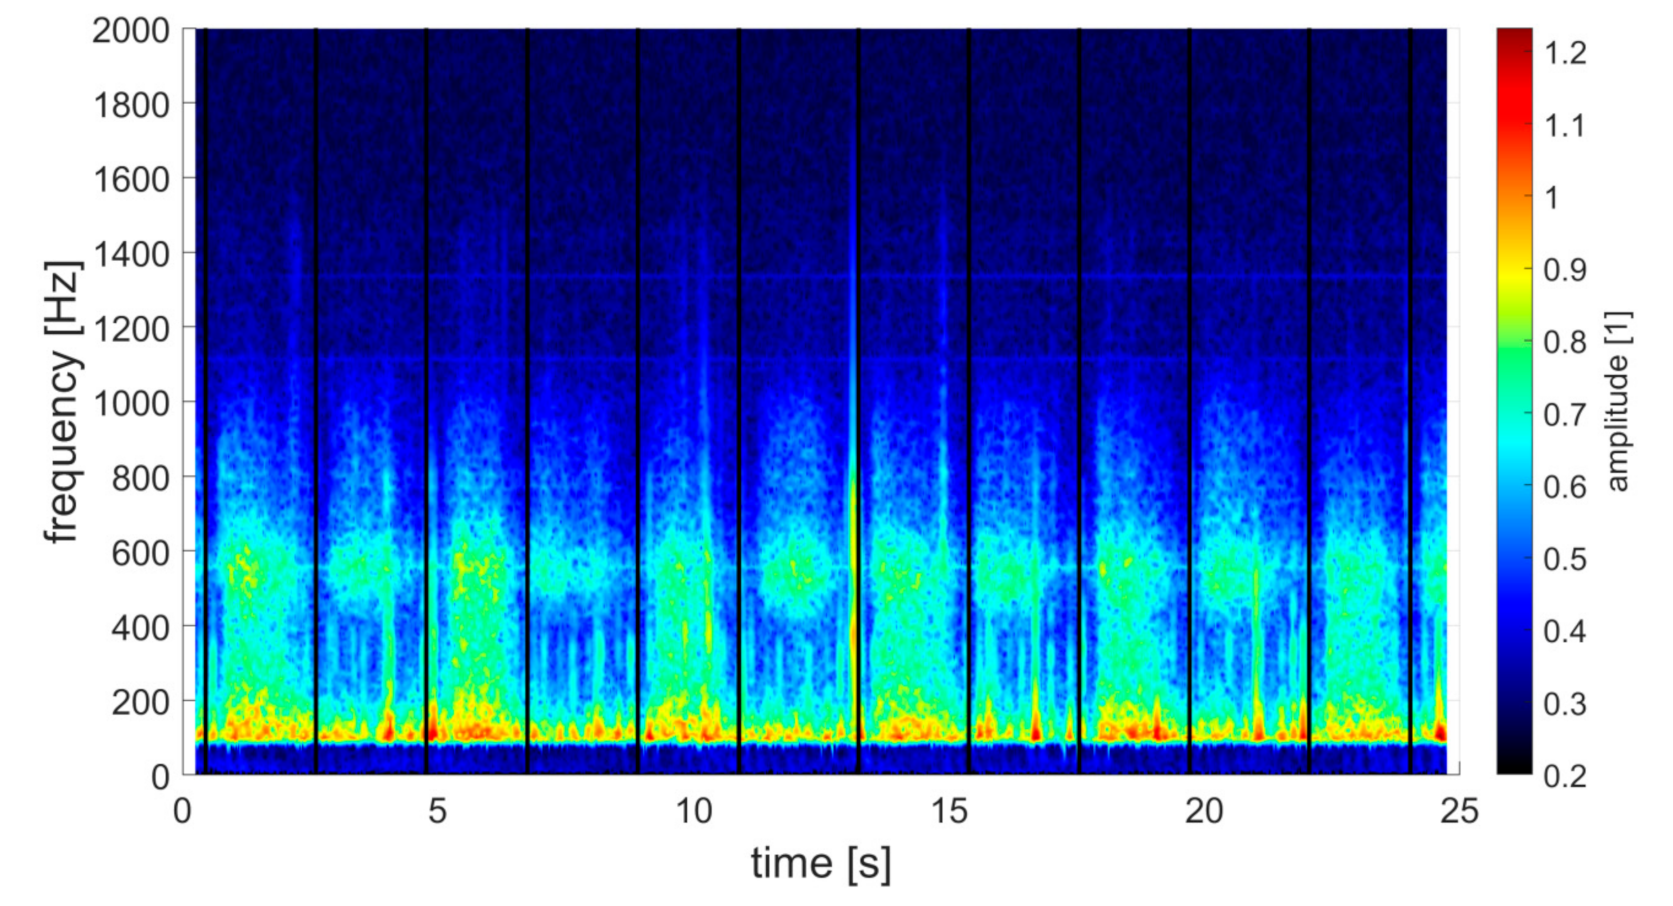
2.2.2. Data Processing and Detection of Respiratory Phases

The respiratory phase identification is based on the assumption that the lauder sound has a higher amplitude deviation than the quieter sound during the time of respirator phase change. For easier, faster and more accurate identification of maximal and minimal deviation of pressure amplitude, it is appropriate to use an envelope of the signal calculated as:
e t = x t 2 + x ^ t 2 ,
where x ^ t is the Hilbert transform of input signal x t [14]. The Hilbert transform, using a 32-points Parks-McClellan FIR filter, is a specific linear operator that creates the envelope of the signal while remaining the same time distribution as the original signal. The upper part of the envelope includes positive values of amplitudes only, while whole signal oscillates between positive and negative values. Therefore, it can be effectively smoothed—Figure 4.
Unfortunately, the envelope is greatly affected by the phonendoscope manipulation artefacts. These artefacts cause a random increase of the amplitude in the recording and because the artefacts are not related to the respiratory sounds, they need to be removed from the recording. The removal is performed according to the following algorithm:
if x i + 1 > x i + r ˜ 1 / 2 ,
then x i + 1 = x i + 1 r ˜ 1 / 2 ,
where i = ⟨1 , k , x is the value of the envelope at a specific time, k   is the length of signal interval approximately equal to the length of the defect (the approximate value of the variable k is set to 0.06 s) and r ˜ 1 / 2 is the median value of the lower half of the set of differences of consecutive values of the envelope in the interval k . The algorithm is applied along the entire length of the recording. The recording without an abrupt change in the amplitude returns relatively constant values at the interval of k and the value r ˜ 1 / 2 remains low. If the amplitude changes rapidly at the interval k, the value r ˜ 1 / 2 also increases. This increase in r ˜ 1 / 2 indicates a presence of noise and the amplitude is consequently attenuated in the envelope. The edited envelope can be further processed for calculating the local minima with the parameter f r p / 2 (approximate duration of the respiratory phase). To identify the local minima precisely, the envelope was smoothed with the moving average with the window length of 100 data points. As there is an inter-individual variation in breath sound, it is necessary to manually control more parameters in the algorithm for the correct automatic identification of the respiratory phases. A favorable and easily adjustable parameter is the approximate rate of the change of the respiratory phases f r p / 2 that reflects duration of one phase—inspiration or expiration. This feature varies according to patient’s age and the health condition. The software is able to work with an approximate value f r p / 2 , which is advantageous in the cases of different lengths of the respiratory phases and changes of these phases length during the audio recording. For most participants, it is possible to define the same value of the respiratory phases f r p / 2 = 1 s but for larger deviations from a given value f r p / 2 , it is necessary to define a specific duration of one phase for each participant individually, e.g., using age-specific normative values for respiratory rate [15].

3. Results

The data processing approach eliminated the high amplitudes sounds so the recording contains mainly the breath sounds. The alternations of inspiratory and expiratory phases are better pronounced and occur when the amplitude of acoustic pressure is minimal (Figure 5).
When these minima become visible, the algorithm needs to locate the low amplitude level. The envelope smoothing approach successfully unified the signal and eliminated the local minima that normally trigger a false positive response (Figure 6).
When the envelope was properly adjusted and the respiratory rate falls into defined boundary, the changes of the respiratory phases are revealed automatically (Figure 7). The accuracy of the changes detection depends mainly on the respiratory rate and the quality of the recording. When the rate is considerably low, a transition part between the phases becomes marginal and the accuracy decreases. In order to maximize the accuracy of respiratory phase detection, it is necessary in some cases to change the settings of certain parameters in the software (see Table 2 and Table 3).
The algorithm was tested on a number of recordings and the results strongly depended on the recordings’ quality and the noise level (Table 1). The third group, classified as very poor, contained the recordings in which the respiratory phases were not correctly identified by the algorithm.
Table 1. Dividing of recordings.
Quality of RecordingNumber of Recordings
very good/with minimal undesirable noise—~2 artefacts/sec or without artefacts22
with significant noise—~1 artefact/3 s10
very poor—~2 artefacts/sec constantly9
The algorithm always detected the changes of the respiratory phases in the recordings of the first and the second quality group—Table 2 and Table 3.
Table 2. Success of detection of boundaries of respiratory phases–very good recordings/recordings with minimal undesirable noise.
Deviation of the detected boundary
up to 0.2 s21 recordings
up to 0.4 s1 recording
The need of the software modifications
none13 recordings
modification of f r p / 2 5 recordings
mod. of low-pass filter value1 recording
mod. of f r p / 2 and values of low-pass and high-pass filter3 recordings
Table 3. Success of detection of boundaries of respiratory phases–recordings with significant noise.
Deviation of the detected boundary
up to 0.2 s3 recordings
up to 0.4 s7 recording
The need of software modifications
none4 recordings
modification of f r p / 2 1 recording
mod. of low-pass filter value2 recordings
mod. of f r p / 2 and values of low-pass and high-pass filter3 recordings
The successfully detected respiratory phases were highlighted in the frequency spectrum graph and helped the physician to identify whether the participant does not suffer from bronchial obstruction (Figure 8) or whether there is a potential problem such as pronounced bronchial obstruction (Figure 9). The frequency spectra are visualized from 100 to 2000 Hz to avoid the noise arising from the cardiac activity.
Besides using the respiratory phases to improve the orientation in the frequency spectrum, the average curves of inhalation and exhalation phases can be plotted as a dimensionless ratio relating the amplitudes and frequencies. Such a graph provides a unique piece of inter-individual information on the quality of respiration, and moreover, it is comparable among the patients. When detecting the respiratory phases, the average curves of inhalation and exhalation demonstrate an obvious difference between a healthy participant and a participant with a breathing problem. The important frequency area is between 100–600 Hz where there is an obvious difference between the curves of the healthy participant and the participant with bronchial obstruction. The overall outcome of such a measurement can be used to compare the patients and their breathing patterns while searching for abnormalities using dimensionless curves (Figure 10).

4. Discussion

The results indicate that the quality of the sound recording is very important for a successful and accurate analysis and the detection of the respiratory phases. When the breath sound is recorded with a minimum of undesirable noise, the algorithm is able to detect the phases with an accuracy up to 0.2 s with a minimum adjustment of the parameters. When there is a greater deviation from the accurate identification of the phases, it is mostly caused by the poor quality of the recording or a very slow frequency of breathing. The lowered quality of the recordings is frequently caused by a strong heart sound and/or the phonendoscope membrane.
In comparison with the other studies that have targeted the detection of the respiratory phases, the presented approach of the filters and envelope provides a robust, fast and efficient approach with little computational demands. On the one hand, the approach does not require any special accessories such as additional sensors or holders [6,10], but on the other hand there is a requirement for an additional piece of software and lower reliability of the algorithm while the recording contains a significant amount of noise. Other authors relied on band-pass filters (150–800 Hz or 500–5000 Hz) or VAD instead of low-pass and high-pass filters or included more parameters in the analysis. Unfortunately, this often makes the algorithm more computationally expensive [6,9,11]. This can be a very limiting factor as the examiner requires the results immediately after the examination. Recent studies have also highlighted the necessity of detecting the pauses between the inhalation and exhalation [12]. If such a pause existed in the recording, the presented algorithm is not able to detect such a pause and the indication line in the graph is placed in the middle of such a pause. In addition to that, the algorithm is not able to label which phase is the inhalation one and which phase is the exhalation one. Of course, there are other methods to determine the respiratory phases. For example, the methods based on the respiratory gas flow [16]. These methods can be very accurate but the instrumental and personal demands are considerably high.
The presented approach of the filters and envelope provides a robust and efficient approach with little computational demands. Although the amplitudes of the individual frequencies are biased by the pressure of phonendoscope on participant’s body, and therefore cannot be directly compared with other recordings, the introduced approach of the inhaling/exhaling proportion in the curves provides an objective parameter for comparing data between individuals.

5. Conclusions

The potential application of respiratory sound analysis is very broad in medicine—from online monitoring of the patient lung function or deep analysis of the sounds to detection of adventitious sounds in the breath sound recording which are not detectable by simple auscultation. It is believed that the automatic definition of respiratory phases has a great potential in the sound processing that could be very helpful for diagnostics of the respiratory diseases especially in children under five years of age. In this particular case, traditional methods such as spirometry are not effective. Moreover, this approach is a non-invasive and can be easily performed in a familiar environment by a general practitioner requiring a little or no cooperation from the young patients.
There is no doubt that the respiratory sound is an endless container of information that includes features and properties which are very beneficial for diagnosing in clinical practices and research. However, discovering and defining the relevant information is still very challenging. The first step in this process is a fast automatic detection of respiratory phases. It is necessary to further improve the available approaches and eliminate its imperfections in the future, for instance, flexibly and automatically define the value of change of respiratory phases f r p / 2 . The utilization of the proportional line of the respiratory phases as an operator for comparison of different respiratory sound recordings shows a great potential in general practice.

Author Contributions

Conceptualization, D.S. and V.K.; methodology, D.S., V.K. and F.L.; software, D.S.; validation, V.K. and F.L.; formal analysis, D.S. and F.L.; technical support for research, M.V.; hardware, M.V.; resources, F.L.; writing—original draft preparation, D.S. and D.H.; writing—review and editing, V.K. and M.D.; supervision, F.L.; project administration, D.S.; funding acquisition, D.S. and F.L. All authors have read and agreed to the published version of the manuscript.

Funding

This research is supported and founded by the Grant Agency of Charles University Project No. 902218 called Detection of Bronchial Obstruction Based on Analysis of Acoustic Phenomena in Breathing and by the programme Progres Q41.

Institutional Review Board Statement

The study was approved by the Ethics Committee of 2nd Faculty of Medicine of Charles University and University Hospital Motol 7 November 2017.

Informed Consent Statement

Informed consent was obtained from all subjects involved in the study.

Data Availability Statement

The presented data are original.

Acknowledgments

This research is supported by Czech-BioImaging—LM2018129 funded by MEYS CR.

Conflicts of Interest

The authors declare no conflict of interest.

References

  1. Sovijärvi, A.; Vanderschoot, J.; Earis, J.E. Standardization of computerized respiratory sound analysis. Eur. Respir. Rev. 2000, 10, 585. [Google Scholar]
  2. Pasterkamp, H.; Kraman, S.S.; Wodicka, G.R. Respiratory sounds. Advances beyond the stethoscope. Am. J. Respir. Crit. Care Med. 1997, 156, 974–987. [Google Scholar] [CrossRef] [PubMed]
  3. Vannuccini, L.; Earis, J.E.; Helistö, P.; Cheetham, B.M.G.; Rossi, M.; Sovijärvi, A.R.A.; Vanderschoot, J. Capturing and preprocessing of respiratory sounds. Eur. Respir. Rev. 2000, 10, 616–620. [Google Scholar]
  4. Sovijärvi, A.R.A.; Dalmasso, F.; Vanderschoot, J.; Malmberg, L.P.; Righini, G.; Stoneman, S.A.T. Definition of Terms for Applications of Respiratory Sounds. Eur. Respir. Rev. 1999, 10, 597–610. [Google Scholar]
  5. Sovijärvi, A.R.A.; Malmberg, L.P.; Charbonneau, G.; Vanderschoot, J.; Dalmasso, F.; Sacco, C.; Rossi, M.; Earis, J.E. Characteristic of breath sounds and adventitious respiratory sounds. Eur. Respir. Rev. 2000, 10, 591–596. [Google Scholar]
  6. Huq, S.; Moussavi, Z. Automatic breath phase detection using only tracheal sounds. In Proceedings of the 2010 Annual International Conference of the IEEE Engineering in Medicine and Biology, Buenos Aires, Argentina, 30 August–4 September 2010; IEEE: Piscataway, NJ, USA, 2010; pp. 272–275. [Google Scholar] [CrossRef]
  7. Earis, J.E.; Cheetham, B.M.G. Current methods used for computerized respiratory sound analysis. Eur. Respir. Rev. 2000, 10, 586–590. [Google Scholar]
  8. Earis, J.E.; Cheetham, B.M.G. Future perspectives for respiratory sound research. Eur. Respir. Rev. 2000, 10, 641–646. [Google Scholar]
  9. Nam, Y.; Reyes, B.A.; Chon, K.H. Estimation of Respiratory Rates Using the Built-in Microphone of a Smartphone or Headset. IEEE J. Biomed. Health Inform. 2016, 20, 1493–1501. [Google Scholar] [CrossRef] [PubMed]
  10. Moussavi, Z.K.; Leopando, M.T.; Pasterkamp, H.; Rempel, G. Computerised acoustical respiratory phase detection without airflow measurement. Med Biol. Eng. Comput. 2000, 38, 198–203. [Google Scholar] [CrossRef] [PubMed]
  11. Abushakra, A.; Faezipour, M. Acoustic Signal Classification of Breathing Movements to Virtually Aid Breath Regulation. IEEE J. Biomed. Health Inform. 2013, 17, 493–500. [Google Scholar] [CrossRef] [PubMed]
  12. Penzel, T.; Sabil, A. The use of tracheal sounds for the diagnosis of sleep apnoea. Breathe 2017, 13, e37–e45. [Google Scholar] [CrossRef] [PubMed]
  13. Charbonneau, G.; Ademovic, E.; Cheetham, B.M.G.; Malmberg, L.P.; Vanderschoot, J.; Sovijärvi, A.R.A. Basic techniques for respiratory sound analysis. Eur. Respir. Rev. 2000, 10, 625–635. [Google Scholar]
  14. MathWorks, Envelope Detection. Available online: https://www.mathworks.com/help/dsp/ug/envelope-detection.html (accessed on 8 November 2020).
  15. Nguyen, T.T.; Hoo, A.F.; Lum, S.; Wade, A.; Thia, L.P.; Stocks, J. New reference equations to improve interpretation of infant lung function. Pediatr Pulmonol. 2013, 48, 370–380. [Google Scholar] [CrossRef] [PubMed]
  16. Horacek, J.; Koucký, V.; Hladik, M. Novel approach to computerized breath detection in lung function diagnostics. Comput. Biol. Med. 2018, 101. [Google Scholar] [CrossRef] [PubMed]
Figure 1. Measurement scheme: 1—the physician, 2—the patient, 3—the measuring device phonendoscope Littmann 3200, 4—the soundproof room preventing entry of the noise from the surroundings (illustrative image).
Applsci 11 06535 g001
Figure 2. A flow-chart of the proposed algorithm. STEP 1: upload and visualization of the sound recording. STEP 2: use of high-pass and low-pass filter to remove ambient noise. STEP 3: finding of the positive envelope of the signal. STEP 4: Modification of the envelope. STEP 5: smoothing of the modified curve. STEP 6: finding of the borders of the respiratory phases as a minimum values of the curve.
Applsci 11 06535 g002
Figure 3. Unfiltered respiratory sound of a healthy female participant-Patient No. 1. Recorded at jugulum, age 13 years old, without bronchial obstruction. Chaotic progress of the acoustic pressure due to the noise in the sound. The phonendoscope Littmann 3200 records the amplitude of the acoustic pressure as a relative quantity normalized to maximum value 1. The amplitude of the acoustic pressure is therefore in arbitrary units.
Applsci 11 06535 g003
Figure 4. (a) Original filtered signal with positive and negative parts of the envelope; (b) detail.
Applsci 11 06535 g004
Figure 5. Respiratory sound filtered using high-pass (500 Hz) and low-pass filter (1600 Hz)-for the same healthy person as in the Figure 3 (Patient No. 1). The changes of the respiratory phases are expected at the regions with the minimum amplitude of acoustic pressure. An example of the noise caused by the equipment manipulation is well demonstrated at the time of 13 s.
Applsci 11 06535 g005
Figure 6. (a) Detail of modified envelope line with the elimination of the noise at the time of 13 s; (b) detail of smoothed modified envelope line.
Applsci 11 06535 g006
Figure 7. Sound signal with border lines-the individual respiratory phases (inspirations and expirations) are highlighted by the red vertical lines.
Applsci 11 06535 g007
Figure 8. The frequency spectrum of the respiratory sound with black, vertical border lines—Patient No. 1. In the spectrum, there are distinct sound defects caused by the manipulation with record equipment (amplitude distinct areas between 200 Hz–600 Hz with time duration roughly 0.02 s). In the spectrum, two distinct horizontal lines are also obvious—1110 Hz and 1330 Hz. These are most likely an effect of the background noise.
Applsci 11 06535 g008
Figure 9. Very chaotic frequency spectrum—Patient No. 2. Recorded at jugulum, age 17 years old, with pronounced bronchial obstruction. The vertical black boarder lines are helpful in this case. In the spectrum the wheezes (areas with sharply increased amplitude—some of them marked by white arrow) are very distinct.
Applsci 11 06535 g009
Figure 10. Comparing of two relative respiratory curves—healthy person (Patient No. 1) and patient with asthma (Patient No. 2).
Applsci 11 06535 g010
Publisher’s Note: MDPI stays neutral with regard to jurisdictional claims in published maps and institutional affiliations.

