1. Introduction
Monitoring the vital signs of people and their environment is an increasingly popular topic related to improving the quality of life and care for elderly, sick, or even healthy subjects [
1,
2,
3,
4]. It is also possible to use similar solutions to improve safety and comfort. Various devices ranging from simple motion sensors through sensor networks to cameras and vision systems are used to observe and record parameters, phenomena, or the environment. Common hazards for the disabled or elderly include falls, cuts, bruises, burns, and, especially in the event of a sudden spread of infectious diseases, contact with a person having elevated body temperature. Warning against people with elevated body temperature can prevent or limit the spread of diseases. The proposed solution here is based on the Flir One Pro thermal camera [
5] working with an Android mobile phone. The used camera records a thermal image and transfers this information to the mobile device.
The discussed system uses the Flir One Pro camera with an optical thermal camera resolution of (images are scaled to by the camera), and an upper temperature limit of 400 °C. The device records images at a frequency of 8 frames per second.
Accuracy is at ±3 °C in a full temperature range. When using this camera in the range of 23–38 °C, accuracy is about 0.5 °C (in comparison with a better thermal camera, Flir T420sc). When precise body-temperature measurement is needed, a better camera can be used (
Figure 1). However, such mobile cameras are not currently available on the market.
Modern smartphones or tablets to which the camera can be connected provide additional vast hardware capabilities that allow for the potential extension of the proposed solution, and the expansion of the image-analysis algorithm. Data from the thermal camera (in the form of temperature in degrees Celsius) in the observed area can be used to monitor hazards associated with elevated body temperature. The thermal camera mounted at chest height records the thermal image directly in front of the user and transmits it to the mobile monitoring application in which the measurement is made, and the degree of danger is determined. The algorithm (discussed below) implemented in the application allows for an appropriate reaction when a person with elevated temperature is detected. When objects with a temperature above 35 °C appear in the field of view, the system automatically detects them and determines the approximate distance from the object. The proposed solution assumes that the human head meets these assumptions, and temperature in its area exceeds 35 °C. In addition, if a temperature above 38 °C occurs in this area, the system may generate a warning about the danger associated with a person.
The problem of determining distance is an important issue in image-analysis and object-tracking systems, and is widely discussed in the available literature. Most often, these solutions are used to monitor the distance between vehicles [
6], assess the location of objects in automation and robotics systems [
7], and reconstruct 3D scenes [
8]. The proposed algorithms apply image-analysis methods and two main approaches, i.e., using one or two cameras [
9]. It is relatively easy to use two cameras that, at the right location, provide images of the object from two different positions at the same time.
Determining distance with this method is characterized by high efficiency. In [
10], the authors proposed a driver-support system using stereoscopy and deep learning to detect and determine distance to a vehicle.
Another example is described in [
11], where two visible light cameras were used to estimate the distance. The known camera parameters, their mutual position, and trigonometric relationships were applied.
Stereoscopy was also used in [
12], where methods based on geometry and triangulation were used.
When using a single camera, system costs are lower, but effectiveness may also be lower. Moreover, camera parameters have greater impact on accuracy. In these methods, the camera movement is most often used with proportional changes in the size of the observed object in the image or geometrical relationships in the scene, e.g., when moving away from the object, its size is reduced, and further objects move more slowly in the image [
9]. These methods often require initial information on object size and camera parameters. In [
13], the authors used a single camera to estimate distance to obstacles in the way of a train.
In [
14], a distance-assessment method using information about reference objects in the image was proposed. In this case, data about the location and size of the known object or known shape in the field of view helpedd in determining the distance. The method was used to control a robot.
Another example of using a single camera is related to determining distance to vehicles [
15].
Active distance measurement using additional ultrasonic sensors, lasers, or radars is a completely different approach [
16]. In this case, information from the sensors is the basis for distance assessment. Systems of this type are very efficient, but their cost may be higher compared to image-analysis systems. To assess distance, images from two cameras can also be used (thermal and visible light). However, there is the problem of determining the correspondence between images. The authors in [
17] used this technique to reconstruct models in 3D using a smartphone camera and the Flir One thermal camera. All the above-presented methods were used to determine or classify the distance to objects or vehicles. However, distance classification mechanisms can be extended and used to inform about an approaching human figure. This type of solutions may warn against a person with elevated body temperature. The use of stationary thermal cameras for the rapid detection of potentially sick people was proposed several years ago during the SARS outbreak [
18,
19]. Systems of this type were installed at airports and stations, and allowed for detecting potentially sick people in a quick and noninvasive manner. In the current situation, with the rapid spread of the SARS-CoV-2 coronavirus [
20], this type of mobile system could be used to alert the user of an approaching a person with elevated body temperature. This paper proposes the use of a mobile thermal camera to detect persons with elevated body temperature and estimate the approximate distance from them. After obtaining this information, the system informs the user that a person with elevated body temperature is approaching them, which may allow for taking preventive measures. In the available literature, it is difficult to find cases of directly determining the distance to the object using a thermal camera. On the basis of literature analysis, a distance-estimation method is proposed that is based on a single thermal camera using object tracking in subsequent frames of image sequences, and distance classification using machine-learning methods. The presented algorithm automatically and in real time analyzes images from the mobile thermal camera, detects and tracks a person with an elevated temperature, and reports the distance to them.
2. Materials and Methods
To perform this study, a series of thermal images of human figures were recorded. The images were recorded in over a dozen of sequences at different times. The training set contained over 580 thermal images of a warm object at different distances (179 for 1 m, 224 for 2 m, and 178 for 3 m), and the test set consisted of 4233 images. The sets included various cases and locations of the warm objects and people, different clothing, and headgear. The image resolution (transferred to the analysis algorithm) was
pixels, and temperatures recorded in the images ranged from about 23 to 40 °C (people in room temperature). Images were recorded in a vertical orientation.
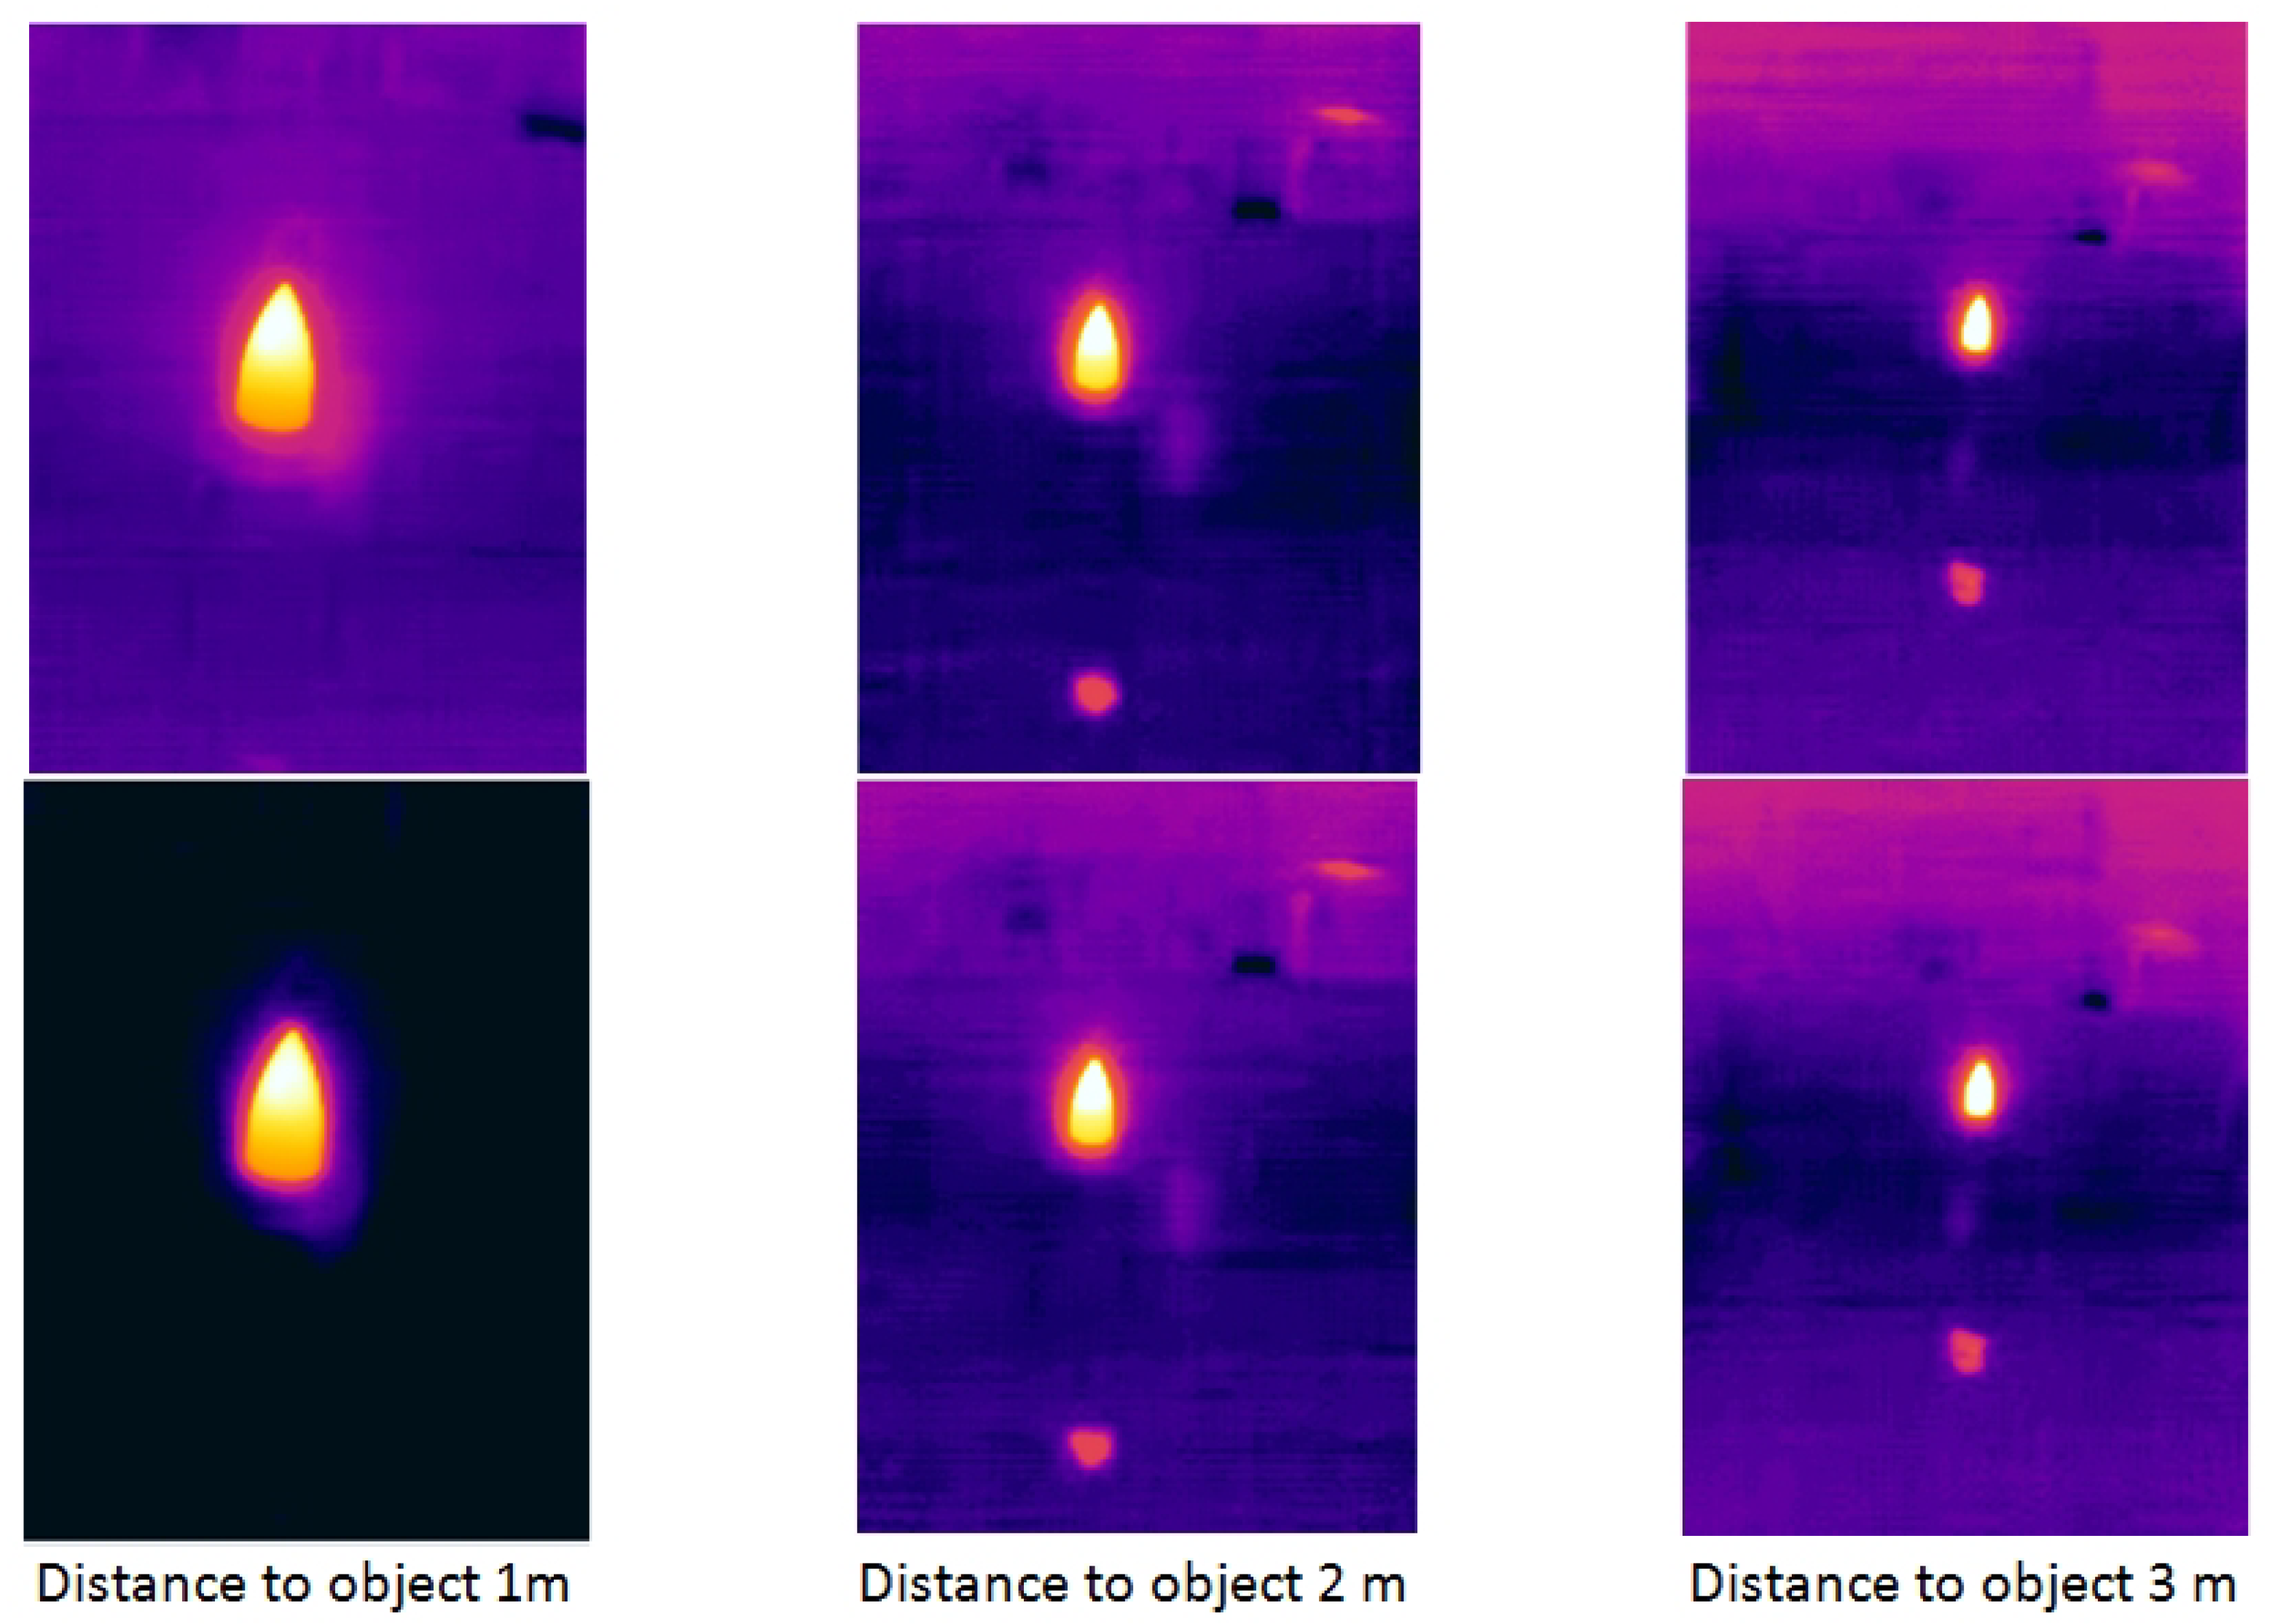
Figure 2 shows images in the form of thermograms containing the hot object at different distances (1, 2, and 3 m). The sample images represent the location of a warm object (used in the training set) at different distances from the thermal camera. As distance increased, the size of the object decreased.
While approaching the hazardous object with an elevated temperature, the user is warned with messages of increased intensity as distance to the object decreases.
2.1. Assumptions of Proposed Method for Localization the People with Elevated Body Temperature
At the testing stage, several distance ranges were checked: 0.25 to 2.0 m every 0.25 m, and 1 to 3 m every 1 m. As a result of preliminary observations and measurements, obtaining accuracy of 0.25 or 0.5 m using available mobile thermal cameras was very difficult or even impossible. However, it was possible to determine the distance to a dangerous object with accuracy of 1 m. The basic assumptions that ensured the proper operation of the automatic system for determining distance to people with the highest temperature, and the limits are discussed below.
Requirements:
mobile thermal camera with a minimal frequency of 8 fps;
thermal camera mounted at chest height;
for measuring distance, small sideways movements of the camera or the observed person;
small movements due to the slow walking speed of the camera user or the observed person.
Purposes:
remote noncontact temperature measurement and localization of people with increased or high temperatures;
automatic image analysis directly on a mobile device;
no need to control and manipulate the device;
estimating distance to a dangerous object and distance classification in ranges of 1, 2, and 3 m;
detection of forward-, left-, or right-facing profiles;
use of the application in closed spaces with limited influence of ambient temperature;
the detection and tracking of one person with the highest temperature in the area of the head moving towards the thermal camera.
Limits:
if the image of the warm objects stops moving, the system displays the last measured distance value;
values of the linear acceleration of the smartphone with a camera not exceeding 0.7 m/s in the X and Y axes for slow walking.
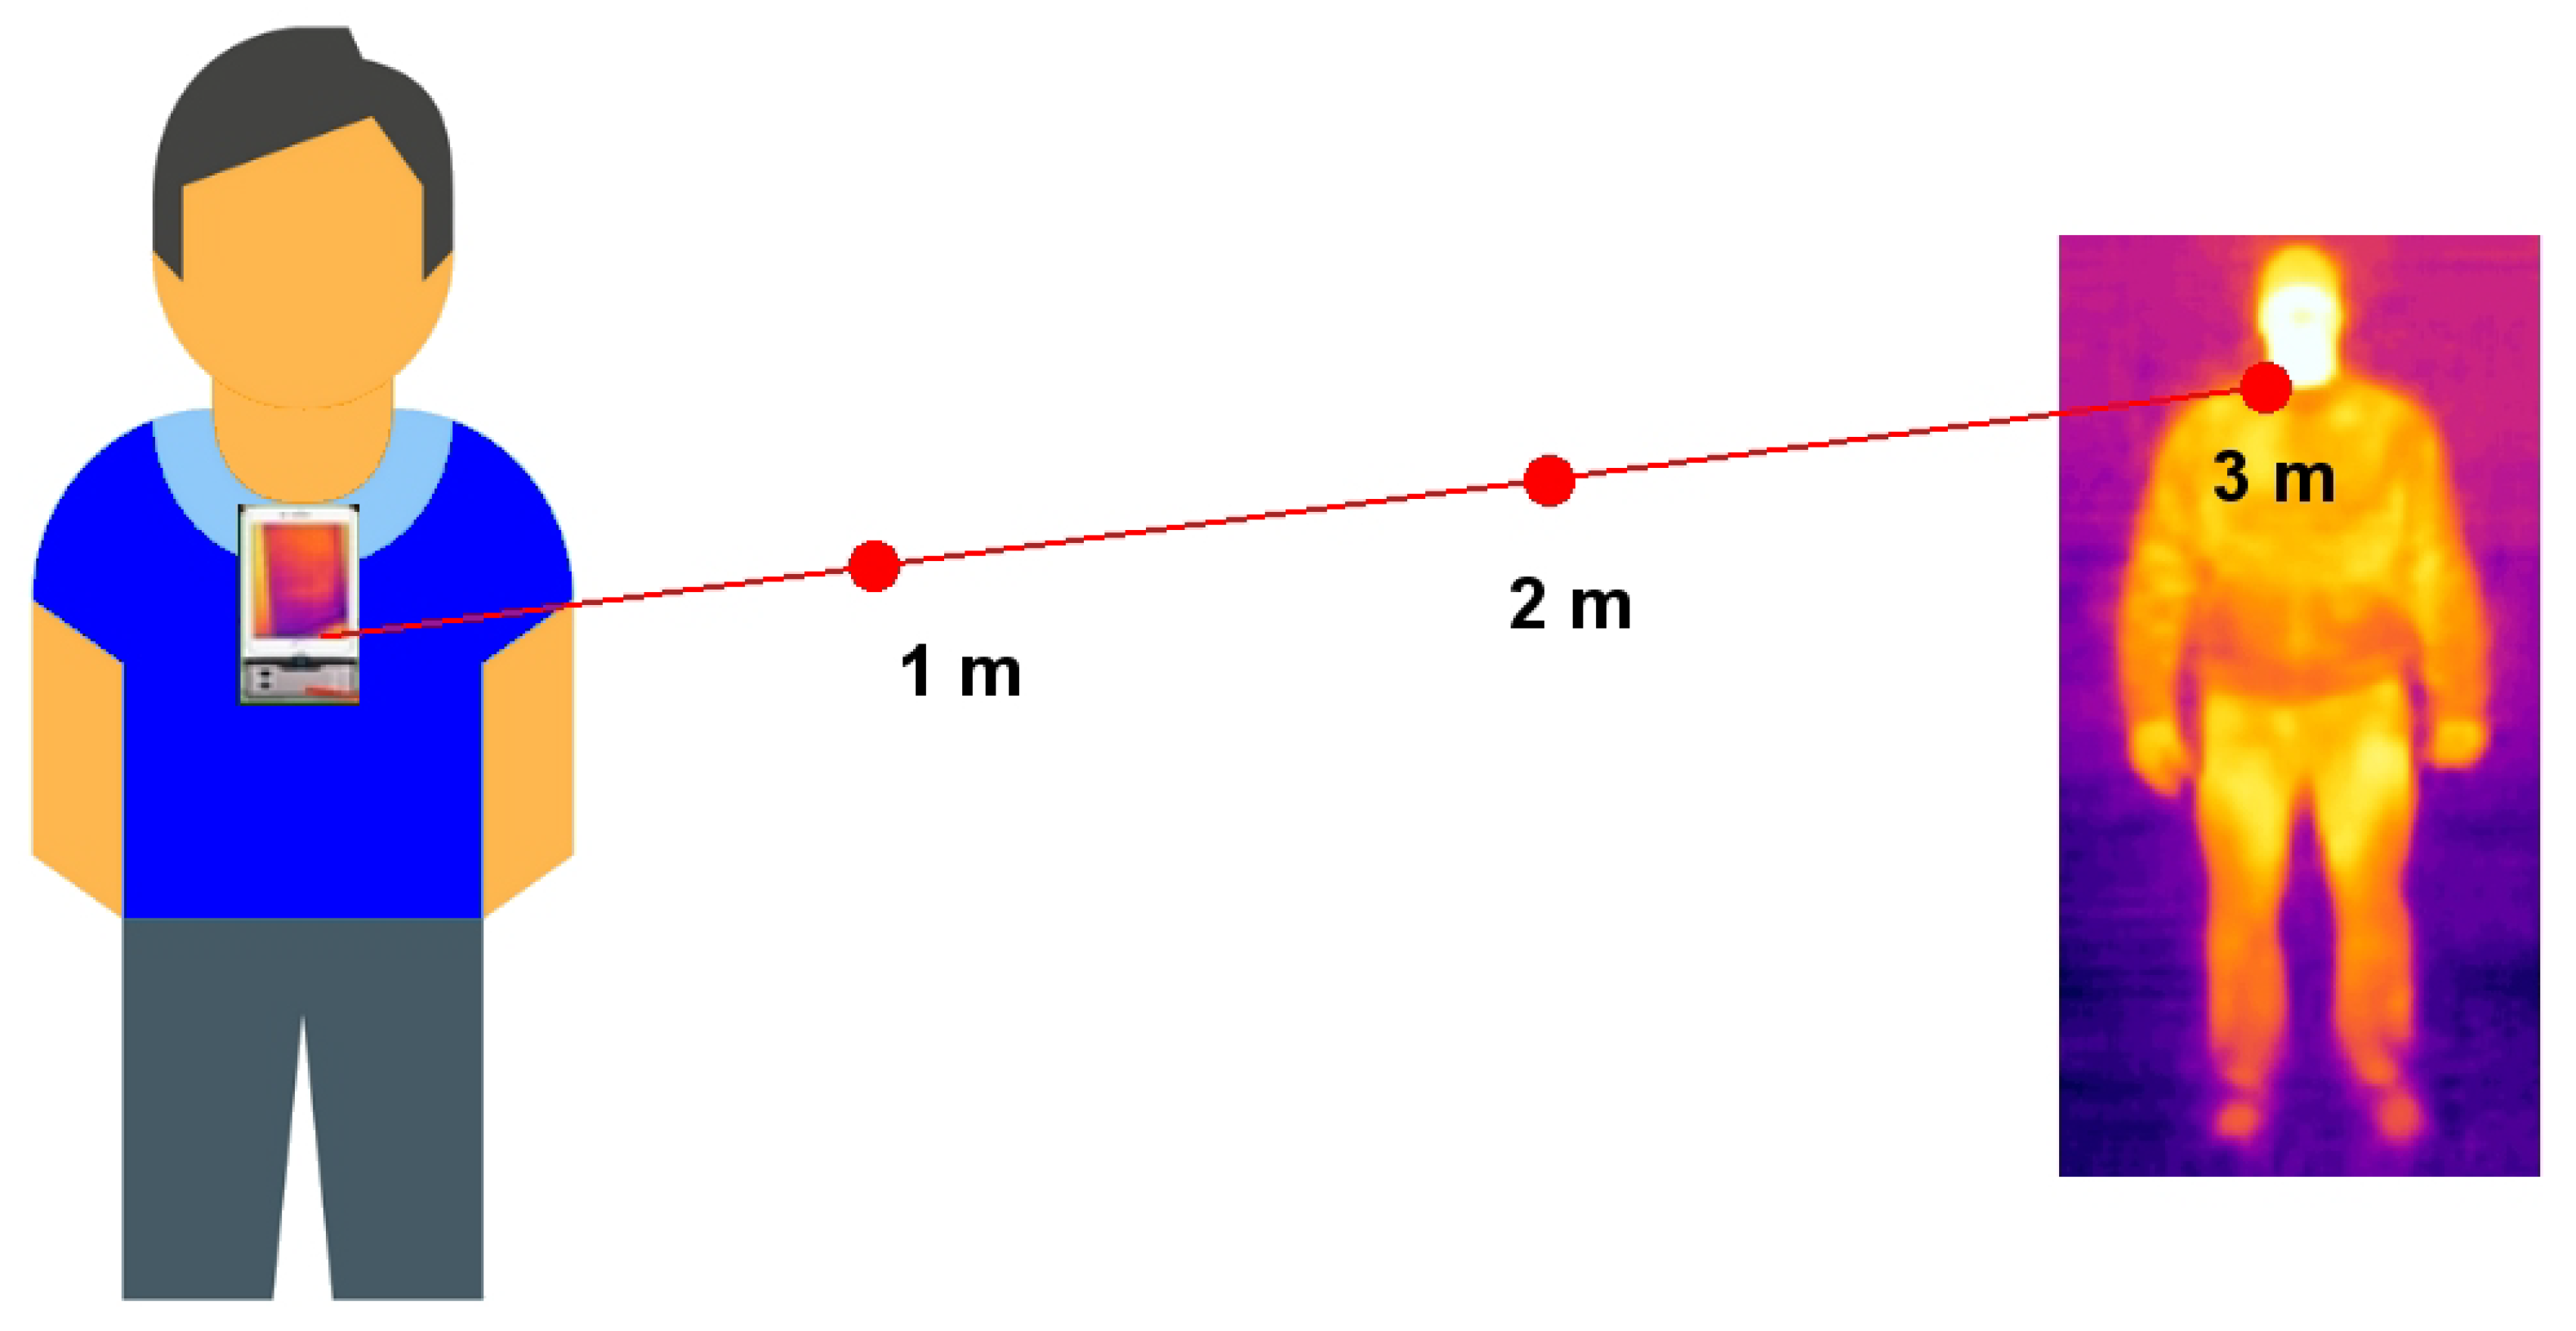
Meeting these requirements allowed for preparing a system that determines the approximate distance to a person with elevated temperature using a single thermal camera. The attachment of the devices is illustrated in
Figure 3. For convenience, user’s comfort, and device dimensions, a good and practical solution seems to be mounting the devices onto the chest. Body temperature does not affect the camera measurement because the smartphone with the thermal camera is packed in one casing.
The threshold temperature value of 35 °C was adopted on the basis of previously described temperature values with different levels of hazards for health and life. Higher temperature objects or areas are detected and tracked by the system. For the detection of a human figure (head), a temperature threshold of 35 °C was adopted, whereas for the detection of a person with elevated body temperature, the threshold was 38 °C.
2.2. Proposed Method
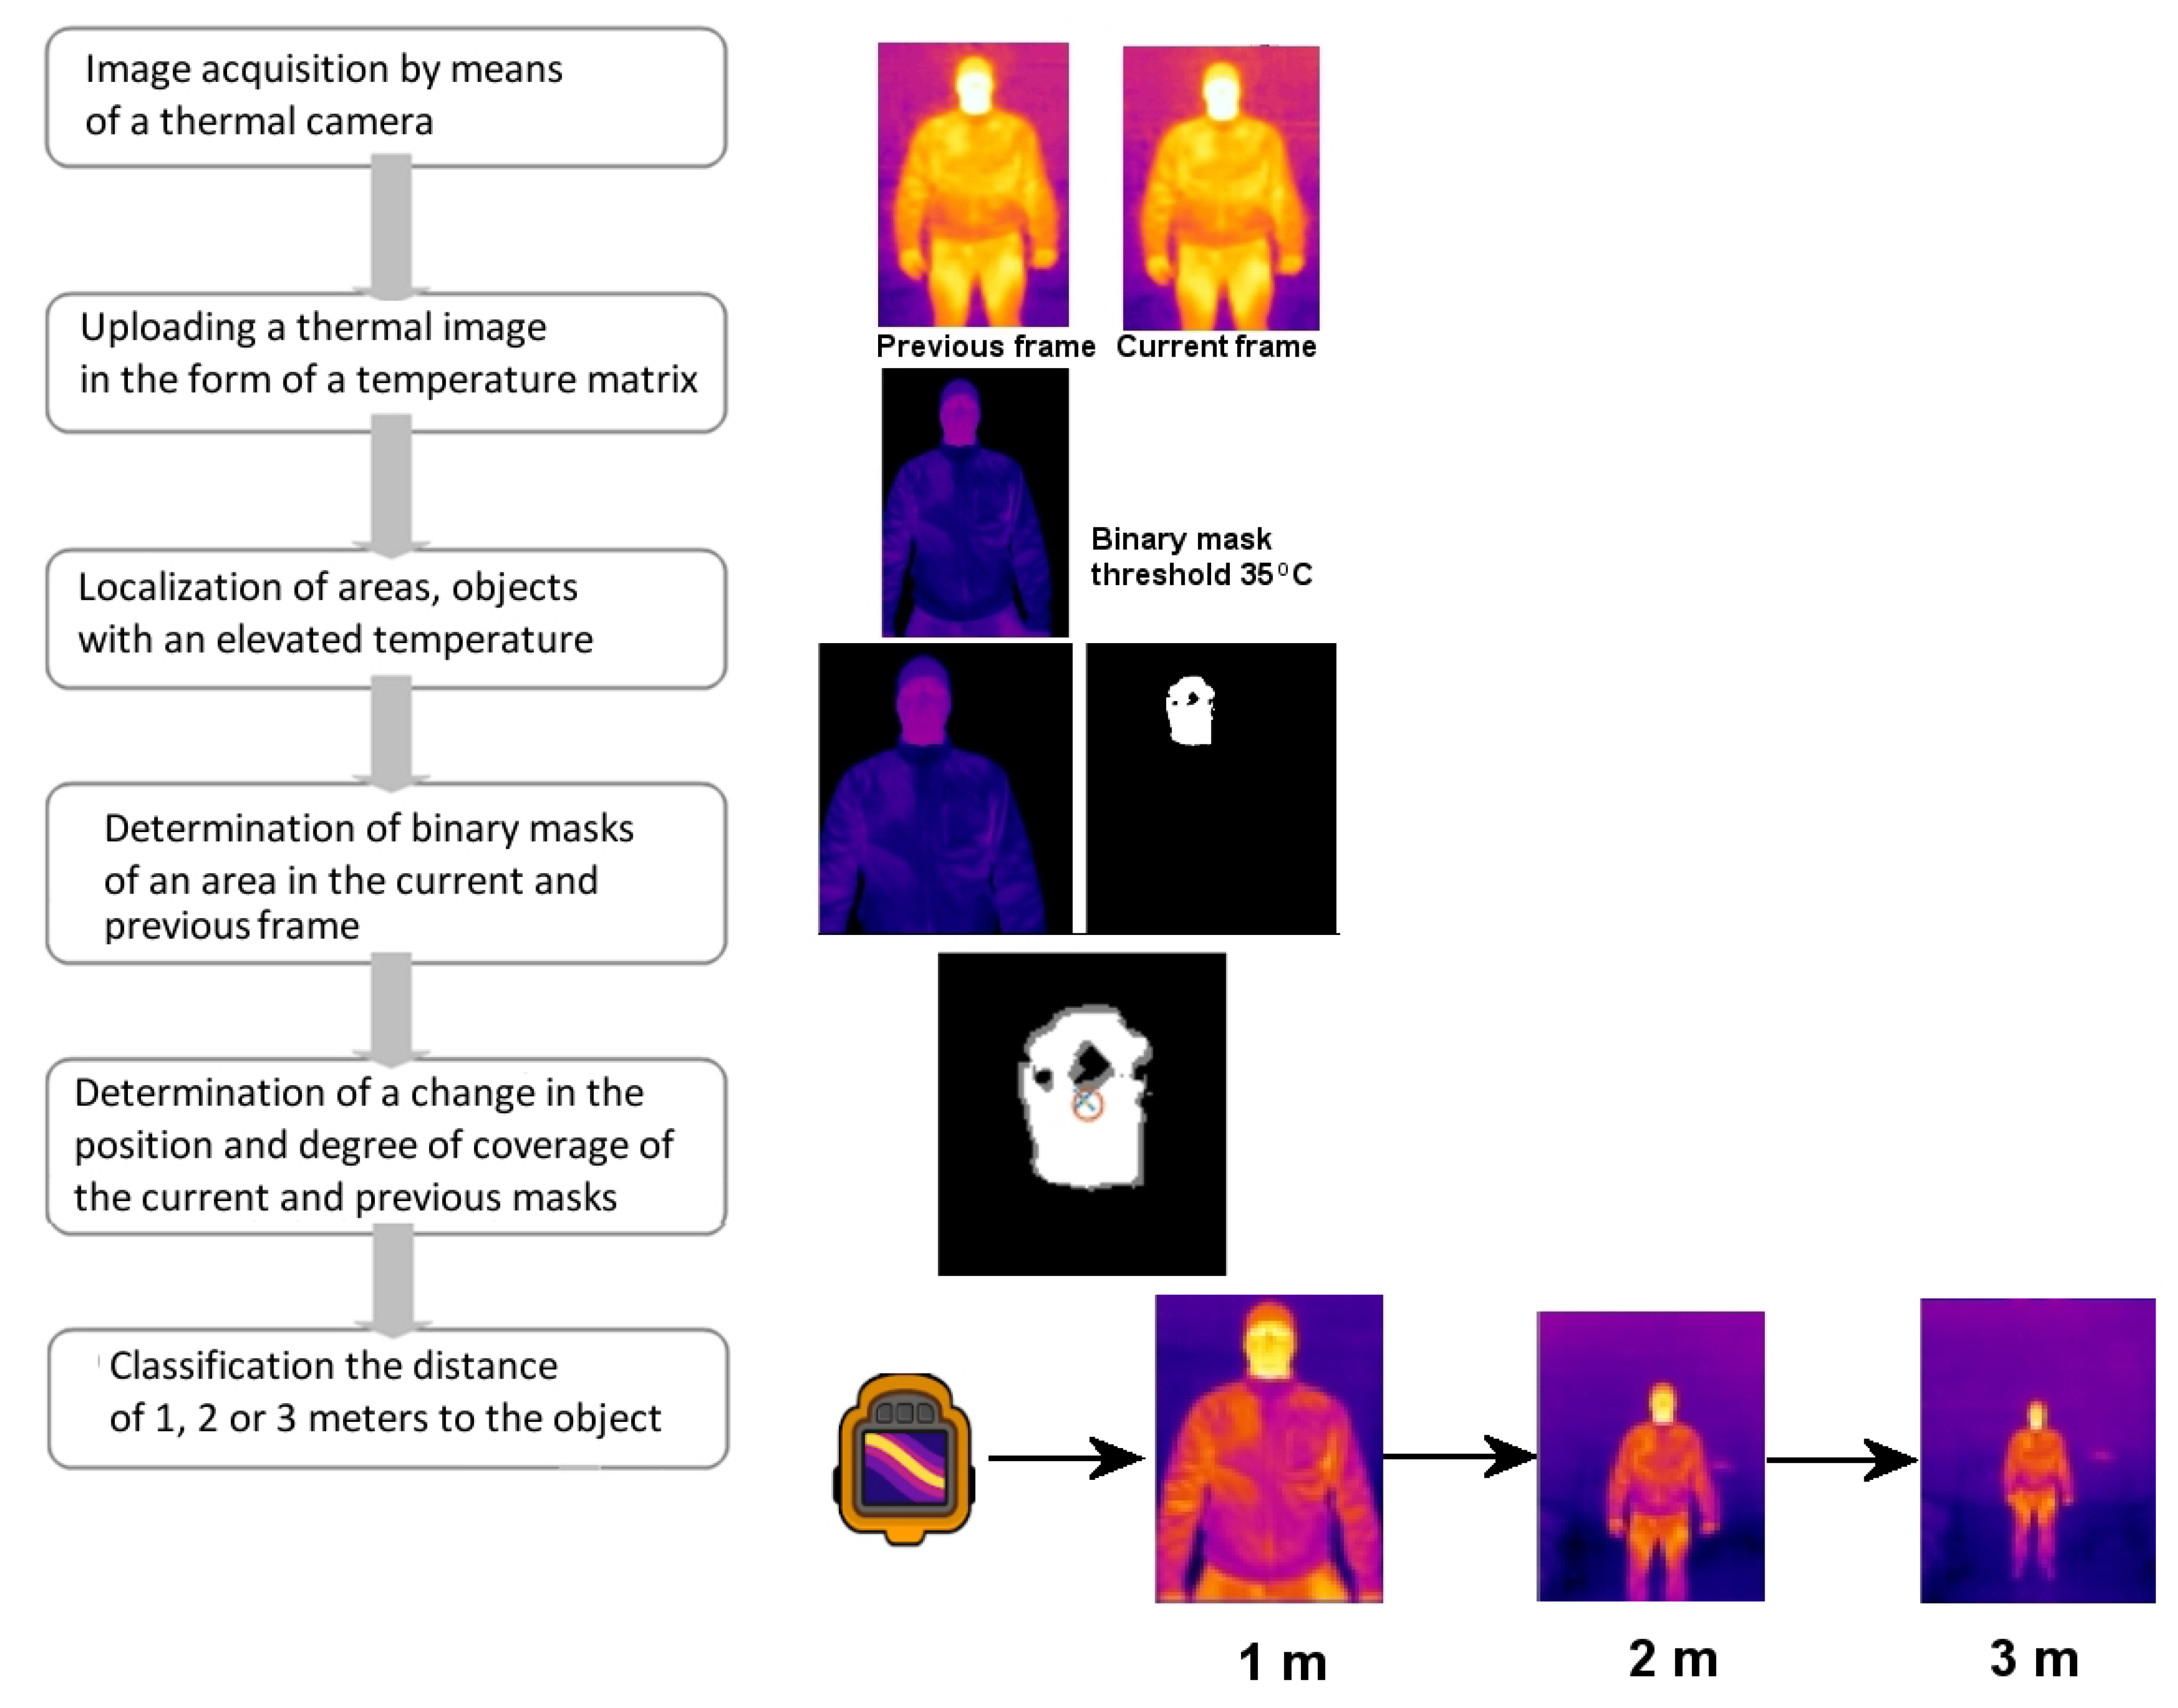
A block diagram of the developed algorithm is presented in
Figure 4 and its individual stages are discussed below (for the detection of a warm object and a human head). The thermal camera records images at a frequency of 8 frames per second. Raw data are transformed into a temperature matrix in degrees Celsius. The temperature matrix with a resolution of
is transferred to the image-analysis algorithm, which detects areas above 35 °C by means of image thresholding (with a threshold of 35 °C). It then selects the largest object with temperature above the threshold and tracks its position in the subsequent frames by determining the binary mask and its centroid. In the case of two (or more) warm objects (in different distances from the camera), the nearest one (the object with the highest binary mask) is selected as the first one. In the case of several objects (at the same distance from the camera), the warmest is selected.
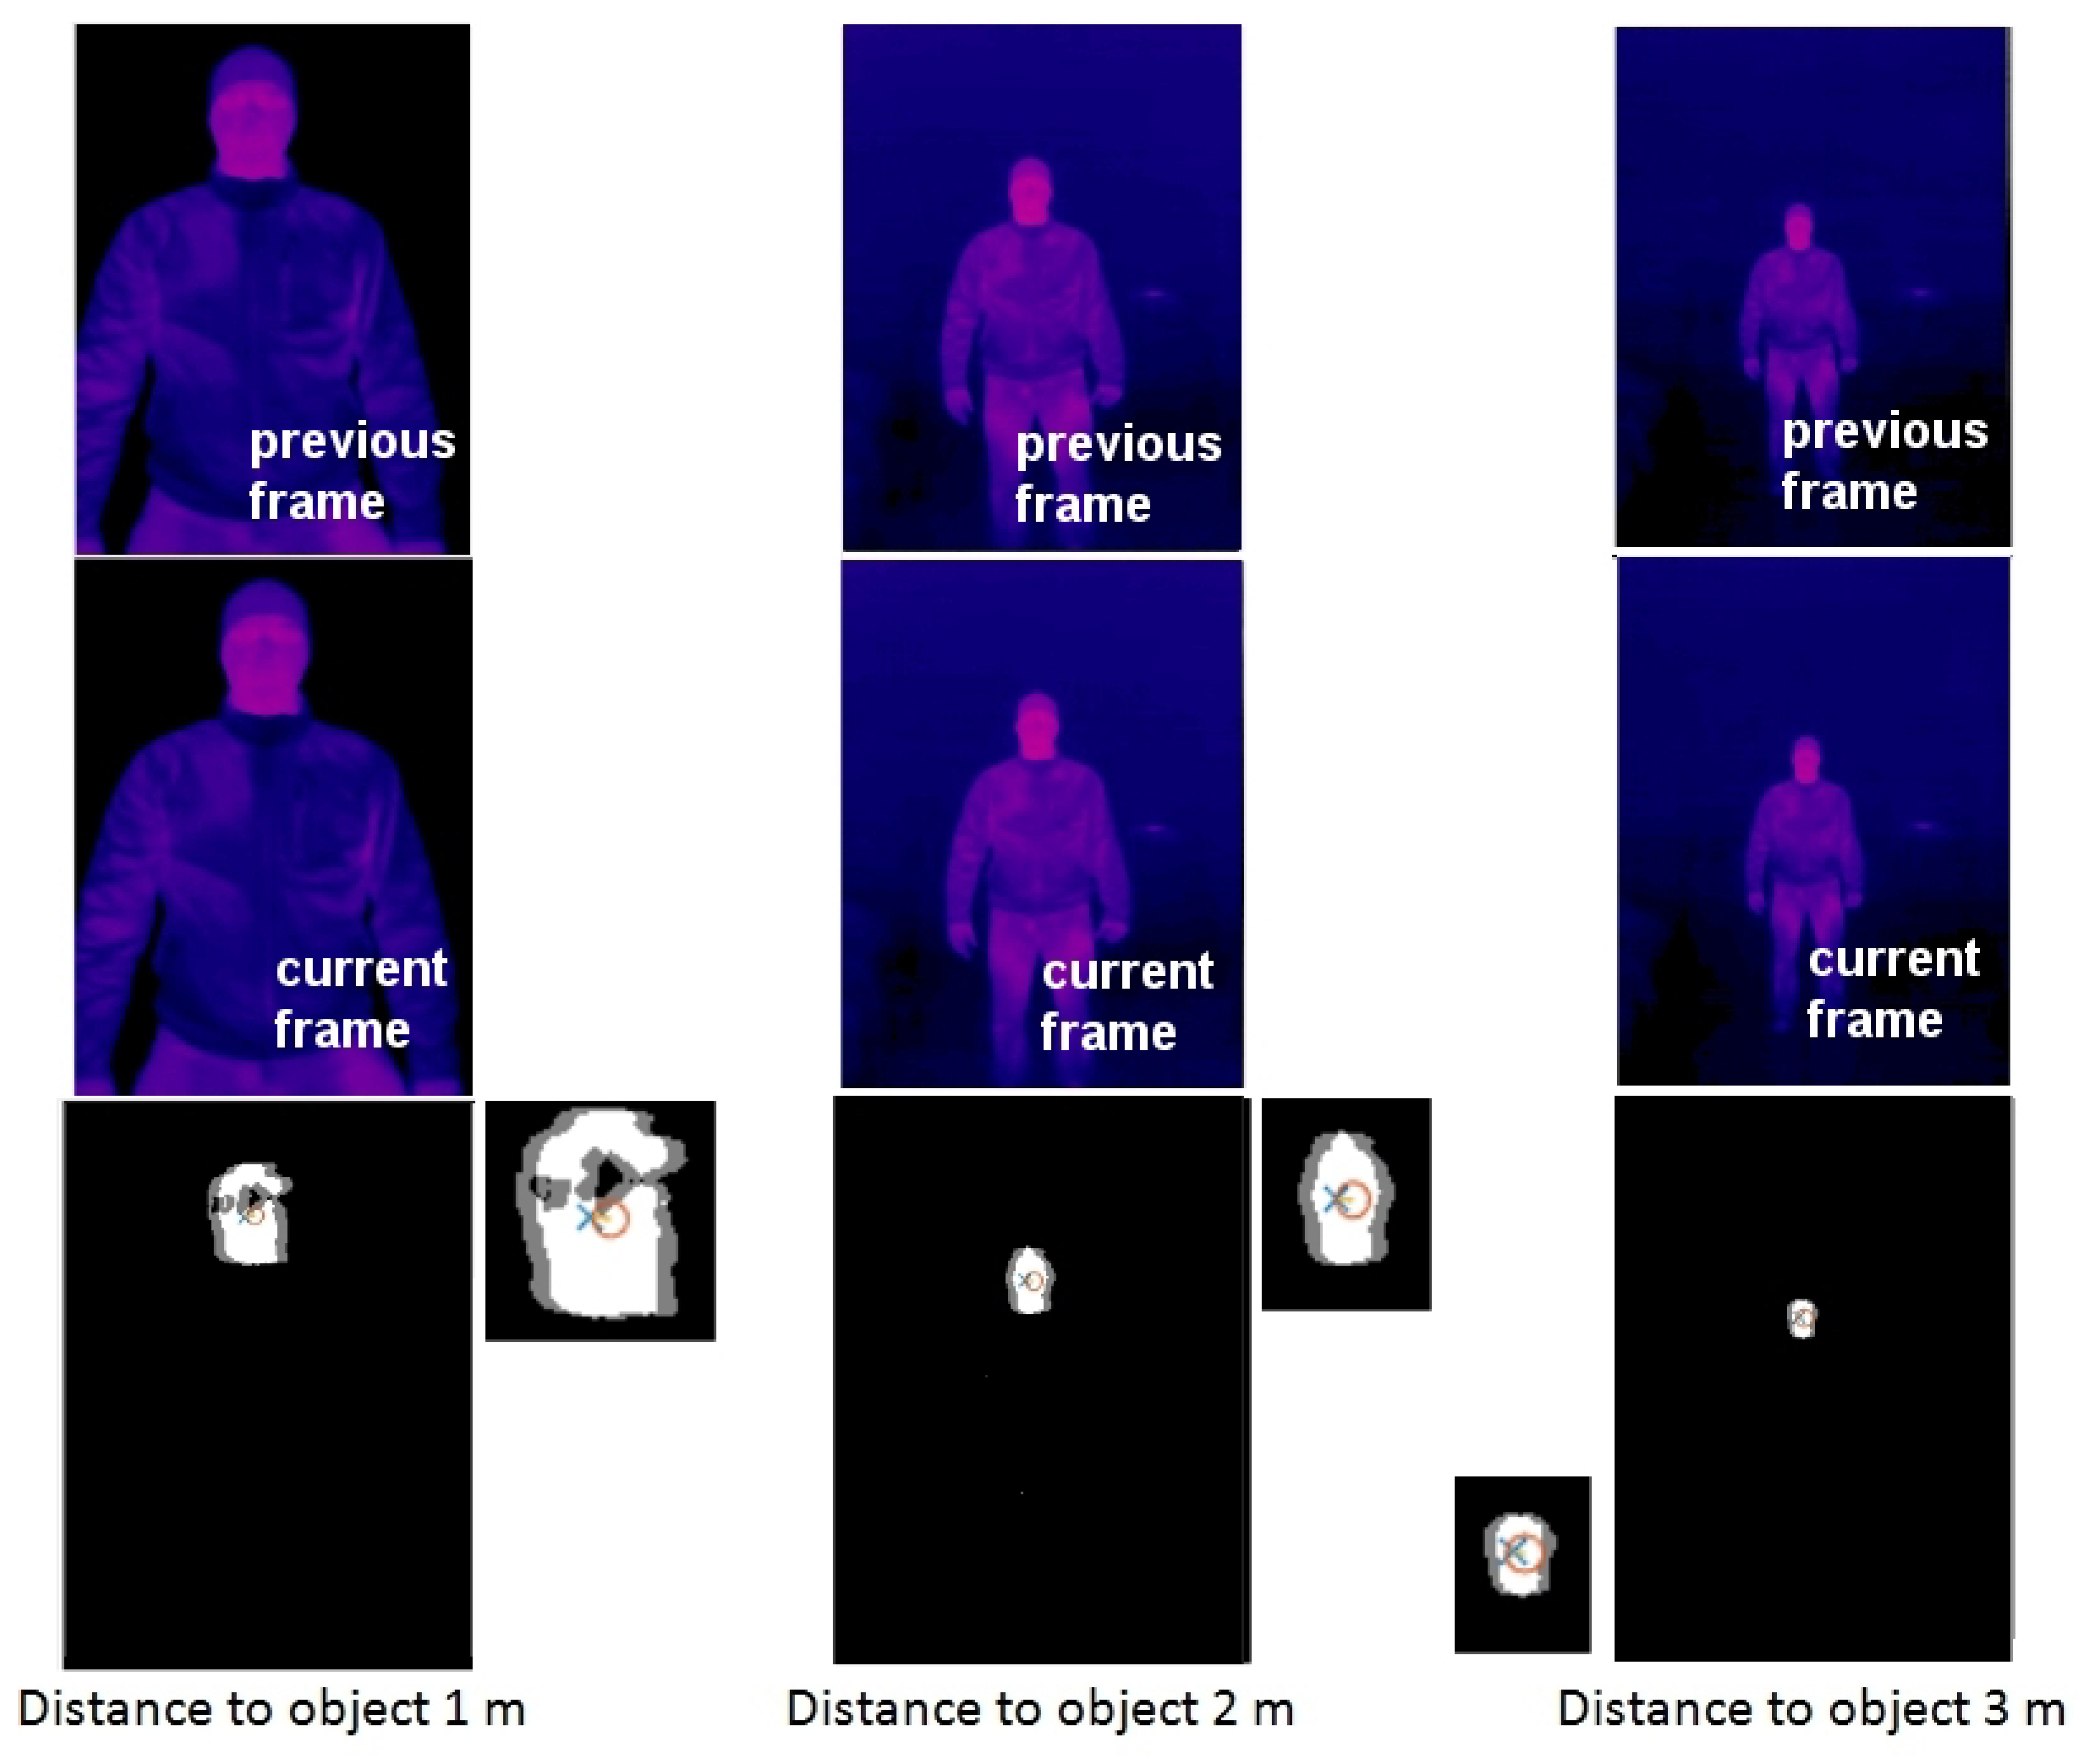
If areas other than the binary mask of the head (for example, fragments of the neck or forearms) or small areas with an elevated temperature appear after the thresholding operation, the algorithm removes them, leaving the largest and warmest area for further analysis. In the case of the next image in the sequence, the head area is determined in the same way, but it is additionally verified whether it is the closest area that meets the above-mentioned criteria. The thresholding operation is shown in
Figure 4 at the stage of determining the area mask, and it is carried out for each image in the sequence. For each subsequent frame, Euclidean distance
between the coordinates of the object mask centroid (in the current frame) C
and the coordinates of the object mask centroid (in the previous frame) C
is determined, as shown in (1).
where C
—X, Y coordinates of the object binary mask centroid in the current frame;
C—X, Y coordinates of the object binary mask centroid in the previous frame;
i—subsequent pair of images (previous and current).
In addition, to determine the shift degree of the entire object in subsequent frames, the Jaccard index is calculated as shown in (2), which enables assessing to what extent the masks of areas in subsequent frames coincide. The Jaccard index (J) is the intersection of two binary images divided by the union of these images [
21]. In this case, J is calculated for the binary mask of the warm object in the previous frame (marked as A) and the binary mask in the current frame (marked as B).
When the degree of coverage of masks in subsequent frames is known, the effect of the object size can be considered, and it is thereby easier to estimate the distance in connection with the change in the position of the area mask centroid. As a result, shift value
and the Jaccard index are determined for each subsequent pair of frames.
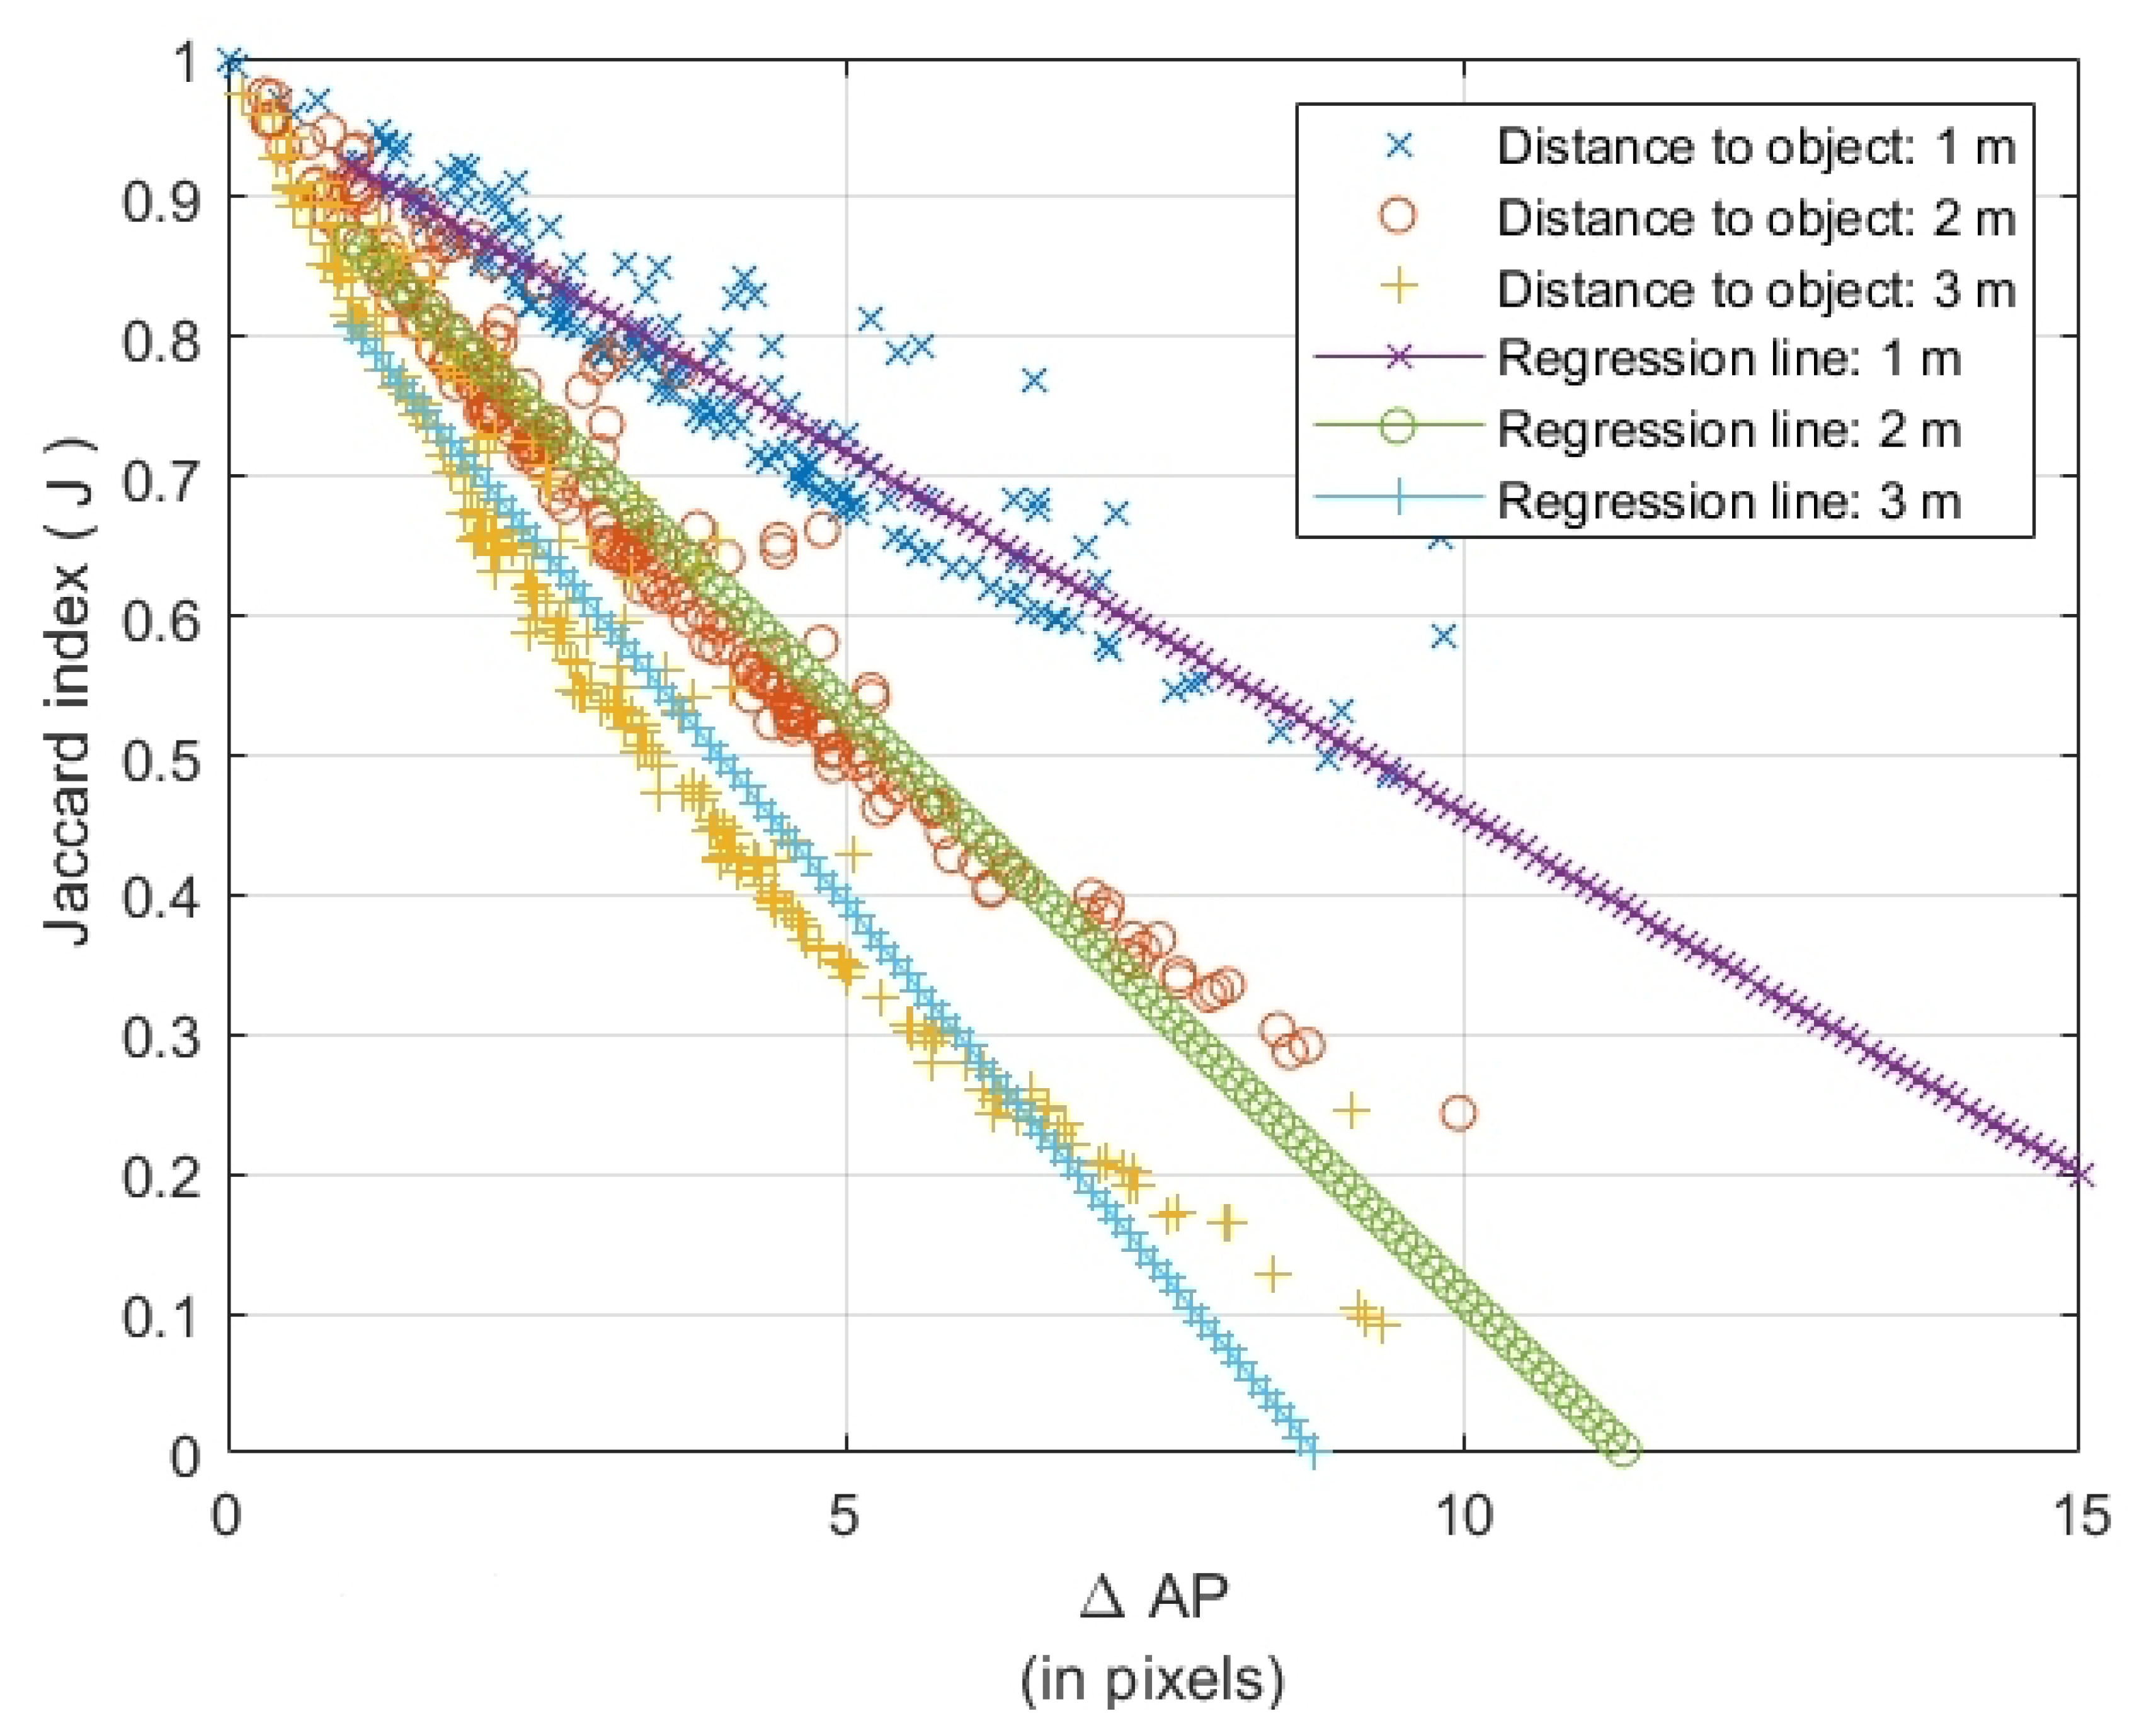
Figure 5 shows that, despite similar object centroid shift values, the Jaccard index for the masks is slightly different (which is related to different distances, holes in the binary mask). The Jaccard index normalizes the results of measuring the coverage of binary masks from the previous and current frame regardless of the distance and absolute size of the mask. At the same time, as the distance from the observed person increases, the Jaccard index value decreases, which is one of the reasons why it is possible to determine the distance.
Figure 5 presents two subsequent frames (from up to downwards) from a sequence of thermal images taken for different distances from the object, namely, 1, 2, and 3 m. There are constant measurements as long as the camera or person is in motion, i.e., the shape of the person moves inside the framed image. When the movement stops, the distance measurement shows the last value.
Feature values
and J recorded in this way in the entire examined set (training set—artificial object
Figure 2) of images for 3 sequences (1, 2, 3 m) are presented in the graph in
Figure 6. Subsequent measurement cases for 3 classes (for a distance of 1, 2, and 3 m to the test object) were concentrated in 3 categories but showed differentiation among categories. This suggests that the data are separable to a certain extent (considering camera movements), which may allow for the correct classification of distance by classifying observations into a specific category.
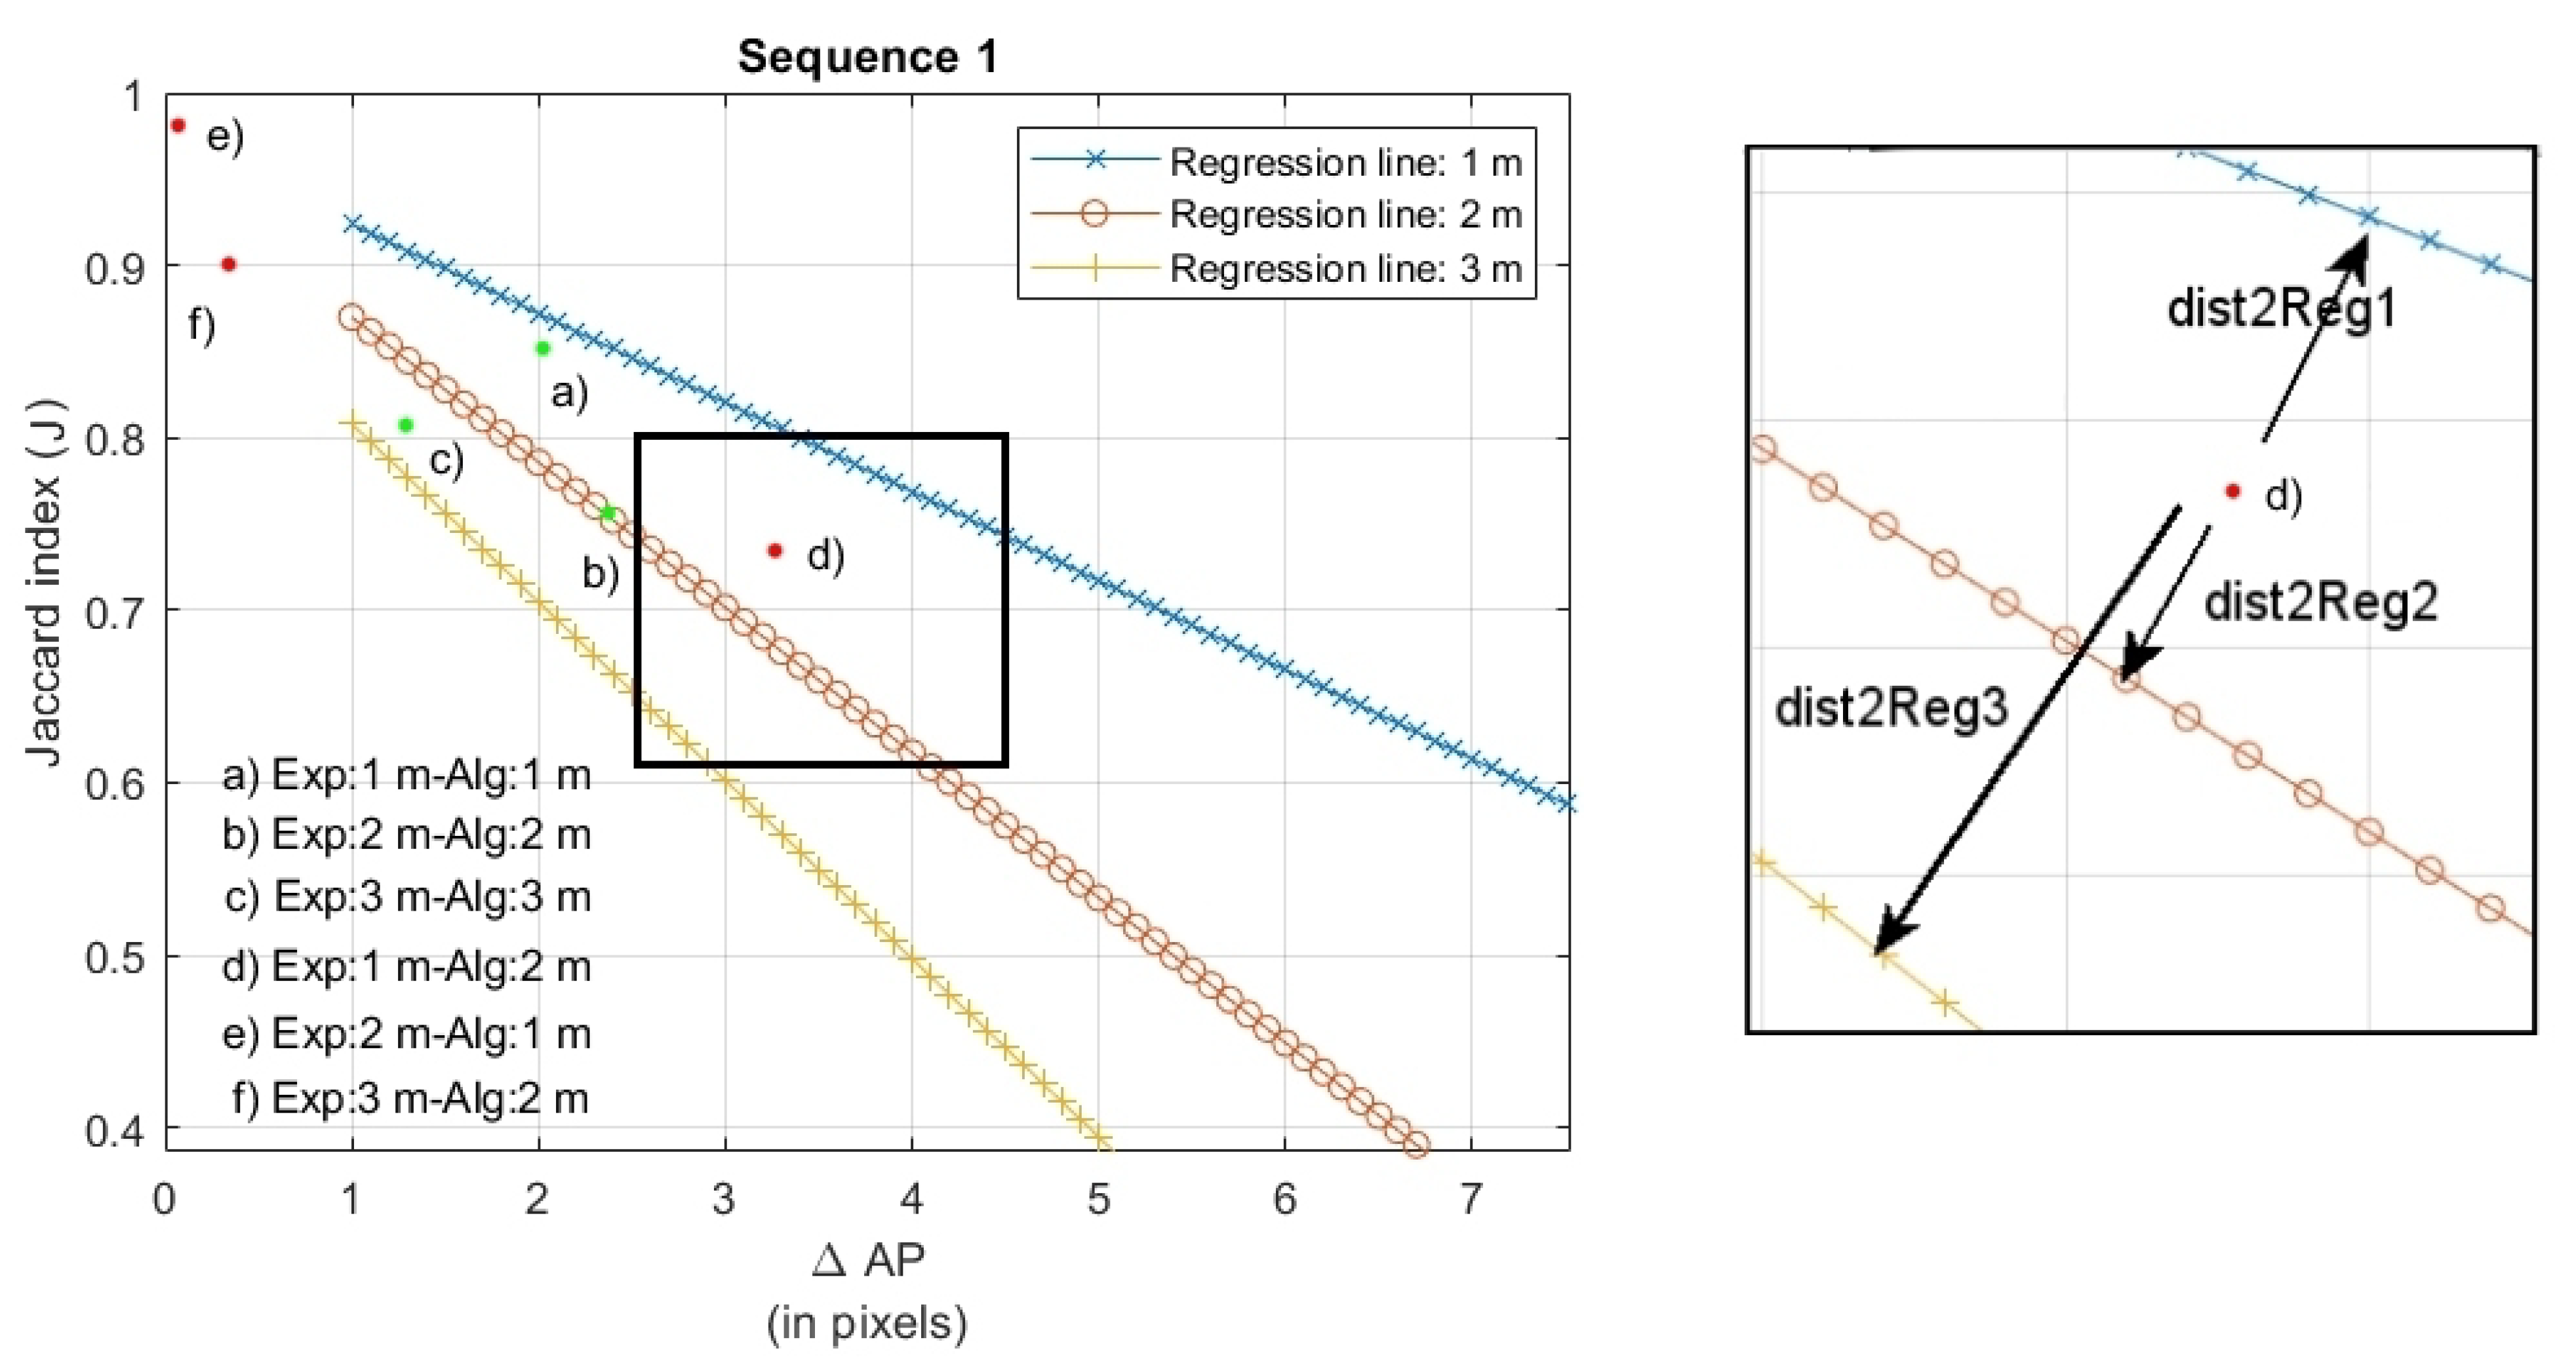
Following this approach, the proposed algorithm automatically categorizes distance to an object and estimates how far from the observer it is (with accuracy of 1 m). The linear-regression method was used as the classifier. For each distance category (reg1, reg2, reg3), the regression function was determined for the values of
and J. In the range of
2–8, individual observations could easily be classified (
Figure 6). As a classification method, it was proposed to measure the distance of the examined point (with coordinates
and J) from each of 3 simple regression functions (3). The category to which the studied case was the closest was determined on the basis of the distance between the measurement point and straight line.
where A, B, C—straight line coefficients: Ax + By + C = 0
P—point, x,y—point coordinates
The minimal distance (Equation (
4)) indicates to which category the examined image is most similar, and what the distance to the object is—Figure 10.
3. Results and Discussion
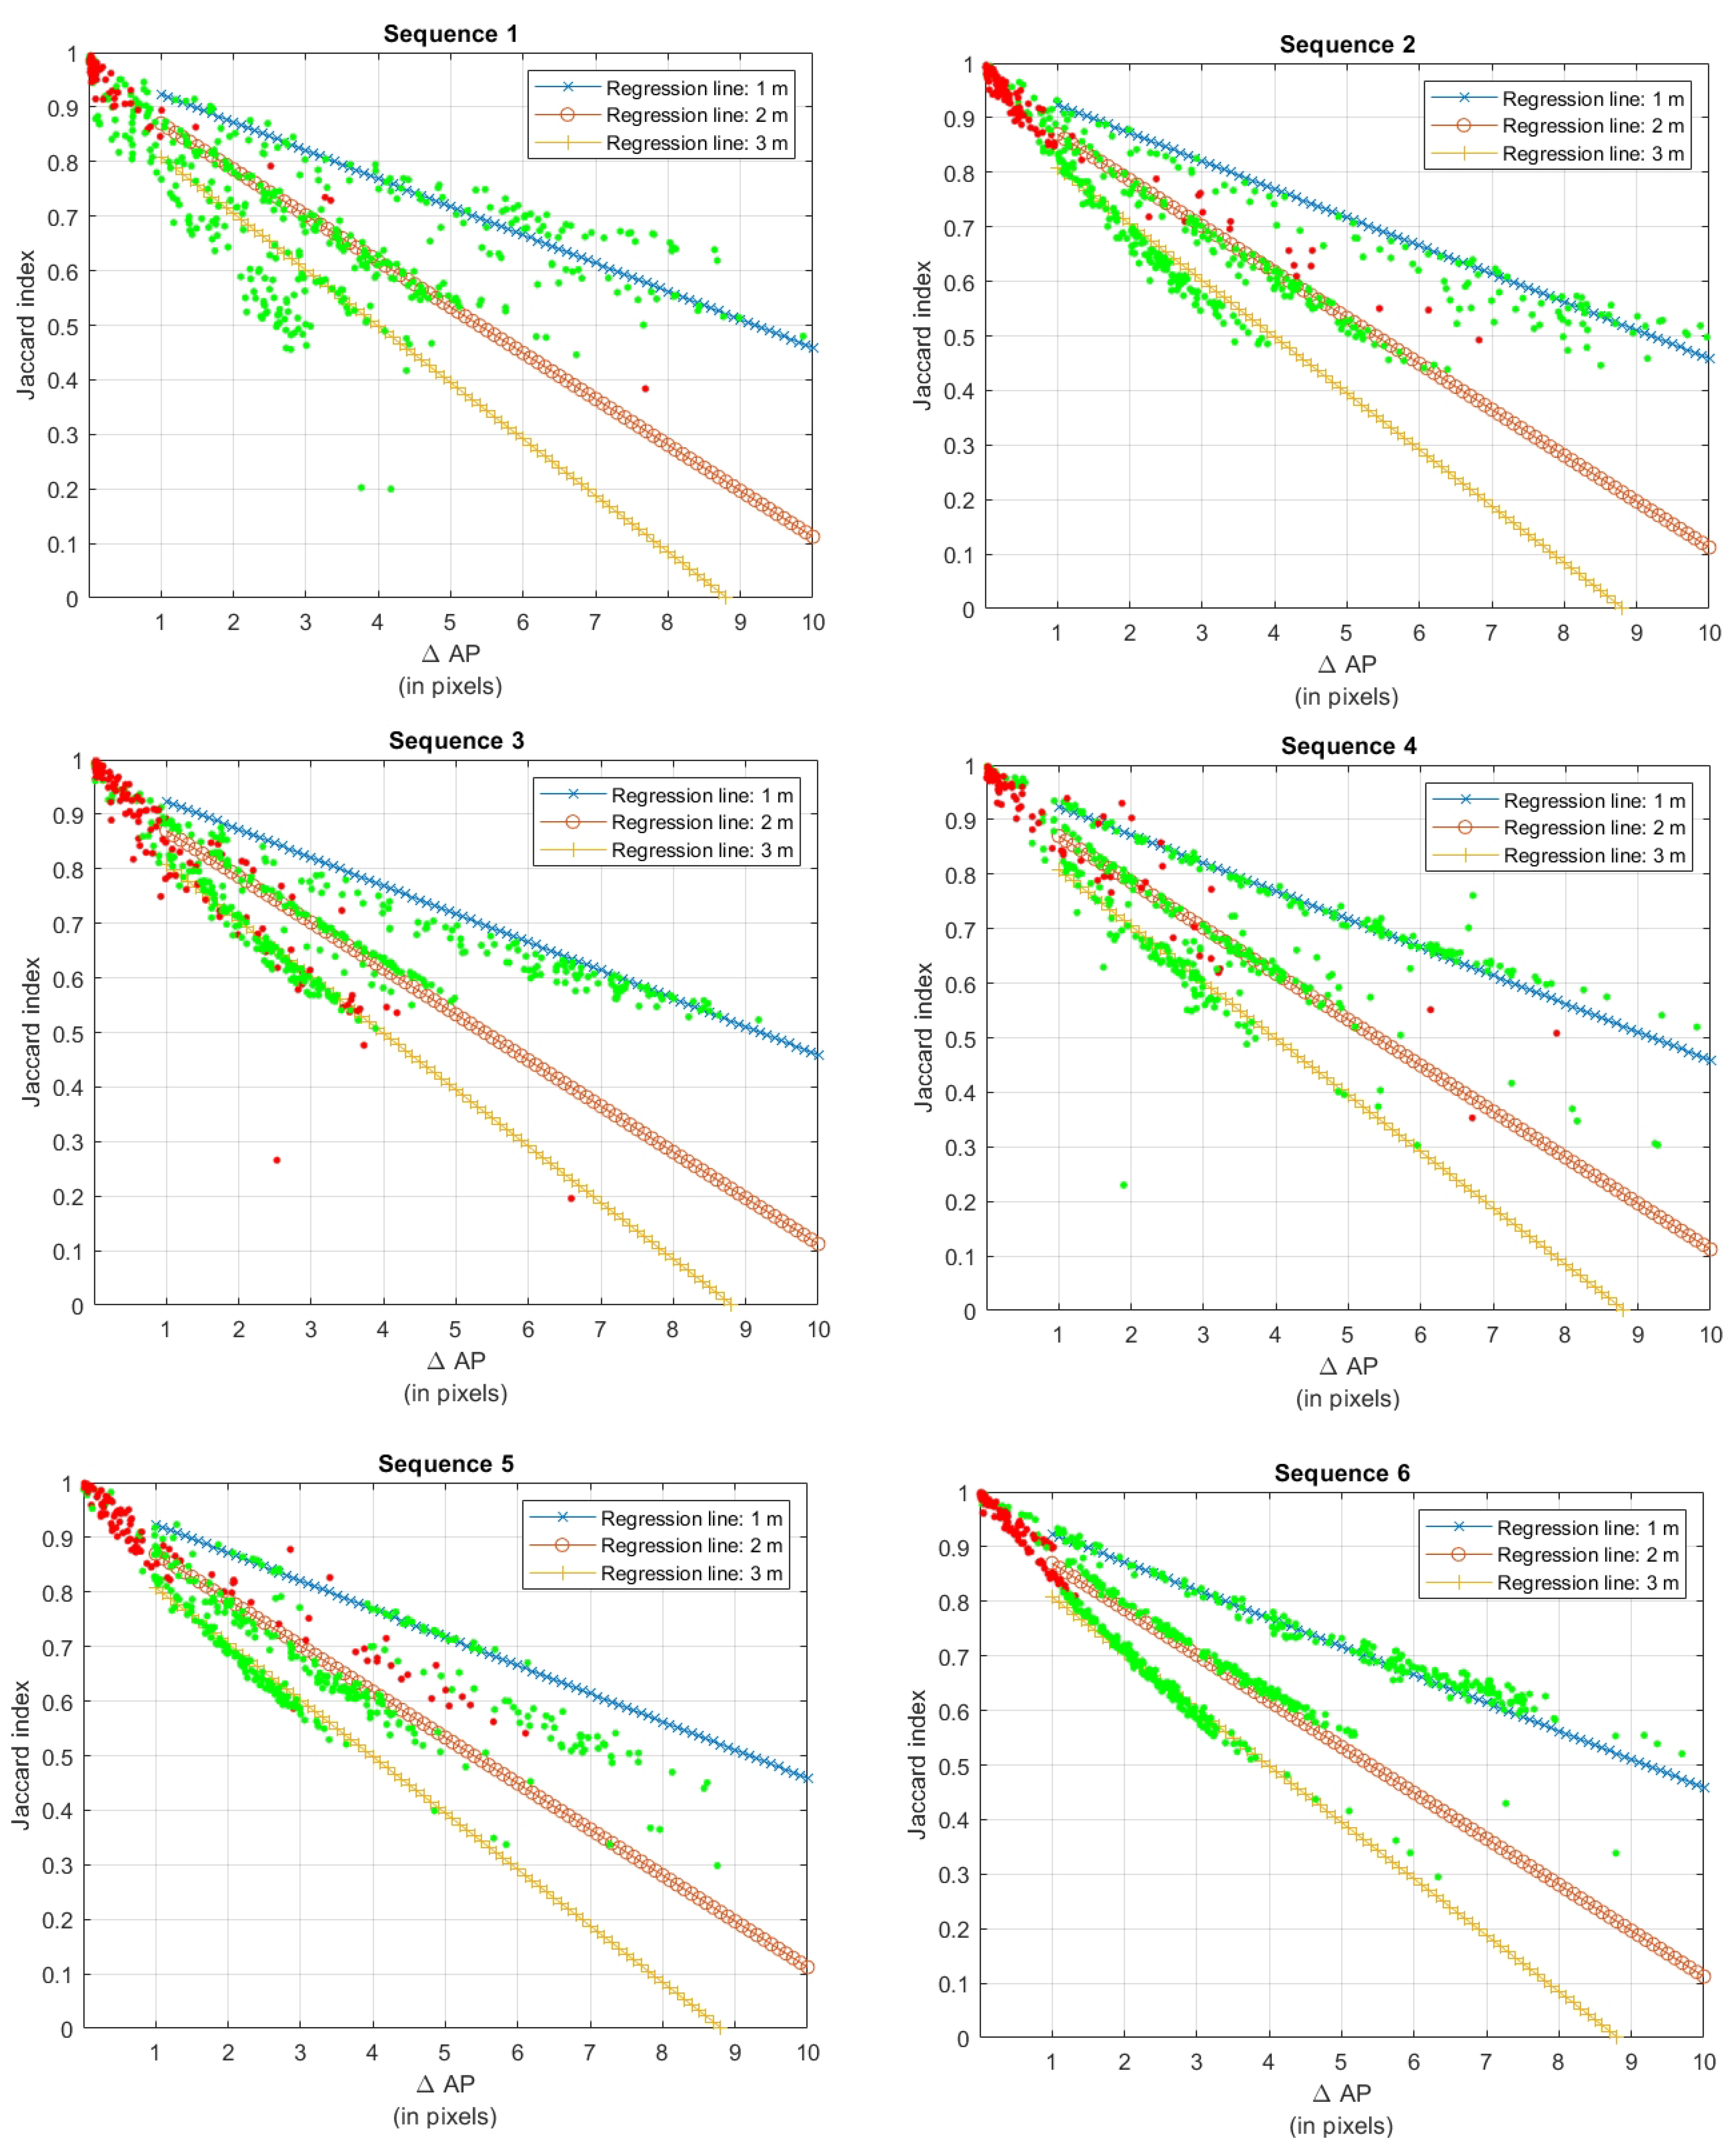
The results presented below show the classification of the distance to the warm object or human head observed with a thermal camera. For this purpose, subsequent sequences of thermal images of people (4233 images) were taken in the same distance range (1, 2, and 3 m). Then what extent the algorithm correctly determined the distance to the observed person was verified.
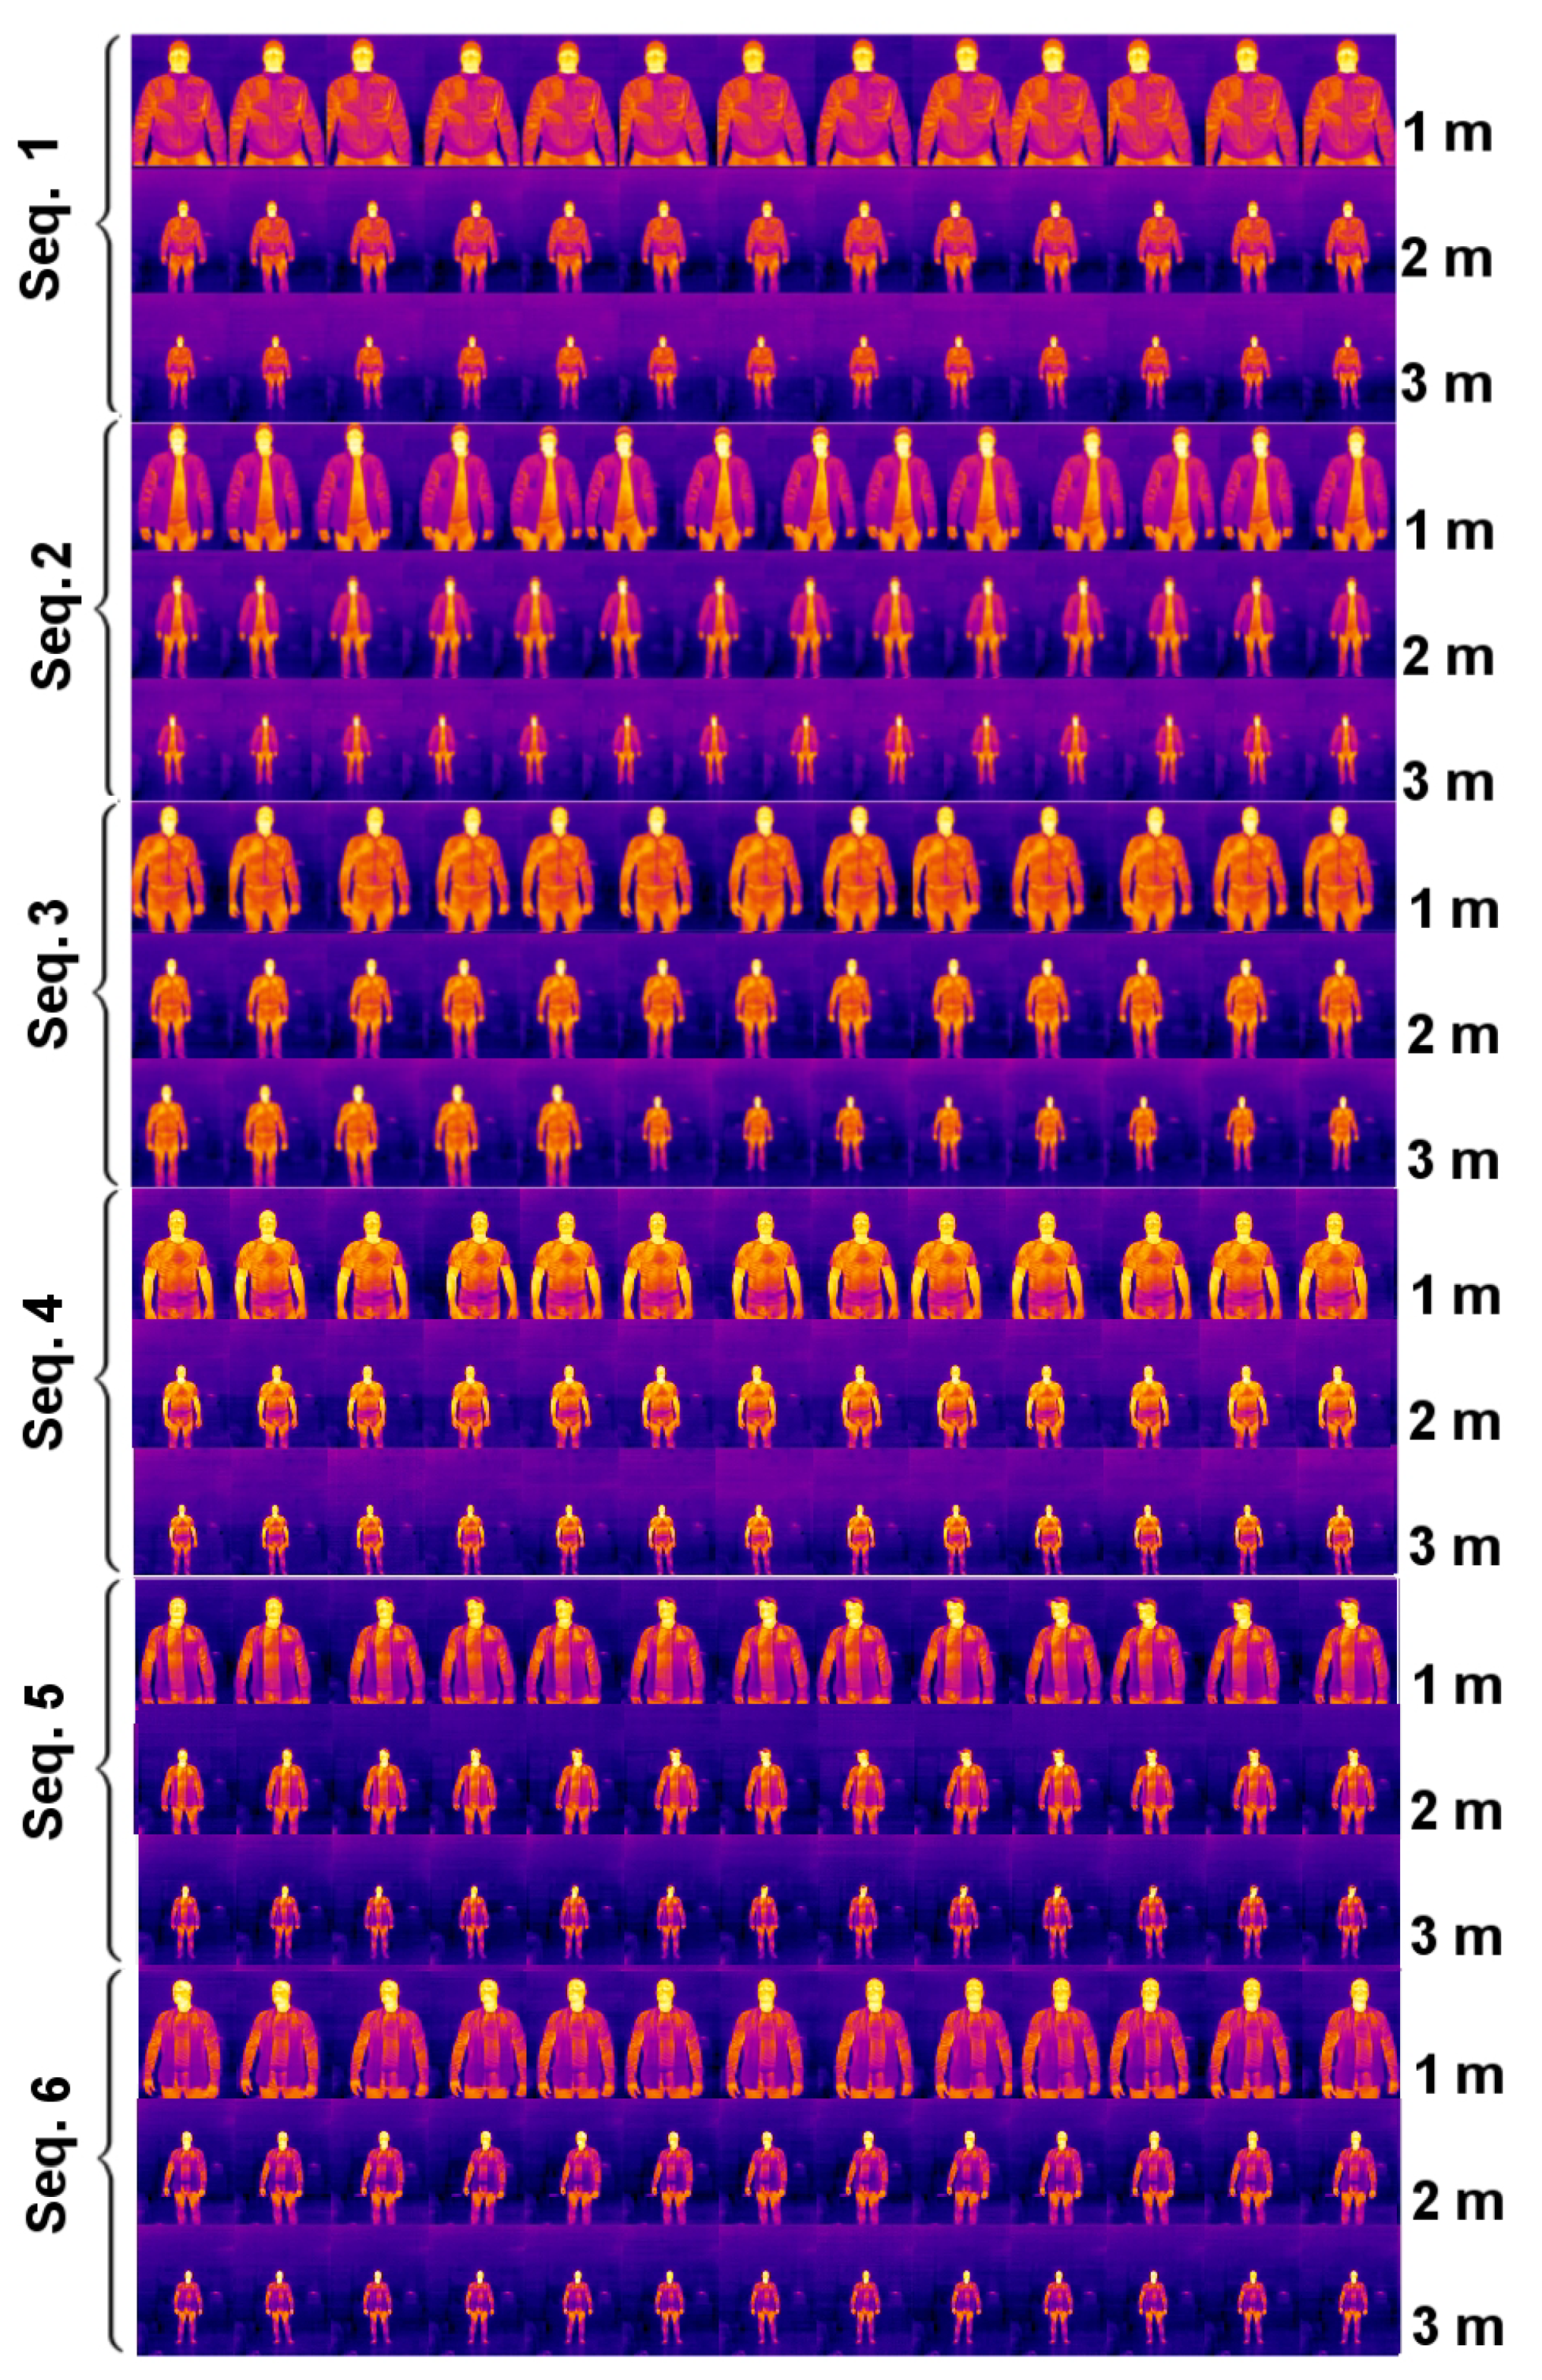
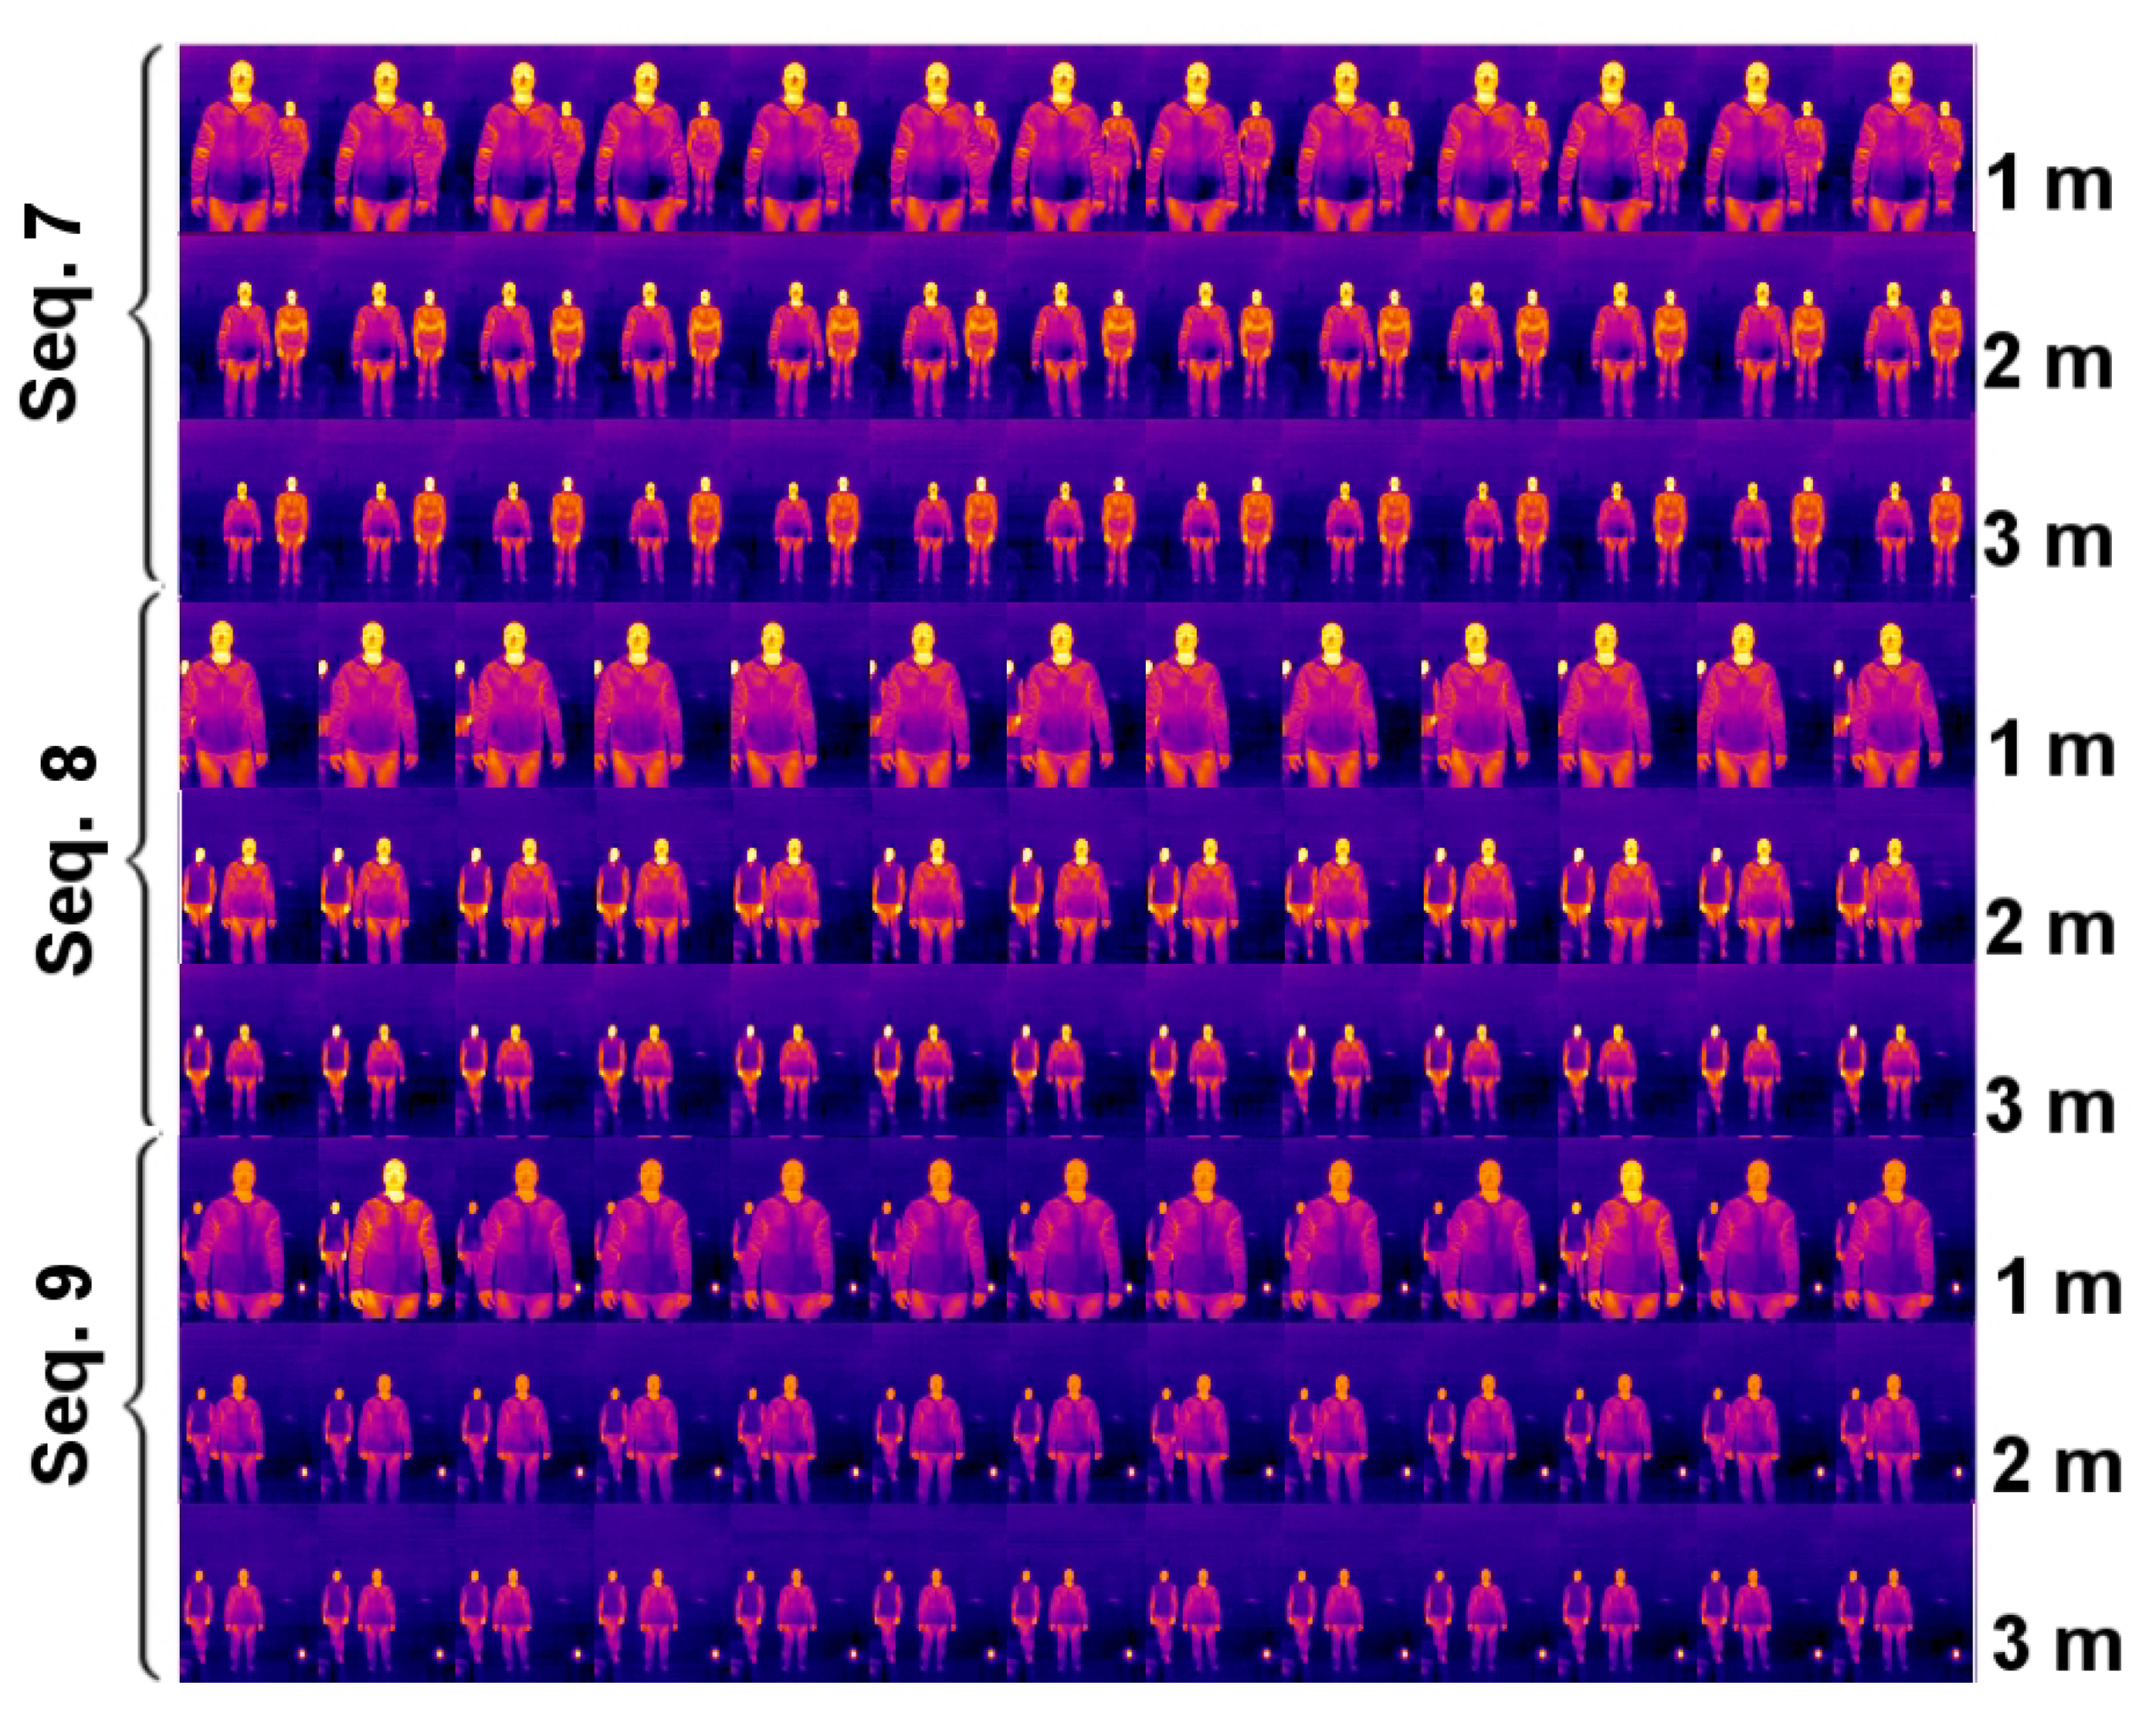
Figure 7 and
Figure 8 present fragments of sample sequences (1–9) of images used in the study. The subjects in the images were characterized by different outfits and changing positions related to the movement of the figure and distance from the camera.
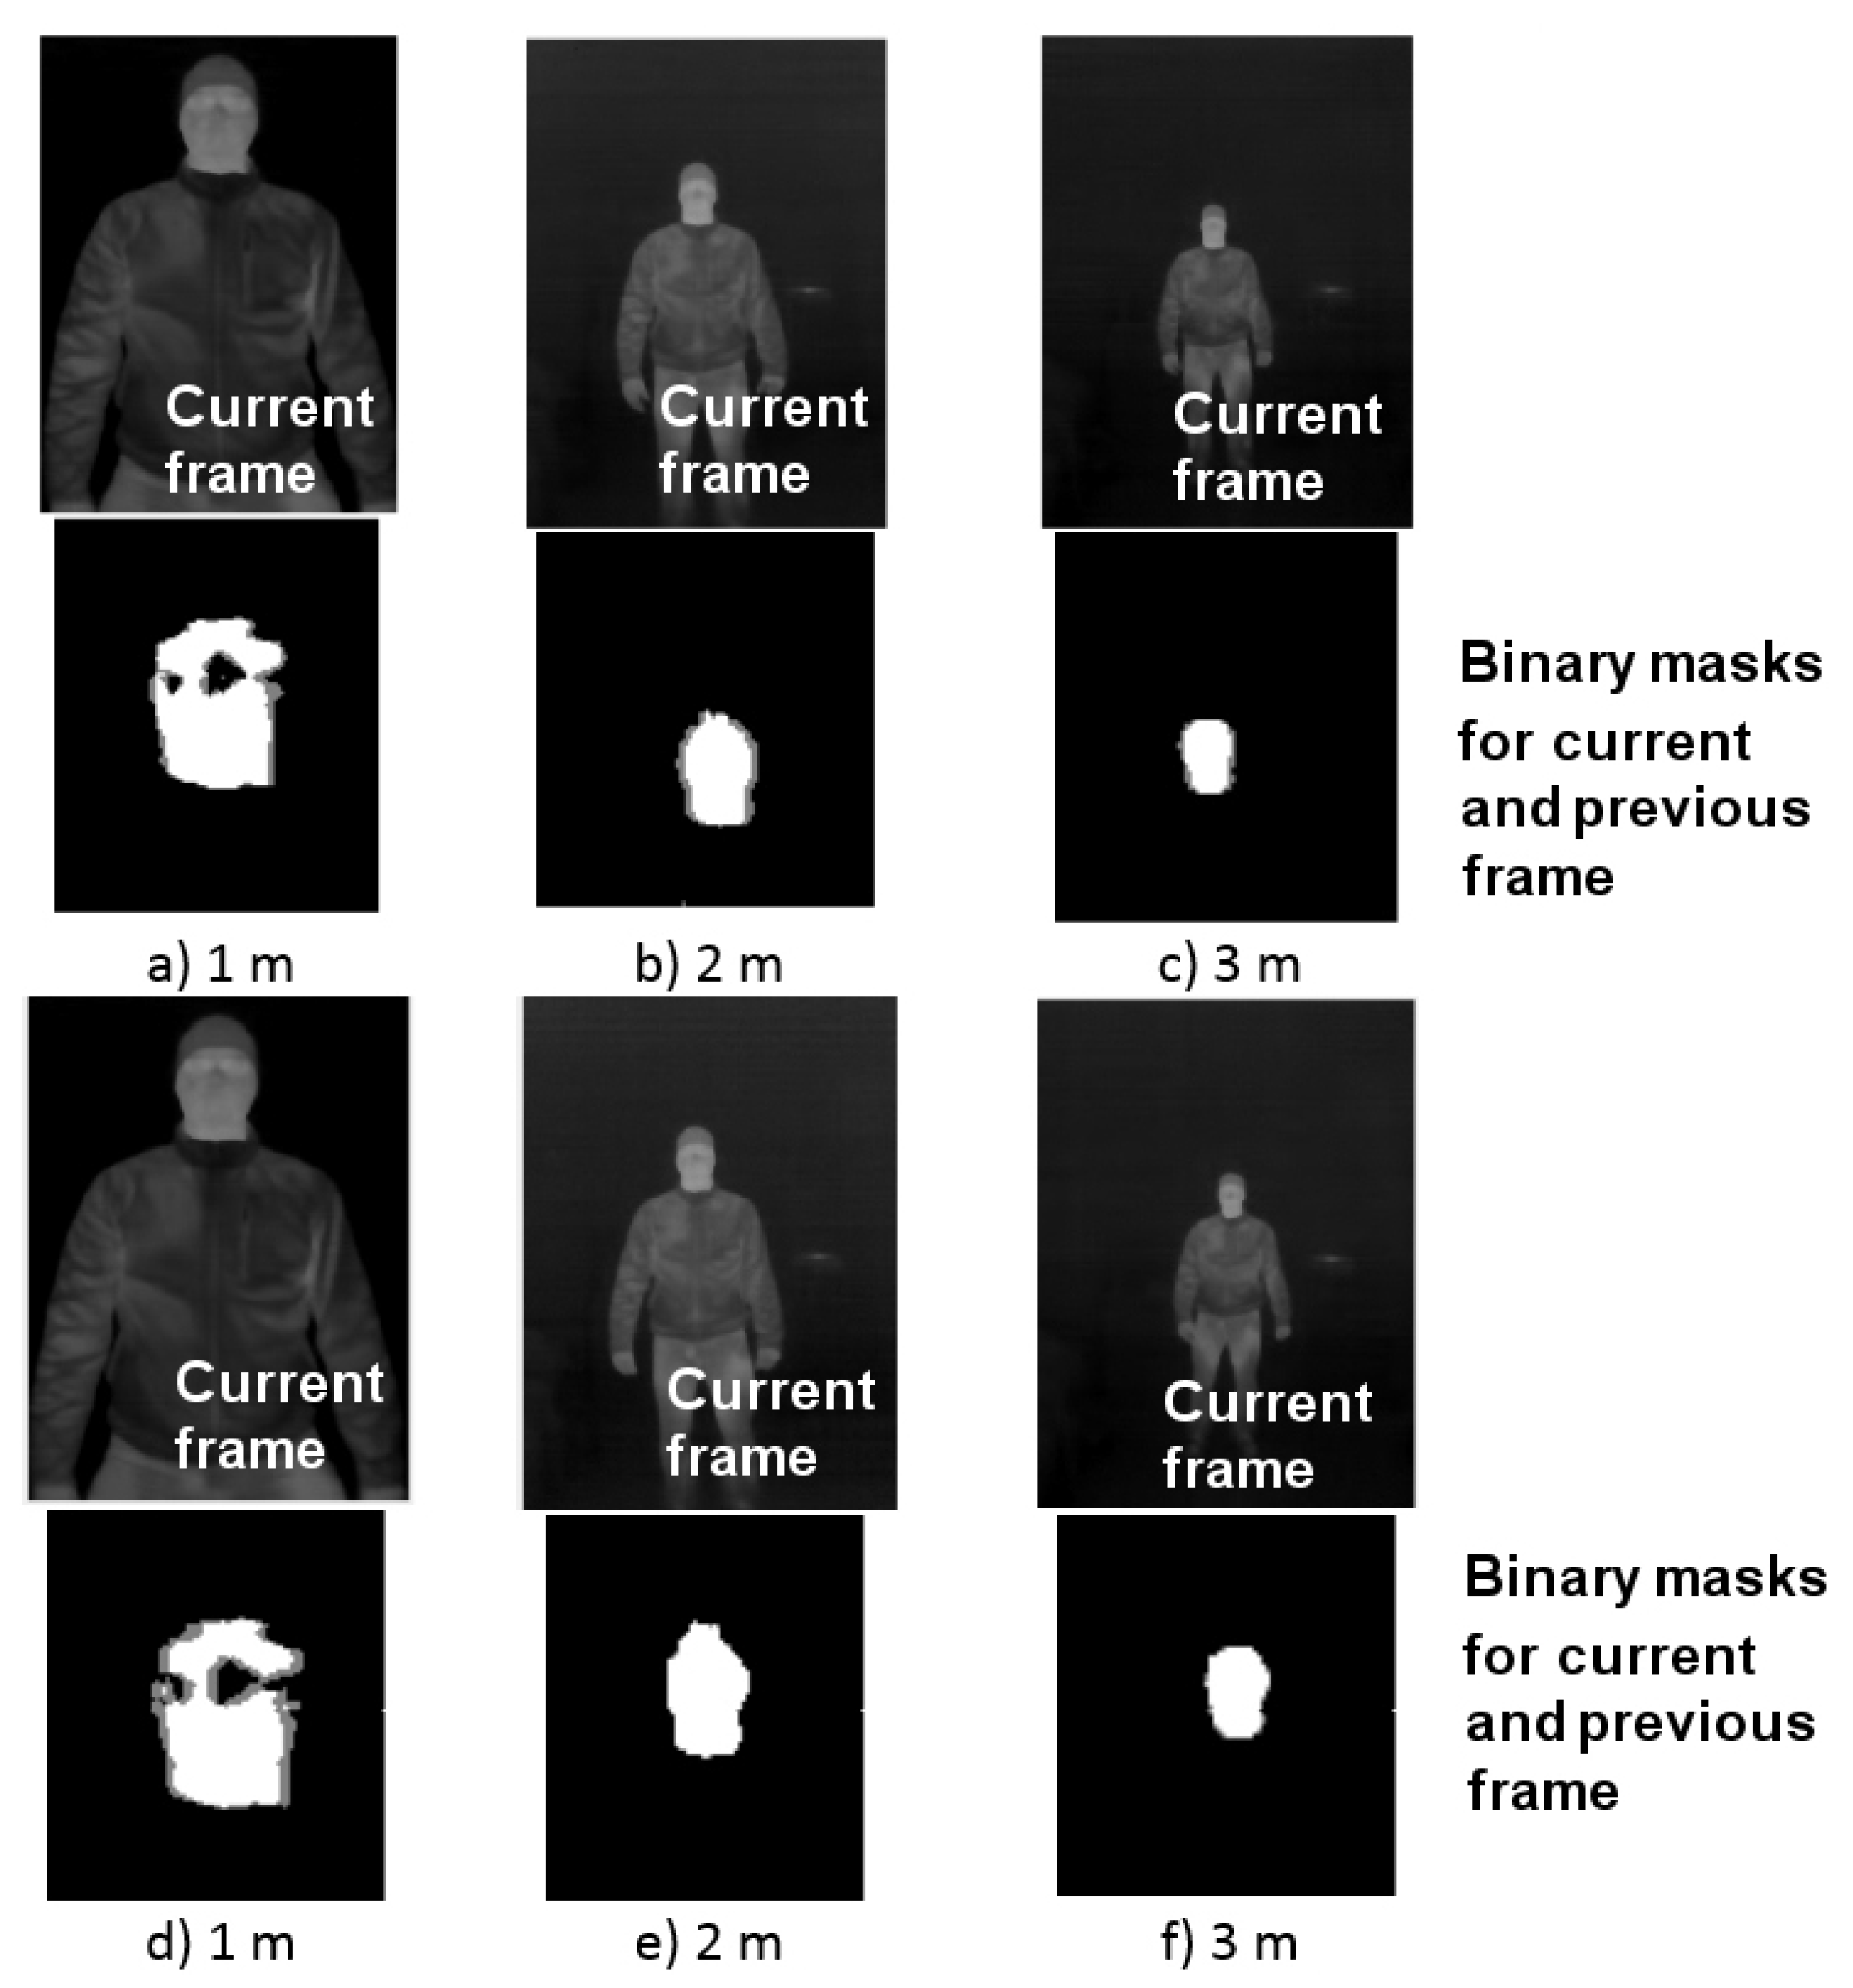
Figure 9 presents sample results of the algorithm operation in the form of images. Images (a–c) are cases of correct distance classification, and images (d–f) are cases where the distance was incorrectly determined.
Figure 10 shows how the cases from images (a–f) were arranged in the measurement space. Better algorithm efficiency could be observed in the 1 and 3 m range (Cases a and c), because values above regression line reg1 and below regression line reg3 wwere easier to classify than those in the vicinity of the reg2 line.
The observations marked in the graph in
Figure 10 incorrectly classified in
Figure 9d–f indicate that distance classification by the algorithm was worse when the camera or observed object movement was insignificant because an important aspect of measuring distance with one camera is correct movement relative to the object. This was confirmed by the results for the entire test set (
Figure 10), which showed that most incorrect classifications appeared in the range of
up to 2 pixels. The graphs shown in
Figure 11 and
Figure 12 correspond to all measurements for the sequences shown in
Figure 7 and
Figure 8. In most cases, the algorithm responded correctly (green) if the camera or observed object was moving.
Algorithm effectiveness was determined by calculating the ratio of correct classifications of distances to one of the categories (1, 2, 3 m) to all test observations. The effectiveness for each of the three distance ranges was also verified. Effectiveness in the full range (from minimal phone movements—
> 0) and from
> 3, when the movement of the phone was related to the movement of the body during walking, is presented. Results in
Table 1 confirmed that it was possible to determine approximate distance to a warm object and warn the user about the risk of approaching a person with elevated temperature.
The results of the algorithm performance in the test image set reached very high values considering the camera-hardware limitations. Because the algorithm is to ultimately work in real time, even in the event of failed detection in one of the recorded image frames, the algorithm would correctly classify previous or subsequent images. At the image recording rate of 8 fps, the loss of individual frames can only cause temporary incorrect distance readings. Additionally, since the application saves the exact time of recording each image frame (with millisecond accuracy), it is possible to capture frame loss, omit erroneous frames, and only carry out measurements for the correct sequence of images. Further improvement of the algorithm performance could be affected by the use of devices with better parameters (e.g., optical resolution and frame rate). The use of a thermal camera with a higher optical resolution and higher frame registration frequency provides greater ranges and resolution of the measured values of and J, which, in turn, can facilitate classification and improve accuracy up to 0.5 m. The resolution of the used camera () also limited measuring greater distances. At distances above 3 m, the binary mask of the head is too small, which prevents effective calculations. Then, the effectiveness of the proposed algorithm with that of those described above were compared. First, distances estimated by the algorithm were compared with ground-truth distances, and these results were compared with those of other algorithms.
The accuracy of distance estimation (in all ranges) ranged from 73% [in the case of
Table 1. Seq] 3—with slight camera movements
> 0) to 100% ( in the case of
Table 1. Seq.6—larger camera movements
> 3)—
Table 2.
Similar effectiveness can be observed compared to the reference methods. However, the proposed method does not require complex geometric assumptions or additional scene elements supporting the distance assessment process. The cases in which the algorithm determined the distance range incorrectly resulted from a small movement of a person (small ) in the image or innacurate segmentation of the binary mask of the person’s head. This interference in the image sequence was partly caused by the hardware autocalibration mechanism of the thermal camera (which was randomly activated during image registration, causing disturbances in the continuity of recording subsequent images).
4. Conclusions
The presented method, due to its effectiveness and speed of object detection, can be used as an element of a warning system against people with elevated body temperature with generally available mobile devices. The detection of people with elevated body temperature (above 35 °C) was carried out with 100% efficiency, whereas the classification of the range of distance to warm objects (head area) had 73–100% efficiency. The algorithm was tested on a set of 4233 images containing cases with different clothing, visibility of different body parts (neck, forearms), different head positions relative to the camera, and one or two people while maintaining the initial assumptions. The most important features of the proposed solution are the use of a single thermal camera for distance assessment, a fully automatic detection and distance classification block, and high-speed operation. The cases of one or two people were considered. To recognize people on the images, we used the embedded in OpenCV face detector (based on Haar Cascade). This detector was trained in over 1000 (face/nonface) thermovision images, as was conducted in [
22], and was effective because the facial areas were initially selected on the basis of facial temperature.
Given that the detection of a person with elevated temperature was carried out with 100% efficiency, a person using the system would be warned sufficiently early about an existing threat, and additional information about the distance (with 73–100% efficiency) would only increase their vigilance. Therefore, the possibility of contact with a potentially sick person is signalled much earlier than the system user approaching that person. A mobile thermal camera with a frequency of 8 fps and resolution (upscaled) was used for determining the distance, which significantly limited the accuracy of distance measurements. The use of a better camera would increase precision, which allows for developing the system so that it can determine distances with accuracy of 0.5 or 0.25 m. The research results obtained at this stage show that the effective monitoring of and protection against sick people is possible using the described devices and solutions. The function of detecting an approaching person (with temperature above 35 °C ) was tested on a mobile device in the form of a smartphone with the following hardware configuration: 8-core processor clocked at 2.2 GHz and 6 GB RAM). The hardware capabilities and reserves offered by this type of devices allow for further expansion by implementing more advanced methods of thermal-image analysis. When developing the presented method to further improve its efficiency, it is worth considering the use of information from the mobile device’s motion sensors (which enriches the application with absolute data describing the camera movement) or the use of a thermal camera with higher optical resolution. It is also important to develop the method to be able to track and detect more than one object, but this may need more advanced methods of locating and tracking faces.


