Article

Threshold Effects of Infectious Disease Outbreaks on Livestock Prices: Cases of African Swine Fever and Avian Influenza in South Korea

1
Department of Management Information Systems, Chungbuk National University, Cheongju 28644, Korea
2
Department of Environment and Resources Research, Korea Rural Economic Institute, Naju 58217, Korea
3
Department of Computer Science, Chungbuk National University, Cheongju 28644, Korea
4
College of Veterinary Medicine, Chungbuk National University, Cheongju 28644, Korea
*
Author to whom correspondence should be addressed.
Appl. Sci. 2021, 11(11), 5114; https://doi.org/10.3390/app11115114
Submission received: 22 February 2021 / Revised: 28 May 2021 / Accepted: 28 May 2021 / Published: 31 May 2021
(This article belongs to the Collection Big Data Analysis and Visualization Ⅱ)

Abstract

:
In this paper we demonstrate the threshold effects of infectious diseases on livestock prices. Daily retail prices of pork and chicken were used as structured data; news and SNS mentions of African Swine Fever (ASF) and Avian Influenza (AI) were used as unstructured data. Models were tested for the threshold effects of disease-related news and SNS frequencies, specifically those related to ASF and AI, on the retail prices of pork and chicken, respectively. The effects were found to exist, and the values of ASF-related news on pork prices were estimated to be −9 and 8, indicating that the threshold autoregressive (TAR) model can be divided into three regimes. The coefficients of the ASF-related SNS frequencies on pork prices were 1.1666, 0.2663 and −0.1035 for regimes 1, 2 and 3, respectively, suggesting that pork prices increased by 1.1666 Korean won in regime 1 when ASF-related SNS frequencies increased. To promote pork consumption by SNS posts, the required SNS frequencies were estimated to have impacts as great as one standard deviation in the pork price. These values were 247.057, 1309.158 and 2817.266 for regimes 1, 2 and 3, respectively. The impact response periods for pork prices were estimated to last 48, 6, and 8 days for regimes 1, 2 and 3, respectively. When the prediction accuracies of the TAR and autoregressive (AR) models with regard to pork prices were compared for the root mean square error, the prediction accuracy of the TAR model was found to be slightly better than that of the AR. When the threshold effect of AI-related news on chicken prices was tested, a linear relationship appeared without a threshold effect. These findings suggest that when infectious diseases such as ASF occur for the first time, the impact on livestock prices is significant, as indicated by the threshold effect and the long impact response period. Our findings also suggest that the impact on livestock prices is not remarkable when infectious diseases occur multiple times, as in the case of AI. To date, this study is the first to suggest the use of SNS to promote meat consumption.

1. Introduction

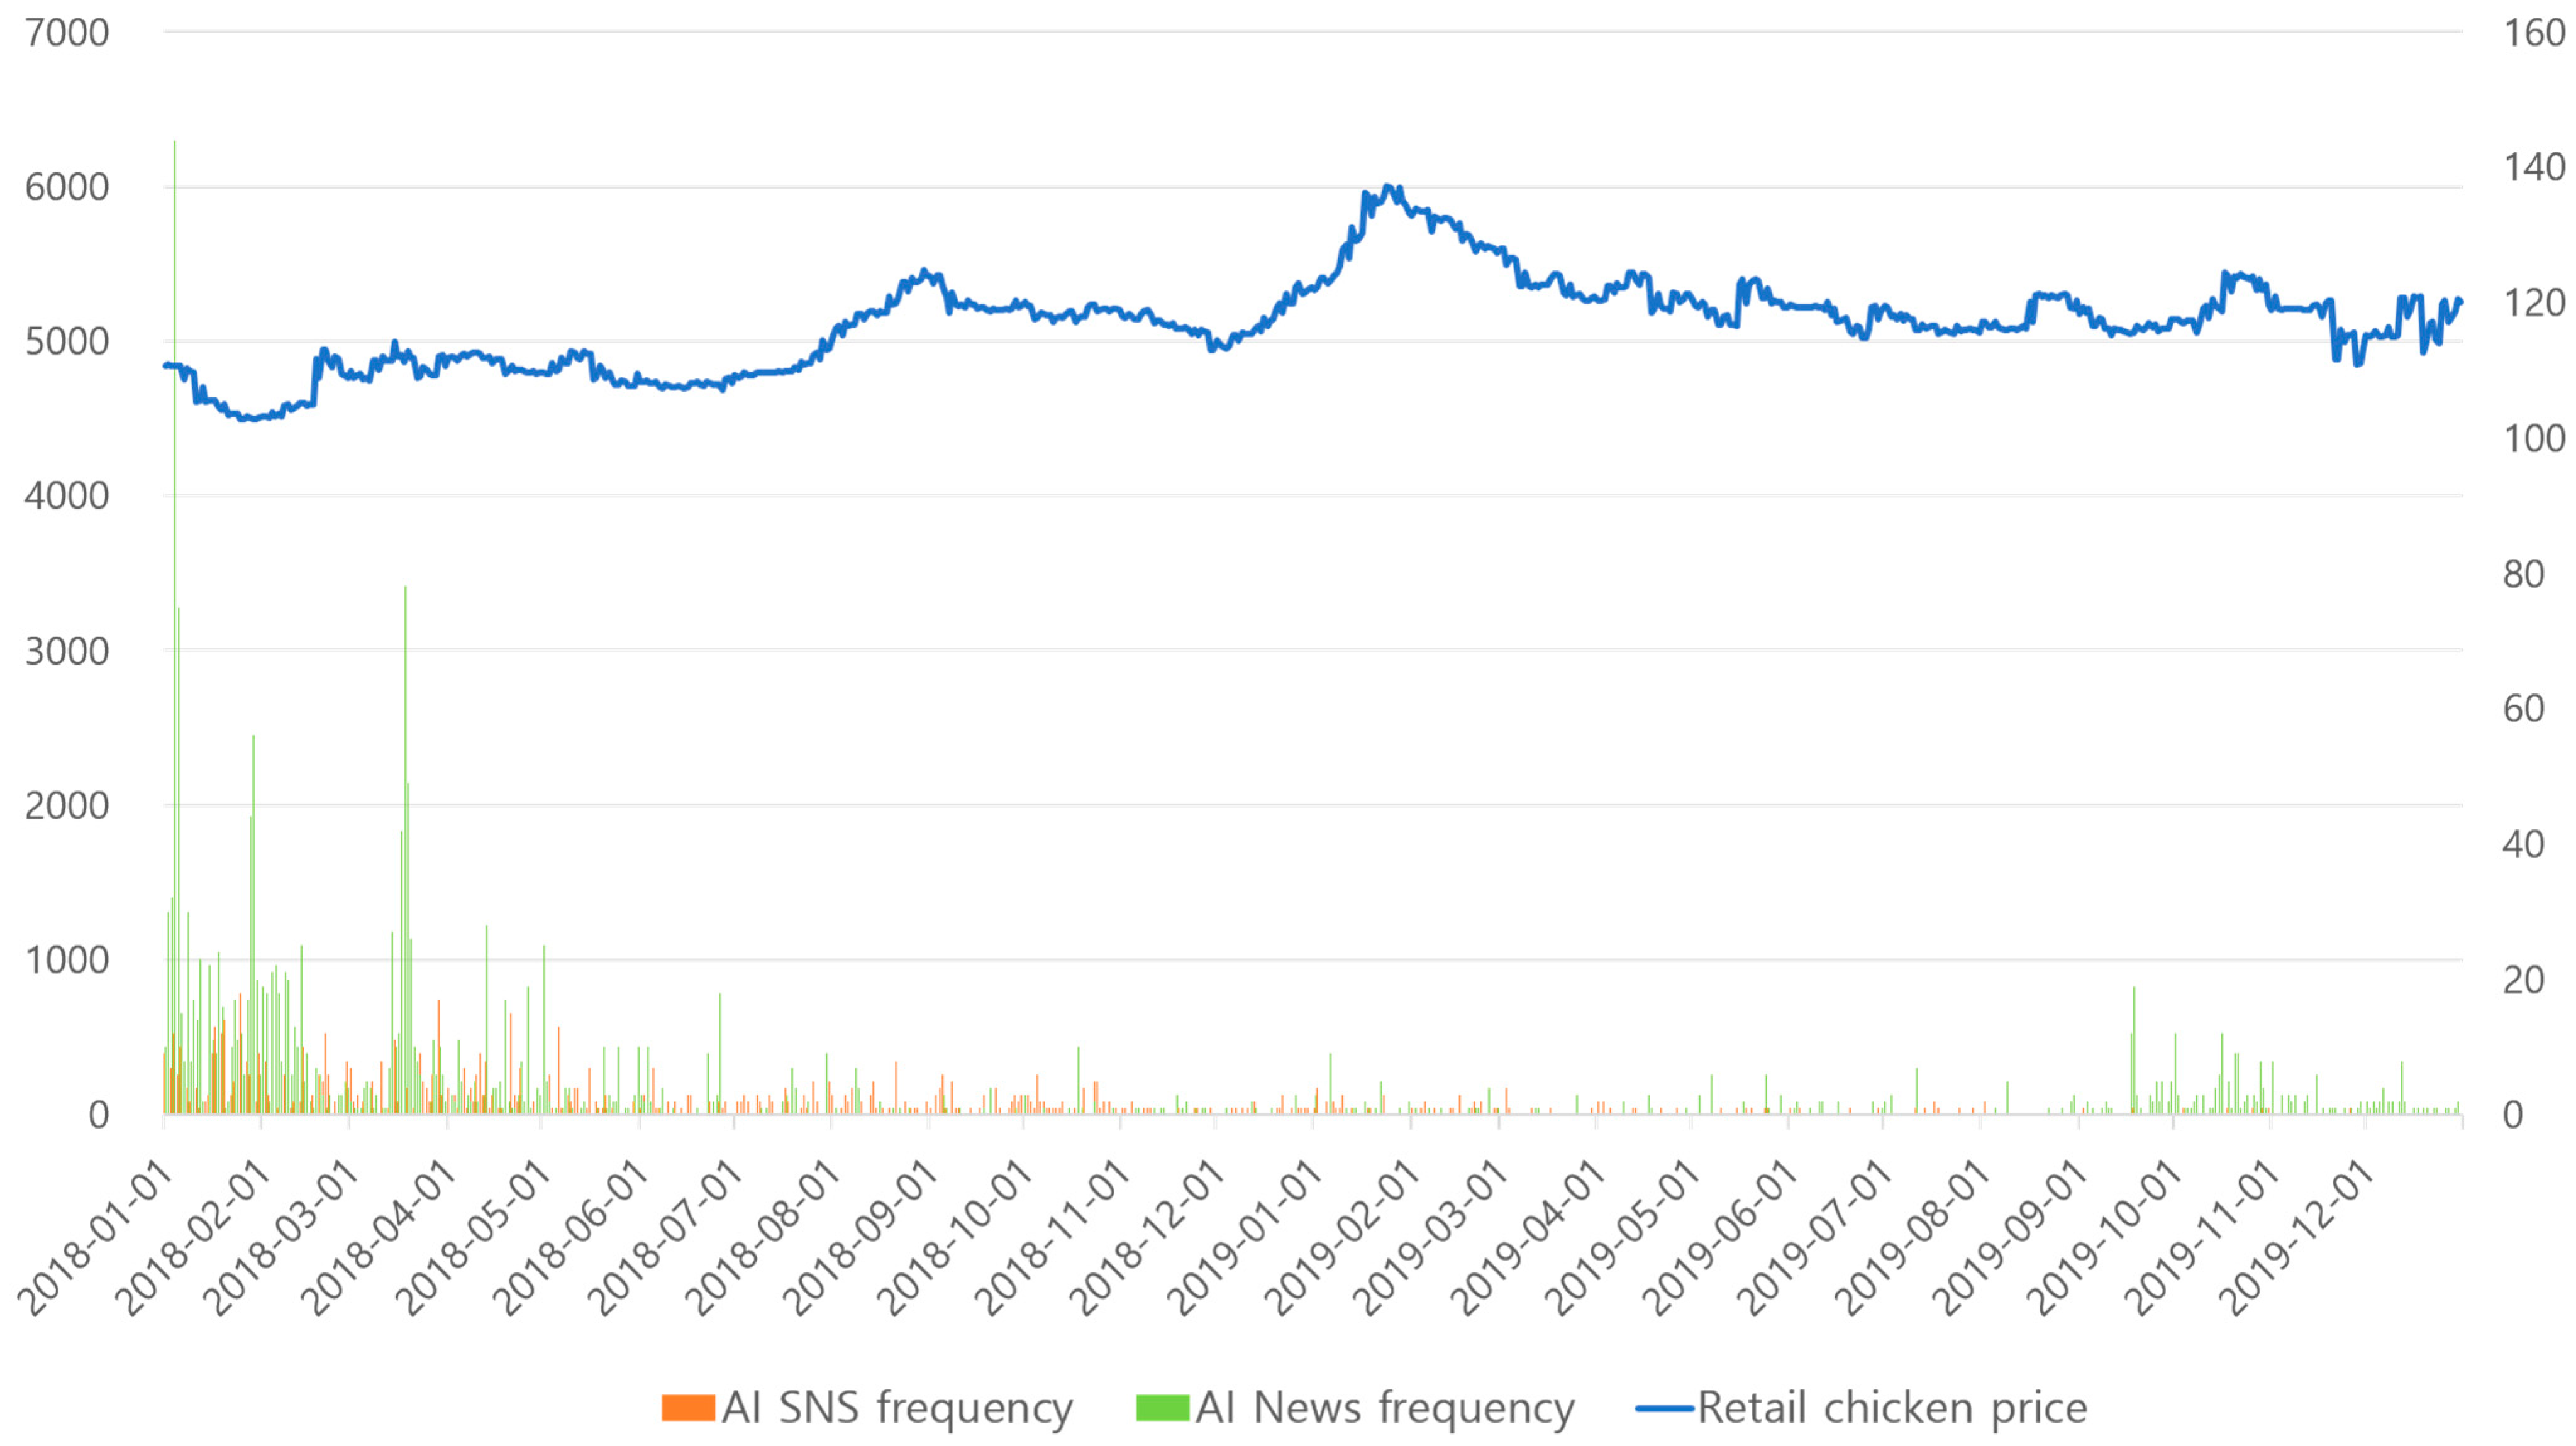
During the outbreak of African Swine Fever (ASF) in South Korea in 2019, the media predicted that the pork supply would decrease and that pork prices would rise by the end of September of that year. At the end of October, after the ASF outbreak was controlled, however, pork prices collapsed due to a sharp fall in consumption [1]. This situation is thought to have stemmed from the reduced will of consumers to purchase pork, as news about the ASF outbreak was reported and the information was delivered to consumers through various types of media, including SNS. When livestock epidemics such as ASF or Avian Influenza (AI) occur, they can have a negative effect on demand and cause volatile changes to livestock prices because the supply of livestock products will be reduced because of the pre-emptive slaughter of animals at risk and the fall in consumer demand [2,3]. Previous outbreaks such as Bovine Spongiform Encephalopathy and Foot and Mouth Disease demonstrated the effect on livestock products [2,4,5,6,7]. News about livestock diseases was considered to be an advertisement against livestock consumption [2,5,6].
Recently, the outbreak of infectious diseases like ASF, AI, Middle East respiratory syndrome (MERS), and COVID-19 have affected the whole world. Many data-based approaches and algorithms have been proposed to predict the spread of diseases and to use social media data for disaster management [8,9,10,11]. In this study, we wanted to test if there were threshold effects of infectious disease-related news on retail livestock prices and to determine the threshold values using a threshold autoregressive (TAR) model when there were outbreaks of major infectious diseases. We also aimed to determine if the response periods of livestock retail prices varied depending on the threshold effects after the price was initially affected. Finally, we compared the prediction accuracies of the TAR and autoregressive (AR) models of livestock retail prices to show the benefit of threshold models.

2. Materials and Methods

2.1. Data

Previously, prediction models of agrifood demand were developed using structured data on agri-food production and sales and unstructured data from mass media, including broadcasting programs and social networks, that were collected and saved in the Mongo database [12]. In the present study, covering the years 2018 and 2019 in South Korea, daily retail prices of pork bellies and chicken from a livestock portal service (eKAPEpia) were used as structured data, while broadcast news and blogs mentioning disastrous livestock epidemics such as ASF and AI were used as unstructured data. Regarding ASF, 14 cases were reported in South Korea in 2019 and during the same period, 9586 ASF-related news articles and 16,111 ASF-related SNS posts were reported (Table 1 and Figure 1). For AI in chickens, there were 14 cases in 2018, with reports from 1666 AI-related news articles and 814 AI-related SNS posts. In 2019, no AI cases were reported, yet there were 352 AI-related news articles and 92 AI-related SNS posts (Table 1 and Figure 2).

2.2. Methods

In this study, we tested to see if a threshold existed between the frequency of news related to infectious diseases, specifically ASF and AI, and the retail prices of pork and chicken, respectively. In the threshold model, a sample was divided into two or more regimes based on the threshold level when external impacts existed [13]. We used infectious disease-related news frequency as a threshold variable. In addition, to estimate the effects of disease-related SNS, we used posting frequency as an exogenous variable. The threshold model used in the analysis is the TAR model, as introduced by Tong and Lim [14]. In the model used here, the threshold effect is added to an autoregressive model, AR(p), implying that it is mainly used for nonlinear time-series data [15]. The form of the TAR model with one threshold is as follows Equation (1):
y t = { c 1 + β 1 y t 1 + β 2 y t 2 + β 3 y t 3 + + β p y t p + ε 1 t     i f q t < γ c 2 + b 1 y t 1 + b 2 y t 2 + b 3 y t 3 + + b p y t p + ε 2 t     i f q t γ
In the TAR model ( y t ), q t indicates the threshold time series variable and γ indicates the threshold value. The TAR model can be divided into two or more regimes based on γ, as expressed by in Equation (2) through Equation (4) [16]:
x t = [ y t 1 y t 2 y t 3     y t p ] θ = [ β b ]
x t ( γ ) = [ x t ( q t < γ )   x t ( q t     γ ) ] I 1 = { 1       i f   q t < γ 0       i f   q t   γ ,   I 2 = { 0 i f    q t < γ 1 i f    q t   γ
y t = x t ( γ ) θ I 1 + x t ( γ ) θ I 2 + ε t
The TAR model assumes that the error term ( ε t ) is independent and identically distributed (IID) with a mean zero and constant variance. Under this assumption, it is possible to estimate the coefficient of the TAR model using a sequential conditional least square estimation via Equation (5). The threshold values can be estimated from the least square value that minimizes the variance of the residual, as shown in Equation (6).
θ ^ ( γ ) = ( t = 1 n x t ( γ ) x t ( γ ) ) 1 ( t = 1 n x t ( γ ) y t ) ε ^ t ( δ ) = y t θ ^ ( γ ) x t ( γ ) δ n 2 ^ ( γ ) = 1 n t = 1 n ( γ ) 2
γ ^ = a r g m i n   δ n 2 ^ ( γ ) γ ^     [ γ _   γ ¯ ]
Given that the TAR model should only be used when a threshold effect exists, it is necessary to test for a threshold effect. This can be done through an F-test of the sum of the squares for residuals (SSR) ( δ ^ n 2 ) both under the null hypothesis (β = b) and under an alternative hypothesis (β ≠ b), as shown in Equation (7).
F n = n ( δ ˜ n 2 δ ^ n 2 δ ^ n 2 ) ,   δ ˜ n 2 :   S S R   u n d e r   t h e   a l t e r n a t i v e   h y p o t h e s i s F n ( γ ) = n ( δ ˜ n 2 δ ^ n 2 ( γ ) δ ^ n 2 ( γ ) )
The TAR model can estimate different coefficients for each regime using the threshold values, and this model can be more accurate than the AR(p) model when used to analyze a nonlinear time-series model. Therefore, the TAR model was used for livestock retail prices with disease-related news frequencies as a threshold variable. The prediction accuracy of the TAR model was compared with that of the AR(p) model for root mean square error (RMSE) to compare the prediction accuracy.

3. Results

3.1. Threshold Effects and Values of African Swine Fever-Related News on Retail Pork Prices

Regarding the validation of the threshold model, there should be threshold effects in the AR model, as shown in Table 2. The distribution used in the threshold effect test shown in Table 2 corresponds to the asymptotic distribution through bootstrapping, and the critical value can vary from trial to trial [17]. Therefore, the results of repeated tests were used in this study. To test for a threshold effect and estimate the threshold values in the AR model, the “tsDyn” package in R-software was used. The ASF-related SNS frequency was included as an exogenous variable when the coefficients and impulse response periods for each regime were estimated using the impulse response functions in STATA software. The results of the threshold effects test indicated that the AR model for retail pork prices had two threshold values based on ASF-related news frequency. These results suggested that the TAR model could be divided into three regimes based on the ASF-related news frequency as shown in Table 3. Here, instead of the actual news frequency, the difference between the frequencies for the previous date and the current date was used because the actual news frequency happened to have a unit root. The threshold values for the pork TAR model in Table 3 were estimated based on the least square value to be −9 and 8 of the difference between the news frequencies of the previous date and those of the current date. Based on the threshold values, the TAR model could be divided into three regimes: regime 1, where the difference in the ASF-related news frequencies is less than −9; regime 2, where the difference is between −9 and 8; and regime 3, where the difference is greater than or equal to 8. The frequency of ASF-related news increased from regime 1 to regime 3.
The coefficients of the difference between the retail prices of the previous date and those of the current date showed negative trends when they were statistically significant, indicating that the retail price difference of the past may have the opposite effect on the retail price difference in the present. When the retail price difference of the past showed an increasing trend, the one for the present had a decreasing trend to return to equilibrium.
Regarding the effect on retail pork prices in 2019, the coefficients of the ASF-related SNS frequencies showed a statistically significant positive relationship in regime 1, where the difference in the ASF-related news frequency was less than −9, as shown in Table 4. These results can be interpreted as meaning that when ASF-related SNS frequency increase compared to that on the previous day, the retail pork price increased by 1.1666 Korean won (KRW). In general, the frequencies of news and the SNS tended to migrate together. Due to the nature of the news, there was a tendency for reports to be more negative than positive. In regime 1, where the frequency of news decreased compared to the previous day, ASF-related news also decreased, though it may have contained negative content. In this context, when the SNS frequency increased in the regime where the news frequency decreased, it was highly likely that the SNS posts contained positive information about ASF, such as the end of the epidemic. As in regime 1, the coefficients of the ASF-related SNS frequencies in regime 2 showed a positive relationship. On the other hand, the coefficients showed a negative relationship on retail pork prices in regime 3, where the difference in the ASF-related news frequency was greater than or equal to 8. Because the news was mainly negative, as mentioned above, regime 3, where the ASF-related news frequency increased, was more likely to have a high proportion of negative news, such as an ASF outbreak. Accordingly, ASF-related SNS posts were also likely to contain negative content that could cause a decrease in consumer demand for pork, leading to a drop in retail prices. However, this speculation requires further study.
Based on the relationship between retail pork prices and ASF-related SNS frequency, a plan to promote pork consumption during a period of falling demand is proposed. From this proposal, the number of SNS posts needed to promote pork consumption was estimated. Table 4 shows that the standard deviation (SD) of retail pork price differences per regime varied from 276.73 to 291.59 KRW. To change the retail pork price by as much as one SD, using promotional SNS posts, the required SNS frequency differences can be estimated by dividing the SD of the retail pork price differences per regime by the coefficient of the ASF-related SNS frequency differences (Table 4).

3.2. Estimation of Impact Response Period of Retail Pork Price

After the test of the threshold effect of ASF-related news on retail pork prices, the impact response periods were estimated using STATA software. The period for regime 1 was estimated to be up to 48 days when an impact up to one SD of the retail pork price differences occurred (Table 5 and Figure 3). Regime 1 is where the ASF-related news frequency was the lowest and the coefficient of the difference in ASF-related SNS frequency was the highest. When an impact as much as one SD in retail pork price difference affected the price in regimes 2 and 3, the impact periods were estimated to be 6 and 8 days, respectively.

3.3. Threshold Effects of Avian Influenza-Related News on Retail Chicken Prices

After testing the threshold effects of ASF-related news on retail pork prices, the threshold effects of AI-related news frequency on retail chicken prices for 2018 and 2019 were tested as a comparison, as shown in Table 6. To test the effects and estimate the threshold values in the AR model, the same methods as above were used after AI-related SNS frequencies were included as exogenous variables. The results indicated that AI-related news frequency had a linear effect on retail chicken prices but not a threshold effect or value. The results of the autoregressive model of AI-related news frequency on retail chicken prices can be interpreted to mean that when the frequency increased over the previous day, the prices decreased by 2.5883 KRW, as shown in Table 7.

3.4. Estimation of the Impact Response Period of Retail Chicken Prices

The impact response period for retail chicken prices, using STATA software was estimated to be up to three days when an impact as great as one SD in the price difference arose as shown in Figure 4.

3.5. Comparison of the Prediction Accuracy of the Threshold Autoregressive (TAR) and Autoregressive (AR) Models

After testing the threshold effect of ASF-related news on retail pork prices, the price for 2019 was predicted using the TAR model and the accuracy was compared with that of the AR model for the root mean square error (RMSE), as shown in Table 8. These results indicated that the accuracy of the TAR model was slightly better than that of the AR model. To predict retail chicken prices for 2018 and 2019, RMSEs of the AR model were calculated for comparison purposes.

4. Discussion

In this study, we aimed to demonstrate that the threshold effects of the TAR model may be used for better livestock price predictions when epidemics such as ASF or AI occur since reduced supply and decreased consumption of livestock products can cause livestock prices to be volatile. TAR models have been influential in agricultural economics, including applications to pork price [18], and there have been a few reports of the use of threshold models to explain the nonlinear structure of livestock prices caused by infectious diseases in pigs and broilers [3,19]. For example, the TAR model was employed to divide the nonlinear dynamics of pork prices in China into two regimes [20,21]. There are many variables that can affect the livestock products, such as the numbers of pigs bred and slaughtered, consumption of livestock products, feed prices, substitute prices, and weather. These variables may be included only exogenously in a time-series TAR model. Exogeneous variables in time series models may cause selection bias, which can reduce its prediction ability [22]. Therefore, we focused on the threshold effects and levels that are determined within the model (endogenously) by omitting exogeneous variables. This study analyzed whether threshold effects existed in the retail prices of livestock products by considering news and SNS frequency which can influence and represent consumer sentiment.
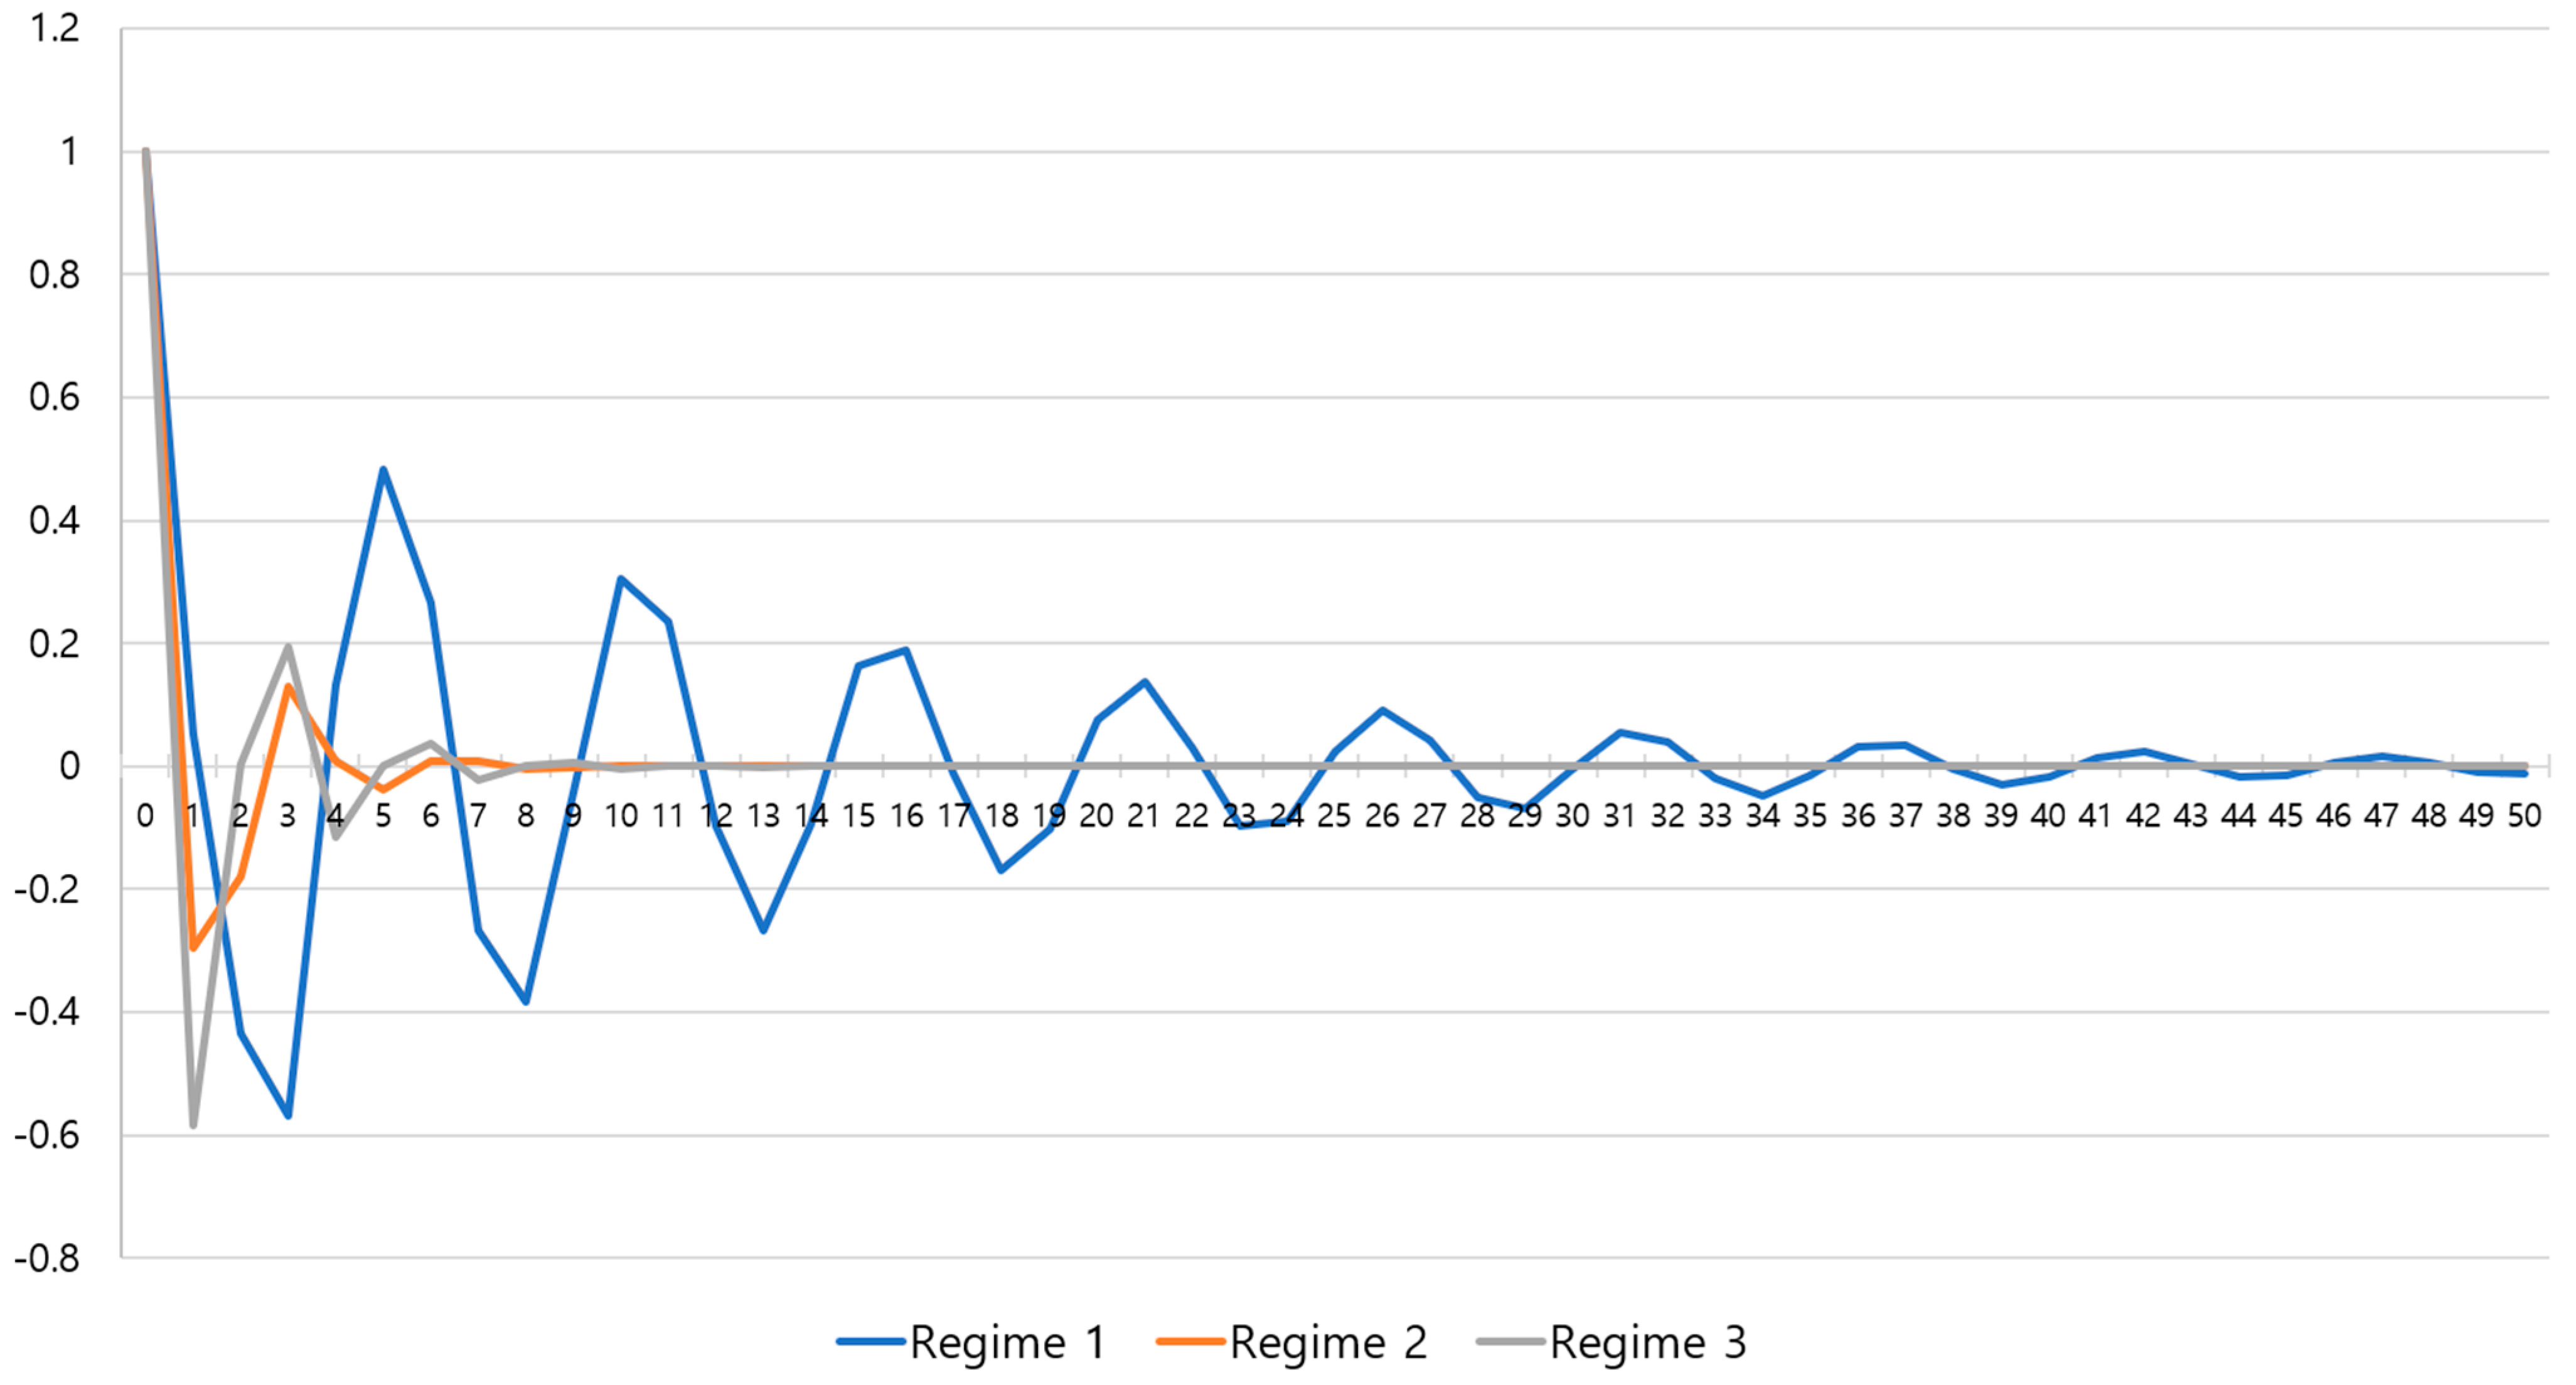
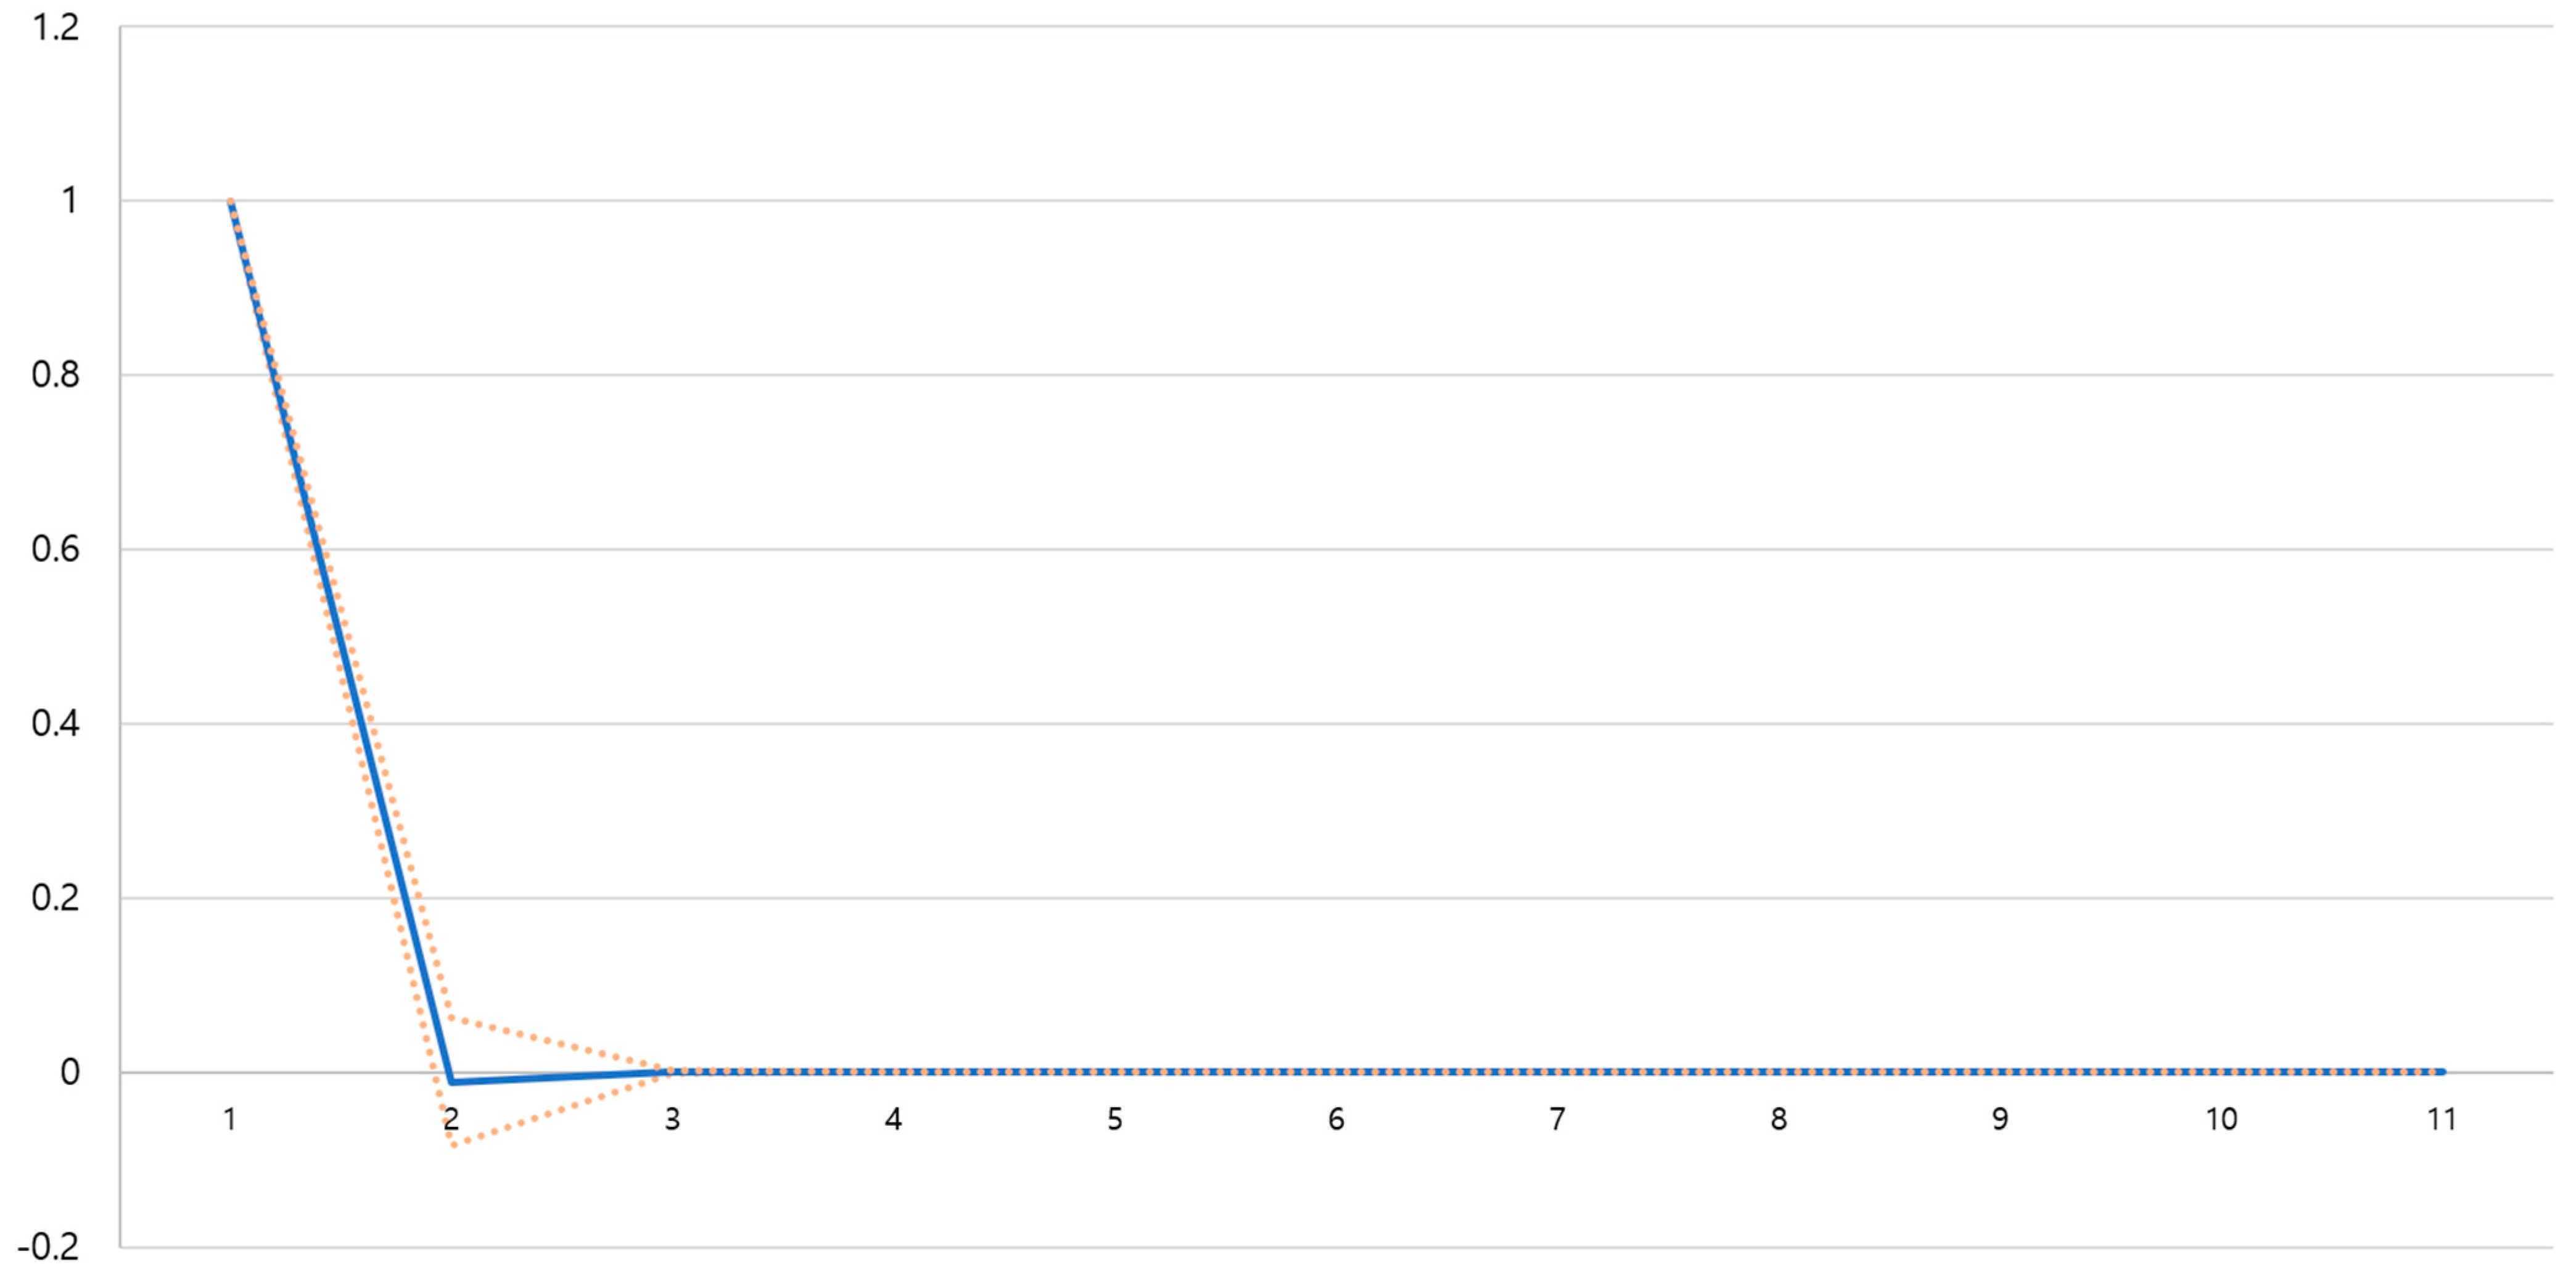
Our findings suggest that when an infectious disease like ASF occurs for the first time, the threshold effects of the TAR model are observed and the price of pork shows a nonlinear relationship that can be divided into three regimes based on ASF-related news frequency, which indicates that the effect of disease-related news frequency on retail pork prices is significant. The impact response results showed that when ASF occurred for the first time on the Korean peninsula in 2019, the impact lasted for a long time in regime 1. However, after AI occurred multiple times, our findings also suggested that retail chicken prices had a linear relationship but no threshold effects, which indicated a reduced effect of AI news frequency on price. In the event of infectious disease outbreaks in livestock, the impacts on livestock prices and response periods were different depending on the regimes. Based on these findings, applying different policies to stabilize prices of livestock products depending the severity of the impact is necessary.
Recent reports have used unstructured data such as broadcast news, TV programs and social networks to predict pork demands or pork prices [12,23]. We proposed the use of SNS to promote pork consumption using ASF-related SNS frequency and its relationship to retail pork prices. Our findings suggest that when there was an increase in an ASF-related SNS frequency differences, the retail price of pork price rose by as much as 1.1666 Korean Won (KRW) in regime 1. Our findings indicate that more than 247 SNS posts are needed to encourage pork consumption and change the retail pork price by as much as one SD, which amounts to 288.2169 KRW. To the best of our knowledge, this study is the first to suggest the use of SNS to promote livestock consumption after it has collapsed because of an epidemic.
During the recent outbreak of ASF on the Korean peninsula, meat consumption and meat prices collapsed, an outcome not observed during the recent outbreak of AI. We wanted to apply the TAR model to estimate the threshold effects of infectious disease-related news on livestock retail prices after outbreaks of major infectious diseases. Therefore, this study specifically focused on whether threshold effects that make the livestock price nonlinear exist due to news and SNS frequency related to infectious diseases. However, this study has a few limitations. First, it did not consider the various factors that can affect livestock prices but looked only at disease-related news and SNS frequency. Second results were interpreted by speculation, and third, analysis of positive and negative news and SNS reporting was missing. For better livestock price prediction, it is necessary to study various factors that can affect prices and analyze the positive and negative content of news and SNS when infectious diseases occur.

Author Contributions

Conceptualization, methodology and software, H.R.; validation and investigation, H.-W.K.; writing—original draft preparation, H.R.; formal analysis, H.-W.K.; supervision and project administration, A.N., W.-S.C., S.C. and K.-H.Y. All authors have read and agreed to the published version of the manuscript.

Funding

This research was funded by the “Cooperative Research Program for Agriculture Science and Technology Development (Project No. PJ015341012021 and PJ016208012021)” Rural Development Administration, Republic of Korea, and partly by the Basic Science Research Program through the National Research Foundation of Korea (NRF) funded by the Ministry of Education (Grant number: 2020R1I1A1A01071884).

Institutional Review Board Statement

Not applicable.

Informed Consent Statement

Not applicable.

Data Availability Statement

Not applicable.

Acknowledgments

The authors thank the “Cooperative Research Program for Agriculture Science and Technology Development (Project No. PJ015341012021 and PJ016208012021)” of the Rural Development Administration, Republic of Korea, and the Basic Science Research Program of the National Research Foundation of Korea (NRF) funded by the Ministry of Education (Grant number: 2020R1I1A1A01071884).

Conflicts of Interest

The authors declare no conflict of interest.

References

  1. Kang, Y.-S. Pork Prices in S. Korea on Wane Amid African Swine Fever Outbreaks. 2019. Available online: https://en.yna.co.kr (accessed on 20 May 2021).
  2. Gim, U.-S.; Choi, S.-H.; Cho, J.-H. An Impact Analysis of FMD News on Pork Demand in Korea. Korean J. Community Living Sci. 2015, 26, 75–85. [Google Scholar] [CrossRef] [Green Version]
  3. Kim, H.W. An Analysis of the Dynamic Characteristics in Price Transmission from Farm to Retail Stages According to Infectious Diseases: The Case of Broiler. Master’s Thesis, Chungbuk National University, Cheongju, Korea, 2018. [Google Scholar]
  4. Pendell, D.L.; Leatherman, J.C.; Schroeder, T.C.; Alward, G.S. The economic impacts of a foot-and-mouth disease outbreak: A regional analysis. J. Agric. Appl. Econ. 2007, 39, 19–33. [Google Scholar] [CrossRef] [Green Version]
  5. Paarlberg, P.L.; Lee, J.G.; Seitzinger, A.H. Potential revenue impact of an outbreak of foot-and-mouth disease in the United States. J. Am. Vet. Med. Assoc. 2002, 220, 988–992. [Google Scholar] [CrossRef] [PubMed]
  6. McCluskey, J.; Grimsrud, K.; Ouchi, H.; Wahl, T. Bovine Spongiform Encephalopathy in Japan: Consumers’ Food Safety Perceptions and Willingness to Pay for Tested Beef. Aust. J. Agric. Resour. Econ. 2005, 49, 197–209. [Google Scholar] [CrossRef] [Green Version]
  7. Lloyd, T.; McCorriston, S.; Morgan, W.; Rayner, A. Food Scares, Market Power and Price Transmission: The UK Bse Crisis. Eur. Rev. Agric. Econ. 2006, 33, 119–147. [Google Scholar] [CrossRef]
  8. Qin, L.; Sun, Q.; Wang, Y.; Wu, K.-F.; Chen, M.; Shia, B.-C.; Wu, S.-Y. Prediction of number of cases of 2019 novel coronavirus (COVID-19) using social media search index. Int. J. Environ. Res. Public Health 2020, 17, 2365. [Google Scholar] [CrossRef] [PubMed] [Green Version]
  9. Phengsuwan, J.; Shah, T.; Thekkummal, N.B.; Wen, Z.; Sun, R.; Pullarkatt, D.; Thirugnanam, H.; Ramesh, M.V.; Morgan, G.; James, P.; et al. Use of Social Media Data in Disaster Management: A Survey. Future Internet 2021, 13, 46. [Google Scholar] [CrossRef]
  10. Amato, F.; Moscato, V.; Picariello, A.; Sperlí, G. Diffusion algorithms in multimedia social networks: A preliminary model. In Proceedings of the 2017 IEEE/ACM International Conference on Advances in Social Networks Analysis and Mining 2017, Sydney, Australia, 31 July–3 August 2017; pp. 844–851. [Google Scholar]
  11. La Gatta, V.; Moscato, V.; Postiglione, M.; Sperli, G. An Epidemiological Neural network exploiting Dynamic Graph Structured Data applied to the COVID-19 outbreak. IEEE Trans. Big Data 2020, 7, 45–55. [Google Scholar] [CrossRef]
  12. Ryu, G.; Nasridinov, A.; Rah, H.; Yoo, K.-H. Forecasts of the Amount Purchase Pork Meat by Using Structured and Unstructured Big Data. Agriculture 2020, 10, 21. [Google Scholar] [CrossRef] [Green Version]
  13. Zapata, H.O.; Gauthier, W.M. Threshold Models in Theory and Practice. 2003. Available online: https://ageconsearch.umn.edu/record/35147/files/sp03za06.pdf (accessed on 31 January 2021).
  14. Tong, H.; Lim, K.S. Threshold autoregression, limit cycles and cyclical data. J. R. Stat. Soc. Ser. B 1980, 42, 245–292. [Google Scholar] [CrossRef]
  15. Hansen, B.E. Sample splitting and threshold estimation. Econometrica 2000, 68, 575–603. [Google Scholar] [CrossRef] [Green Version]
  16. Hansen, B. Inference in TAR models. Stud. Nonlinear Dyn. Econom. 1997, 2, 1–14. [Google Scholar] [CrossRef]
  17. Hansen, B. Testing for linearity. J. Econ. Surv. 1999, 13, 551–576. [Google Scholar] [CrossRef]
  18. Hansen, B.E. Threshold autoregression in economics. Stat. Its Interface 2011, 4, 123–127. [Google Scholar] [CrossRef]
  19. Kim, H.-W.; Kwon, J.-S.; Kim, S.-J.; Yoo, D.-I. An Analysis on Non-linear Structure of Livestock Prices Caused by Infectious Diseases: An Application to Pork, Chicken, and Egg. 2018. Available online: https://ageconsearch.umn.edu/record/273977/files/Abstracts_18_05_23_14_21_25_69__27_35_83_249_0.pdf (accessed on 26 May 2020).
  20. Li, J.; Chavas, J.-P. The Impacts of African Swine Fever on Vertical and Spatial Hog Pricing and Market Integration in China. 2020. Available online: https://ageconsearch.umn.edu/record/304516/files/18994.pdf (accessed on 24 May 2021).
  21. Zhao, G.-Q.; Qiong, W. Nonlinear dynamics of pork price in China. J. Integr. Agric. 2015, 14, 1115–1121. [Google Scholar] [CrossRef]
  22. McNees, S.K. Forecasting accuracy of alternative techniques: A comparison of US macroeconomic forecasts. J. Bus. Econ. Stat. 1986, 4, 5–15. [Google Scholar] [CrossRef]
  23. Chuluunsaikhan, T.; Ryu, G.; Yoo, K.-H.; Rah, H.; Nasridinov, A. Incorporating Deep Learning and News Topic Modeling for Forecasting Pork Prices: The Case of South Korea. Agriculture 2020, 10, 513. [Google Scholar] [CrossRef]
Figure 1. Trends in retail pork prices, African Swine Fever (ASF)-related news and SNS frequencies in 2019. The x axis indicates time and the y axis indicates retail pork price and frequency.
Applsci 11 05114 g001
Figure 2. Trends of retail chicken prices, Avian Influenza (AI)-related news and SNS frequencies in 2018 and 2019. The x axis indicates time and the y axis indicates retail chicken price and frequency.
Applsci 11 05114 g002
Figure 3. Estimation of the impact response periods of retail pork prices according to the regime for the African Swine Fever (ASF)-related news frequency. The x axis indicates the period (day) and the y axis indicates the retail price responded to impulse.
Applsci 11 05114 g003
Figure 4. Estimation of the impact response period of retail chicken prices according to the Avian Influenza (AI)-related news frequency. The x axis indicates period (day) and the y axis indicates retail price responded to impulse.
Applsci 11 05114 g004
Table 1. List of Unstructured Data Used in this Study.
YearDiseaseNo. of CasesNo. of Disease-Related News ReportsNo. of Disease-Related SNS Posts
2018Avian Influenza141666814
2019035292
2019African Swine Fever14958616,111
Table 2. Threshold Effect Test of African Swine Fever-related News on Retail Pork Prices.
PriceThreshold Effect TestLilihood Ratio-Statisticsp-Value
Retail Pork priceLinear AR vs. 1 threshold AR7.650.50
Linear AR vs. 2 threshold AR10.05<0.01 *
Note: * indicates significance at the 1% level.
Table 3. Threshold Autoregressive Model of the African Swine Fever (ASF)-related News Frequency on Retail Pork Prices.
Threshold VariableRegimeThreshold Value and Regime Interval (ASF-Related News Frequencies (Differences))Coefficient
Retail Pork Price (Differences)
ASF-related news frequencies (differences)1regime 1 < −9 Δ p ( 1 ) 0.0524
Δ p ( 2 ) −0.4366 *
2−9 ≤ regime 2 < 8 Δ p ( 1 ) −0.2943 *
Δ p ( 2 ) −0.2657 *
38 ≤ regime 3 Δ p ( 1 ) −0.5825 *
Δ p ( 2 ) .−0.3357 *
Note: * indicates significance at the 1% level.
Table 4. Coefficients of African Swine Fever (ASF)-related SNS frequencies per regime and the amount of ASF-related SNS frequency difference required to change the retail pork price by one standard deviation.
RegimeCoefficient of ASF-Related SNS Frequency Difference Standard Deviation (S.D.) of Retail Pork Price Difference per RegimeAmount of ASF-Related SNS Frequency Difference Required to Change the Retail Pork Price by One Standard Deviation
11.1666 *288.2169247.057
20.2663276.72781039.158
3−0.1035291.58702817.266
Note: * indicates significance at the 1% level.
Table 5. Estimation of the Impact Response Period of retail pork prices according to the regime for ASF-related news frequency.
RegimeEstimation of the Impact Response Period of Retail Pork Prices According to the Regime for the ASF-Related News Frequency
148 days
26 days
38 days
Table 6. Threshold Effect Test of Avian Influenza-related News on Retail Chicken Prices.
PriceThreshold Effect TestLikelihood Ratio Statisticsp-Value
Retail chicken priceLinear AR vs. 1 threshold AR4.900.68
Linear AR vs. 2 threshold AR26.190.44
Table 7. Autoregressive Model of the Avian Influenza (AI)-related News Frequency for Retail Chicken Prices.
Threshold VariableRegimeThreshold Value and Regime Interval (AI-Related News Frequencies (Difference))Coefficient
Chicken Price (Difference)AI-Related SNS Frequencies (Difference)
AI-related news frequency (differences)N/AN/A−0.0112−2.5883
Table 8. Comparison of the Prediction Accuracy of the Threshold Autoregressive (TAR) and Autoregressive (AR) Models.
PriceModelRoot Mean Square Error (RMSE)
Retail pork priceAutoregressive267.002
Threshold autoregressive261.639
Retail chicken priceAutoregressive205.058
Publisher’s Note: MDPI stays neutral with regard to jurisdictional claims in published maps and institutional affiliations.

