Article

Failure Patterns and Morphological Soil–Rock Interface Characteristics of Frozen Soil–Rock Mixtures under Compression and Tension

1
Key Laboratory of Shale Gas and Geoengineering, Institute of Geology and Geophysics, Chinese Academy of Sciences, Beijing 100029, China
2
College of Earth and Planetary Science, University of Chinese Academy of Sciences, Beijing 100049, China
3
Innovation Academy for Earth Science, Chinese Academy of Sciences, Beijing 100029, China
*
Author to whom correspondence should be addressed.
Appl. Sci. 2021, 11(1), 461; https://doi.org/10.3390/app11010461
Submission received: 2 December 2020 / Revised: 29 December 2020 / Accepted: 31 December 2020 / Published: 5 January 2021

Abstract

:
Construction operations in cold regions may encounter frozen geomaterials. In construction, it is important to understand the processes by which geomaterials fail under common loading conditions to avoid accidents and work efficiently. In this work, an artificial frozen soil–rock mixture was used for uniaxial compression and indirect tension loading analysis to investigate macroscopic failure patterns and soil–rock interface crack evolution mechanisms. To further understand and compare the meso-mechanical failure mechanisms of the soil–rock interface, we used two types of rock block particles with different surface roughness for fabricating frozen artificial soil–rock mixtures. Acoustic emission (AE), ultrasonic plus velocity (UPV), and digital microscopy were utilized here to obtain the sample deformation response and analyze the morphology of the soil–rock interface. The results were as follows. From the perspective of macroscopic observation, bulging deformations and short tension cracks represent the main failure pattern under compression, and a tortuous tension crack in the center of the disk is the main failure pattern under indirect tension. From the perspective of microscopic observation, the soil–rock interface will evolve into a soil–rock contact band for the sample containing a rough rock block. The strength of the soil–rock contact band is obviously larger than that of the soil–rock interface. Three main failure patterns of the soil–rock interface were observed: a crack path through the accurate soil–rock interface, a crack path through the envelope of the rough rock block, and a crack path passing through the rough rock block. The experimental results could provide a reference for foundation engineering, especially in pile foundation engineering in cold regions.

1. Introduction

Soil–rock mixtures (SRMs) are very complicated inhomogeneous geomaterials with textures of stiff rock blocks surrounded by weaker soil. Not only are SRMs widely distributed in nature, i.e., via remnant slope accumulation, flush accumulation, and glacial accumulation, they are also widely used as materials in geotechnical engineering, such as in roadbed and railway subgrade construction. SRMs offer a wide range of mechanical properties and strongly rely on their internal mesostructure, i.e., the rock block proportion, block shape, block size, spatial distribution, etc. Many large engineering structures inevitably feature SRMs. The design and construction of engineering structures with SRMs is always challenging. In recent years, as important projects in Tibet, the Qinghai–Tibet railway, Sichuan–Tibet railway roadbed, and power transmission line construction in areas passing through high-altitude glacier areas and cold regions in which frozen soil, frozen soil–rock mixtures (FSRMs), and glacier debris are widespread [1,2,3,4,5,6]. The mechanical properties of FSRMs have attracted significant interest during the last 10 years due to their roles in engineering, and FSRMs are more complicated than general SRMs.
Prior studies have largely focused on internal components in SRMs such as the rock block proportion, rock size, and rock block shape in terms of macroscopic strength response [7,8,9,10,11,12,13,14]. In recent decades, many studies have shown that the soil–rock interface is the weak area inside SRMs at normal temperature and that cracks are typically initiated here. The soil–rock interface is generally considered to be the most sensitive part of a SRM to an external load. The mechanical properties of SRMs are strongly affected by the soil–rock interface. To study the failure pattern and the evolution of cracks and rock blocks for SRMs, many scholars have carried out various studies. For example, Wang and Sun [15,16] investigated crack propagation under uniaxial compressive testing, finding the distributions of cracks were strongly affected by the rock block position, where most of the cracks were located around the rock blocks. Wang et al. [17] studied the mesomechanical characteristics of SRMs, highlighting the stress concentration at the soil–rock interface region and that the failure of the SRM firstly occurred here. Considering only the soil–rock interface region, according to previous studies, the soil particle size, cementation, and the mechanical contrast between blocks and matrices play important roles in the mechanical properties of the soil–rock interface, as well as the crack propagation mode [11,18,19,20]. The surface roughness (wave distance <1 mm) of rock blocks, rather than the macroscopic rock block shape (wave distance >10 mm), is another important factor that affects the mechanical properties of a soil–rock interface [21]. In contrast, less attention has been placed on rock block surface roughness, especially in terms of numerical simulation analysis. Smooth particles or particle clumps are commonly used as rock blocks in SRMs. Xu [13] constructed a mesostructure concept model of a rock block via a digital image processing technique, and the results showed that the boundary of the rock block should be smooth enough for meshing of the geometry model for the SRM. The influence of the rock block’s surface roughness on the soil–rock interface remains unknown, especially for cementation SRMs, such as frozen SRMs. In recent years, with the rapid emergence of engineering construction in cold regions, a series of geotechnical problems have drawn the attention and interest of many engineers; however, studies on frozen soil–rock mixtures (FSRMs) are lagging behind frozen soil studies. The freezing properties of fine soil may differ significantly from those of coarse-grained soil [22]. This topic has rarely been studied. Fitzsimons [23] studied the structure, strength, and deformation behavior of substrate from Suess Glacier, Southern Victoria Land, Antarctica, with a large-scale direct shear device. Nickling and Bennett [24] studied the effects of the ice content and normal load on frozen coarse granular debris shear strength properties. They found that the Mohr–Coulomb failure envelopes displayed very distinctive parabolic curvilinearity. Arenson et al. [25,26] observed the freezing process of coarse-grained sand and the creep and strength properties of rock glacier samples in triaxial stress conditions. Qi et al. [27] studied the influence of temperature, ice content, and normal stress on the shear strength of soil–rock mixtures via large direct shear tests; however, adjustments to the mesostructure (such as the rotation of rock blocks and changes) and the development of internal injures (crack propagation and breakage of rock blocks, etc.) were the crucial causes of the different macro-mechanical responses. Unfortunately, there are a few relevant clues toward frozen soil–rock interface properties, especially in terms of the morphology and cracking characteristics of the frozen soil–rock interface. According to freezing adhesion theory [28], ice adhesion is strongly affected by surface roughness. The contact angles of liquid decrease with the increasing surface roughness of material, where the smaller the contact angle, the higher the contact area, which causes stronger ice adhesion; however, as mentioned in previous studies detailed above, the soil–rock interface is the stress concentration area. The number of stress concentration points increases with an increasing surface roughness of rock blocks. The interactions between blocks and frozen soil matrices are more complex than the interactions at normal temperature. Microscopic representations and the deformation of the frozen soil–rock interface and the influence of rock block surface roughness on mechanical properties still require further exploration and correlation with physical materials. Here, the aim of this research was to explore soil–rock interface properties and their influence on the strength of FSRMs.
The purpose of this study was to investigate the macroscopic failure pattern and deformation of a FSRM sample. Moreover, the strength effects, interface morphologies, and crack propagation modes of soil–rock interfaces composed of rock blocks with different surface roughness are discussed. First, a series of uniaxial compressive tests and Brazilian tests of FSRM samples were conducted with different frozen temperatures. Simultaneously, to further understand the stress field, we used acoustic emission (AE) and ultrasonic plus velocity (UPV) methods during the compression tests. Second, we observed the mesostructure of the soil–rock interface inside the FSRM by utilizing a digital microscope camera. Ultimately, the crack propagation and cracking mode of the soil–rock interface are discussed and summarized.

2. Materials and Methods

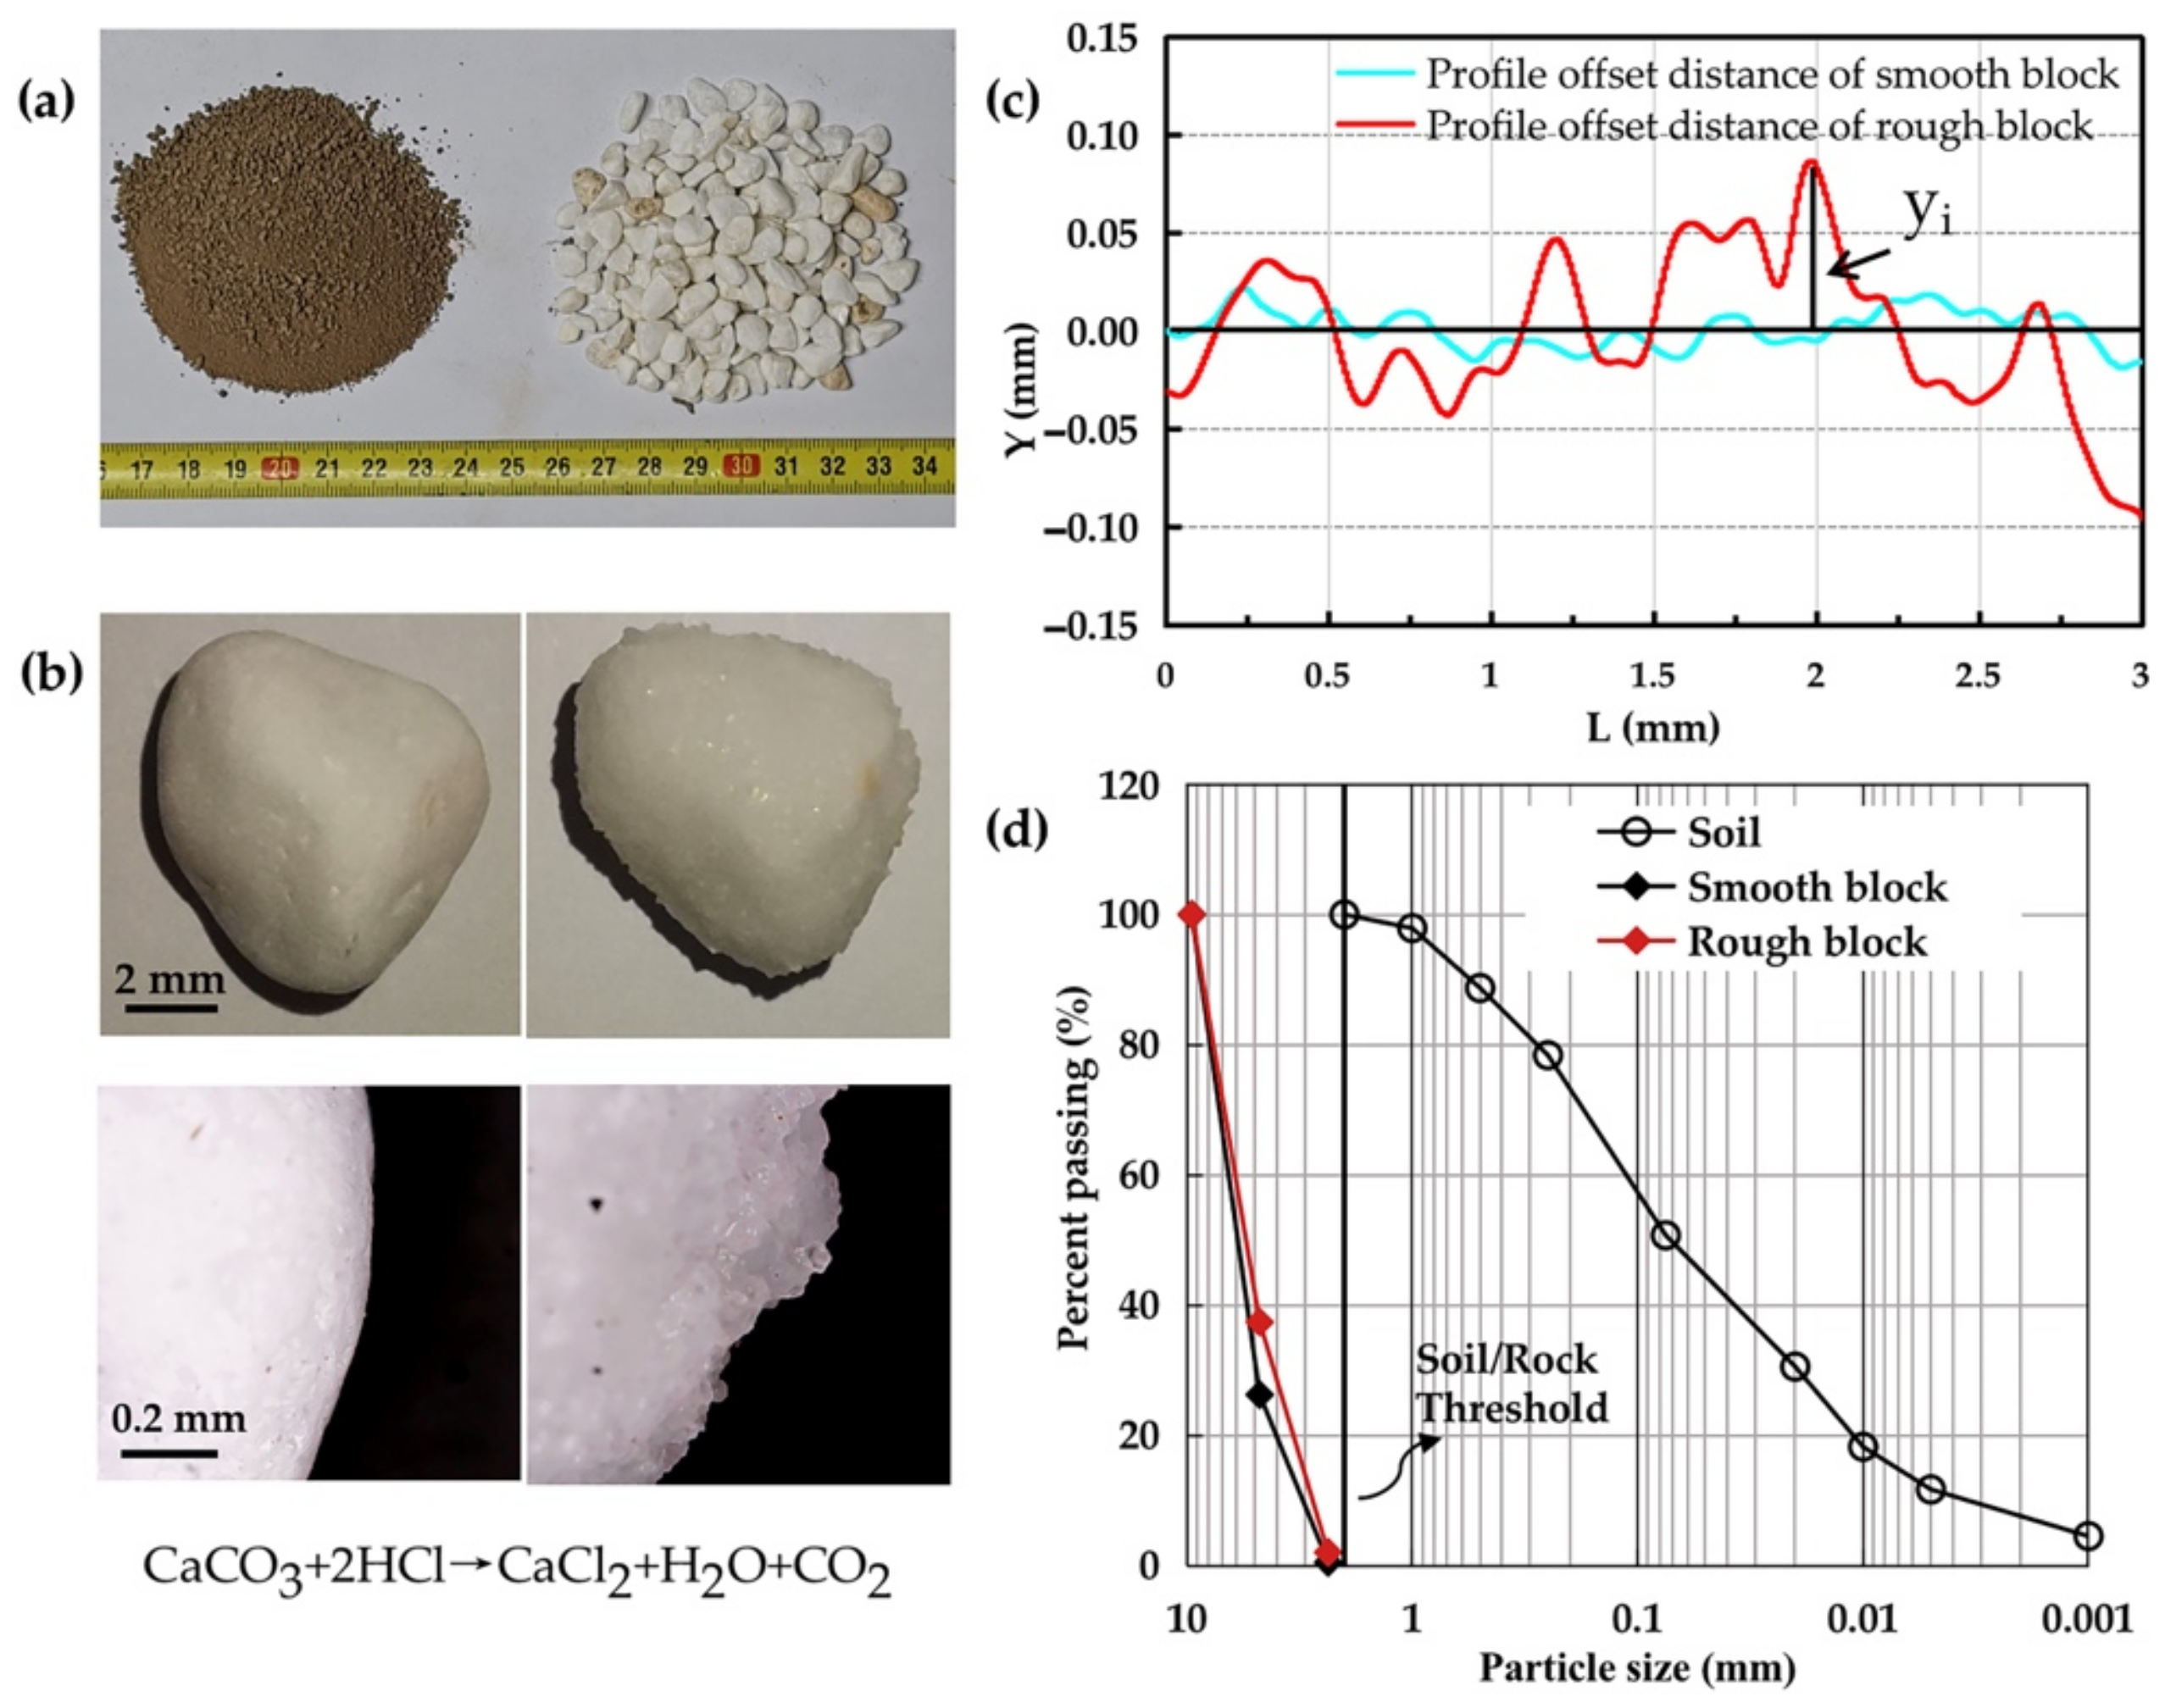
2.1. Material Characteristics and Sample Preparation

It is extremely challenging to obtain undisturbed core samples in permafrost [26]. Therefore, artificially prepared frozen samples were used in this research. According to the research from Medley and Lindquist [29,30], the soil/rock threshold was set at ds/rt = 0.05 Lc, where Lc is the diameter of specimens. Two types of cylindrical samples (61.8 mm (diameter) × 125 mm (height) and 61.8 mm × 50 mm) were fabricated for uniaxial compression testing and Brazilian testing, respectively. Therefore, we selected 2.0 mm as the soil/rock threshold. The plastic limit, liquid limit, and plasticity index of the soil were about 18.8%, 31.3%, and 12.5, respectively; the Cu and Cc were 31.58 and 0.77, respectively. For rock blocks, according to the sample preparation standard (Standard for Soil Test Method GB/T 50123-1999) [31], the diameters of rock blocks should be less than 12.36 mm (61.8 × 0.2 = 12.36 mm). Moreover, the geometries and strengths of rock blocks are the main factors that affect the mechanical properties of the soil–rock mixture [32,33,34]. Accordingly, alabaster blocks were chosen for testing, which are mostly made up of CaCO3 and SiO2. The particles have a density of 2.59 g/cm3 with a smooth surface. The point-load strength of the particles is about 6.5 MPa. We calculated the roundness, sphericity, and the ratio of the perimeter and area of projection contour using the Image-Pro Plus (IPP) software package [35]. The mean roundness, sphericity, and ratio values were 1.132, 0.729, and 0.536, respectively. In order to acquire alabaster blocks with a rough and porous surface and maintain similar macroscopic particle shapes with natural alabaster blocks, we treated the blocks with a hydrochloric acid solution (HCl) with a solubility of 5 mol/L for 15 min, then washed the alabaster blocks with distilled water. The angles of repose of the 2 alabaster blocks were 35° and 43°, respectively. Moreover, the arithmetical mean deviations of the profiles (Ra) were calculated as follows [36]:
R a = 1 n i = 1 n y i
As shown in Figure 1c, the Ra values of the 2 blocks were 13.24 µm (from 9 samples), and 99.14 µm (from 11 samples), respectively. All materials and corresponding parameters are shown in Figure 1.
The mixture ratio, water content, dry unit weight, and frozen temperature are the important factors that determine the strength and deformation characteristics of FSRMs. According to earlier literature [37,38], the strength of a SRM is jointly controlled by rock blocks and soil particles when the rock block content is 25%–75%. To obtain universal research conclusions and avoid the breakage of rock blocks during sample preparation, we selected the volumetric block proportion (VBP) of 40%. In the literature, when the water content is increased above saturation, the unfrozen water film thickness increases and pore ice begins to dominate the sample, where the strength is then reduced [24]. Considering the plastic limit (18.8%) and liquid limit (31.3%) of soil, research object, and sample preparation method, it is difficult to maintain the shape of sample at higher soil water content during sample preparation; moreover, it is not representative of frozen soil at lower soil water content. Therefore, the soil water content of 25% was selected. For the soil dry unit density, in general, the strength of frozen soil increases with an increase in unit weight; however, because most of natural SRMs are obtained from the loose colluvium and sediment, the soil dry weight of 1.7 g/cm3 was chosen.
For the SRM preparation, the soil was first mixed with the desired amount of pure water, and samples were placed in sealed bags for 12 h. Before the mixture preparation, an extra amount of pure water was sprayed on the rock blocks to prevent water absorption. Subsequently, the soil matrices and rock blocks for each sample were mixed and homogenized in a mixer. Then, the mixtures were placed in an iron module (61.8 × 125 mm in diameter and height, respectively) whose internal wall was covered with a Vaseline film. The samples were compacted in 3 layers with a stratified method. After the compaction of each layer, the top surface layer was disturbed to make the connectivity between the layers homogeneous. The samples were unmolded and were then sealed with plastic film to prevent water evaporation. For preventing the deformation of the cylindrical samples because of gravity, we wrapped them with a cylindrical copper mold that had the same size as the sample. In addition, to more clearly understand and compare the mechanisms of FSRM, we prepared ice–rock mixture samples with a VBP of 100%. All samples are shown in Figure 2.
In the literature, because of the large specific surface area for silty soil particles, most free water in the soil pores will be frozen at the temperature of −5 °C [27]. We selected the frozen temperatures of −10 °C, −20 °C, and −30 °C for analysis here. The samples were placed into a low-temperature box for 36 h. The temperature scope of the box was −50 to 150 °C with a resolution of 0.5 °C.

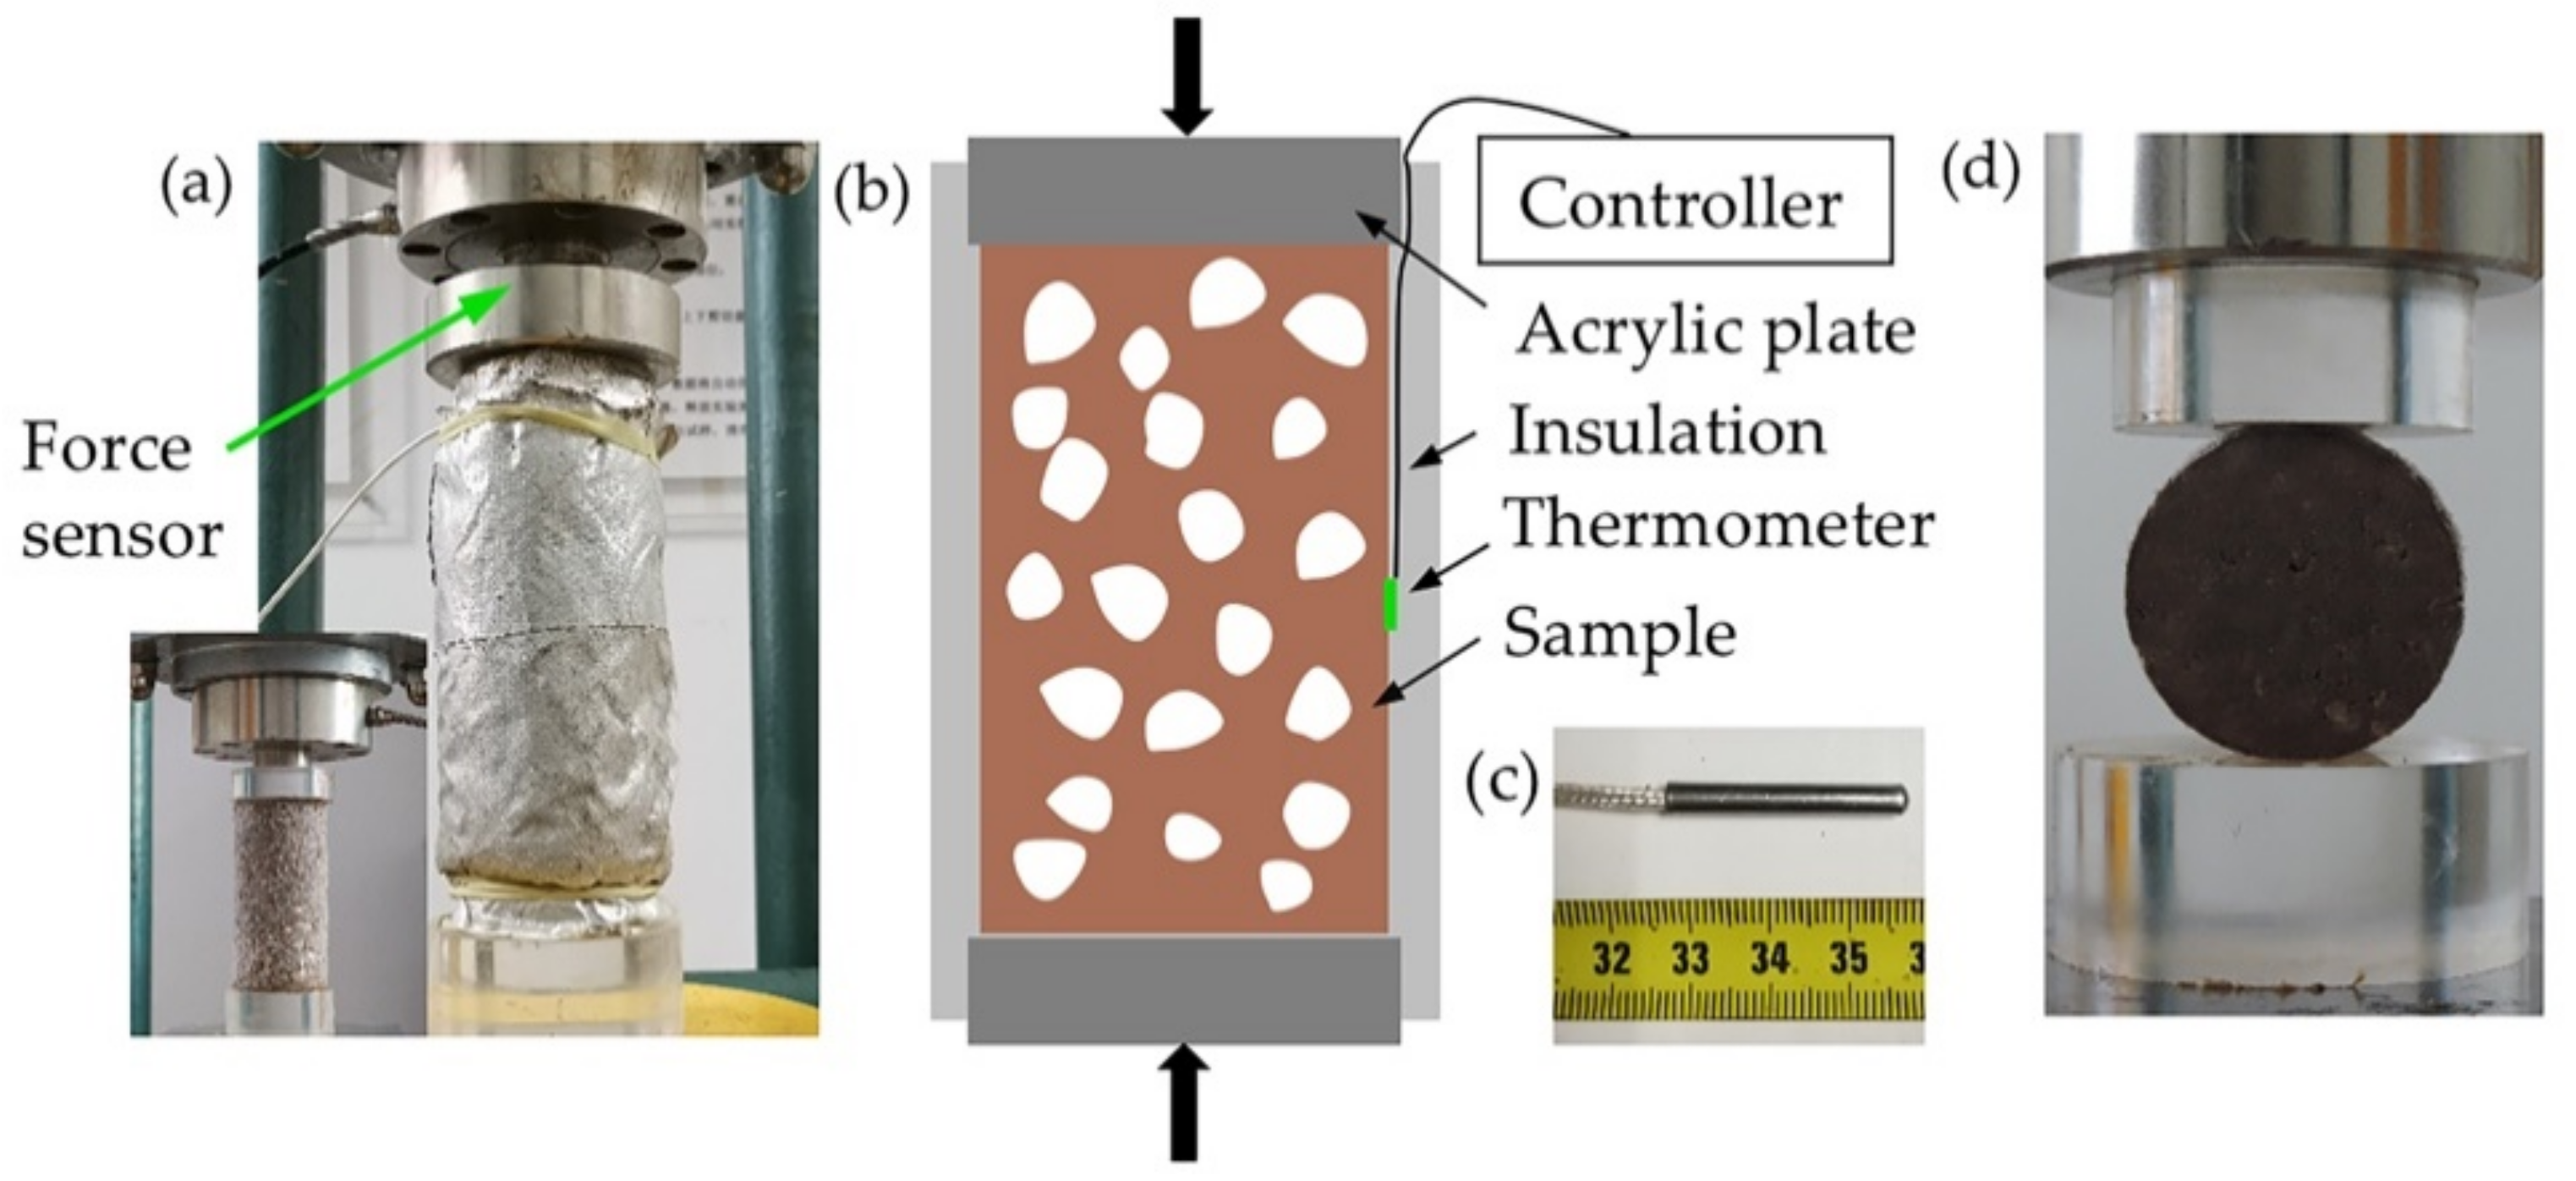
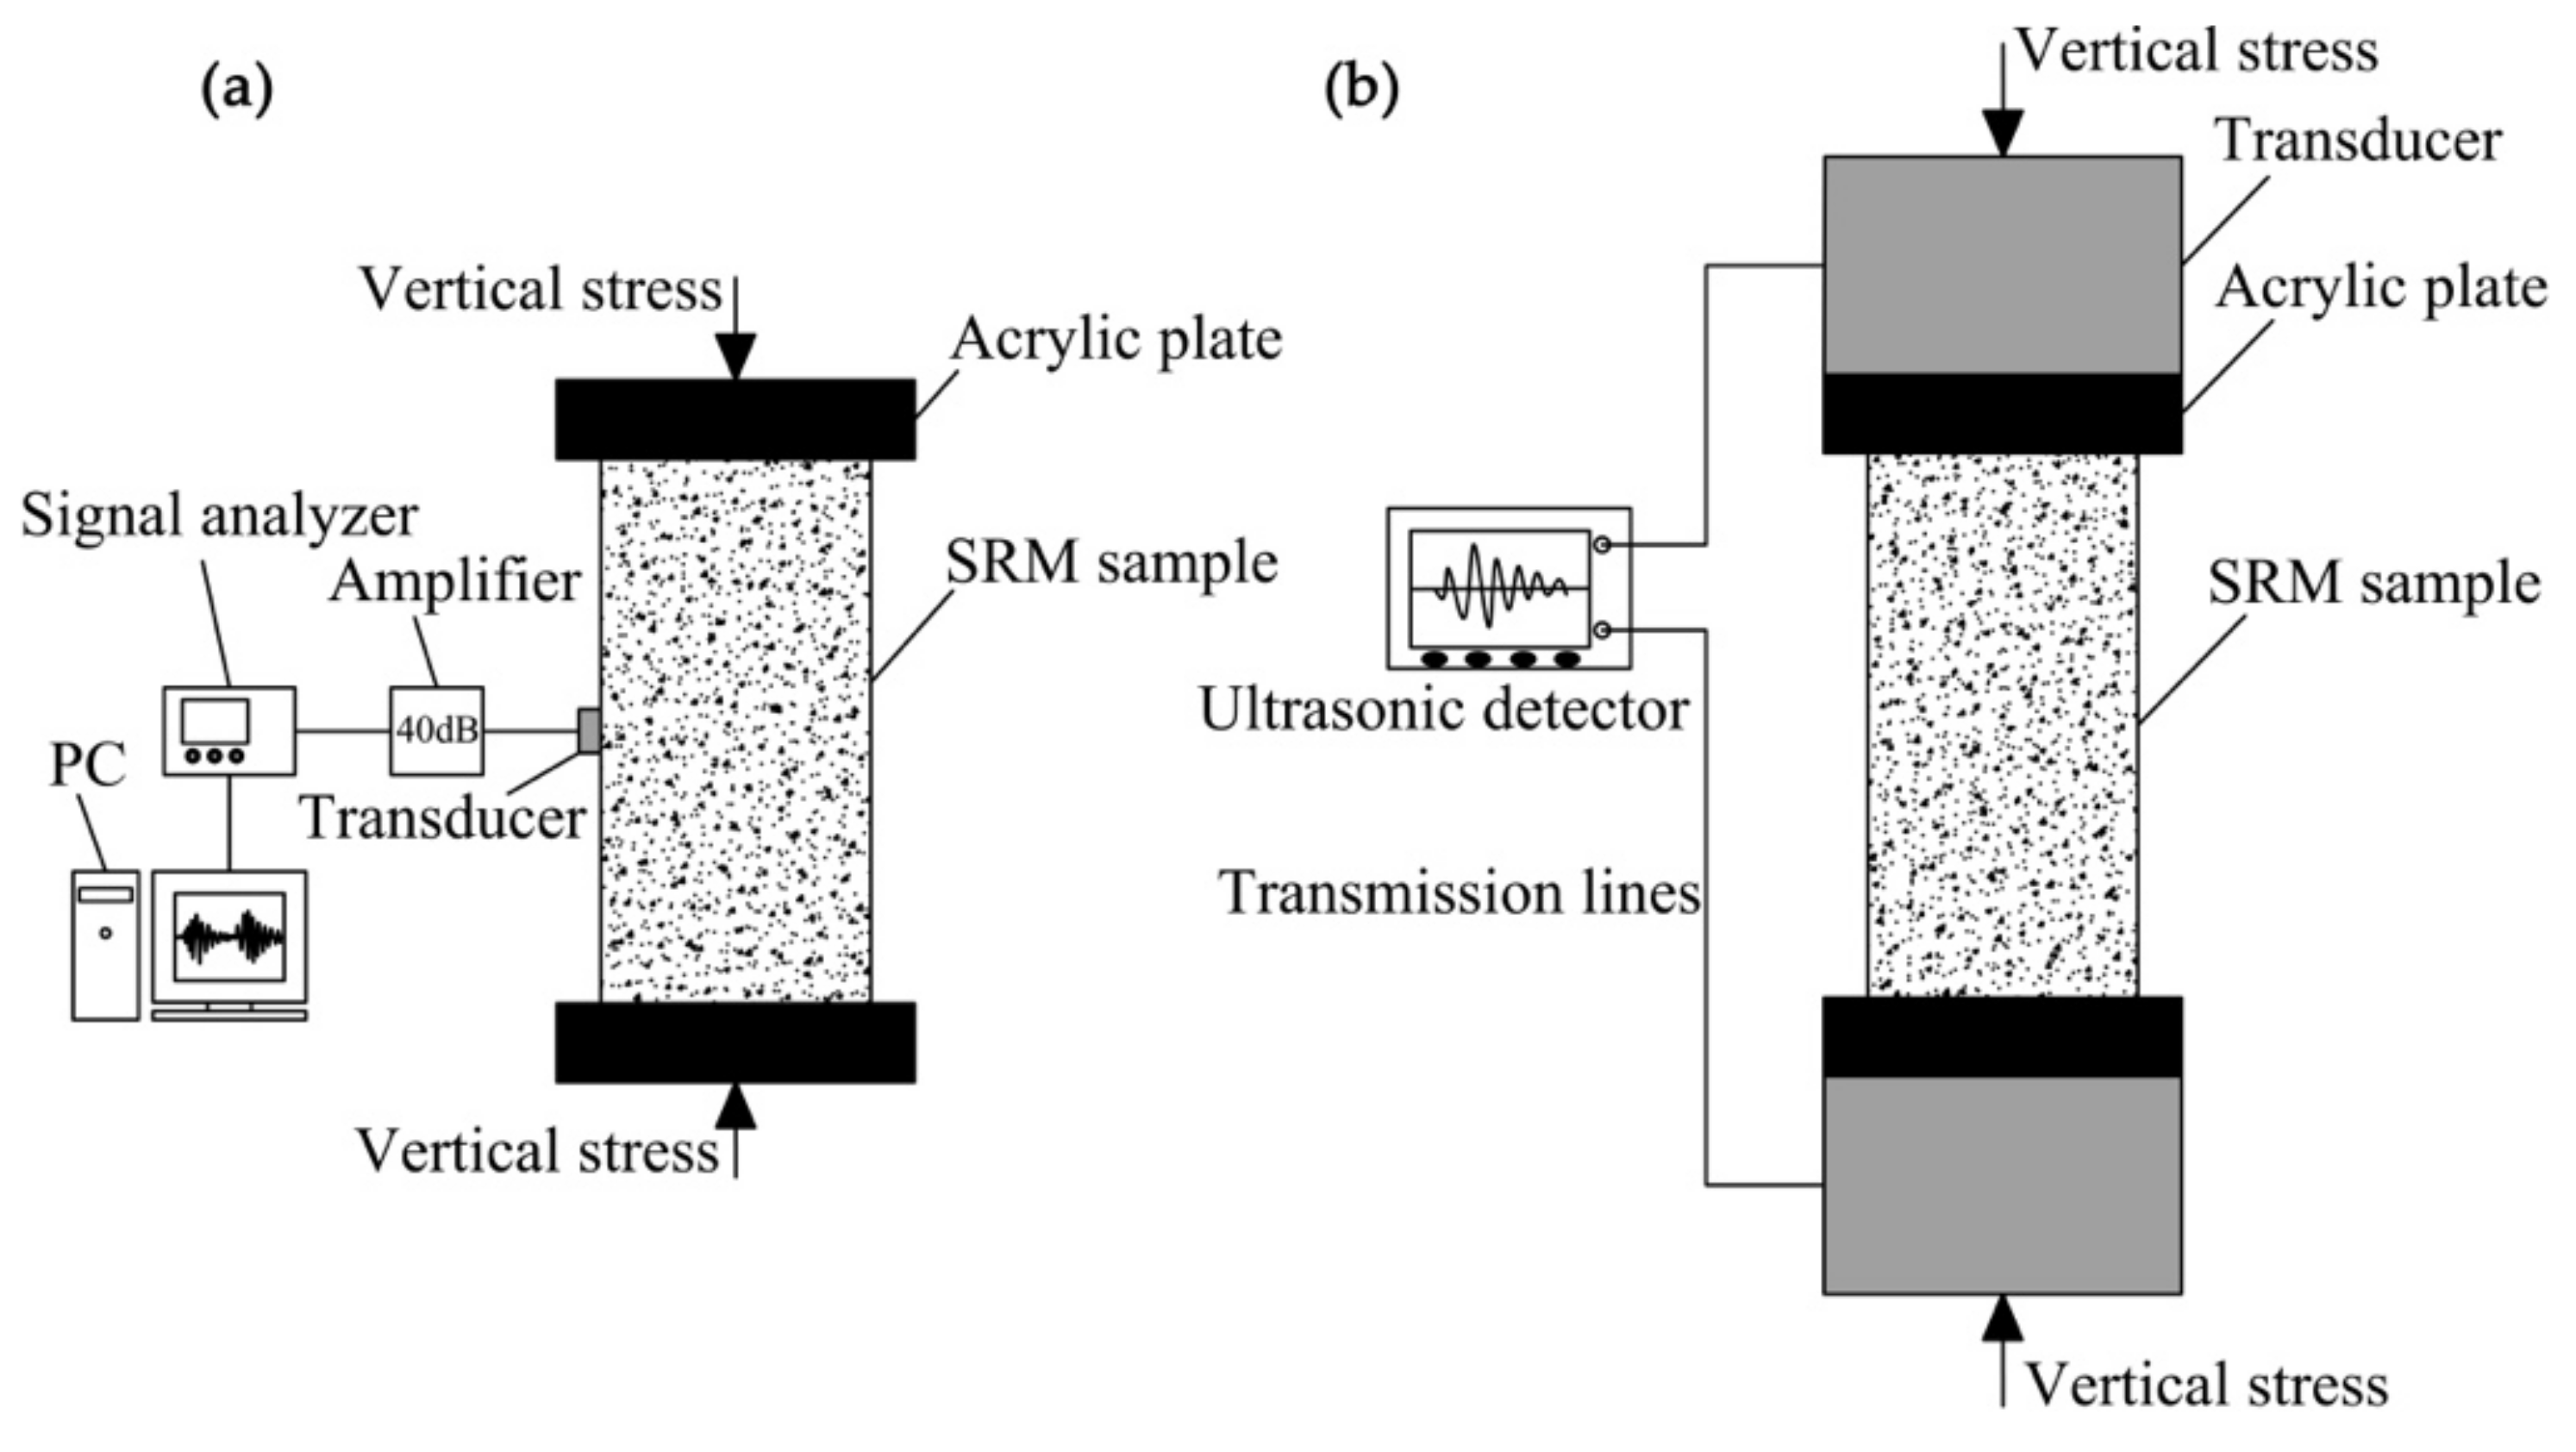
2.2. Testing Progress

Both the uniaxial compression testing and Brazilian testing for the FSRM samples were conducted using a Servotronic system with a capacity of 100 kN and a resolution of 0.1 kN [39]. The radial displacement was measured using a contact strain acquisition sensor at a resolution of 0.05 mm. In this experiment, the test was conducted in a lab environment (20 °C). To prevent the loading interface from melting, we replaced the top and bottom metal load platens with high-density acrylic plates (PMMA). In addition, the cylinder samples were capped at both ends with a Vaseline film. Meanwhile, the cylindrical samples were wrapped with aluminum silicate thermal insulation cotton during the uniaxial compression testing. For the Brazilian testing, each cylindrical disk was placed directly between the platens of the compression testing machine, as shown in Figure 3. All the tests were carried out under displacement control at a rate of 1.236 mm/min. The samples were taken out from the low-temperature environment box and were placed on a loading table. Axial loading was applied via an electric motor and the axial loading and displacement were recorded. Moreover, an electronic thermometer was fixed on the sample surface to monitor the temperature variation of the sample surface during compression, as shown in Figure 3.
Acoustic emission (AE) techniques can record ultrasound signals when emitted by a defect within a sample when it is produced. To clearly understand the internal deformation properties of rock blocks and the strain field characteristics under the uniaxial compression and Brazilian tests, we used an acoustic emission signal measuring system for obtaining the AE characteristics of a typical FSRM with the frozen temperature of −20 °C during testing (Figure 4a). A piezoelectric wide-band sensor (RS-2A) with a frequency spectrum of 50–400 kHz was installed in the middle of the specimen surface to pick up the high-frequency stress waves, which were then converted to electric signals. The background noise from the uniaxial compressive apparatus and surrounding environment approximately ranged from 6 to 25 mV. The trigger level voltage of 30 mV was selected on the basis of the preliminary analysis of waveforms. The signals detected by the sensor that were greater than the trigger level of 30 mV were amplified by a pre-amplifier by 40 dB and were then processed and recorded. The AE energy was recorded as a function of time. In addition, the ultrasonic plus velocity (UPV) is commonly used to evaluate cracks or defects inside materials. A P-wave transducer and associated equipment were employed to three similar FSRM samples to record the axial UPV during the compression process. The piezoelectric transducers were deployed at the 2 ends of the sample, as shown in Figure 4b. The piezoelectric wide-band transducers featured a frequency spectrum of 1–125 kHz. Pulses were emitted at a pulse width of 0.04 ms and a voltage of 500 V, and the sampling period was 0.2 µs. The transducer at the bottom emitted a pulse signal and the receiving transducer collected the signal at the top. An initial wave was selected to obtain the travel time at each loading step. The P-wave time to travel through the samples and acrylic end-caps platens were recorded (t1). The travel time in the acrylic plates was also recorded (t0). After measuring the sample length (L), we calculated the velocities as UPV = L / (t1–t0).

3. Results and Discussion

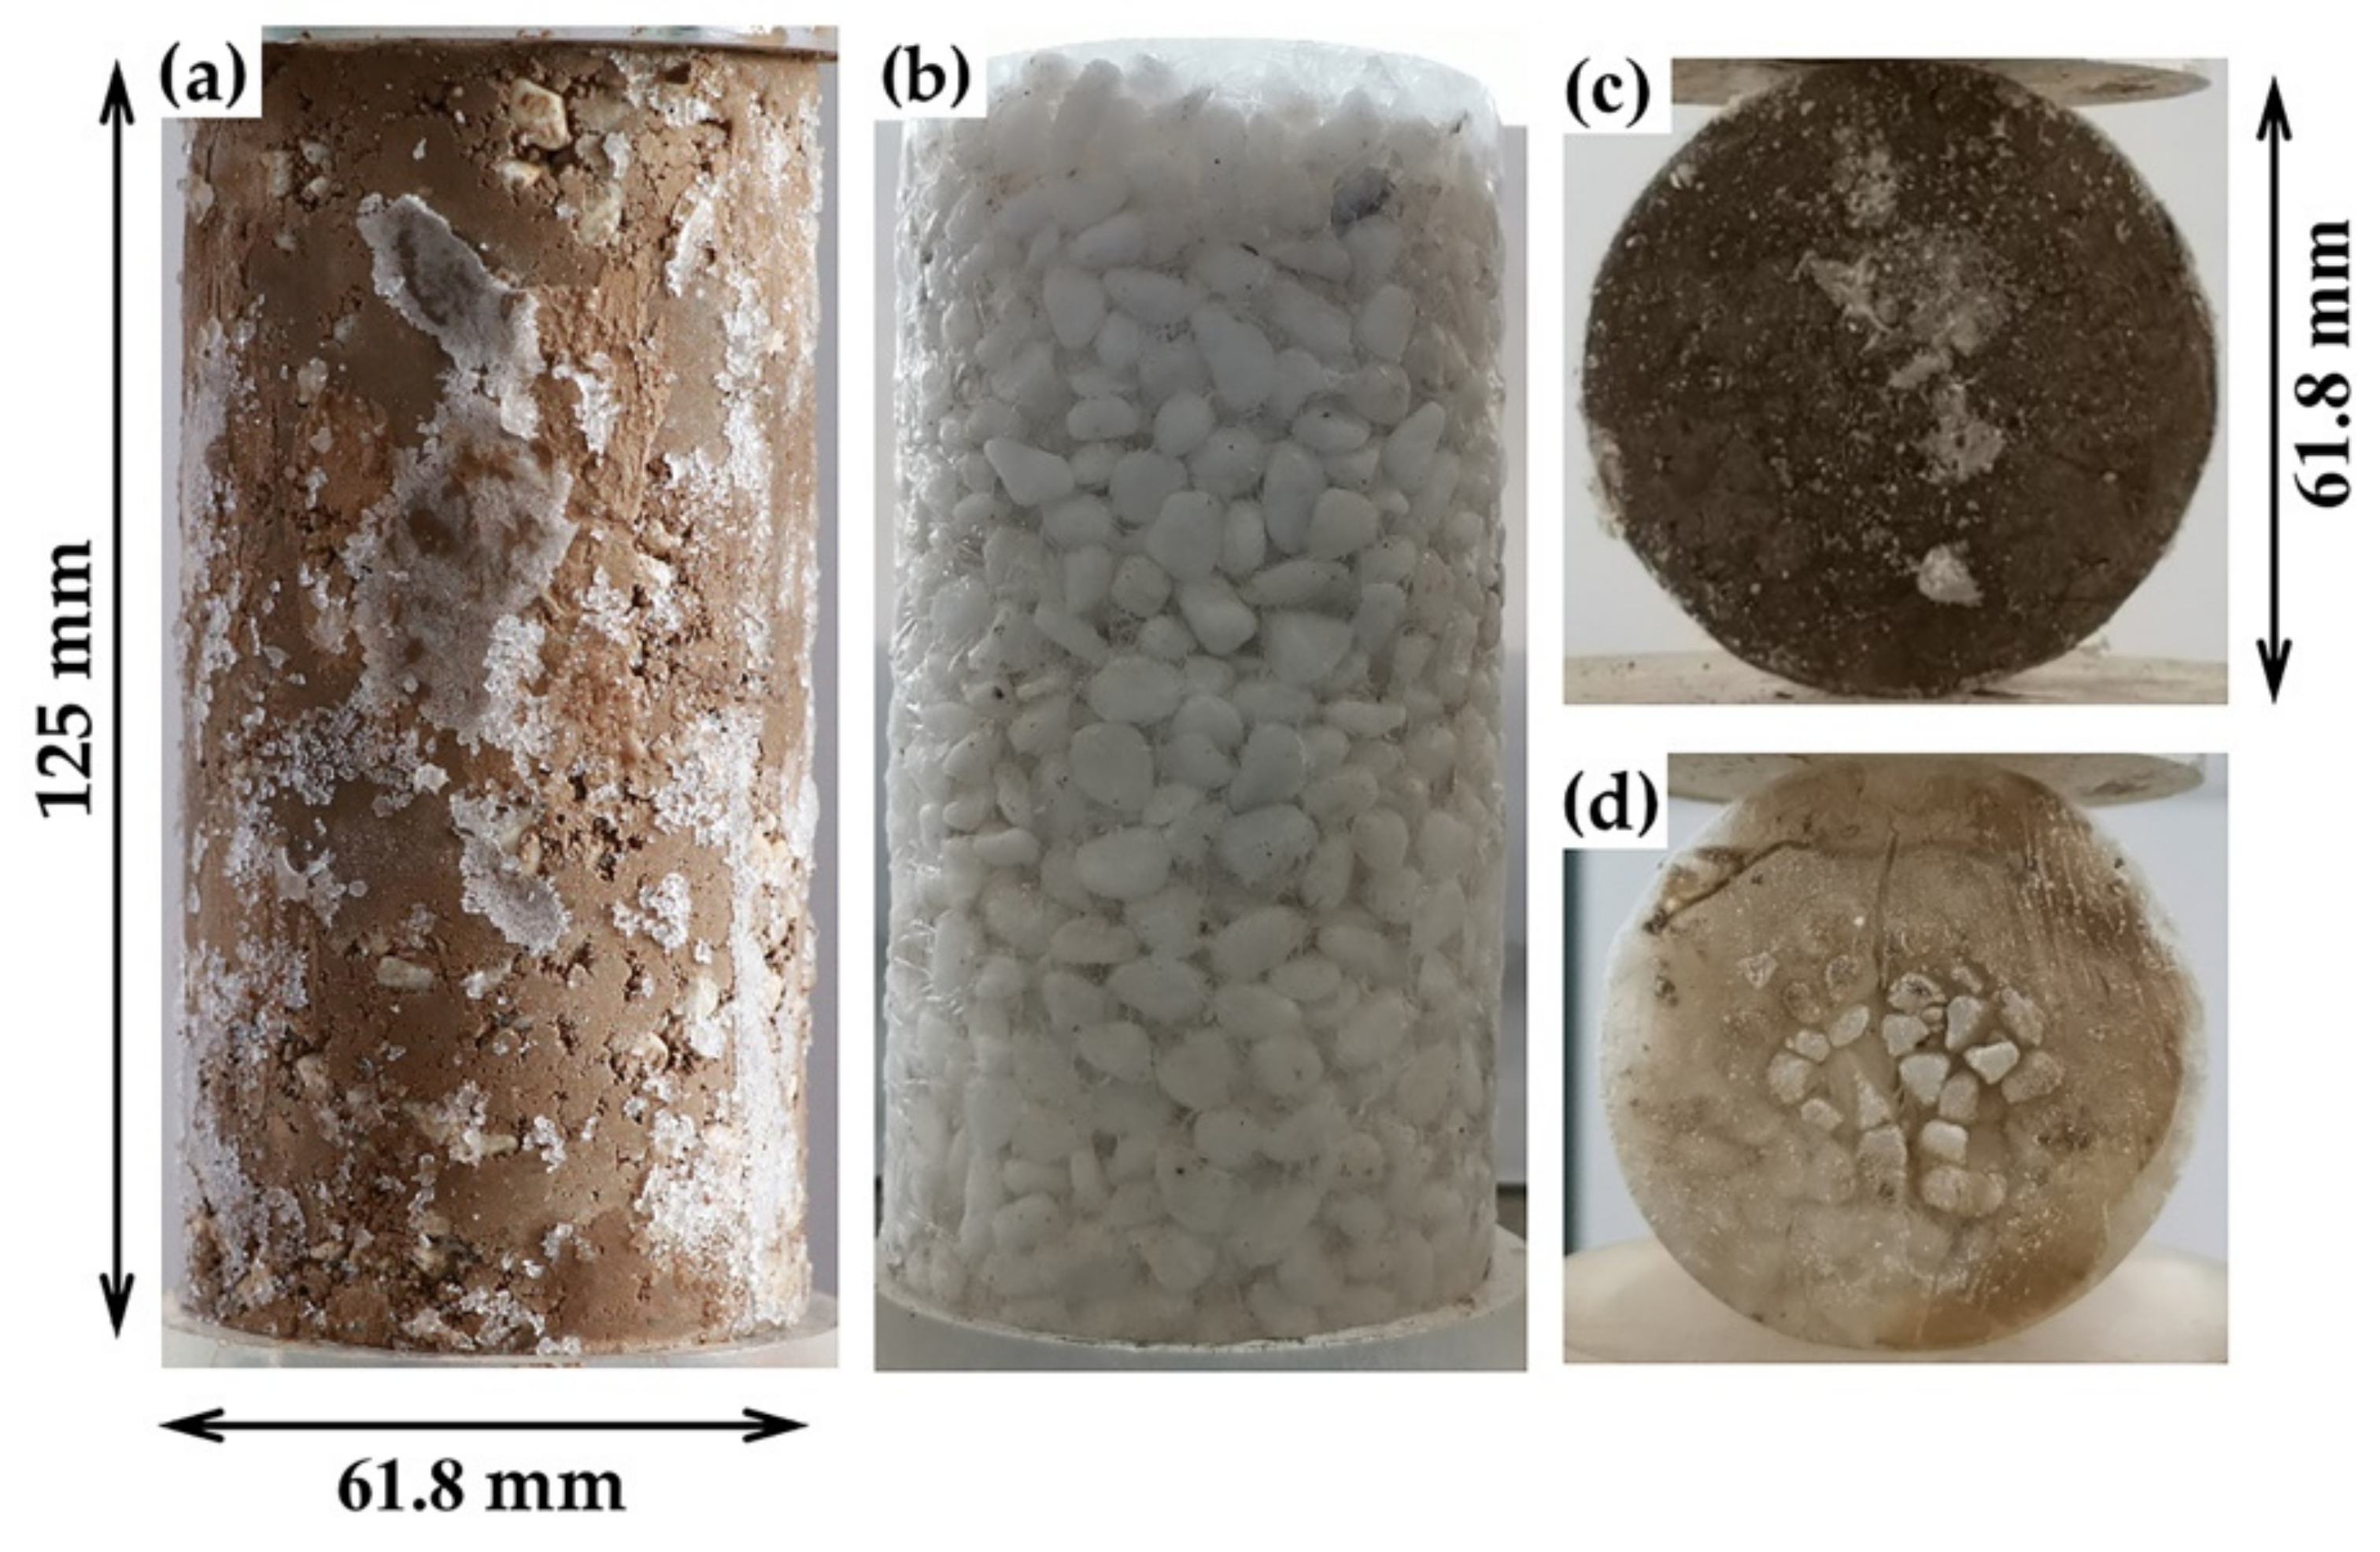
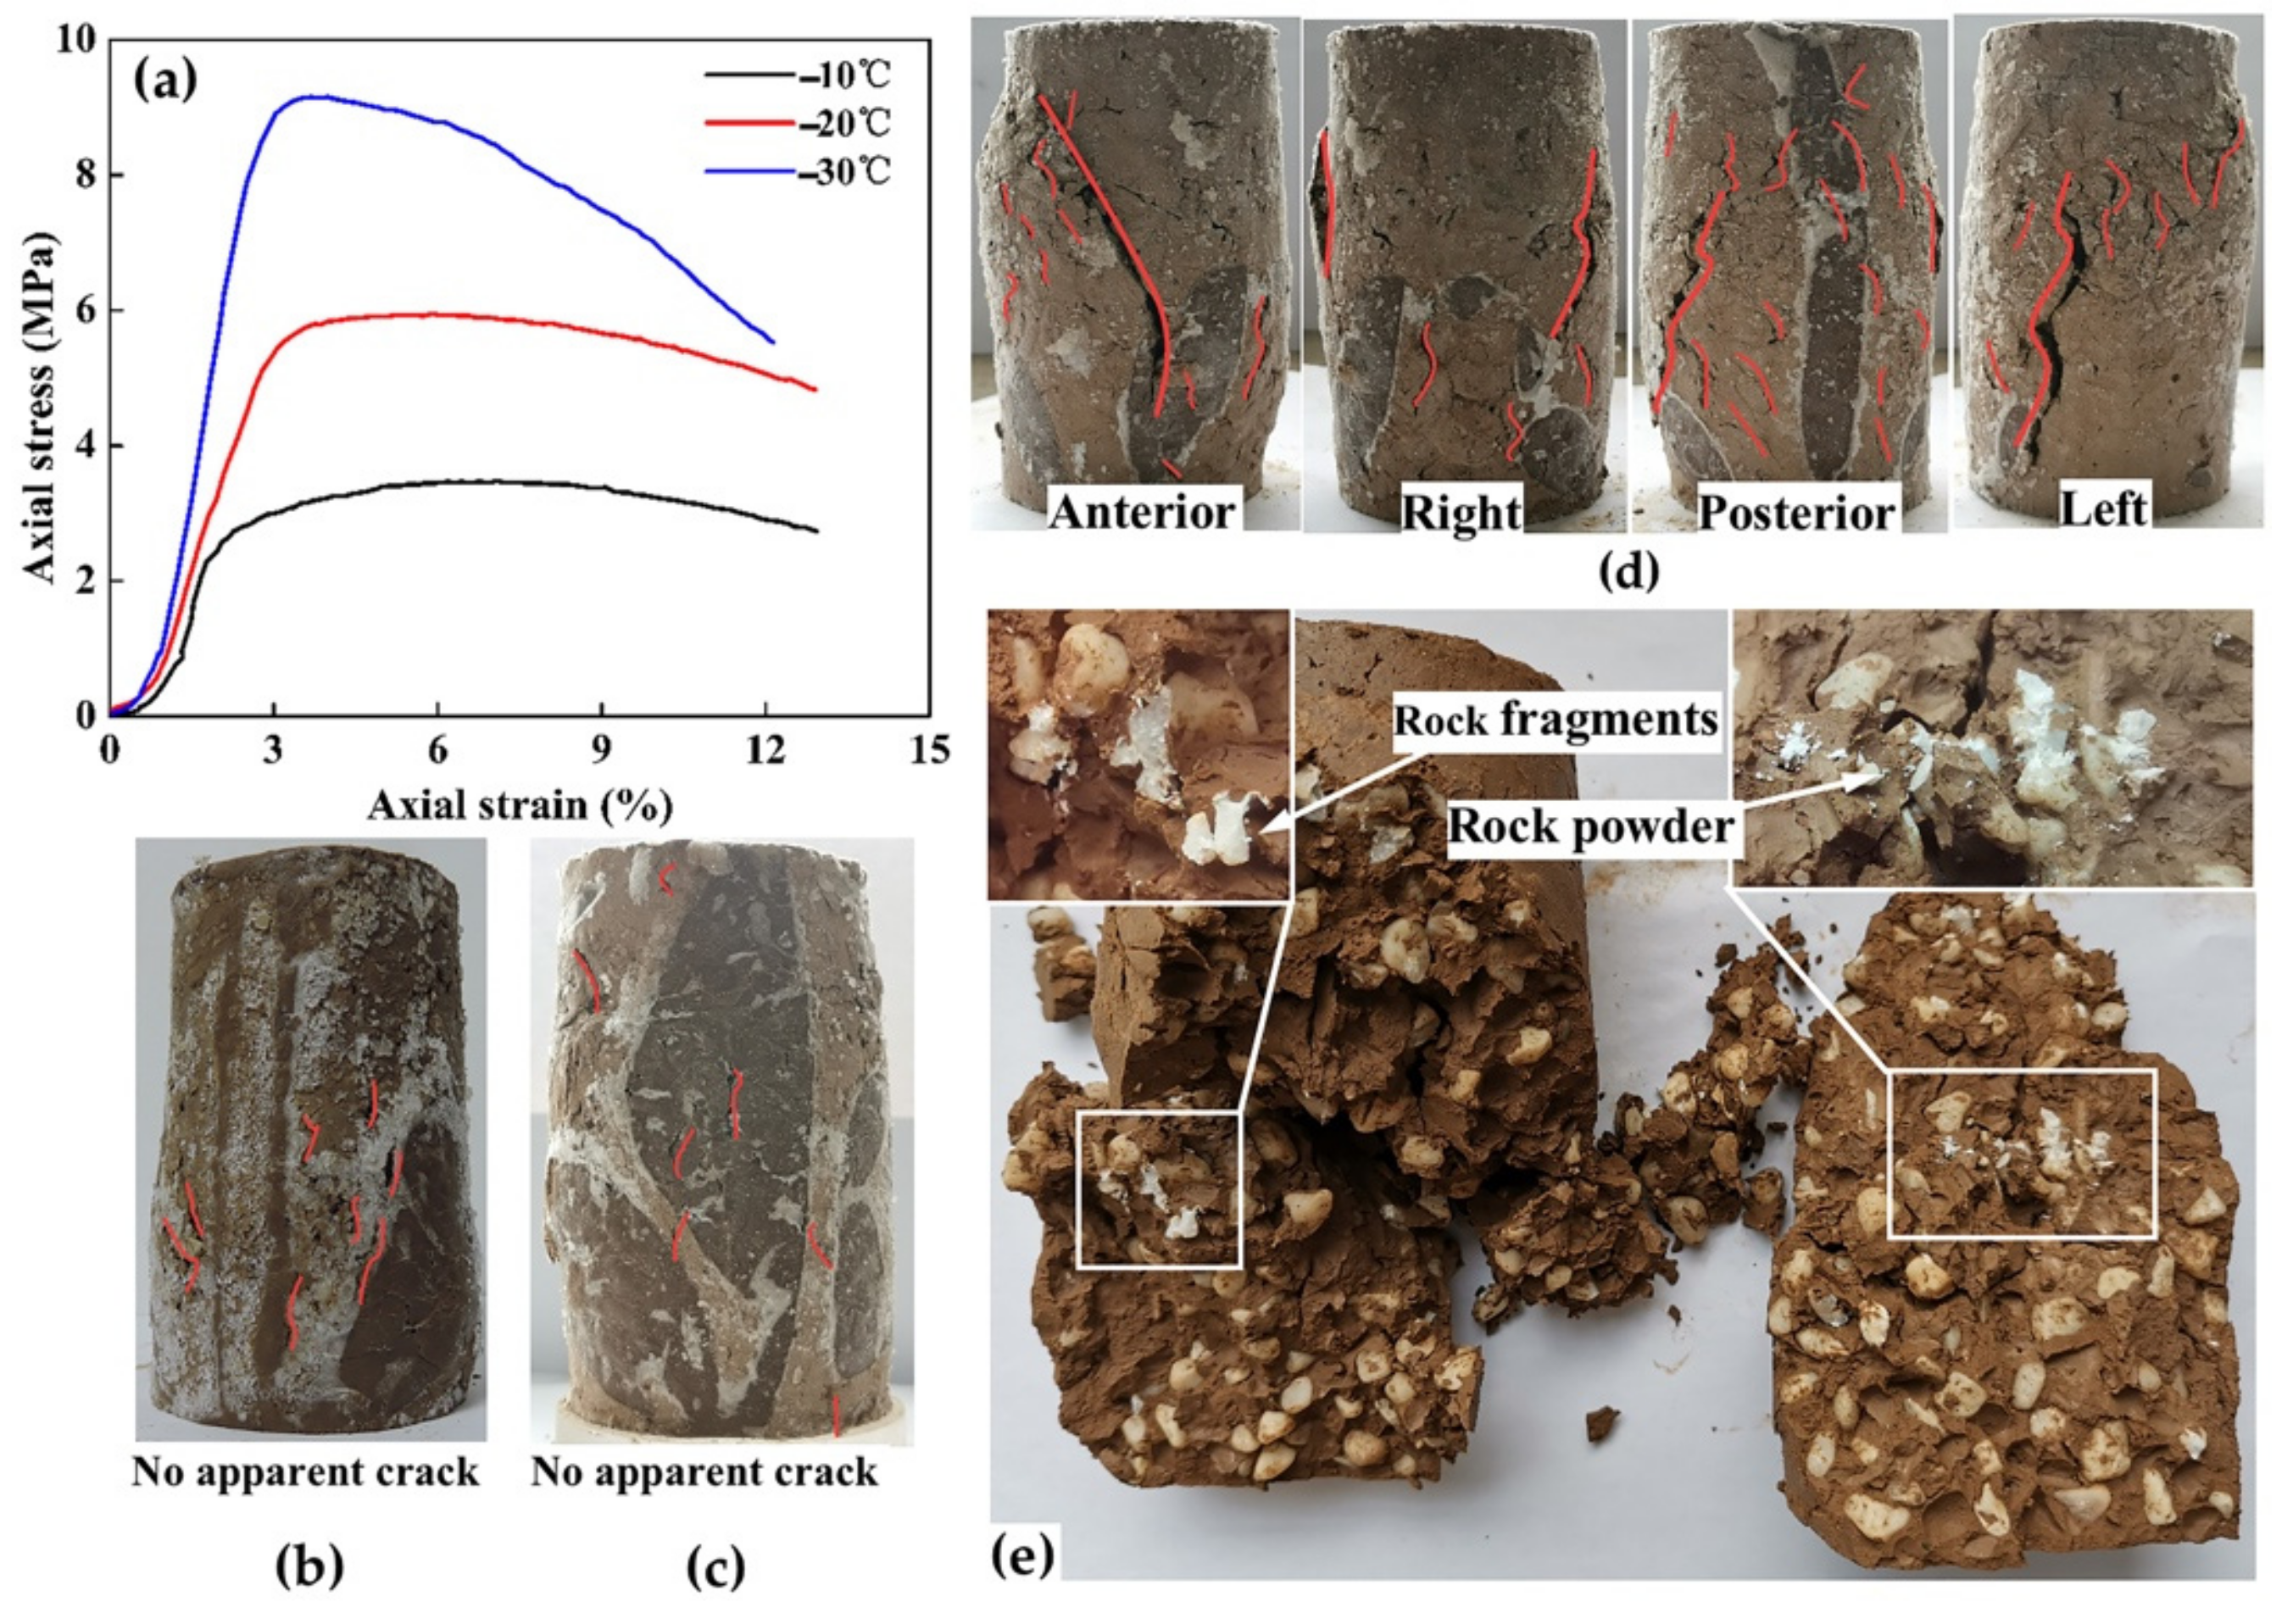
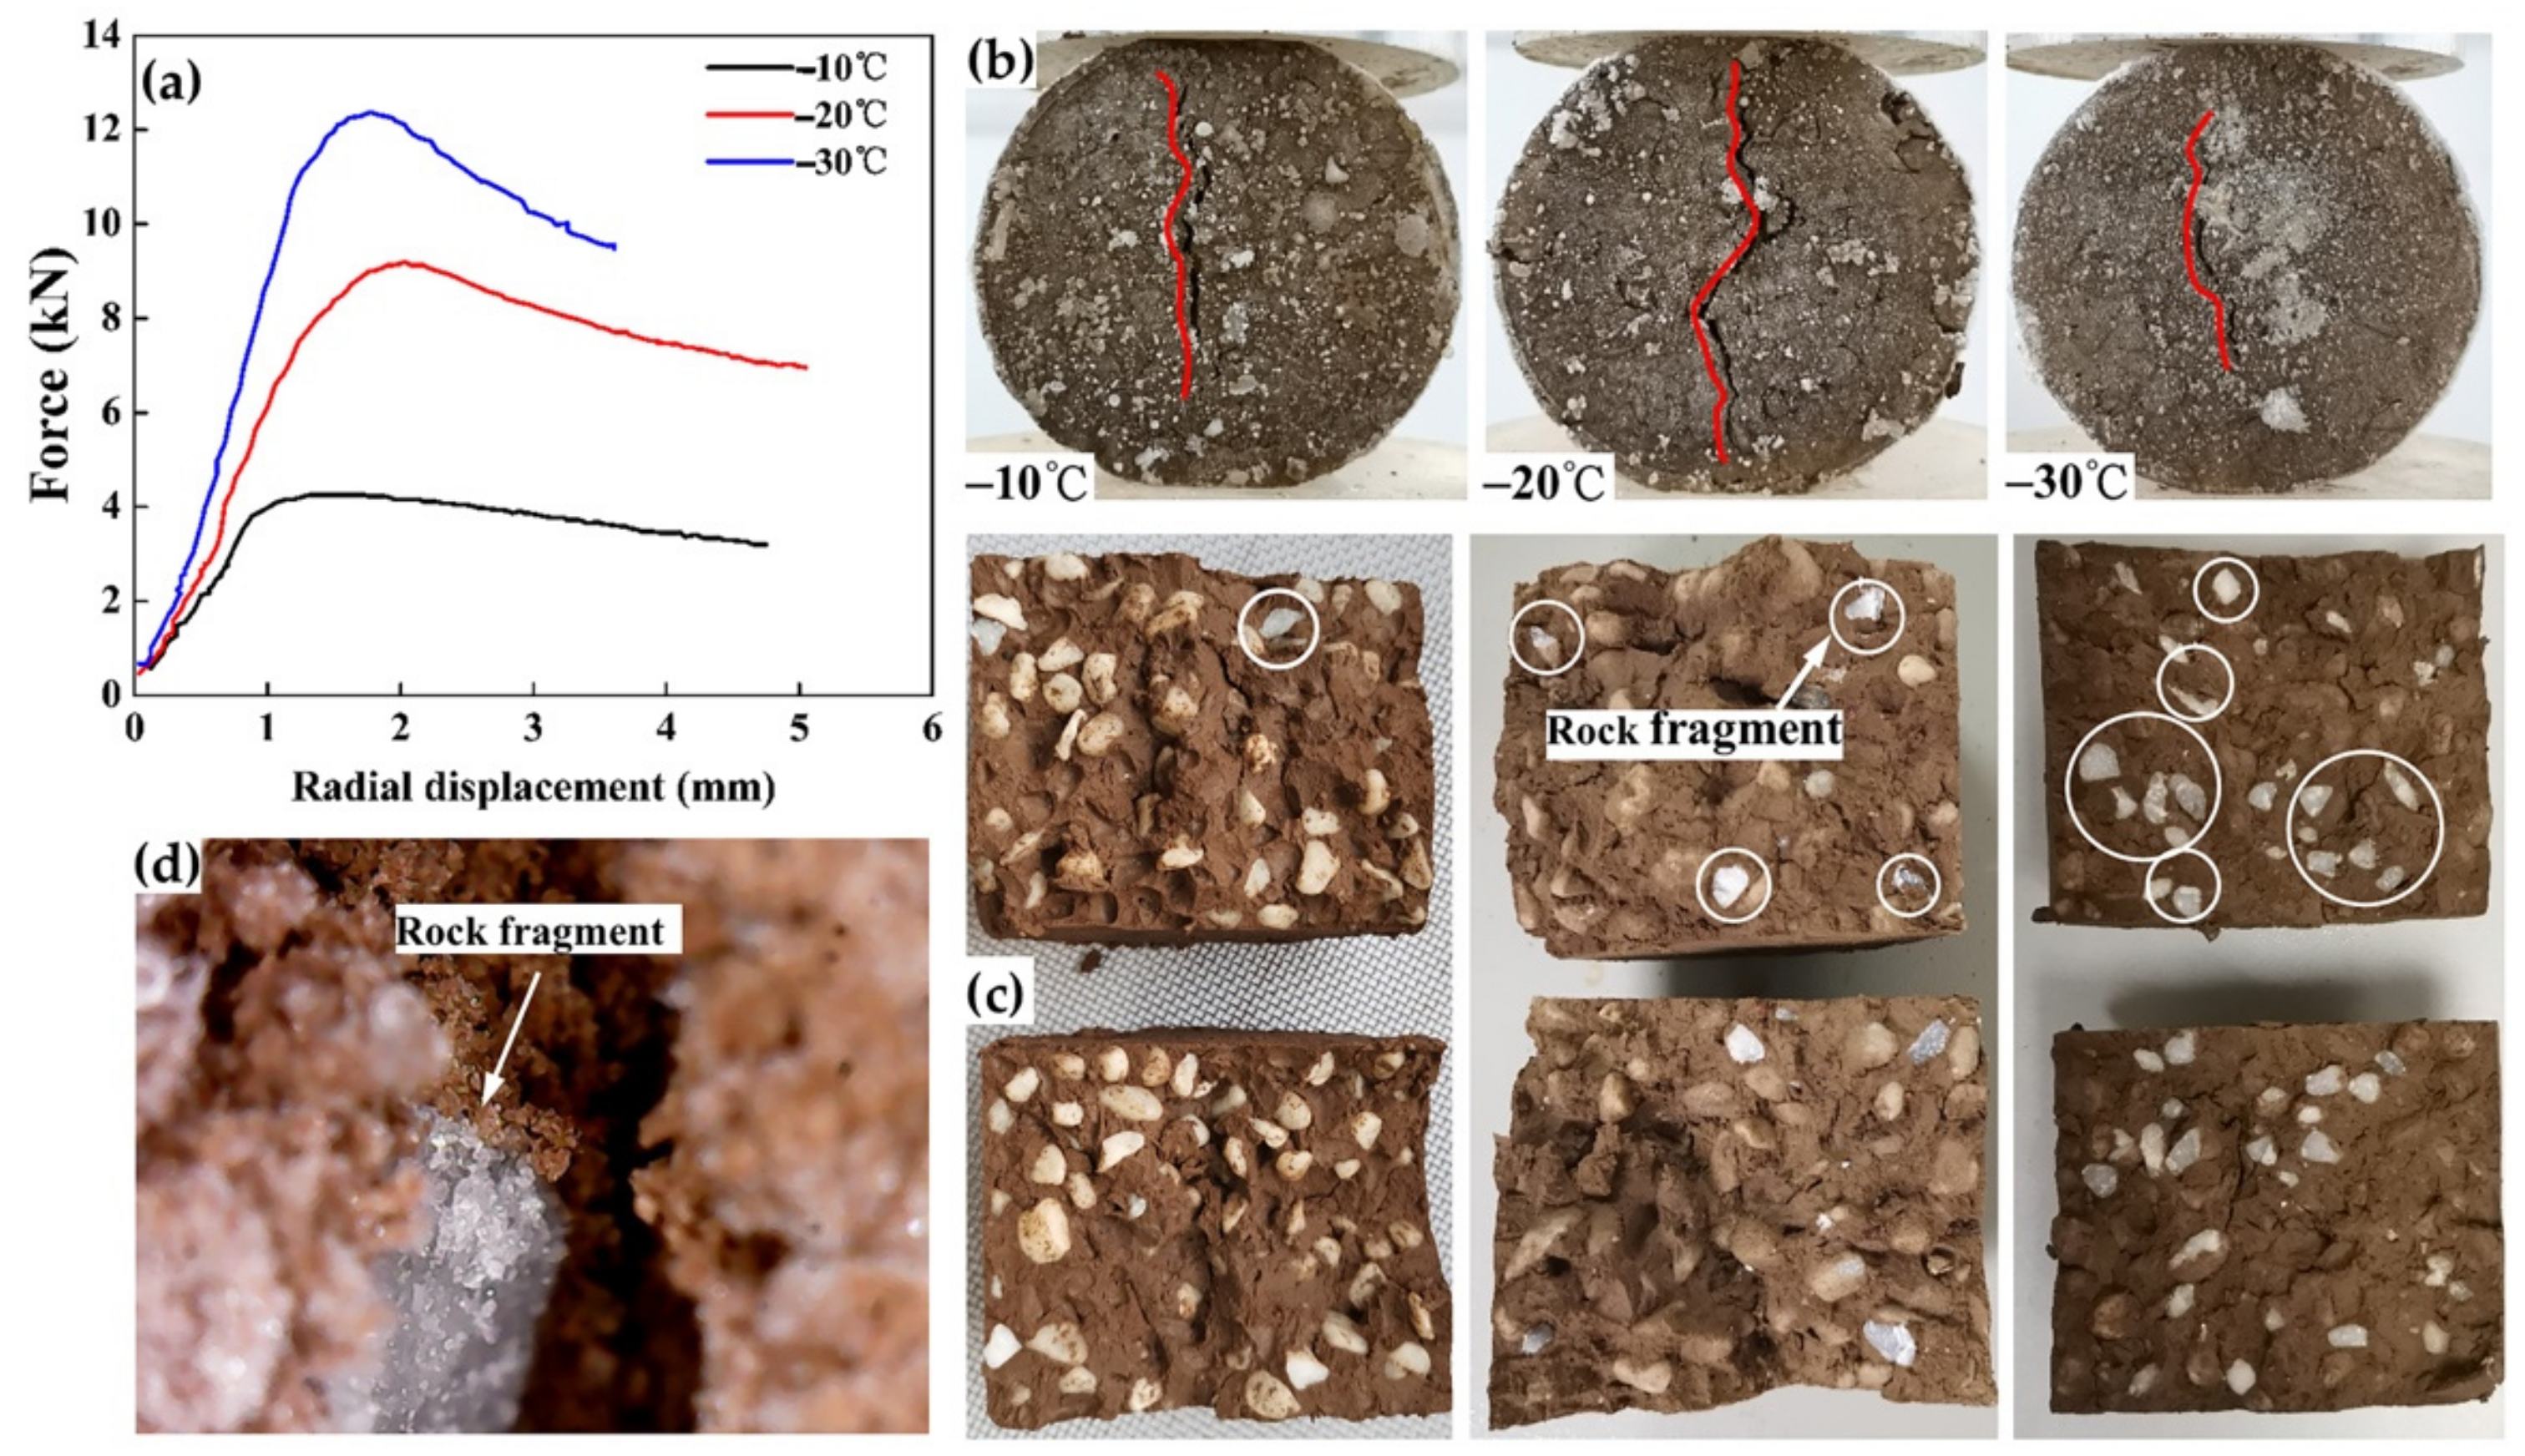
3.1. The Failure Pattern under Compression and Brazilian Testing

The temperature data show that relatively stable temperatures of −26 ± 1, −15 ± 1, and −7 ± 1 °C were maintained for 5~7 min during compression testing. Meanwhile, the peak stresses could be reached within 3–4 min. The Brazilian test samples were analyzed directly, and the peak loads could be reached within 2–3 min. For the current work, it is sufficient to investigate the strength difference of FSRMs under different temperatures.
The typical stress–strain curves of FSRM samples under different frozen temperatures are plotted in Figure 5. Under uniaxial compression, the stress–strain curves followed a similar pattern. At the beginning stage of the loading, all the curves had a transient concave upward section. Subsequently, all samples exhibited an elastic behavior wherein stress was linearly proportional to strain. After the yielding stress was reached for the sample with a frozen temperature of −30 °C, the stress showed a sharp increase to the peak stress strength point and decreased rapidly; however, for the samples with frozen temperatures of −10 °C and −20 °C, the stress data showed a yielding plateau. The stress slowly increased to the peak point, then decreased gradually. The samples with different frozen temperatures showed different failure modes. For the samples with frozen temperatures of −10 and−20 °C (Figure 5b,c), no obvious penetrating cracks were observed, even when the strain reached 12%. The bulging deformation and short split fracture parallel to the compression axis were the main failure modes at the stress post-peak stage. For the sample with a frozen temperature of −30 °C (Figure 5d), the obvious inclined shear cracks and axial tension cracks were observed at the stress post-peak stage. The samples exhibited greater shear failure, and the bulging deformation was not relatively obvious. Within the local area of the shear cracks, small amounts of rock fragments were observed, and rock powder was mainly distributed around the rock fragments. This implies that the shear dislocation extrusion damage of interlocking angular rock blocks was the main block destruction mechanism. On the contrary, all the ice–rock mixture samples showed obvious axial cracks at the peak point, and the axial stress decreased rapidly after the peak strength point.
The loading curves and corresponding failure modes of the FSRM disk samples containing rough rock blocks under the Brazilian test are depicted in Figure 6. A tortuous failure surface adjacent to the loading surface, instead of a splitting fracture as in the homogeneous sample, was the main failure mode for FSRMs under Brazilian testing here. In addition, rock fragments could be observed in the central failure surface, and the number of rock fragments increased with a decreasing temperature. On the basis of the fracture surface morphology of rock blocks in Figure 6d, we found that rock block tensile damage was the main destruction mechanism. We could not see the obvious breakage of rock blocks in the ice–rock mixture samples and FSRM samples containing smooth rock blocks. This indicates that the tensile strength of the soil–rock interface in FSRM containing rough rock block was larger than those of the ice–rock interface and soil–rock interface containing smooth rock blocks.

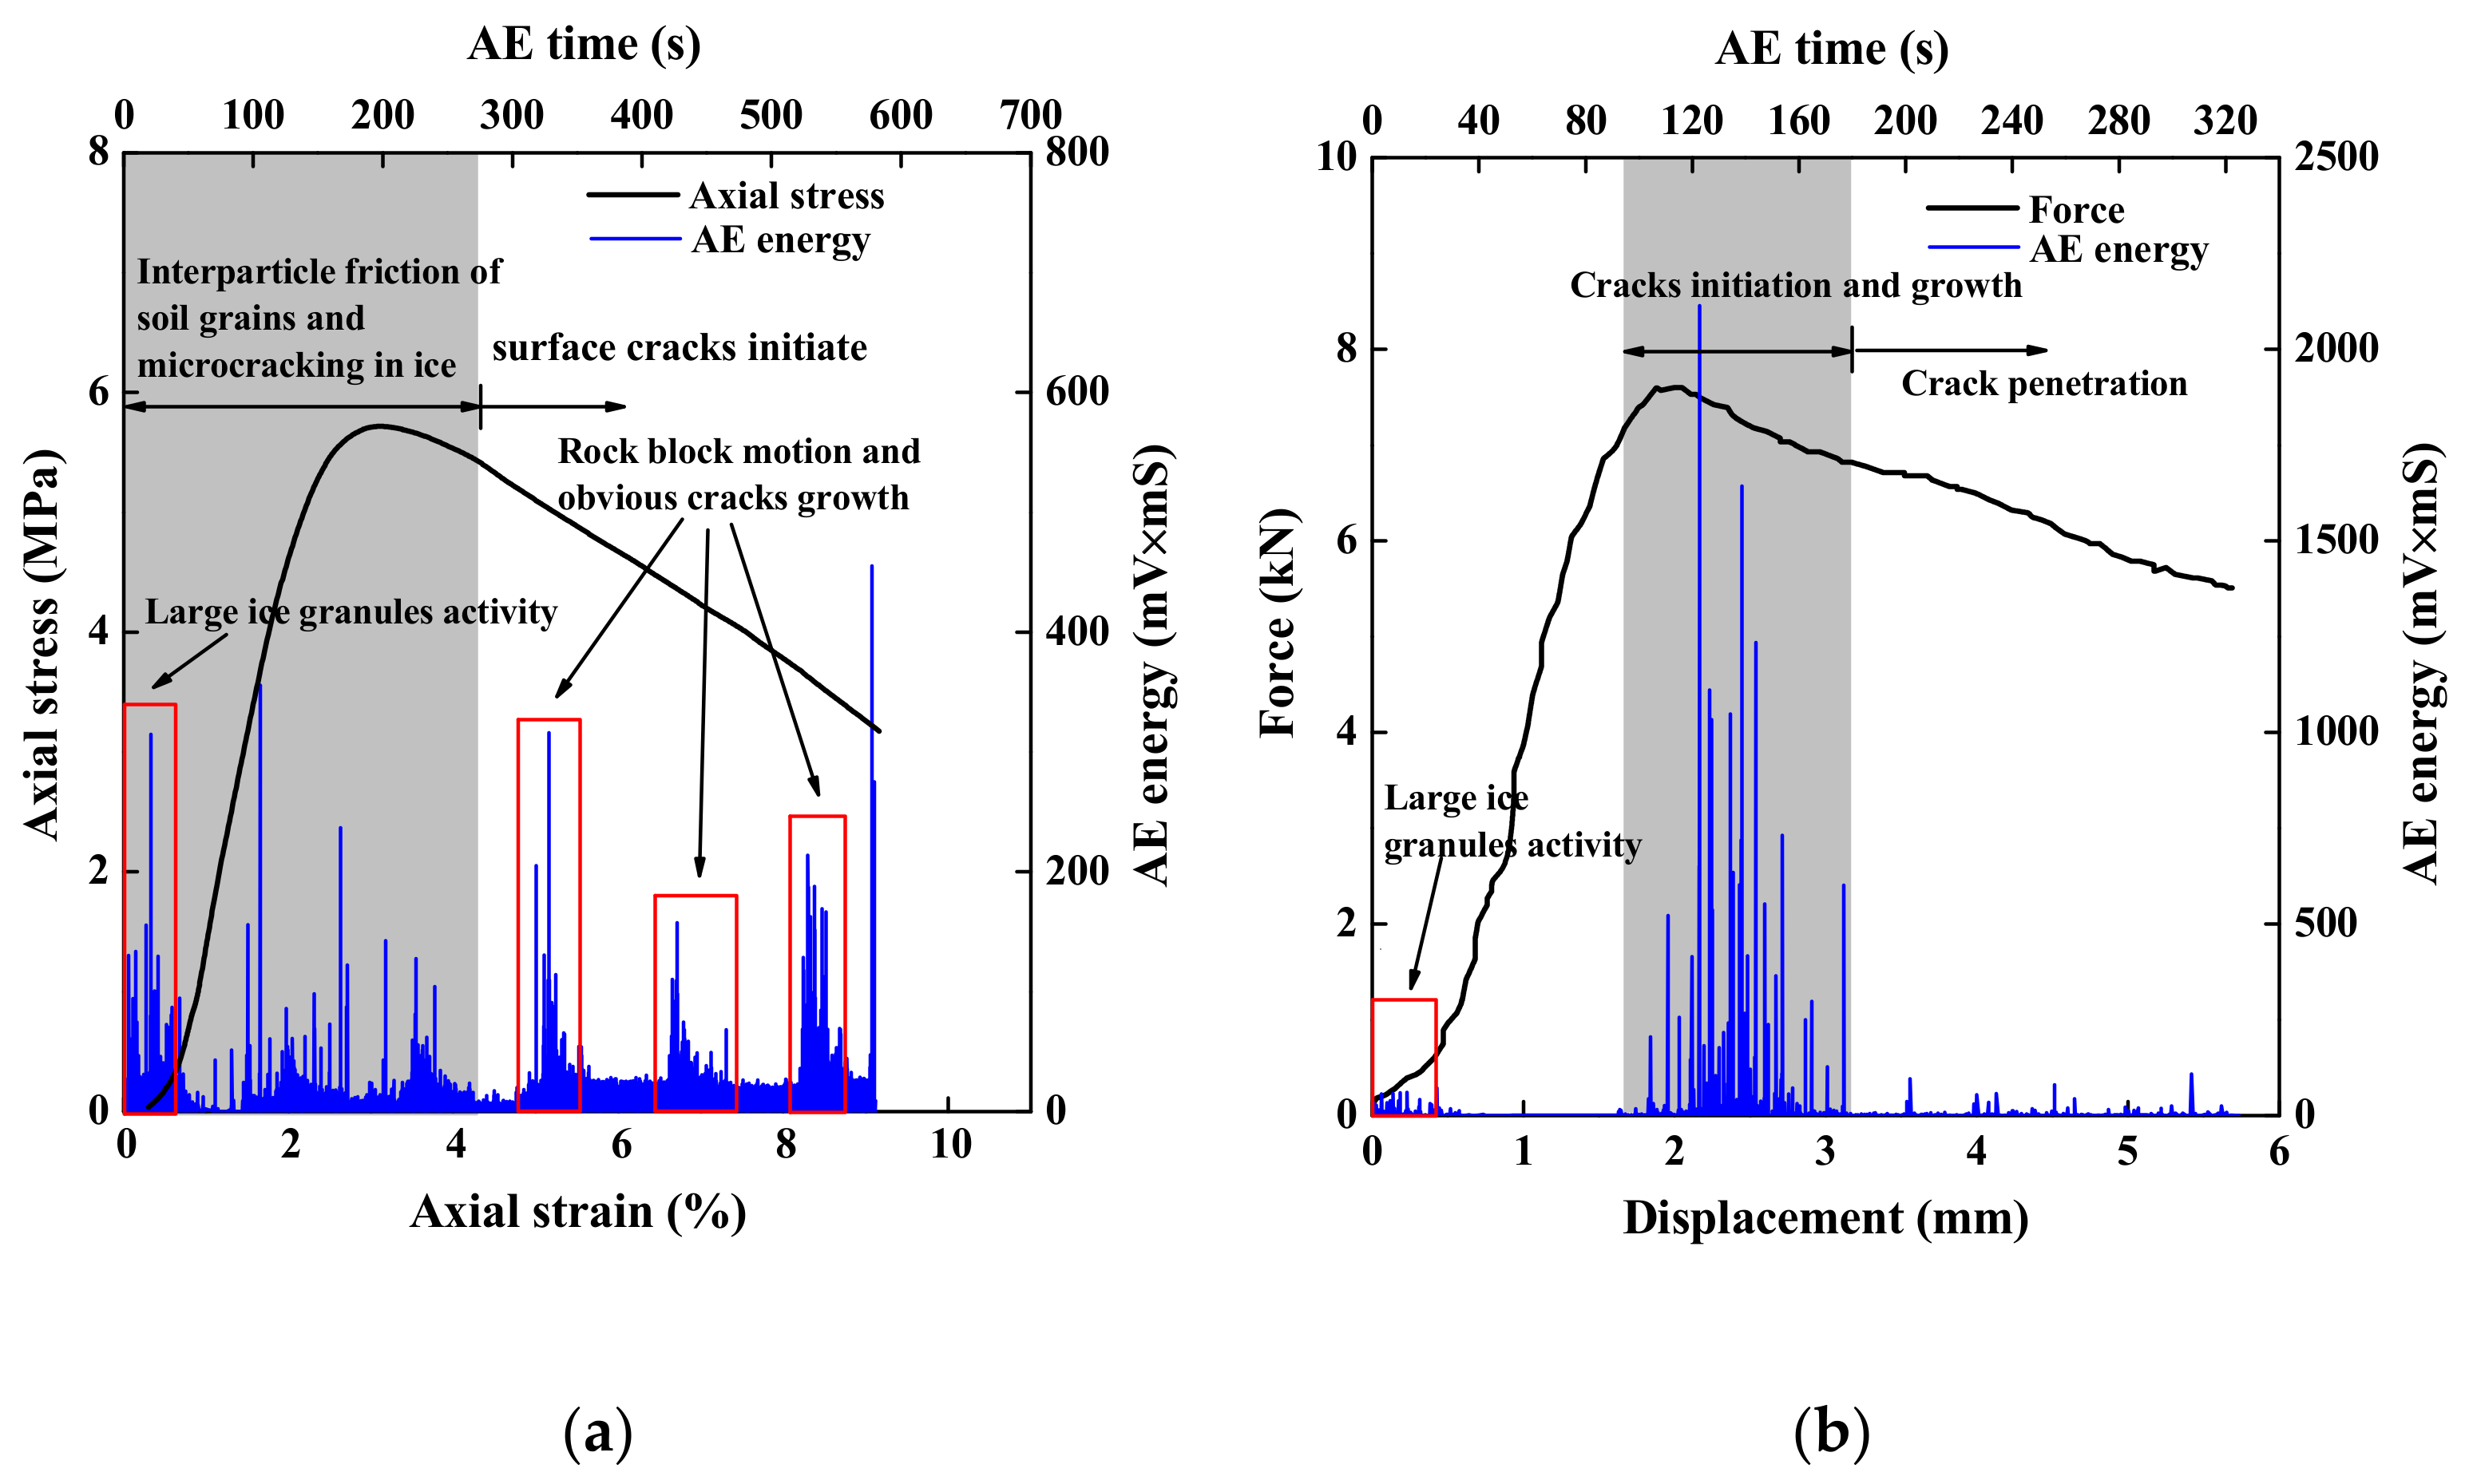
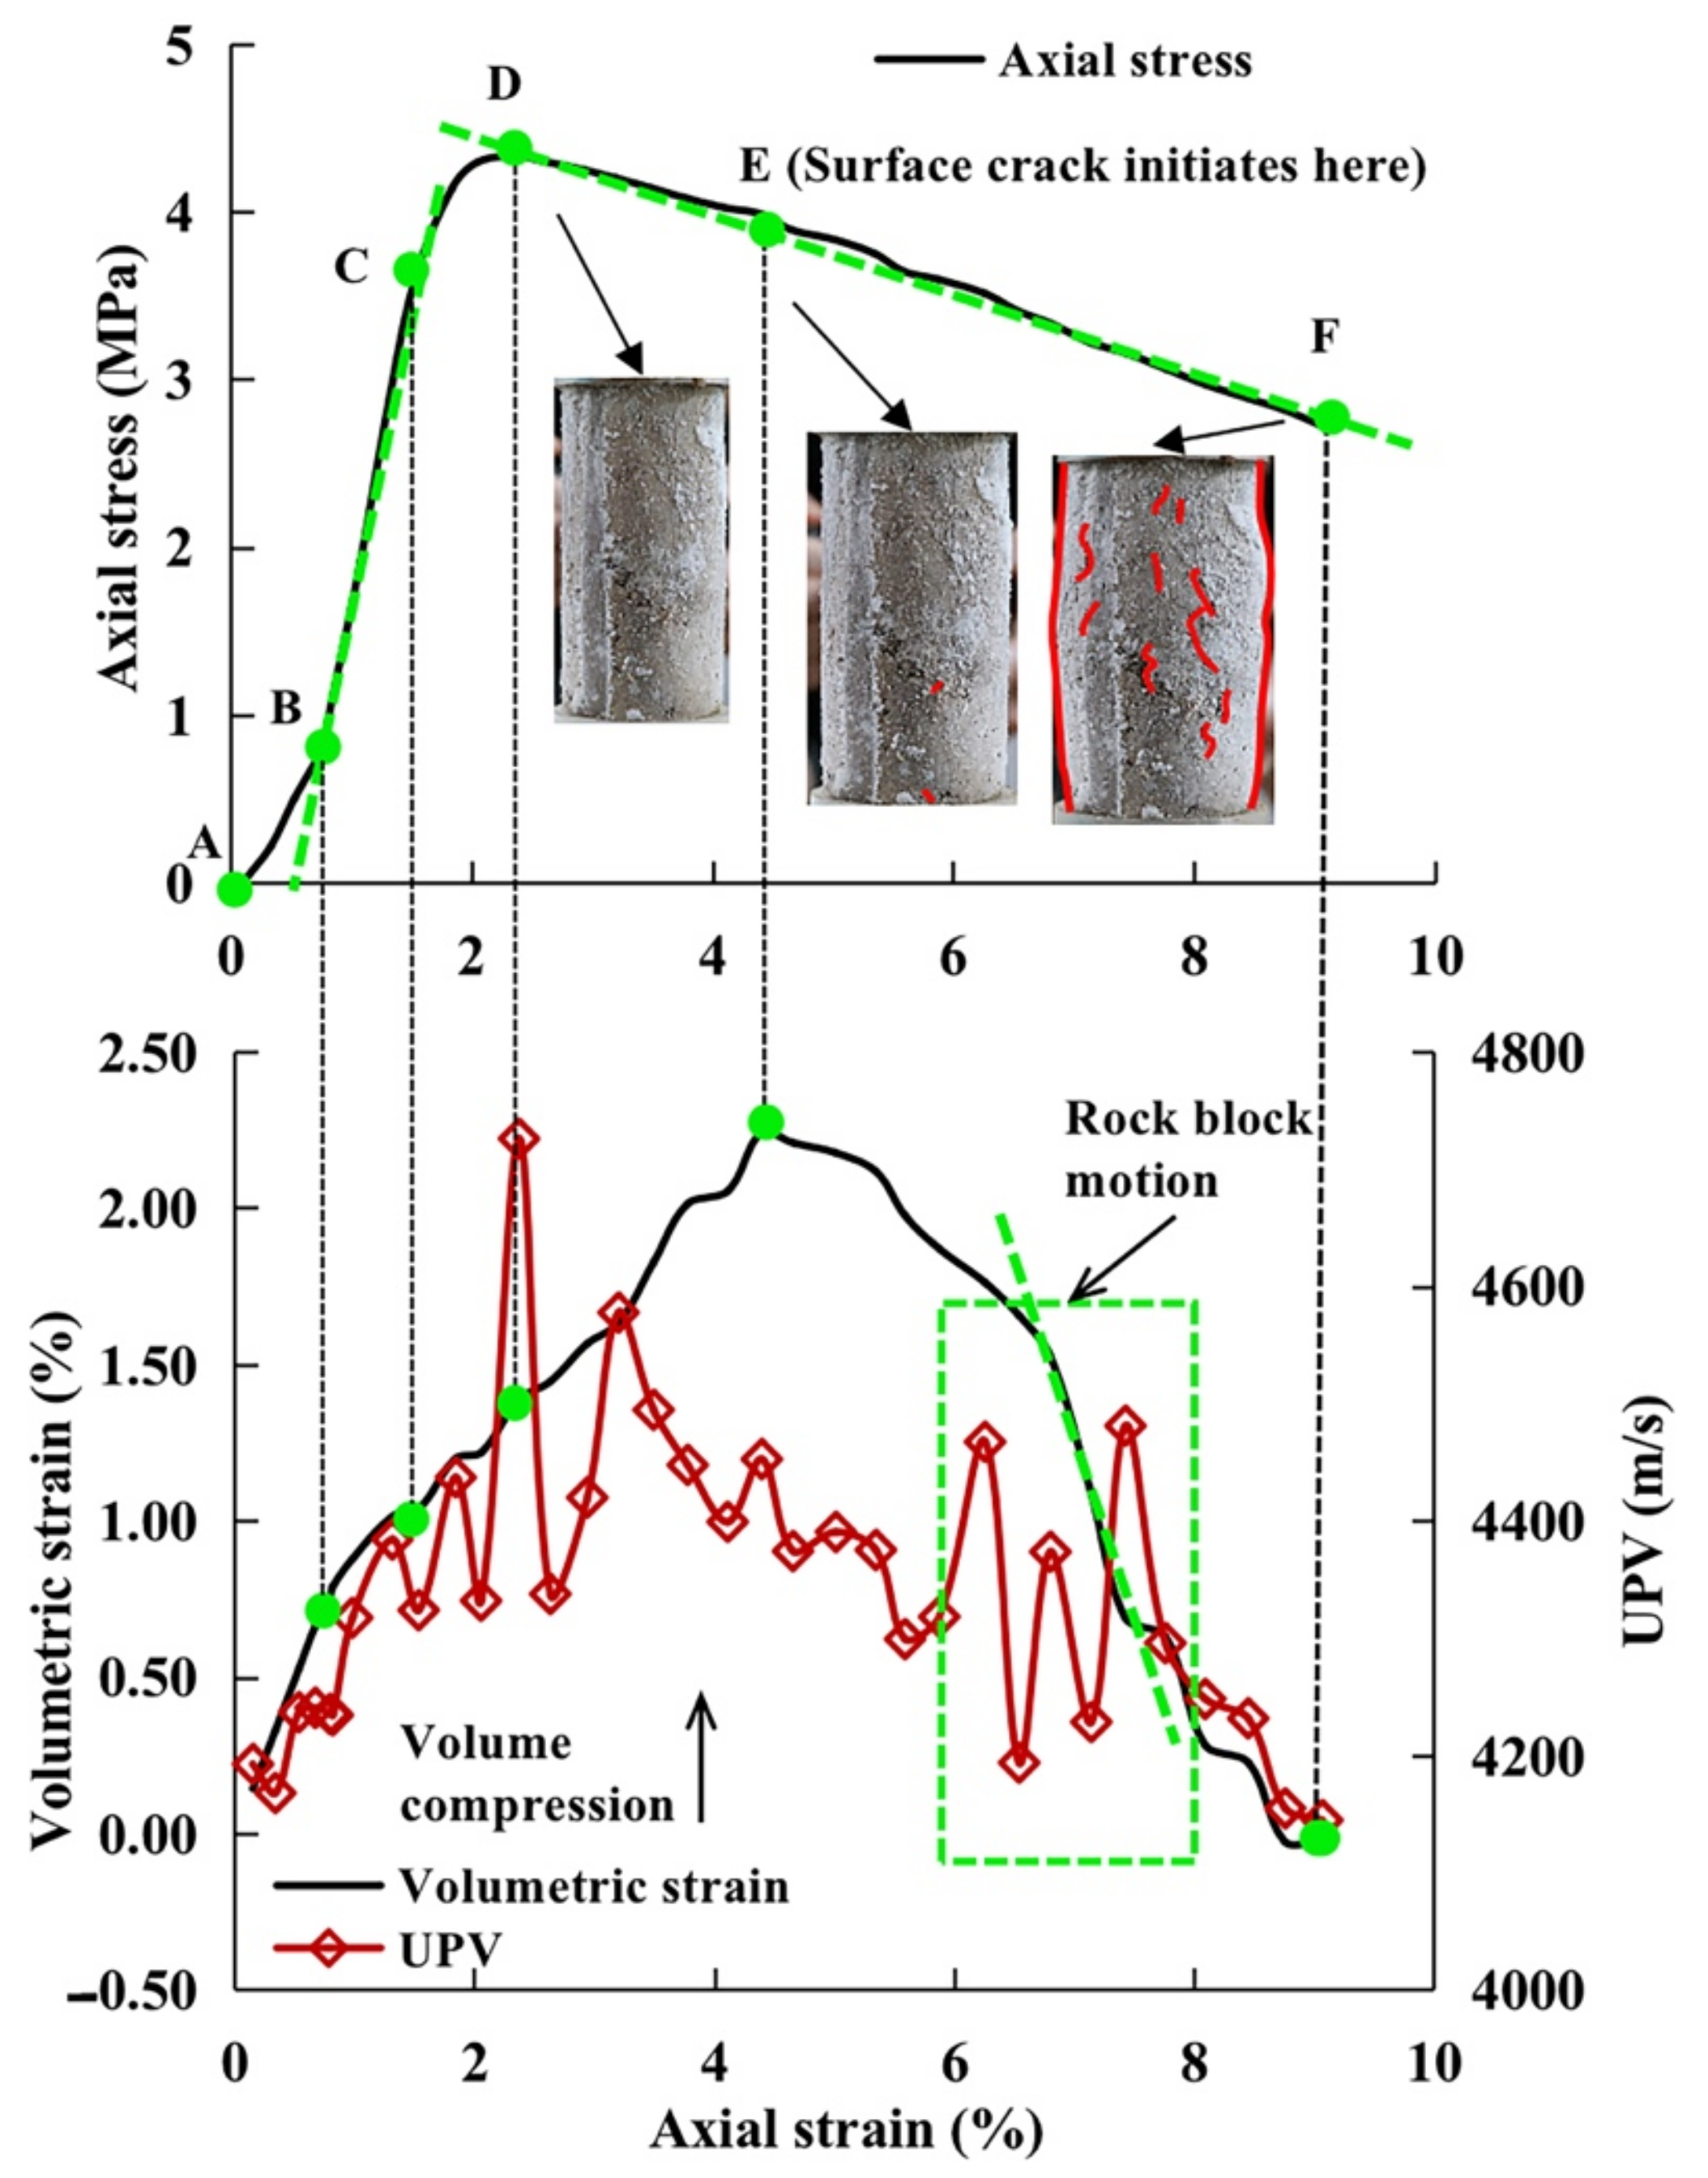
3.1.1. The Acoustic Emission Characteristics of Frozen SRM Samples

The AE energy signals and stress–strain curves for the compression and Brazilian tests are depicted in Figure 7. As can be seen, the AE energy curves of the two types of tests were obviously different in the post-peak stage. The AE time–energy curve showed a unimodal type under the Brazilian test; however, the AE time–energy curve showed a multimodal type under the uniaxial compression test, which is similar to the results of the report by Sair and Yuko [40,41]. At the beginning stage of loading, both of the AE activity types could be attributed to the compaction and the breakage of ice crystals during minor stress condition [41]. In the linear elastic stage of the loading curve, only a few acoustic emission signals with low amplitudes could be detected. In the pre-peak region, in which the curves showed an apparent non-linear deformation, both evolutions of AE signals showed a similar response, where the AE signals increased with the increase of the axial stress or the vertical force. Subsequently, in the post-peak stage, the AE signal sharply decreased to a relatively small value under the Brazilian test. Nevertheless, the apparent AE signal was observed in the post-peak stage under the uniaxial compression test and the amplitude was obvious.
Acoustic emission signals effectively reflect the mechanical deformation of geomaterials [42,43,44]. According to the comparison of the mechanical and acoustic responses of the FSRMs subjected to the uniaxial compression and Brazilian tests, the differences in the AE signal responses can be attributed to the motion and friction of internal components, especially the rock blocks during loading. For the Brazilian test, the samples mainly experienced radial tensile stress, especially in the central surface. The separation between the rock and soil matrix and the cracks propagated into the soil matrix mainly occurred in the central surface of the cylindrical disk, which triggered obvious acoustic emission. The obvious acoustic emission activity stopped when the crack had fully propagated throughout the disk sample. Nevertheless, the whole acoustic emission activity pattern was inconclusive under uniaxial loading. Being a mixture composed of soil particles, rock blocks, and ice granules with widely contrasting physical properties, from the inspection of the samples after uniaxial loading testing, obvious surface cracks typically occurred in the post-peak stage. It may be inferred that the movement of rock blocks was relatively active in the post-peak stage, thereby triggering evident AE signals. In the pre-peak stage, the creeping and friction of soil particles and ice granules could be assumed rather than the obvious movement of the rock blocks.

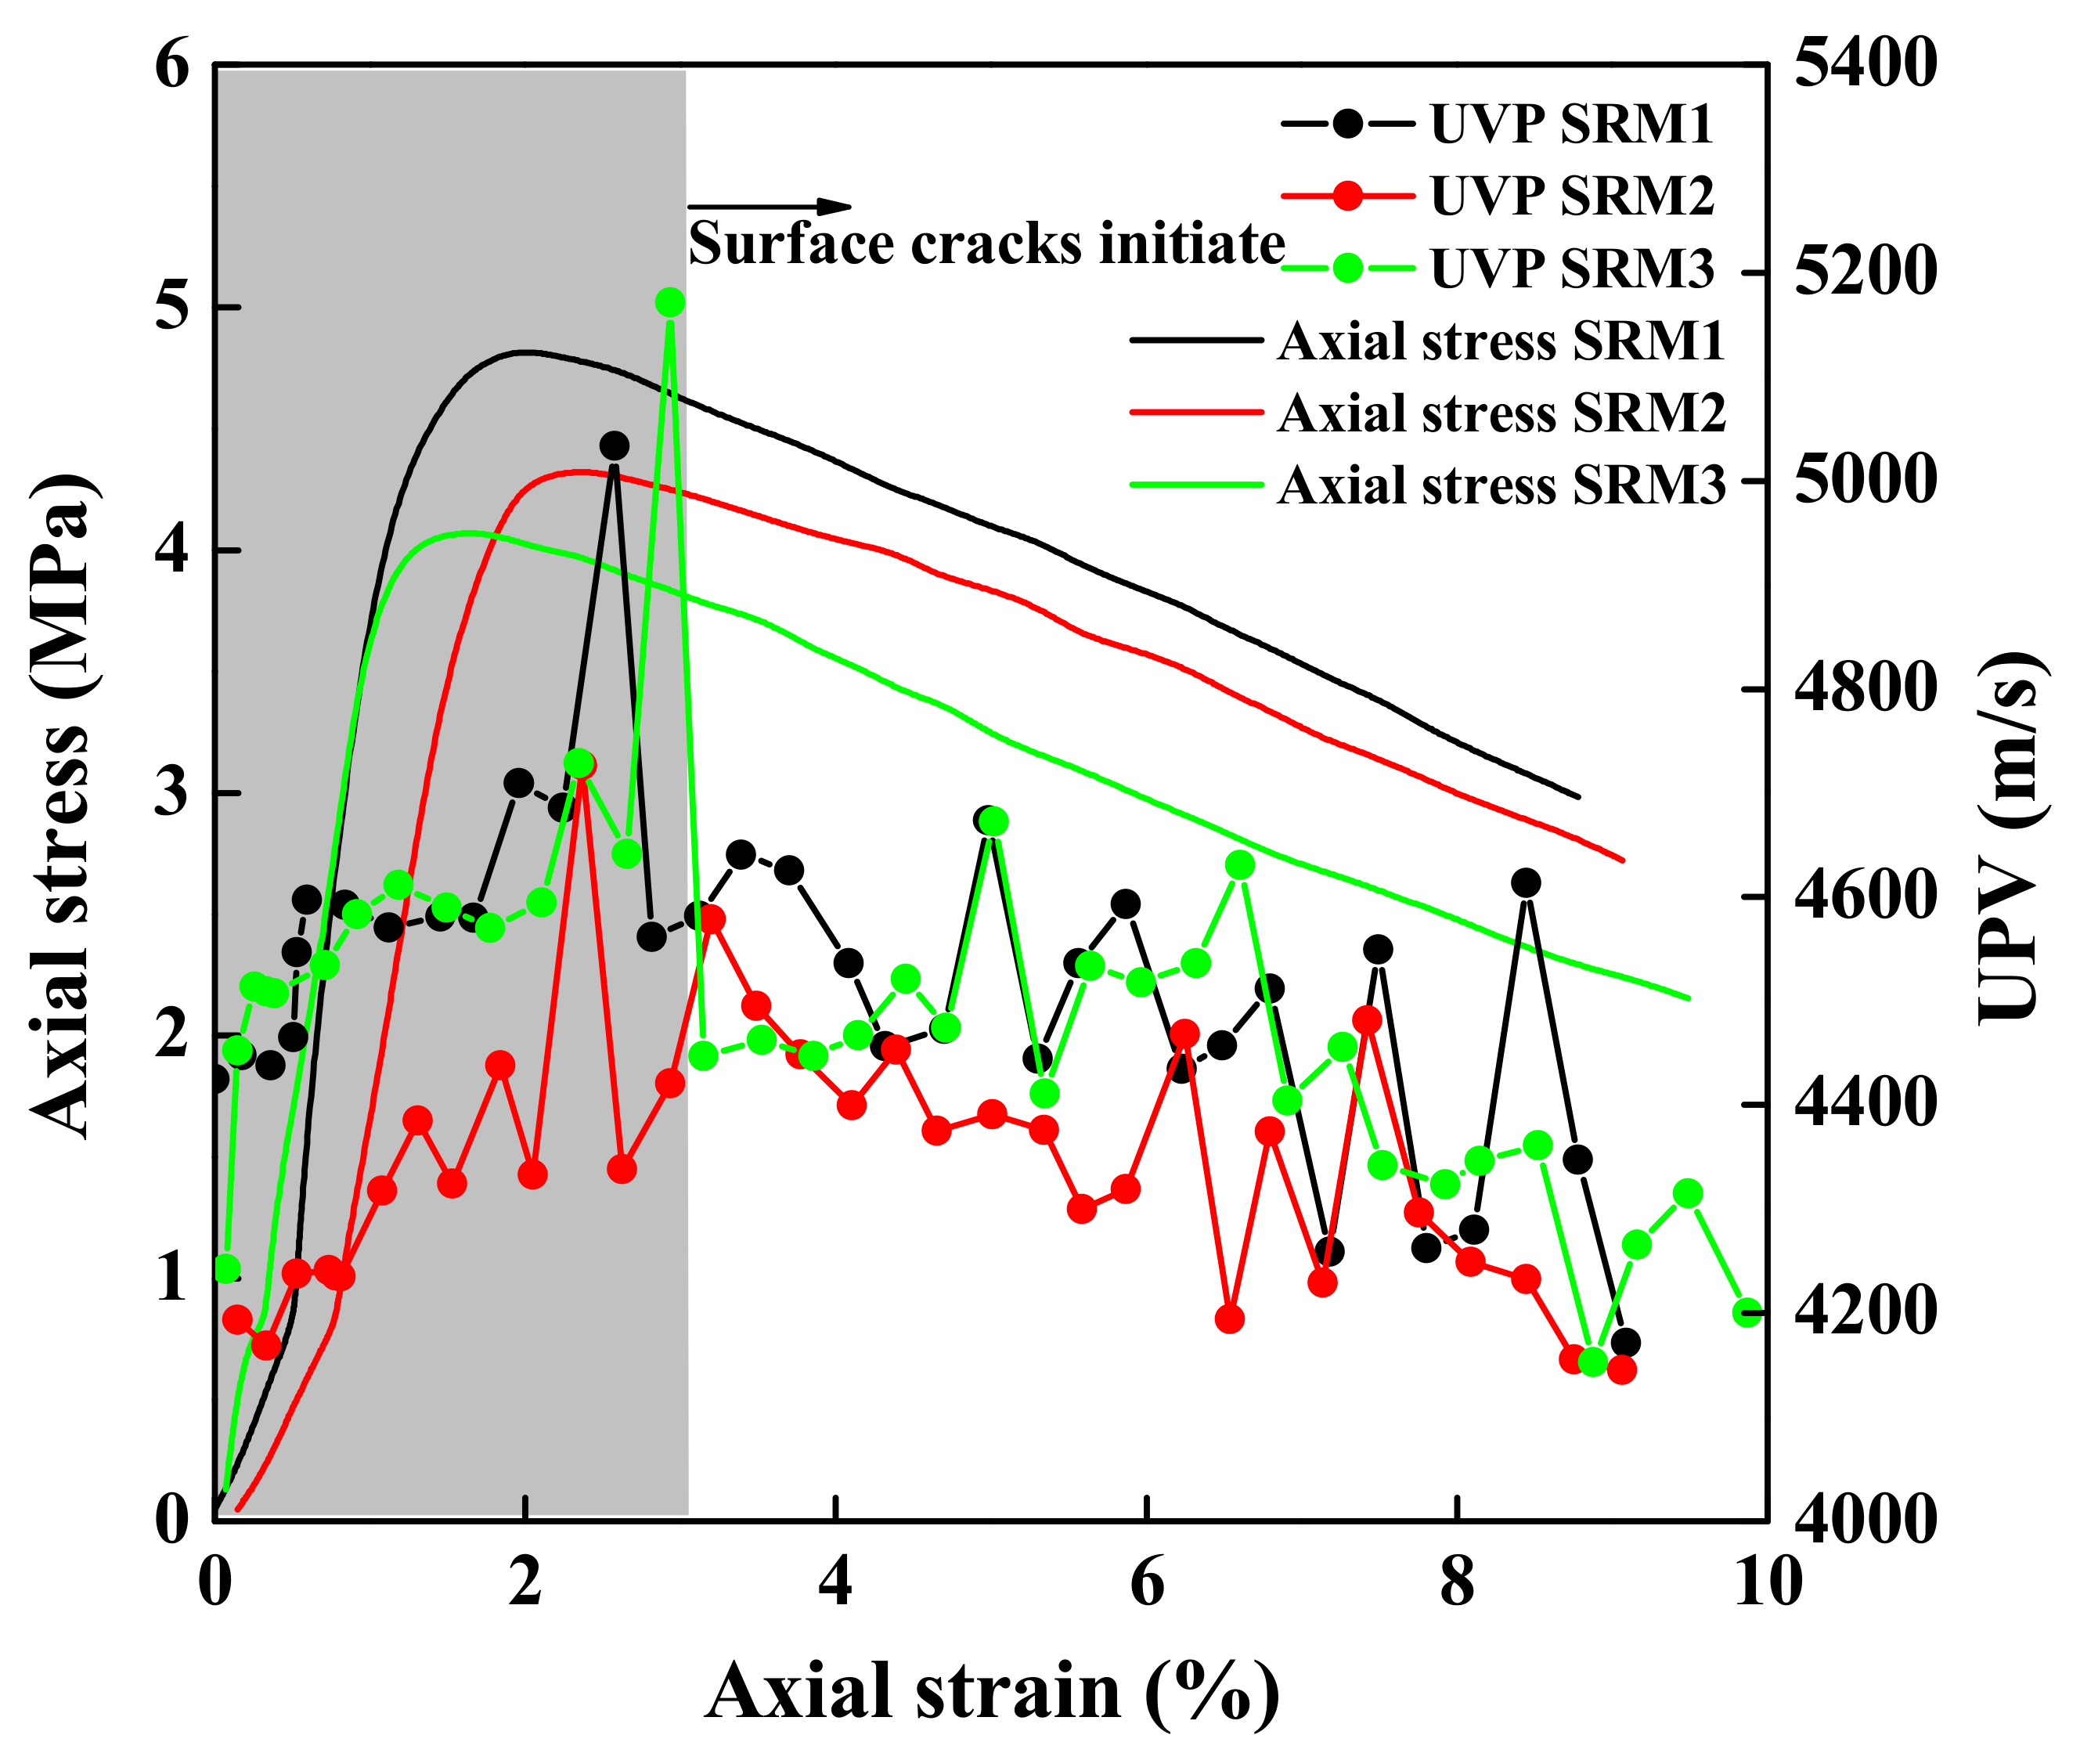
3.1.2. The Ultrasonic Plus Velocity Characteristics of FSRM

The stress–strain–UPV curves are shown in Figure 8. We observed that the UPV increased with increasing stress at the pre-peak stage and then presented a decreasing trend with the decrease of stress. In general, the UPV is associated with material properties and density. The UPV increases with an increasing density. In Figure 8, in the pre-peak stage, the increasing axial UPV indicates that the density increased. In the post-peak stage, with the growth of cracks in the sample, the UPV decreased. Nevertheless, the maximum of UPV appeared in the stress post-peak stage (as with initial surface crack), which indicates that the crack started to grow at the post-peak stage. Moreover, the UPV showed a trend of fluctuating downward. We further observed the macroscopic failure morphology by the naked eye during the loading process, where the short surface cracks initiated after the maximal UPV was recorded and the bulging deformation then occurred. It was inferred that the obvious motion of rock blocks occurred in the post-peak stage. The obvious fluctuation of the UPV could be attributed to the pre-existing cracks being closed and new cracks growing because of the movement of the rock block, especially inside frozen soil with an increasing temperature. In addition, Figure 9 shows the stress–strain curve, sample deformation in different stages, the UPV, and volumetric strain of the FRSMs at a freezing temperature of −20 °C. The stress–strain curve can be divided into five sections. Section AB is a microcrack closures stage. Section BC is an elastic deformation stage in which the ice crystals and particles resisted external loading. Section CD is the ice crystal particles creeping and melting stage, in which the ice crystal experienced pressure melting and the soil particles were further compressed. The UPV and axial stress had the maximum values at point D. In section DE, the frozen soil particles started to creep, and the microcracks can be seen by the naked eye at point E. Moreover, the volumetric strain reached a peak point at point E. In section EF, the obvious surface cracks and lateral expansion can be seen. The rotation and slippage of rock blocks occurred in this section. Figure 9 presents a rapid descent of volumetric strain corresponding to a significant fluctuation of UPV in the rectangle. This indicates that the internal rock blocks were apparently motivated and some pre-existing cracks were closed; however, at the same time, new cracks appeared. The results for the UPV analysis are consistent with the AE analysis in the section above.

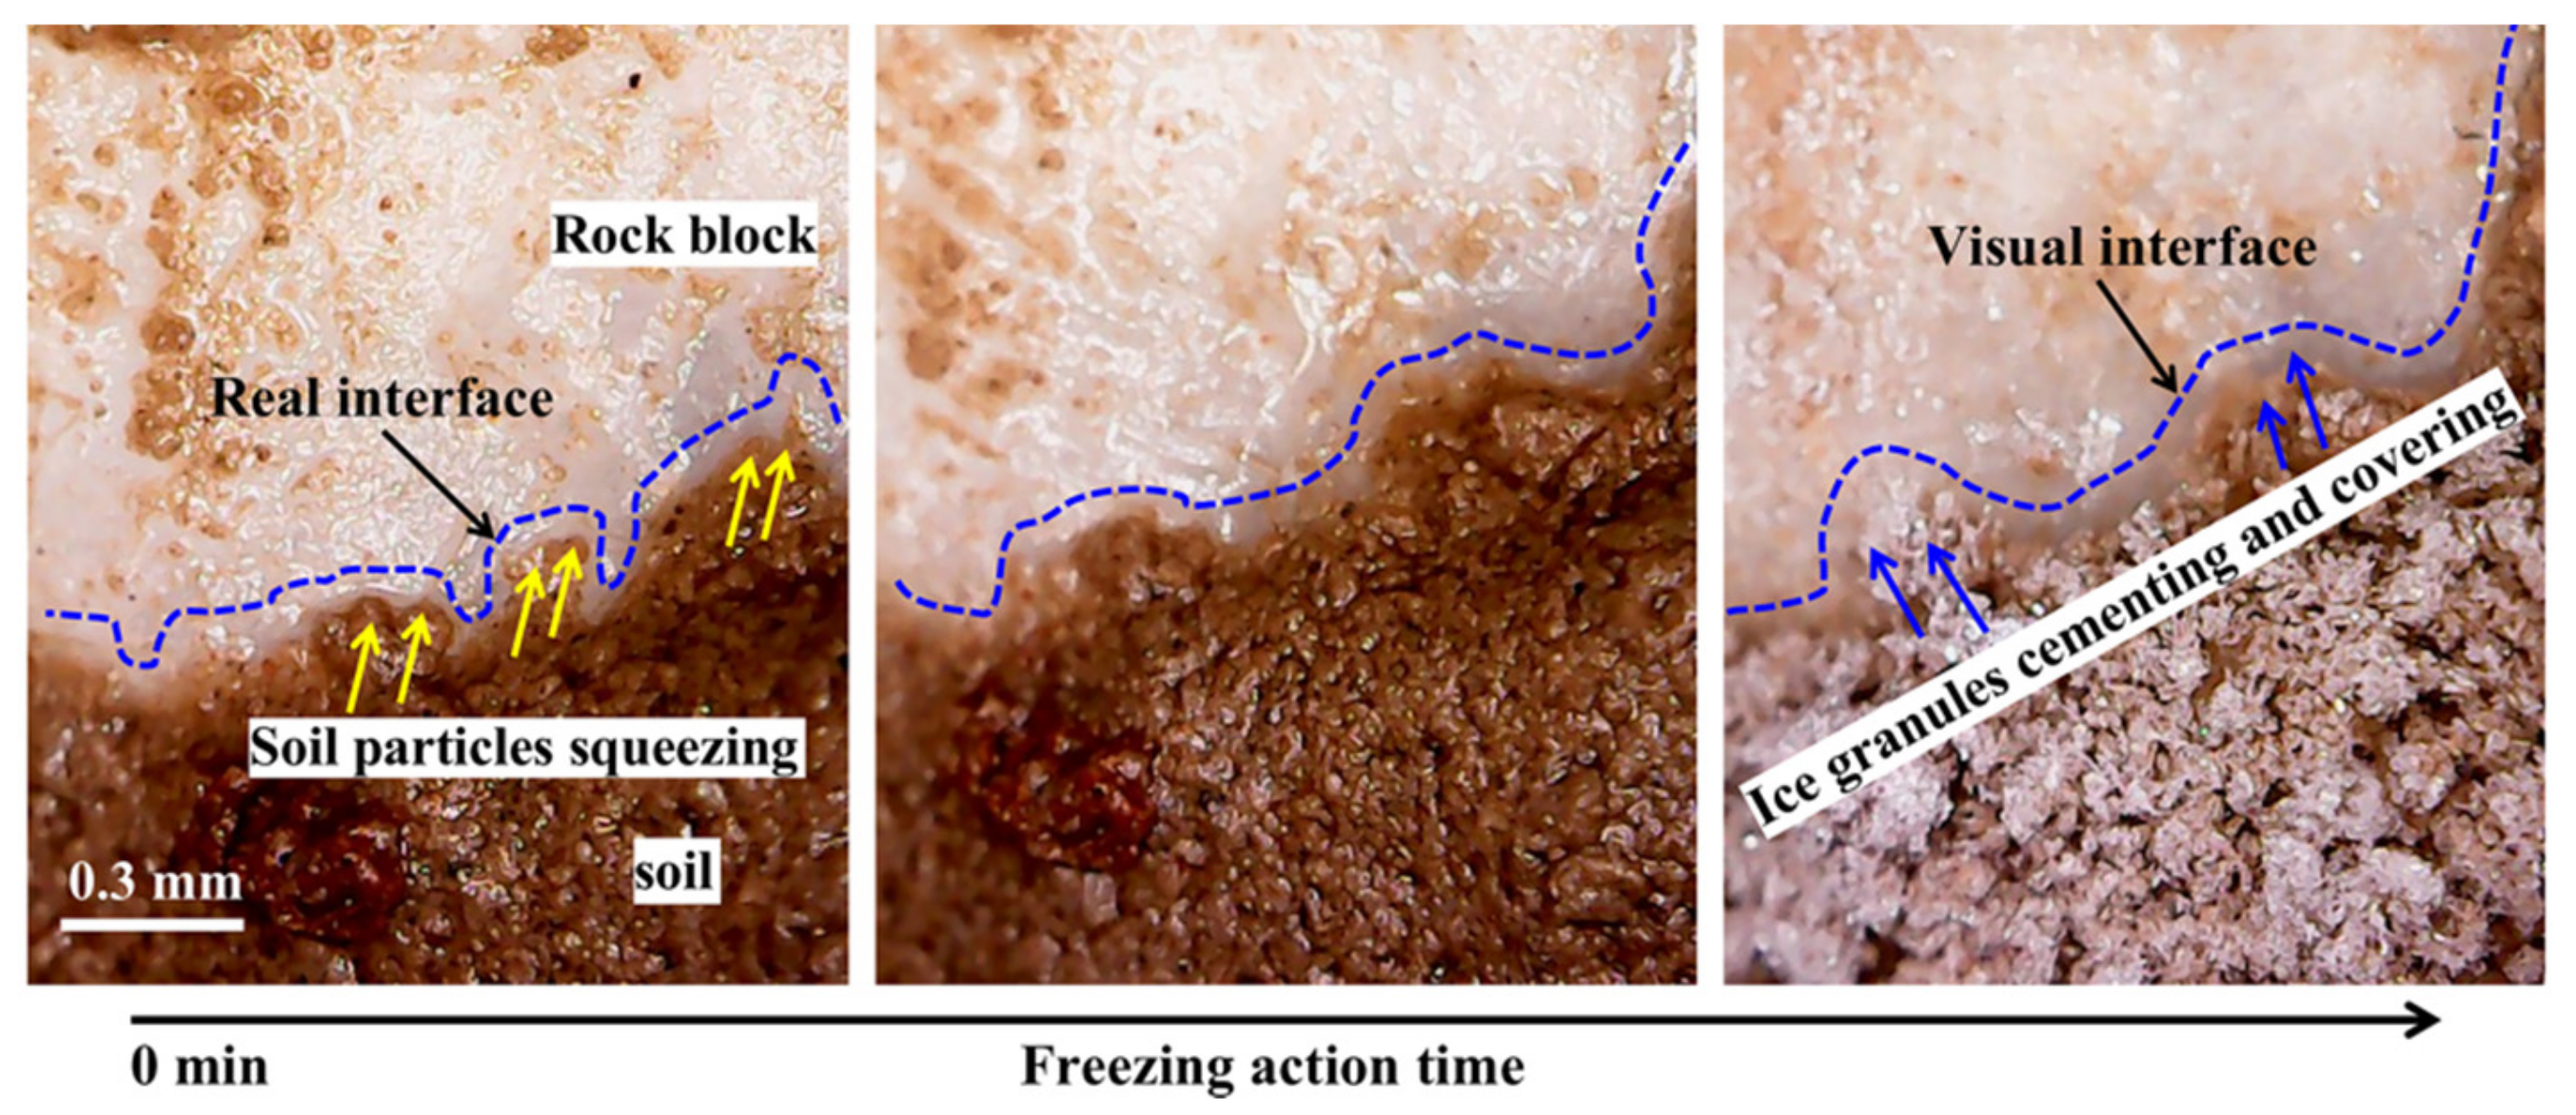
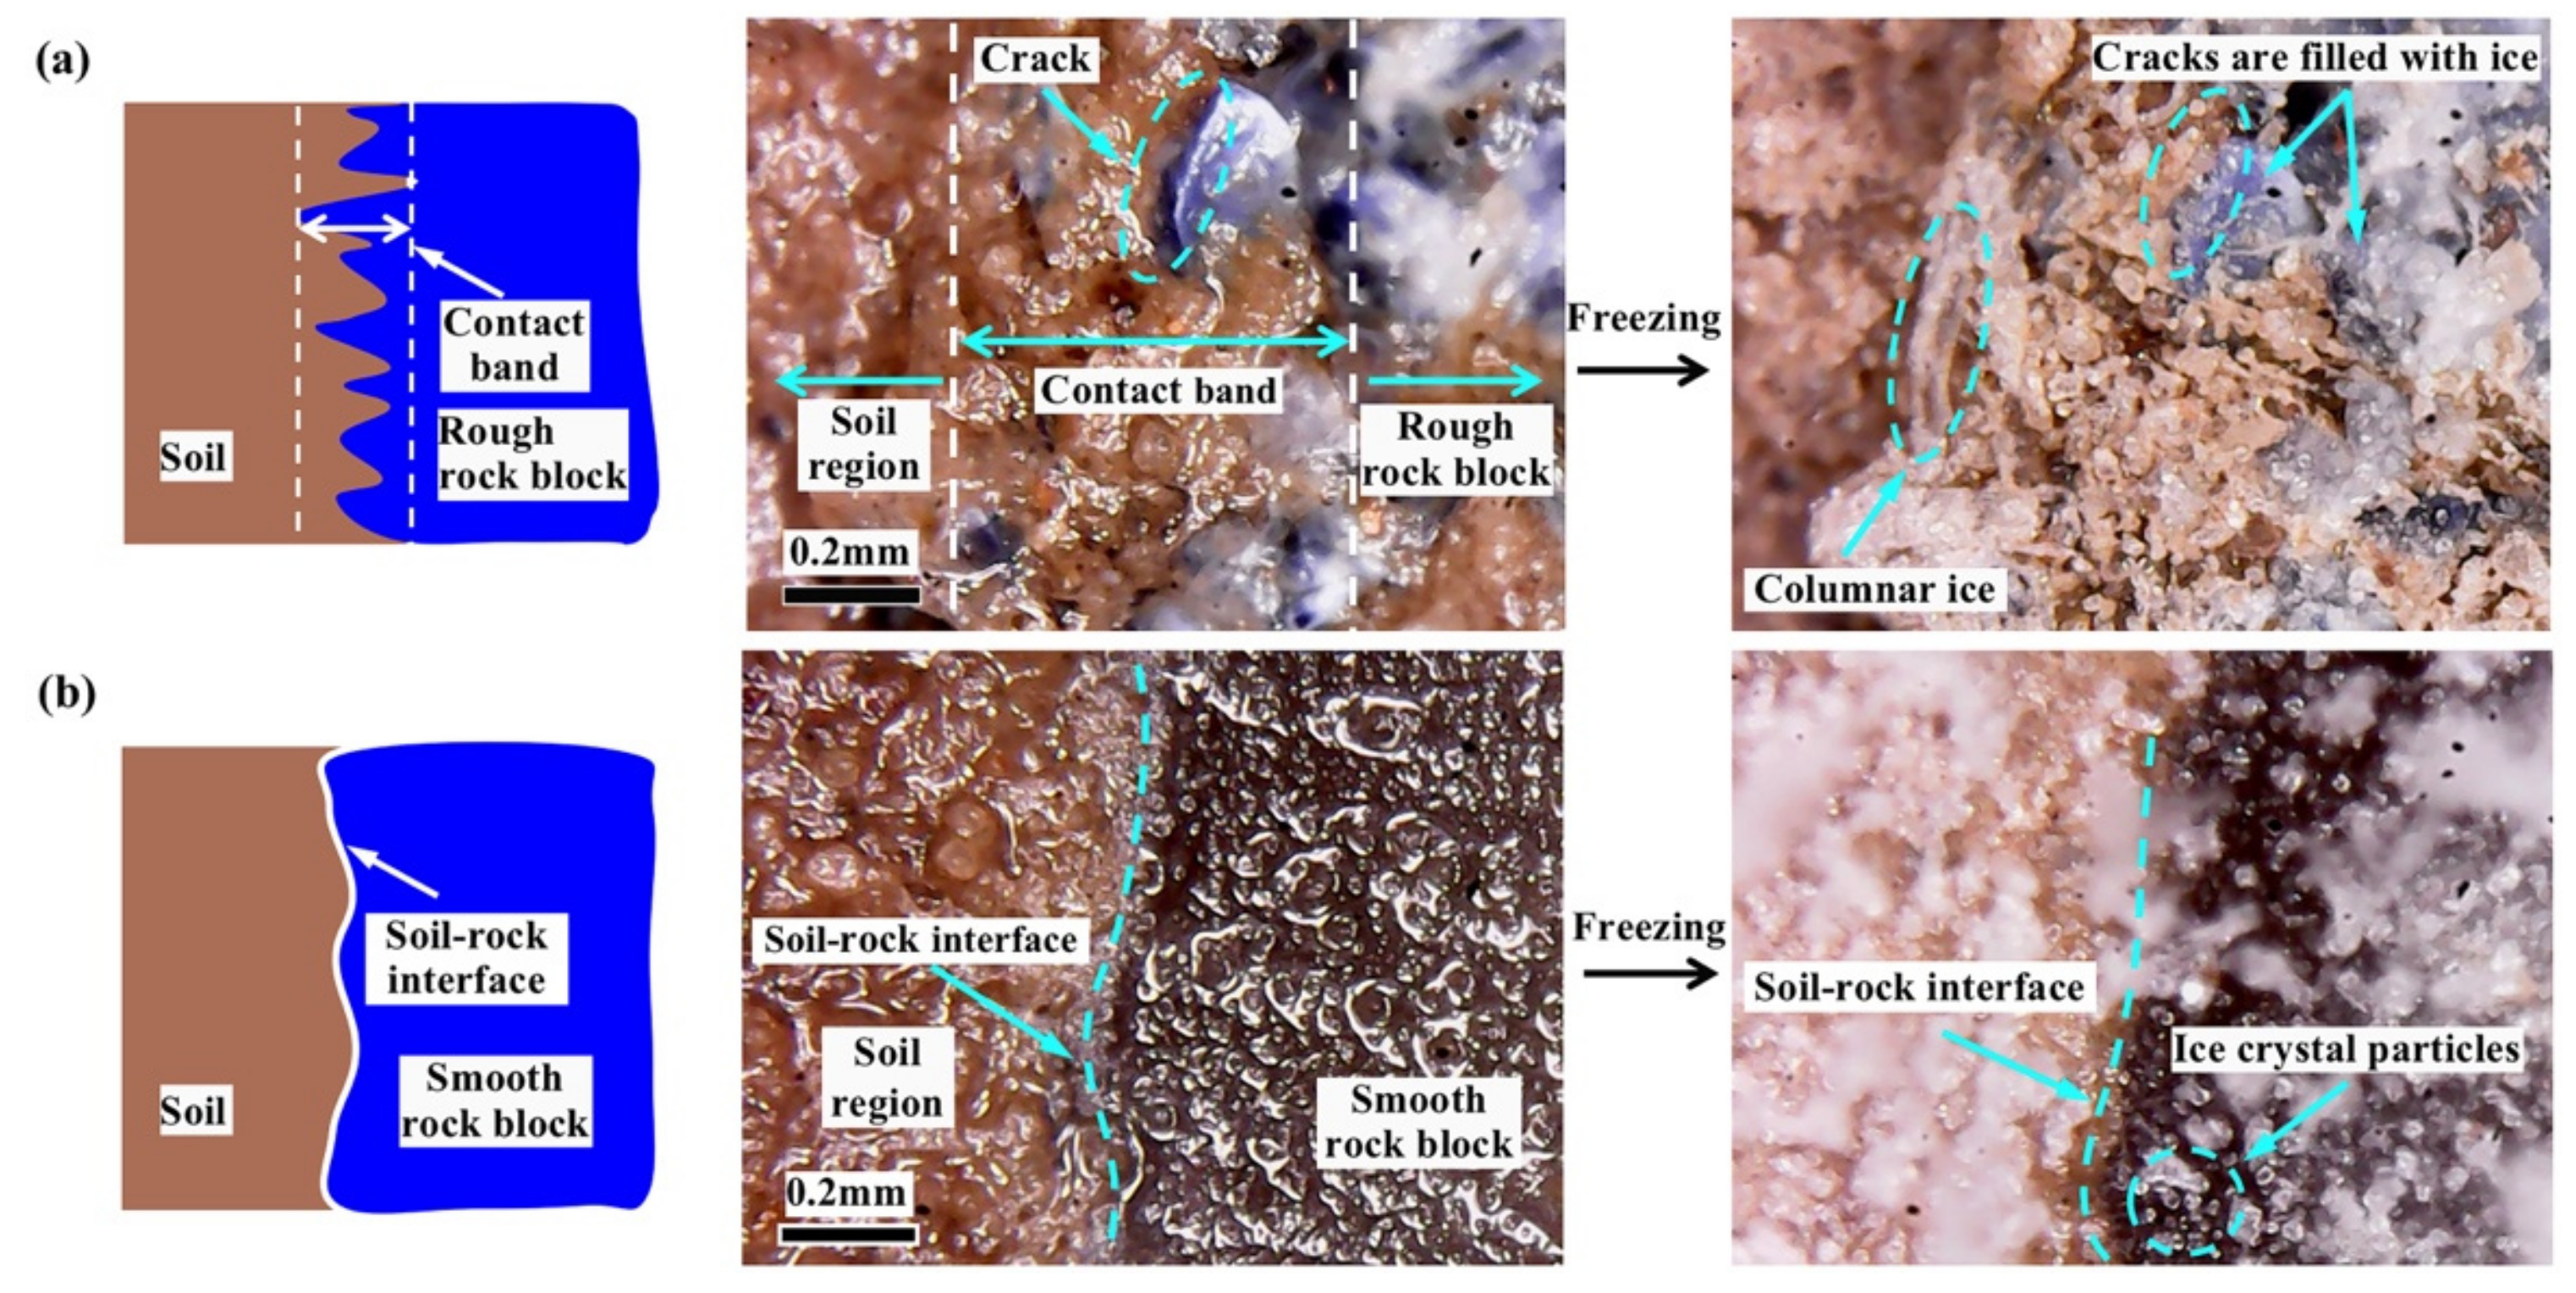
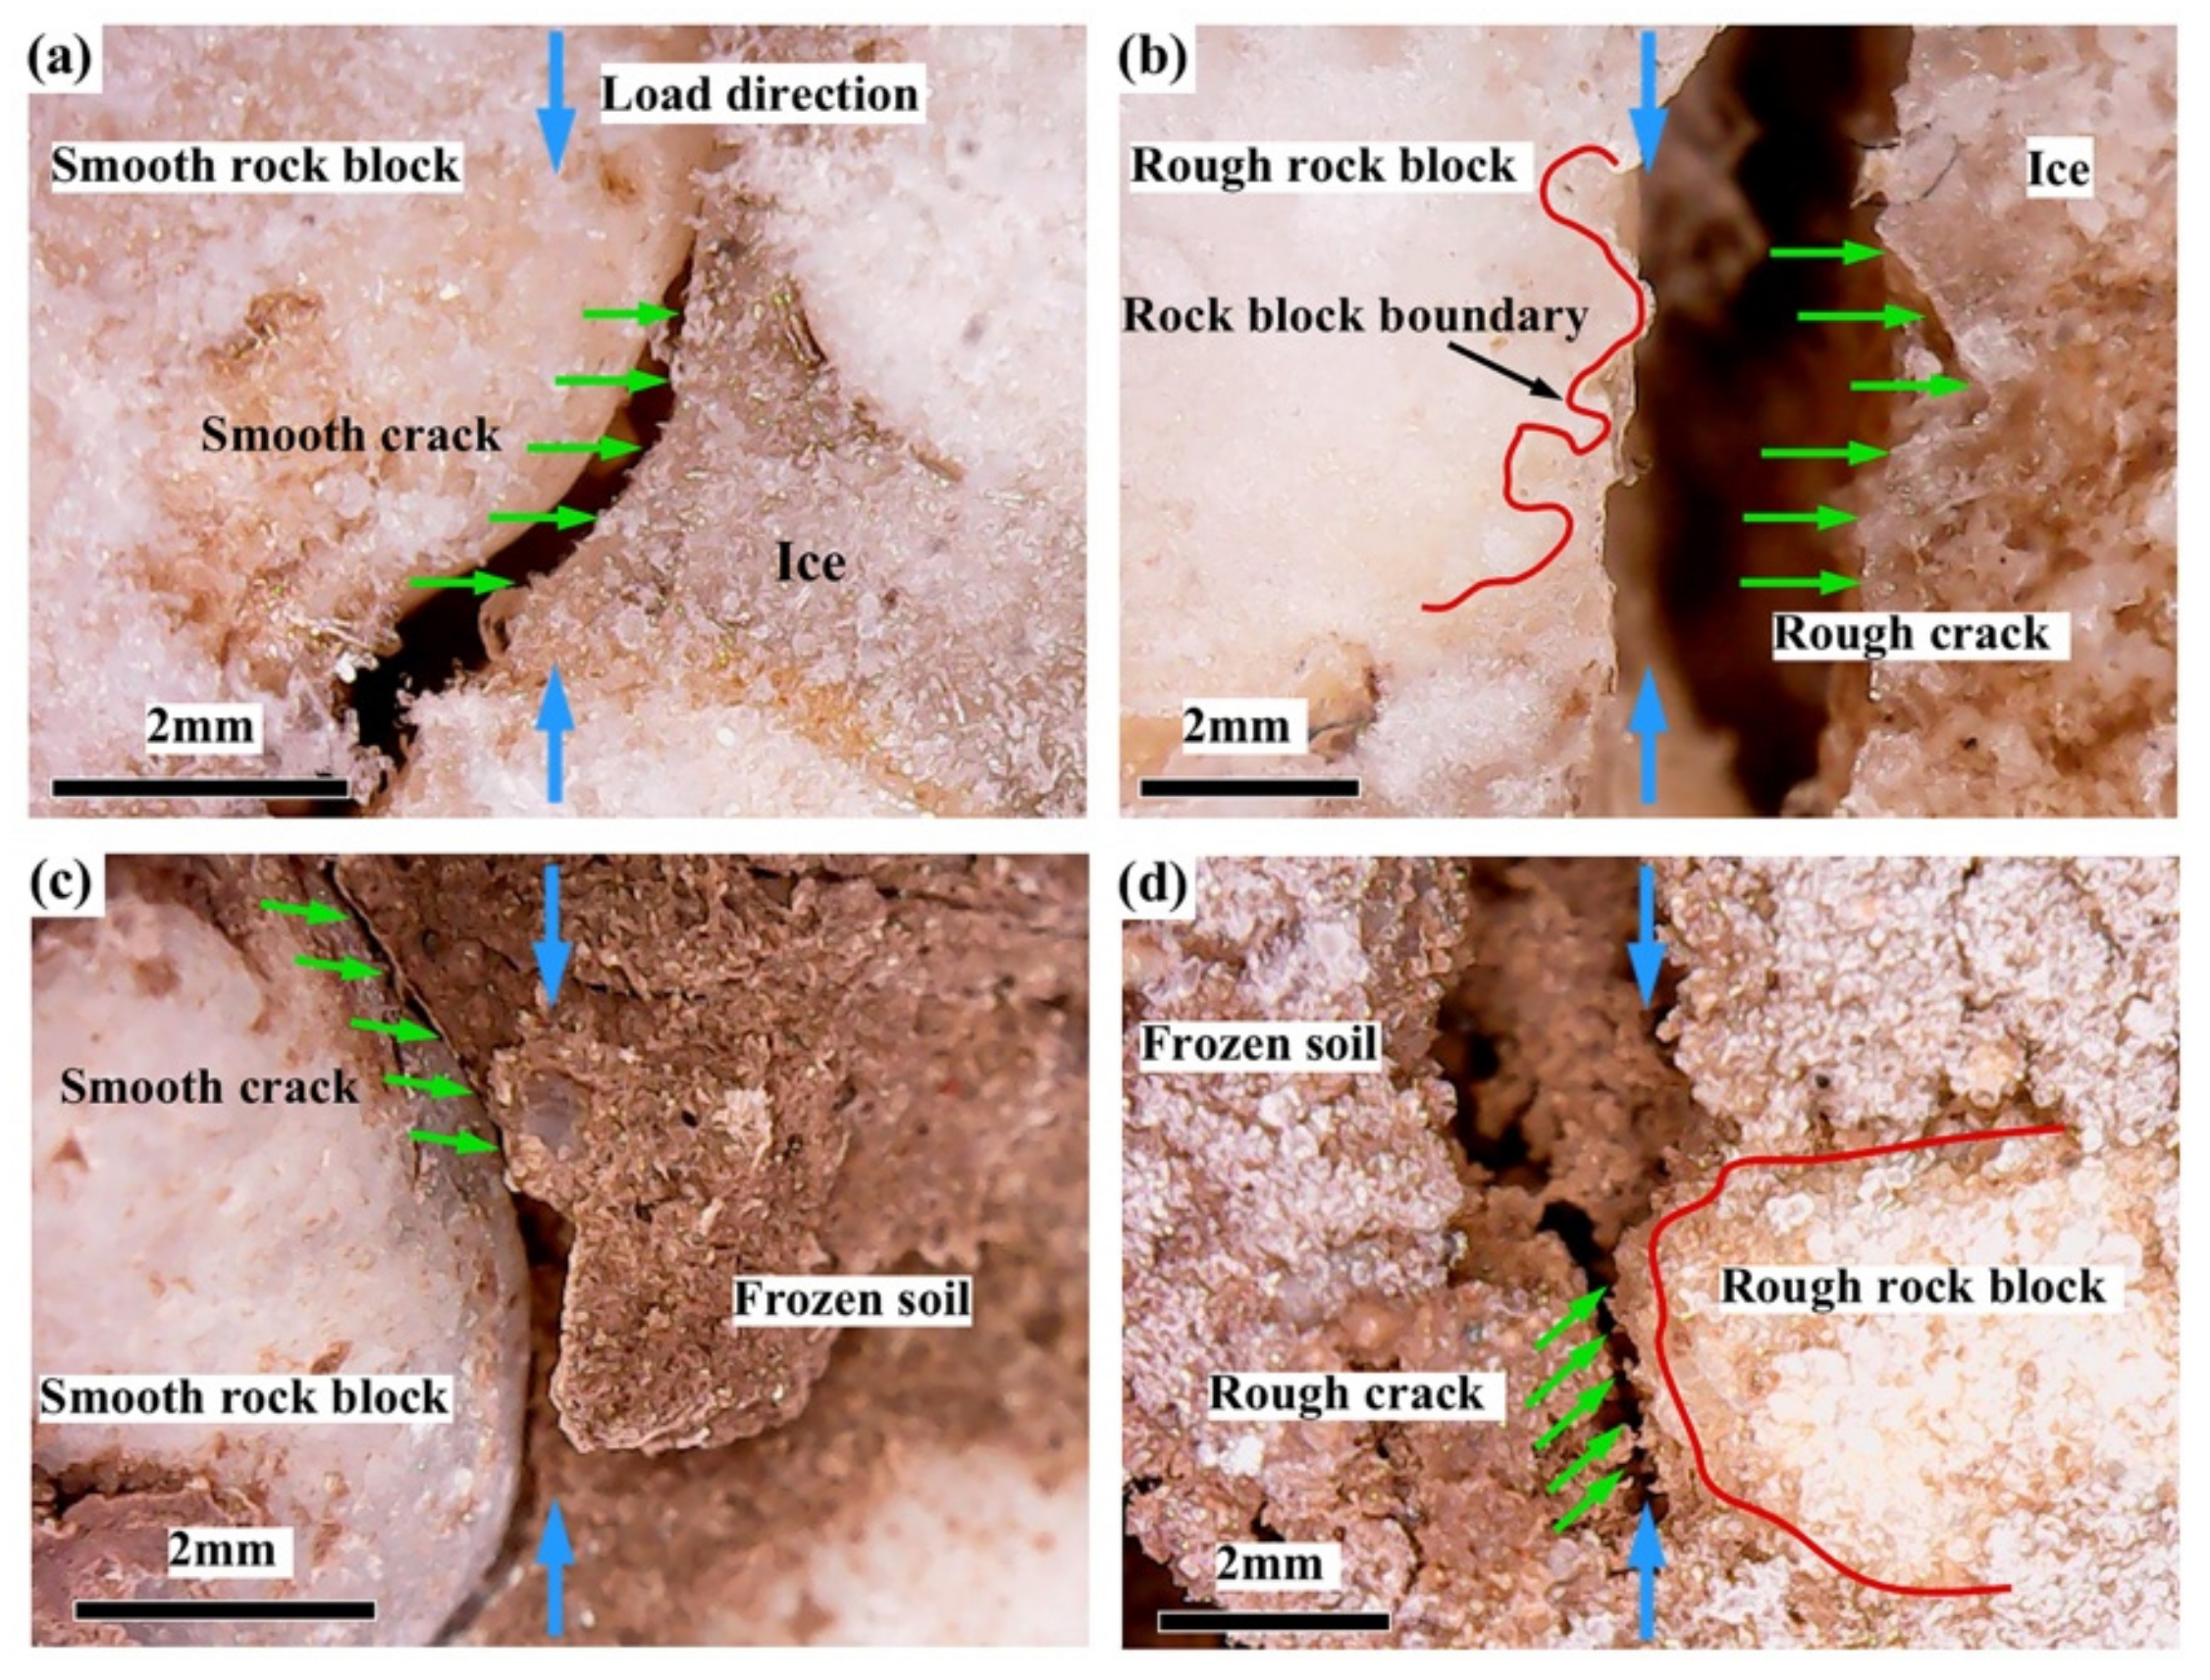
3.2. Morphology of Frozen Soil–rock Interface

The micromorphology of the frozen soil–rock interface is shown in Figure 10. We can see that there was no obvious boundary between the soil and the rock surface. The soil matrix and cemented ice could squeeze into the micropores of the rock block surface to form the soil–rock contact band, in which the rock block and frozen soil are interlaced with each other. To clearly understand the soil–rock interface mechanism, we compared two soil–rock interfaces before and after freezing, which were composed of smooth rock blocks (carnelian) and rough rock blocks (filter stone), respectively, as shown in Figure 11. The results clearly show that the soil–rock interface exhibited an obvious contact band instead of a soil–rock interface surface at the rough surface of the filter stone. Moreover, the ice could enter the small pores or fractures to fill them due to the water molecules being smaller than soil particles, which indicates that the higher the surface roughness of the rock block, the wider the width of the soil–rock contact band.
It is interesting to note that the soil–rock interface is the weakest part in SRMs, and cracks commonly initiate here [13,17]; however, in line with the ideas of our observations, the soil–rock contact band and ice play important roles in improving the strength of the soil–rock interface. Our results cast a new light on the soil–rock interface. It is worth discussing these interesting phenomena as revealed by the observation of the FSRM digital image. In the following section, by comparing the results from the uniaxial compression test and Brazilian test, we discuss the influence of these findings on the mechanical properties of FSRMs and the failure mode of the frozen soil–rock interface.

3.3. The Results of UCS and Indirect Tension Strength Analysis

Table 1 lists the comparison results of UCS and indirect tensile strength of samples.

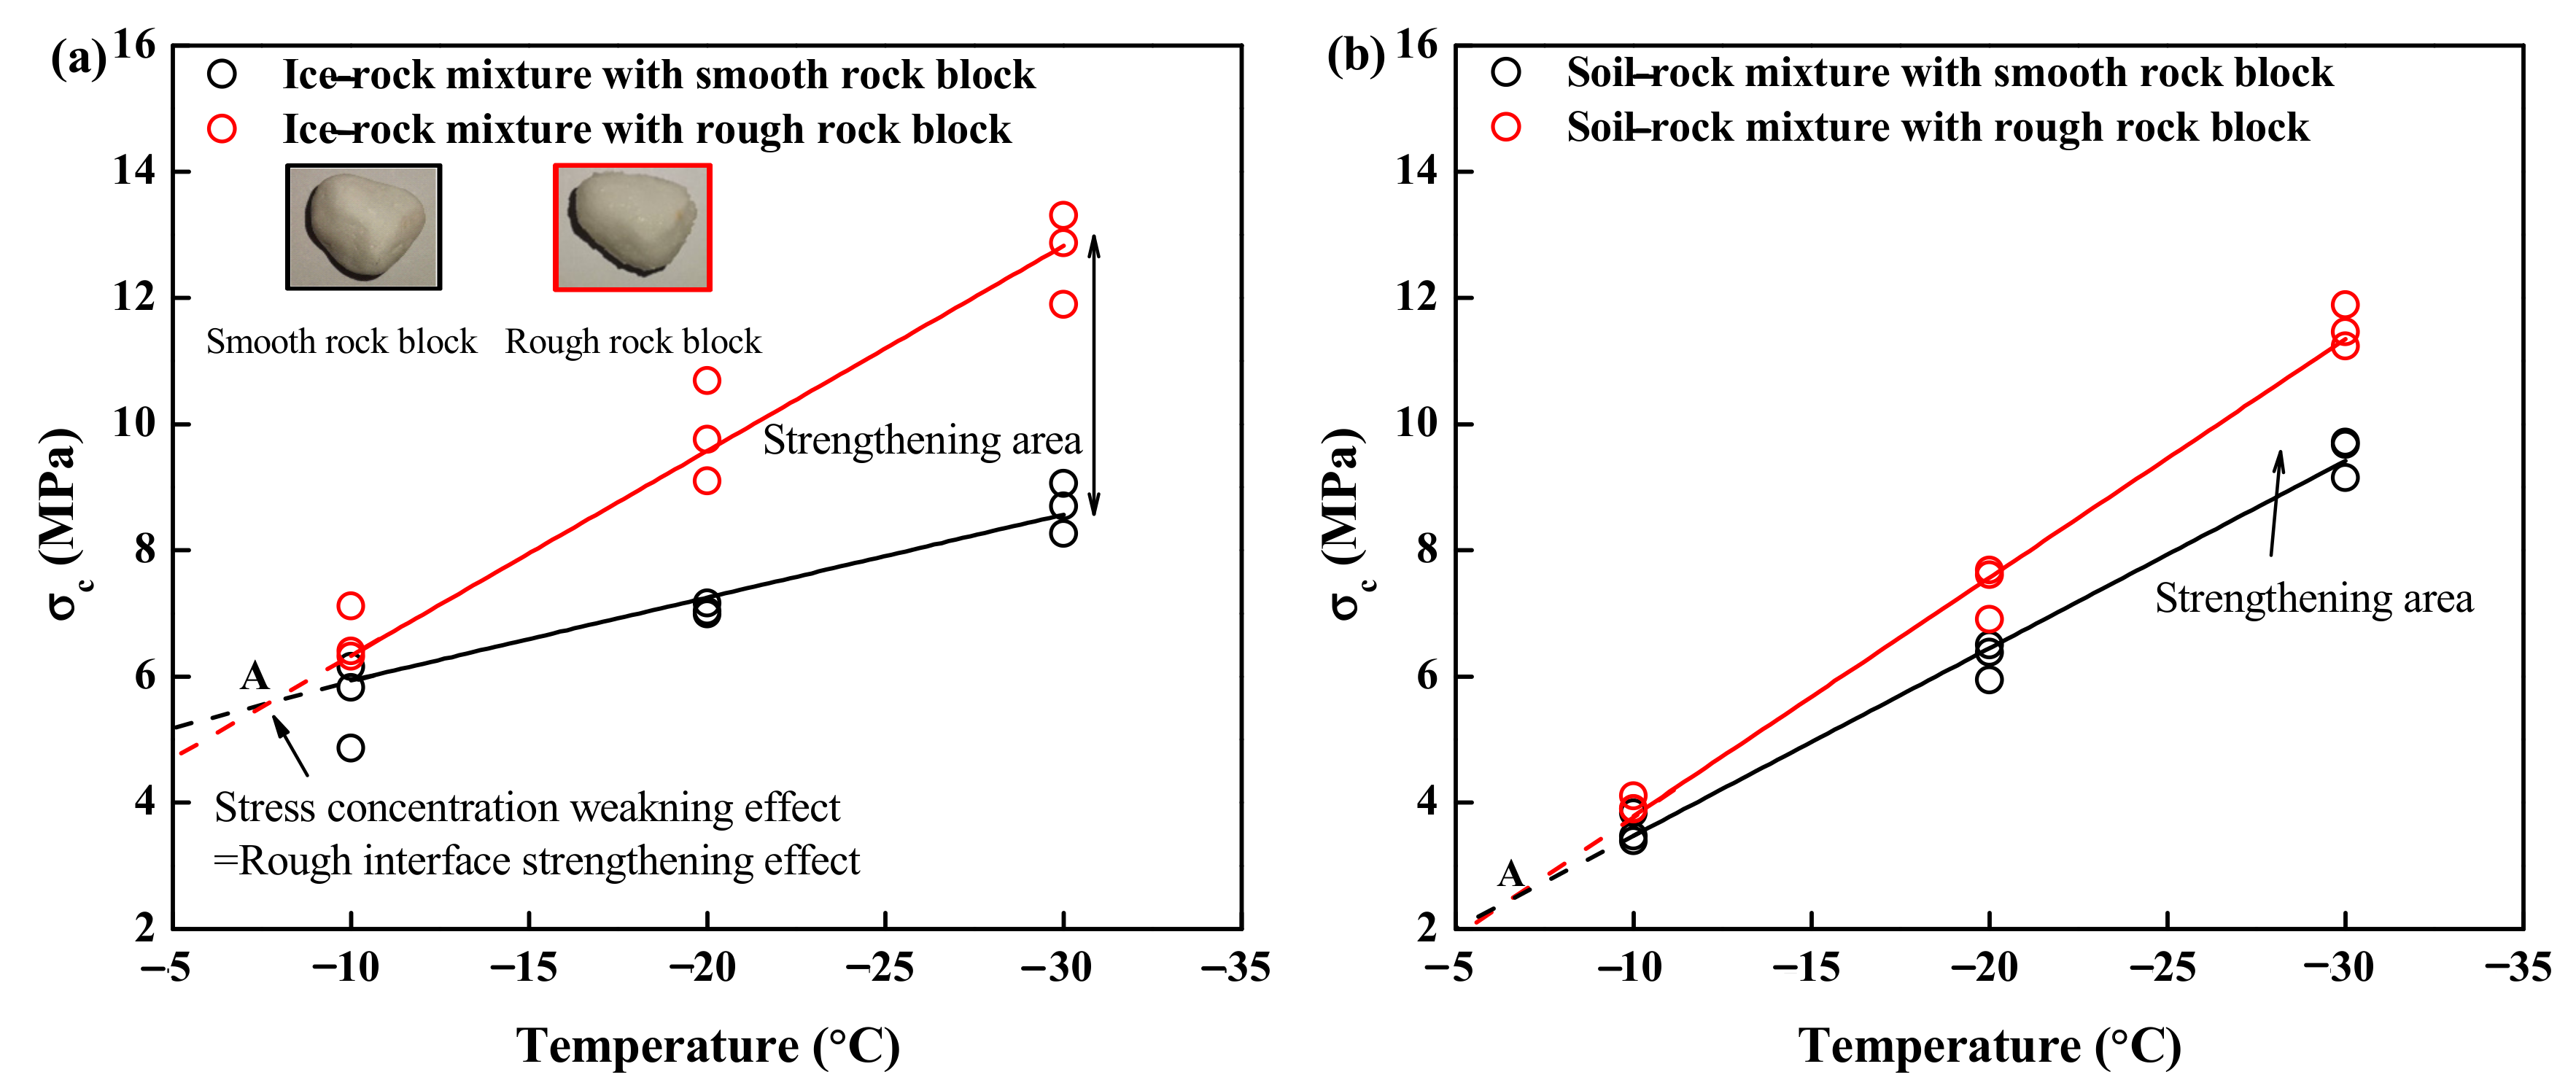
3.3.1. The Uniaxial Compression Strength Analysis

Figure 12 presents the uniaxial compression strength (UCS) of artificially FSRM samples and ice–rock mixture samples under different frozen temperatures of −10, −20, and −30 °C. It can be seen that the UCS values of the ice–rock mixtures and FSRM samples containing rough rock blocks were obviously larger than those of samples containing smooth rock blocks, especially for ice–rock mixtures. Both strengths for all samples increased with a decreasing temperature, and the uniaxial compression strength change was approximately linear with the frozen temperature, which is similar to the findings of previous studies. Moreover, the difference between UCS increased with a decreasing temperature. Nevertheless, according to the trends of the curves, the UCS and the tension strength of samples containing smooth rock blocks were larger than those of samples containing rough rock blocks when the temperature was higher than that at intersection point A. As mentioned above, the soil–rock interface is the stress concentration area under compression, especially in the surface of rough rock blocks, and the pressure melting of ice granules also occurs here. The lubrication of meltwater is disadvantageous to the soil–rock interface strength.

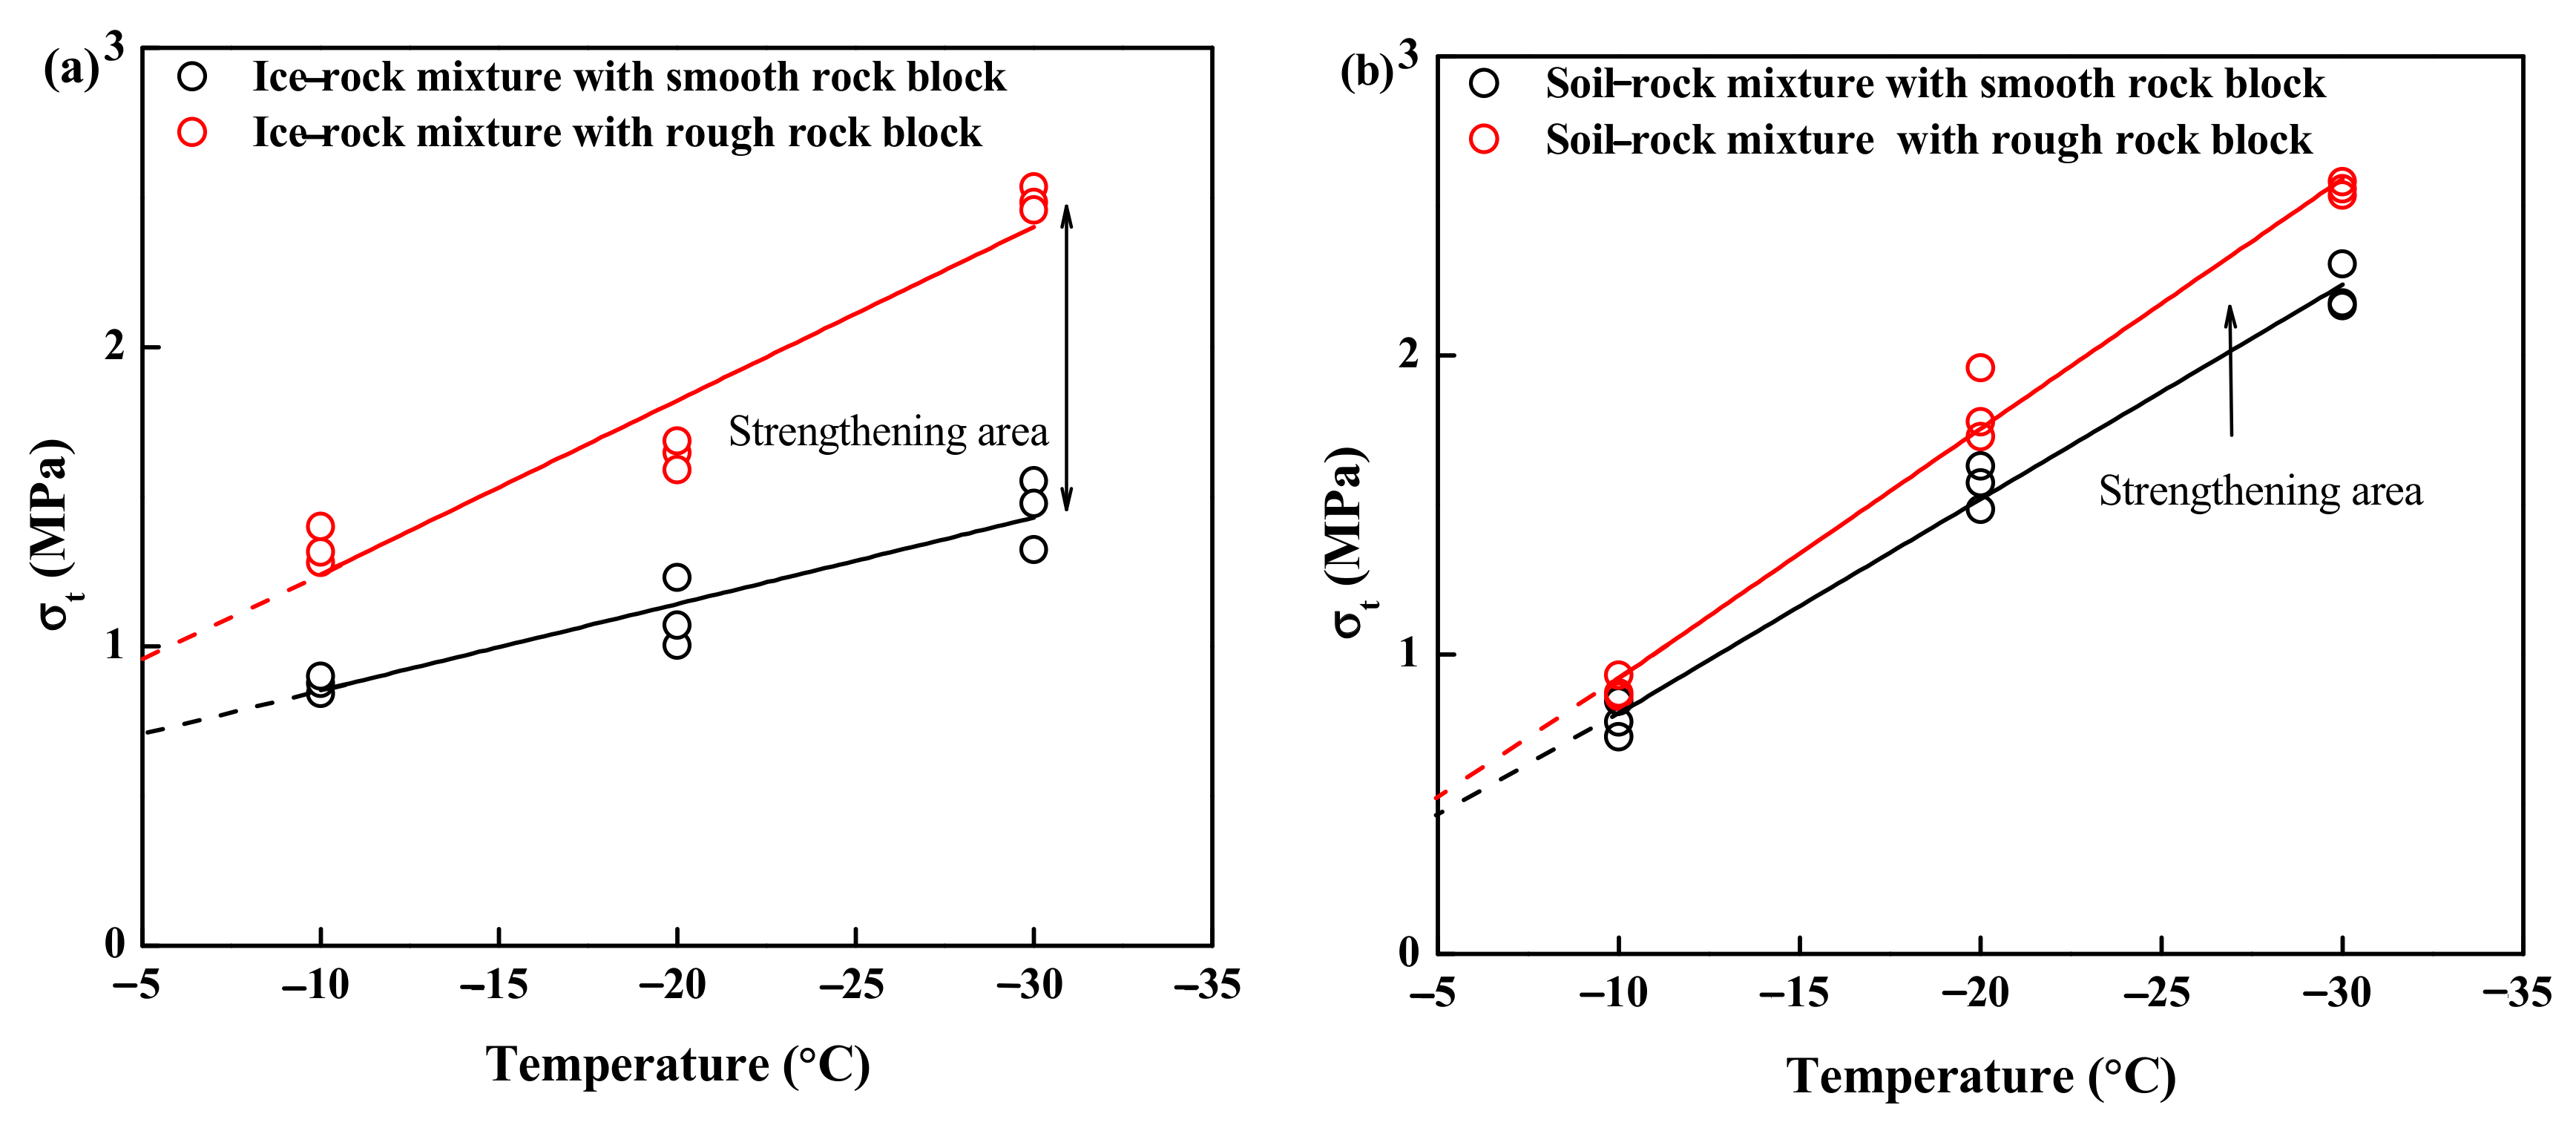
3.3.2. The Indirect Tension Strength Analysis

The Brazilian test is a common method to indirectly evaluate the tensile strength of materials. According to elastic mechanical theories, the tensile strength σt can be expressed as follows [45]:
σ t = 2 P π DL
where P is the compression loading at failure, D is the diameter of the specimen, and L is the length of the specimen. Figure 13 shows the testing results of the Brazilian testing. It is notable that the tensile strength grew linearly with a decreasing temperature. The tensile strengths of samples containing rough rock blocks were larger than those of samples containing smooth rock blocks, and the increment in tensile strength presented an increase trend with a decreasing temperature, as with the UCS. Furthermore, the strength increment of the ice–rock mixture sample was more obvious than that of the soil–rock mixture sample. This can be attributed to the high VBP for the ice–rock mixture. Like in the compression test, the trend curves will intersect; however, the temperature of the intersection is higher than that of the compression test. This can be attributed to the stress concentration of the tension condition being weaker than that in the compression/shear conditions. This study shows that the interaction between frozen soil and blocks is more complex than originally thought. Further tests will be taken to examine this problem.

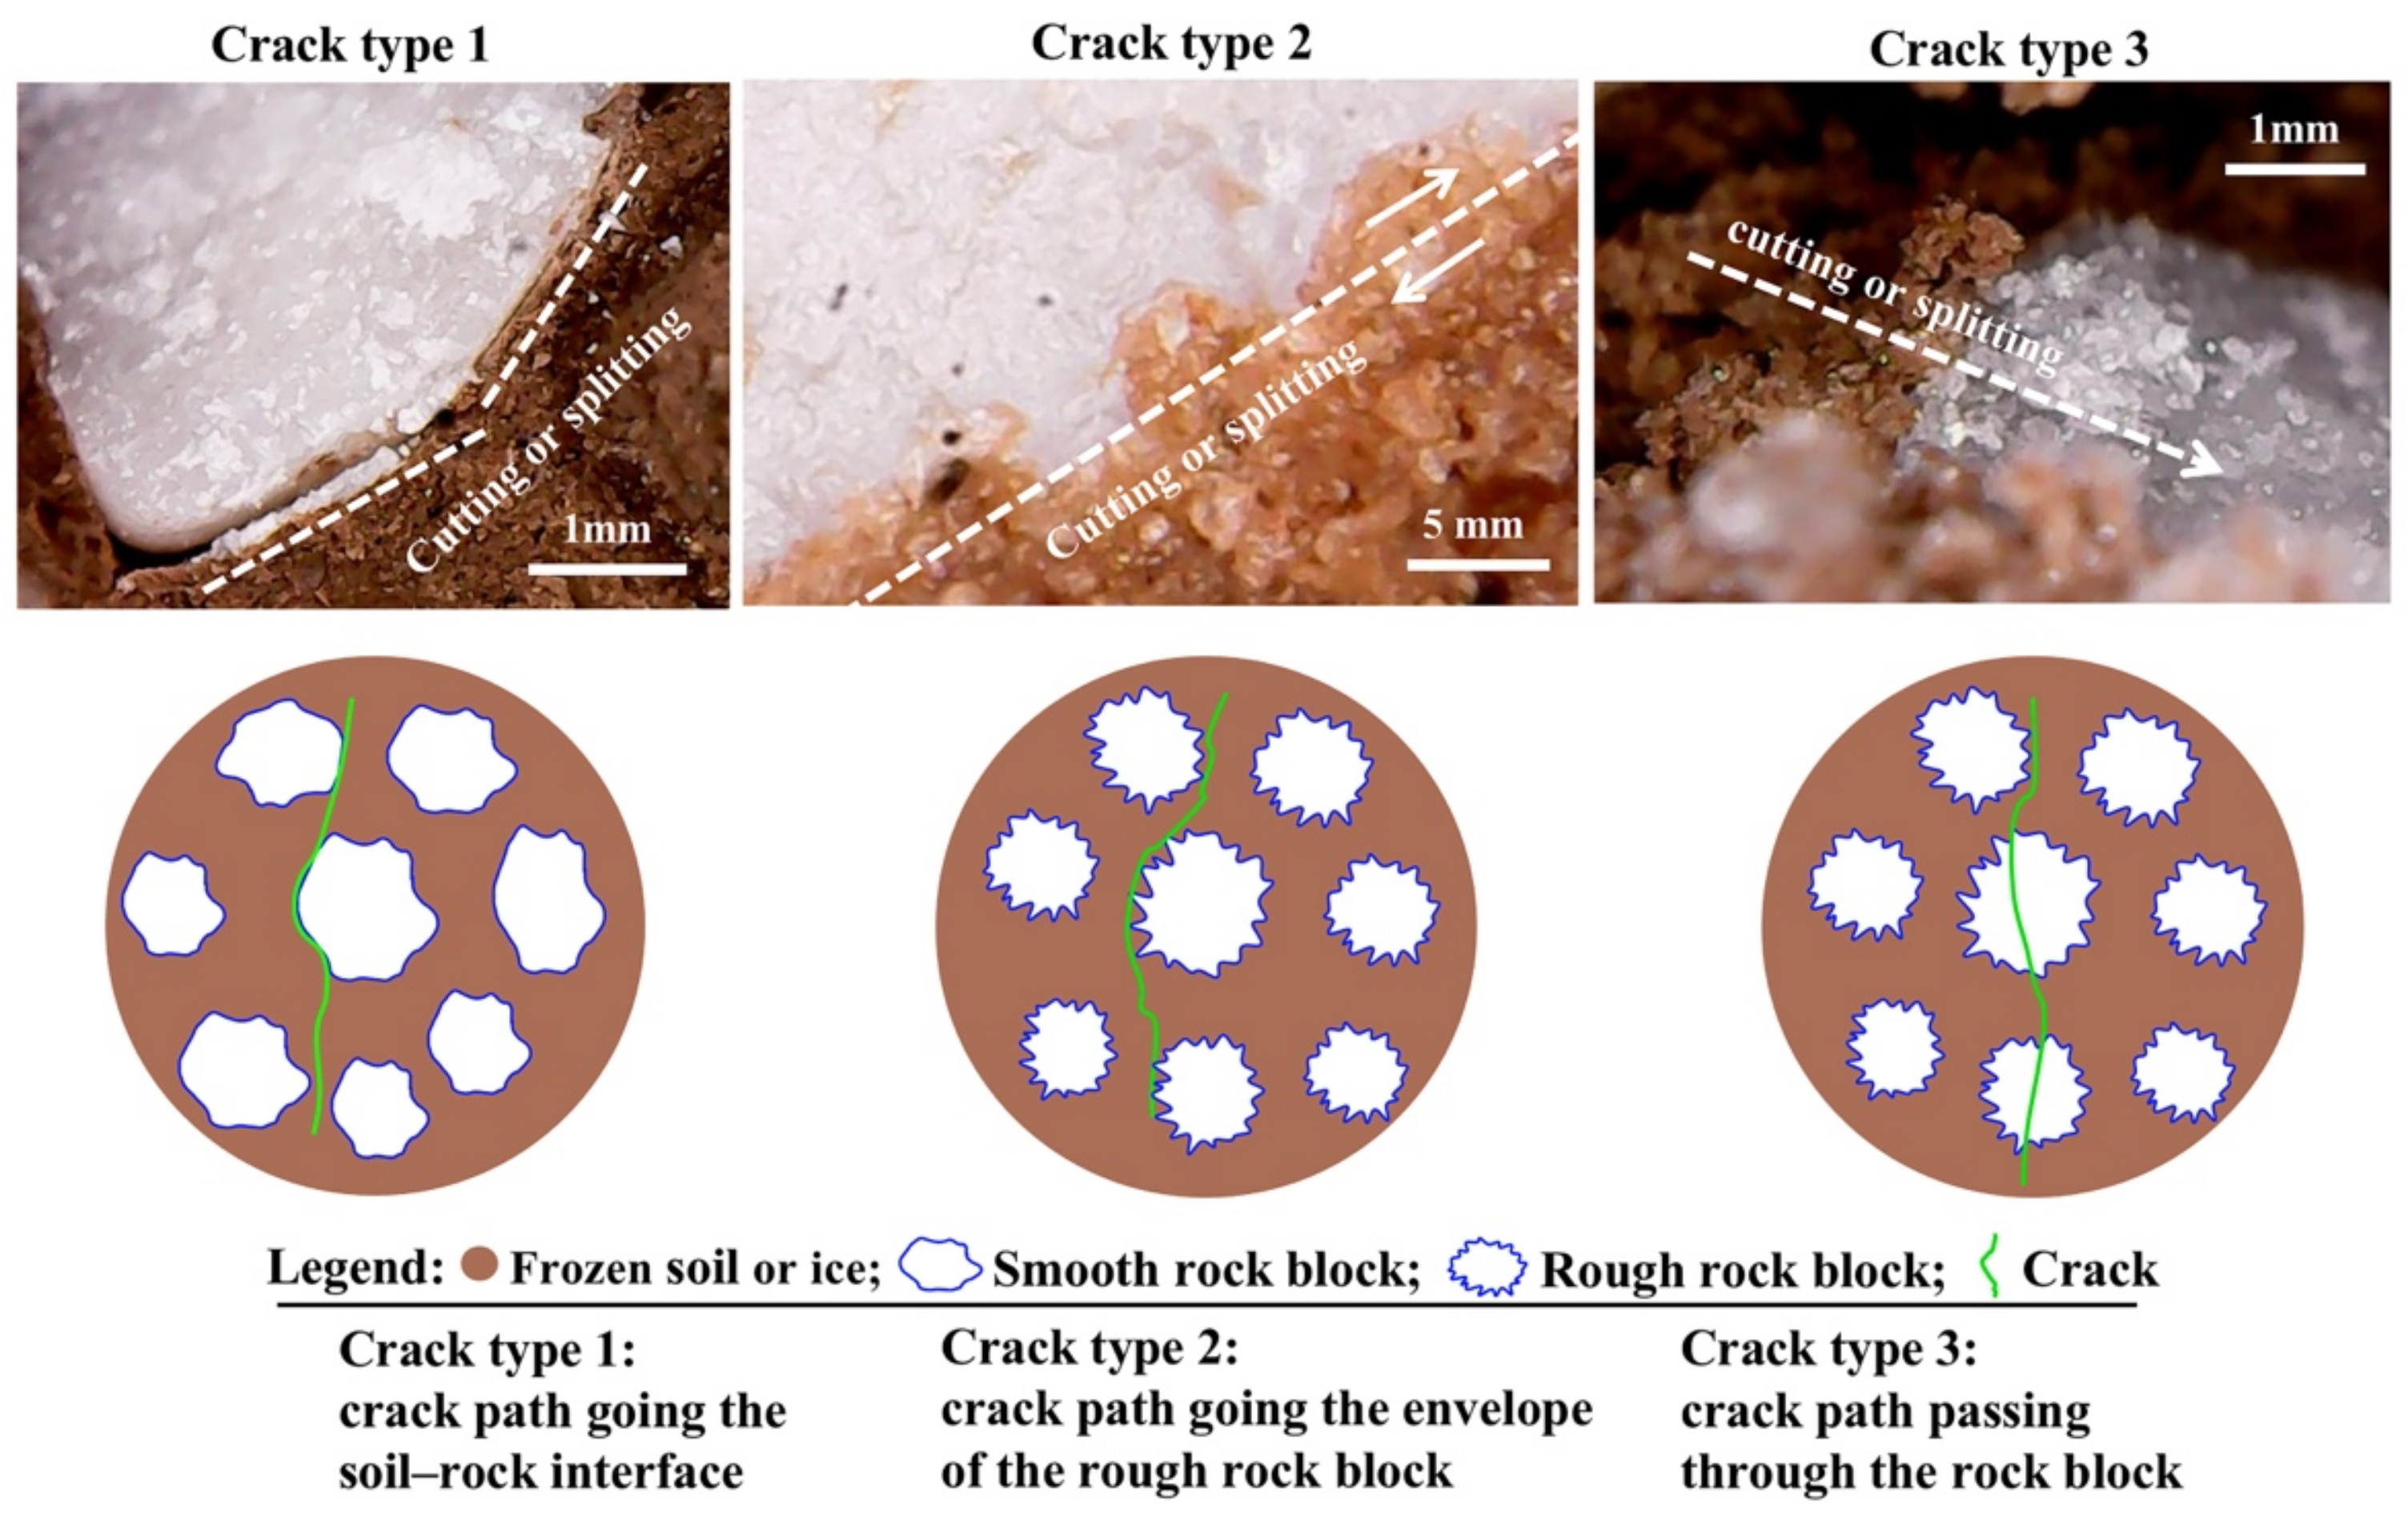
3.4. The Failure Model and the Evolution of Crack Propagation at Soil–Rock Interface

Using a digital microscope, we analyzed the cracks in FSRM samples and ice–rock mixture samples from a mesoscopic perspective. As shown in Figure 14, we can see two types of crack structures in the images. For samples containing smooth rock blocks, the cracks showed a flat surface, and the cracks propagated along the accurate soil–rock interface; however, for the sample containing rough rock blocks, the cracks showed a rough serrated surface and the cracks no longer propagated along the accurate soil–rock interface, but in the frozen soil instead. The crack morphology in the soil–rock interface here was similar to that in the frozen soil. According to Figure 14, two possible paths will occur, as shown in Figure 15. For the first crack propagation mode, the crack will go through the accurate soil–rock interface in the sample containing the smooth rock blocks. In the sample containing the rough rock blocks, the second crack propagation mode depends on the contrast strength of the soil–rock interface and rock blocks. As shown in Figure 15, the crack will not propagate along the accurate soil–rock interface. The envelope of the rough rock block outline is the weakest area, and the crack propagation will initiate here; however, for FSRMs, the strength of the soil–rock contact band increases with the decrease of frozen temperature, and it could be larger than the strength of rock block. Therefore, cracks will pass through weak rock blocks, as the third crack propagation mode.

4. Conclusions

Smooth rock blocks and rough rock blocks were used here for fabricating artificial FSRMs and ice–rock mixtures, respectively. On the basis of microstructure observations of the frozen soil–rock interfaces, uniaxial compressive and Brazilian testing were applied to the FSRM samples and ice–rock mixture samples under different frozen temperatures to investigate the deformation mechanisms of the FSRMs and the influence of the soil–rock interface on strength. Moreover, the AE and the UPV technologies were used to enhance the understanding of the mechanism of the deformation behavior in the FSRMs under loading. Finally, the microstructure failure modes of the soil–rock interfaces were identified, and the major conclusions are given as follows:
Under the uniaxial compression test, the main failure mode for FSRMs was characterized by bulging deformation and no obvious surface crack before the peak stress point. Most of the surface cracks appeared at the post-peak stage. With a decreasing frozen temperature, the surface tension cracks gradually evolved into shear cracks. All the ice–rock mixture samples showed obvious axial cracks at the peak point, and the axial stress decreased rapidly after the peak strength point. Under the Brazilian test, the main failure mode was characterized by tortuous cracks propagating adjacent to the center of the disk that were perpendicular to loading platens. The failure cracks appeared near the peak stress point stage. The AE results show that a large degrees of deformation occurred in the stress post-peak stage under the uniaxial compression test; however, the deformation mainly occurred at the peak stress stage with the Brazilian test. This indicates that the obvious motion of rock block and crack propagation occurred in the post-peak stage and the creeping and friction of soil particles and ice granules were amused in the pre-peak stage under uniaxial compression test. The UPV results show that the maximum UPV often appeared in the post-peak stress stage. This indicates that the obvious cracks mainly initiated and grew in the post-peak stage. Combining the results above, we can speculate that the creeping of the frozen soil and ice granules, crack propagation, and rock block activities jointly result in the failure of FSRMs.
The soil–rock interface will evolve into a soil–rock contact band at the surface of the rough rock block. The soil particles and water will squeeze into the pores to form the soil–rock contact band. The compressive and tensile strength of the frozen soil–rock contact band was larger than that of the soil–rock interface, and the strength difference increased with decreasing frozen temperatures. The soil–rock contact band tension strength was even larger than with rock block particles at relatively lower negative temperatures; it could cause breakage of rock block.
From the failure crack morphology perspective, three crack propagation patterns are shown. In the first pattern, cracks between the soil–rock interface will propagate along the accurate soil–rock interface in FSRMs containing smooth rock blocks and will present a flat crack surface; however, cracks will propagate along the contour envelopes of rock blocks in FSRMs containing rough rock blocks and will resultingly present a rough crack surface, as the second pattern. In the third pattern, the crack will pass through rough rock block.
This study provides a point for discussion and further research on cold engineering, especially in foundation engineering inside frozen soil (such as pile foundation). According to the third crack pattern of this study, the crack propagation could pass through the rock block. It is a disadvantage to pile surface protection, especially the pile with rough surface; however, it is good for pile side frictional resistance. Looking forward, further research in the area could be helpful to the protection and correction resistance of piles in cold regions engineering.

Author Contributions

Conceptualization, Z.L. and F.H.; data curation F.H. and Y.T.; formal analysis, F.H.; investigation, F.H. and Y.T.; methodology, F.H.; project administration, Z.L. and R.H.; validation, Z.L.; writing—original draft, F.H.; writing and editing draft, Z.L. and F.H. All authors have read and agree to the published version of the manuscript.

Funding

This work was funded by the Second Tibetan Plateau Scientific Expedition and Research Program (STEP) (Grant No. 2019QZKK0904), National Natural Science Foundation of China (Grant No. 41672316), Chinese Academy of Sciences Key Deployment Project (Grant No. KFZD-SW-422), Youth Innovation Promotion Association CAS (Grant No. 2017092) and the International Cooperation Program of Chinese Academy of Sciences (Grant No. 131551KYSB20180042).

Institutional Review Board Statement

Not applicable.

Informed Consent Statement

Not applicable.

Conflicts of Interest

The authors declare no conflict of interest.

References

  1. Xue, Y.G.; Meng, K.F.; Yang, W.M.; Qiu, D.H.; Su, M.X.; Fu, K.; Ma, X.M. Main unfavorable geological conditions and engineering geological problems along Sichuan—Tibet railway. Chin. J. Rock Mech. Eng. 2020, 39, 445–468. [Google Scholar] [CrossRef]
  2. Zhao, Y.; Xie, Q.; Wang, Z.; Zhao, W.; Zhu, L. Characteristics of Temperature Field of Coarse-grained soil Slope in Seasonal Frozen Soil Region Along Sichuan-Tibet Railway. Rail Eng. 2017, 5, 95–99. [Google Scholar]
  3. Lu, C.; Cai, C. Challenges and Countermeasures for Construction Safety during the Sichuan–Tibet Railway Project. Engineering 2019, 5, 833–838. [Google Scholar] [CrossRef]
  4. Jin, H.; Wei, Z.; Wang, S.; Yu, Q.; Lü, L.; Wu, Q.; Ji, Y. Assessment of frozen-ground conditions for engineering geology along the Qinghai–Tibet highway and railway, China. Eng. Geol. 2008, 101, 96–109. [Google Scholar] [CrossRef]
  5. Zhu, L.; Xie, Q.; Ren, X.H.; Wen, J.Q. Experimental Study on Shear Strength of Seasonal Coarse-grained Frozen Soil Along Sichuan-Tibet Railway. J. Chin. Railw. Soc. 2018, 40, 107–111. [Google Scholar]
  6. Wang, J.; Jia, K.; Rafique, R.; Guo, L.; Yu, Q.; Yue, Y.; Yuan, C. Changes of backfill soil of tower foundation in the permafrost regions with warm ice-rich frozen soil on the Qinghai–Tibet Plateau. Environ. Earth Sci. 2016, 75, 1–10. [Google Scholar] [CrossRef]
  7. Li, Y.R. Effects of particle shape and size distribution on the shear strength behavior of composite soils. Bull. Eng. Geol. Environ. 2013, 72, 371–381. [Google Scholar] [CrossRef]
  8. Zhang, H.Y.; Xu, W.J.; Yu, Y.Z. Triaxial tests of soil–rock mixtures with different rock block distributions. Soils Found 2016, 56, 44–56. [Google Scholar] [CrossRef] [Green Version]
  9. Afifipour, M.; Moarefvand, P. Mechanical behavior of bimrocks having high rock block proportion. Int. J. Rock Mech. Min. Sci. 2014, 65, 40–48. [Google Scholar] [CrossRef]
  10. Xu, W.J.; Hu, L.M.; Gao, W. Random generation of the meso-structure of a soil-rock mixture and its application in the study of the mechanical behavior in a landslide dam. Int. J. Rock Mech. Min. Sci. 2016, 86, 166–178. [Google Scholar] [CrossRef]
  11. Kahraman, S.; Alber, M. Estimating unconfined compressive strength and elastic modulus of a fault breccia mixture of weak blocks and strong matrix. Int. J. Rock Mech. Min. Sci. 2006, 43, 1277–1287. [Google Scholar] [CrossRef]
  12. Coli, N.; Berry, P.; Boldini, D. In situ non-conventional shear tests for the mechanical characterisation of a bimrock. Int. J. Rock Mech. Min. Sci. 2011, 48, 95–102. [Google Scholar] [CrossRef]
  13. Xu, W.J.; Yue, Z.Q.; Hu, R.L. Study on the mesostructure and mesomechanical characteristics of the soil–rock mixture using digital image processing based finite element method. Int. J. Rock Mech. Min. Sci. 2008, 45, 749–762. [Google Scholar] [CrossRef]
  14. Kalender, A.; Sonmez, H.; Medley, E.; Tunusluoglu, C.; Kasapoglu, K.E. An approach to predicting the overall strengths of unwelded bimrocks and bimsoils. Eng. Geol. 2014, 183, 65–79. [Google Scholar] [CrossRef]
  15. Wang, Y.; Li, C.H.; Hu, Y.Z. X-ray computed tomography (CT) observations of crack damage evolution in soil-rock mixture during uniaxial deformation. Arab. J. Geosci. 2018, 11, 199. [Google Scholar] [CrossRef]
  16. Sun, H.F.; Yang, Z.K.; Xing, M.X.; Ju, Y.; Yang, Y.M. CT Investigation of Fracture Mechanism of Soil-Rock Mixtures. Appl. Mech. Mater. 2012, 204–208, 67–71. [Google Scholar] [CrossRef]
  17. Wang, Y.; Li, C.H.; Hu, Y.Z. Use of X-ray computed tomography to investigate the effect of rock blocks on meso-structural changes in soil-rock mixture under triaxial deformation. Constr. Build. Mater 2018, 164, 386–399. [Google Scholar] [CrossRef]
  18. Sonmez, H.; Tuncay, E.; Gokceoglu, C. Models to predict the uniaxial compressive strength and the modulus of elasticity for Ankara Agglomerate. Int. J. Rock Mech. Min. Sci. 2004, 41, 717–729. [Google Scholar] [CrossRef]
  19. Rotta, G.; Consoli, N.; Prietto, P.; Coop, M.; Graham, J. Isotropic yielding in an artificially cemented soil cured under stress. Geotechnique 2003, 53, 493–501. [Google Scholar] [CrossRef]
  20. Akram, M.; Sharrock, G. Physical and numerical investigation of a cemented granular assembly of steel spheres. Int. J. Numer. Anal. Methods Geomech. 2010, 34, 1896–1934. [Google Scholar] [CrossRef]
  21. Saiang, D.; Malmgren, L.; Nordlund, E. Laboratory Tests on Shotcrete-Rock Joints in Direct Shear, Tension and Compression. Rock Mech. Rock Eng. 2005, 38, 275–297. [Google Scholar] [CrossRef]
  22. Fourie, W.J.; Barnes, D.L.; Shur, Y. The formation of ice from the infiltration of water into a frozen coarse grained soil. Cold Reg. Sci. Technol. 2007, 48, 118–128. [Google Scholar] [CrossRef]
  23. Fitzsimons, S.; McManus, K.; Lorrain, R. Structure and strength of basal ice and substrate of a dry-based glacier: Evidence for substrate deformation at sub-freezing temperatures. Ann. Glaciol. 1999, 28, 236–240. [Google Scholar] [CrossRef] [Green Version]
  24. Nickling, W.G.; Bennett, L. The Shear Strength Characteristics of Frozen Coarse Granular Debris. J. Glaciol. 1984, 30, 348–357. [Google Scholar] [CrossRef]
  25. Arenson, L.; Sego, D. The effect of salinity on the freezing of coarse-grained sands. Can. Geotech. J. 2006, 43, 325–337. [Google Scholar] [CrossRef]
  26. Arenson, L.; Springman, S. Triaxial constant stress and constant strain rate test on ice-rich permafrost samples. Can. Geotech. J. 2005, 42, 412–430. [Google Scholar] [CrossRef]
  27. Qi, C.Q.; Wang, Z.K.; Li, L.Y. Influence of temperature and ice content on mechanical properties of frozen rock-soil mixture. J. Eng. Geol. 2016, 24, 1112–1117. [Google Scholar]
  28. Tavana, H.; Neumann, A. Recent progress in the determination of solid surface tensions from contact angles. Adv. Colloid Interface Sci. 2007, 132, 1–32. [Google Scholar] [CrossRef]
  29. Medley, E. The Engineering Characterization of Melanges and Similar Block-In-Matrix Rocks (Bimrocks). Ph.D. Thesis, University of California, Berkeley, CA, USA, 1994. [Google Scholar]
  30. Medley, E.; Lindquist, E.S. The engineering significance of the scale-independence of some Franciscan melanges in California, USA. In Proceedings of the 35th US Rock Mechanics Symposium, Reno, NV, USA, 5–7 June 1995; Daemen, J., Schultz, R., Eds.; Balkema: Rotterdam, The Netherlands, 1995; pp. 904–917. [Google Scholar]
  31. MWRPRC (Ministry of Water Resources of the People’s Repoblic of China). GB/T 50123-1999: Standard for Soil Tests Method; MWRPRC: Beijing, China, 1999. [Google Scholar]
  32. Wang, Y.; Li, X.; Zheng, B.; Zhang, B.; Wang, J.B. Real-time ultrasonic experiments and mechanical properties of soil and rock mixture during triaxial deformation. Géotech. Lett. 2015, 5, 281–286. [Google Scholar] [CrossRef]
  33. Guo, P.; Su, X. Shear strength, interparticle locking, and dilatancy of granular materials. Can. Geotech. J. 2007, 44, 579–591. [Google Scholar] [CrossRef]
  34. Mair, K.; Frye, K.M.; Marone, C. Influence of grain characteristics on the friction of granular shear zones. J. Geophys. Res. Solid Earth. 2002, 107, ECV 4-1–ECV 4-9. [Google Scholar] [CrossRef]
  35. Ahern, K. Image-Pro Plus (Media Cybermetics Company, MD, USA) Image-Pro Plus. Biotechnol. Softw. Internet J. 1998, 15, 10–15. [Google Scholar]
  36. Geometrical Product Specifications (GPS)—Surface Texture: Profile Method: Terms, Definitions and Surface Texture Parameters; ISO 4287:1997; ISO: Geneva, Switzerland, 1997.
  37. Sönmez, H.; Gokceoglu, C.; Tuncay, E.; Medley, E.; Nefeslioglu, H. Relationships between Volumetric Block Proportions and Overall UCS of a Volcanic Bimrock. Felsbau 2004, 22, 26–34. [Google Scholar]
  38. Lindquist, E.S. The Strength and Deformation of Melange. Ph.D. Thesis, University of California, Berkeley, CA, USA, 1994. [Google Scholar]
  39. Li, Z.Q.; Wang, W.; Shi, S.Q. A Test Method for Shear Strength of Landslide and Deformation of Shear Band. China Patent ZL2015103594909, 29 July 2017. [Google Scholar]
  40. Slatalla, N.; Alber, M.; Kahraman, S. Analyses of acoustic emission response of a fault breccia in uniaxial deformation. Bull. Eng. Geol. Environ. 2010, 69, 455–463. [Google Scholar] [CrossRef]
  41. Yamamoto, Y.; Springman, S. Axial compression stress path tests on artificial frozen soil samples in a triaxial device at temperatures just below 0 °C. Can. Geotech. J. 2014, 51, 1178–1195. [Google Scholar] [CrossRef]
  42. Ketcham, R.; Carlson, W. Acquisition, optimization and interpretation of X-ray computed tomographic imagery: Applications to the geosciences. Comput. Geosci. 2001, 27, 381–400. [Google Scholar] [CrossRef]
  43. Lei, X.L.; Kusunose, K.; Rao, M.V.M.S.; Nishizawa, O.; Satoh, T. Quasi-static fault growth and cracking in homogeneous brittle rock under triaxial compression using acoustic emission monitoring. J. Geophys. Res. Solid Earth. 2000, 105, 6127–6139. [Google Scholar] [CrossRef]
  44. Manthei, G. Characterization of Acoustic Emission Sources in a Rock Salt Specimen under Triaxial Compression. Bull. Seismol. Soc. Am. 2005, 95, 1674–1700. [Google Scholar] [CrossRef]
  45. ISRM. Suggested Methods for Determining Tensile Strength of Rock Materials. Int. J. Rock Mech. Min. Sci. Geomech. Abstr. 1978, 15, 99–103. [Google Scholar] [CrossRef]
Figure 1. Materials: (a) soil and rock block particles; (b) surface morphology of rock blocks; (c) profile offset distance of rock blocks; (d) particle distributions.
Applsci 11 00461 g001
Figure 2. Fabricated samples: (a) cylindrical frozen soil–rock mixture sample; (b) cylindrical ice–rock mixture sample for compression testing; (c) disk soil–rock mixture samples for Brazilian testing; (d) disk ice–rock mixture sample for Brazilian testing.
Applsci 11 00461 g002
Figure 3. The testing apparatus and method: (a) uniaxial compression test; (b) sketch of the testing system; (c) thermometer probe; (d) Brazilian test.
Applsci 11 00461 g003
Figure 4. Testing system: (a) acoustic emission (AE) system; (b) ultrasonic plus velocity (UPV) system.
Applsci 11 00461 g004
Figure 5. Failure patterns of frozen soil–rock mixtures (FSRMs) under uniaxial compression: (a) stress-strain curves; (b) failure pattern of the FSRM at –10 °C; (c) failure pattern of the FSRM at –20 °C; (d) failure pattern of the FSRM at –30 °C; (e) rock block fragments in the internal crack of the FSRM at –30 °C.
Applsci 11 00461 g005
Figure 6. Failure patterns of FSRMs under Brazilian testing: (a) radial force–displacement curves; (b) failure patterns; (c) the rock fragments in the tensile cracks; (d) fracture morphology of a rock fragment.
Applsci 11 00461 g006
Figure 7. AE characteristics of FSRMs: (a) uniaxial compression test; (b) Brazilian test.
Applsci 11 00461 g007
Figure 8. Relationship between the axial stress–strain and UPV.
Applsci 11 00461 g008
Figure 9. Stress–strain–UPV diagrams showing the different compression stages.
Applsci 11 00461 g009
Figure 10. Frozen soil–rock interface.
Applsci 11 00461 g010
Figure 11. The morphology of soil–rock interface (contact band) before and after freezing: (a) rough soil–rock interface (contact band); (b) smooth soil–rock interface.
Applsci 11 00461 g011
Figure 12. Relationship between the uniaxial compression strength (UCS) and the frozen temperature (a) ice–rock mixture; (b) soil–rock mixture.
Applsci 11 00461 g012
Figure 13. Relationship between indirect tension strength and frozen temperature (a) ice–rock mixture; (b) soil–rock mixture.
Applsci 11 00461 g013
Figure 14. The characteristics of cracks at the soil–rock interface and ice–rock interface: (a) smooth ice–rock interface crack; (b) rough ice–rock interface crack; (c) smooth soil–rock interface crack; (d) rough soil–rock interface crack.
Applsci 11 00461 g014
Figure 15. Three possible crack propagation types for FSRMs.
Applsci 11 00461 g015
Table 1. The strength parameters of the ice–rock mixture and frozen soil–rock mixtures (FSRM).
Ice–Rock
Mixture
Tσc (MPa)σt (MPa)FSRMTσc (MPa)σt (MPa)
(°C)SmoothRoughSmoothRough(°C)SmoothRoughSmoothRough
1−104.8676.4050.8431.281−103.3983.8980.7250.931
2−105.8256.3200.8771.3152−103.4693.9070.8440.872
3−106.1577.1160.9011.4013−103.8364.1090.7750.860
4−206.98810.6911.231.6464−205.9447.6841.5741.728
5−207.1659.7571.0031.6865−206.5007.6141.6311.778
6−207.0339.0951.071.5906−206.3806.9041.4851.959
7−308.70312.8711.5532.5367−309.15311.4622.1652.536
8−308.26613.3081.4772.4848−309.67411.8882.1762.556
9−309.05811.8991.3232.4589−309.71011.2372.3052.581
Note: σc, uniaxial compressive strength; σt, tensile strength; T, temperature.
Publisher’s Note: MDPI stays neutral with regard to jurisdictional claims in published maps and institutional affiliations.

