Article

Towards the Development of Rapid and Low-Cost Pathogen Detection Systems Using Microfluidic Technology and Optical Image Processing

1
School of Engineering and the Built Environment, Edinburgh Napier University, Edinburgh EH10 5DT, UK
2
School of Computing, Edinburgh Napier University, Edinburgh EH10 5DT, UK
*
Author to whom correspondence should be addressed.
Appl. Sci. 2020, 10(7), 2527; https://doi.org/10.3390/app10072527
Submission received: 29 February 2020 / Revised: 24 March 2020 / Accepted: 1 April 2020 / Published: 7 April 2020

Abstract

:
Waterborne pathogens affect all waters globally and proceed to be an ongoing concern. Previous methods for detection of pathogens consist of a high test time and a high sample consumption, but they are very expensive and require specialist operators. This study aims to develop a monitoring system capable of identifying waterborne pathogens with particular characteristics using a microfluidic device, optical imaging and a classification algorithm to provide low-cost and portable solutions. This paper investigates the detection of small size microbeads (1–5 µm) from a measured water sample by using a cost-effective microscopic camera and computational algorithms. Results provide areas of opportunities to decrease sample consumption, reduce testing time and minimize the use of expensive equipment.

1. Introduction

1.1. Water Borne Pathogen

Due to the increasing concern for water scarcity, it is expected that by 2025, half of the world’s population will endure ‘water-stressed’ areas [1]. This is due to climate change affecting both the developing and developed world. Already, 1.1 billion people lack access to clean water and 2.7 billion have a water shortage for at least one month of the year, exposing waterborne diseases such as cholera, typhoid fever and hepatitis A [2]. As a result, approximately 525,000 children under the age of five die annually from diarrhea diseases alone. According to the World Health Organization (WHO), lower respiratory infections and diarrheal diseases are the top two causes of deaths in low-income countries in 2016. From this, 11–20 million people get an illness due to typhoid fever, and 128,000–161,000 people die from this annually [2]. Typhoid fever is caused by the Enterobacteriaceae Salmonella Typhimurium, which typically is around 2–5 µm in size. In addition to this, the developed world suffers from pathogens such as Cryptosporidium, which can survive months within waters [3,4]. This particular pathogen causes gastrointestinal and respiratory illnesses, although the death rate is much lower than typhoid fever. Detection protocols such as the U.S. Environmental Protection Agency (EPA) method 1623.1 [5] stipulate a procedure for Cryptosporidium detection. This method consists of several steps involving filtration, elution, centrifugation, immuno-magnetic separation (IMS) and staining with fluorescent dyes, followed by microscopic examination for the manual identification and enumeration of oocysts.
Bridle [6] has previously established that research has been conducted to identify advances in obtaining results of waterborne pathogen movements. In compliance with WHO, waterborne pathogens have to be carefully monitored and analyzed to implement the safety of water intake. Considering this, microfluidic devices (a set of micro-channels etched into a material e.g., glass [7]) can take a very small sample and conduct a process to analyses the safety of water through an experimental monitoring method.

1.2. Microfluidic Technology

Newly introduced technology is continuously being miniaturized, hence the attractiveness of microfluidic devices. Microfluidic technology was introduced around 20 years ago and is maturing as a technology, despite the initial lack of success on the market [8,9]. The device was influenced from microelectronic chips; however, the use and analysis of fluid movement was changed from the use of pathways for electrons. Microfluidic devices accommodate more mixers and separators rather than transistors and other microelectronic hardware [10]. This increases microfluidics applications to be developed to perform in applications, such as drug testing in nanosystems, biochemistry immunoassay and gene sequencing etc., to proceed at a faster, cheaper rate, whilst decreasing the sample and reagent consumptions [11]. From these benefits, other applications use the devices to provide aid in their success, such as cosmetic formulations, biology cell culture and energy plasma confinement [12]. The science behind microfluidic technology is to manipulate and control small levels of fluid from microliters (µL) to picoliters (pL) within small micrometer channels, allowing for the precision of experiments to be maximized and a higher probability of detection to be available. For the purpose of this paper, the main focus will be to detect and monitor ‘acting’ pathogens via a smart designed system. In the past few years, microfluidic systems have been intensely researched to advance applications in the fields of chemistry, biology, genomics, proteomics, pharmaceuticals, biodefense [13] emerging as a powerful useful technology. Large processes that once were carried out in bulky, slow, expensive equipment are now processed on a single miniaturized chip. Microfluidic chips are purposely designed to monitor the movement of cells, pathogens or nanoparticles within the microchannels, allowing easy detection and removal methods under controlled conditions. In addition, microchannels typically have a width of 100–800 µm which allows advantages of sample consumption to be reduced, whilst also increasing the speed of results. This allows increasing efficiency and an inexpensive process [12,13].

1.3. Microfluidic Flow Cytometry

Microfluidic flow cytometers techniques are one of the most powerful approaches for a high resolution of cell analysis. This technique was developed from a traditional flow cytometer, which aids in biological applications and clinic research [14]. Flow cytometers are popular due to the ability to sort, count and detect individual cells, while also measuring scientific characteristics and the handling of cell populations [14,15]. However, flow cytometers do not effectively detect particles and cells smaller than 0.5 µm in diameter via light scattering [16]. Light scattering manipulates singles out pathogens based on size and shape. Microfluidic flow cytometry technique aims to process a sample by 3 stages: external pumping force of the sample, focusing of particles within the sample and sorting of particles by separation. This allows particles to be manipulated and analyzed faster, whilst being less expensive than a conventional flow cytometer [17,18]. The limitations of a microfluidic flow cytometer are that, due to a small flow rate of the external pump force, it will consist of a non-steady flow, which contributes to installing extra fabrication steps and limited range of flow rate, increasing the production cost [19].
In addition, optical detection within activated flow cytometry for particle detection is well advanced for microfluidic techniques. For instance, fluorescent dye is the most common optical detection technique due to its high sensitivity, which illuminates targets within samples under a specific wavelength of a light source [6]. This allows reflection of the particle to be transmitted and detected from the optical point of a microscope. The development and integration of different controlling units (e.g., pumps, valves and switches) into microfluidic devices are challenging for an automated process. This is due to the response time needed to redirect the particles into the desired output channels [18]. New advances for optical detection and the separation of cells or particles in the modern flow cytometer defeat these drawbacks and reduce the bulkiness of the system. Integrating optical fibers and waveguides to within the device around the microfluidic channels allows results to be optimized and analyzed without the use of a microscope or camera, as Lin et al. [19] proved with the detection of Phalaenopsis pathogens using optical fibres.

2. Sample Preparation

2.1. Methodology

To monitor the movement of a waterborne pathogen, a micro-pump (The Aladdin single-syringe infusion) drives a sample of 3 mL through a microfluidic device. To simulate the movement of a pathogen inside the microfluidic channel, a polymer fluorescent green microsphere beads are used with a range size of 1–5 µm.
A USB microscopic camera (The Dino-Lite AM4515T8 Edge 700x~900) was set up and positioned at a perspective angle. The camera emits an ultraviolet light source, causing the fluorescent microspheres to reflect to the camera. As shown in Figure 1a, the camera was secured in a position using a clamp to obtain a perspective view of the microfluidic device. The camera’s focus point was altered to output a clear view of the microfluidic channels on the software. Five hundred micrograms of polymer fluorescent green microspheres were diluted and mixed into a 50 mL test tube containing clean fluid (Propane-2-Ol, “IPA”). This allowed the sample to be withdrawn easily with the use of a BD Plastipak 3 mL max syringe. The tubing was connected to the input port of the microfluidic device. Tubes were connected to the output ports of the microfluidic device to release the wastage processed. These green polymer beads are used in this paper because they have the same size and the same color as the waterborne pathogen: Cryptosporidium. Figure 1b shows an image of a microbead inside the microfluidic channel.
The tests were performed in the lab with controlled ventilation. The temperature was set to an ambient room temperature of 22 degrees Celsius, and the humidity was measured for an indoor level of 43%. These two parameters of ambient temperature and relative humidity can affect optical image quality taken by the camera and can also affect the fluid movement inside the channel, as the microfluidic is made from a clear plastic.

2.2. Velocity Tests

Velocity tests of microbeads have been carried out in this research to study the movement of beads inside the microfluidic channel. The micro-pump injected the sample at a controlled flow rate through the microchannel of a custom designed microfluidic chip via capillary tubes. Velocity measurements will help to identify the limitation of this type of microscopic camera in terms of the minimum frames per second needed for this application with a selective flow rate. This is important, as lower frame rates can result in choppy or a broken movement.
Flow rates were tested from 5–235 µL/min (in increments of 10 µL/min) to find the most probable flow paths for a pathogen cell. Videos from the camera stored the movement of the fluorescent bead within the microchannel at a rated flow rate in increments of 30 µL/min. A highlighted bead expresses the motion of which it travels at a specific flow rate. Flow rates between 5–35 µL/min resulted in no movement of particles therefore were not included. The movement is processed from the images using Matlab, allowing analysis of where most beads flow in terms of the 0.8 mm diameter channel, as shown in Figure 2.
In order to find the velocity of the fluorescent beads at different flow rates, a distance is fixed at 250 mm for all flow rates tested using the software provided by the camera, as shown in Figure 3, The general equation for finding speed is Equation (1), where v is the velocity, d is the distance and t is the time. The time is found using the video recorded by the Dino Lite camera—this is also highlighted in Figure 3.
v = d/t
An average time is recorded from multiple tests for microspheres travelling in 3 sections and these are inside, middle and outside, as described in Figure 4.

3. Results

3.1. Fluorescent Microspheres Detection

The main objective of this study is to monitor the movement of waterborne pathogen cells using a microscopic camera and a light source integrated into a microfluidic device. The micro-pump is configured at a very low flow rate of 45 µL/min, to investigate the possibility of detection. After the operating equipment is correctly configured, 500 µg of a solid bead powder is diluted into a 50 mL test tube containing clean fluid (Propane-2-Ol, “IPA”). This master sample is mixed using ultrasonic and steel ball merging to gain a homogeneous bead distribution. This allowed samples to be withdrawn easily, by extracting 5 µL from the master sample and added it into 10 mL and 100 mL of IPA. The first images are obtained using the method in Section 2.1 to produce a high reflection rate of fluorescent microspheres. Therefore, a diluting process is performed to receive more realistic images.
Figure 5a demonstrates the mass of fluorescent green beads within the master sample. Figure 5b shows image with diluted sample, which contains a less dense concentration of fluorescent beads. Therefore, a further dilution process is performed to result the image in Figure 5c, where only a very small concentration of beads are detected, expressing a more realistic result of pathogen movement.

3.2. Image Processing Using Computational Algorithm

The microsphere beads used in this research are inert, nontoxic and do not contaminate the device, so there is no requirement to move it to a dedicated biology laboratory. However, the manufacturer (Cospheric) does not specify the size distribution of the beads, hence the number of beads per milligram can vary (calculated with the given diameter range) between 1.2 × 10⁷ and 1.5 × 10⁹ (using ideal spheres and the material density 1.3 g/cc). This makes a measurement by volume and weight not suitable.
Different computational methods and algorithms for biological microscopic image analysis have demonstrated a comprehensive contribution for efficient and quantitative study of microorganism cells [20,21]. Experiments have been conducted in this paper to detect and quantify fluorescent microbeads (1–5 µm) in a measured sample of a clean water. Detailed steps are outlined as: (i) taking 2 µL of sample via micropipette; (ii) placing one drop on top of a microscopic glass slide; (iii) captureing an image of the full drop under microscopic camera; (iv) capturing zoomed images of the same drop frame by frame and finally (v) analyzing captured images by using computational algorithms using Matlab. The Circular Hough Transform (CHT) algorithm [22,23] based code in Matlab, is used to find circular/spherical shapes in the captured image as one frame of a drop, as discussed above. The CHT algorithm is used to mark/circle specific sized microbeads for quantification. CHT algorithm accuracy rate is affected by different parameters/factors, such as minimum and maximum radius of the target circular shape, object polarity in the sense of dark or bright, and computation method. The results using CHT algorithm are approximately 80%, as reported in Table 1.
Figure 6 shows resulting images of different iterations, which refer to the number of runs of the CHT algorithm applied in each image capture. First, the image is converted to grayscale, as color images are not giving a good segmentation. Then, minimum and maximum radius are defined as 1 and 600 pixels respectively. Finally, the object polarity is set to dark.

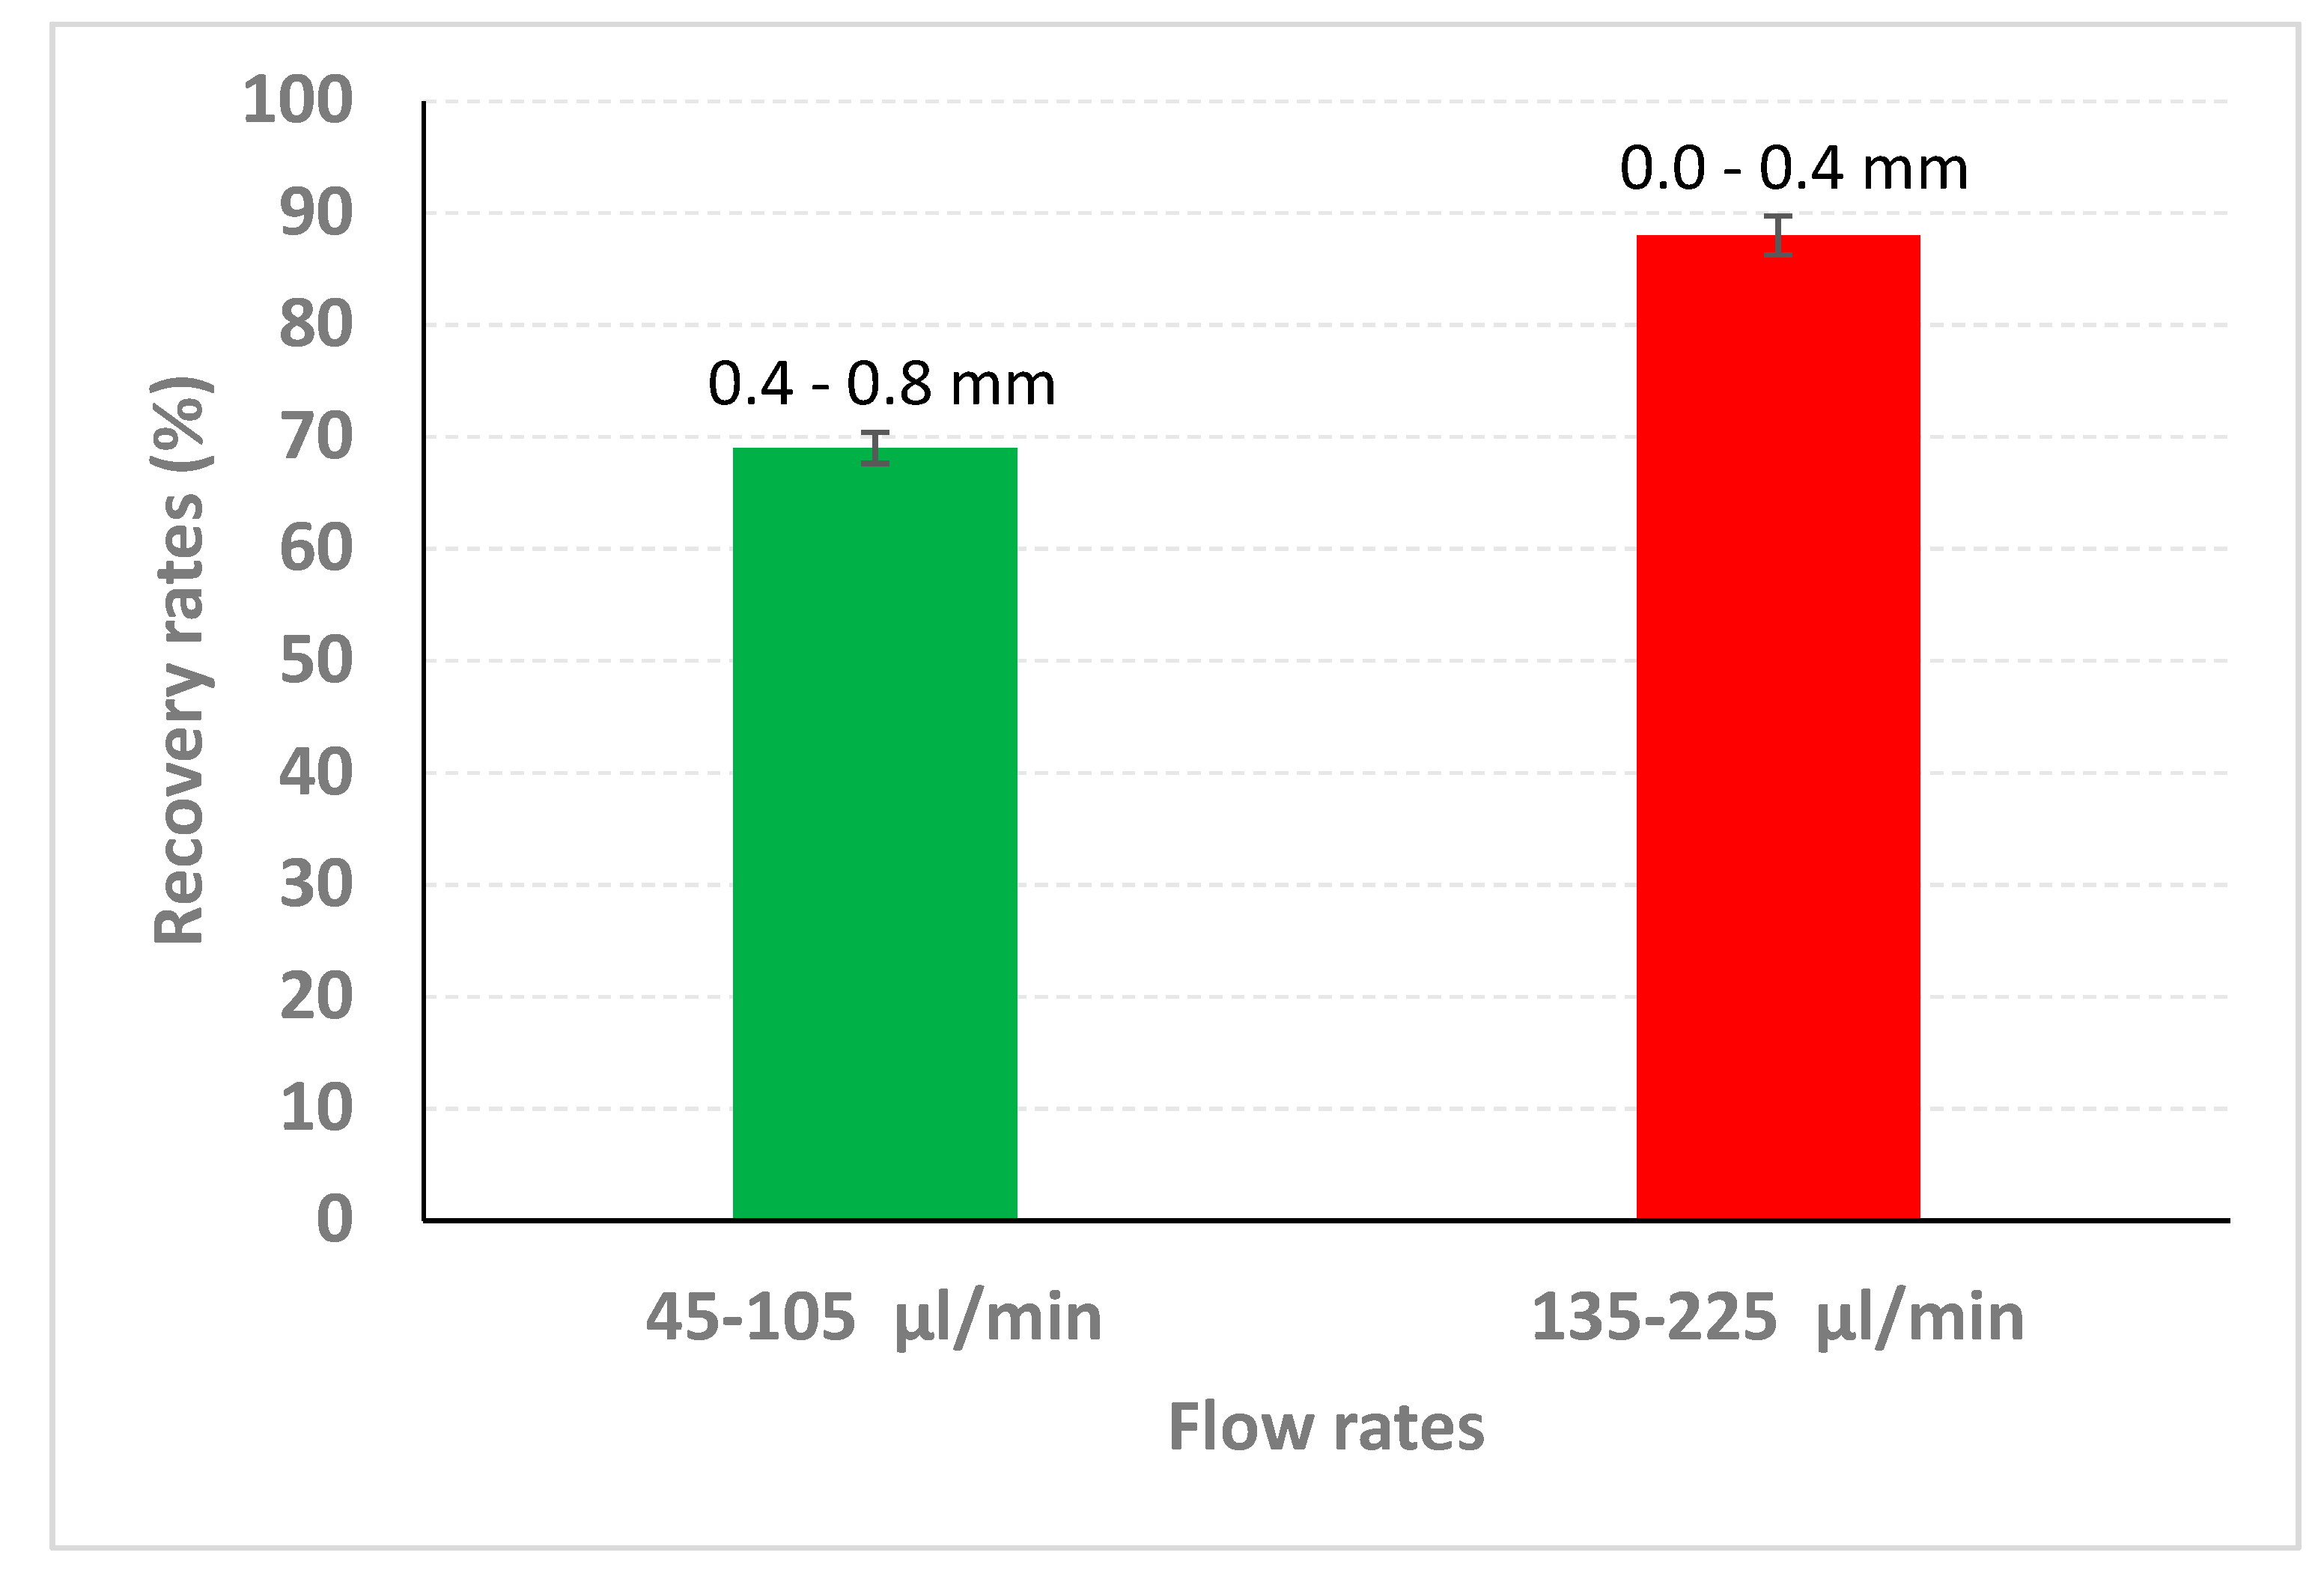
3.3. Microsphere Detection with Change of Flow Rate

Table 2 illustrates a sample of data collected in terms of number of beads over a fixed period of time (30 s). This time is fixed by Matlab to count the number of the total beads passed within the microfluidic channel, as shown in Figure 3. The data shown in Table 2 demonstrates an overview of the highest probable chances microspheres are going to travel inside the channel at specific flow rates. The evidence of the movement detection allows an analysis of where most beads flow in terms of the 0.8 mm diameter channel displayed in Table 2. The microfluidic channel diameter is then divided into two sections on Table 2 (outside to middle, middle to inside) to demonstrate where the bead is more likely to travel.
As it could be seen in Table 2, between the outside of the meander 0.8 mm to the middle sector at 0.4 mm, there is a higher probability that the bead will travel between the flow rates of 45–105 µL/min.
Figure 7 shows results from the data collected over three tests for each flow rate to determine the recovery rate, which is the number of beads detected in the region in question over the first 100 beads detected within the channel. As demonstrated in Figure 4, 69% of beads can be recovered from the sample between the outside of the meander 0.8 mm to the middle sector at 0.4 mm. On the other side, from the middle of the channel at 0.4 mm to the inside 0.0 mm the probability that the bead will flow between these points is at the flow rate between 135–225 µL/min. This provides a recovery rate of 88%, conveying that the increase of flow rate increases the consistency of where the microsphere will travel. However, this will not allow an easy detection, as the bead’s velocity will increase too, as explained in Section 3.4.
From these results, fabrication of a microchannel can be inserted for the pathogen to be removed from the sample. Being able to do this will allow microfluidic technology to essentially replace most filtration methods used to remove waterborne pathogen such as EPA Cryptosporidium detection method [5].

3.4. Velocity Measurements

As this method detects the movement of a fluorescent bead, it allowed further testing to find a single flow rate, where a pathogen cell will consistently flow on the same path. This provides an opportunity to locate the pathogen within the sample, which helps with placing the camera at the right position for detection. The microfluidic channel diameter is divided into three sections to demonstrate where the bead is more likely to travel, as shown in Figure 4.
Figure 8 illustrates the average velocity of the microsphere travelling at the representing flow rate within the microchannel. Results demonstrate that the gradual increase of flow rate up to 145 μL/min slightly increases the velocity of the microsphere. However, after this flow rate, the velocity of the beads increased significantly in all three parts of the microfluidic channel. This is due to the extremely high velocity of the microsphere that is unable to be detected by the camera—and only some ‘slower’ microspheres could be detected as altering the average velocity.

4. Discussion and Conclusions

This research aims to design a smart monitoring system to detect a waterborne pathogen cell using microfluidic technology and a cost-effective microscopic camera. The sample was driven through the designed microfluidic channel at a selected flow rate on a micro-pump. The pathogen movement was tracked by a high-quality camera at a perspective angle. With repeated experiments and alterations of the input flow rate, the output is hypothesized to find a consistent ‘track line’ that the pathogen travels within the channel, so a separation channel can be fabricated to separate the pathogen from the sample.
The prominent challenges for the pathogen detection methods in practice are: (i) physical characteristics of different groups of pathogens, (ii) large volume of water containing low concentration of target pathogens and (iii) sample preparation protocols. The key advantages for the results delivered by this new method allows sample consumption to be decreased, the reduction of testing time and reducing the use of expensive equipment, providing an attractive cost. This will benefit existing methods such as Flow Cytometry and EPA Cryptosporidium detection approach by replacing procedures with a less complicated process that does not need specialized persons to operate. This method provides new possibilities for further analysis and research to improve results on finding precise intersection points for high recovery rates of waterborne pathogens with different sizes such as Giardia or Escherichia coli (E. coli). This provides vital intersection points for a microchannel to be fabricated to remove the waterborne pathogen.
A key objective for this paper is to investigate the design of an intersection point on the microchannel to separate the waterborne pathogen. To achieve this, the micro pump flow rates were changed slightly to find a consistent path of which the microsphere will travel. Figure 3 displays the movement of microspheres around a meander. This gives a general observation that the slower the flow rate is (45 µL/min), the microsphere movement is towards the outside of the microchannel. Comparing this to 225 µL/min flow rate, it portrays that the movement of the microsphere is on the inside of the microchannel. From the videos taken by the camera, Table 2 gathered data from the movement of the microsphere. This shows that, at slower flow rates of 45–105 µL/min, the microsphere has a higher probability of 69% to be recovered at 0.4–0.8 mm of the microchannel. Whereas at faster flow rates of 135– 225 µL/min, the recovery rate has a probability of 88% at 0.0–0.4 mm of the microchannel. However, as stated in Section 3.4, due to the fast velocities of microspheres at these flow rates, the detection became more difficult. This could slightly alter the probability rate of recovery, due to the possibility of some microspheres not been detected.
The detection accuracy of the beads with the CHT algorithm used in this paper can be improved using different platforms such as ImageJ or Python. The processed image of a full drop can be performed using sequential steps to study different parameters such as target object size, the distance between two objects and threshold.
Microfluidic chips can be manufactured using different types of materials such as PDMS (PolyDiMethylSiloxane), Silicon, Glass or PMMA (PolyMethylMethAcrylate). These materials can be investigated to improve the images taken by the camera in order to improve recovery rates. Alongside this, the system described in this paper can be reduced even more into a single automated unit, to be able to optimize results that requires no manual intervention.
From all factors discussed in this paper, the idea of detecting movement of a waterborne pathogen using a cost-effective camera is very promising. This benefits engineering problems by minimizing the need for expensive laboratories and equipment to commence procedures on tackling waterborne pathogens.

Author Contributions

Conceptualization, A.K. and J.L.; methodology, A.K.; software, A.K. and I.M.; validation, A.K. and I.R.; formal analysis, A.K.; investigation, A.K; resources, A.K.; data curation, A.K.; writing—original draft preparation, A.K.; writing—review and editing, A.K.; visualization, A.K.; supervision, A.K.; project administration, A.K.; funding acquisition, A.K. and J.L. Please turn to the CRediT taxonomy for the term explanation. Authorship must be limited to those who have contributed substantially to the work reported. All authors have read and agreed to the published version of the manuscript.

Funding

This research received no external funding.

Acknowledgments

The authors would like to acknowledge the support from Helen Bridle, Heriot Watt University.

Conflicts of Interest

The authors declare no conflict of interest.

References

  1. World Health Organization (WHO). “Drinking Water”. 2018. Available online: https://www.who.int/topics/drinking_water/en/ (accessed on 29 February 2020).
  2. World Health Organization (WHO). “Top 10 Causes of Death”. 2018. Available online: https://www.who.int/news-room/fact-sheets/detail/the-top-10-causes-of-death (accessed on 29 February 2020).
  3. Cryptosporidium: Drinking Water Health Advisory. EPA-822-R-01-009. Available online: https://www.epa.gov/sites/production/files/2015-10/documents/cryptosporidium-report.pdf (accessed on 29 February 2020).
  4. Kerrouche, A. Megasonic sonication for cost-effective and automatable elution of cryptosporidium from filters and membranes. J. Microbiol. Methods 2015, 118, 123–127. [Google Scholar] [CrossRef] [PubMed] [Green Version]
  5. Method 1623.1, 2012. Method 1623.1: Cryptosporidium and Giardia in Water by Filtration/IMS/FA; Environmental Protection Agency: Washington, DC, USA, 2012. [Google Scholar]
  6. Bridle, H. Overview of Waterborne Pathogens, Waterborne Pathogens: Detection Methods and Applications, 1st ed.; Academic Press: Cambridge, MA, USA, 2014. [Google Scholar]
  7. Whitesides, G.M. The origins and the future of microfluidics. Nature 2006, 442, 368–373. [Google Scholar] [CrossRef] [PubMed]
  8. Tian, W.C.; Finehout, E. Microfluidic Diagnostic Systems for the Rapid Detection and Quantification of Pathogens, Microfluidics for Biological Applications; Springer: Boston, MA, USA, 2008. [Google Scholar]
  9. Ghosal, S. Microfluidics. In Encyclopaedia of Complexity and Systems Science; Meyers, R., Ed.; Springer: New York, NY, USA, 2009. [Google Scholar]
  10. Hansen, C.B.; Kerrouche, A.; Tatari, K.; Rasmussen, A.; Ryan, T.; Summersgill, P.; Desmulliez, M.P.Y.; Bridle, H.; Albrechtsen, H.J. Monitoring of drinking water quality using automated ATP quantification. J. Microbiol. Methods 2019, 165, 105713. [Google Scholar] [CrossRef] [PubMed]
  11. Chen, Q.L.; Cheung, K.L.; Kwan, Y.W.; Kong, S.K.; Ho, H.P. A centrifugal microfluidics platform for potential application on immobilization-free bead-based immunoassays. Appl. Mech. Mater. 2013, 289, 39–44. [Google Scholar] [CrossRef]
  12. Bridle, H.; Miller, B.; Desmulliez, M.P.Y. Application of microfluidics in waterborne pathogen monitoring: A review. Water Res. 2014, 55, 256–271. [Google Scholar] [CrossRef] [PubMed]
  13. Maxine, Y. A review of state-of-the-art microfluidic technologies for environmental applications: Detection and remediation. Glob. Chall. 2019, 3. [Google Scholar] [CrossRef] [Green Version]
  14. Gone, Y.; Na Fan, X.Y.; Bei, P.; Hai, J. New advances in microfluidic flow cytometry. Electrophoresis 2019, 40, 1212–1229. [Google Scholar]
  15. Lukes, J.R.; Hong, J. Flow Cytometer Lab-on-a-Chip Devices, Encyclopaedia of Microfluidics and Nanofluidics; Springer: New York, NY, USA, 2015. [Google Scholar]
  16. Wu, M.; Piccini, M.; Koh, C.Y.; Lam, K.S.; Singh, A.K. Single cell microRNA analysis using microfluidic flow cytometry. PLoS ONE 2013, 8. [Google Scholar] [CrossRef] [PubMed]
  17. Piyasena, M.E.; Graves, S.W. The intersection of flow cytometry with microfluidics and microfabrication. Lab Chip 2014, 14, 1044. [Google Scholar] [CrossRef] [PubMed] [Green Version]
  18. Ditterich, P.S.; Malik, F.; Schwille, P. Cytometry on Microfluidic Chips, Microfluidic Technologies for Miniaturized Analysis Systems; Springer: Dortmund, Germany, 2007; Chapter 14. [Google Scholar]
  19. Lin, C.L.; Chang, W.H.; Wang, C.H.; Lee, C.H.; Chen, T.Y.; Jan, F.J.; Lee, G.B. A microfluidic system integrated with buried optical fibers for detection of Phalaenopsis orchid pathogens. Biosens. Bioelectron. 2015. [Google Scholar] [CrossRef] [PubMed]
  20. Meijering, E.; Dzyubachyk, O.; Smal, I. Chapter nine—Methods for cell and particle tracking. Methods Enzymol. 2012, 504, 183–200. [Google Scholar] [CrossRef] [PubMed]
  21. Li, C.; Wang, K.; Xu, N. A survey for the applications of content-based microscopic image analysis in microorganism classification domains. Artif. Intell. Rev. 2019, 51, 577–646. [Google Scholar] [CrossRef]
  22. Kis, B. Counting Bacteria Colonies Based on Image Processing Methods. In Proceedings of the Medical Technologies Congress (TIPTEKNO), Selçuk, Turkey, 3–5 October 2019; pp. 1–4. [Google Scholar] [CrossRef]
  23. Bonteanu, P. A new pupil detection algorithm based on circular Hough transform approaches. In Proceedings of the IEEE 25th International Symposium for Design and Technology in Electronic Packaging, Cluj-Napoca, Romania, 23–26 October 2019; pp. 260–263. [Google Scholar] [CrossRef]
Figure 1. (a) The system setup includes a syringe pump and a USB camera with 500–900 times zoom; (b) image detection of the microbeads of 1–5 μm within the microfluidic channel.
Applsci 10 02527 g001
Figure 2. Detection of microsphere movement at 45 µL/min.
Applsci 10 02527 g002
Figure 3. Dino Lite 2.0 software with evidence of fixed distance of 250 mm and a time interval of when microsphere travels the distance.
Applsci 10 02527 g003
Figure 4. Drawing illustrates the three sections of the microfluidic channel.
Applsci 10 02527 g004
Figure 5. Diluting process images illustrated by (a--c).
Applsci 10 02527 g005
Figure 6. Original image and resulting images of different iterations, as shown in Table 1.
Applsci 10 02527 g006
Figure 7. Recovery rates within the microfluidic channel.
Applsci 10 02527 g007
Figure 8. Gradual increase of velocity for the microsphere travelling within the microfluidic channel with respect of flow rate increase.
Applsci 10 02527 g008
Table 1. Values of different parameters used during different iterations.
IterationminRadiusmaxRadiusSensitivityTotal CirclesTotal Beads Accuracy
11100.99212723853.36%
21300.99215323864.29%
31500.99216923871.01%
411000.99217023871.43%
516000.99219023879.83%
Table 2. Number of beads counted after 30 s. Terms of specific flow rates against specific areas of microfluidic channels at the same time for each test.
Diameter
(mm)
45
µL/min
75
µL/min
105
µL/min
135
µL/min
165
µL/min
195
µL/min
225
µL/min
0.7–0.82111010
0.6–0.70140101
0.5–0.61040000
0.4–0.52220000
0.3–0.41021211
0.2–0.30203001
0.1–0.20213110
0.0–0.10011243

