Article

An Integrated Algorithm for Intersection Queue Length Estimation Based on IoT in a Mixed Traffic Scenario

1
College of Automotive and Mechanical Engineering, Changsha University of Science & Technology, Changsha 410114, China
2
Hunan Key Laboratory of Smart Roadwasy and Cooperative Vehicle-Infrastructure Systems, Changsha University of Science & Technology, Changsha 410114, China
3
School of Electrical and Information Engineering, Changsha University of Science & Technology, Changsha 410114, China
*
Authors to whom correspondence should be addressed.
Appl. Sci. 2020, 10(6), 2078; https://doi.org/10.3390/app10062078
Submission received: 4 February 2020 / Revised: 6 March 2020 / Accepted: 12 March 2020 / Published: 19 March 2020
(This article belongs to the Special Issue Intelligent Transportation Systems: Beyond Intelligent Vehicles)

Abstract

:

Featured Application

The proposed algorithm and architecture has the capability of estimating the queue length of waiting vehicles at a signalized intersection, where traffic cameras, edge server, and some connected vehicles are available. This method can resolve the queue length estimation problem in a mixed traffic scenario, especially when there are variable types of vehicles. It can provide key information for traffic lights control and improve the traffic efficiency.

Abstract

Nowadays, traffic infrastructures and vehicles are connected through the network benefiting from the development of Internet of Things (IoT). Connected automated cars can provide some useful traffic information. An architecture and algorithm of mobile service computing are proposed for traffic state sensing by integration between IoT and transport system models (TSMs). The formation process of queue at this intersection is analyzed based on the state information of connected vehicles and the velocity of shockwave is calculated to predict queue length. The computing results can be delivered to the traffic information edge server. However, not all the vehicles are capable of connecting to the network and will affect the queue length estimation accuracy. At the same time, traffic cameras transmit the traffic image to the edge server and a deep neuron network (DNN) is constructed on the edge server to tackle the traffic image. It can recognize and classify the vehicles in the image but takes several seconds to work with the complex DNN. At last, the final queue length is determined according to the weight of the two computing results. The integrated result is delivered to the traffic light controller and traffic monitoring center cloud. It reveals that the estimation from DNN can compensate the estimation from shockwave when the penetration rate of connected vehicles is low. A testbed is built based on VISSIM, and the evaluation results demonstrate the availability and accuracy of the integrated queue length estimation algorithm.

1. Introduction

Intelligent transportation systems (ITS) show the ability to address the issues of traffic efficiency and safety. ITS is an indispensable part of the smart city [1]. To deploy ITS, more and more traffic infrastructures and cars need to be connected, which is a typical application of IoT [2]. Automated cars are equipped with many sensors for environment sensing. Benefiting from the development of vehicular network, information from sensors and fused sensors’ information can be utilized to ITS application. For example, traffic signal optimization at intersections is a promising application for ITS based on vehicular communication networks (vehicle-to-everything, V2X) communication [3,4] and intelligent camera, which can significantly reduce traffic congestion and emission [5]. The key to traffic signal optimization is traffic states sensing. Inductive loops and traffic cameras are used to evaluate the traffic states, such as queue length at intersections and traffic flow, while these equipments have disadvantages of high installation and maintenance cost and low service life [6]. With the development of V2X, the intelligent vehicle travelling on the road can act as a powerful mobile detector [7,8]. The intelligent vehicle with GPS can obtain the real time position and speed of the vehicle. This information can be collected to the TSMs and utilized to evaluate the traffic states such as delay time, queue length, etc. [9]. The traffic states can be exchanged among intelligent vehicles, transport infrastructure, and road users, which is a typical application of IoT-based transportation system [10].
Utilizing connected vehicles to sense the traffic states depends on service computing. Service computing has been utilized in many applications with the development of the network. It defines a unified structure of service combined with the computer network [11]. Benefiting from the IoT, the infrastructures in ITS are connected and intelligent. It seems that the connected vehicles can provide some service for traffic states sensing when travelling on the road [11]. The connected vehicle can act as a mobile traffic information sensor [12,13]. In a mixed traffic scenario, the information from connected vehicle is used in delicate traffic models to estimate the traffic volume at the intersection [14].
The vehicles’ queue length and delay are the most important indicators for traffic signal control in signalized intersection. There are some traditional approaches to queue estimation and delay at signalized intersections, such as the Webster theory and highway capacity manual (HCM) method. They are still the fundamentals and used in the handbook for the traffic signal design and optimization [15]. It reveals that Webster theory cannot be used when the degree of saturation approaches one, while HCM method can be used under near saturation and over saturation conditions [16]. Both Webster theory and HCM method are based on statistical data and empirical models. With the development of artificial intelligence (AI), some researchers compared the performance of Webster theory, HCM method, and AI-based model [17] and the AI-based model showed more robustness and adaptiveness than the traditional approaches.
A probability distribution method based on mathematical statistics was developed to estimate the queue length by utilizing the last connected vehicle’s position in the queue, waiting time, and number of connected vehicles [18,19]. What is more, the arrival rate of vehicles at the intersection is defined and valuated, as well as the penetration rate of connected vehicles. Most existing queue length estimation models can only be applied for an unsaturated scenario at isolated intersections and need to determine the connected vehicles penetration rate in advance [20]. In order to improve the communication efficiency of V2X, a mechanism that can reduce transmission times without affecting accuracy of length estimation is proposed [21]. This mechanism allocates the priority of information transmission to vehicles near the end of the motorcade and makes other vehicles near the stop line stop transmission. When the adjacent intersection is far away or the motorcade is a mixed traffic flow, the model cannot predict queue length. Coinciding with the basic idea proposed in [19], the number of vehicles is used to predict the queue length. An improved interpolation algorithm is designed to evaluate the estimation results at different penetration rates [22]. The results revealed that a low penetration rate would lead to large prediction error. To explore the relationship between the connected vehicle penetration rate and prediction accuracy, an algorithm about finding the minimum penetration rate is designed in [23,24]. It concluded that the minimum penetration rate that can ensure the estimation accuracy was 1%. In the practical application, more factors impose on the estimation accuracy, especially the vehicle type, which leads to relative error. The camera-based model is capable of remedying this disadvantage.
Image and vision-based traffic monitoring is widely used benefiting from the development of embedding and computer technology [25]. The vehicle recognition algorithm and typical sample data set are developed in these works. It is relatively difficult to deal with the images. Recently, lots of powerful neural networks are introduced by scholars and engineers to deal with the images due to the improvement of artificial intelligence. Deep learning using DNN has latterly shown encouraging fitness in object detection and image classification [26]. Deep learning DNN is used to monitor traffic in ITS applications [25,27]. Deep neural network has the ability of abstracting many characters from the image. A feature extraction algorithm about traffic flow is designed to recognize the appearance-based characteristics of traffic images by DNN in [28].
Nowadays, many traffic infrastructures and vehicles can be accessed to the network and communicate useful information. Infrastructures and vehicles are connected to the road network that share information between each other. The framework has improved greatly with the development of IoT [29]. Collection and dissemination of traffic information, management and monitoring of traffic flow have been investigated widely based on the application of IoT in the transportation system [30].
Many traffic states including traffic flow, jamming, queuing length at intersections can be collected, abstracted, and fused through the connected traffic infrastructures and vehicles. These traffic states are of great significance to traffic management and optimization. In this aspect, the development of connected vehicles and wireless technology has brought revolutionary changes, which makes the traffic information exchange convenient [31]. Benefiting from the development of embedded devices, the computing capability of the connected traffic infrastructures’ controller enhances greatly. Moreover, the cloud [32] and edge computing [33] can be used to serve the traffic states sensing. A framework of smart city with intelligent IoT, cloud, edge, and 5G is constructed to provide more efficiency and rationality [34]. It supports a variety of innovative applications and services.
There are some application cases based on IoT to serve for traffic. A predictive maintenance service is studied for connected cars based on IoT. The status of key parts and of the car as a whole are transmitted to the cloud and a predictive maintenance plan is given based on the current status, which will decrease the cost of maintenance and eliminate safety hazards if compared to a traditional periodical maintenance schedule [35]. Another useful application is parking service for connected cars based on IoT. A comprehensive review of smart parking research focused on distinguishing their functionalities and controversial issues is provided in [36]. The parking service is classified as an information collection system deployment and service dissemination tool, based on the information exchanged by means of the IoT. The authors of [36] reveal that the parking service needs lots of computing to complete the whole procedure. Thus, a central solution based on cloud is proposed. The always best connected and best served paradigm is proposed to develop a general middleware for an intelligent vehicle parking system based on cloud [37]. These works focus on the drivers’ side and always include competition for one parking space. An IoT-cloud car parking management system is developed based on location. The scheme aims to help administrative officers in locating parking violations quickly [38].
For the ease of algorithm validation for IoT-based traffic service, some simulators are developed. An integrated road traffic-network-cloud simulator for connected car services is designed, which links cloud simulation, road traffic, and network to display both the practical states of vehicles [39]. Moreover, a full-stack, cloud-based test bed is developed for connected car service experimentation. Heterogeneous sensors and vehicular communication and edge servers are integrated based on open application programming interfaces using microservices philosophy [40].
The service oriented ITS application has been accelerated by utilizing the connected car as a mobile IoT resource, together with service computing, edge computing, and 5G [31,41]. Distance headway, number of stops and speed are collected by connected vehicles and an integrated CVT-AI method is used to estimate the level of service on freeways [42]. It exposes that the accuracy of estimation is associated with the penetration rate of connected vehicles. Moreover, a comprehensive review gives a summary of road traffic density estimation methods based on vehicular ad hoc networks [43]. The infrastructure-based mechanisms mentioned in the paper belong to an IoT-based solution. As service platforms for smart cities, the deployment of connected cars and edge devices has been studied in many works [33,34].
In this paper, a general framework is proposed based on IoT in a mixed traffic scenario. All devices are connected through networks. By using the computing capacity of the IOT device, a variety of traffic information are sensed. Especially, the cars are not only traffic participants, but also act as a mobile traffic status service provider. The main contributions are summarized below:
(1)
A paradigm of service computing about traffic application in IoT-based scenario is firstly proposed. A case for queuing length estimation at traffic intersections is studied.
(2)
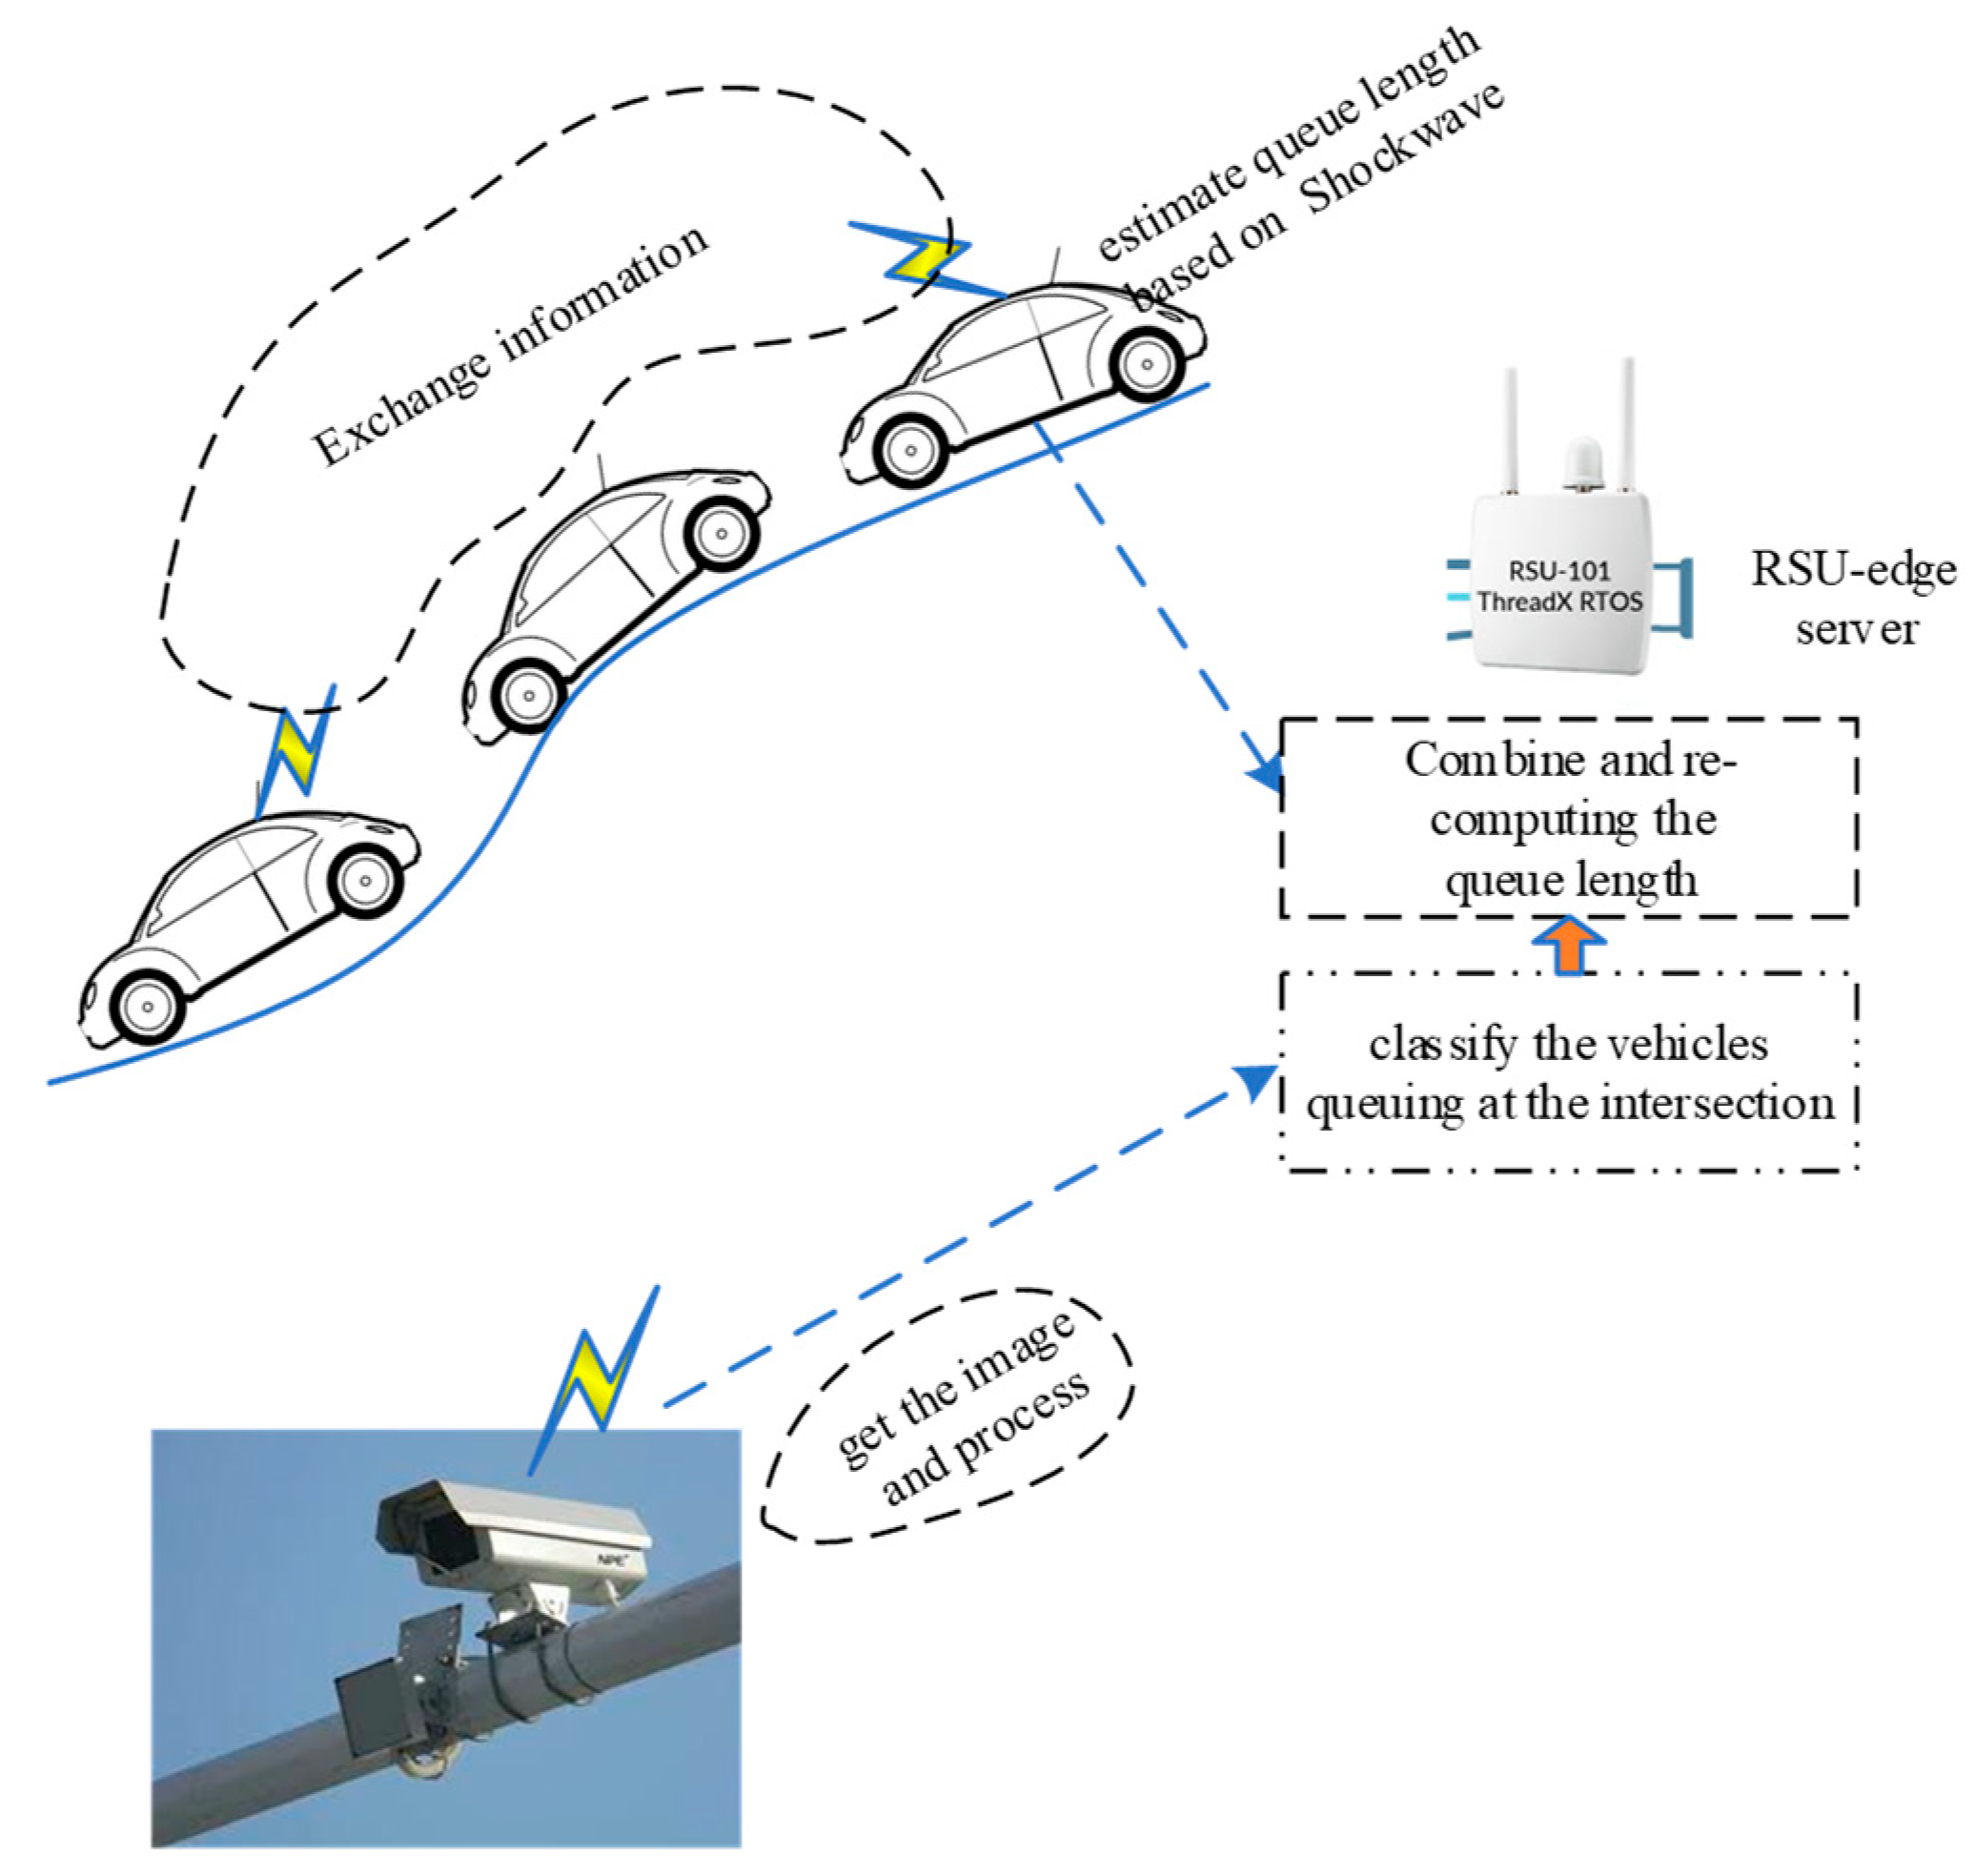
The connected cars provide computing service based on the shockwave model with considering the upstream intersection flow change in a cooperative manner.
(3)
A queue length estimation is realized with the aid of connected traffic cameras and edge server. A deep neural network is utilized to classify the queuing cars in the intersection.

2. Materials and Methods

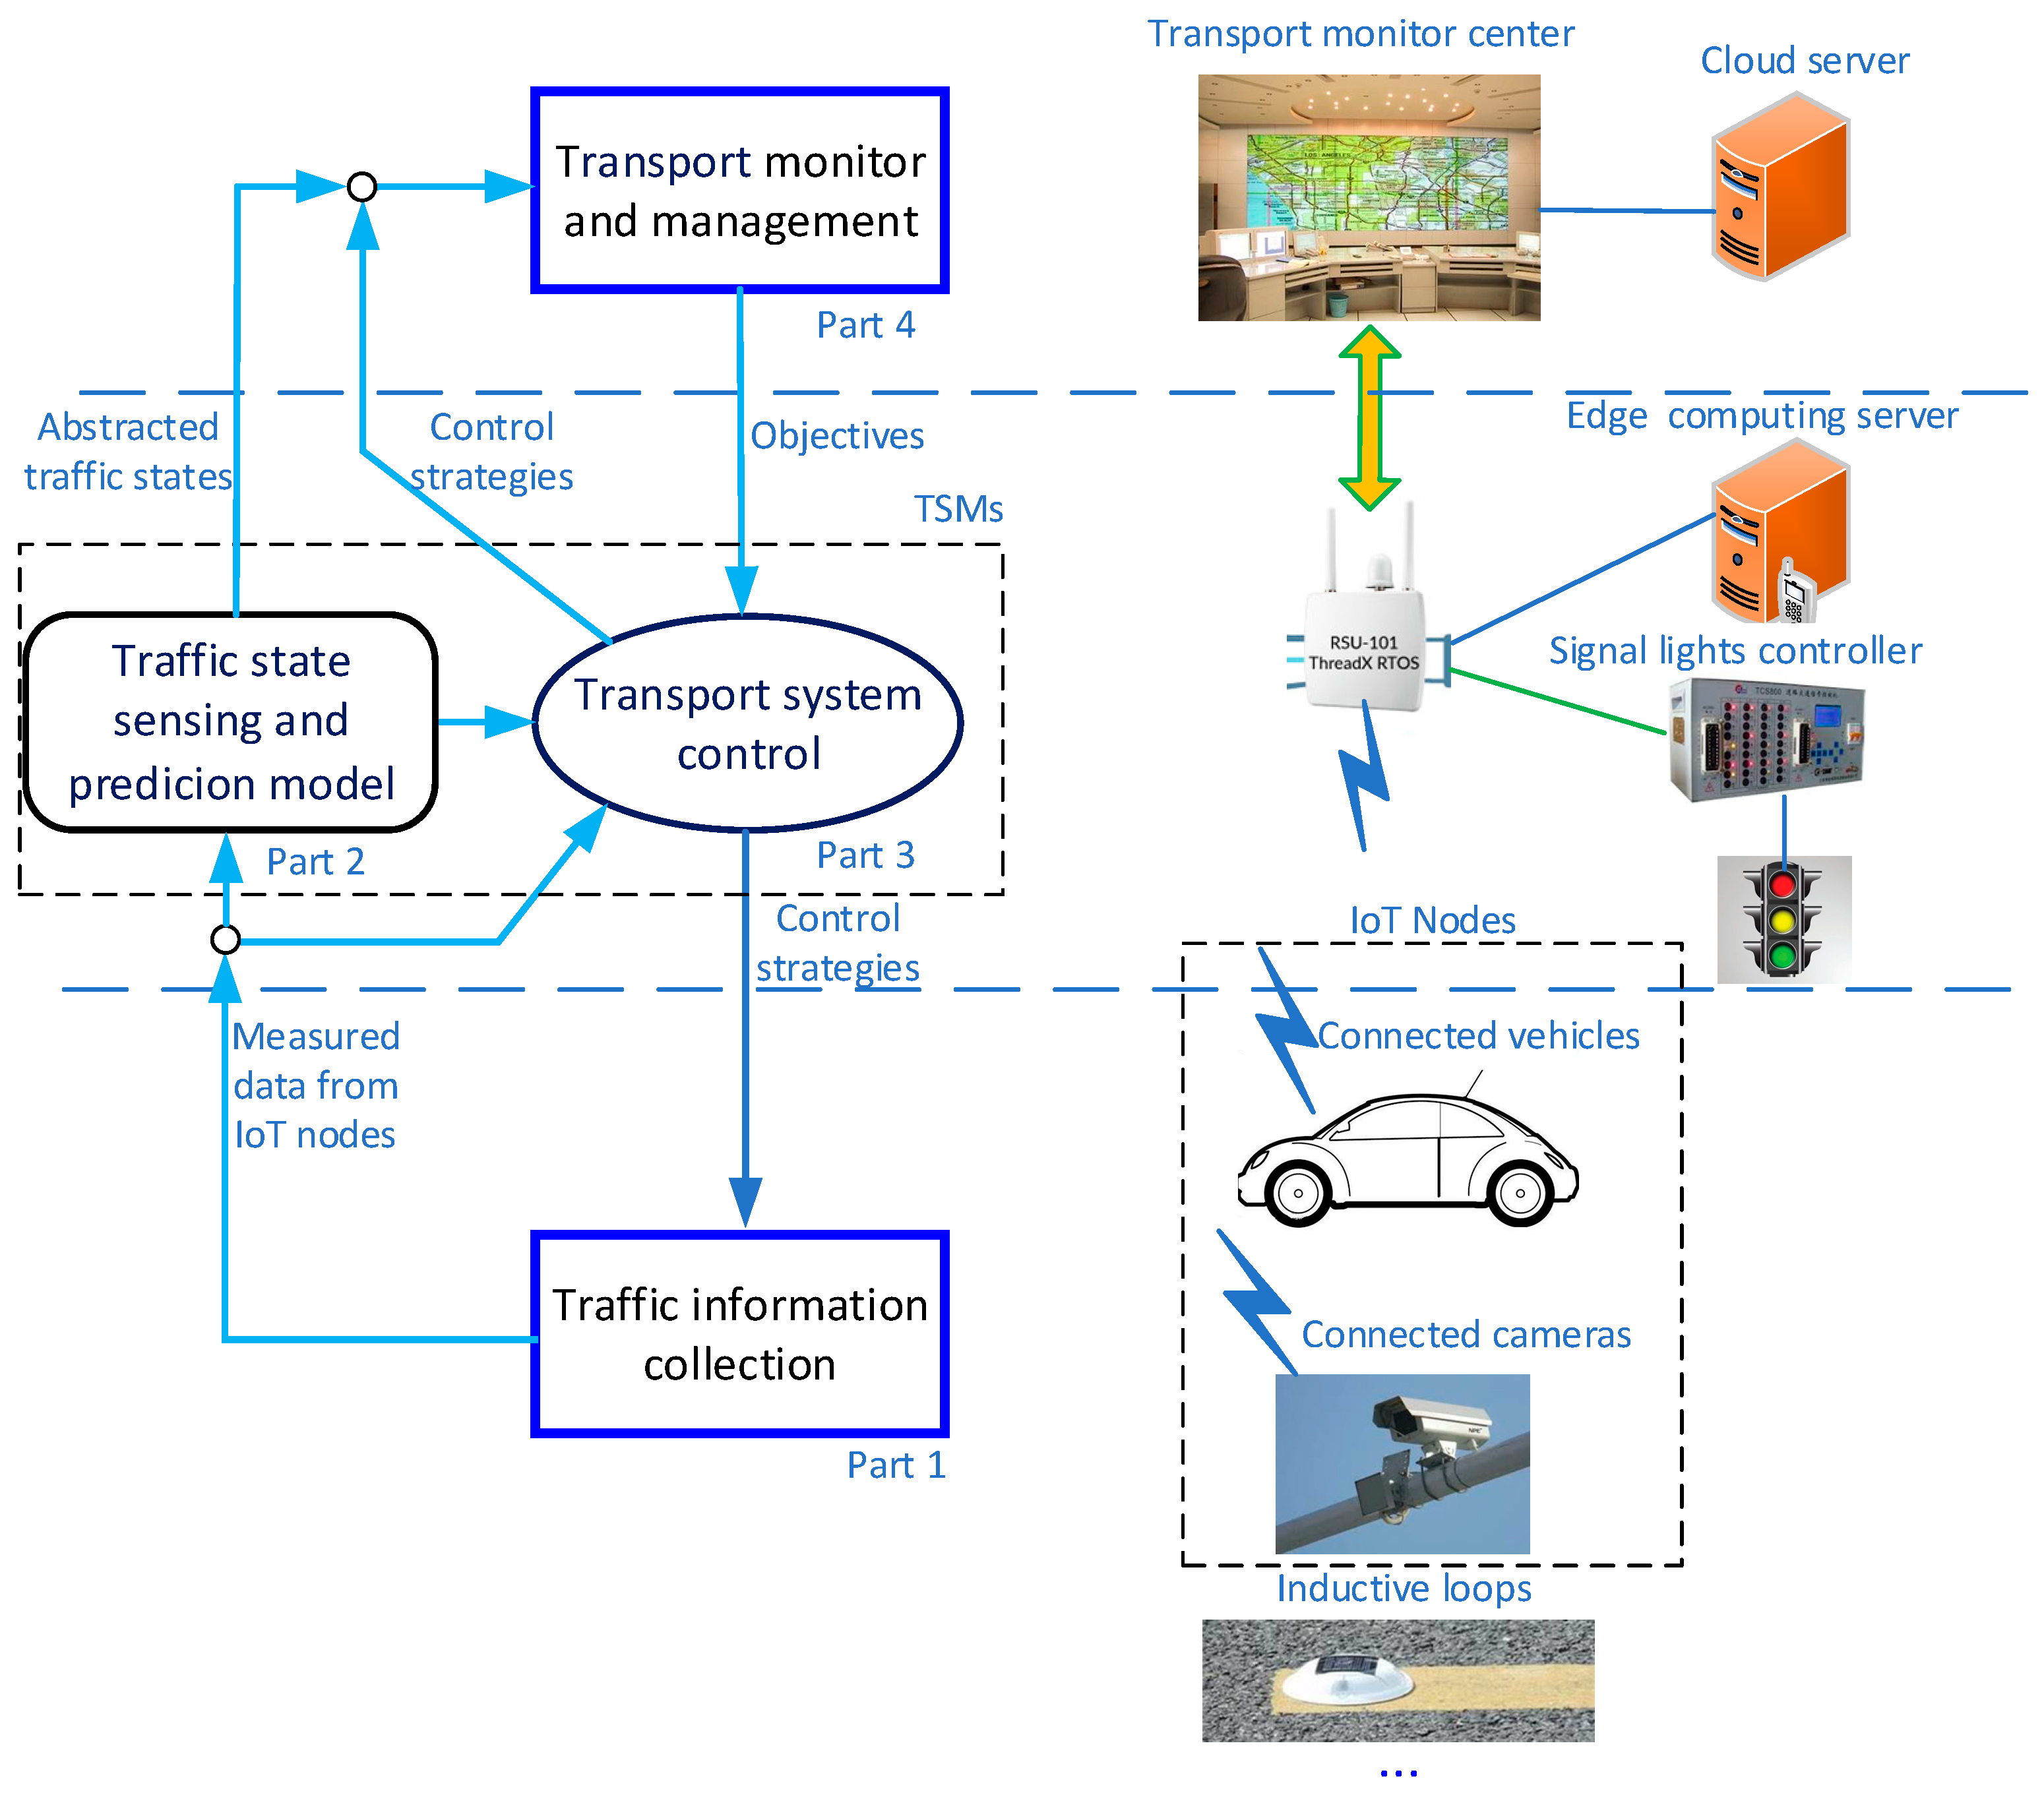
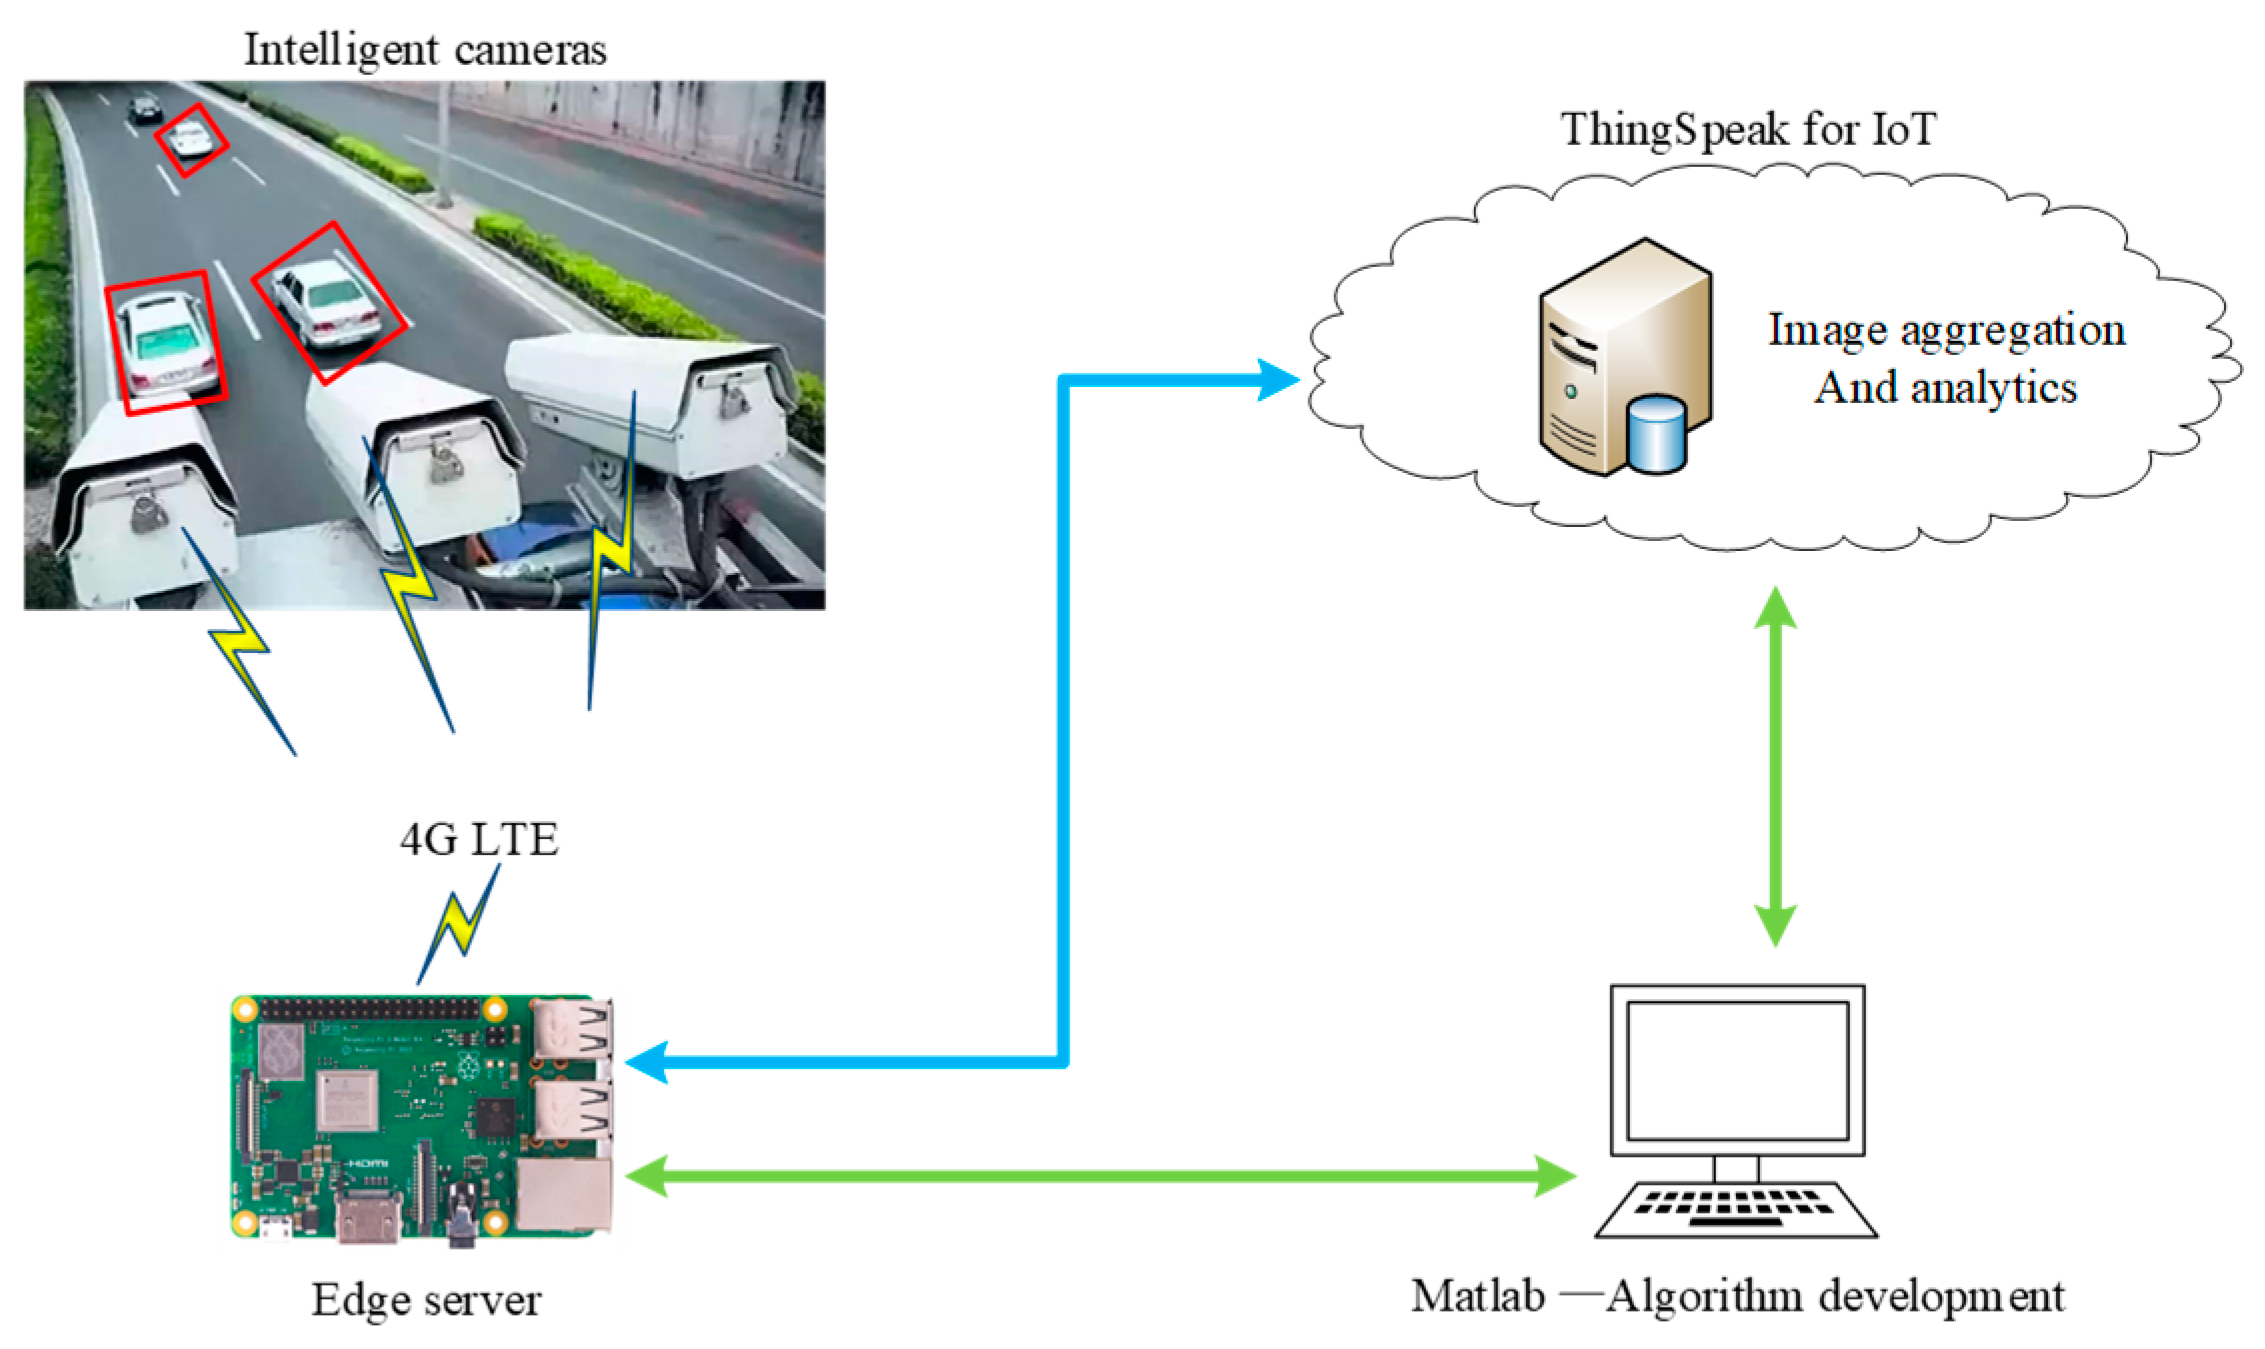
2.1. Architecture of Mobile Service Computing for Traffic Static Estimate in an IoT Scenario

Nowadays, information and communication technology (ICT) and intelligent control technology make great changes in the transportation system. Advanced technology including edge, cloud, V2X, and IoT is integrated into the transportation monitor and management. To address the operating mechanism of the proposed algorithm, a general and sustainable ITS architecture is shown as Figure 1 inspired by [44]. There are four parts in the proposed ITS architecture.
In Part 1—traffic information collection, the IoT nodes, including connected cars, inductive loops, and traffic cameras can be accessed into the network. Measured data including travelling speed, number of passing vehicles, pictures of waiting vehicles, etc. can be collected and sent to Part 2—traffic states sensing and prediction model in upper level. In Part 2, data from Part 1 is received and stored. Then, real time, as well as historical traffic information can be utilized in many models to evaluate and predict abstracted traffic states including volumes, queue length, travelling delay, etc. Then, these states about traffic are delivered to the transport system control center and transport monitor and management center to incorporate with the decision support system (DSS). In Part 3—transport system control and traffic light control algorithm are designed with the overall objectives from transport monitor and management center, sensing traffic states from Part 2, and basic information from Part 1. Usually, Part 3 will impose great influence on the behaviors of traffic participants [45,46] by adopting different control strategies. Part 2 and 3 can be treated as transport system models (TSMs) including sensing, prediction, and control. The high level of the ITS Part 4—transport monitor and management can get the whole information and set the objectives and constraints on Part 3. Many new developed models, algorithms, and equipment could be integrated in the architecture [47,48].
This paper works on Part 2 in the general ITS architecture from the perspective of IoT. It aims to develop a queue estimation algorithm working in the TSMs. IoT provides information as inputs for the queue estimation algorithm working in the TSMs. A mixed traffic scenario including connected vehicles and traditional vehicles is considered, which will be the general case in the near future. The objective of this paper is to develop an algorithm utilizing the information from Part 2. Connected vehicles travel on the road and process the data, which can provide mobile service for traffic states estimate based on the computing of the onboard embedded processor. The cameras installed at the signal intersection can acquire the images of vehicles in the queue periodically and transmit those back to the edge server. Cameras are connected to the edge server on the roadside by wired or wireless networks, and image processing is done in the edge server, which is set in Part 2. Characteristics of the traffic including congestion, violated traffic regulations, and plate numbers can be obtained accordingly.
From the view of server provider, all the connected devices in the traffic scenario can produce useful information or work with the edge server to complete more complex tasks. Service computing gives a unified information exchange and sharing mechanism in the IoT traffic scenario. Some useful traffic characteristics can be abstracted based on the information from IoT nodes, such as traffic flow and congestion, which is the key information to traffic management. Some traffic applications need the IoT nodes to work cooperatively. For example, traffic guidance needs the traffic state of a wide network of roads and exchanging information with roadside unit or other detection devices. The cloud server will give some advices based on the real time information. Moreover, the connected cars can collect much useful information while travelling on the road. The queue length estimate at the intersections can be used to regulate the signal lights timing and predict the traffic jam. In this paper, a case for queue length estimate is studied based on the combined result computed from connected cars, cameras, and edge server.

2.2. Queue Length Estimation Algorithm Design

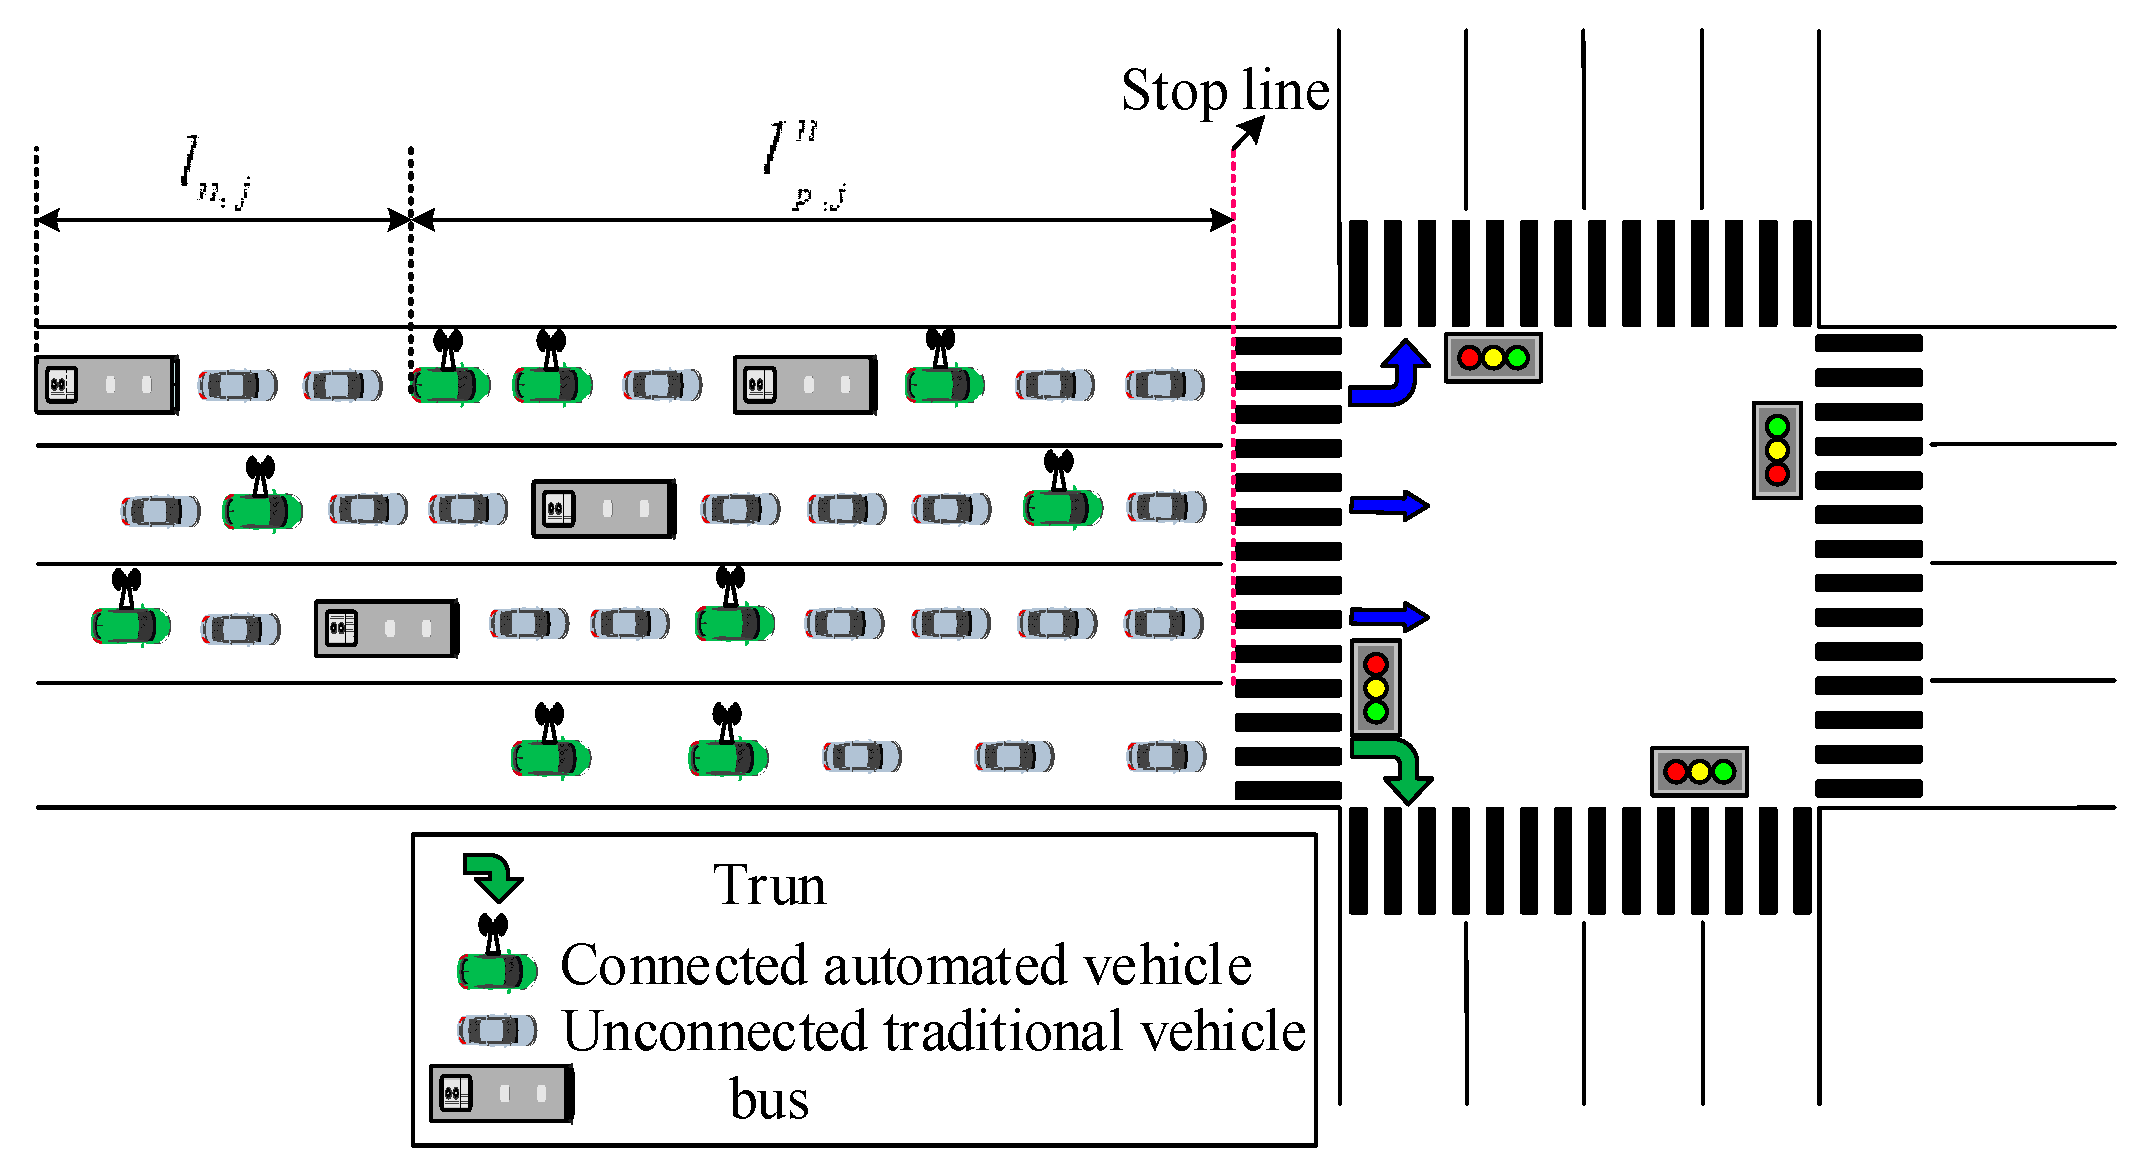
2.2.1. Basic Conditions

To address the application conditions, without losing generality, the queue length estimation method proposed in this paper requires the following basic conditions:
(1)
GPS and V2X modules are set on the automated vehicles, which can get and deliver the position and speed of vehicles. Nowadays, these modules are usually integrated in the automotive IoT module, such as modules supplied by Quectel corporation in China;
(2)
The edge computing server in the roadside units can accurately obtain the connected vehicle’s ID and location;
(3)
There is at least one connected vehicle in each entrance lane for a sample cycle;
(4)
The length of the vehicles is not assumed to be identical, which is an enormous challenge to V2X- based traffic states sensing in a mixed traffic scenario.
In our previous work, we proposed an algorithm for queue length estimation assuming that the length of vehicles is identical by converting according to the vehicle conversion coefficient [43]. Nowadays, connected automated vehicles are not very popular. Comparing with traditional unconnected vehicles, the number of connected vehicles is rather few. Therefore, it is more realistic to consider the queue prediction of all unconnected vehicles for some sample cycles. There are many types of vehicles with different lengths travelling on the road. For connected vehicles, the characters including length, ID, weight of the vehicle are stored in the memory on board and can be delivered to other vehicles and roadside unit (RSU). However, for the unconnected vehicles, it is very difficult to get this information. Some literature refers to utilizing inductive loops to tackle this situation. The prediction task is done by information fusion. However, it is much less feasible to use and in addition, these infrastructures are expensive. To overcome these problems, a framework of IoT-based algorithm is proposed, that is a camera and V2X-based shockwave model integration to estimate the queue length at the signalized intersection.
The task of queue length estimate based on IoT framework is achieved according to the following paradigm. As shown in Figure 2, queue length at the intersection is estimated based on computing results from the shockwave and image process. Some automated cars queuing at the intersection connect to the network through V2X, while traditional cars are not able to connect to the network. The connected car can provide computing service to estimate the queue length by exchanging information through V2X. Nevertheless, the system assumes that all the vehicles have the same dimension, which may not be the case in the actual situation. Thus, an image-based computing method is proposed to amend the result from V2X. It utilizes a DNN to classify the queuing vehicles in the image, and then calculates the queue length by counting and multiplying the length of every type. Suffering from the complex structure of DNN and the delivering delay from connected camera to the roadside unit, the queue length estimate result based on image usually takes a much longer time. Thus, these two methods are combined to estimate the queue length by the unified computing service framework. The computing details are shown in the following subsections.

2.2.2. Shockwave Estimation Model Based on V2X

In this section, we address the shockwave estimation model using information from connected automated vehicles. During the red-light period, the proposed model can compute the cumulative queue length of each entrance lane. Queuing vehicles are used to represent the vehicles that arrive at the intersection stop with speed reduced to zero. To estimate the queue length by means of connect vehicle sensing technology, the information including vehicle’s ID, location, and waiting time should be periodically broadcasted to RSU. In the traffic flow theorem, the vehicles form a queue at the stop line obeying Poisson distribution. The waiting queue passes back like a wave before the traffic lights turn green, which is defined as a shockwave.
As shown in Figure 3, n is the total number of connected vehicles in a lane. j is the number of lanes at a traffic crossing in the same direction. In Figure 3, the lane on the top is numbered j = 1. The lane on the bottom is numbered j = 4. For the no waiting lane, the queue length is zero. The shockwave velocity could be calculated according to Equation (1):
{ v n , j = 1 n 1 i = 1 n 1 l p , j n l p , j i t n , j t i , j ,   ( n > 1 , i = 1 , 2 , , n 1 ) v 1 , j = l p , j 1 t 1 , j t r , ( n = 1 )
where i (in) is the number of a connected vehicle to the stop line. vn,j represents the shockwave velocity. l p , j i (in) is denoted as the queue length before the connected vehicle numbered i in the lane j. ti,j (in) represents the stop time of the connected vehicle numbered i in the lane j. tr is denoted as the beginning time of a red light cycle. tf is denoted as the closing time of red-light cycle. Obviously, tr and tf are the same for every lane at the intersection.
As shown in Figure 3, there are traditional unconnected vehicles behind the last connected vehicle. The length of these vehicles ln,j can be calculated by Equation (2):
l n , j = v n , j ( t f t n , j )
Therefore, the queue length lj estimation model with considering shockwave in the entrance lane j at the signalize intersection can be represented by Equation (3):
l j = l p , j n + v n , j ( t f t n , j )
To regulate the signal light time aiming to optimize the traffic at the intersection, the value of queue length of every entrance can be calculated by taking the maximum value of lj. Usually, the value of lj is approximately equal, because it is natural that most of the drivers want to wait as little as possible and will stop at the shortest queue lane. Therefore, the queue length of the intersection is denoted as Equation (4), where m is the number of lanes except there is no stop turn right or turn left lane.
l = max { l j | j [ 1 , 2 , m ] }
In [43], the relationship about vehicle arrival and queue length is analyzed. In urban roads, adjacent intersections’ distance is usually short. The arrival rate at the downstream is related to the traffic volume of an adjacent upstream intersection. Therefore, a corrective coefficient r is utilized to remedy the effect of vehicle arrival rate, which is shown in Equation (5).
r = q k , k + 1 t k + 1 t k q k 1 , k t k t k 1
where k is used to number a connected vehicle that crosses the inductive loop at the upstream. qk,k+1 is denoted as the number of traditional vehicles between adjacent connected vehicles. tk represents the time of a connected vehicle numbered k that crosses the inductive loop. It reveals that the corrective coefficient r > 1 when the downstream arrival rate increases and vice versa. The queue length of lane j after corrective coefficient can be denoted as Equation (6):
l j = l p , j n + v n , j r ( t f t n , j )

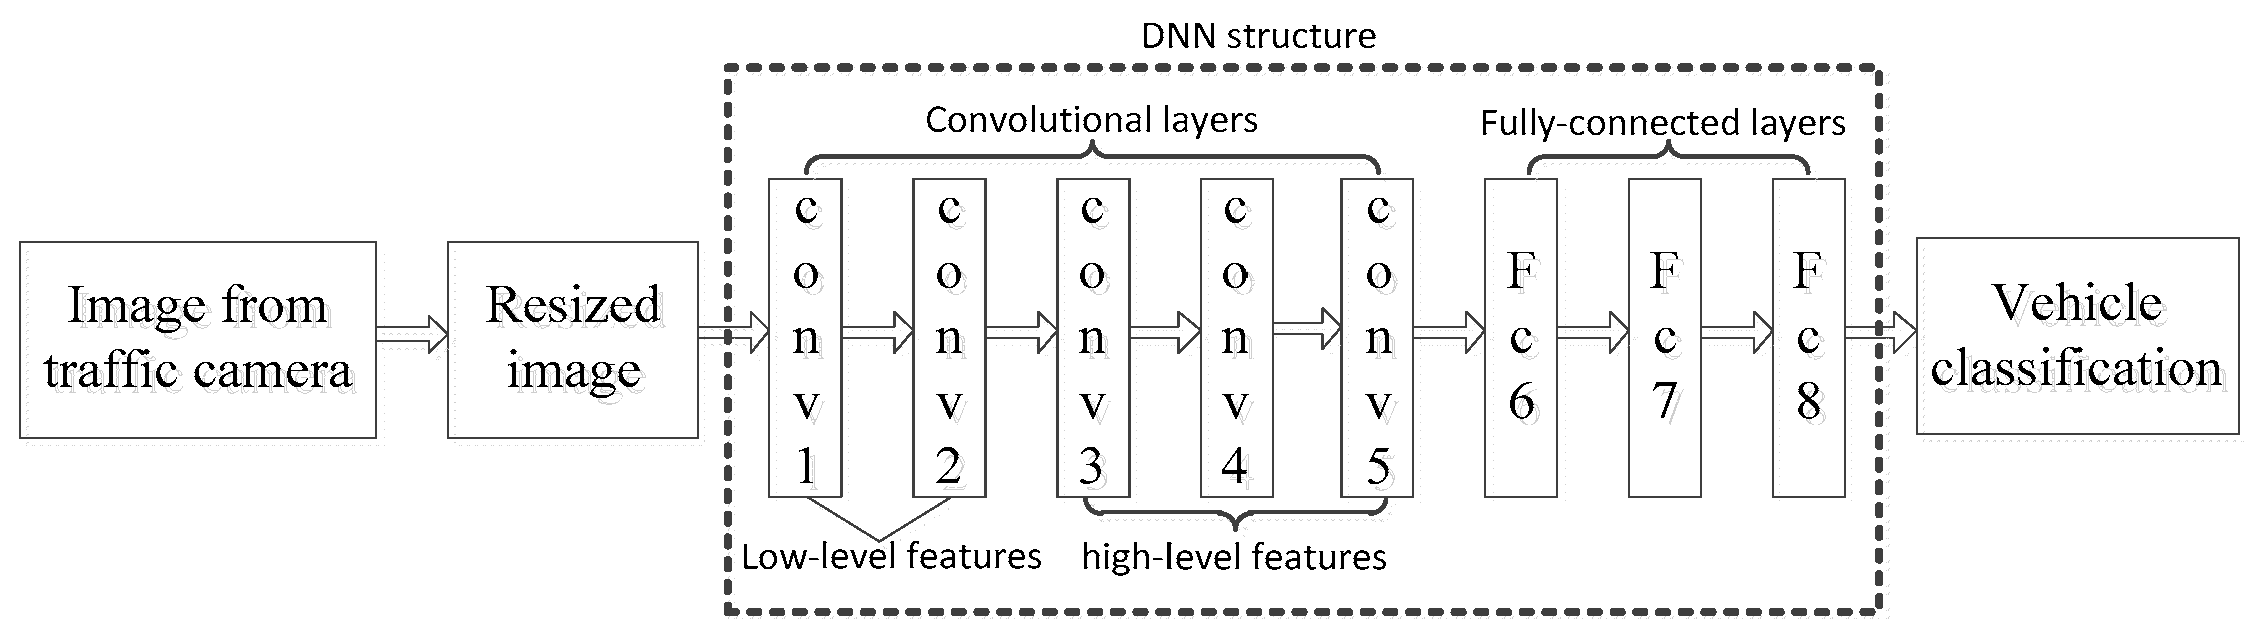
2.2.3. Deep Learning to Compute the Queue Length Based on Traffic Image

Standard traffic surveillance cameras setup at the intersection can get an image of the vehicles waiting behind the stop lines. Much research has been done to get rich information, including vehicle classification, vehicle characters, and vehicle numbers [25]. Counting the number of vehicles in the image is computationally expensive and hardware expensive. However, some simple works can be done to get basic information about the queue length. In this paper, we construct a DNN to classify the vehicles in the image.
The detection area is fixed and depends on the camera’s capability. It is also set as the area of connected vehicles using cooperative estimation by V2X. First, a series of image frames can be acquired by a traffic camera and sent to the signal light controller. A DNN is constructed to abstract the feathers of the image including the boundary of vehicles background. It does not need to get a high-resolution image to count the number of vehicles and the color or the plate number [27]. Through deep learning proposed in our paper, the vehicles in the images can be analyzed. The structure of DNN is similar to the one described in [49]. The input and output of DNN is designed according to our work.
A promising work has been done to detect and classify a vehicle by DNN [28]. The passenger vehicle including sedan, SUV, MPV, can be detected accurately, as well as the other vehicle including a van and bus. Intuitive and abstract features can be used to describe the vehicles despite the fact that length, shape, and color are different. The Alexnet model [50] is utilized to model DNN architecture, which is similar to the work in [49]. The DNN has five convolutional layers and three full connected layers. A 3D filter is linked to the prior layer’s outputs in the kernels of every convolutional layer. The image got by traffic cameras is resized to 256 × 256 and becomes the input to DNN. To alleviate the compute complexity and ensure it works in real time, the second last fully connected layer is used to extract the features of a vehicle according to the test results in [49]. Figure 4 shows the structure and function of DNN (Alexnet model) used in our work.
There are 4096 neurons in Fc6 and Fc7 layers and the feature vector of 4096 dimension is used to represent the traffic image. The features including the vehicle’s lane location and vehicle’s type can be described in the deep vector. Benefiting from the government’s management policy, a connected vehicle can be distinguished by the plate, which is also a deep feature. Then, the penetration rate can be calculated in the intersection controller in every phase. There are 10 neurons in the Fc8 layer. The low-level features including shapes, color, and length to the road bound are contained in the first few convolutional layers. The high-level features are utilized to describe the specific character of vehicle type, lane location, and congestion extent, which is contained in higher convolutional layers.
Figure 4 shows that there are many layers in DNN, and the traffic image processing takes a lot of the computer processor unit time. The DNN training work can be done offline based on the ImageNet Large Scale Visual Recognition challenge (ILSVRC) 2012 and images from ITS dataset. The real time online work of DNN takes several seconds to process the traffic image at intersections. The traffic flow has continuous spatial and temporal characters and will not change very fast. Therefore, DNN is used to revise the estimation value of a connected vehicle based on V2X in our work.
After training and fine tuning, the DNN is used to process the image from a traffic camera. It sets that DNN gets information from the images and classifies vehicles into several groups. If DNN gets queuing vehicles at the intersection, then it calculates the queue length as Equation (7):
l 2 ( t τ ) = i c k c L i c Q i c + ( m V 1 ) L 0
where l2 is a function of time t, representing the estimation of queue length from camera images. t is the time when the images are taken. τ is the time used by DNN to process the traffic images. kc is the total number of vehicle types. Lic is the length of this type of vehicle and Qic is the number of type ic vehicle in the image. L0 is the space between adjacent vehicles. mv is the sum of all vehicles in the traffic image and can be calculated by accumulation of Qic.

2.2.4. Weight Calculation of Combined Model

As shown in Figure 1, the queue length computing will be done in the cloud server. It depends on the results of connected vehicles and edge server. To take advantage of shockwave-based model and camera-based model, they are combined by a weight to remedy the error induced by different vehicles length and the error induced by calculation delay. A weight determined by a ratio of last connected vehicles’ stop time to the red-light period in this intersection is used to combine the shockwave-based model and camera-based model. The ratio is denoted as Equation (8), where ts is the stop time of the last connected vehicle. tf and tr is defined in Equations (1) and (2) in Section 2.2.2. Equation (8) implies that weight α is related to the queue length variety and the distribution condition of connected vehicles.
α = t s t r t f t r
Based on the models of shockwave and DNN, the queue length can be calculated by Equation (9):
L = α l + ( 1 α ) l 2
where L is the integrated queue length, l is the queue length estimation based on shockwave, which is defined in Equation (4). l2 is the queue length estimation based on DNN, which is defined in Equation (7).
In order to assess the accuracy of the proposed integrated queue length estimation model, performance indexes including absolute error AE defined as Equation (10) and relative error RE defined as Equation (11) are shown as follows:
A E = | L c * L c |
R E = | L c * L c | L c * × 100 %
where L c * is defined as the actual queue length measured at the intersection in a cycle c. Lc is defined as the estimation queue length determined by Equation (9) in a cycle c. The integrated vehicle queue length estimate algorithm depending on the combined computing model is summarized in Algorithm 1.
Algorithm 1 Queue Length Estimate Algorithm at Intersections
Input:l, the predicted queue length based on shockwave; l2, the predicted queue length from DNN based on image, defined by (7); α, the weight of shockwave model, defined by (8); vn,j, velocity of shockwave for the n-th connected vehilce in lane j; n is the number of connected vehicles in the queue; j is the number of lanes at the intersection; l p , j i , the queue length before the connected vehicle numbered i in the lane j; tf, the closing time of red light cycle; tr, the beginning time of a red light cycle; ti,j, the stop time of the connected vehicle numbered i in the lane j; k, the number of a connected vehicle that crossing the inductive loop at the upstream; kc, the total number of vehicle types; Lic, the length of type ic of vehicle; Qic, the number of type ic vehicle in the image; L0, the space between adjacent vehicles; mv, the sum of all vehicles in the traffic image; m, the number of lanes at the intersection.
Output:
1: L , queue length estimated by combined computing;
2: Algorithm begin:
3: Computing the queue length to estimate l based on shockwave, l = max { l j | j [ 1 , 2 , m ] }
4: where l j = l p , j n + v n , j r ( t f t n , j )
5: r = q k , k + 1 t k + 1 t k q k 1 , k t k t k 1
6: vnj can be calculated as follows,
7: if n == 1 then
8: v 1 , j = l p , j 1 t 1 , j t r ,   ( n = 1 )
9: else
10: v n , j = 1 n 1 i = 1 n 1 l p , j n l p , j i t n , j t i , j ,   ( n > 1 , i = 1 , 2 , , n 1 )
11: end if
12: Deep learning to compute the queue length based on traffic image,
13: Get images from connected camera and resize and classify the vehicles to predefine types by DNN constructed like Figure 4,
14: then compute the queue length by,
15: l 2 ( t τ ) = i c k c L i c Q i c + ( m V 1 ) L 0
16: compute the combined estimate queue length,
17: L = α l + ( 1 α ) l 2
18: where α = t s t r t f t r
19: return L
20: Algorithm end

3. Results

To evaluate the performance of the queue length estimation computing model proposed in this paper, a mixed traffic scenario is constructed in a popular platform VISSIM, where a signalized intersection is set. An architecture of ITS is built according to Figure 1. The signal transformation scheme is designed and the time used in the model can be delivered to the edge server. The real time status of connected vehicles and upstream traffic volume are collected by the roadside unit and then sent to the edge server. At the same time, the data from VISSIM is transferred to MATLAB, where the proposed algorithm is working and gives the result about the queue length. As shown in [12], the penetration rates may impose a great effect on the estimate accuracy and can be estimated by V2X [51]. Therefore, several penetration rate levels are validated in the simulation.
Remark 1.
The queue length estimation result of the proposed methodology is related to the positions of the connected vehicles, the penetration rate of connected vehicles, and the types of waiting vehicles, while not related to the typology and phases of the intersection. It can be concluded by analyzing the mechanism of the proposed model. Therefore, a traditional orthogonal four bidirectional branches intersection with four phases was used in this section to validate the performance.

3.1. Shockwave-Based Queue Length Estimation Model Validation

The road network used in the evaluation is set as follows. Two adjacent intersections are considered with a 500 m distance. The proposed model is used at the downstream intersection. An inductive loop was placed in the upstream intersection’s exit. The communication transmission cycle of a connected vehicle is set to 0.2 s. The simulation duration is set as 1 h, and 10 cycles of data are utilized as the basis for performance evaluation. Different connected vehicles’ penetration rates are used to test the performance under the same simulation conditions, aiming to assess the effect of penetration rates on estimation accuracy. Cars and buses arrive stochastically during the simulation.
The queue length estimation results based on shockwave at the intersection, as shown in Figure 3, are given in Figure 5. The connected vehicles’ penetration rates in Figure 5a–d are respectively 10%, 30%, 50%, and 70%. The actual queue length can be calculated through counting the number of vehicles waiting in every lane. It reveals that the proposed shockwave-based queue length estimation results can follow the traffic volume variation trend during the 10 cycles. Obviously, the queue length prediction accuracy gets higher with the increasing penetration rates of connected vehicles at the same simulation cycle.
What is more, it is shown that the queue length prediction accuracy is not coincident during certain connected vehicles’ penetration rates. From an analysis of the queue of vehicles, the last connected vehicle’s position in the queue may change under the same penetration rate. As shown in Equation (1), the last connected vehicle’s position would affect the estimation result. To validate the reason, the traffic conditions in the simulation were checked, especially at the 5th, 6th, and 10th cycles. In the 5th and 6th cycle, it shows that the last connected vehicle stopped far from the end of the queue, nearly at the middle position of the queue, which will induce estimation error. In the 10th cycle, the number of buses in the queue is bigger than other cycles, but the last connected vehicle is near the end of the queue. Therefore, the shockwave-based algorithm gets worse when there are many different types of vehicles in the queue. In order to remedy this drawback, the camera-based algorithm needs to be introduced.

3.2. Model Validation Based on DNN

Figure 6 shows a structure of intelligent camera-based queue length estimation. A field test in the campus thoroughfare has been conducted by this platform, whose structure is similar to [52]. Smart sensors and connected devices are used to communicate with ThingSpeak and workstation, both of which are developed by MATLAB.
The cameras were mounted close to one of the campus thoroughfares. The image captured by cameras is sent to the edge server, which is Raspberry Pi 3b+ with a Broadcom BCM2837B0 SoC with a 1.4 GHz 64-bit quad-core ARM Cortex-A53 processor, GPU, and 1 GB memory. SIMULINK is utilized to provide a modeling environment that can automatically generate a code that can run on Raspberry Pi 3b+. With the DNN algorithm deployed on the Raspberry Pi device, the raw data sent by the Raspberry Pi 3b+ to ThingSpeak is analyzed by fetching it from thingspeak.com. The test reveals that it takes about 3 s for Raspberry Pi 3b+ to tackle the pictures.
It is obvious that the connected vehicles’ penetration rates will not affect the result based on DNN but the intensity of illumination. This is the advantage of image-based queue length estimation. In this work, a normal case is considered, and the light will not affect the classification result of DNN. Aiming to verify the performance of the model, we set the time usage by DNN to 3 s and the penetration rates of connected vehicle is 10%. The estimation result based on DNN is depicted in Figure 7. It reveals that the queue length estimation result of many cycles is not equivalent to queue length at the intersection. The reason is that the time delay is caused by an image process and the traffic flow is variable. To classify the vehicles in the image by DNN, it takes some time to compute due to several layers of the neuron. To promote the estimation accuracy, it is better to combine the DNN with shockwave.

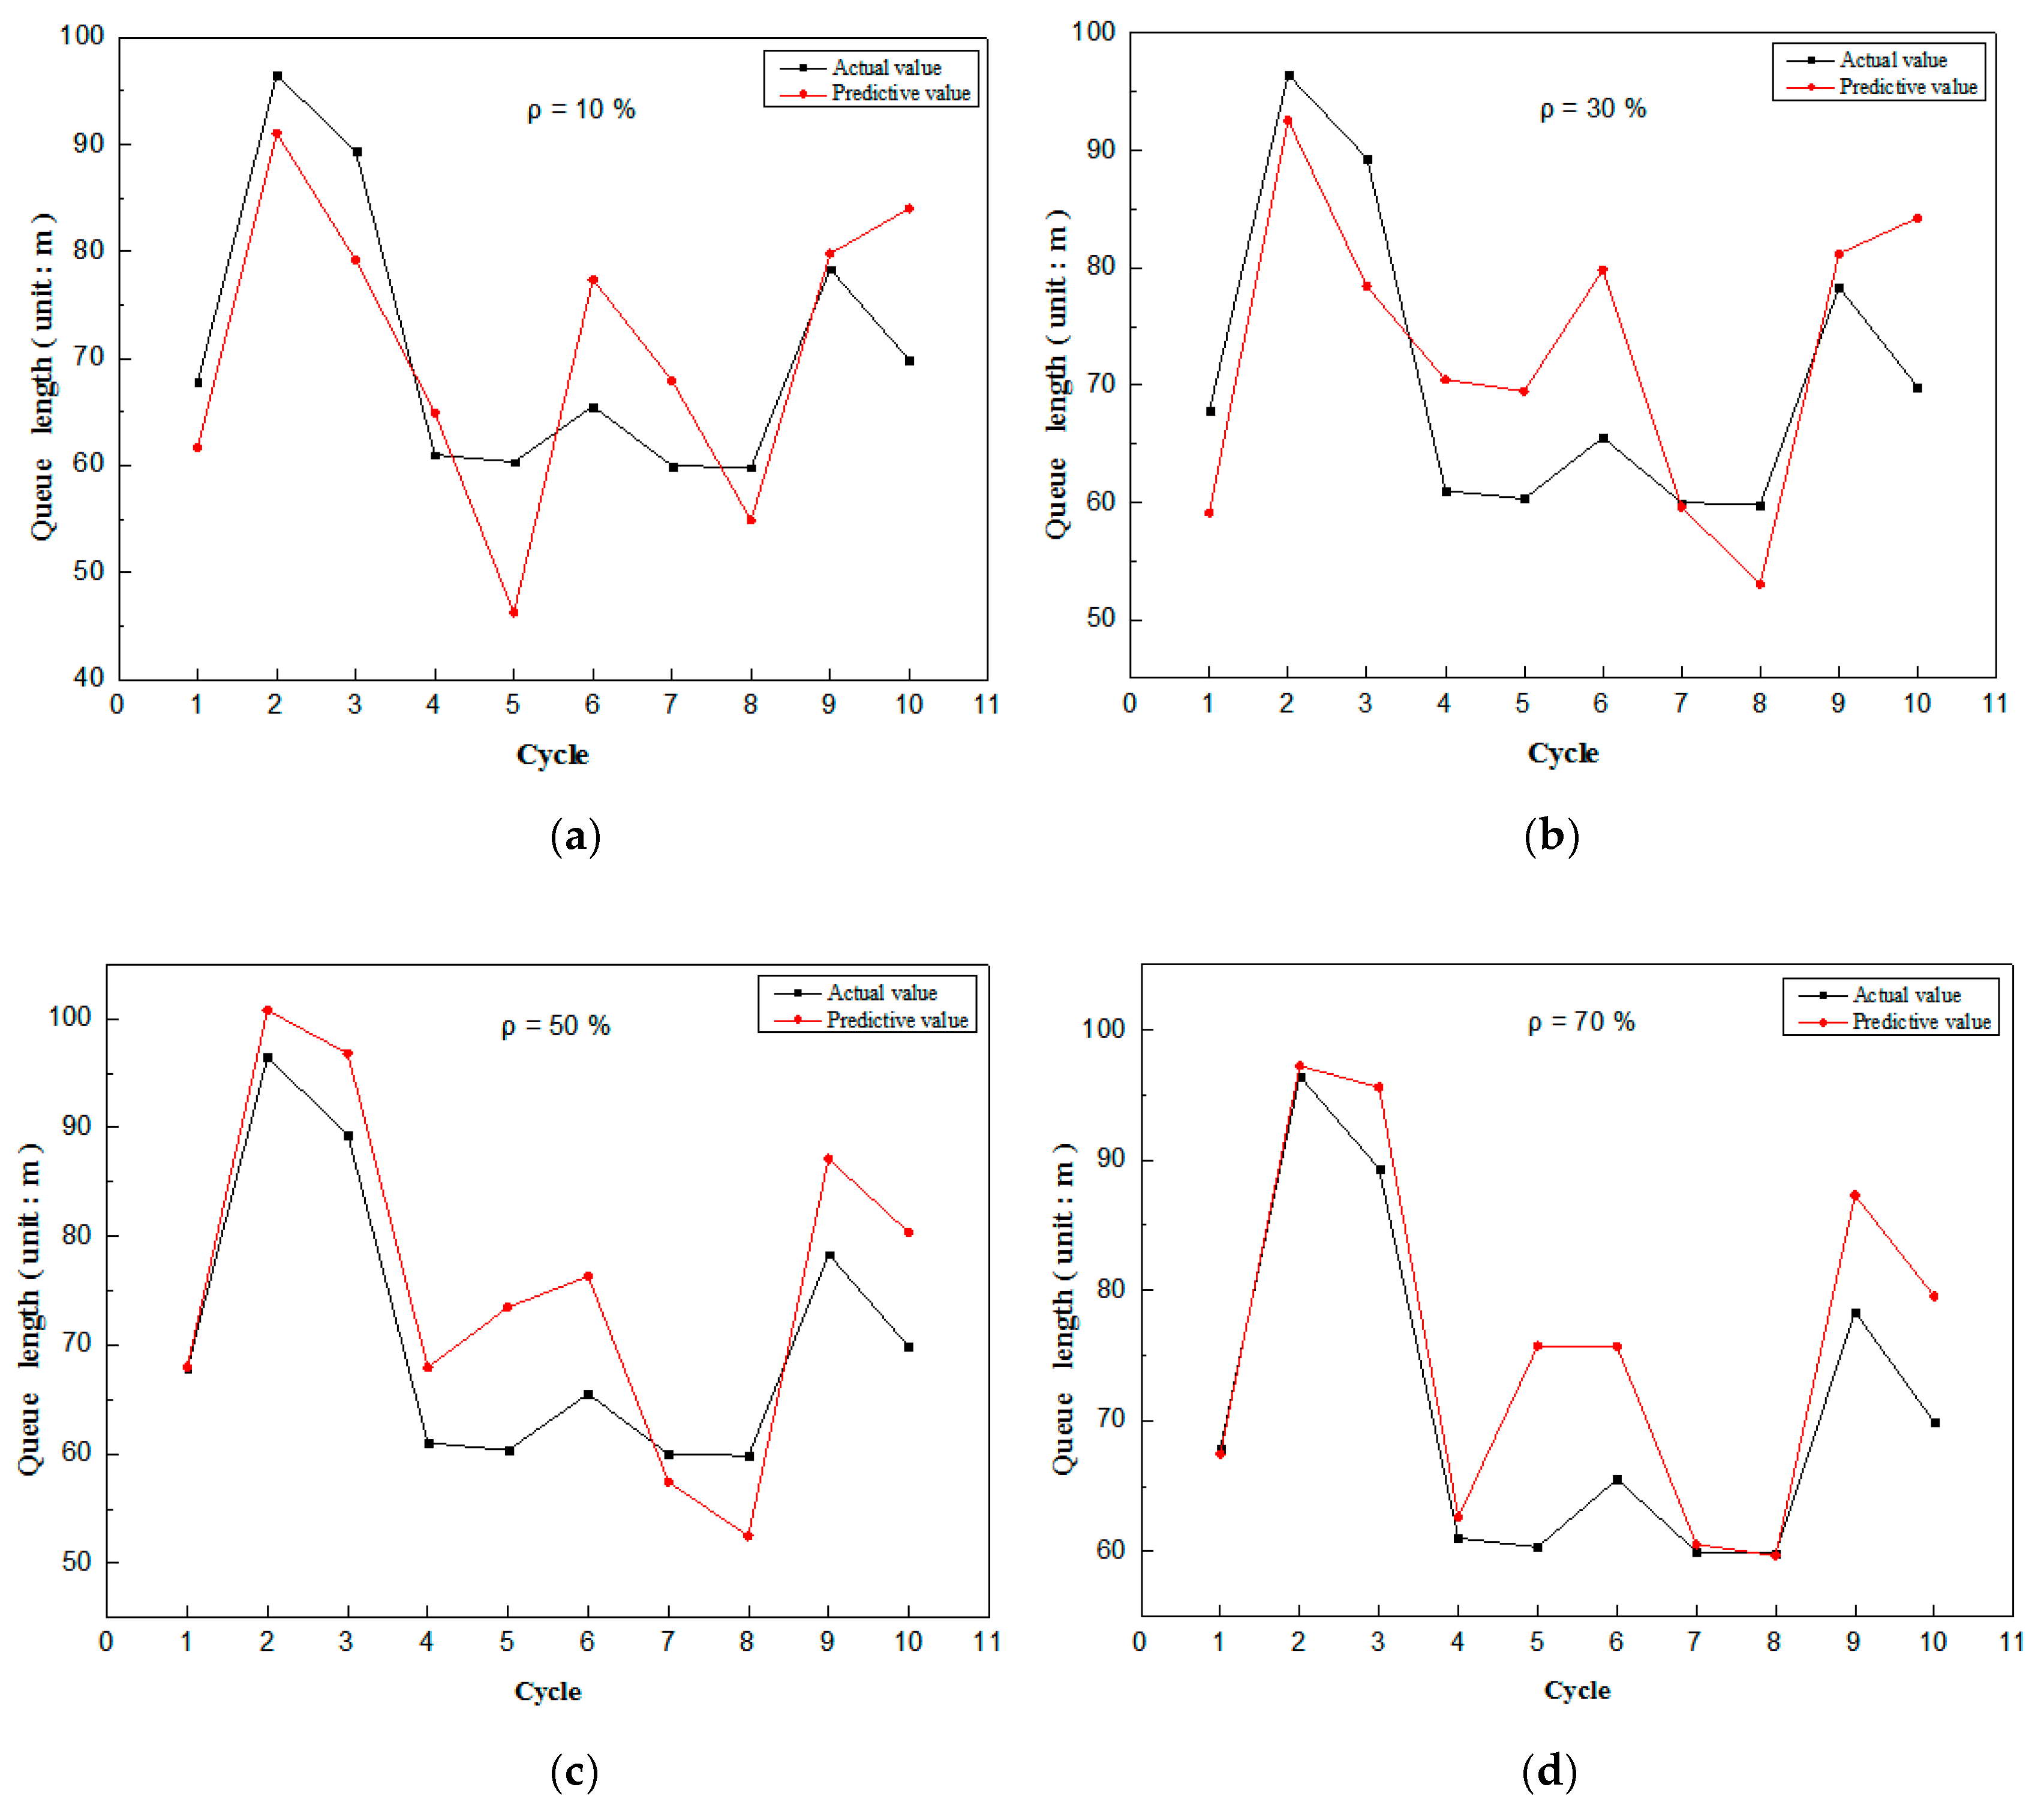
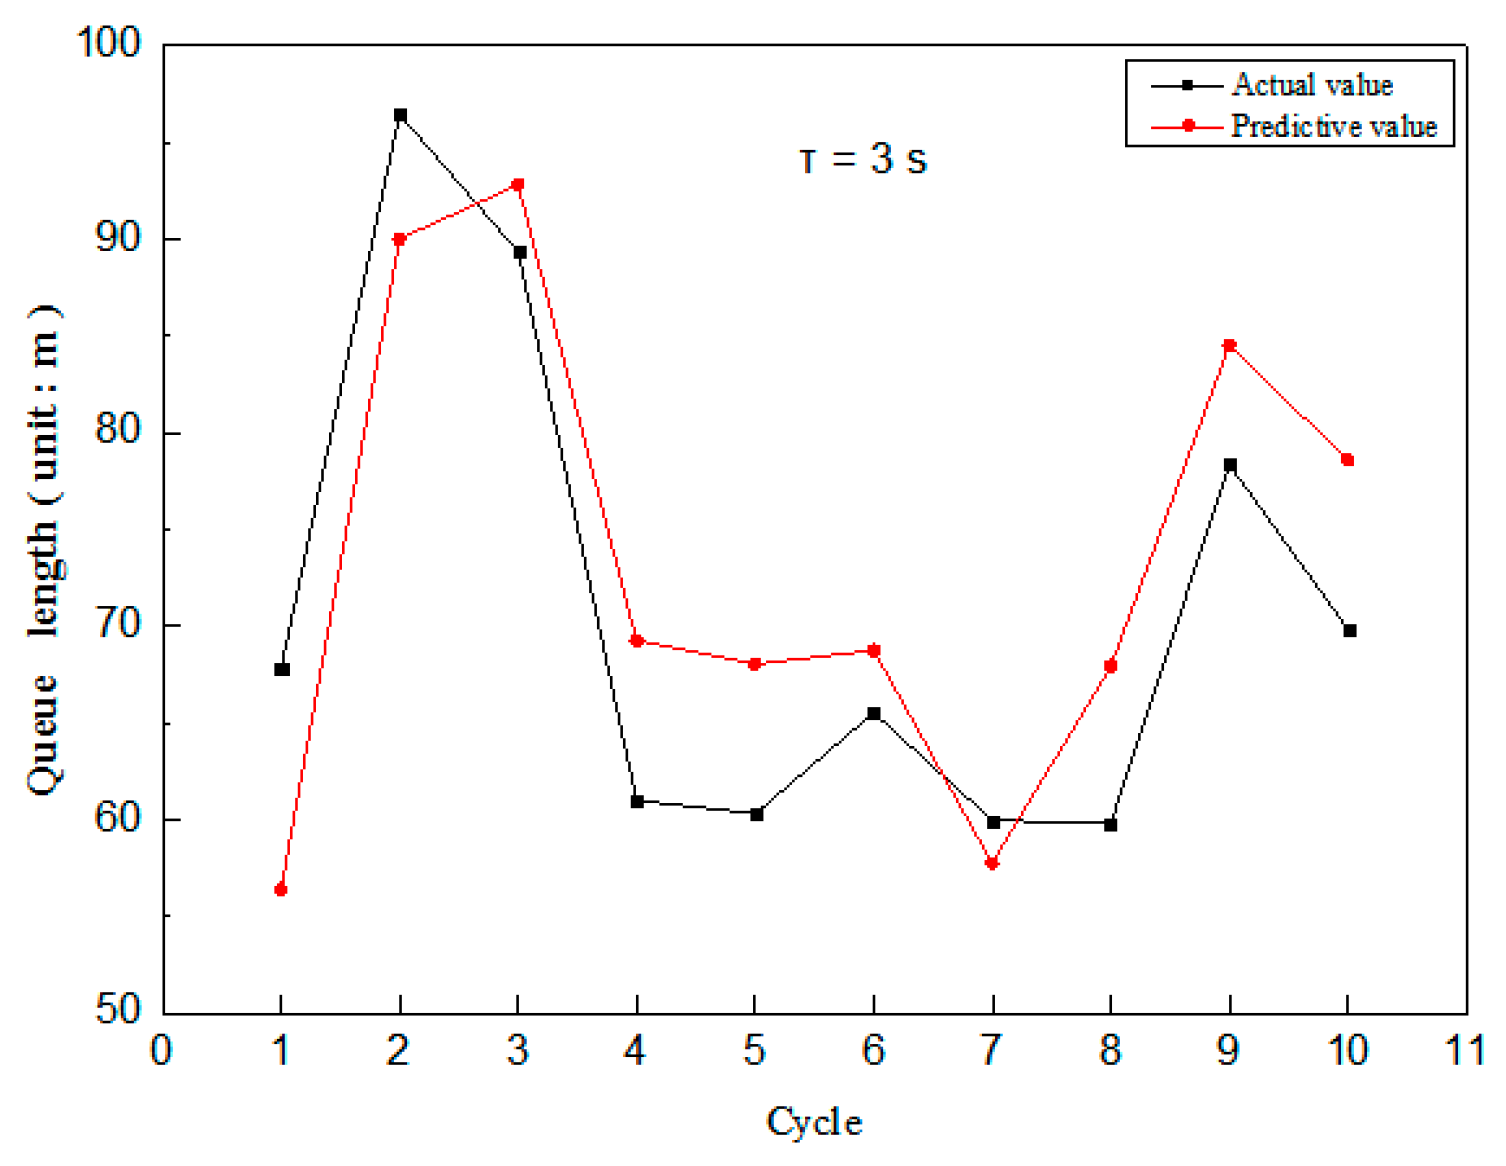
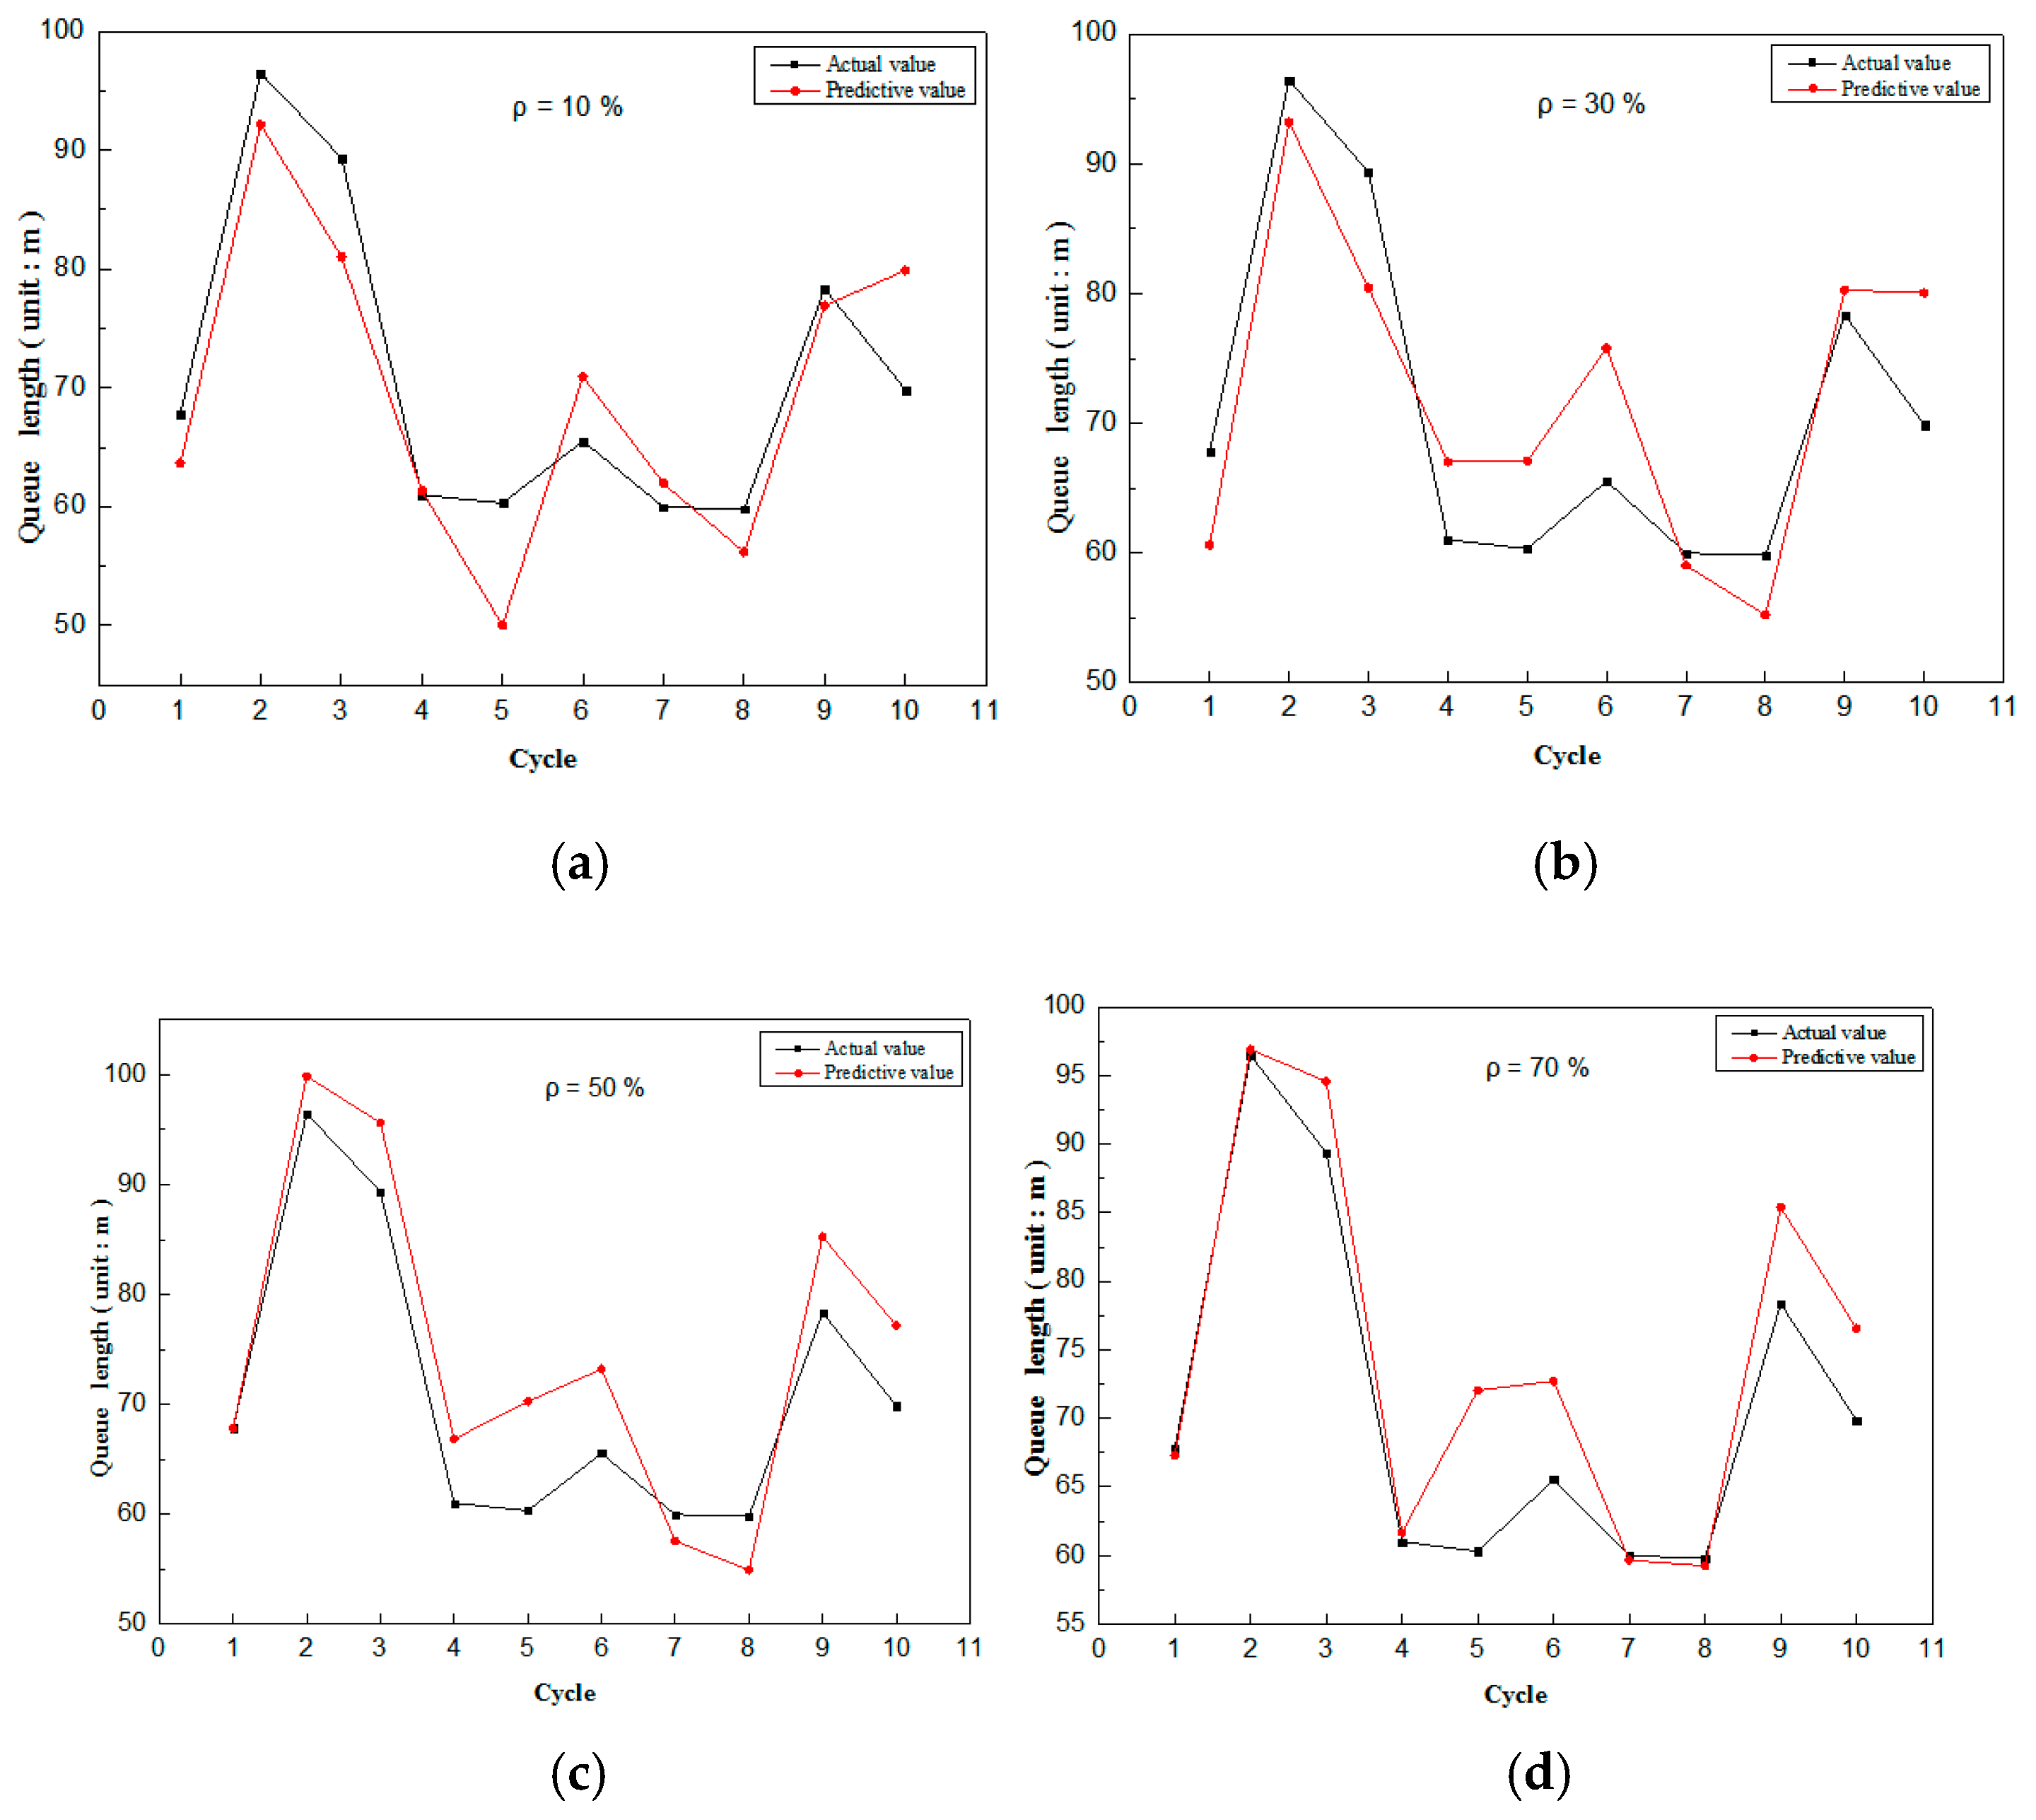
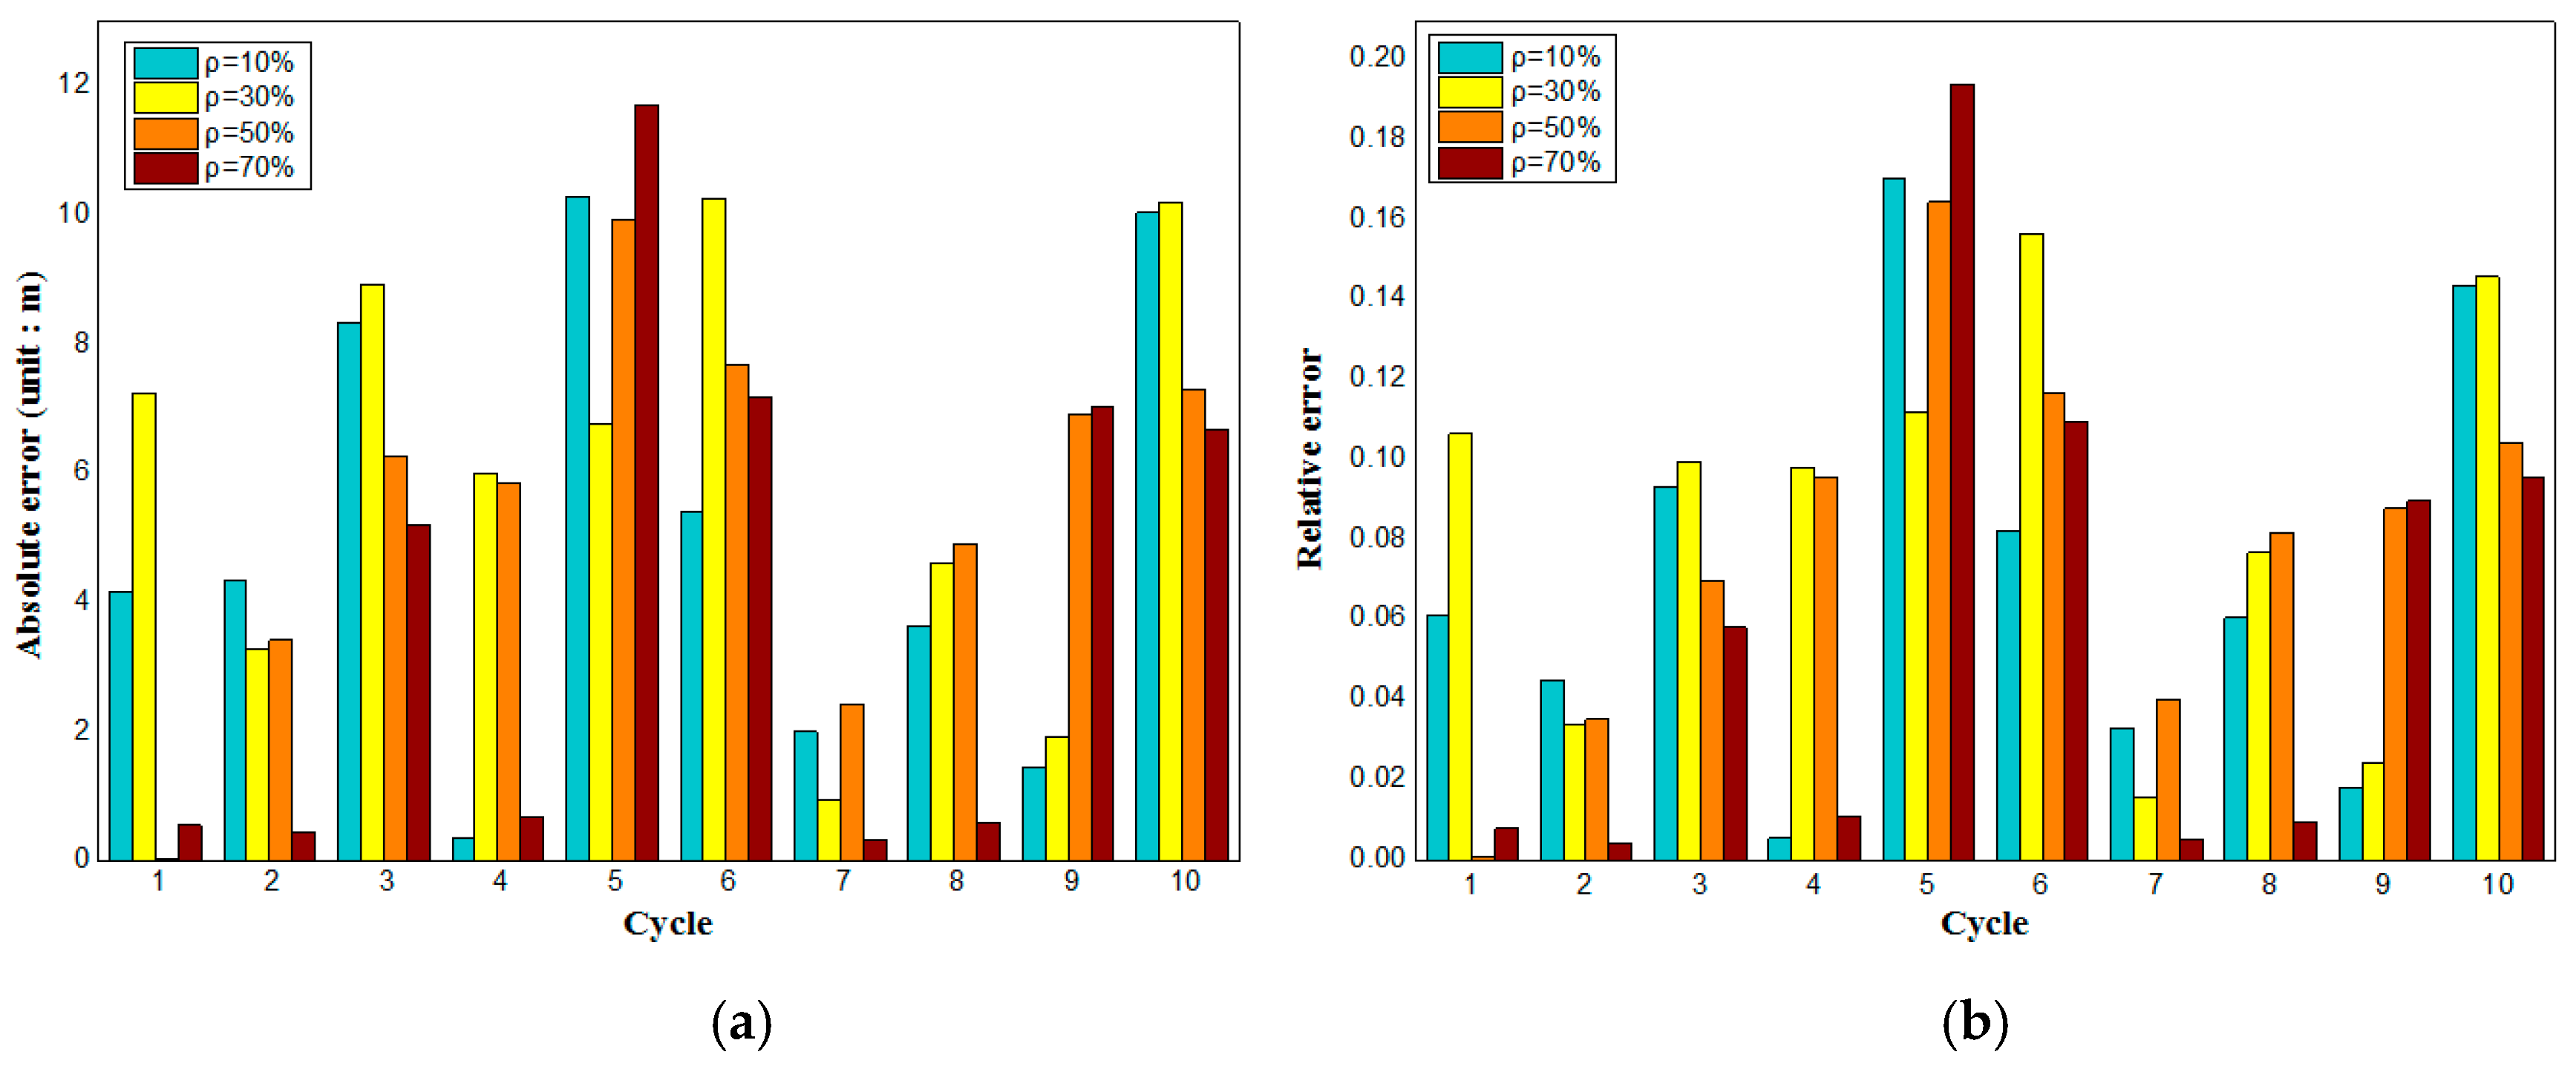
3.3. Test of Combined Prediction Model

The simulation parameters are set the same as Section 3.1 and Section 3.2. The estimation result is calculated by Equation (9). The simulation results are shown in Figure 8. Compared to Figure 5, it is evident that the queue length estimation accuracy is developed. When the position of a connected vehicle is at the later part in the motorcade and the penetration rate is large enough, the shockwave-based queue length estimation model exhibits better accuracy because the information of connected vehicles imply the characteristics of queue forming process at the intersection. The well trained DNN model is capable of accurately estimating the queue length when the connected vehicle is in the front part of queue with a low penetration rate. Suffering from the stochastic arrival of vehicles and variable traffic environment, the simulation results reveal that the integrated queue estimation model takes the advantages of a shockwave-based model and camera-based model, which can be used as input to traffic signal control and transport monitor.
To give a full look of the performance of the integrated queue length model, the absolute error during the simulation is shown in Figure 9a, which shows the error to the actual queue length. The relative error represents the ratio of error to the actual queue length and is shown in Figure 9b.
It reveals that the absolute error gets much bigger as the connected vehicles’ penetration rate is less than 30%. The maximum absolute error value is about 10 m (almost two vehicles). However, the maximum relative error of queue length is less than 20%, and the average relative error is about 10%. In many cycles, the queue length estimation is near the actual value, which would be useful for traffic signal control. Therefore, we can conclude that this method is capable of taking advantage of the shockwave-based model and camera-based model.

4. Conclusions

To address signal optimization and evaluate the control performance of traffic light in a mixed traffic scenario, an algorithm of mobile service computing for traffic state sensing based on connected vehicles and traffic camera is proposed in this paper. The results reveal that the connected vehicles can provide a queue length sensing service by shockwave-based model, but the penetration rate, the position of the last connected vehicle in the queue, and types of vehicles affect the queue length estimation accuracy. The camera-based model can remedy these drawbacks. However, this method requires that the DNN working on the edge server consumes computing and network resources to transfer the information, which delays the sensing result. To take advantage of shockwave-based model and camera-based model, a combined model by a weight shows a better performance in the evaluation. The weight is designed according to the queue length and the last connected vehicle. The error analysis showed that the average relative error is about 10%. This method can resolve the queue length estimation problem in a mixed traffic scenario, especially that there are variable types of vehicles. It can provide almost real time information for traffic lights control and will provide more chance to improve the traffic efficiency.
What is more, the queue length estimation method designed in this paper could be studied further in the following points in the future work:
(1)
The delay of information transmission and the loss of data between the on-board unit and the roadside unit are not considered in this paper. When this situation exists, errors in the prediction results are possible, which could do some further research.
(2)
Additional research is needed on the effect factors of weight α, connected vehicles penetration rate, and vehicle type difference rate.
(3)
The proposed methodology framework will be attempted to apply in computing delay at unsignalized intersections and even roundabouts with necessary modifications.
(4)
The proposed algorithm may be validated by probe vehicles or float car data.

Author Contributions

K.G. and F.H. conceived the idea; S.L. and W.W. designed the experiments and analyzed the data; S.H. implemented the experiments and wrote the manuscript; F.H. and S.L. helped with the simulation; R.D. and K.G. revised the manuscript. All authors have read and agree to the published version of the manuscript.

Funding

This research was funded by the National Natural Science Foundation of China, grant number 61973047 and also by the Scientific research project of Double First-Class International Cooperation and Development Project of Changsha University of Science and Technology (2019IC28). The project was supported by the Open Fund of Hunan Key Laboratory of Smart Roadway and Cooperative Vehicle-Infrastructure Systems (kfj190701) (Changsha University of Science & Technology).

Acknowledgments

In this section you can acknowledge any support given which is not covered by the author contribution or funding sections. This may include administrative and technical support, or donations in kind (e.g., materials used for experiments).

Conflicts of Interest

The authors declare no conflict of interest.

References

  1. Wu, M.; Xiong, N.N.; Tan, L. An intelligent adaptive algorithm for environment parameter estimation in smart cities. IEEE Access 2018, 6, 23325–23337. [Google Scholar] [CrossRef]
  2. Xing, Y.; Lv, C.; Wang, H.; Ai, Y.; Cao, D.; Velenis, E.; Wang, F.Y. Driver lane change intention inference for intelligent vehicles: Framework, survey, and challenges. IEEE Trans. Veh. Technol. 2019, 68, 4377–4390. [Google Scholar] [CrossRef] [Green Version]
  3. Florin, R.; Olariu, S. A survey of vehicular communications for traffic signal optimization. Veh. Commun. 2015, 2, 70–79. [Google Scholar] [CrossRef]
  4. Li, W.; Xu, H.; Li, H.; Yang, Y.; Sharma, P.K.; Wang, J.; Singh, S. Complexity and algorithms for superposed data uploading problem in networks with smart devices. IEEE Internet Things J. 2019. [Google Scholar] [CrossRef]
  5. Lee, J.; Park, B. Development and evaluation of a cooperative vehicle intersection control algorithm under the connected vehicles environment. IEEE Trans. Intell. Transp. Syst. 2012, 13, 81–90. [Google Scholar] [CrossRef]
  6. Tiaprasert, K.; Zhang, Y.; Wang, X.B. Queue length estimation using connected vehicle technology for adaptive signal control. IEEE Trans. Intell. Transp. Syst. 2015, 16, 2129–2140. [Google Scholar] [CrossRef]
  7. Du, R.; Qiu, G.; Gao, K.; Hu, L.; Liu, L. Abnormal road surface recognition based on smartphone acceleration sensor. Sensors 2020, 20, 451. [Google Scholar] [CrossRef] [Green Version]
  8. Lu, N.; Cheng, N.; Zhang, N.; Shen, X.; Mark, J.W. Connected vehicles: Solutions and challenges. IEEE Internet Things J. 2014, 1, 289–299. [Google Scholar] [CrossRef]
  9. Chen, Z.; Luo, Z.; Duan, X.; Zhang, L. Terminal handover in software-defined WLANs. EURASIP J. Wirel. Commun. Netw. 2020. [Google Scholar] [CrossRef] [Green Version]
  10. Siegel, J.E.; Erb, D.C.; Sarma, S.E. A survey of the connected vehicle landscape—Architectures, enabling technologies, applications, and development areas. IEEE Trans. Intell. Transp. Syst. 2018, 19, 2391–2406. [Google Scholar] [CrossRef] [Green Version]
  11. Deng, S.; Huang, L.; Wu, H.; Tan, W.; Taheri, J.; Zomaya, A.Y.; Wu, Z. Toward mobile service computing: Opportunities and challenges. IEEE Cloud Comput. 2016, 3, 32–41. [Google Scholar] [CrossRef]
  12. Hu, L.; Ou, J.; Huang, J.; Chen, Y.; Cao, D. A review of research on traffic conflicts based on intelligent vehicles. IEEE Access 2020, 8, 24471–24483. [Google Scholar] [CrossRef]
  13. Ma, C.; Hao, W.; He, R.; Jia, X.; Pan, F.; Fan, J.; Xiong, R. Distribution path robust optimization of electric vehicle with multiple distribution centers. PLoS ONE 2018, 13, e0193789. [Google Scholar] [CrossRef] [PubMed] [Green Version]
  14. Comert, G.; Cetin, M. Queue length estimation from probe vehicle location and the impacts of sample size. Eur. J. Oper. Res. 2009, 197, 196–202. [Google Scholar] [CrossRef]
  15. Cheng, C.; Du, Y.; Sun, L.; Ji, Y. Review on theoretical delay estimation model for signalized intersections. Transp. Rev. 2016, 36, 479–499. [Google Scholar] [CrossRef]
  16. Dion, F.; Rakha, H.; Kang, Y.S. Comparison of delay estimates at under-saturated and over-saturated pre-timed signalized intersections. Transp. Res. Part B Methodol. 2004, 38, 99–122. [Google Scholar] [CrossRef]
  17. Hasiloglu, A.; Gokdag, M.; Karsli, N. Comparison an artificial intelligence-based model and other models: Signalized intersection delay estimates. Artif. İntell. 2014, 4, 220–228. [Google Scholar]
  18. Ahn, S.; Choi, J. Utilization of V2X Communications for Vehicle Queue Length Estimation. In Proceedings of the 2018 International Conference on Information and Communication Technology Convergence (ICTC), Jeju, Korea, 17–19 October 2018. [Google Scholar] [CrossRef]
  19. Xu, H.; Ding, J.; Zhang, Y. Queue Length Estimation at Isolated Intersections Based on Intelligent Vehicle Infrastructure Cooperation Systems. In Proceedings of the IEEE Intelligent Vehicles Symposium (IV), Los Angeles, CA, USA, 11–14 June 2017. [Google Scholar] [CrossRef]
  20. Zheng, J.; Liu, H.X. Estimating traffic volumes for signalized intersections using connected vehicle data. Transp. Res. Part C 2017, 79, 347–362. [Google Scholar] [CrossRef] [Green Version]
  21. Tišljaric, L.; Erdelic, T.; Caric, T. Analysis of Intersection Queue Lengths and Level of Service using GPS data. In Proceedings of the International Symposium ELMAR, Zadar, Croatia, 16–19 September 2018. [Google Scholar] [CrossRef]
  22. Guler, S.I.; Menendez, M.; Meier, L. Using connected vehicle technology to improve the efficiency of intersections. Transp. Res. Part C 2014, 46, 121–131. [Google Scholar] [CrossRef]
  23. Yang, K.; Menendez, M. Queue estimation in a connected vehicle environment: A convex approach. IEEE Trans. Intell. Transp. Syst. 2018, 4, 1–17. [Google Scholar] [CrossRef] [Green Version]
  24. Argote-Cabañero, J.; Christofa, E.; Skabardonis, A. Connected vehicle penetration rate for estimation of arterial measures of effectiveness. Transp. Res. Part C 2015, 60, 298–312. [Google Scholar] [CrossRef]
  25. Shirazi, M.S.; Morris, B. Vision-based vehicle queue analysis at junctions. In Proceedings of the 2015 12th IEEE International Conference on Advanced Video and Signal Based Surveillance (AVSS), Karlsruhe, Germany, 25–28 August 2015. [Google Scholar] [CrossRef]
  26. LeCun, Y.; Bengio, Y.; Hinton, G. Deep learning. Nature 2015, 521, 436. [Google Scholar] [CrossRef] [PubMed]
  27. Shirazi, M.S.; Morris, B.T. Looking at intersections: A survey of intersection monitoring, behavior and safety analysis of recent studies. IEEE Trans. Intell. Transp. Syst. 2017, 18, 4–24. [Google Scholar] [CrossRef]
  28. Shirazi, M.S.; Morris, B. Traffic flow classification using traffic cameras. In Advances in Visual Computing; Springer: Cham, Switzerland, 2018; pp. 758–767. [Google Scholar]
  29. Jiang, F.; Wang, K.; Dong, L.; Pan, C.; Xu, W.; Yang, K. Deep Learning Based Joint Resource Scheduling Algorithms for Hybrid MEC Networks. IEEE Internet Things J. 2019. [Google Scholar] [CrossRef] [Green Version]
  30. Guerrero-Ibanez, J.A.; Zeadally, S.; Contreras-Castillo, J. Integration challenges of intelligent transportation systems with connected vehicle, cloud computing, and internet of things technologies. IEEE Wirel. Commun. 2015, 22, 122–128. [Google Scholar] [CrossRef]
  31. Li, Z.J.; Chen, C.; Wang, K. Cloud computing for agent-based urban transportation systems. IEEE Intell. Syst. 2011, 26, 73–79. [Google Scholar] [CrossRef]
  32. Abbas, N.; Zhang, Y.; Taherkordi, A.; Skeie, T. Mobile edge computing: A survey. IEEE Internet Things J. 2018, 5, 450–465. [Google Scholar] [CrossRef] [Green Version]
  33. Ang, L.-M.; Seng, K.P.; Ijemaru, G.K.; Zungeru, A.M. Deployment of IoV for Smart Cities: Applications, Architecture, and Challenges. IEEE Access 2019, 7, 6473–6492. [Google Scholar] [CrossRef]
  34. Dhall, R.; Solanki, V. An IoT based predictive connected car maintenance. Int. J. Interact. Multimedia Artif. Intell. 2017, 4, 16. [Google Scholar] [CrossRef] [Green Version]
  35. Lin, T.; Rivano, H.; Le Mouël, F. A survey of smart parking solutions. IEEE Trans. Intell. Transp. Syst. 2017, 18, 3229–3253. [Google Scholar] [CrossRef] [Green Version]
  36. Ji, Z.; Ganchev, I.; O’Droma, M.; Zhao, L.; Zhang, X. A cloud-based car parking middleware for IoT-based smart cities: Design and implementation. Sensors 2014, 14, 22372–22393. [Google Scholar] [CrossRef] [PubMed]
  37. Dinh, T.; Kim, Y. A novel location-centric IoT-cloud based on-street car parking violation management system in smart cities. Sensors 2016, 16, 810. [Google Scholar] [CrossRef] [PubMed]
  38. Kim, H.; Han, J.; Kim, S.-H.; Choi, J.; Yoon, D.; Jeon, M.; Yang, E.; Pham, N.; Woo, S.; Park, J.; et al. IsV2C: An integrated road traffic-network-cloud simulator for V2C connected car services. In Proceedings of the 2017 IEEE International Conference on Services Computing (SCC), Honolulu, HI, USA, 25–30 June 2017. [Google Scholar] [CrossRef]
  39. Datta, S.K.; Khan, M.I.; Codeca, L.; Denis, B.; Härri, J.; Bonnet, C. Iot and microservices based testbed for connected car services. In Proceedings of the 2018 IEEE 19th International Symposium on “A World of Wireless, Mobile and Multimedia Networks” (WoWMoM), Chania, Greece, 12–15 June 2018. [Google Scholar] [CrossRef]
  40. Hu, Y.C.; Patel, M.; Sabella, D.; Sprecher, N.; Young, V. Mobile edge computing—A key technology towards 5G. ETSI White Paper 2015, 11, 1–16. [Google Scholar]
  41. Khan, S.M.; Dey, K.C.; Chowdhury, M. Real-time traffic state estimation with connected vehicles. IEEE Trans. Intell. Transp. Syst. 2017, 18, 1687–1699. [Google Scholar] [CrossRef]
  42. Darwish, T.; Bakar, K.A. Traffic density estimation in vehicular ad hoc networks: A review. Ad Hoc Netw. 2015, 24, 337–351. [Google Scholar] [CrossRef]
  43. Gao, K.; Han, F.; Dong, P.; Xiong, N.; Du, R. Connected vehicle as a mobile sensor for real time queue length at signalized intersections. Sensors 2019, 19, 2059. [Google Scholar] [CrossRef] [Green Version]
  44. Croce, A.I.; Musolino, G.; Rindone, C.; Vitetta, A. Sustainable mobility and energy resources: A quantitative assessment of transport services with electrical vehicles. Renew. Sustain. Energy Rev. 2019, 113, 109236. [Google Scholar] [CrossRef]
  45. Alonso, B.; Ibeas, Á.; Musolino, G.; Rindone, C.; Vitetta, A. Effects of traffic control regulation on network macroscopic fundamental diagram: A statistical analysis of real data. Transp. Res. Part A Policy Pract. 2019, 126, 136–151. [Google Scholar] [CrossRef]
  46. Marcianò, F.A.; Musolino, G.; Vitetta, A. Signal setting optimization on urban road transport networks: The case of emergency evacuation. Saf. Sci. 2015, 72, 209–220. [Google Scholar] [CrossRef]
  47. Birgillito, G.; Rindone, C.; Vitetta, A. Passenger mobility in a discontinuous space: Modelling access/egress to maritime barrier in a case study. J. Adv. Transp. 2018, 2018, 1–13. [Google Scholar] [CrossRef]
  48. Filocamo, B.; Ruiz, J.A.; Sotelo, M.A. Efficient management of road intersections for automated vehicles—The FRFP system applied to the various types of intersections and roundabouts. Appl. Sci. 2020, 10, 316. [Google Scholar] [CrossRef] [Green Version]
  49. Zhou, Y.; Nejati, H.; Do, T.-T.; Cheung, N.-M.; Cheah, L. Image-based vehicle analysis using deep neural network: A systematic study. In Proceedings of the 2016 IEEE International Conference on Digital Signal Processing (DSP), Beijing, China, 16–18 October 2016. [Google Scholar] [CrossRef] [Green Version]
  50. Krizhevsky, A.; Sutskever, I.; Hinton, G.E. Imagenet classification with deep convolutional neural networks. Adv. Neural Inf. Process. Syst. 2012, 25, 1097–1105. [Google Scholar] [CrossRef]
  51. Wong, W.; Shen, S.; Zhao, Y.; Liu, H.X. On the estimation of connected vehicle penetration rate based on single-source connected vehicle data. Transp. Res. Part B Methodol. 2019, 126, 169–191. [Google Scholar] [CrossRef]
  52. Handana, S.J.; Hussain, S.J. Smart surveillance system using thing speak and Raspberry Pi. Int. J. Adv. Res. Comput. Commun. Eng. 2015, 4, 214–218. [Google Scholar] [CrossRef]
Figure 1. Architecture of Intelligent Transportation System.
Applsci 10 02078 g001
Figure 2. Queue length estimate based on unified service computing.
Applsci 10 02078 g002
Figure 3. Schematic diagram of Shockwave estimation model.
Applsci 10 02078 g003
Figure 4. Structure and function of deep neuron network (DNN) (Alexnet model).
Applsci 10 02078 g004
Figure 5. Shockwave-based queue length estimation results when penetration rate ρ = 10% (a), penetration rate ρ = 30% (b), penetration rate ρ = 50% (c) and penetration rate ρ = 70% (d).
Applsci 10 02078 g005
Figure 6. Structure of test for DNN-based queue length estimation.
Applsci 10 02078 g006
Figure 7. Schematic diagram of model prediction results based on DNN.
Applsci 10 02078 g007
Figure 8. Schematic diagram of combined model prediction results when penetration rate ρ = 10% (a), penetration rate ρ = 30% (b), penetration rate ρ = 50% (c) and penetration rate ρ = 70% (d).
Applsci 10 02078 g008
Figure 9. Error analysis of integrated queue length estimation model: absolute error (a) and relative error (b).
Applsci 10 02078 g009

