1. Introduction
A report by the Intergovernmental Panel on Climate Change (IPCC) noted that so far the global temperature has risen by 1 °C due to warming by 0.2 °C per decade and may reach a critical value of 2 °C by the 2060s if the proposed environmental policies will not be implemented urgently worldwide [
1].
This global warming has caused the warmest 18 years to date as well as several meteorological events that fall into the extreme intensity class, and for some time now it has been increasingly recognized and accepted that greenhouse gas (GHG) emissions are responsible for most of these climate changes [
1,
2].
As it is well known, the largest source of GHG emissions from human activities (formed mostly by carbon dioxide, accounting for 80% of the emissions) is represented by the energy-producing industry and by transportation, both of which are responsible together for more than a half of the total emission [
3]. Given this situation, it becomes obvious there is the need to increase research and technology development efforts to make the transition to a low-carbon, secure, and competitive economy [
4].
Part of this problem solution is perceived to be the increase in using renewable energy sources (RESs) [
5]. Unfortunately, the rapid deployment of RESs involves addressing issues related to their disadvantages because there are some [
6].
Their vast majority is characterized by intermittency and fairly wide diurnal and/or seasonal variability [
7]. Due to their inherent nature, RESs are vulnerable to climate change and are also geographically unevenly distributed, and so the redistribution of energy, with all the losses involved, becomes inevitable [
8].
During the last few years, technology advances have progressed in establishing a carbon-free energy chain via a partnership between electricity and hydrogen, mediated by fuel cells, which act as efficient and pollution-free energy converters, allowing direct conversion of hydrogen to electricity and thus favoring RES growing scale applicability [
9]. To this effect, the proton exchange membrane fuel cell (PEMFC) emerged as a candidate solution [
10], due to the advantages such as the high efficiency, zero emission, low noise, and flexibility in controllable power output. In addition, if we refer to PEMFC performance, then it should be mentioned that it strongly depends on operating parameters (such as load profile, temperature, pressure, relative humidity, reactance stoichiometry, etc.) that can cause significant changes in PEMFC performance [
11].
Nevertheless, the slowness in some of the balance of plant auxiliary subsystems for gas (fuel and oxidizer), heat, and water management operation, and also in electrochemical processes occurring in fuel cells themselves, makes an FC-based energy storage or power supply system unable to provide a quick startup and to follow fast load changes [
12].
It is a fact that in real life, electricity consumption characteristics are hilly and, moreover, quite often fast transients occur, so it appears obvious there is the need to use in power systems, apart from fuel cells, some wide dynamics energy storage devices to help the power source match the load demand [
13]. Together, they form a so-called hybrid power system (HPS).
Usually, hybridization is made using batteries and/or ultracapacitors (UCs) [
14]. As it is known, a lithium-ion battery has a high energy ratio, a relatively long life compared to other technologies for making batteries, and can generate high power [
15], and an ultracapacitor has high power density and very short response time [
16]; together or separately, they can counterbalance the disadvantages of pure FC power systems [
17].
Regardless of the application that a HPS works in, be it mobile or stationary, the power distribution among FCs, batteries, and/or ultracapacitors is a basic problem to be solved through an energy management strategy (EMS) [
18]. Moreover, in the car propulsion system, these storage devices allow for the absorption of braking energy, thus improving efficiency and also eliminating the requirement for a starting device [
19].
The way in which the HPS control strategy is designed has a decisive influence both on its performance [
20] and on the economic aspects [
21]. System performance control aims to optimize the static and dynamic characteristics and also to maintain a low current fluctuation of FCs [
21,
22] and a narrow range of charging and discharging depth of the energy storage devices, in order to preserve their lifespan [
14,
17,
19,
23]. System economics control often involves improving economic efficiency through several means, such as reducing the fuel [
24] and/or energy consumption [
25] and maximizing energy efficiency [
26].
An EMS aims at finding an optimal solution [
27] for the specific system by considering several or all the mentioned aspects [
19,
20,
28,
29,
30]. Especially in the last decade, more attention has been paid to different topologies of multisource hybrid electric power systems used in mobility energy supply [
31] and in stationary and portable power generation [
32]. The major challenges faced by the ongoing research involve the integration of multiple and often conflicting objectives of power management strategy optimization in a real-time control system [
33]. The EMS of a fuel cell hybrid power systems should aim at improving the system design (topology, dimensions, weight etc.), performances (fuel consumption, energy efficiency, lifespan, resilience, etc.) and cost, and at finding an optimal solution for the specific system by considering aforementioned objectives.
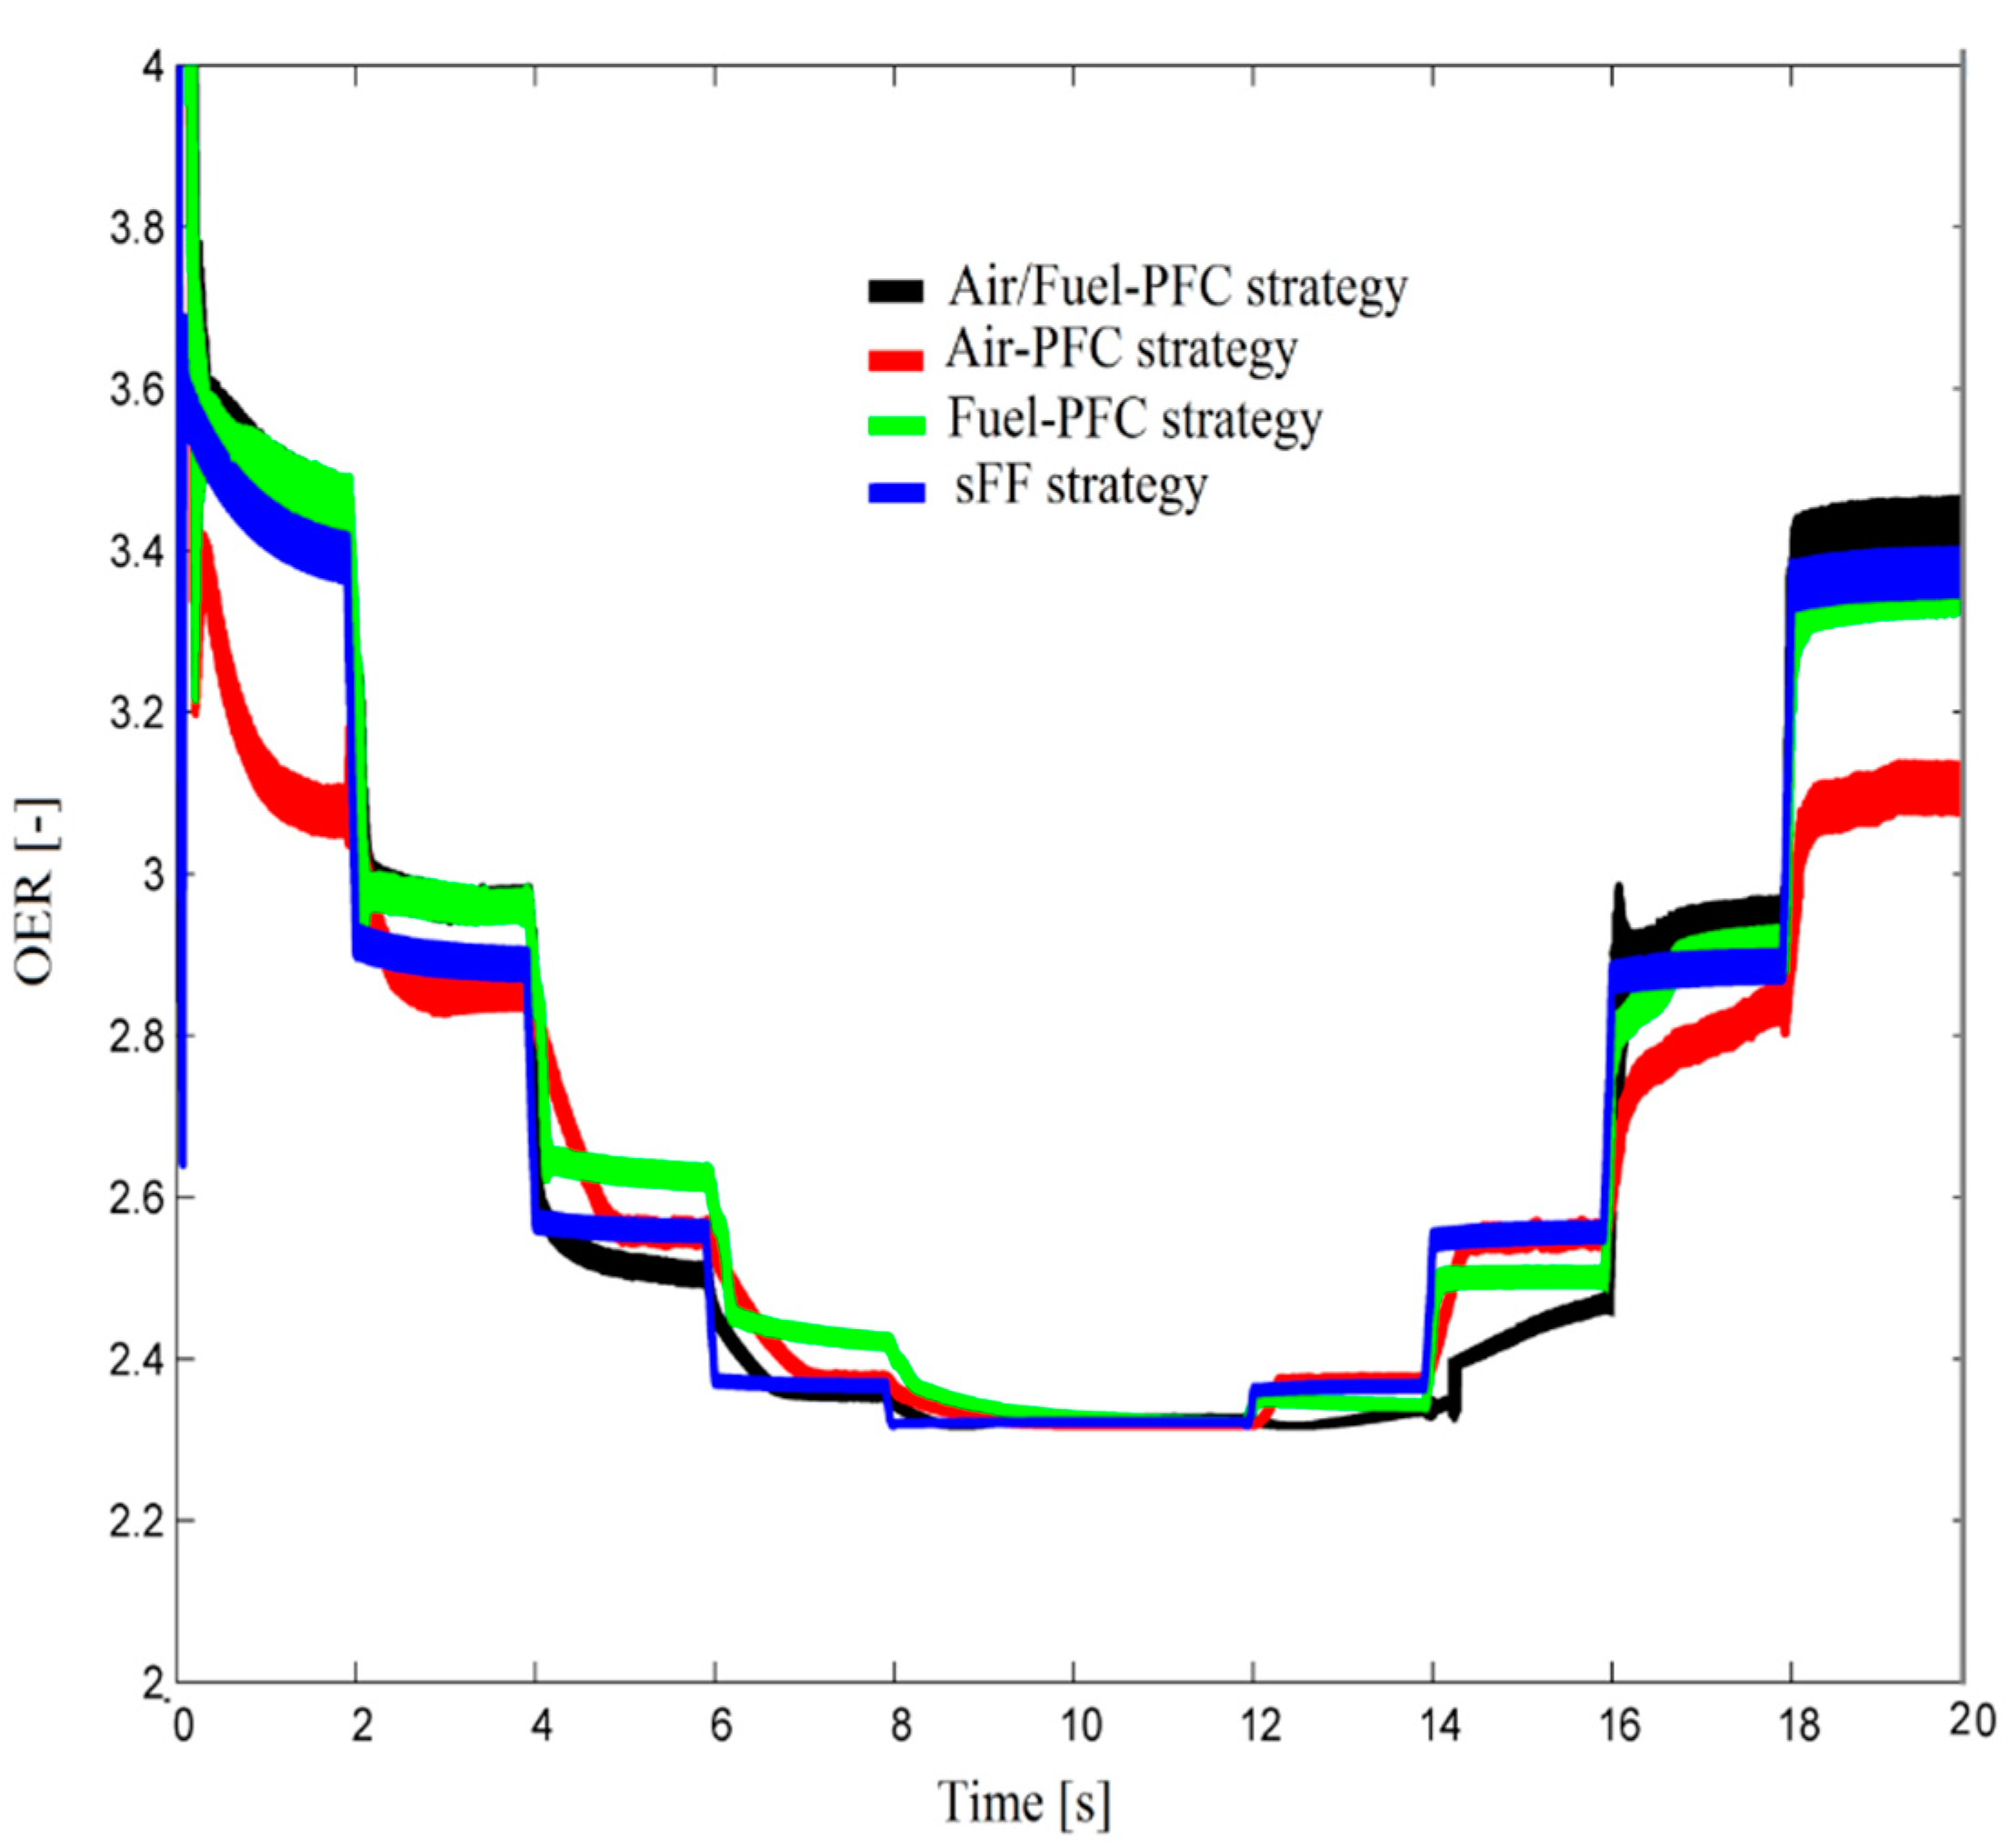
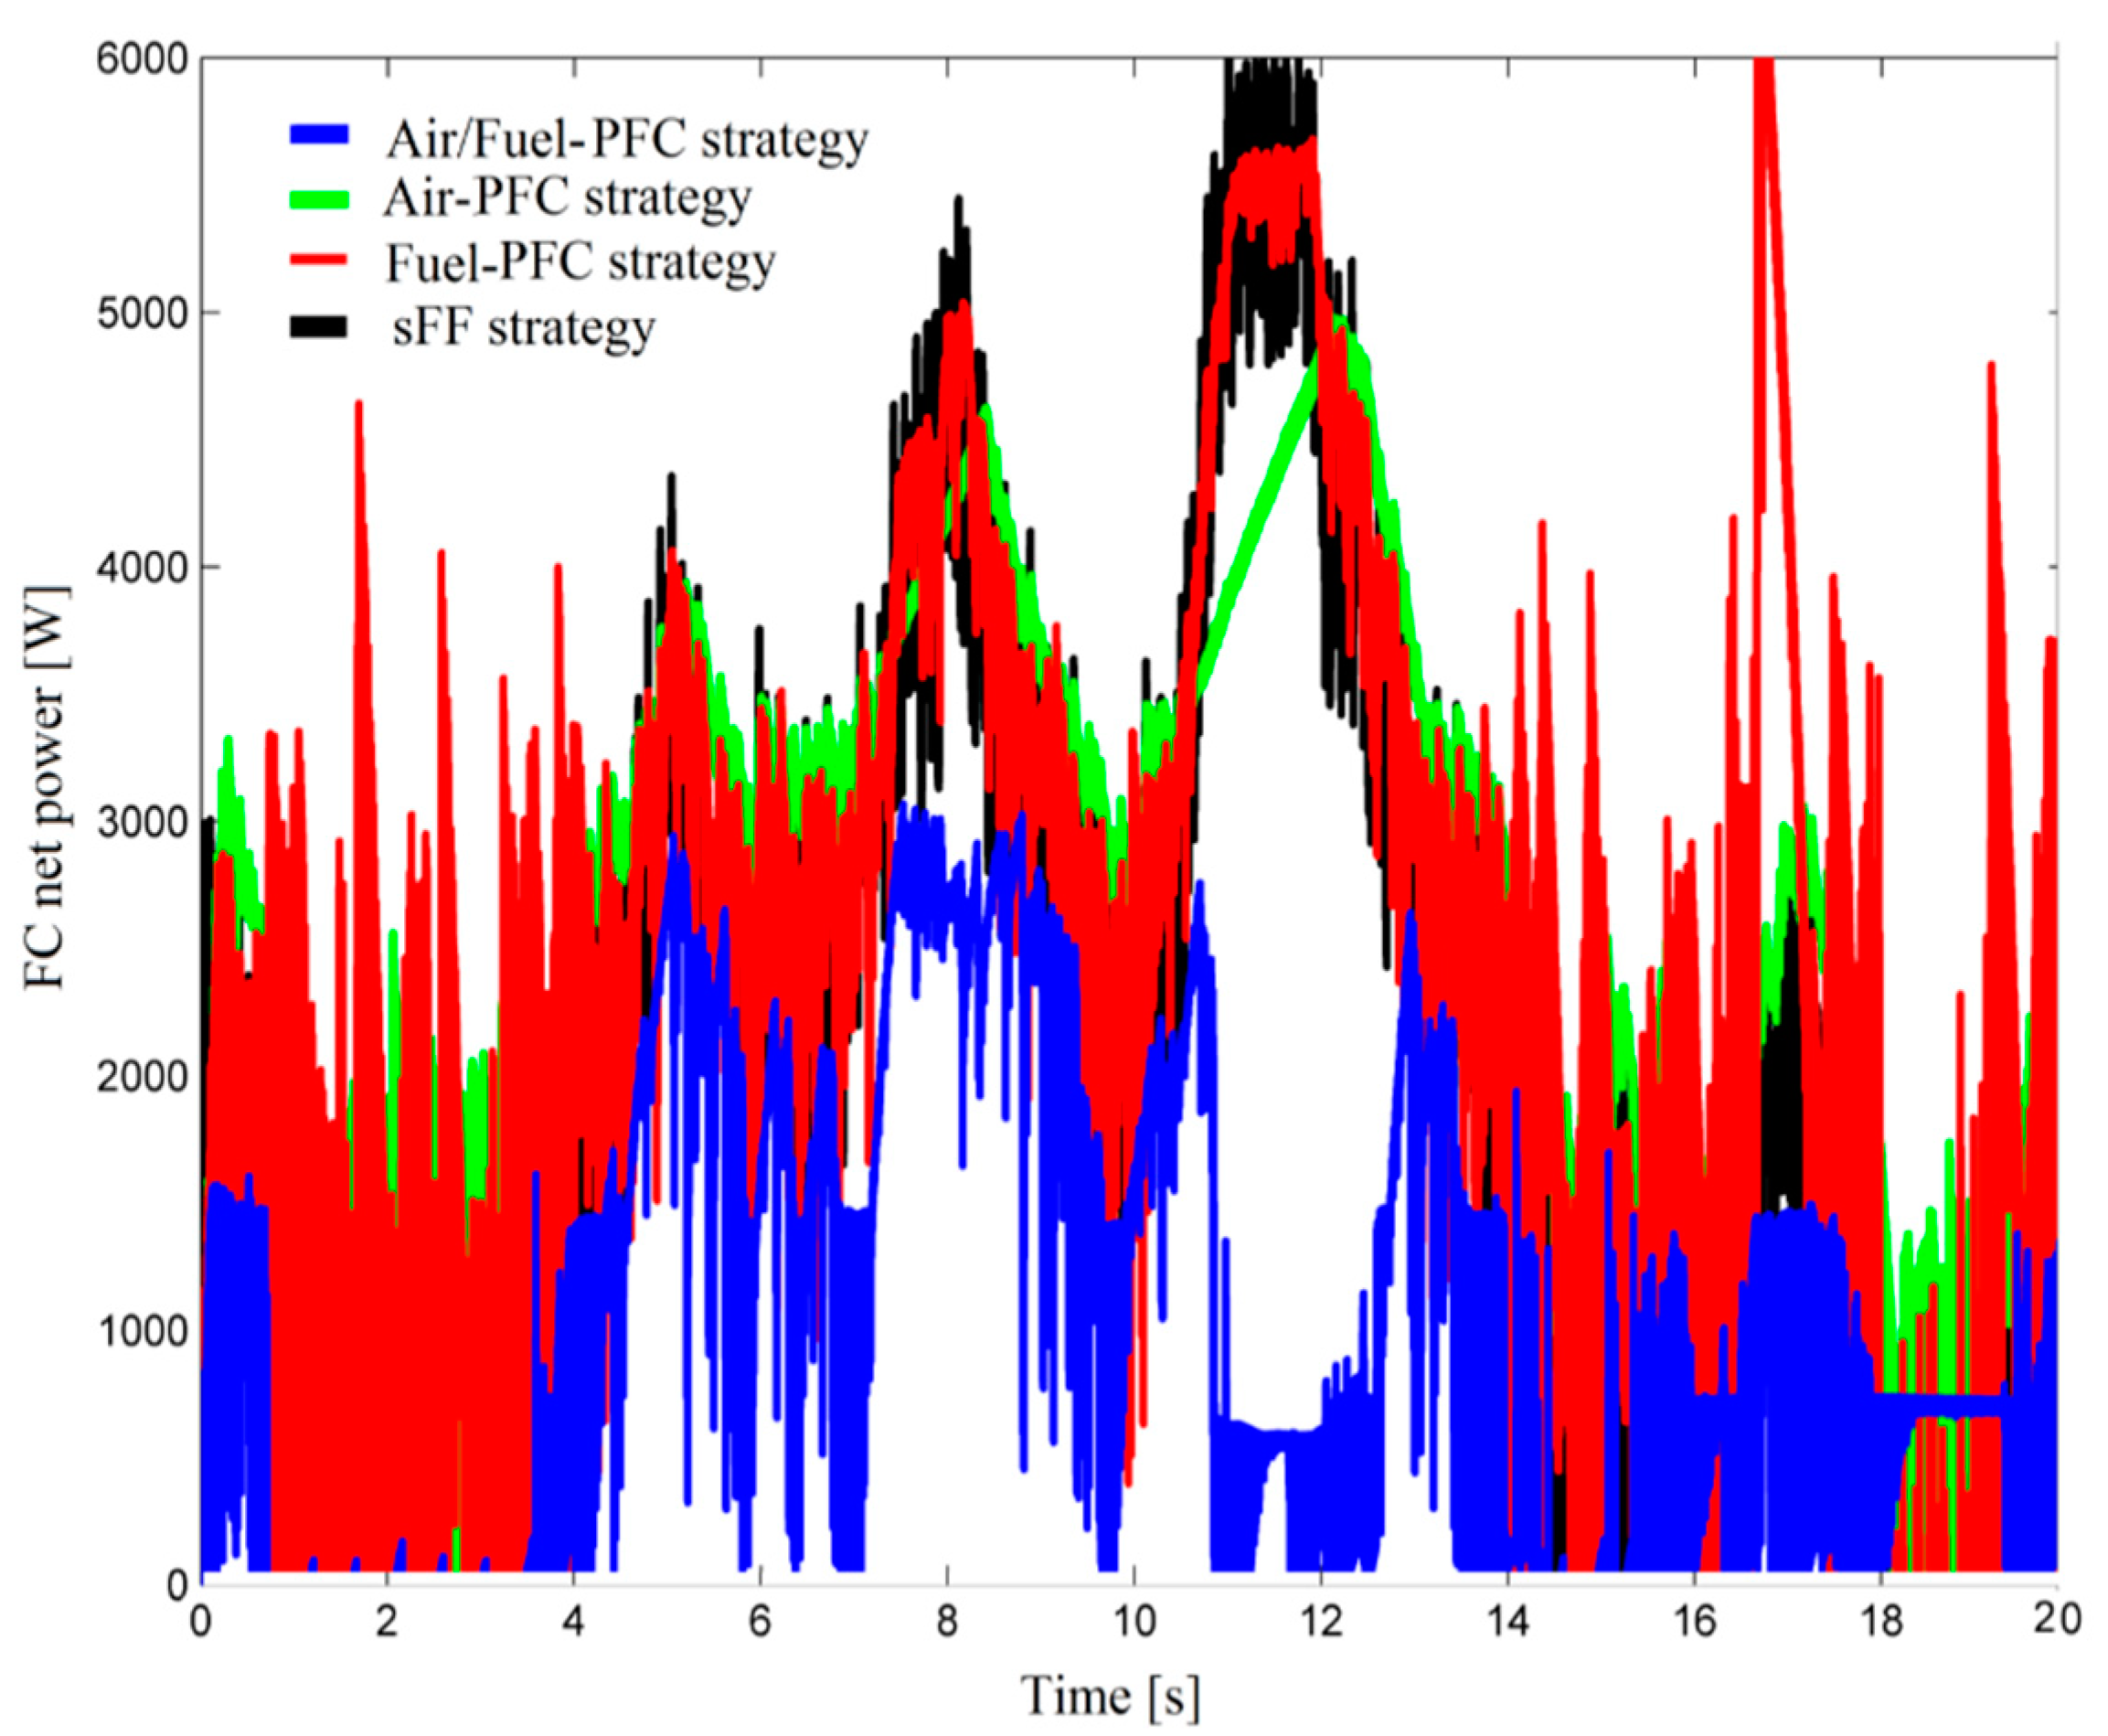
The main objective of this paper is to carry out a systematic evaluation of four fuel economy EMSs, three of which involves power-following control (PFC). These EMSs are referred to as air/fuel-PFC, air-PFC, fuel-PFC, and static feed-forward (sFF) strategies, and they are assessed in order to identify the best and safest strategy compared to the commercial standard based on the static feed-forward (sFF) control. For this, indicators such as fuel economy and oxygen excess ratio (OER) are used to evaluate the efficient and safe operation of an FC system and battery using power-following control (PFC) for the air regulator or the fuel regulator of the FC system, either separately or switched. The innovative switched mode proposed for the air/fuel-PFC strategy is comparatively analyzed with PFC-based strategies that control separately the air regulator or the fuel regulator of the FC system in order to highlight the fuel economy obtained for FC systems and FC/renewable hybrid power systems (HPSs). Net FC power is generated by PFC-based strategies for battery operation in sustained charging mode, with increased battery lifespan and cost less maintenance of the HPS.
Following this objective, the structure of the paper is as follows. The first section details the model of an FC/renewable HPS, a PFC-based fuel economy EMS, and the involved control and optimization loops. The second section presents and comments on the results obtained under dynamic load and variable power from renewable energy sources (RESs). The last two sections discuss the results and conclude the paper respectively.
2. Materials and Methods
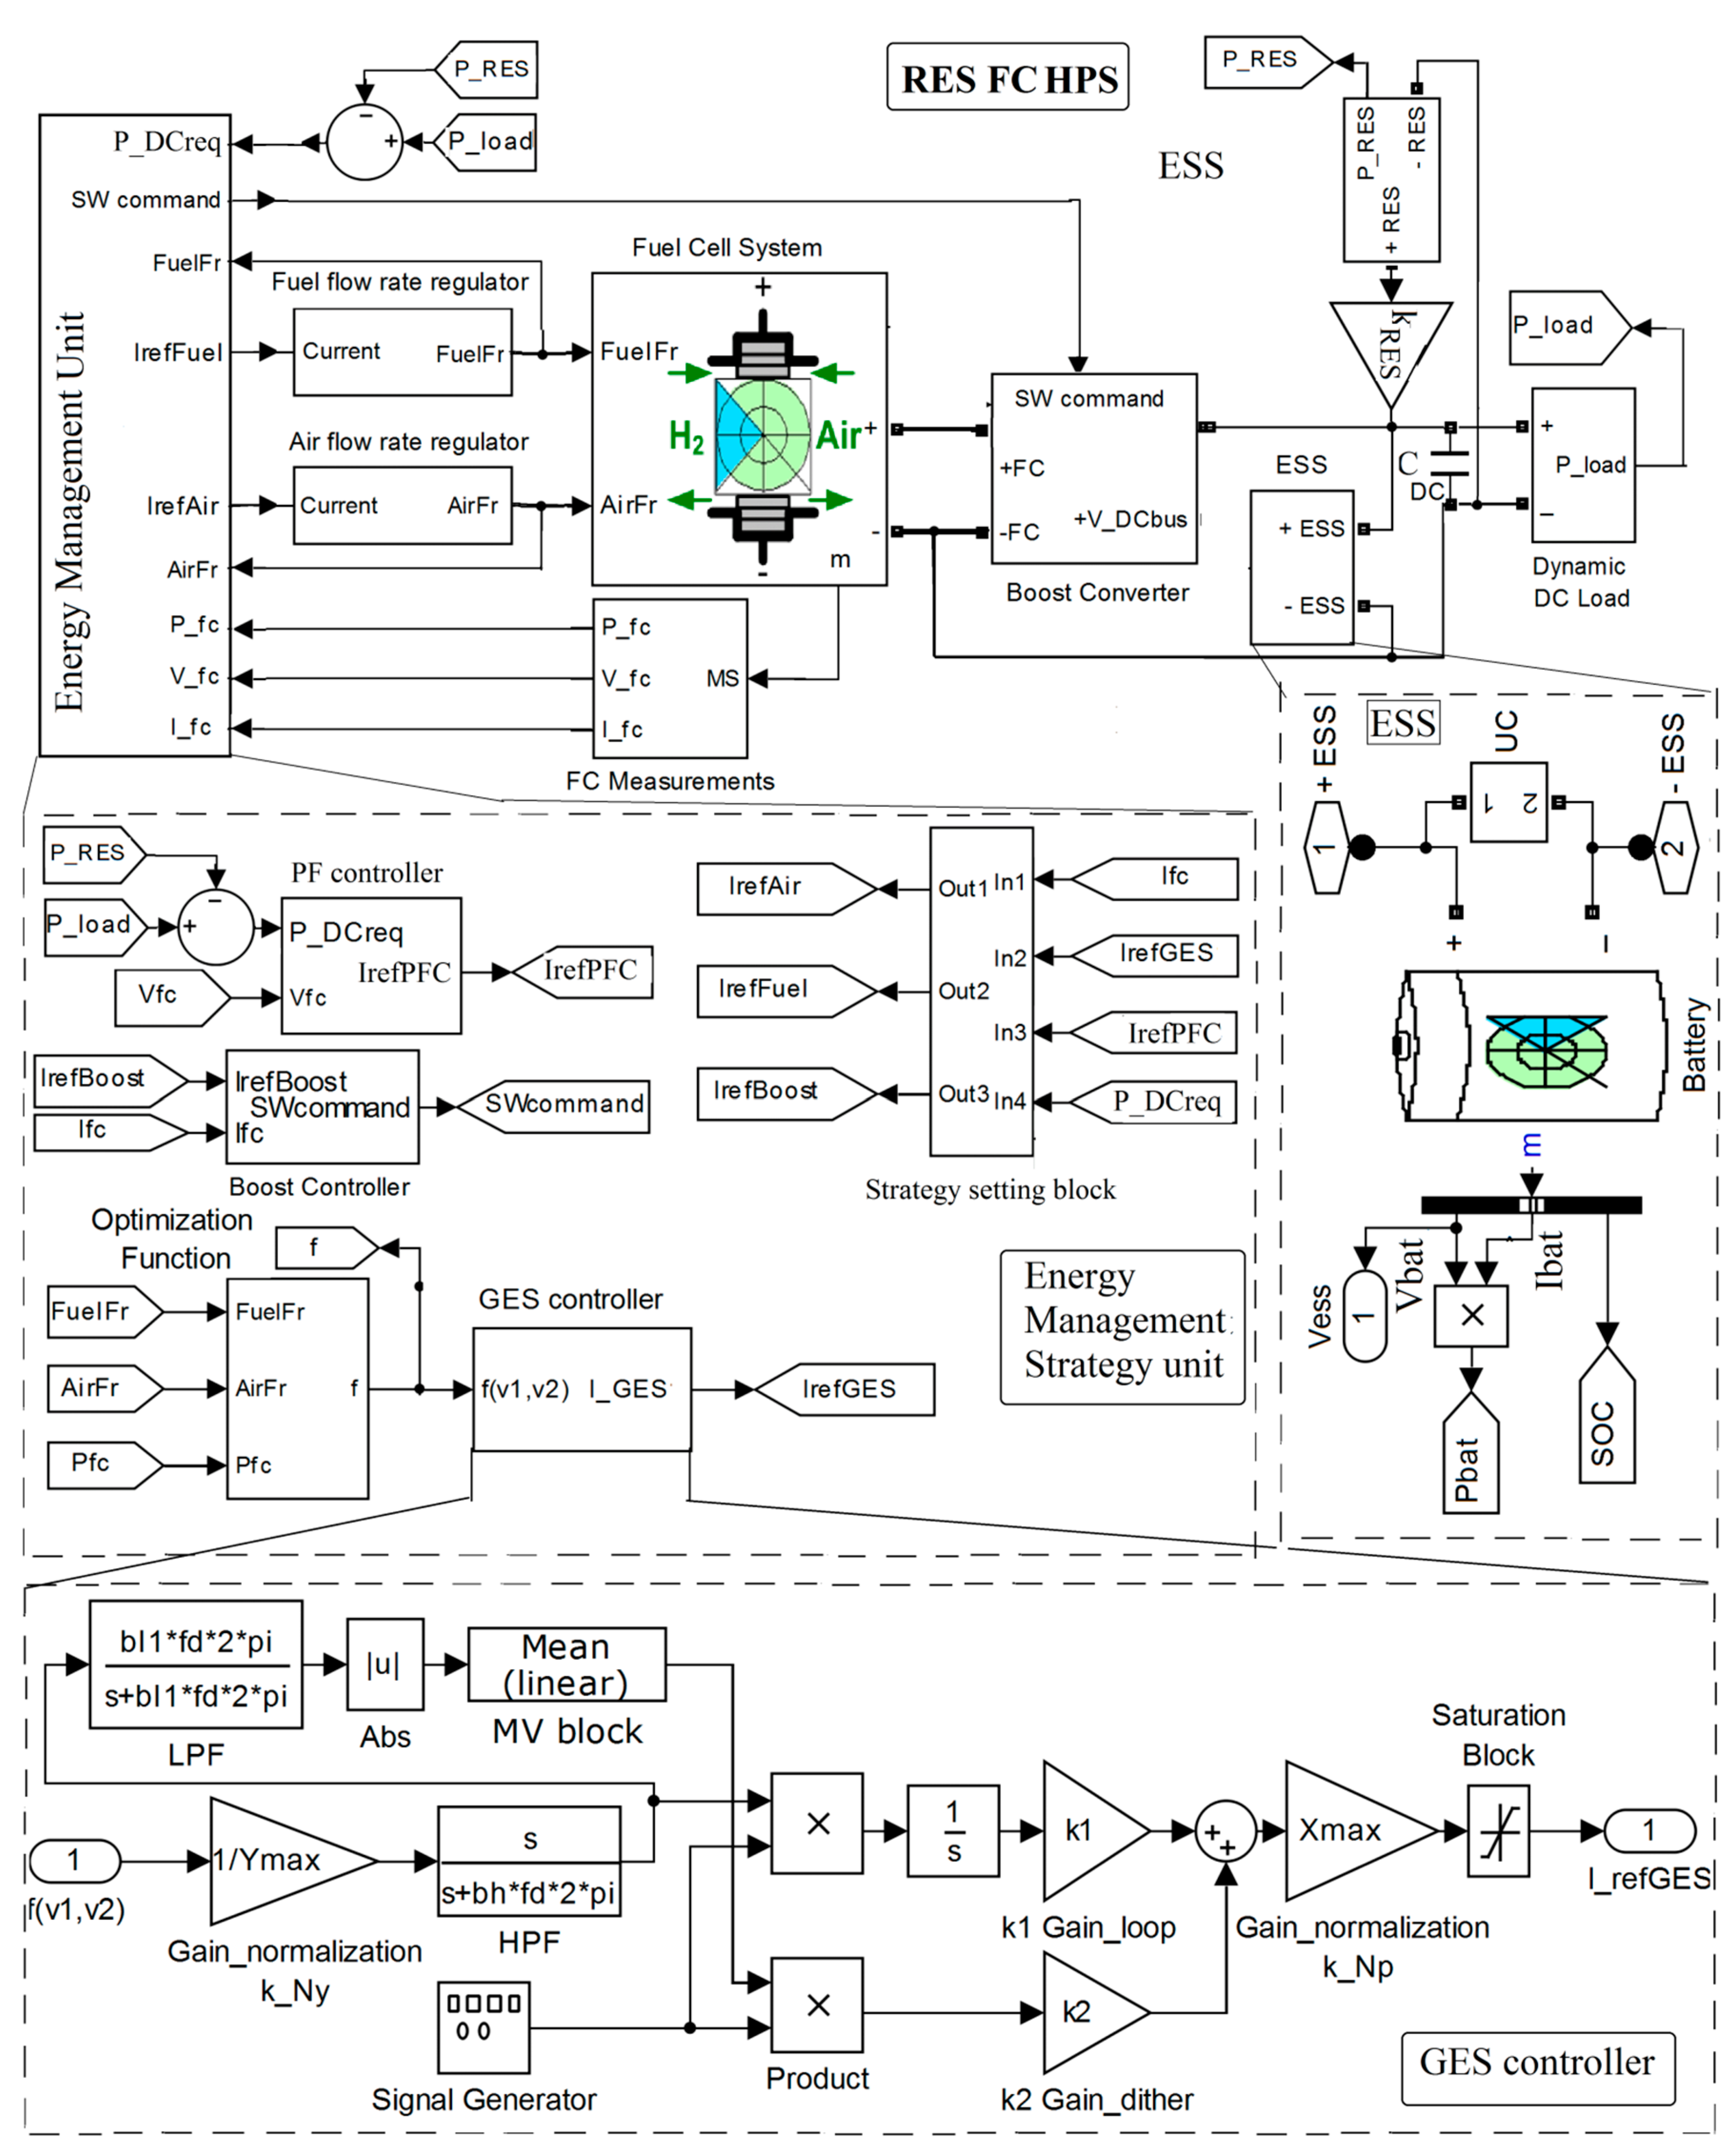
The fuel cell (FC) system, battery/ultracapacitor (UC) hybrid ESS, and FC/ESS/renewable hybrid power system (HPS) represented in
Figure 1 are analyzed under dynamic load and variable power from renewable energy sources (RESs) respectively, with the preliminary results under dynamic load presented in [
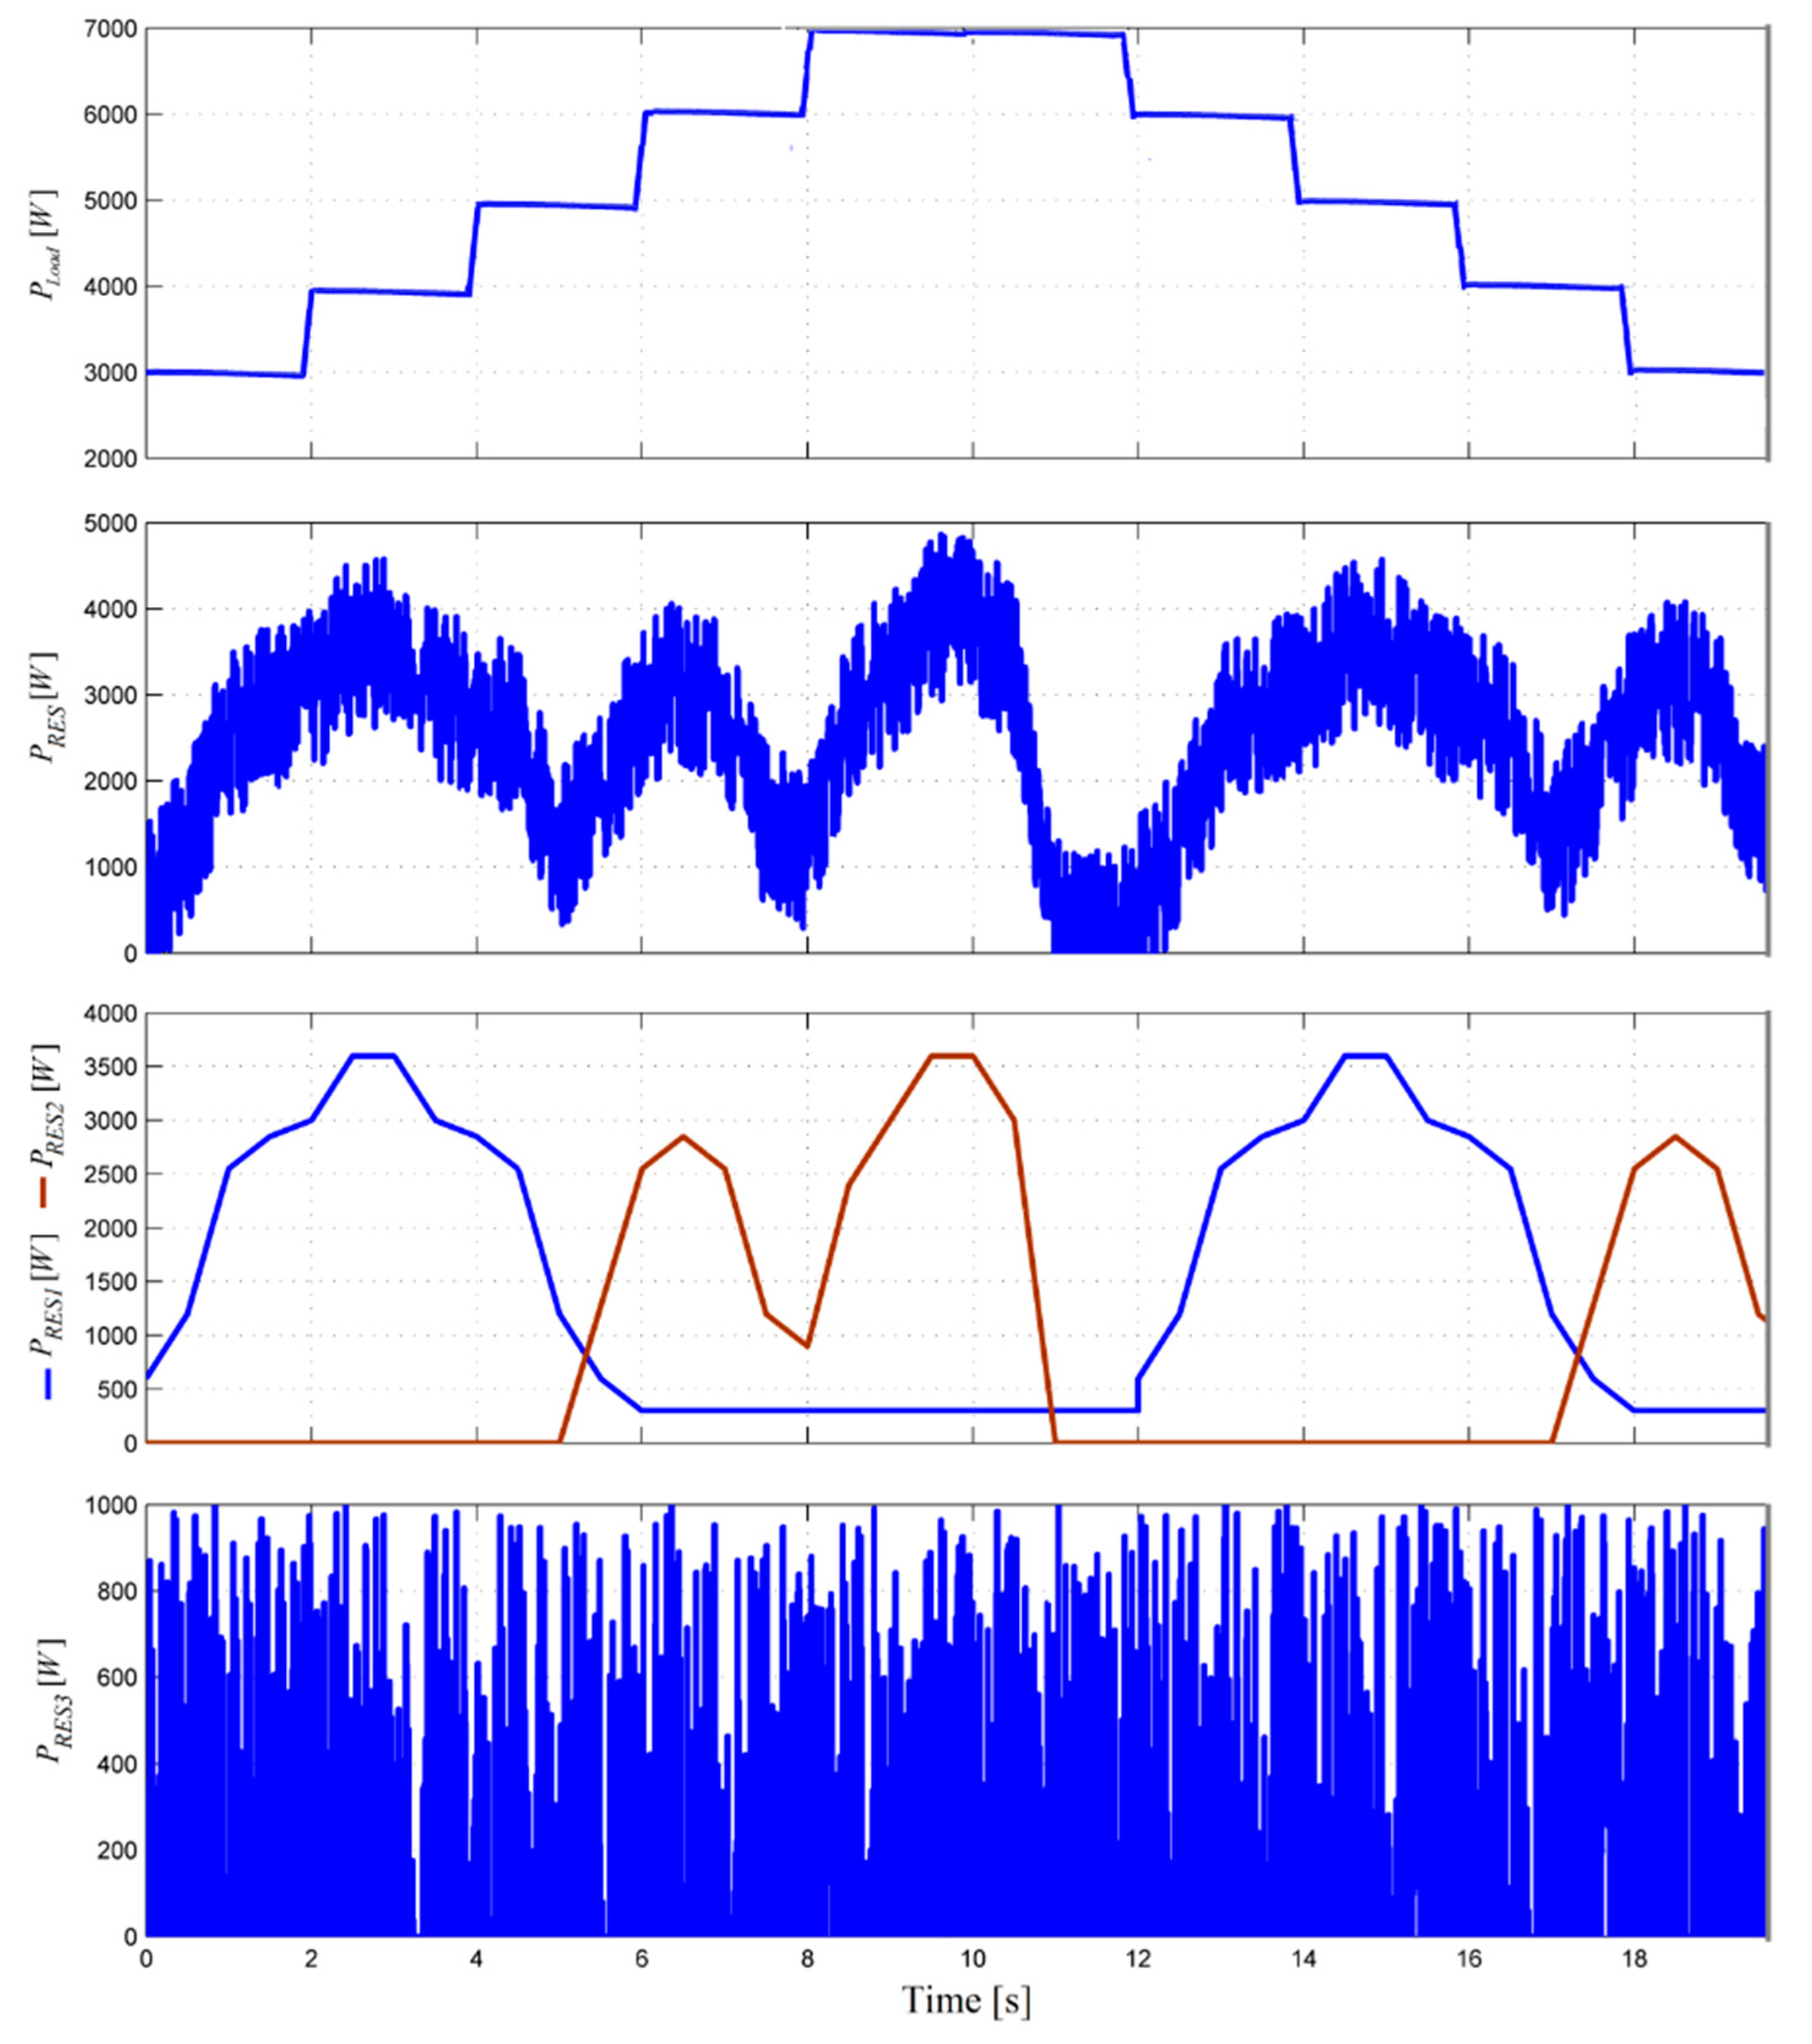
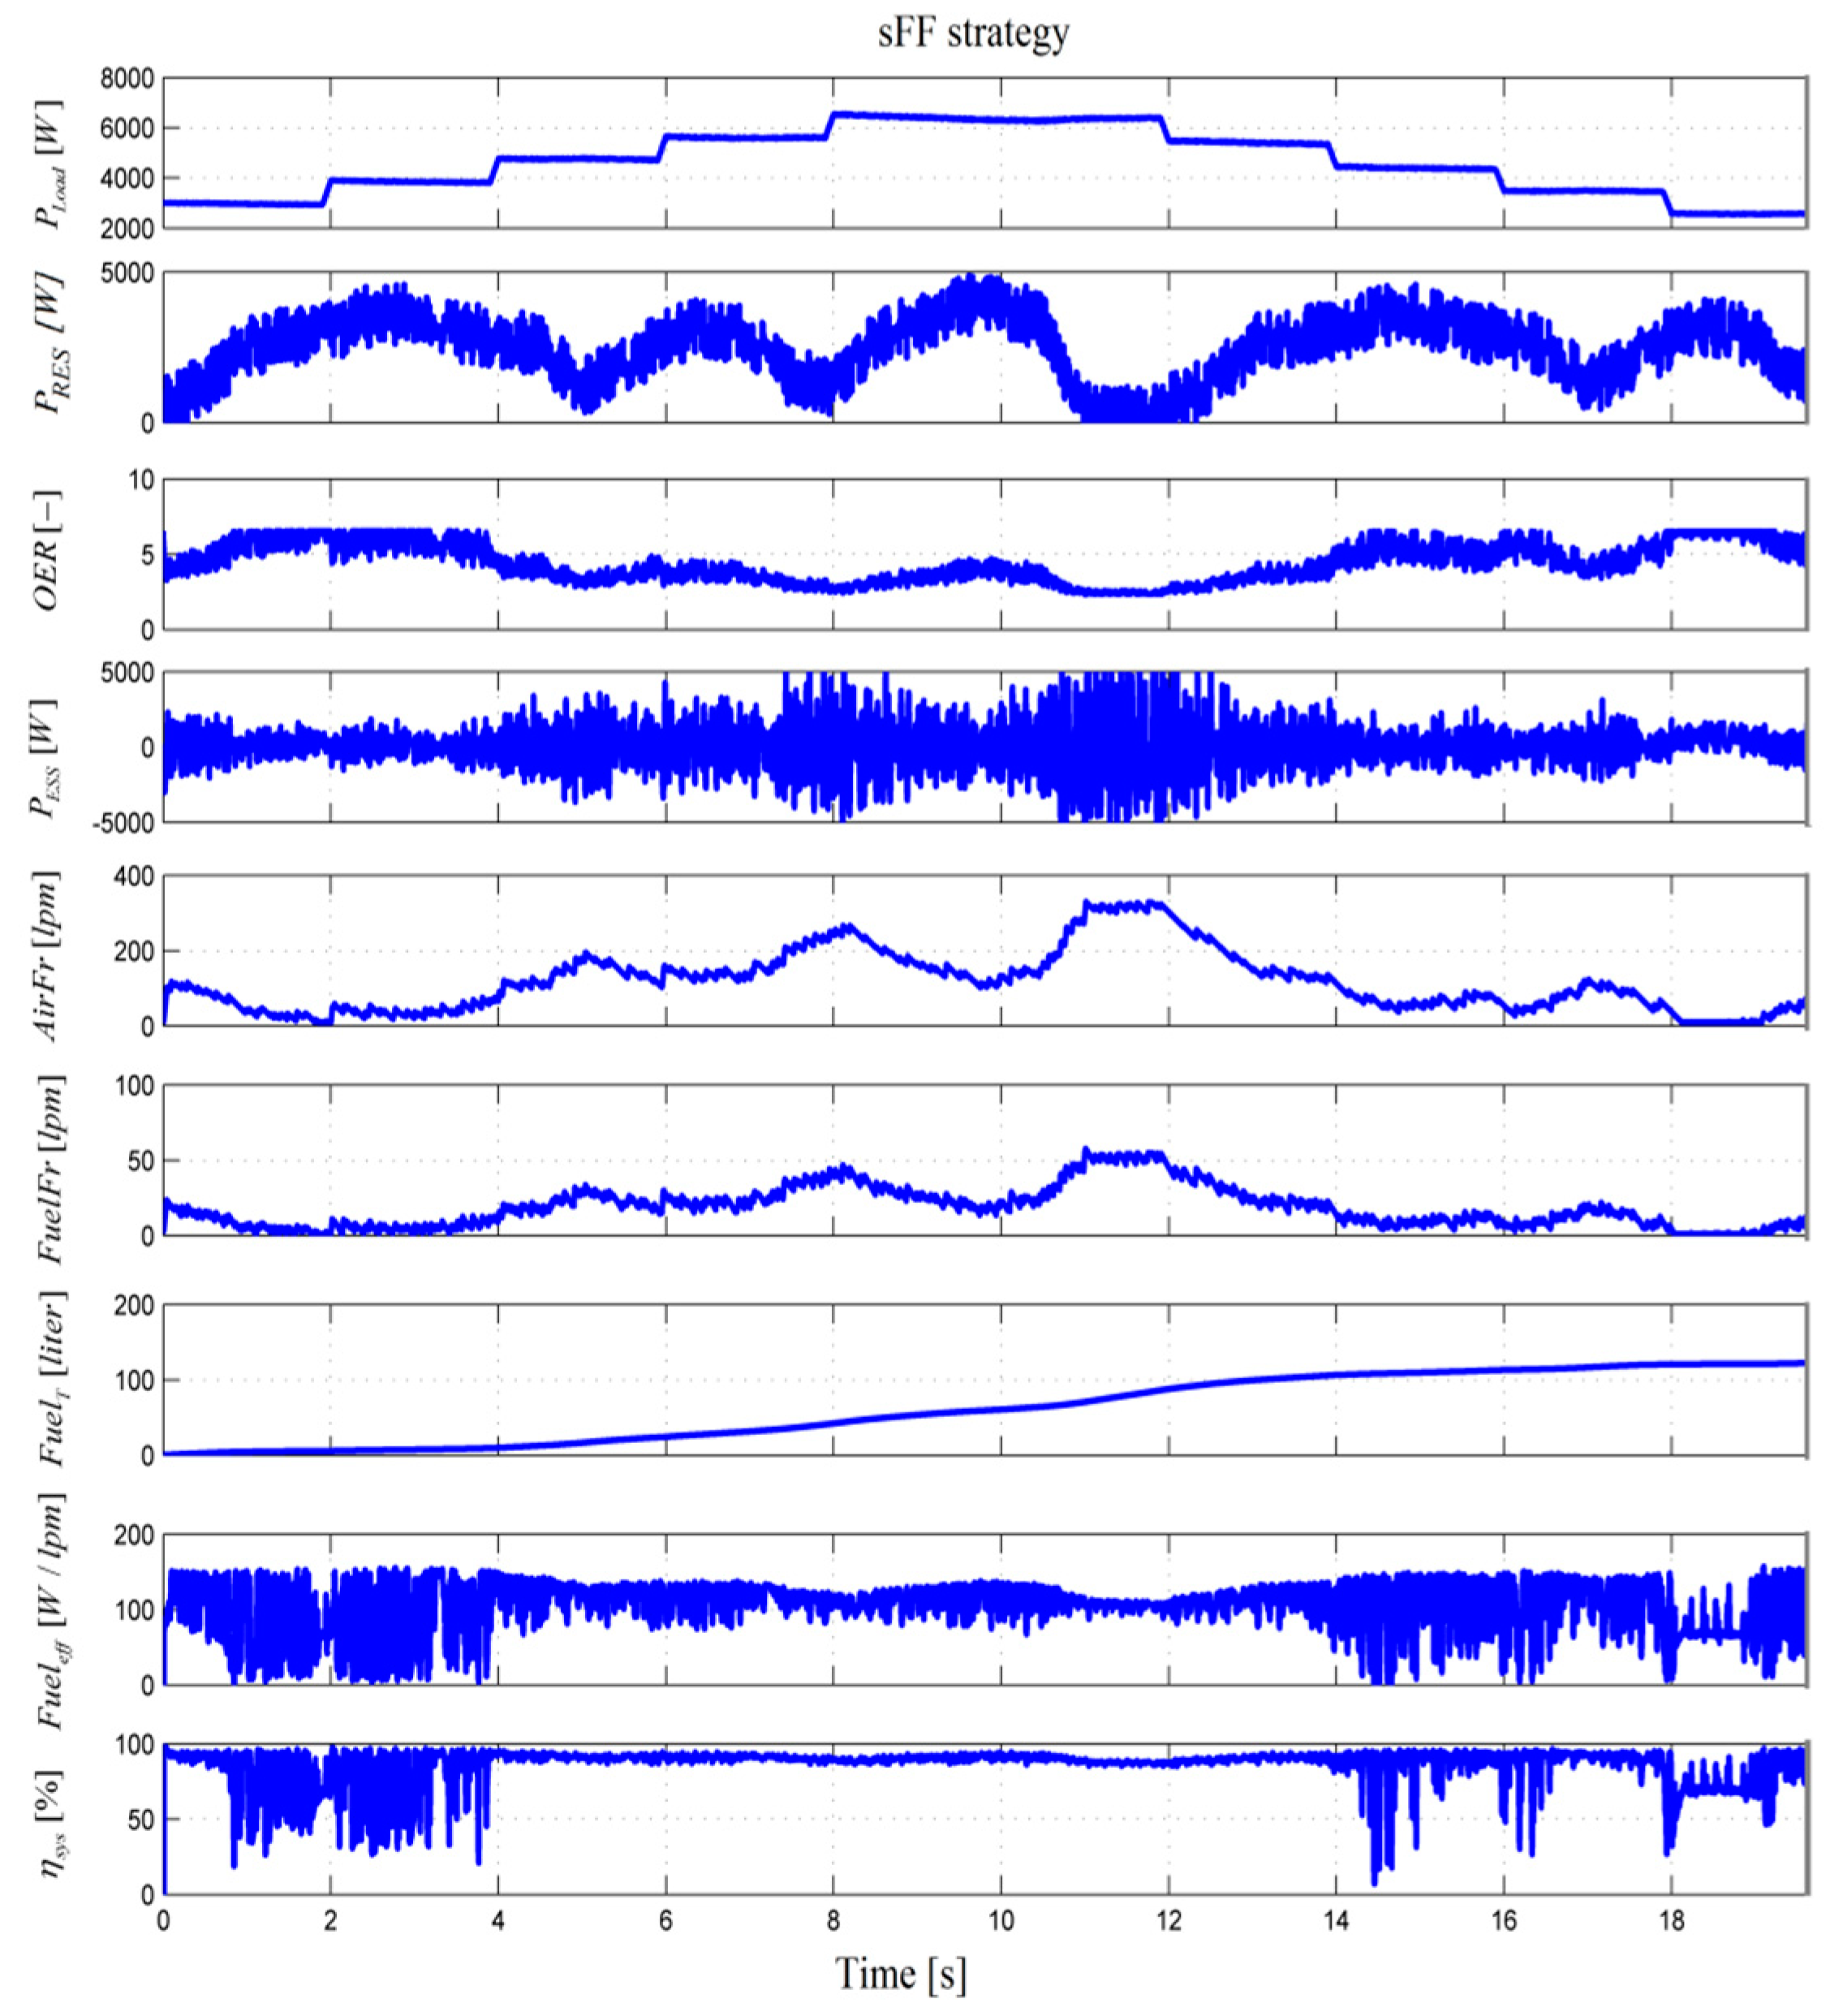
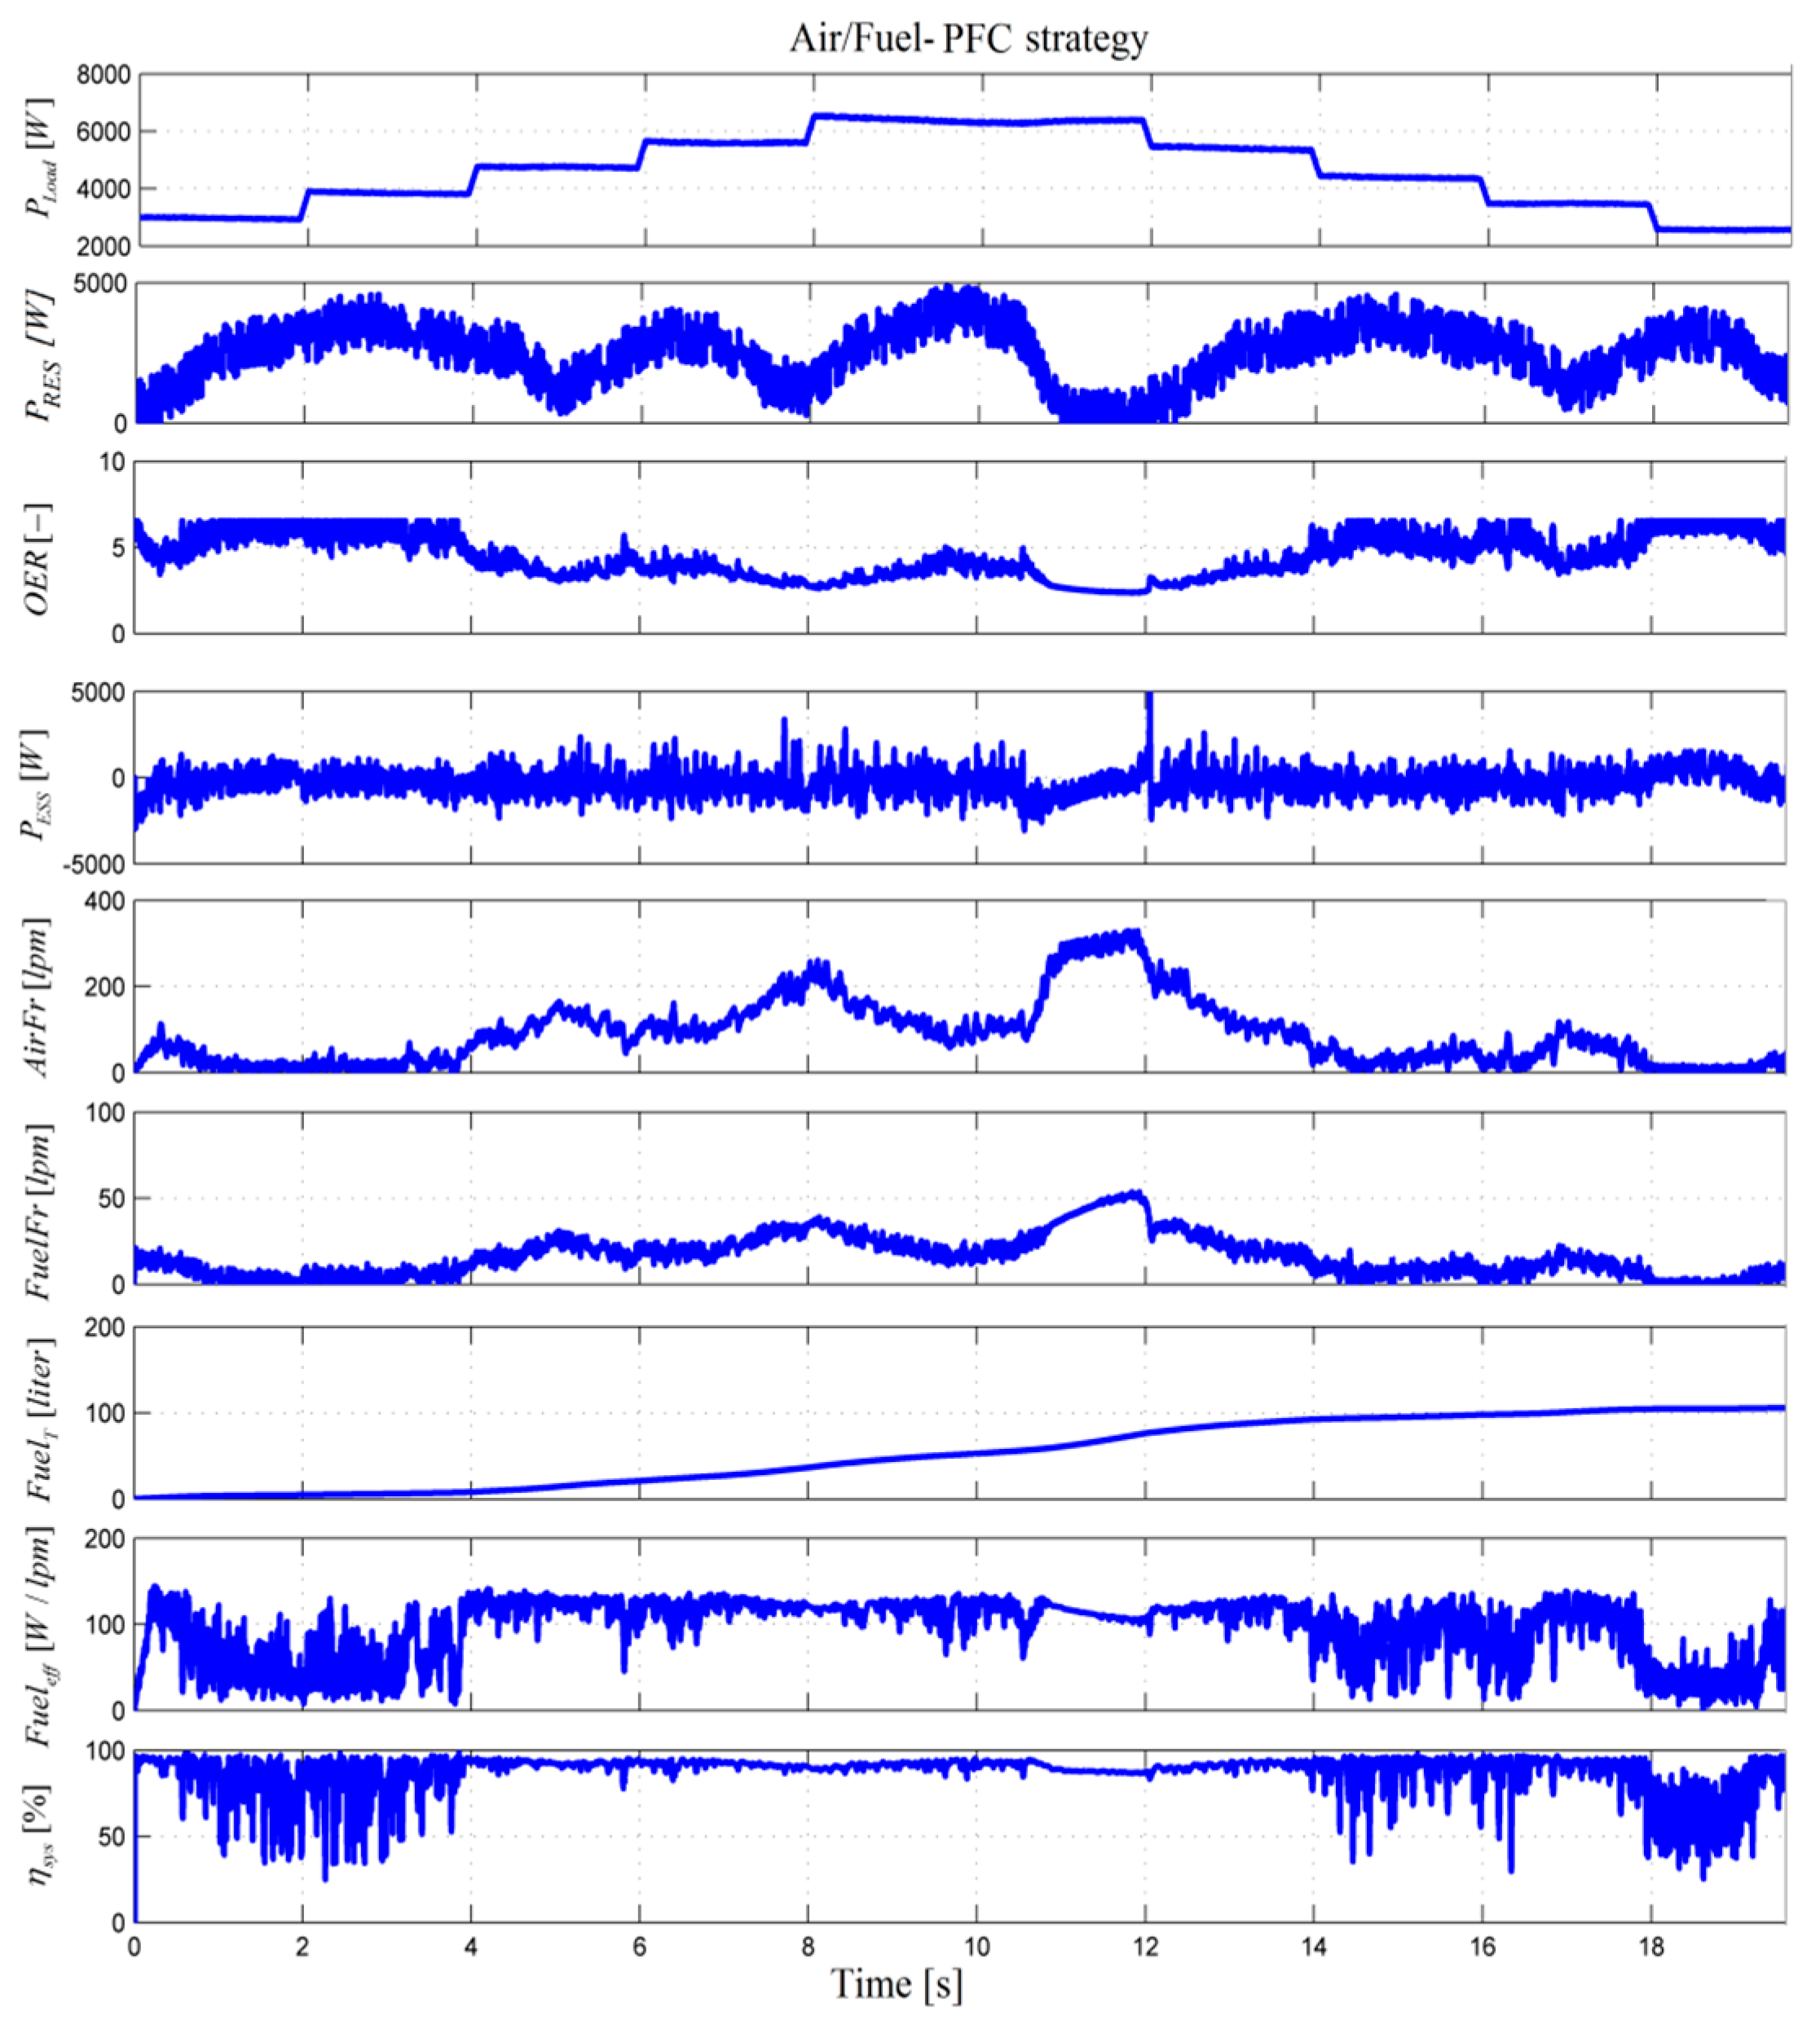
34]. The load profile that was chosen was up and down the stairs with levels changed at every 2 ms using a step of 1 kW (see
PLoad at the top of
Figure 2). The renewable energy profile (see
PRES in the 2nd plot of
Figure 2) was generated by adding the power from two renewable sources, such as the power generated by a photovoltaic park and a wind turbine farm (see
PRES1 and
PRES2 in the 3rd plot of
Figure 2), and the random profile with 1 kW peak (
PRES3 in the 4th plot of
Figure 2):
A 6 kW FC system (with the slope limits of 100 A/s for the fueling regulators and a 0.2 s time constant) was used as the backup energy source to mitigate the variability of the power flow from the renewable energy sources (RESs) under power-following control (PFC) implemented in the energy management strategy (EMS) unit. This PFC-based strategy operates the battery stack in the charge-sustained mode, avoiding frequent charge-discharge cycles, as is shown below, which will obviously lead to an increase in battery lifespan.
The power flow balance (2) is sustained by a 100 Ah battery with a 100 F ultracapacitor energy storage system (ESS) using a semi-active ESS topology, having the battery on a 200 V DC bus and the ultracapacitors via a bidirectional DC-DC buck–boost converter (see
Figure 1):
where
is the capacitor connected on the DC bus.
The power difference on the DC bus,
−
, will be mainly generated by the FC system due to the PFC-based strategy implemented for the fueling regulators. Consequently, the mean value (MV) of the battery’s power exchanged with the DC bus is almost zero, except the abrupt transition on load (as it is the case of the load profile chosen in this study):
This charging mode is very useful in operating a battery stack, increasing the battery lifespan, reducing its size (capacity) and maintenance costs [
35,
36]. Due to the 20 s time constant of the battery used in simulation, the dynamic compensation of the power balance (2) will be ensured by capacitor
of 0.01 F and by 100 F ultracapacitors via the bidirectional DC-DC buck–boost converter controlled by DC voltage regulation loop [
37,
38].
Thus, considering (3), the MV of the power balance (2) can be written as (4):
The FC power (
) that is generated on the DC bus is the FC net power (
):
where
is the efficiency of the DC-DC converter;
and
is the FC-generated power and FC net power, respectively; and
represents the power losses of the air compressor that is modeled using (6) and a 2nd order dynamic system with a 100 Hz natural frequency and 0.7 damping ratio [
39,
40]:
where
,
,
,
, and
. Considering (4) and (5), the PFC reference (
) is given by (7):
A PFC-based strategy of FC net power can be implemented through the boost controller, the air regulator, and the fuel regulator, using the strategy settings block to set an
reference to one of their references,
,
, or
, respectively (see the EMS unit in
Figure 1). The fuel economy-based strategy can be implemented through optimal control based on the global extremum seeking (GES) controller [
41,
42,
43] (see
Figure 1) that generates the
reference by maximizing the multicriteria optimization function (8) that mixes the FC net power (
PFCnet) and the fuel consumption efficiency (
Fueleff =
PFCnet/FuelFr):
where vector
x represents the FC state variables [
44,
45]; and GES variables
v1 =
AirFr and
v2 =
FuelFr are the air flow rate (
AirFr) and the fuel flow rate (
FuelFr), respectively, given by (9) [
46]:
where
are default parameters [
47].
and
act as a perturbation during the GES-based search of the optimal point, depending on the weighting parameter
kfuel, which can be set at zero to maximize
PFCnet [
48] or at 25 (lpm/W) to reduce the fuel consumption, i.e.,
[
49,
50].
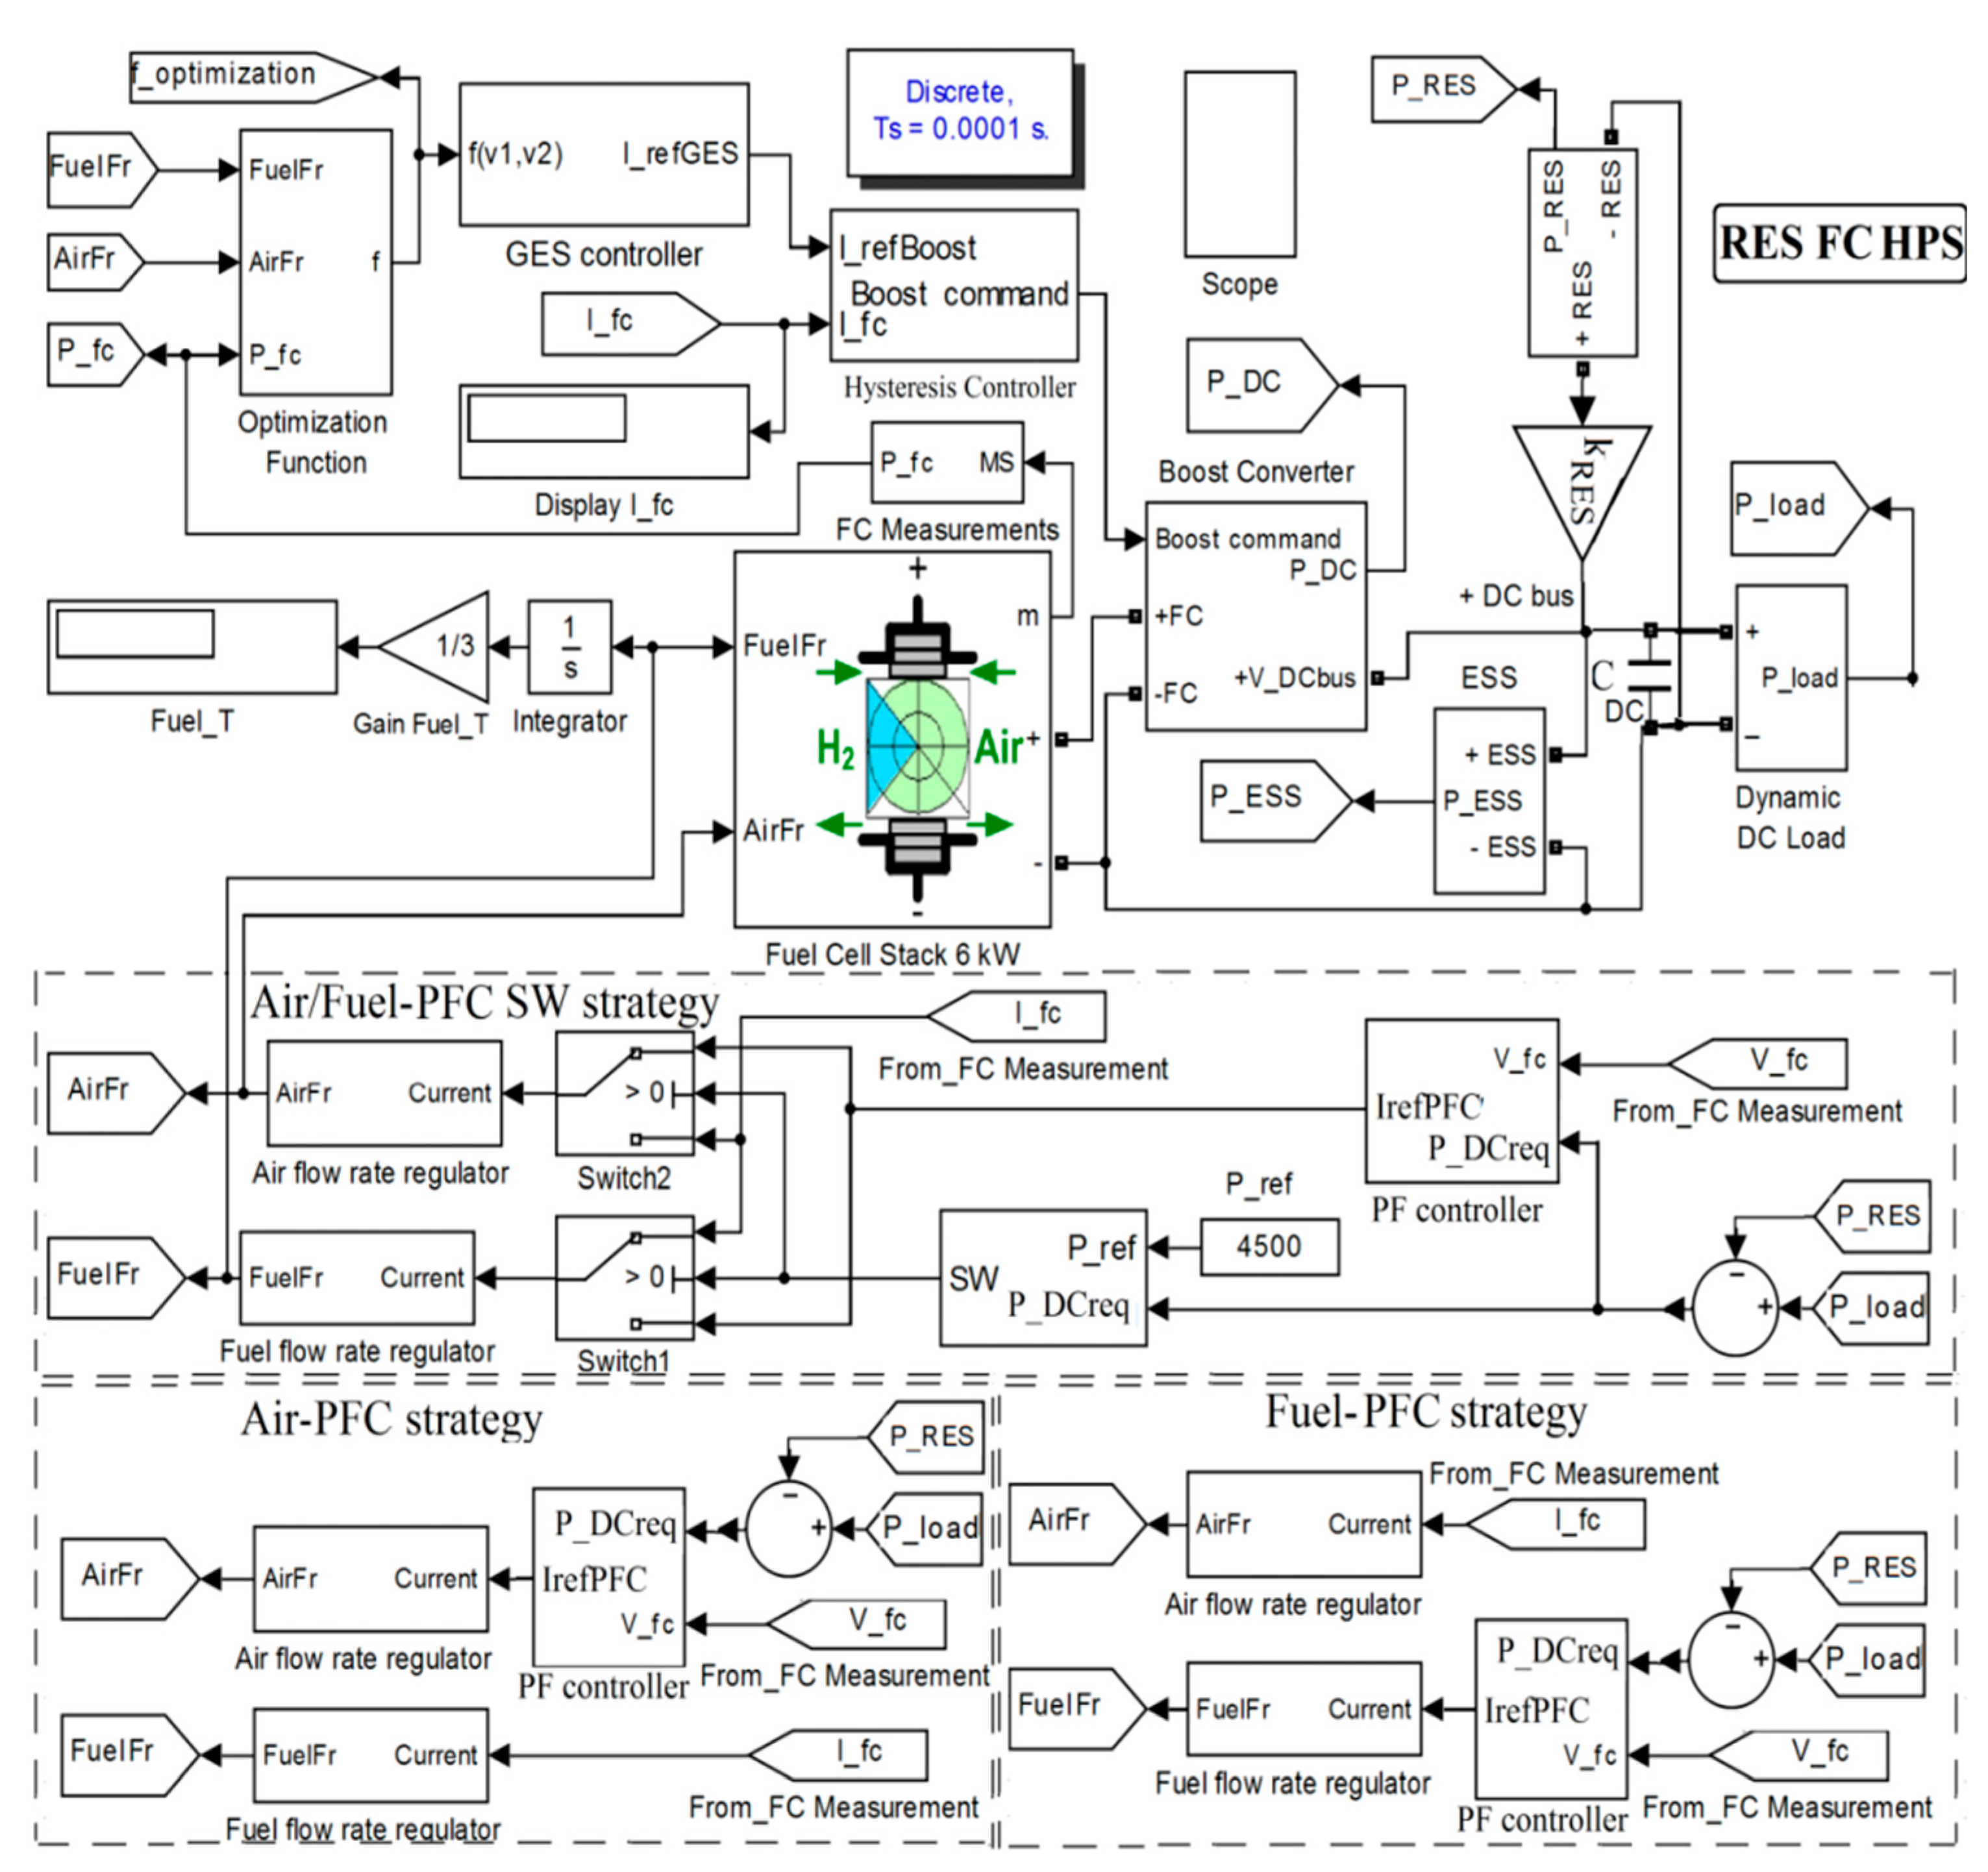
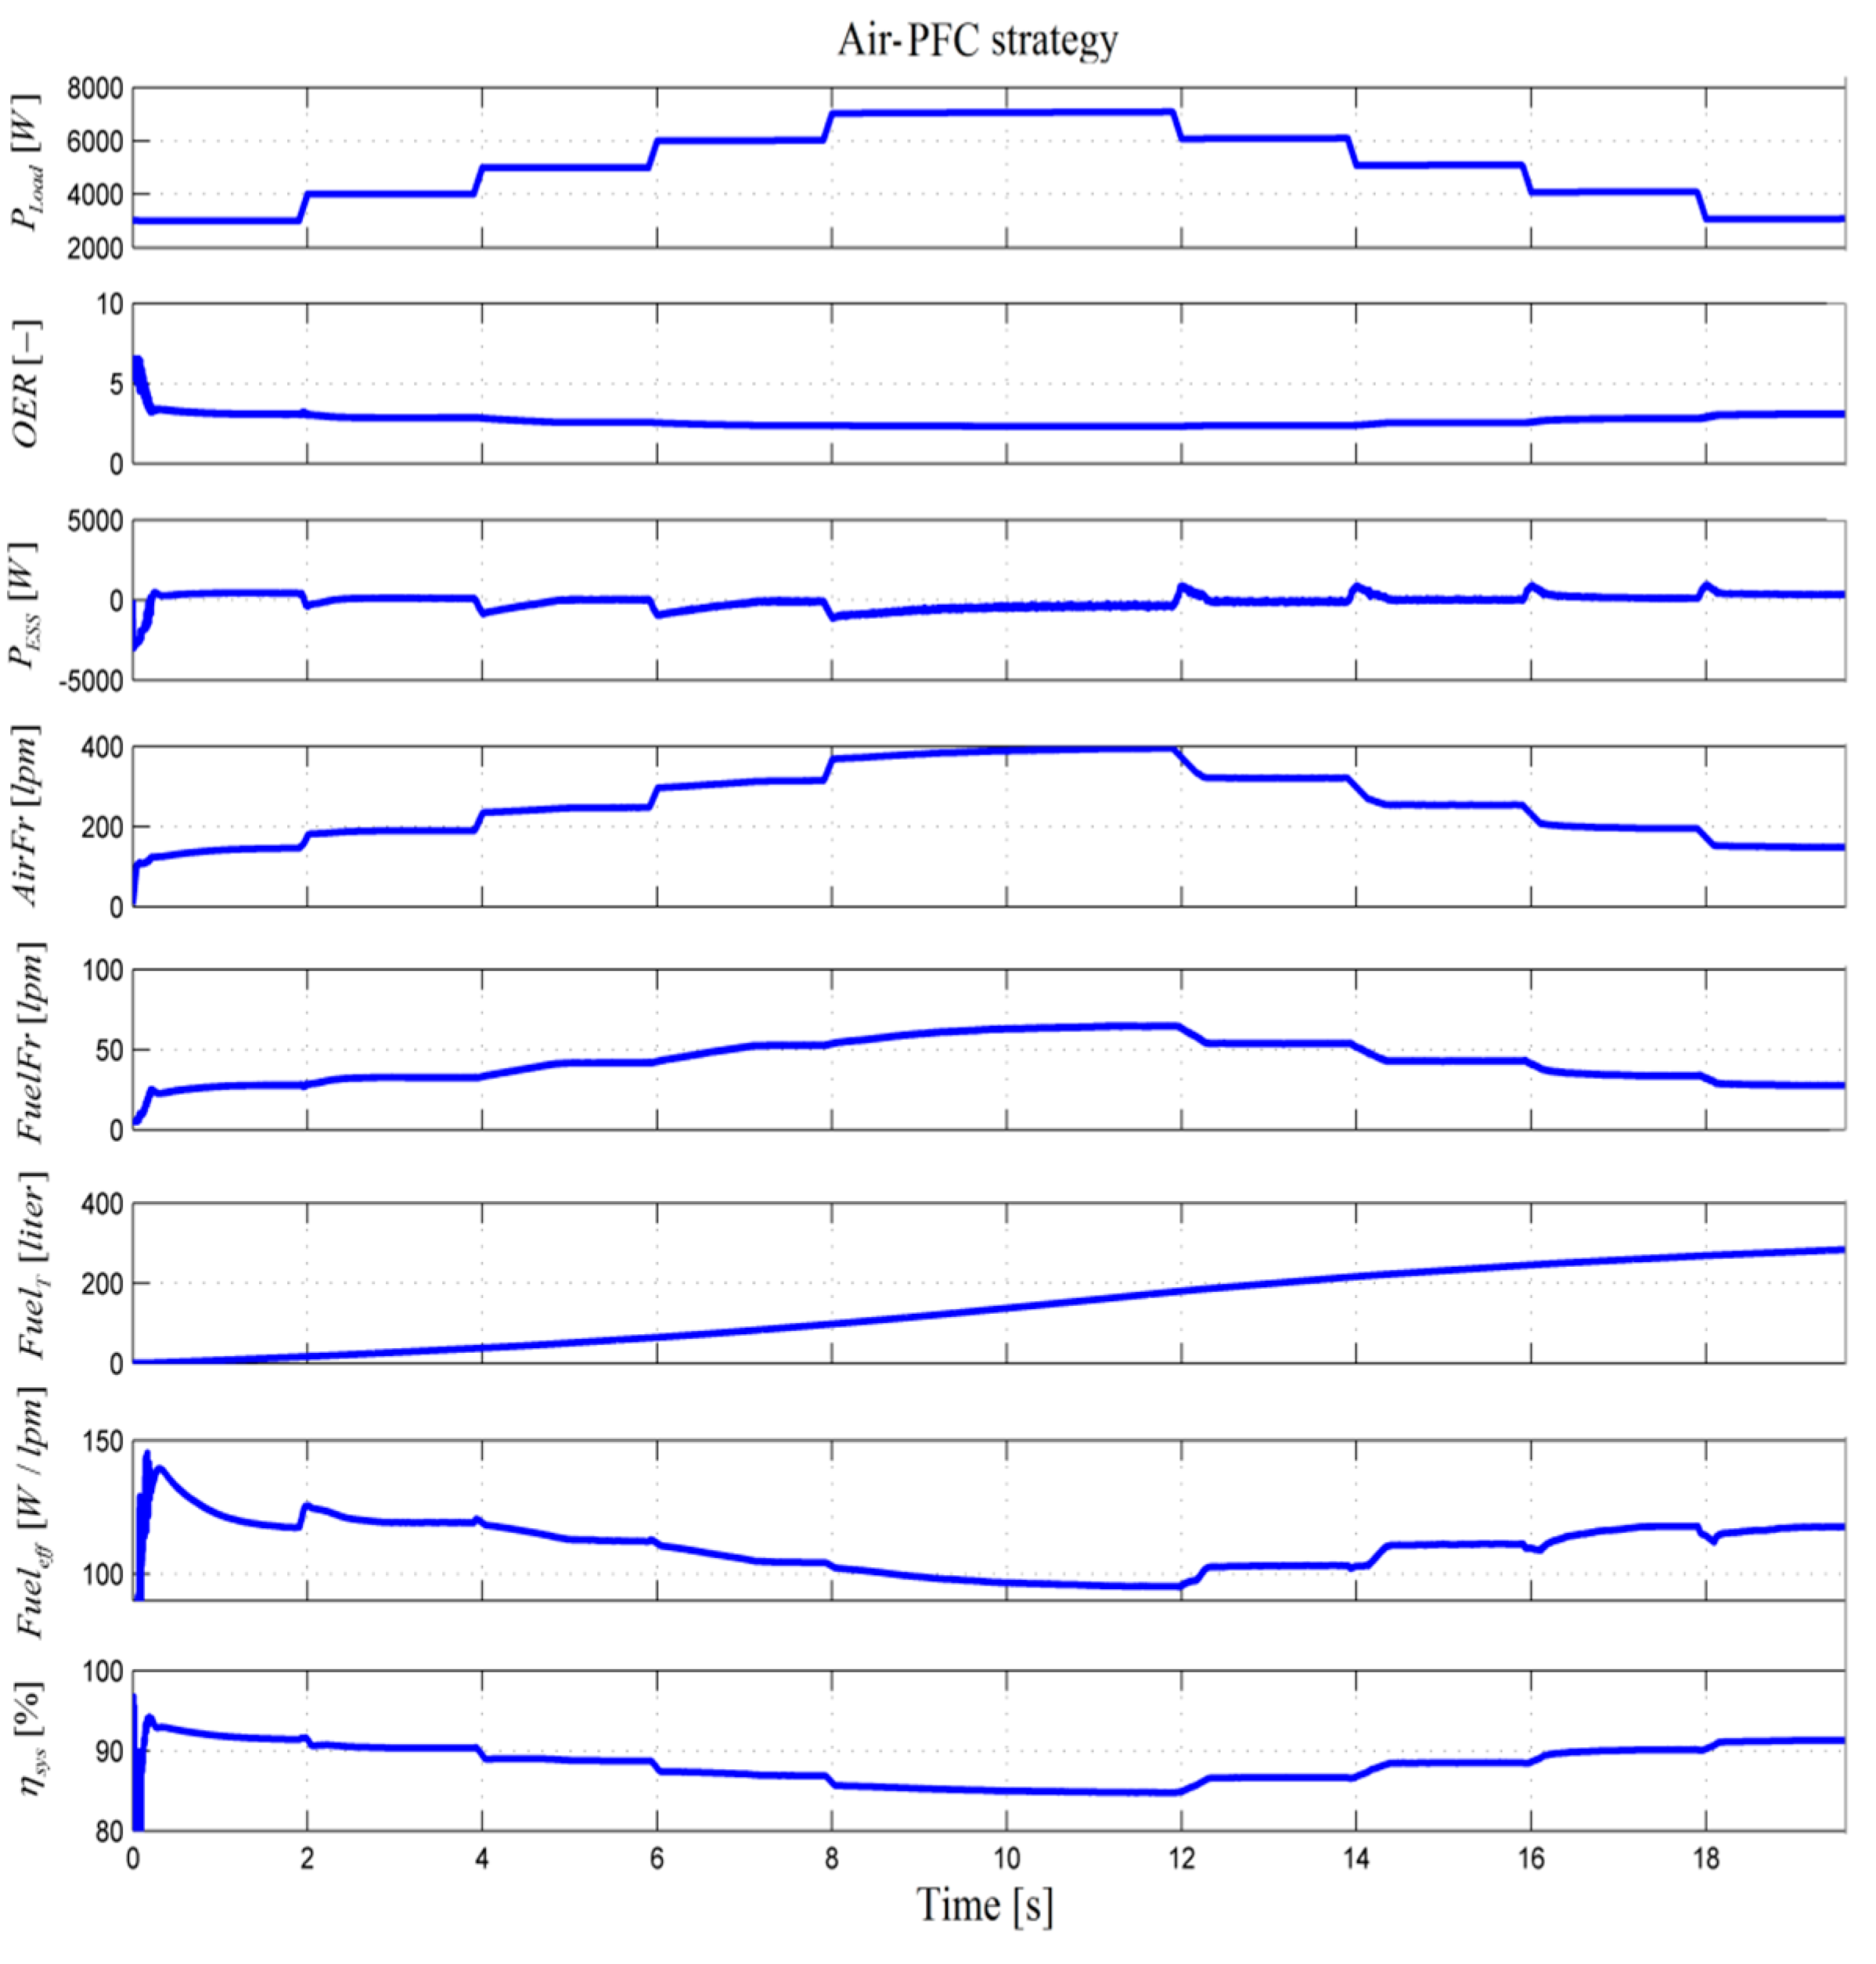
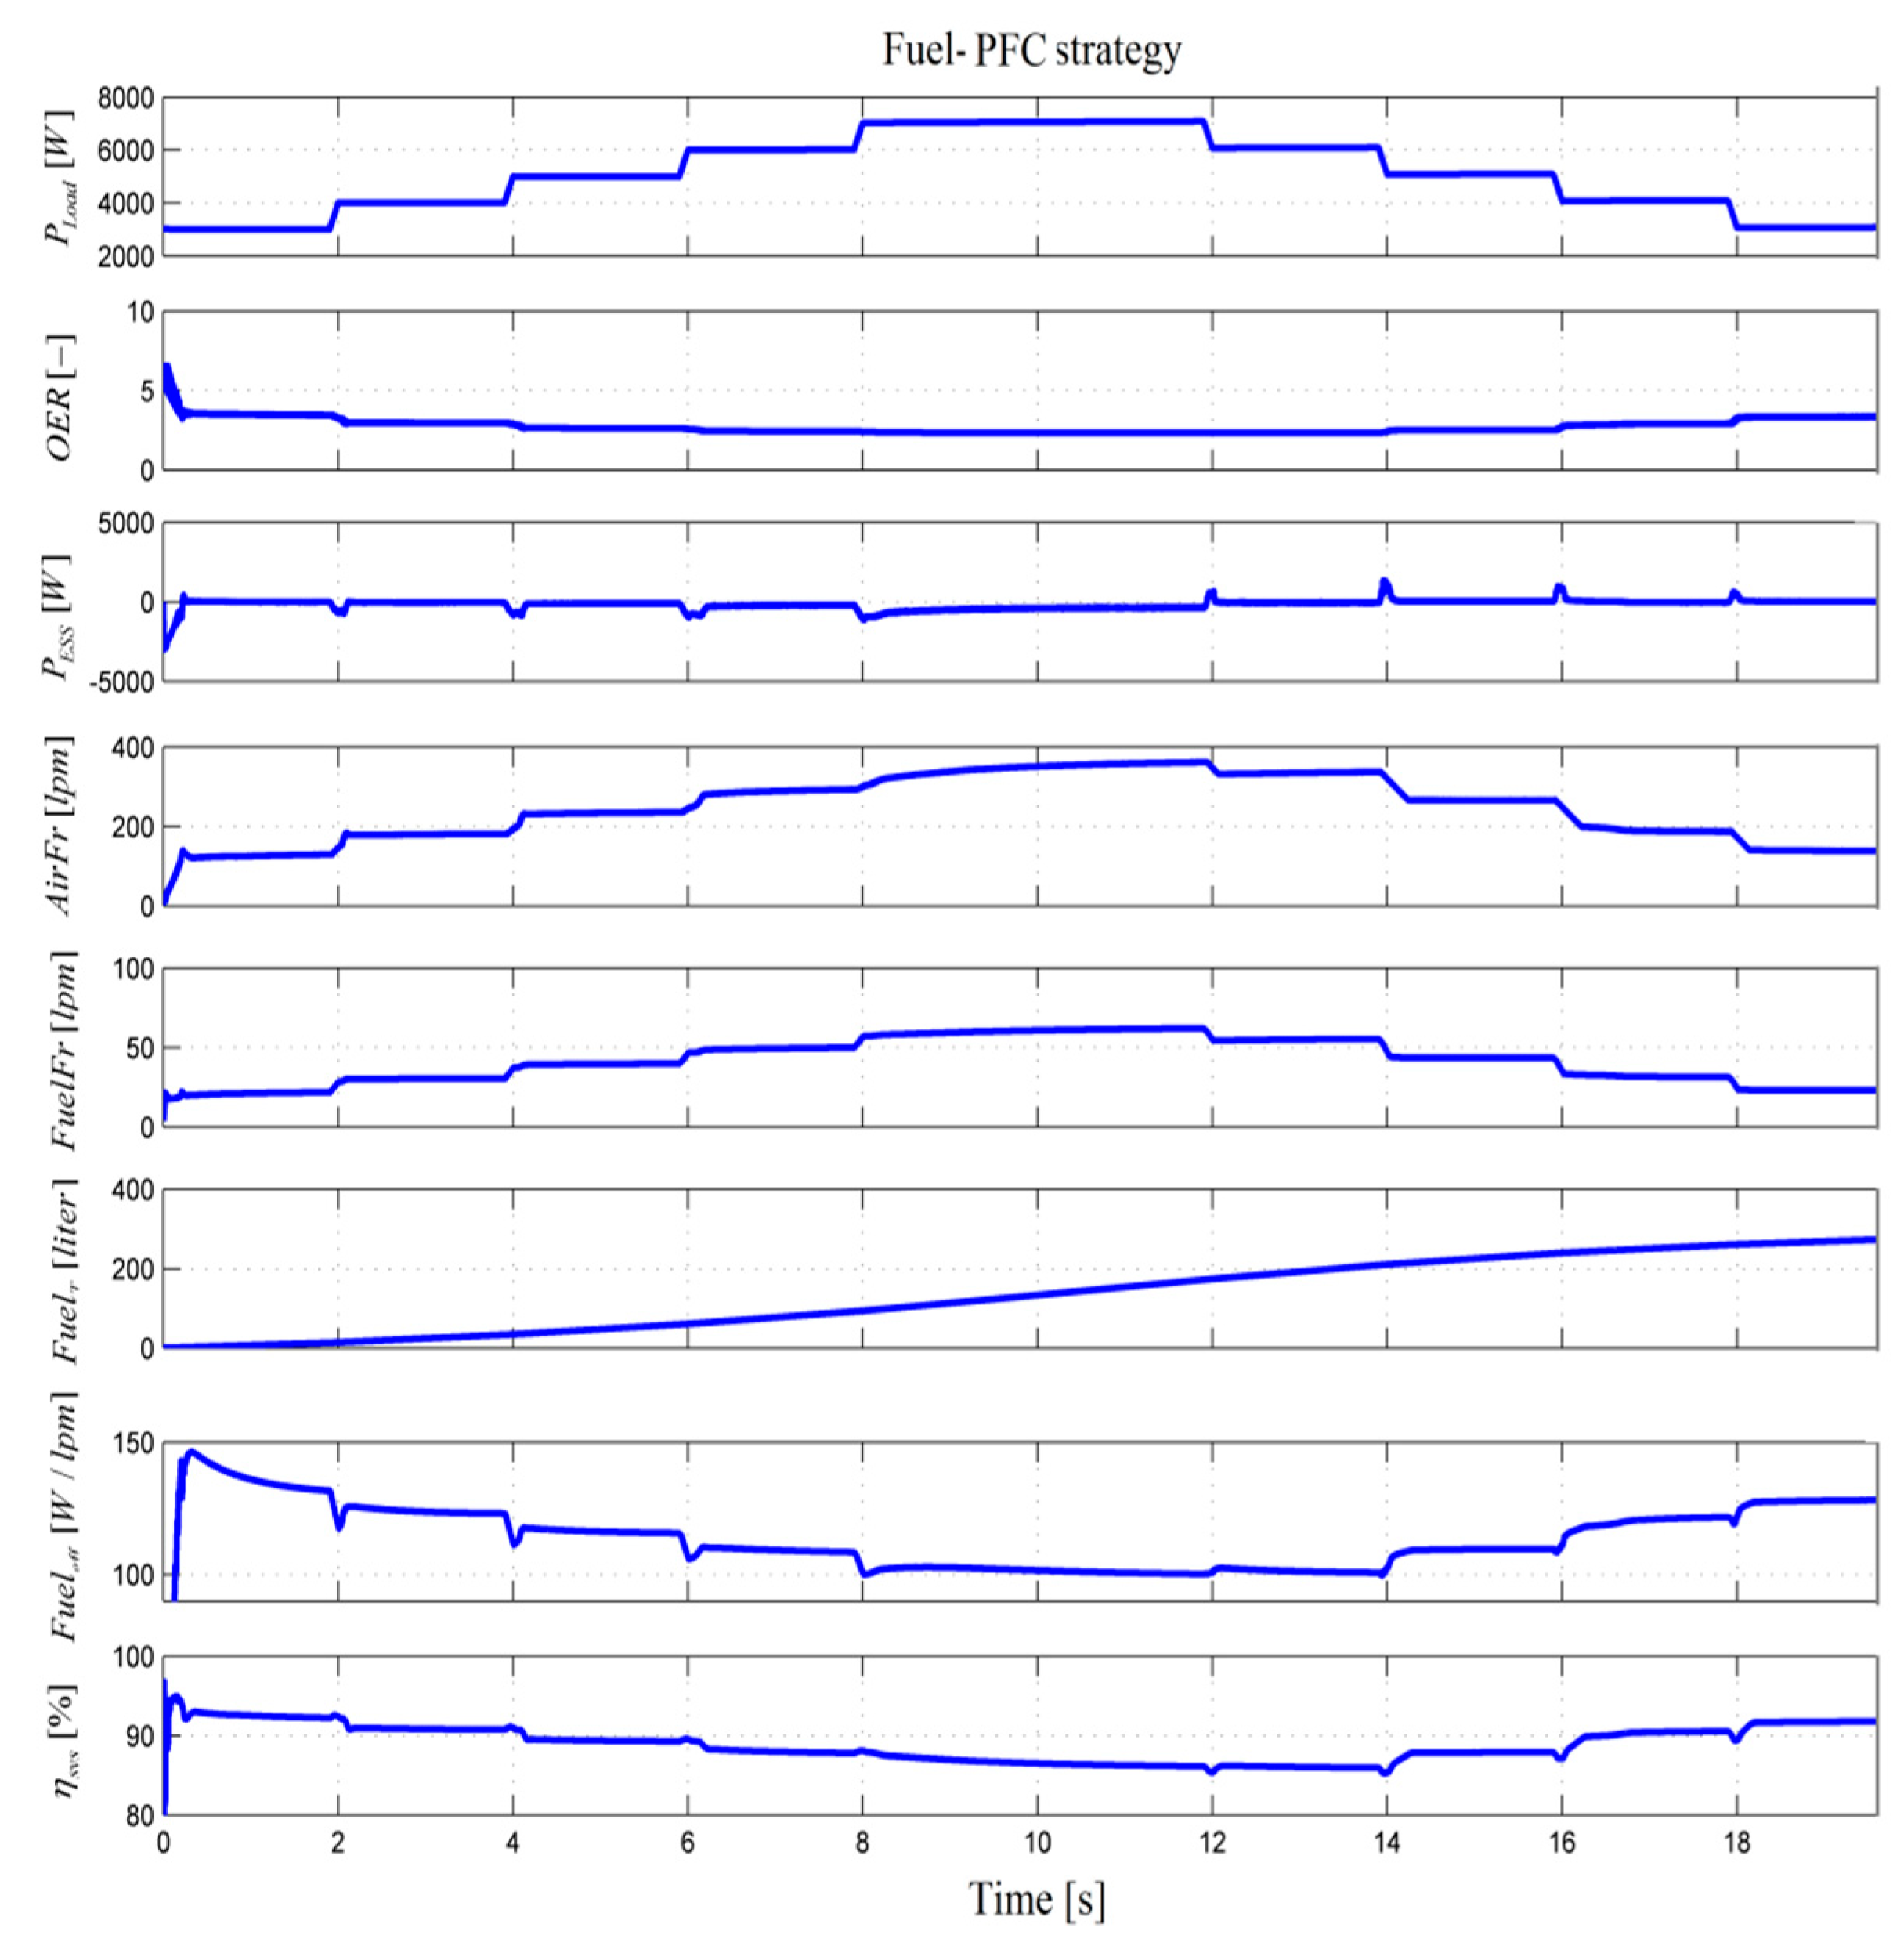
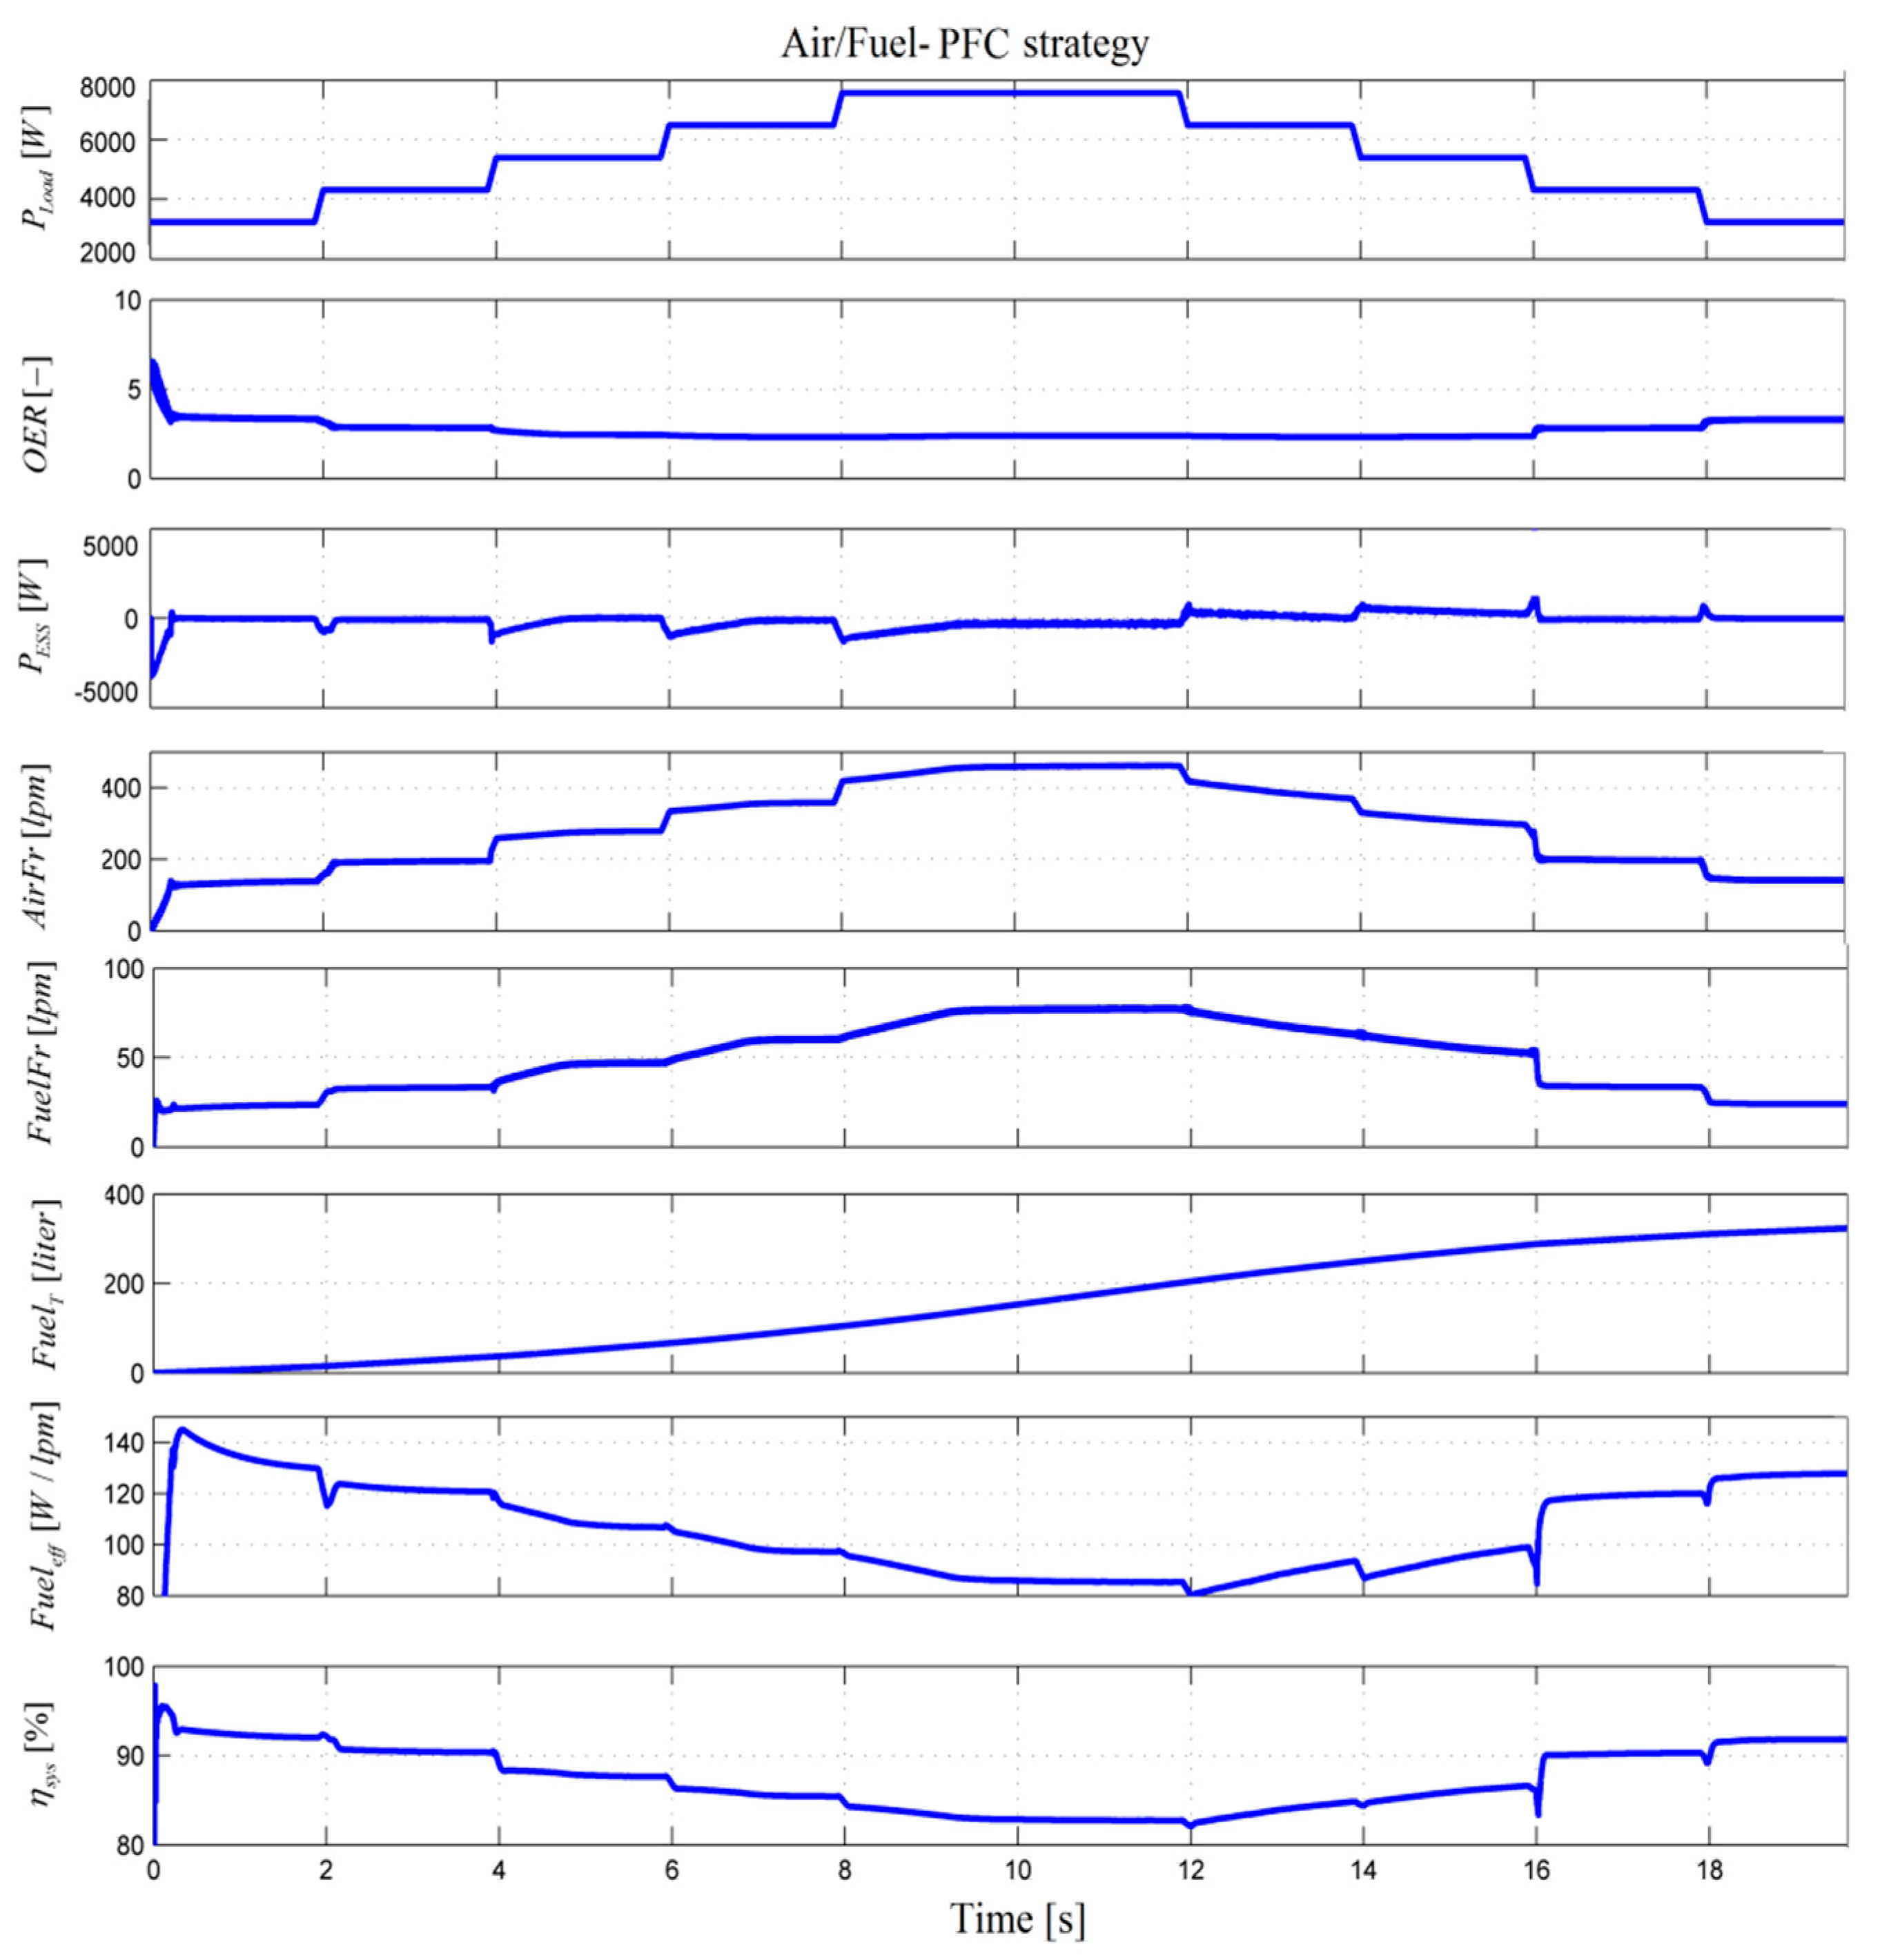
In this study, the DC-DC boost converter was optimally controlled to improve fuel economy, and the PFC-based strategy of the FC net power was implemented through the air regulator or the fuel regulator using the strategies air-PFC or fuel-PFC, respectively, or by both fueling regulators in the switching (SW) strategy (called air/fuel-PFC) that switches the
reference to the air regulator or the fuel regulator using a power threshold of 5.5 kW for the power requested on the DC bus (
). Thus, the strategies air-PFC, fuel-PFC, and air/fuel-PFC are set by (10a), (10b), and (10c) respectively:
The diagram of FC/ESS renewable HPS using the strategies air-PFC, fuel-PFC, and air/fuel-PFC is presented in
Figure 3, and
sets the level of RES power on the DC bus. If
is zero (
), then the case of the FC system will be analyzed. If
is different to zero, then the case of the FC/renewable HPS will be analyzed. In the last case, if
, then the excess of power (
) will supply an electrolyzer to produce hydrogen.
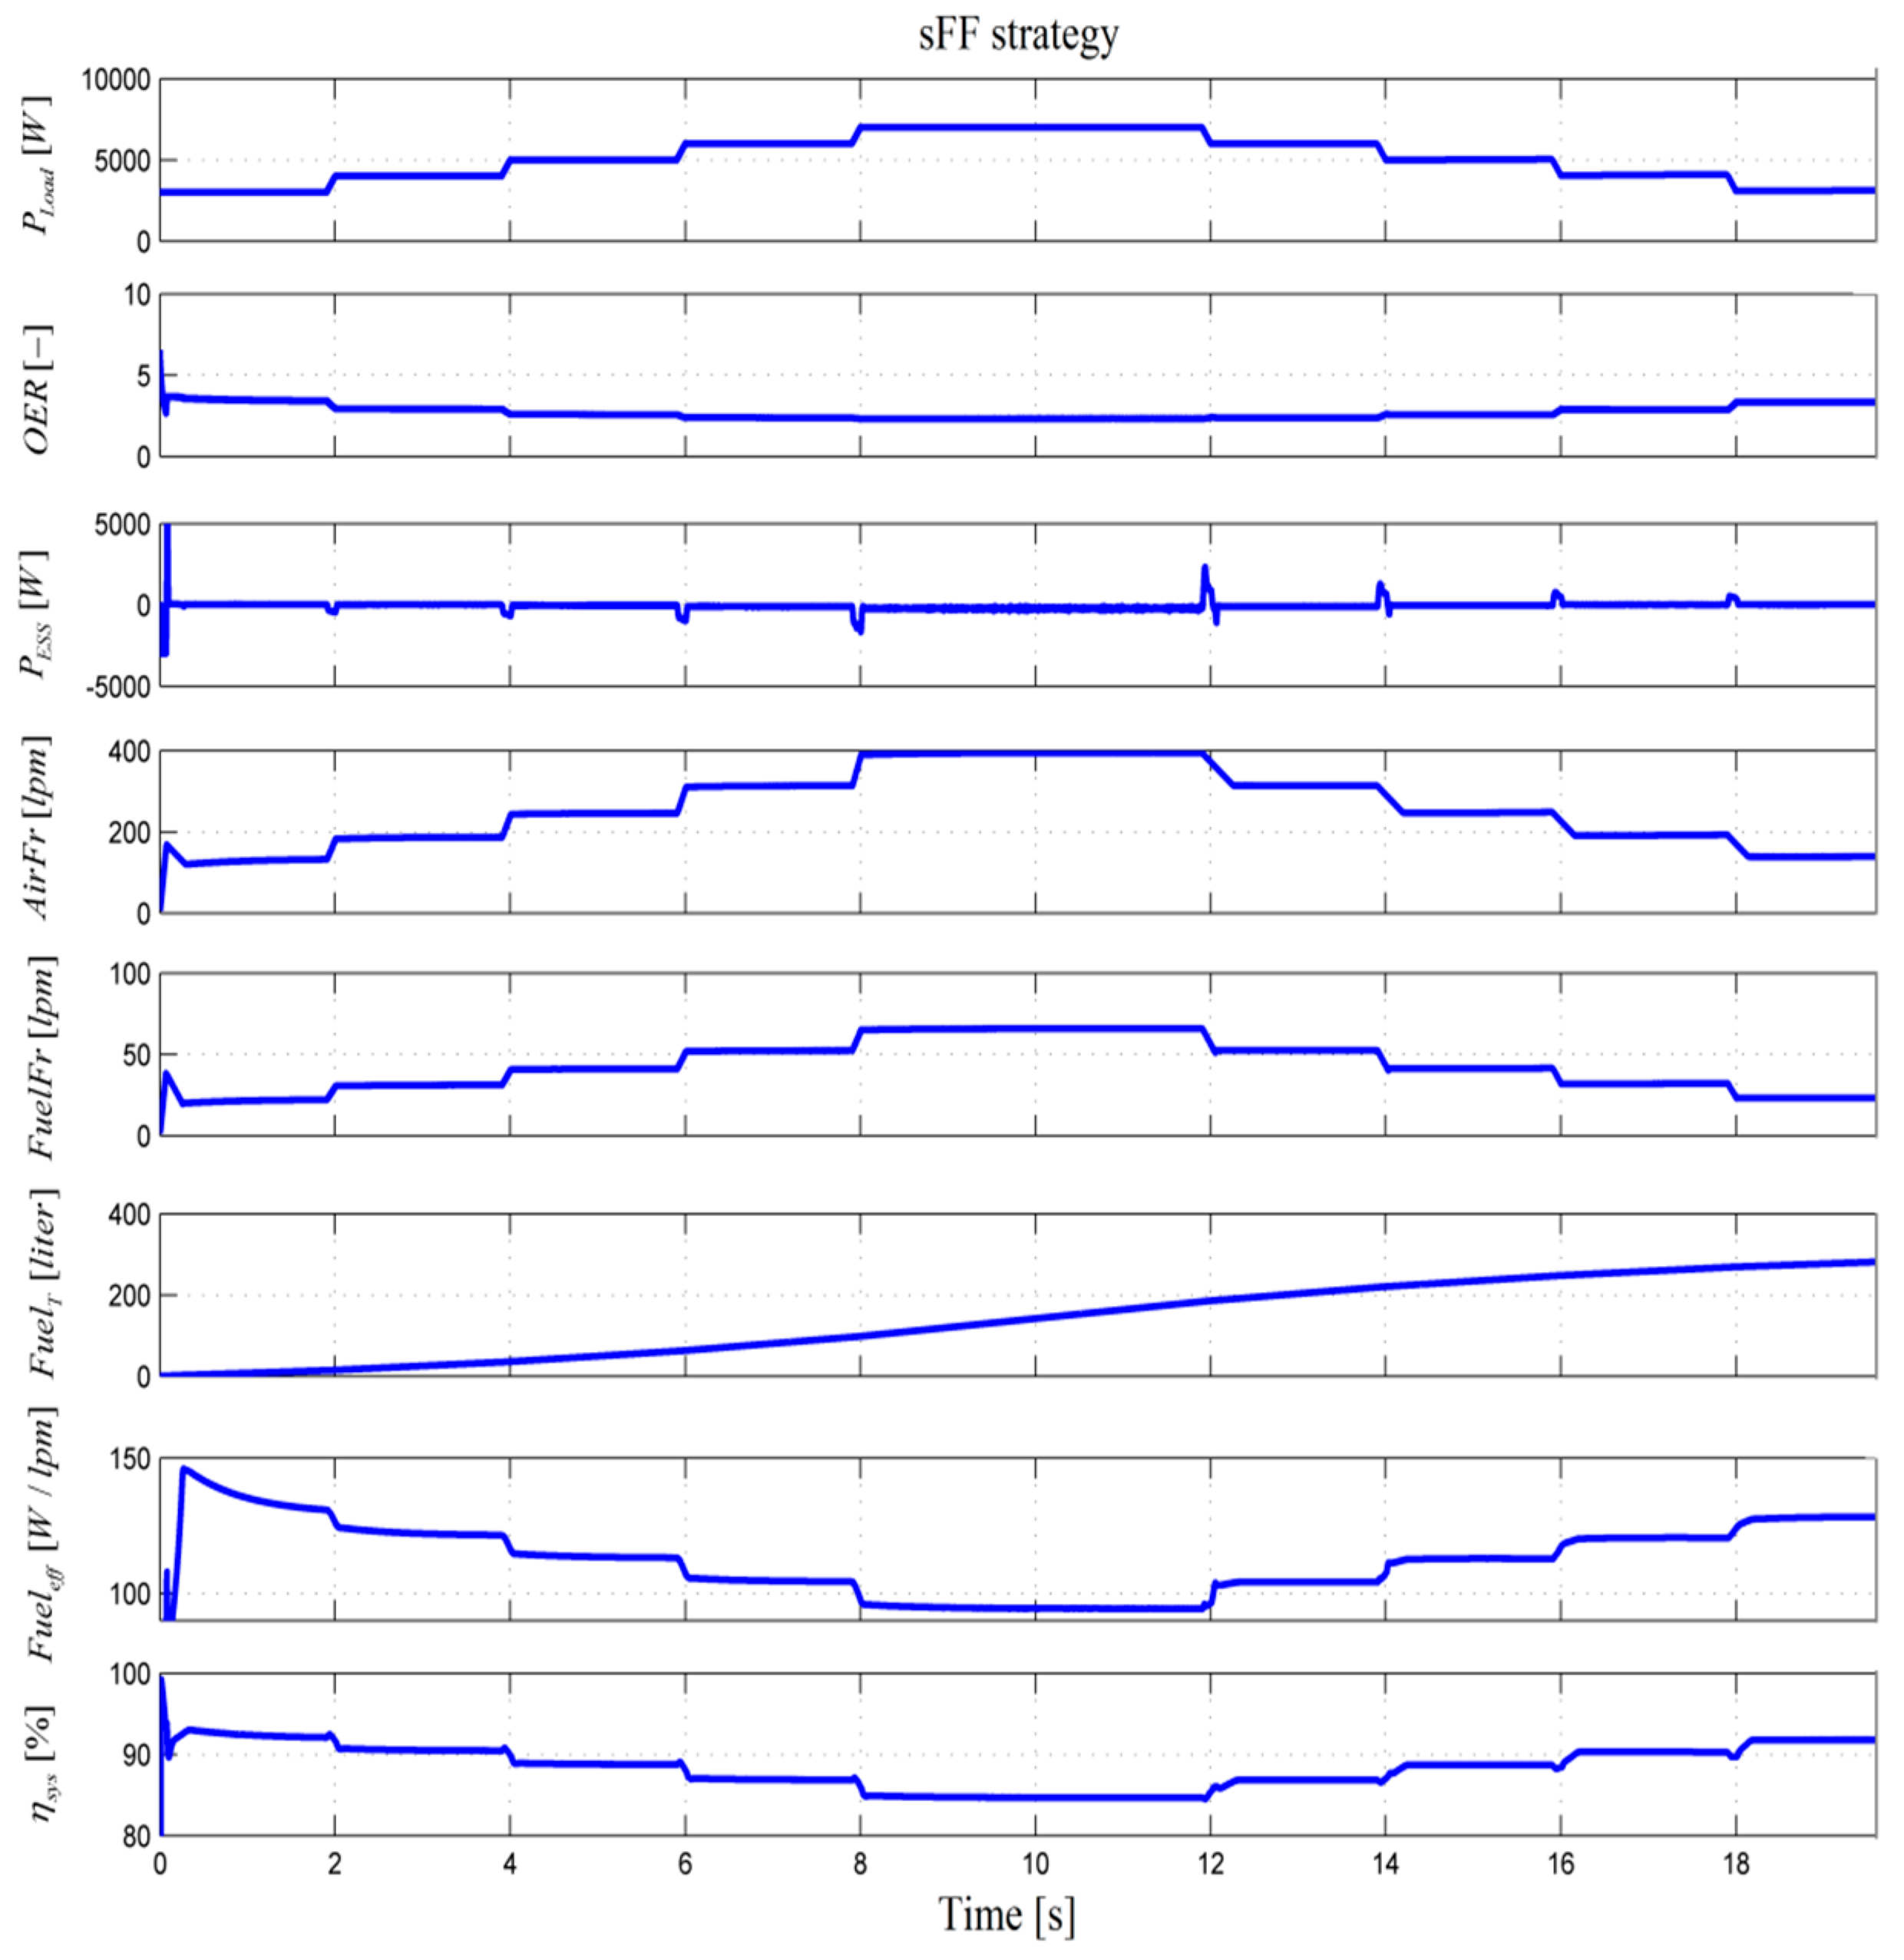
The performance and safe operation of FC/renewable HPS using the strategies air-PFC, fuel-PFC, and air/fuel-PFC is highlighted and compared to the static feed-forward (sFF) control sets by (11) [
43]:
where
is the FC current.
The command of the DC-DC boost converter (the signal SW command in
Figure 1) is obtained using a 0.1 A hysteresis controller with inputs
and
.
The GES controller shown in
Figure 1 has the following operational relationships [
41,
42,
43]:
where the first harmonic of the FC power (
) is approximated using a band-pass filter with the cut-off frequencies
and
, where
and
. This is demodulated with a sinusoidal dither,
, and integrated to obtain the search gradient (
), where
and
fd = 100 Hz. The search and location signals (
and
) are tuned using
and
to speed up tracking of the optimum. In this study,
k1 = 1 and
k2 = 2, and the input and output are normalized using
kNy = 1/1000 and
kNp = 20.
It is worth mentioning that after the transitory regime, the stationary values are almost zero [
40], resulting in a negligible ripple of FC power and a 99.9% tracking accuracy [
43].
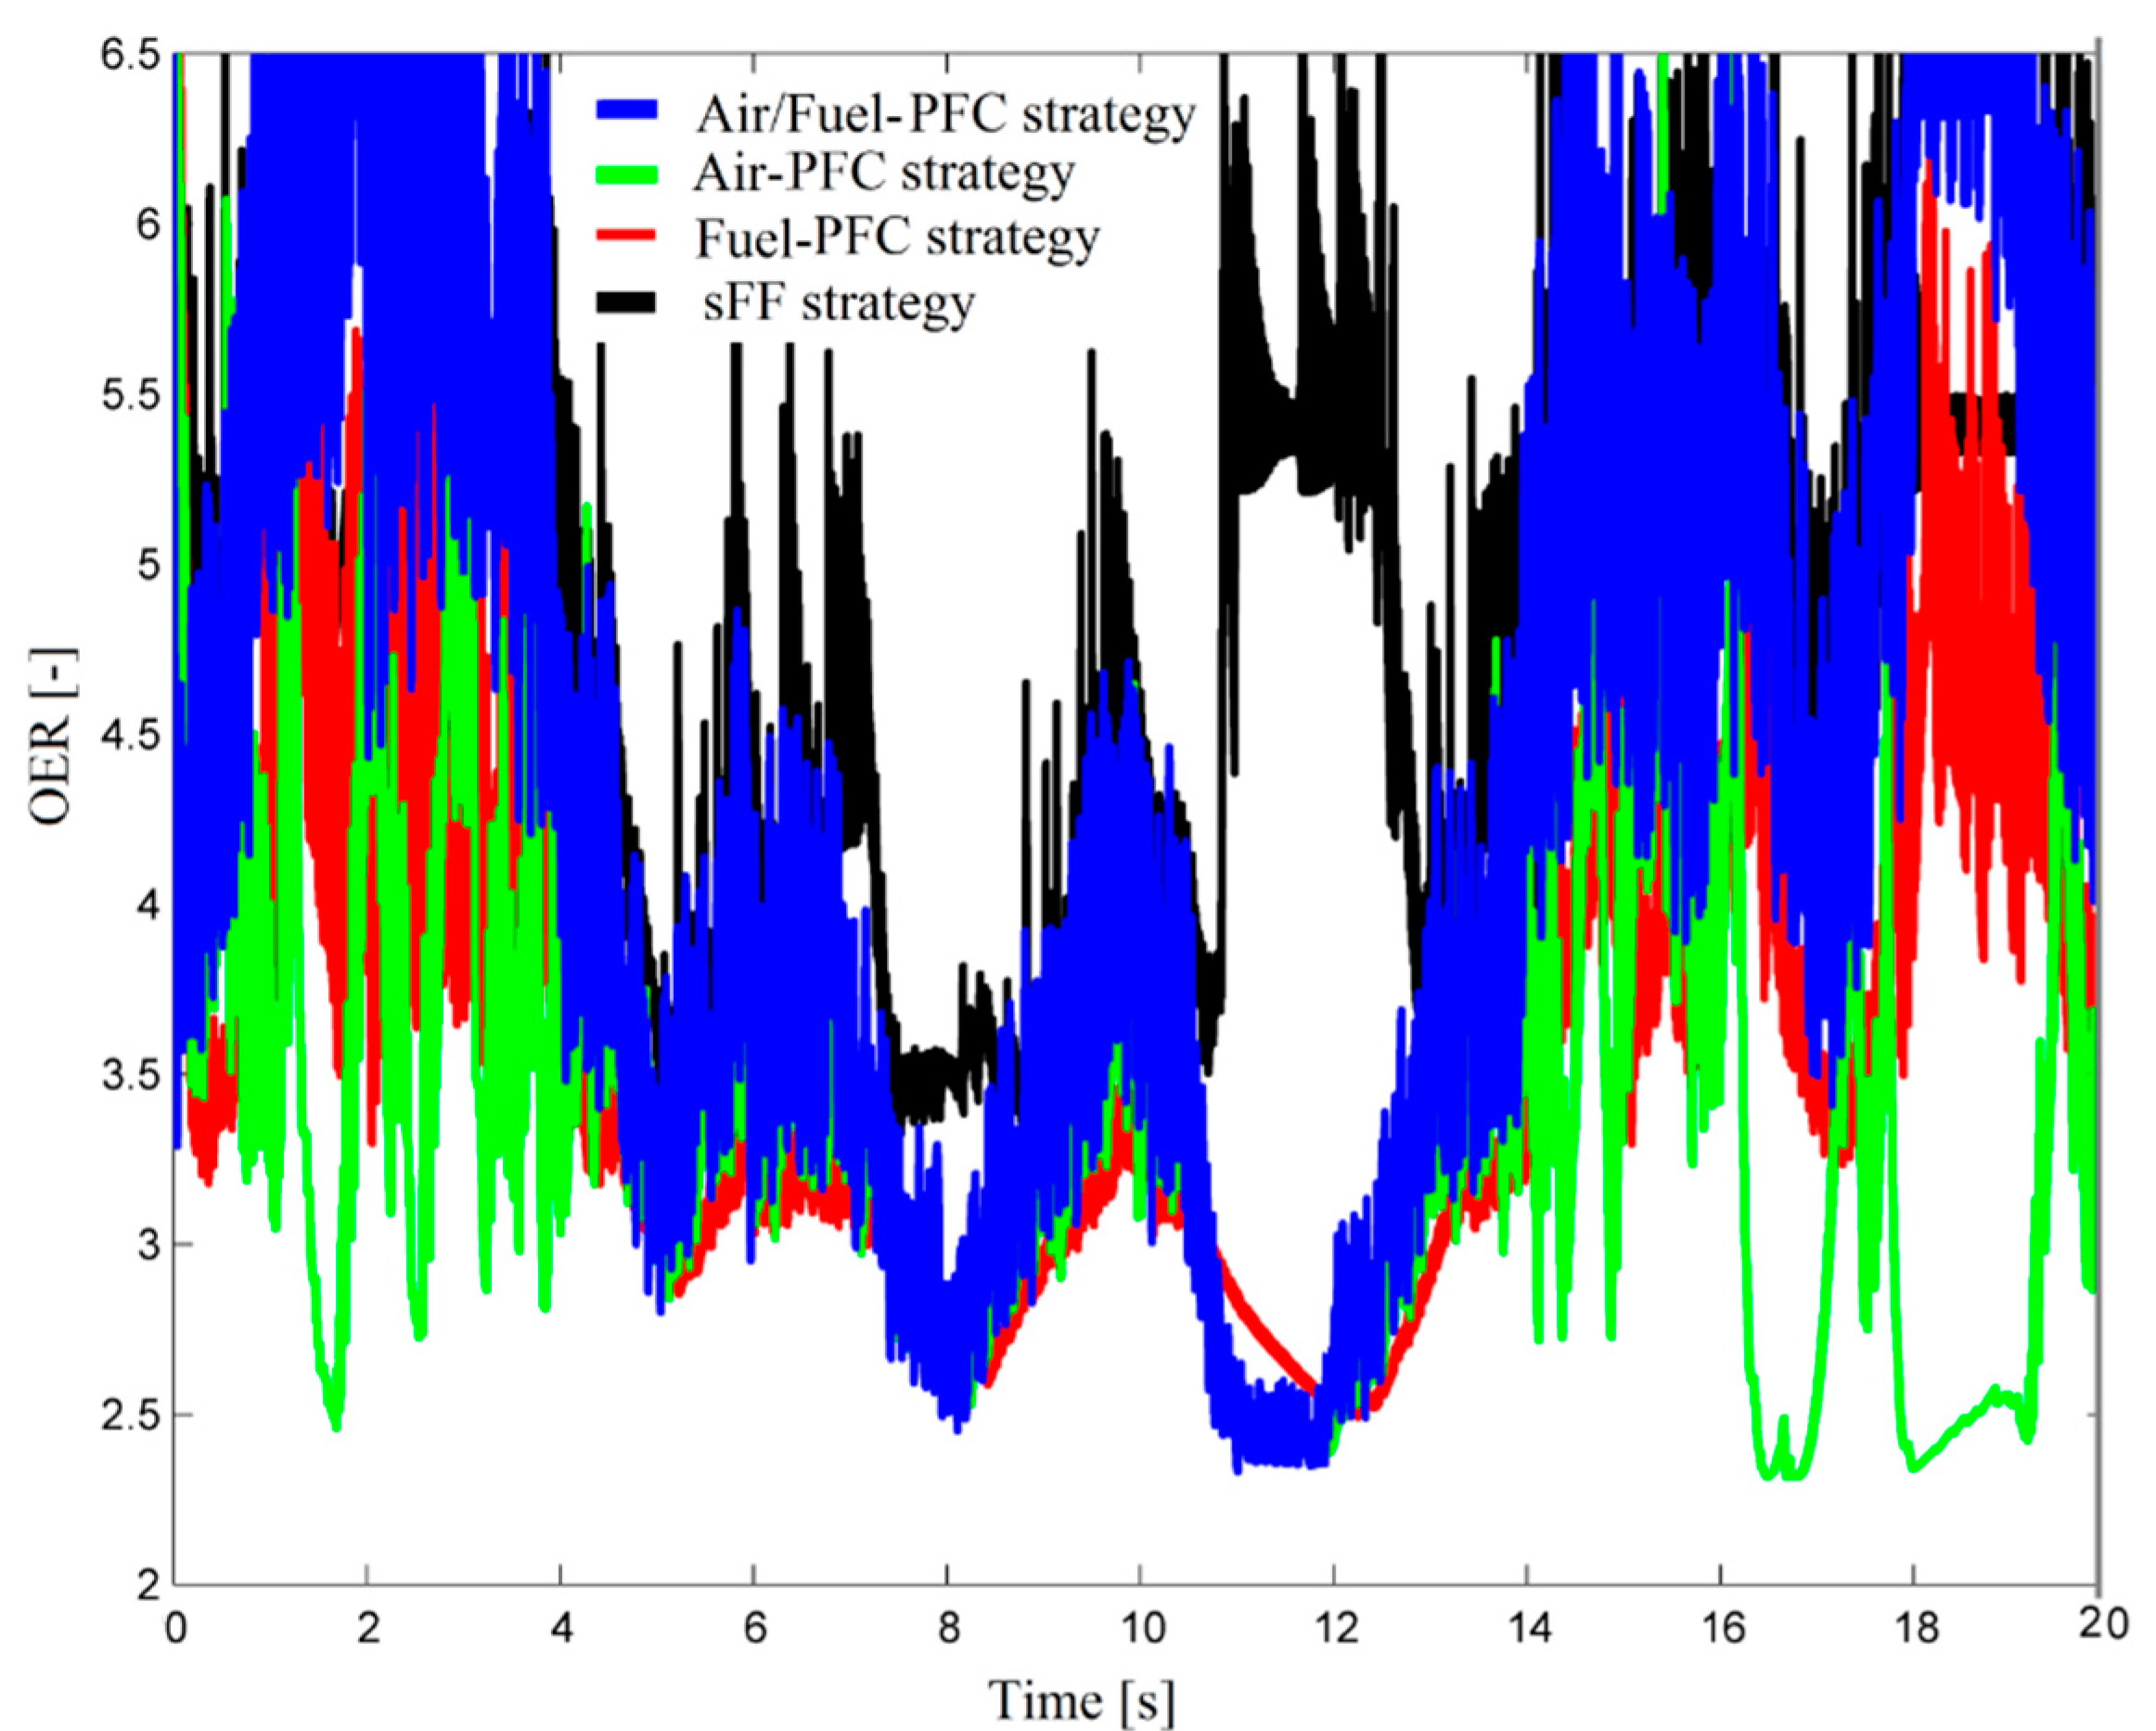
OER (
) is used as an indicator of safe operation of FC/renewable HPS [
51]:
where
,
,
,
,
, and
. The fuel consumption measured in liters [l] is the performance indicator. This is estimated during 20 s from one minute using (14):
Because
is measured in liters per minute (Lpm), a gain of 1/3 (= 20 s/60 s) is requested to compute the fuel consumption (Gain Fuel_T in
Figure 3).
4. Discussion
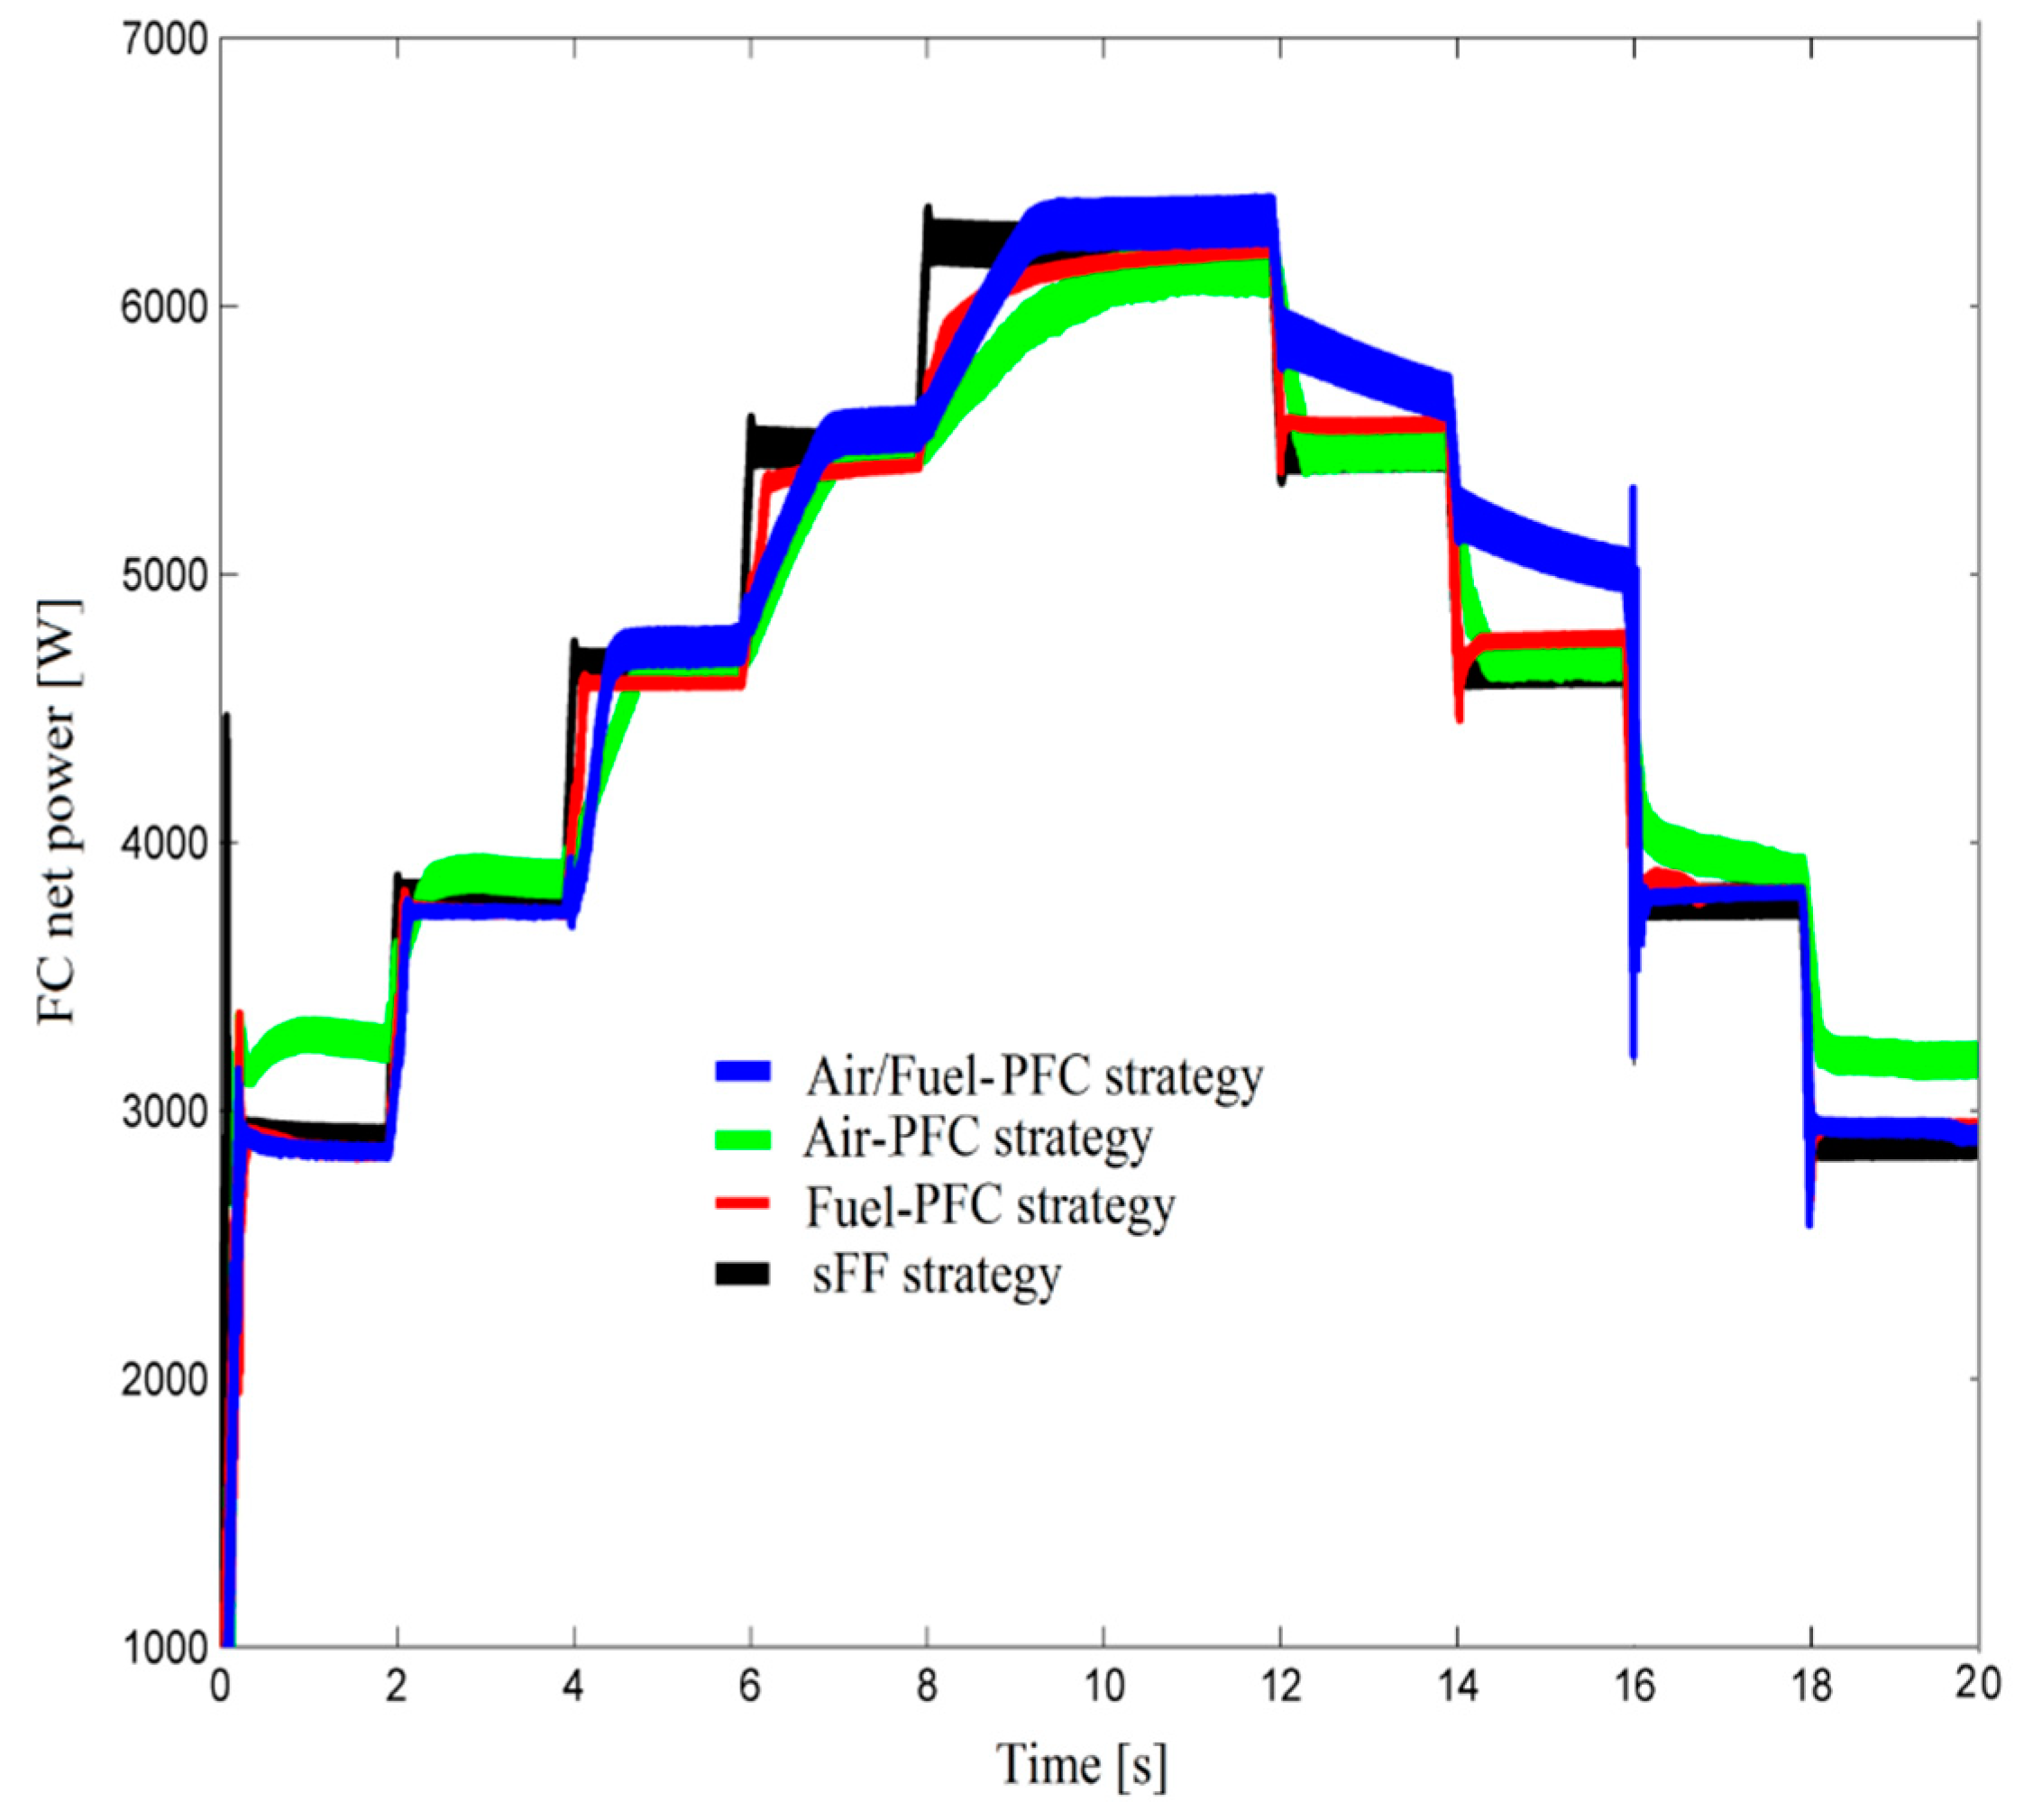
The results were comparatively analyzed in section of the results for the FC system and the FC/renewable HPS using the strategies sFF, air-PFC, fuel-PFC, and air/fuel-PFC; here, we summarize and discuss these further in the frame of the working hypotheses.
The fuel consumption using the strategies sFF, air-PFC, fuel-PFC, and air/fuel-PFC for the FC system and the FC/renewable HPS is summarized in
Table 5.
It is worth mentioning that the lowest fuel consumption was obtained using the air/fuel-PFC strategy for both FC-based power systems and then by using the strategies air-PFC, fuel-PFC, and sFF (see the first two rows of
Table 5).
In addition, it should be noted that the difference in the fuel consumption for the FC system and FC/renewable HPS,
, represents about 57% of the fuel consumption of the FC system using that strategy (see the last row of
Table 5).
This difference results from operating the FC system from the FC/renewable HPS at low power due to contribution of RES power on the load demand. The profiles of the load demand and RES power shown in
Figure 2 have a MV of 5 kW and about 2.5 kW, justifying the 57% reduction in the fuel consumption for the FC system and FC/renewable HPS.
The fuel economy strategies for the FC/renewable HPS compared to the FC system are better by about 0.7% (see last row of
Table 6) due to the same reason (FC system operates at lower power due to available renewable energy on the DC bus).

 ,
, 


