1. Introduction
Recently, as the industrial society has advanced and business strategies and systems have been systematized, productivity has improved in various industries. At the same time, the level of information technology (IT) is increasing every day and the scope of its application is widening rapidly.
Thus, the construction industry is becoming knowledge information-intensive, passing information within and between enterprises, and governments are establishing information-intensive worldwide construction businesses.
Construction enterprises are also utilizing information systems such as Enterprise Resource Planning (ERP), Knowledge Management Systems (KMS), and Project Management Information Systems (PMIS) to meet their different needs [
1]. The information techniques that began with the use of Computer-Aided Design (CAD), Building Information Modeling (BIM) and structure analysis programs have evolved into the latest information-intensive techniques of Radio Frequency IDentification (RFID) and Ubiquitous, which are common in the field.
However, while in other industries, the end users have introduced, developed, and spread IT, in the construction industry, government and company owners have done so.
Therefore, users in the construction industry do not understand IT as well as users in other industries and become accustomed to it more slowly. According to a survey by JBKnowledge (2690 respondents) [
2], 42.5% used fewer than three software programs on average during construction projects. Most of them were found to be using Excel. Moreover, 48.7% was found to be exchanging data through old methods due to the absence of an integrated platform.
It is clear that the use of IT in the construction industry will spread with the changing paradigm, and the extent of IT application will increase rapidly as well. Thus, a study showing the extent of users’ acceptance of IT within the context of the construction industry needs to be conducted.
Based on this perception, we conducted actual research on IT acceptance by individuals using it in the construction industry based on Davis’s technology acceptance model (TAM). In this study, we aim to grasp how the use of IT in the construction industry impacts users and to determine whether the latest IT should be introduced by analyzing whether users are able to accept it.
This study is classified into four steps. In the first step, external variables were derived based on a review of the literature on cognitive engineering and the study of TAMs in other industries and the construction IT TAM (and its accepters in the construction industry). These external variables were organized into the six areas based on expert brainstorming: acceptance type, frequency of use, educational satisfaction, usage knowledge, usage enjoyment, and usage experience. In the second step, we used these variables as the basis of the hypotheses to determine the effects of the internal and external variables for each factor. In the third step, based on the hypotheses, we conducted a survey to derive the TAM for consumers in the construction area. Survey participants included people working in construction industry basic law or in the general construction industry, such as contractors for government or public enterprises, construction workers, supervisors, managers of construction businesses, and engineers. Finally, based on the results of the survey, the suitability of the TAM and the established hypothesis were verified.
The specific contents of construction IT that form the object of this study are based on the software most often used in the construction industry; we classified them into the following five groups through consultation with experts:
Scheduling programs: Microsoft Project, Primavera Project Planner, etc.
Design programs: CAD, BIM, Microstation, Plant Design Series, etc.
Information technology communications: GPS, GIS, etc.
Wireless technology: RFID, etc.
Management programs: KMS, PMIS, etc.
2. Theoretical Background: Technology Acceptance
2.1. Technology Acceptance Model
The most important aspect of information systems study and execution is IT acceptance and actual usage. Although companies have made significant investment in the progressive growth of hardware, software, and IT, a productivity paradox is occurring because of the limited understanding of IT usage, which requires urgent improvement [
3]. The study of IT acceptance has gradually developed over the past 20 years.
Some researchers have studied the relationship between the usefulness and ease of use of IT [
4,
5,
6]. In particular, Davis proposed TAM—a major contribution to the theory and study of IT usage and acceptance [
5]. Davis studied and analyzed why people do or do not accept information systems.
The actual behavior of an individual is decided by behavioral intention, which is determined by the attitude and subjective norms, which in turn are determined by beliefs or other factors.
The theory of reasoned action (TRA) and the theory of planned behavior (TPB) were predecessors of the TAM. Ajzen suggested the TPB to extend the TRA to apply to situations in which behavior is not under the individual’s control [
7]. Ajzen said that behavior is determined by three faiths: behavioral faith, subjective faith, and control faith [
8].
In this model, behavior is affected by some factors out of the individual’s control. Therefore, we must consider how much the individual’s will controls his or her behavior [
9]. Thus, the value of how much behavior is under the individual’s control—Called perceived behavioral control—is included as an additional factor influencing the behavioral intention in Ajzen’s TPB.
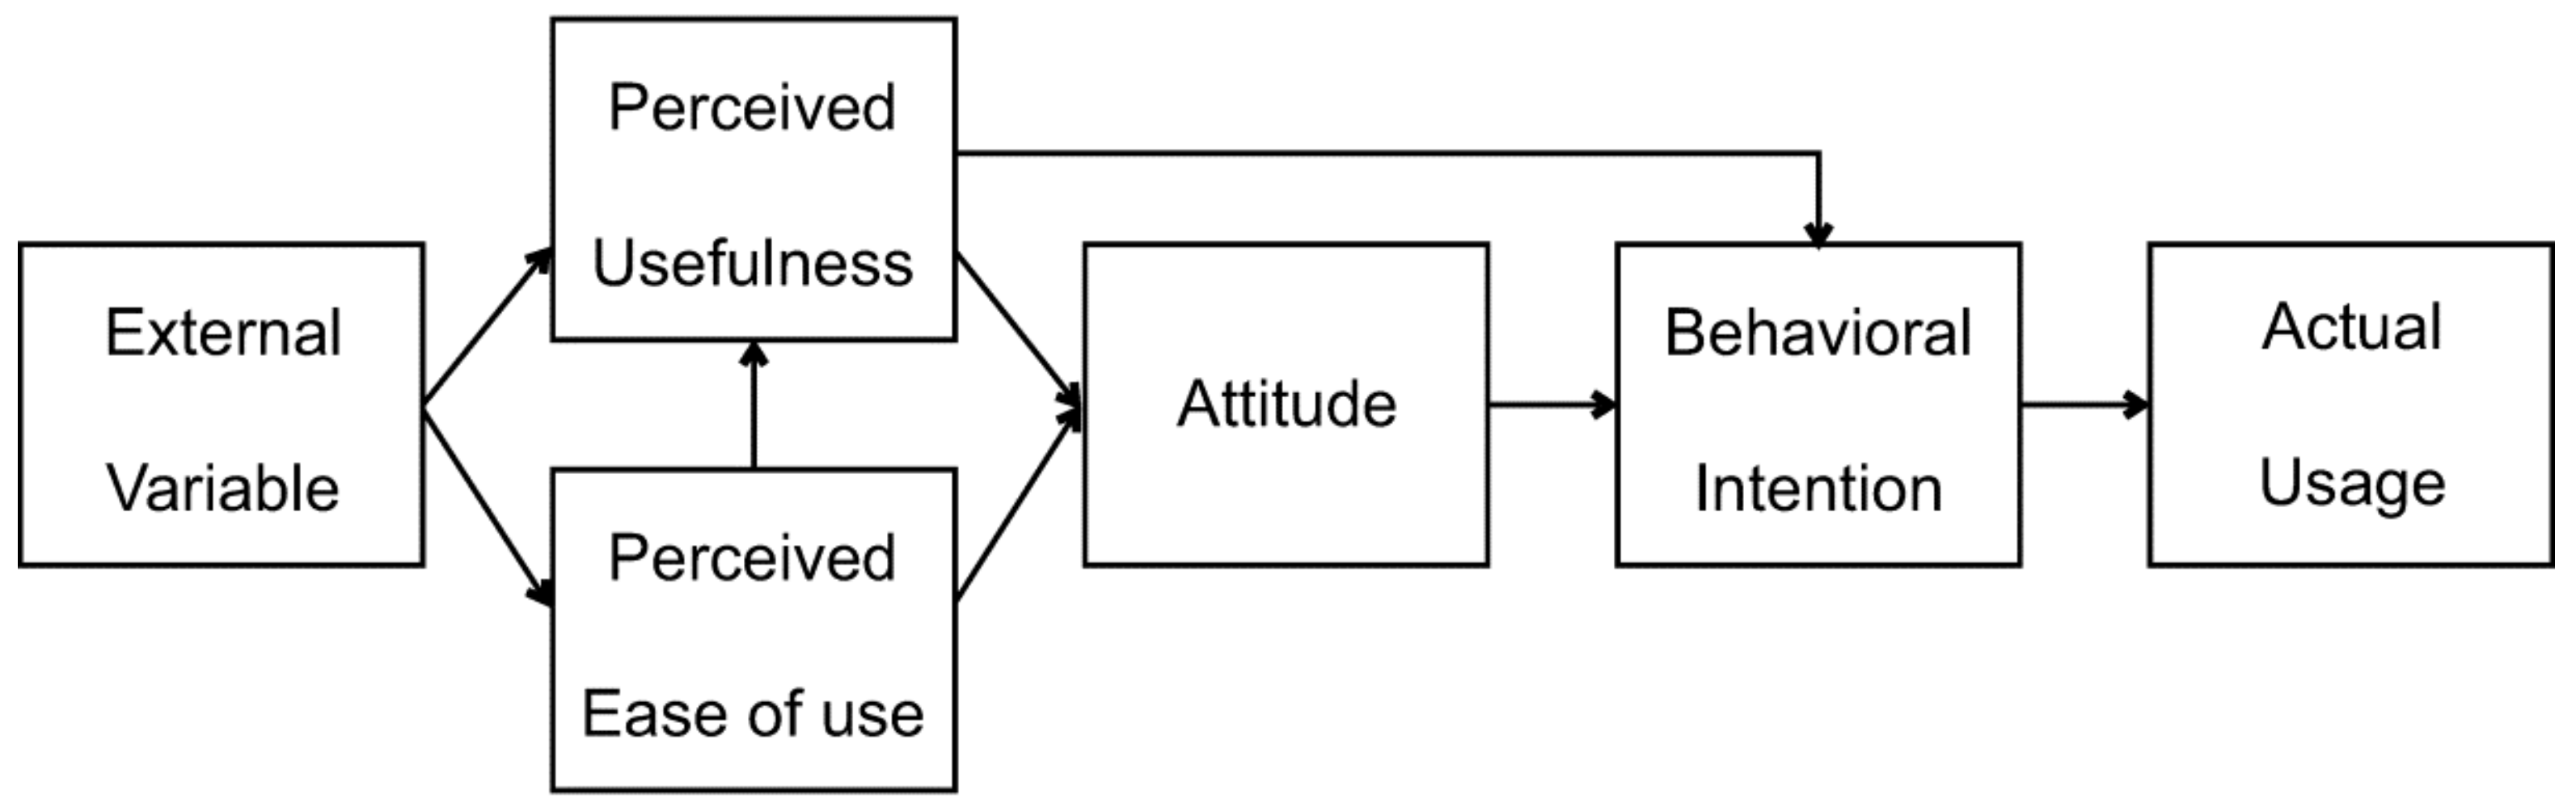
Davis developed the TAM to explain IT users’ behaviors and anticipate them based on the TRA, which came from the social psychology field [
5]. Perceived usefulness and ease of use are specified as the main factors impacting attitude in the TAM, which utilizes only the relations among belief, attitude, intention, and behavior. All other external factors are supposed to influence intention and attitude indirectly through perceived usefulness and ease of use. Thus, the variables called perceived usefulness and perceived ease of use are the keys to TAM, as shown in
Figure 1.
The perceived usefulness of IT indicates how much users believe that using some kind of system improves their task achievement ability, and perceived ease of use indicates how much they believe that a specific system is easy to use.
2.2. Study of the TAM Including Individual Characteristics
It has been an important issue for IT managers and researchers to determine which factors make an individual select a new IT. The answer is that regardless of how much enterprises invest in establishing new and more efficient IT systems, the system’s effectiveness can only be realized if the users clearly understand and use it. The individual’s characteristics are connected to their culture and society [
10]; thus, if developers cannot understand the changing user process in terms of technique, they will fail to develop an appropriate system. Moreover, if they cannot understand the extent of individual expertise, the efficiency of the group will suffer. Based on this viewpoint, much of the research on individual differences in IT use shows that the end users play a decisive role in the results of the utilization of IT.
Based on an examination of the existing literature on IT use, Zmud said in his study that two cognitive and attitude routes impact the success of the system and that individual differences can be classified into three variables: perceived style, character, and population statistics/situation [
11]. By examining this, we found that education discipline, user experience, and user ability are situational variables of individual differences.
Fazio’s study showed that the experience of IT is important, as it could change an individual’s faith and attitude [
12].
In his study, he described different forms of individual e-mail use, showing that IT usefulness directly impacts the intention of IT use before IT is used, whereas the perceived ease of use does not have similar statistical results for the intention of IT use.
Igbaria et al. verified the impact of external variables such as user differences, system differences, and group supports on the degree of use [
13]. They asserted that user differences such as education discipline or user experience with computers and external variables such as system differences and group support mostly have a direct impact on degree of use, although they also have indirect impacts through perceived usefulness and ease of use.
Bajaj et al. suggested and verified a new model, showing that attitude could be formed based on past system use, pointing out that IT acceptance models have ignored the feedback possibility from past behavior [
14].
Fenech suggested that it could be suitable to introduce computer self-efficiency to the TAM, asserting that additional concepts are necessary to improve the models’ estimation ability, because suitability is low using only perceived usefulness and ease of use to study users’ demands of the World Wide Web with the TAM [
15].
On the other hand, in a study on the intention to use the World Wide Web among students majoring in business economics, Agarwal et al. asserted that perceived absorption, which was introduced to TAM as a multi-dimensional composition concept, has an impact on perceived usefulness and ease of use [
16].
They also said that perceived absorption, meaning a state of deep participation with the software, is not an external value like usefulness, but rather a feeling of satisfaction similar to perceived pleasure. This is an internal motivation consisting of five dimensions: momentary split, concentrated absorption, pleasure, control, and curiosity.
3. Research Model and Hypotheses
3.1. Research Model
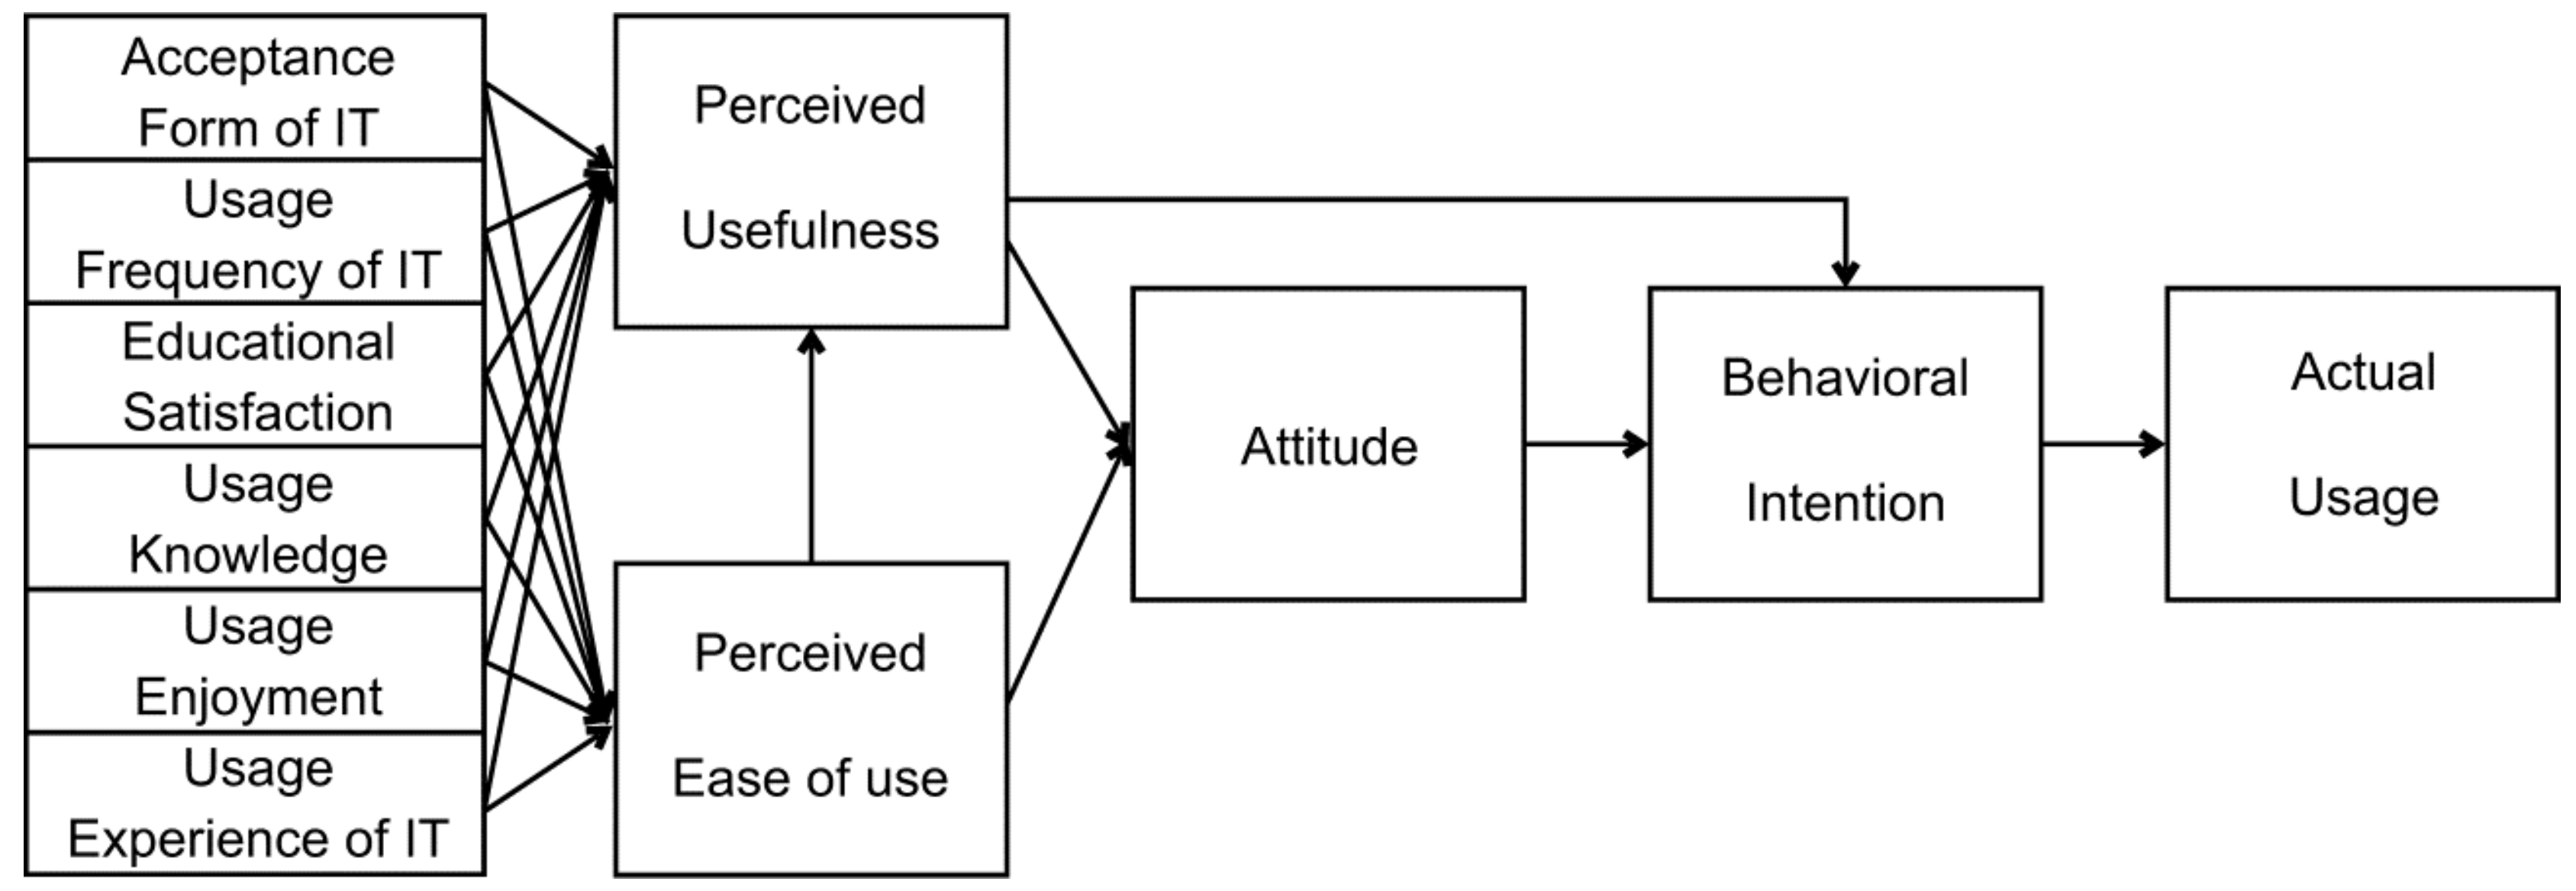
We derived external variables through a literature investigation and preceding study analysis for the extension application on the basis of Davis’s TAM. In this study, we propose a research model for construction IT acceptance according to the traits of information accepters in the construction industry. We present six external variables (acceptance type, frequency of use, educational satisfaction, usage knowledge, usage enjoyment, and usage experience), based on brainstorming with three experts from academia and enterprises to verify the external variables already derived, as the hypotheses for verification.
Moreover, the research model supposes that those six external variables have some effects on attitude, behavioral intention, and actual usage—which are components of TAM—as well as perceived usefulness and ease of use, as shown in
Figure 2.
3.2. Hypothesis Creation
3.2.1. Acceptance Type
Rogers classified the accepters of information reform into five categories: reformers, accepters of early information reform, normal accepters, and the people who are not sensitive to IT [
17]. He asserted that most people are careful in the earlier stages of technology introduction, and the number of technology accepters that increases after it is judged useful. The users then move through the stages together until they reach the stagnancy stage. Hypotheses H1a and H1b suggest that those who accept IT more readily tend to consider construction IT more useful and easier than those who are less satisfied.
3.2.2. Acceptance Frequency of Use
Larsen et al. studied a standard for IT use by both people who use IT often and those who do not by using an actual focus group [
18]. He asserted that people who use IT often have a higher standard of IT use. Hypothesis H2a and H2b suggest that frequency of IT use affects perceived ease of use and perceived usefulness.
3.2.3. Educational Satisfaction
Chan et al. asserted that learning impacts the spread of IT [
19] and Romm et al. also said that systematic learning is connected with IT [
20]. User satisfaction is a major factor in the user’s intention to use continuously [
21,
22]. Based on this, hypotheses H3a and H3b suggest that educational satisfaction affects perceived ease of use and perceived usefulness.
3.2.4. Usage Knowledge
Hong et al. asserted that differences between individuals and system characteristics (relevance, terminology, and screen design) impact the intention to use digital libraries [
23]. Therefore, hypotheses H4a and H4b suggest that usefulness and ease of use are evaluated differently according to the individual’s IT usage knowledge.
3.2.5. Usage Enjoyment
In a study of online stores, Koufaris asserted that online consumers have two sets of characteristics because they are not only buyers but also computer users [
24], and that, therefore, a unified theoretical framework is necessary to understand the behavior of online consumers.
According to the study, perceived usefulness and the pleasure of the shopping itself were the important factors that make consumers return. Hypotheses H5a and H5b suggest that pleasure has an impact on perceived usefulness and perceived ease of use.
3.2.6. Usage Experience
IT usage experience has a significant impact on IT patterns [
19,
20,
25]. Moreover, Igbaria et al. showed that IT usage experience has a positive impact on perceived ease of use, perceived usefulness, and the standard of use [
13]. Hypotheses H6a and H6b suggest that previous experience with IT has an impact on the acceptance of construction IT, in accordance with the theoretical investigation.
3.2.7. Internal Variables
Each item of the TAM is suitable for the model of the construction business information management acceptance presented in this study, and we have verified which items have more impact on the acceptance of construction IT. Attitude [
26,
27], external variables, and behavioral intention [
28,
29] have similar results to the actual use of construction IT. Hypotheses H7a to H7e address the internal variables. The verification results of the codes are listed in
Table 1.
4. Analysis on TAM Variables in Construction IT
4.1. Research Target and Method
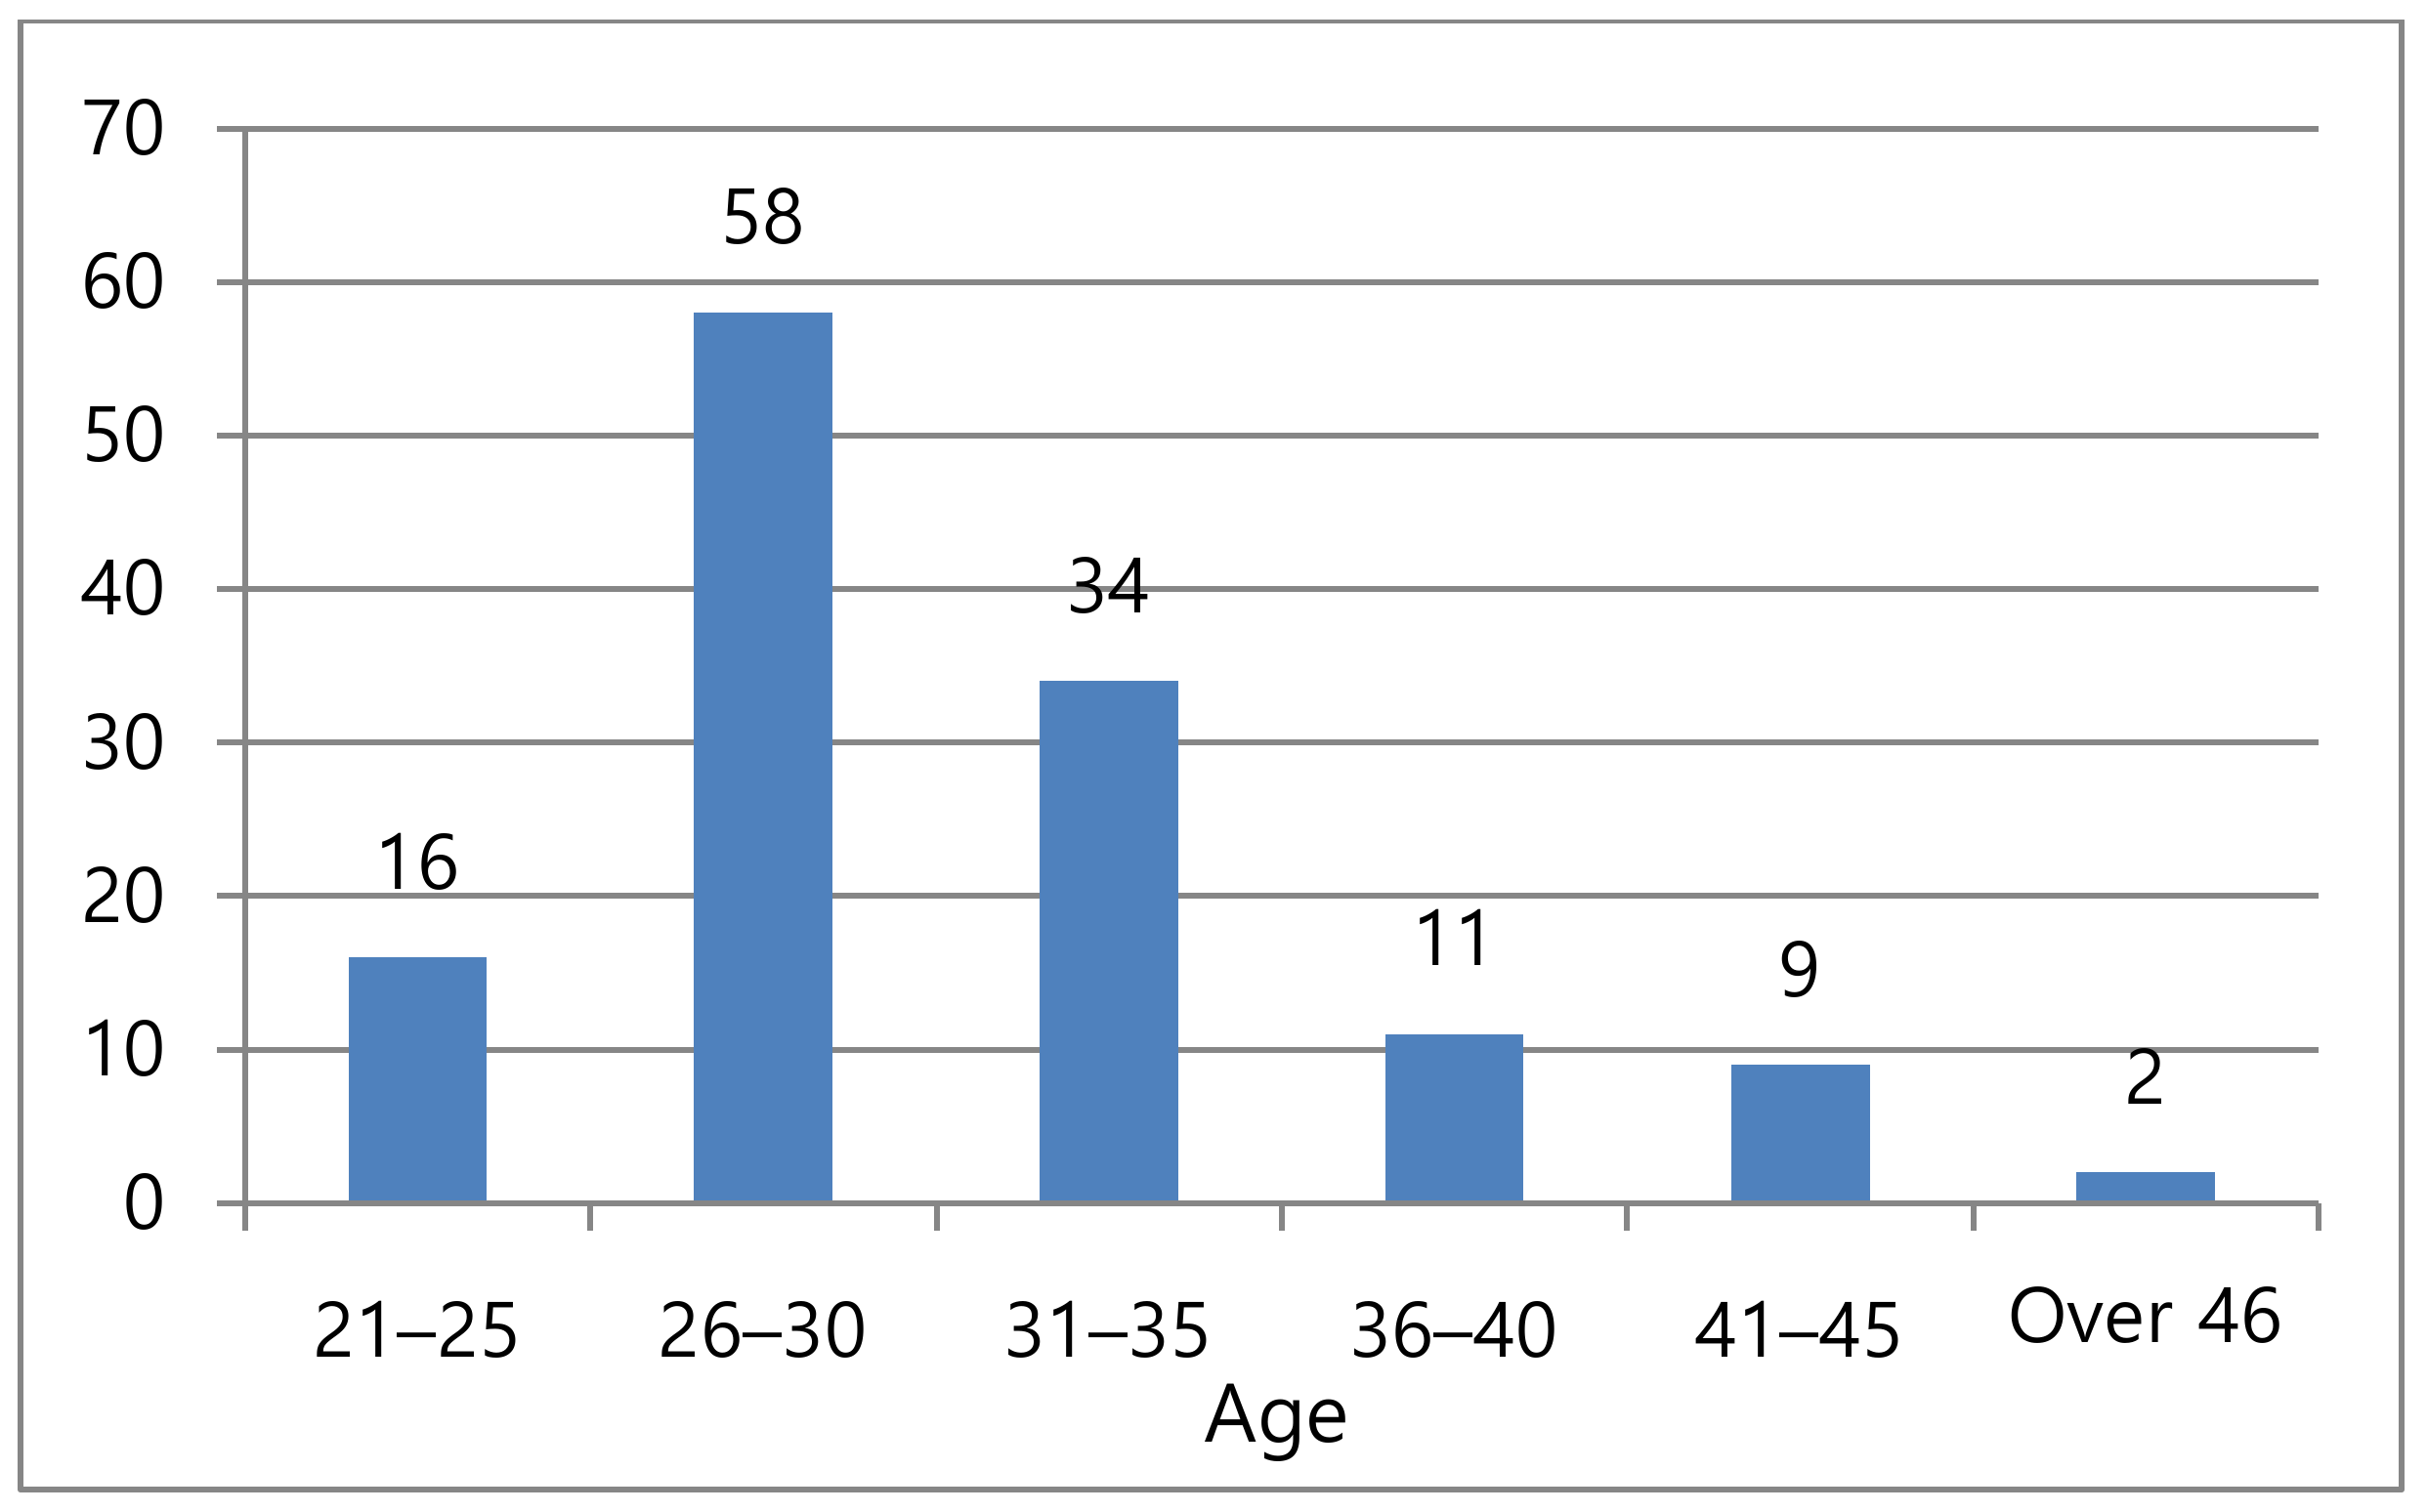
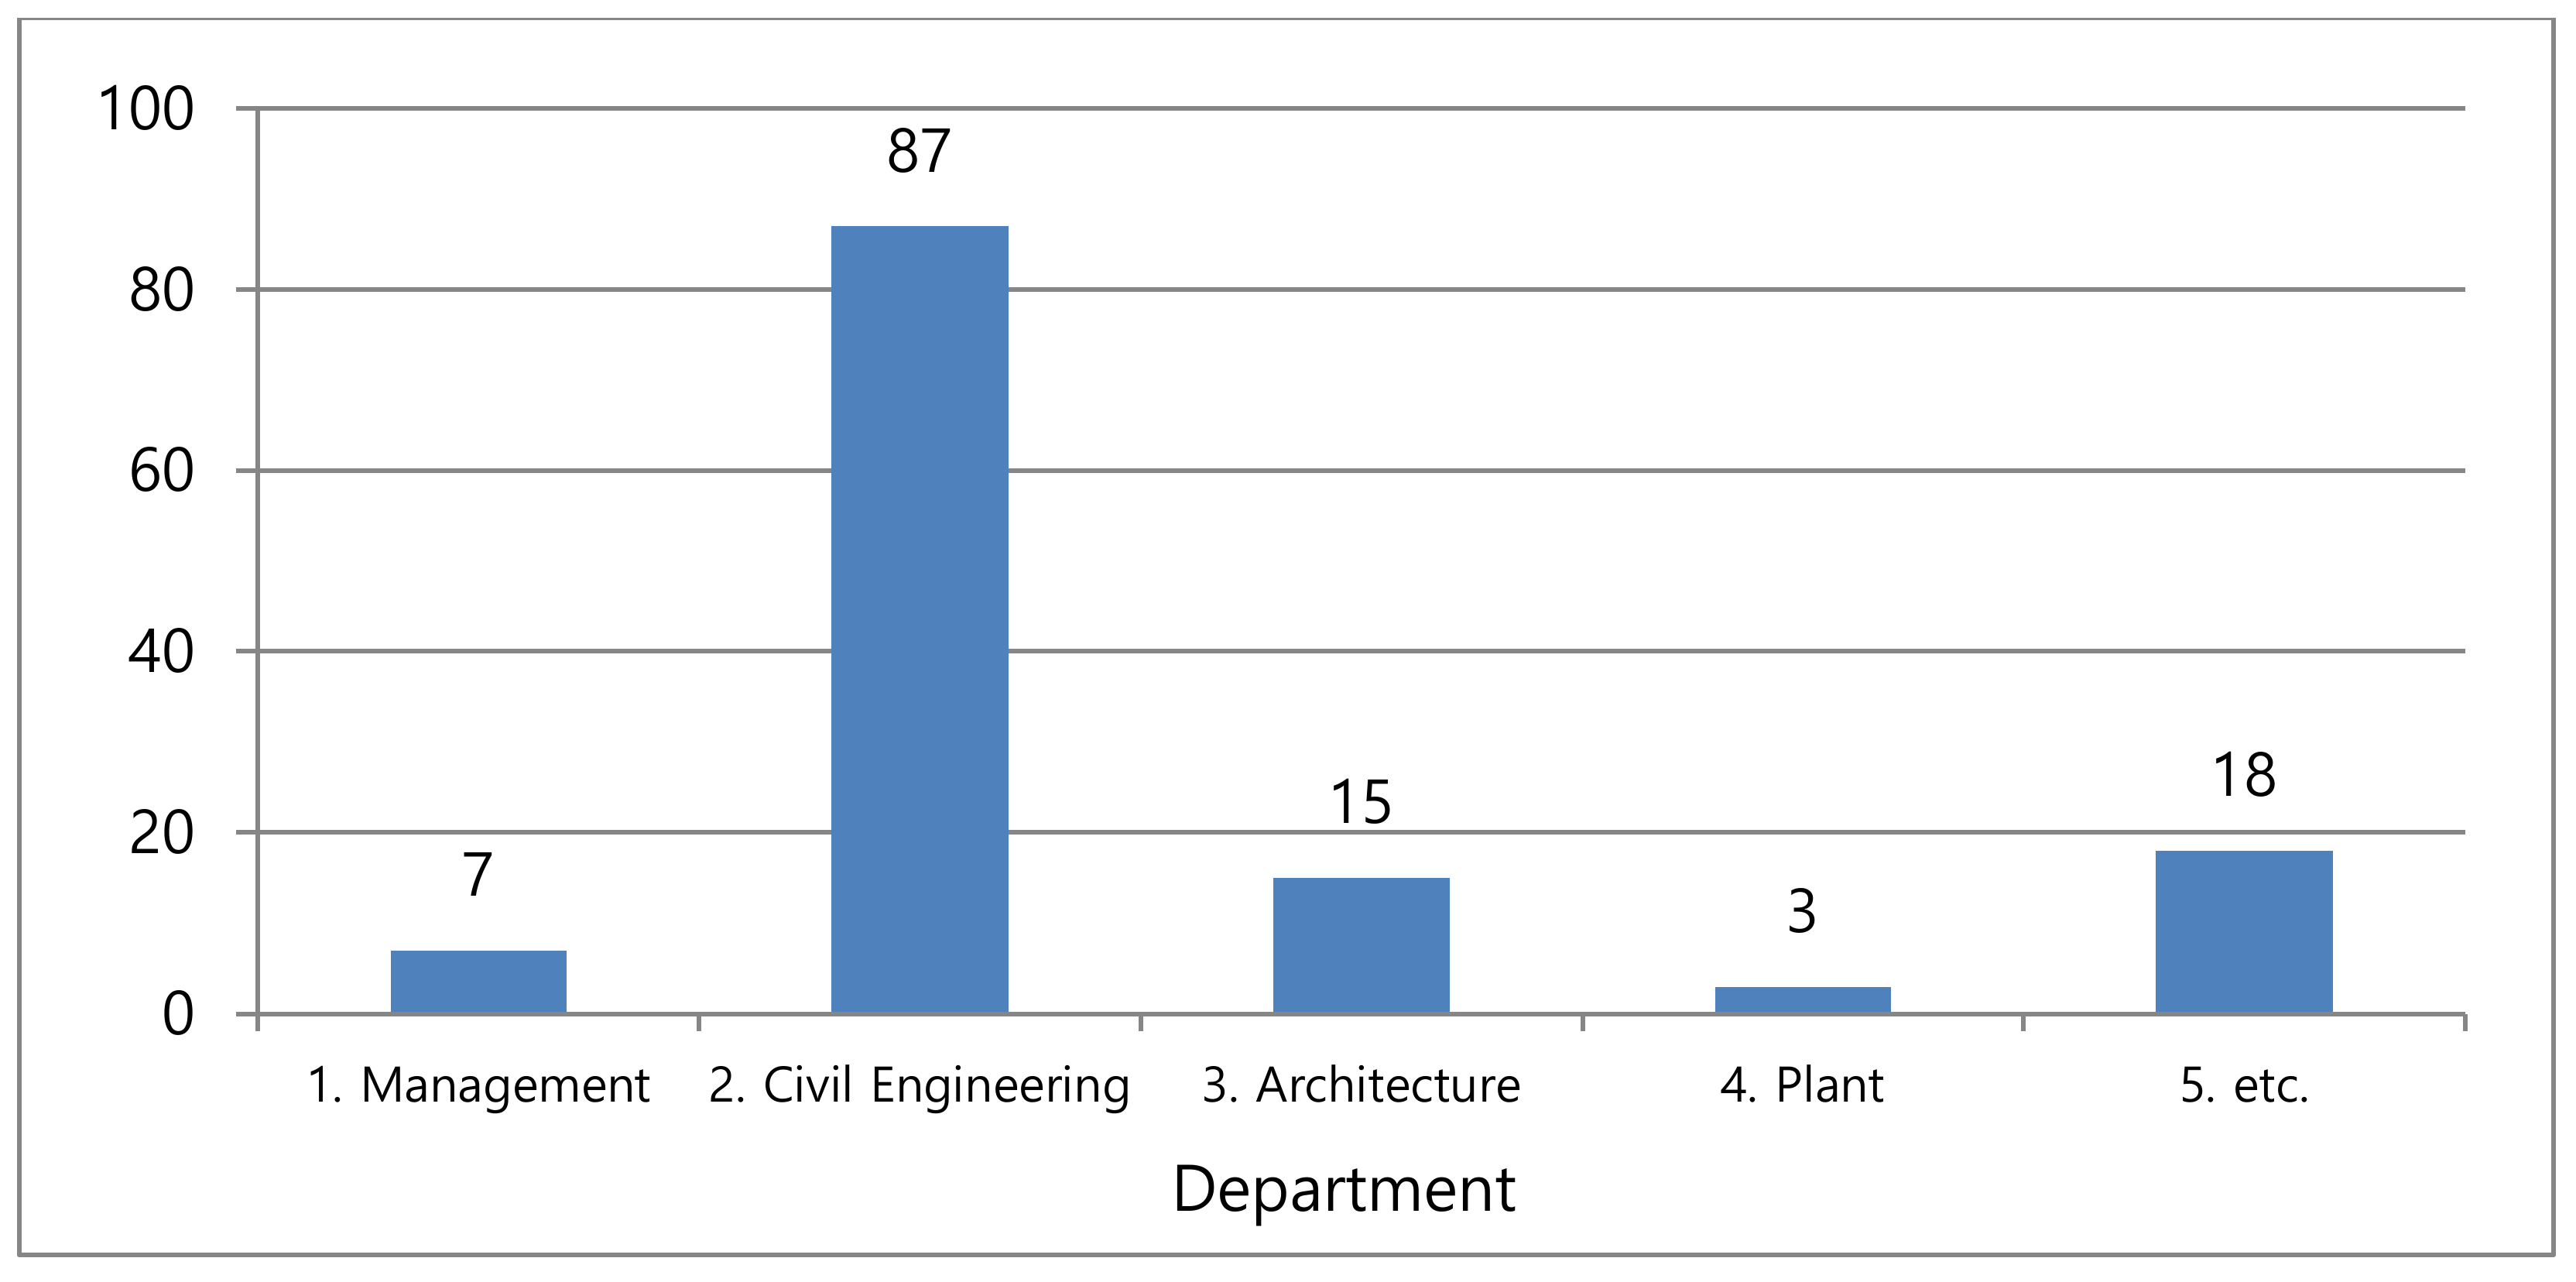
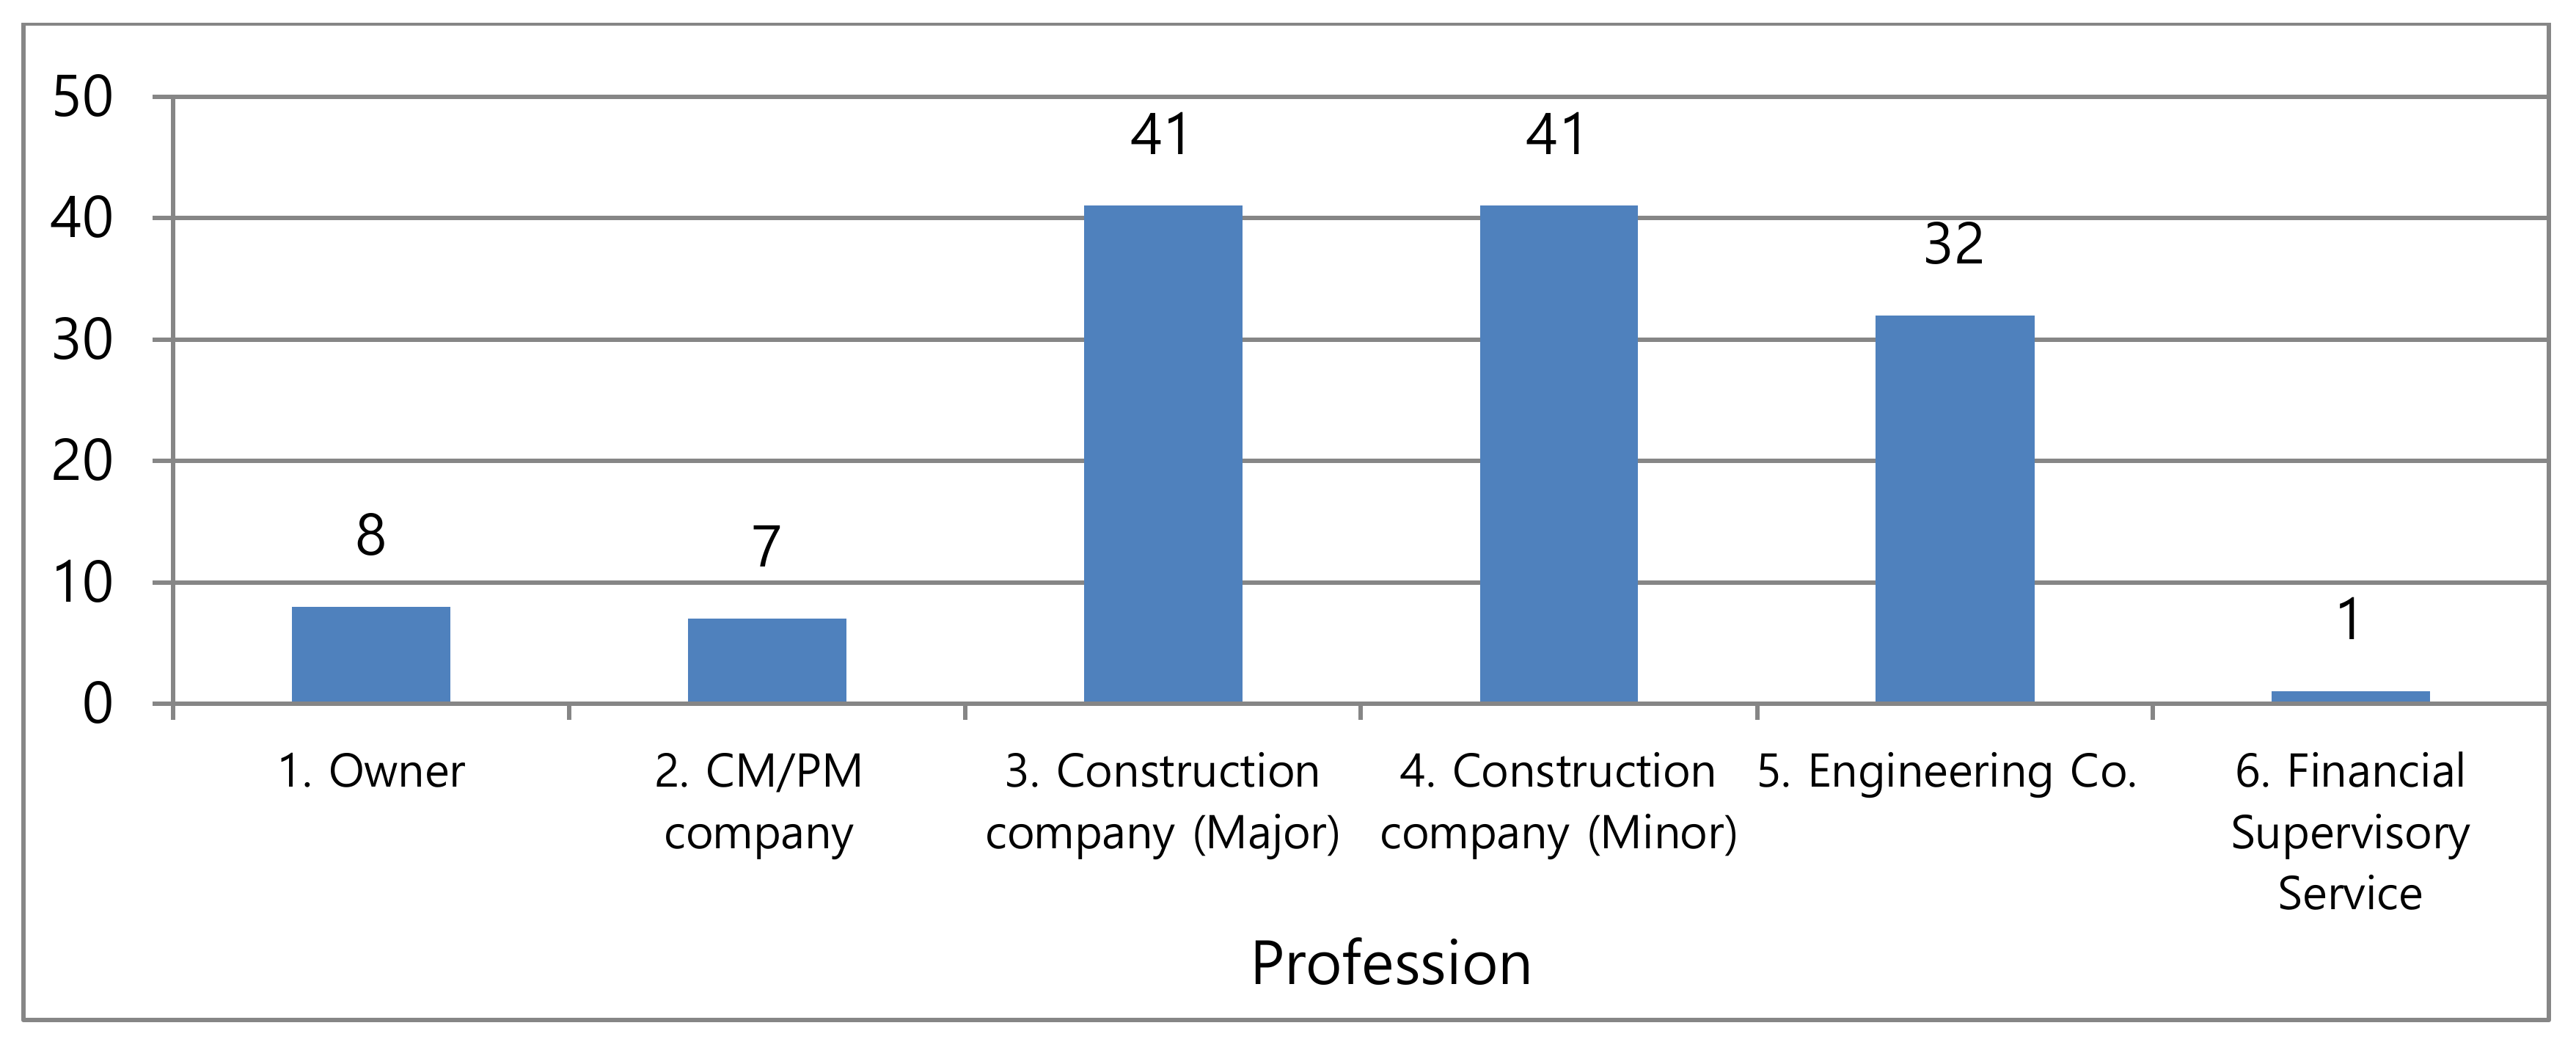
The survey of IT accepters using construction IT was conducted to verify the construction IT TAM based on the hypothesis derived from experts brainstorming and proceeding studies. The survey was conducted mainly with the stakeholders of construction and engineering organizations located in Seoul. The survey had a sample of 150; we analyzed the results of the final sample of 130 complete returned surveys, excluding the 20 false answers, using the SPSS 26.0 statistics program. After the first survey, we conducted a second survey to determine the main software used in the construction industry and the advantages or inconveniences of using construction IT in business.
Figure 3,
Figure 4 and
Figure 5 provide related information on the research targets.
We collected data for the first and second survey during 2 months. Respondents completed the survey themselves. As this is the first study on the acceptance of construction IT, survey items on the important internal and external variables of IT in general were considered applicable to the construction area based on surveys and studies of other industries. Furthermore, the variables used in this study were compiled based on those used in preceding studies, but the verification of the reliability and validity of each variable was required owing to the inclusion of revised or newly developed items suitable for the purposes of this study. Therefore, we conducted an analysis of confidence and cause to examine the reliability and validity of each variable.
After verifying the reliability and validity, a multiple regression analysis is performed using the representative values of each variable. We analyze the hypotheses presented in this study through this analysis and the correlation of each variable.
4.2. Reliability and Validity of Each Variable
We measured the reliability using the coefficient of Cronbach’s alpha, which is used to measure the internal consistency between items with the same factors. Alpha values above 0.6 are considered reliable, and all the variables were analyzed with one standard. The reliability of the measurement devices with alpha values above 0.6 is acceptable for the group analysis standard [
30]. The measurement result of this study meets the overall 0.6 criteria. However, item number 3 for the acceptance type was deleted to increase the alpha value in the reliability analysis of the variables regarding the construction IT acceptance type. Reliability was found to be high, since the reliability analysis results have values from α = 0.6850 to α = 0.8400. Validity indicates how reliable the equipment measures are.
Cause analysis is a method of determining whether the measured variables are measuring the same composition concept to reduce the complexity of collecting data with the same variable factors. It is used to determine the validity of measurement devices in the developing process of a measurement and test index. We determined that each variable was mutually independent using a principal component analysis and the varimax rotation method. The result has validity because all items have values over 0.4.
Table 2 lists the reliability and validity of the internal and external variables of the TAM.
4.3. Analysis Results on TAM Variables in Construction IT
4.3.1. Analysis about External Variables
We conducted a multiple regression analysis of perceived ease of use and usefulness based on the external variables and the TAM to verify the correlation between the external variables (hypotheses H1a to H6b) impacting construction IT acceptance.
The external variables proportional to the perceived ease of use are acceptance type, frequency of use, educational satisfaction, usage knowledge, and usage enjoyment, whereas usage experience is inversely proportional to the perceived ease of use. By looking at the beta values that have a similar impact on the perceived ease of use, we found that there is a correlation among usage enjoyment, educational satisfaction, and usage knowledge, in that order. Here, the beta values denote a normalized coefficient of the linear regression analysis result.
The external variables proportional to perceived usefulness are acceptance type, educational satisfaction, usage enjoyment, and usage experience, whereas usage frequency and usage knowledge are inversely proportional to perceived usefulness. By looking at beta values having an impact on perceived usefulness, we found that there is a correlation among the usage enjoyment, usage experience, acceptance type, and educational satisfaction, in that order. However, we found that usage frequency had nothing to do with either perceived usefulness or ease of use.
4.3.2. Analysis about Internal Variables
We conducted a multiple regression analysis of the existing variables to determine whether the TAM proposed here was applicable to construction IT acceptance. We found that perceived usefulness and ease of use were proportional to attitude and had a significant impact. By looking at beta values, we inferred that perceived usefulness and attitude had an impact on behavioral intention, which had an impact on actual usage.
Table 1 and
Figure 6 provide a summary of the hypothesis verification results. As in
Appendix A,
Appendix B,
Appendix C,
Appendix D,
Appendix E beta values refer to the influence on the dependent variable. A beta value of ‘+’ means an influential value; ‘−’ means no influence on the hypothesis. A large
t-value means a small standard deviation (high correlation), and a small
t-value means a large standard deviation (low correlation). The hypotheses for the external variable of usage frequency and the independent variables of perceived usefulness and perceived ease of use were all rejected, but at least one of the hypotheses for the other external variables (acceptance type, educational satisfaction, usage knowledge, usage enjoyment, and usage experience) and for the independent variables (perceived usefulness and perceived ease of use) was confirmed. We found that utilization of the TAM is useful in the analysis of construction IT acceptance because the hypotheses based on internal variables were all confirmed.
4.3.3. Detail Research Results for Construction IT
In this study, we used the first survey to verify our hypotheses about the TAM and construction IT. Based on these results, we classified construction IT into five categories (scheduling programs, design programs, wireless technology and IT communications (ITC), KMS, and PMIS) and performed a second survey to determine the different influences individuals have on the software and systems used in the construction industry and user errors. However, wireless technology and ITC users were excluded from the survey. The survey was not easy because the majority of users are in specific fields.
From the second survey, we found that Nex-Pert (Project management program, South Korea), Sure-Track, Microsoft Project, and Primavera Project Planner were the most used scheduling programs. They were often used for progress schedules, preceding process control, process cost analysis, and business distribution. The results show that the schedule programs were used because the companies provided them (the most common answer), they were considered useful, and they were required to be used by contractors. Second, we investigated the design program used most in the construction industry—Auto CAD—which is used for producing drawings, revisions, material calculations, estimates, and checking the detailed size and availability when necessary at a site. We found that Auto CAD is easy to use, useful, often used, and convenient. However, it is also not compatible with other programs, such as scheduling programs, which have to be fixed for Auto CAD to be utilized in more fields. Third, we investigated what purpose KMS serve in the construction industry and found that they are used for sharing data with people in other places and collecting and researching the necessary data for business use. KMS are reputed to be useful in that companies provide them. We found that respondents placed high value on the usefulness and convenience of KMS, which were also evaluated as being easy to use. However, KMS have not yet spread throughout the construction industry and are short on the various types of information as well. Fourth, we investigated what purpose PMIS serve in the construction industry and assessed users’ complaints about PMIS. We determined that PMIS are used to check the percentage of work completed for each field, to share data between the contractor and site, to utilize data such as portal systems, to provide defective sample control, as a security information integration system, and for the receipt or dispatch of documents. We found that the reason that PMIS has low values for compatibility is that the design programs and scheduling programs explained above are not compatible with PMIS.
Table 3 lists the complaints.
5. Results and Discussion
We checked the specific correlation of the external and internal variables with multiple regression analysis as well as the reliability and classification standard in terms of the validity of the factors related to the analysis, to propose a TAM for construction IT suitable to the characteristics of each information accepter based on the construction industry factors verified in this study. We examined the correlation among six internal and 12 external variables through hypothesis verification and rejected the hypotheses for five external variables.
First, in the case of the hypotheses for acceptance type, the hypothesis related to the perceived usefulness of construction IT for each individual was confirmed but that related to the perceived ease of use was rejected because even when respondents had experience with other IT systems, they were not able to feel any major difference in their acceptance of IT. Moreover, they might not be able to use IT easily, in spite of thinking that the programs or systems of construction IT are useful. This result might be related to the fact that a higher level of knowledge and experience is necessary to understand IT in the construction industry than that in other industries. Thus, when developing construction IT in the future, an interface accessible to users has to be considered and the program visuals have to be emphasized for users to accept the new construction IT more easily.
Second, in the case of the hypotheses for usage knowledge, only one was not confirmed because it had a correlation with perceived ease of use but not with perceived usefulness. This result is different from the TAM results in other industries, because new construction IT might depend on legal and contractor requisites and it might not be introduced, even though users in the field need it. Public relations for new construction IT have to be improved to let users understand or realize the necessity and efficiency of it for it to spread in the future.
Third, in the case of the hypotheses for usage experience, the hypothesis related to the perceived ease of use was rejected. This is because although users might perceive the existing and new construction IT to be efficient and effective, they might not perceive the new technology to be easy to use.
Fourth, the hypotheses for usage frequency were rejected for both perceived usefulness and ease of use. We found that even if the frequency of existing IT use is high, this is not related to the perceived usefulness and ease of use of the new construction IT. This is because construction IT requires expert knowledge and has less correlation among construction technologies (for example, structural analysis and scheduling management) compared with other industries. Moreover, the second survey showed that if certain programs are not used often, users easily forget how to use them. Many comments emphasized that the lack of training in the formal education causes users to fail to use certain software. This does not significantly affect either perceived usefulness or ease of use.
These problems might be solved through educational satisfaction, for which both hypotheses were confirmed; that is, perceiving the usefulness and ease of use of new construction IT requires enough education and training for users, and a systematic manual has to be created and distributed as well. Moreover, when the widely used existing IT is upgraded, continuous education will have to be implemented by offering software renewal programs or construction engineer training, which will also have to be supported by the government through funding and policy.
We found that the six internal variables, which are the factors for verifying the construction IT TAM on the basis of Davis’s TAM, have high correlation and that the IT TAM proposed in this study are the main factor influencing the actual usage of new construction IT.
The overall research analysis of this study was based on the questionnaire of comprehensive construction IT software. This analysis has limitations on the analysis of the ease of use of specific software in construction IT. Future research will analyze using detailed software such as CAD and PMIS.
6. Conclusions
We determined which factors impact the user acceptance of IT used in the construction industry. We found that users are able to accept IT with ease before its introduction and determined the problems that have to be considered when introducing new IT to society. Thus, the TAM for construction IT was proposed on the basis of Davis’s TAM, with five external factors (acceptance type, educational satisfaction, usage knowledge, usage enjoyment, and usage experience) and four internal factors (ease, usefulness, attitude, behavioral intention) proposed after deriving and verifying the characteristics for each factor. This study presented the construction IT technology acceptance model according to the characteristics of each individual information user in the construction industry, and analyzed the reliability of the relevant factors. The validity of such factors was reviewed and the characteristic relationships between internal and external variables were identified through a multiple regression analysis. This resulted in the results described below.
We found that if users consider IT in the construction industry easy to use, spontaneous attitude and behavioral intention are to be expected. Thus, it is important to provide background education about IT so that users feel interested in using it based on their usage knowledge. Moreover, acceptance type, educational satisfaction, usage enjoyment, and usage experience are the factors that impact perceived usefulness, and educational satisfaction and usage enjoyment impact perceived ease of use as well. Thus, it is clear that procedural and easy education must be enforced to make IT acceptors feel good about construction IT for its effective acceptance.
In particular, the results show that process control software, which is being revitalized, is difficult to use by merely referring to the manual, because special education about the software is not provided by the company, according to the survey or interviews on each specific category of construction IT with directors and executives from construction companies.
Moreover, we found that users are not able to use these systems easily because of a lack of experience, revitalization in the use of KMS or PMIS, and the opinion that the construction site environment is continuously changing and that the actual efficiency cannot match the functionality of the programs. Other problems, such as lack of skill, program compatibility, instance of use, and application scope, were investigated.
To solve the identified problems, the subjects of construction IT have to be more specific, and it is necessary to compare them with those in other industries.
Future studies must examine the external variables that reflect the characteristics of latest information acceptors in the construction environment so that construction IT can be introduced more systematically and rationally.


