Intelligent Detection of IoT Botnets Using Machine Learning and Deep Learning

Abstract
:1. Introduction
2. Related Works
2.1. IoT Security Threats
2.1.1. Classification of Attacks
- IoT layer:
- Attacks:
- Vulnerabilities:
2.1.2. Attack Works
- Perception:
- Network:
- Application:
2.2. Existing AI-Based IoT Studies
2.2.1. IoT Using AI
2.2.2. IoT Security Using AI
- Malware Classifier:
- Network Anomaly Detection:
- Network Anomaly Detection using N-BaIoT:
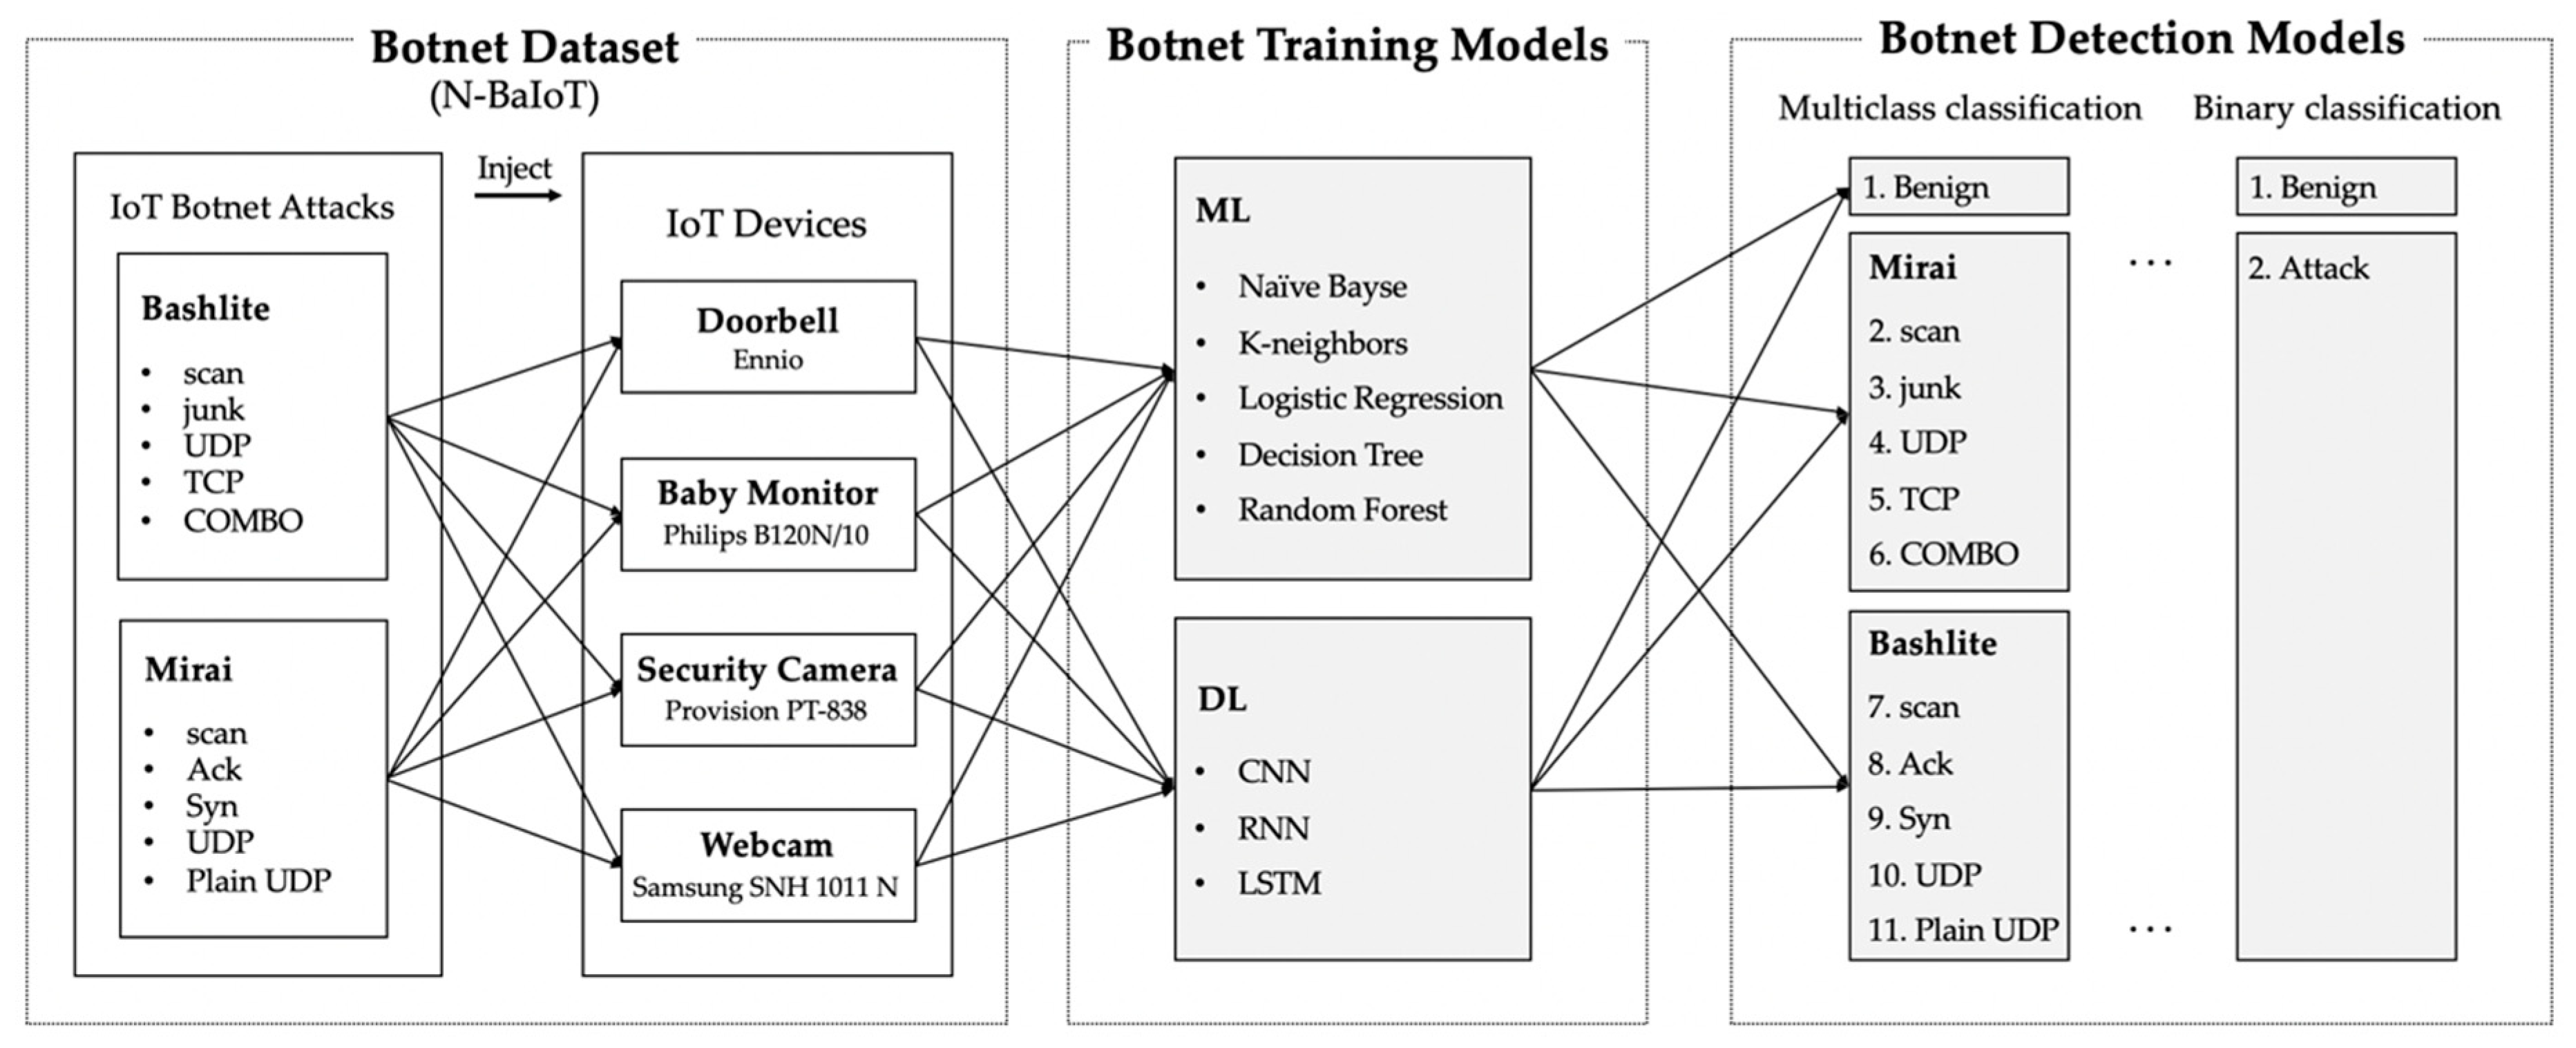
3. Methodology
3.1. N-BaIoT Dataset
3.2. Proposed Framework
4. Experimental Evaluation
4.1. Binary Classification
4.2. Multiclass Classification
5. Conclusions
Author Contributions
Funding
Conflicts of Interest
References
- World Economic Forum. Available online: https://www.weforum.org/focus/fourth-industrial-revolution (accessed on 8 October 2020).
- Ashton, K. That ‘internet of things’ thing. RFiD J. 2009, 22, 97–114. Available online: https://www.rfidjournal.com/articles/view?4986 (accessed on 8 October 2020).
- Gartner Top 10 Strategic Technology Trends for 2020. Available online: https://www.gartner.com/smarterwithgartner/gartner-top-10-strategic-technology-trends-for-2020 (accessed on 8 October 2020).
- Available online: https://www.gartner.com/en/newsroom/press-releases/2019-08-29-gartner-says-5-8-billion-enterprise-and-automotive-io (accessed on 8 October 2020).
- IoT Attacks Escalating with a 217.5% Increase in Volume. Available online: https://www.bleepingcomputer.com/news/security/iot-attacks-escalating-with-a-2175-percent-increase-in-volume/ (accessed on 8 October 2020).
- Lin, J.; Yu, W.; Zhang, N.; Yang, X.; Zhang, H.; Zhao, W. A survey on internet of things: Architecture, enabling technologies, security and privacy, and applications. IEEE Internet Things J. 2017, 4, 1125–1142. [Google Scholar] [CrossRef]
- Sonar, K.; Upadhyay, H. A survey: DDOS attack on internet of things. Int. J. Eng. Res. Dev. 2014, 10, 58–63. [Google Scholar]
- Abomhara, M.; Køien, G.M. Cyber security and the internet of things: Vulnerabilities, threats, intruders and attacks. J. Cyber Secur. Mobil. 2015, 4, 65–88. [Google Scholar] [CrossRef]
- Andrea, I.; Chrysostomou, C.; Hadjichristofi, G. Internet of things: Security vulnerabilities and challenges. In Proceedings of the 2015 IEEE Symposium on Computers and Communication (ISCC), Larnaca, Cyprus, 6–9 July 2015; pp. 180–187. [Google Scholar]
- Deogirikar, J.; Vidhate, A. Security attacks in IoT: A survey. In Proceedings of the 2017 International Conference on I-SMAC (IoT in Social, Mobile, Analytics and Cloud) (I-SMAC), Palladam, India, 10–11 February 2017; pp. 32–37. [Google Scholar]
- Neshenko, N.; Bou-Harb, E.; Crichigno, J.; Kaddoum, G.; Ghani, N. Demystifying IoT security: An exhaustive survey on IoT vulnerabilities and a first empirical look on internet-scale IoT exploitations. IEEE Commun. Surv. Tutor. 2019, 21, 2702–2733. [Google Scholar] [CrossRef]
- Ronen, E.; Shamir, A. Extended functionality attacks on IoT devices: The case of smart lights. In Proceedings of the 2016 IEEE European Symposium on Security and Privacy (EuroS&P), Saarbrücken, Germany, 21–24 March 2016; pp. 3–12. [Google Scholar]
- Alaba, F.A.; Othman, M.; Hashem, I.A.T.; Alotaibi, F. Internet of things security: A survey. J. Netw. Comput. Appl. 2017, 88, 10–28. [Google Scholar] [CrossRef]
- IoT Botnets Found Using Default Credentials for C&C Server Databases. Available online: https://thehackernews.com/2018/06/iot-botnet-password.html (accessed on 8 October 2020).
- Available online: https://www.bankinfosecurity.com/massive-botnet-attack-used-more-than-400000-iot-devices-a-12841 (accessed on 8 October 2020).
- Available online: https://www.enigmasoftware.com/bashlite-malware-hits-one-million-iot-devices/ (accessed on 8 October 2020).
- Thingbots: The Future of Botnets in the Internet of Things. Available online: https://securityintelligence.com/thingbots-the-future-of-botnets-in-the-internet-of-things/ (accessed on 8 October 2020).
- McDermott, C.D.; Majdani, F.; Petrovski, A.V. Botnet detection in the internet of things using deep learning approaches. In Proceedings of the 2018 International Joint Conference on Neural Networks (IJCNN), Rio de Janeiro, Brazil, 8–13 July 2018; pp. 1–8. [Google Scholar]
- Brun, O.; Yin, Y.; Gelenbe, E. Deep learning with dense random neural network for detecting attacks against IoT-connected home environments. Procedia Comput. Sci. 2018, 134, 458–463. [Google Scholar] [CrossRef]
- Meidan, Y.; Bohadana, M.; Shabtai, A.; Ochoa, M.; Tippenhauer, N.O.; Guarnizo, J.D.; Elovici, Y. Detection of unauthorized IoT devices using machine learning techniques. arXiv 2017, arXiv:1709.04647. [Google Scholar]
- Doshi, R.; Apthorpe, N.; Feamster, N. Machine learning DDoS detection for consumer internet of things devices. In Proceedings of the 2018 IEEE Security and Privacy Workshops (SPW), San Francisco, CA, USA, 24–24 May 2018; pp. 29–35. [Google Scholar]
- Sivaraman, V.; Gharakheili, H.H.; Vishwanath, A.; Boreli, R.; Mehani, O. Network-level security and privacy control for smart-home IoT devices. In Proceedings of the 2015 IEEE 11th International Conference on Wireless and Mobile Computing, Networking and Communications (WiMob), Abu Dhabi, UAE, 19–21 October 2015; pp. 163–167. [Google Scholar]
- Meidan, Y.; Bohadana, M.; Shabtai, A.; Guarnizo, J.D.; Ochoa, M.; Tippenhauer, N.O. ProfilIoT: A machine learning approach for IoT device identification based on network traffic analysis. In Proceedings of the Symposium on Applied Computing, Marrakech, Morocco, 4–6 April 2017; pp. 506–509. [Google Scholar]
- Namvar, N.; Saad, W.; Bahadori, N.; Kelley, B. Jamming in the internet of things: A game-theoretic perspective. In Proceedings of the 2016 IEEE Global Communications Conference (GLOBECOM), Washington, DC, USA, 4–8 December 2016; pp. 1–6. [Google Scholar]
- Dou, Z.; Si, G.; Lin, Y.; Wang, M. An adaptive resource allocation model with anti-jamming in IoT network. IEEE Access 2019, 7, 93250–93258. [Google Scholar] [CrossRef]
- Angrishi, K. Turning internet of things (iot) into internet of vulnerabilities (iov): Iot botnets. arXiv 2017, arXiv:1702.03681. [Google Scholar]
- Kolias, C.; Kambourakis, G.; Stavrou, A.; Voas, J. DDoS in the IoT: Mirai and other botnets. Computer 2017, 50, 80–84. [Google Scholar]
- Li, C.; Qin, Z.; Novak, E.; Li, Q. Securing SDN infrastructure of IoT–fog networks from MitM attacks. IEEE Internet Things J. 2017, 4, 1156–1164. [Google Scholar] [CrossRef]
- Cekerevac, Z.; Dvorak, Z.; Prigoda, L.; Cekerevac, P. Internet of things and the man-in-the-middle attacks-security and economic risks. MEST J. 2017, 5, 15–25. [Google Scholar] [CrossRef]
- Wallgren, L.; Raza, S.; Voigt, T. Routing attacks and countermeasures in the RPL-based internet of things. Int. J. Distrib. Sens. Netw. 2013, 9, 794326. [Google Scholar] [CrossRef]
- Yavuz, F.Y.; Devrim, Ü.N.A.L.; Ensar, G.Ü.L. Deep learning for detection of routing attacks in the internet of things. Int. J. Comput. Intell. Syst. 2018, 12, 39–58. [Google Scholar] [CrossRef] [Green Version]
- Shiranzaei, A.; Khan, R.Z. An Approach to Discover the Sinkhole and Selective Forwarding Attack in IoT. J. Inf. Secur. Res. 2018, 9, 107. [Google Scholar] [CrossRef]
- Soni, V.; Modi, P.; Chaudhri, V. Detecting Sinkhole attack in wireless sensor network. Int. J. Appl. Innov. Eng. Manag. 2013, 2, 29–32. [Google Scholar]
- Palacharla, S.; Chandan, M.; GnanaSuryaTeja, K.; Varshitha, G. Wormhole attack: A major security concern in internet of things (IoT). Int. J. Eng. Technol. 2018, 7, 147–150. [Google Scholar] [CrossRef] [Green Version]
- Lee, P.; Clark, A.; Bushnell, L.; Poovendran, R. A passivity framework for modeling and mitigating wormhole attacks on networked control systems. IEEE Trans. Autom. Control 2014, 59, 3224–3237. [Google Scholar] [CrossRef] [Green Version]
- Rizal, R.; Riadi, I.; Prayudi, Y. Network forensics for detecting flooding attack on internet of things (IoT) device. Int. J. Cyber Secur. Digit. Forensics 2018, 7, 382–390. [Google Scholar]
- Campus, N.M.I.T.; Govindapura, G.; Yelahanka, B. Denial-of-service or flooding attack in IoT routing. Int. J. Pure Appl. Math. 2018, 118, 29–42. [Google Scholar]
- Azmoodeh, A.; Dehghantanha, A.; Conti, M.; Choo, K.K.R. Detecting crypto-ransomware in IoT networks based on energy consumption footprint. J. Ambient Intell. Humaniz. Comput. 2018, 9, 1141–1152. [Google Scholar] [CrossRef]
- Dash, A.; Pal, S.; Hegde, C. Ransomware auto-detection in IoT devices using machine learning. Int. J. Eng. Sci. 2018, 8, 19538–19546. [Google Scholar]
- Wang, X.; Yu, W.; Champion, A.; Fu, X.; Xuan, D. Detecting worms via mining dynamic program execution. In Proceedings of the 2007 Third International Conference on Security and Privacy in Communications Networks and the Workshops-SecureComm 2007, Nice, France, 17–21 September 2007; pp. 412–421. [Google Scholar]
- Yu, W.; Zhang, N.; Fu, X.; Zhao, W. Self-disciplinary worms and countermeasures: Modeling and analysis. IEEE Trans. Parallel Distrib. Syst. 2009, 21, 1501–1514. [Google Scholar] [CrossRef]
- Al-Garadi, M.A.; Mohamed, A.; Al-Ali, A.; Du, X.; Ali, I.; Guizani, M. A Survey of machine and deep learning methods for internet of things (IoT) security. arXiv 2018, arXiv:1807.11023. [Google Scholar] [CrossRef] [Green Version]
- Xie, X.; Wu, D.; Liu, S.; Li, R. IoT data analytics using deep learning. arXiv 2017, arXiv:1708.03854. [Google Scholar]
- Alam, F.; Mehmood, R.; Katib, I.; Albeshri, A. Analysis of eight data mining algorithms for smarter internet of things (IoT). Procedia Comput. Sci. 2016, 98, 437–442. [Google Scholar] [CrossRef] [Green Version]
- Mohammadi, M.; Al-Fuqaha, A.; Sorour, S.; Guizani, M. Deep learning for IoT big data and streaming analytics: A survey. IEEE Commun. Surv. Tutor. 2018, 20, 2923–2960. [Google Scholar] [CrossRef] [Green Version]
- KISA (Korea Internet & Security Agency). Study on IoT Device Malware Analysis Based on Embedded Linux, KISA-WP-2018-0025. 2018. Available online: https://www.kisa.or.kr/jsp/common/libraryDown.jsp?folder=0012200 (accessed on 8 October 2020).
- HaddadPajouh, H.; Dehghantanha, A.; Khayami, R.; Choo, K.K.R. A deep recurrent neural network based approach for internet of things malware threat hunting. Future Gener. Comput. Syst. 2018, 85, 88–96. [Google Scholar] [CrossRef]
- Hodo, E.; Bellekens, X.; Hamilton, A.; Dubouilh, P.L.; Iorkyase, E.; Tachtatzis, C.; Atkinson, R. Threat analysis of IoT networks using artificial neural network intrusion detection system. In Proceedings of the 2016 International Symposium on Networks, Computers and Communications (ISNCC), Yasmine Hammamet, Tunisia, 11–13 May 2016; pp. 1–6. [Google Scholar]
- Meidan, Y.; Bohadana, M.; Mathov, Y.; Mirsky, Y.; Shabtai, A.; Breitenbacher, D.; Elovici, Y. N-BaIoT—Network-based detection of IoT botnet attacks using deep autoencoders. IEEE Pervasive Comput. 2018, 17, 12–22. [Google Scholar] [CrossRef] [Green Version]
- Al Shorman, A.; Faris, H.; Aljarah, I. Unsupervised intelligent system based on one class support vector machine and Grey Wolf optimization for IoT botnet detection. J. Ambient Intell. Humaniz. Comput. 2020, 11, 2809–2825. [Google Scholar] [CrossRef]
- Manos, A.; April, T.; Bailey, M.; Bernhard, M.; Bursztein, E.; Cochran, J.; Durumeric, Z.; Halderman, J.A.; Invernizzi, L.; Kallitsis, M.; et al. Understanding the mirai botnet. In Proceedings of the 26th {USENIX} Security Symposium ({USENIX} Security 17), Vancouver, BC, Canada, 16–18 August 2017; pp. 1093–1110. [Google Scholar]
- Marzano, A.; Alexander, D.; Fonseca, O.; Fazzion, E.; Hoepers, C.; Steding-Jessen, K.; Chaves, M.H.P.C.; Cunha, Í.; Guedes, D.; Meira, W. The evolution of bashlite and mirai iot botnets. In Proceedings of the 2018 IEEE Symposium on Computers and Communications (ISCC), Natal, Brazil, 25–28 June 2018; pp. 00813–00818. [Google Scholar]
- Available online: https://github.com/jgamblin/Mirai-Source-Code (accessed on 8 October 2020).
- Bastos, G.; Marzano, A.; Fonseca, O.; Fazzion, E.; Hoepers, C.; Steding-Jessen, K.; Chaves, M.H.P.C.; Cunha, Í.; Guedes, D.; Meira, W. Identifying and Characterizing bashlite and mirai C&C servers. In Proceedings of the 2019 IEEE Symposium on Computers and Communications (ISCC), Barcelona, Spain, 29 June–3 July 2019; pp. 1–6. [Google Scholar]


| Classification | Reference | Classes |
|---|---|---|
| Based on the IoT layer | [6,7] | Perception layer, network layer, application layer |
| Attacks | [8] | Physical attacks, reconnaissance attacks, DoS, access attacks, attacks on privacy, cyber-crimes, destructive attacks, supervisory control and data acquisition (SCADA) attacks |
| [9,10] | Physical attacks, network attacks, software attacks, encryption attacks | |
| Vulnerabilities | [11] | Layers, security impact, attacks, countermeasures, sac |
| [12] | ignoring functionality, reducing functionality, misusing functionality, extending functionality | |
| [13] | application, architecture, communication, data |
| Layer | Attack | Confidentiality | Integrity | Availability | Reference |
|---|---|---|---|---|---|
| Perception | Jamming | O | O | [24,25] | |
| DoS | O | [26,27] | |||
| Network | MITM | O | O | [28,29] | |
| Routing attack | O | [30,31] | |||
| Sinkhole | O | [32,33] | |||
| Wormhole | O | O | [34,35] | ||
| Flooding | O | [36,37] | |||
| Application | Virus | O | O | O | [38,39] |
| Worm | O | O | [40,41] |
| Algorithm | Standard Dataset | Original Dataset | N-BaIoT | |||||||
|---|---|---|---|---|---|---|---|---|---|---|
| Reference | [43] | [47] | [44] | [18] | [19] | [20] | [48] | [49] | [50] | |
| ML | Random forest | O | ||||||||
| Decision tree | O | O | ||||||||
| BLSTM | O | |||||||||
| MLP | O | |||||||||
| Naïve Bayes | O | |||||||||
| KNN | O | O | ||||||||
| LDA | O | |||||||||
| ANN | O | |||||||||
| SVM | ||||||||||
| OCSVM | O | |||||||||
| IF | O | |||||||||
| LOF | O | |||||||||
| DL | DLANN | O | ||||||||
| LSTM | O | O | O | O | ||||||
| deep autoencoder | O | |||||||||
| Dense RNN | O | |||||||||
| RNN | ||||||||||
| CNN | ||||||||||
| Aggregated by | Value | Statistic | Total No. of Features |
|---|---|---|---|
| Source IP | Packet size (only outbound) | Mean, variance | 3 |
| Packet count | Integer | ||
| Source MAC-IP | Packet size (only outbound) | Mean, variance | 3 |
| Packet count | Integer | ||
| Channel | Packet size (only outbound) | Mean, variance | 10 |
| Packet count | Integer | ||
| Amount of time between packet arrivals | Mean, variance, integer | ||
| Packet size (both inbound and outbound) | Magnitude, radius, covariance, correlation coefficient | ||
| Socket | Packet size (only outbound) | Mean, variance | 7 |
| Packet count | Integer | ||
| Packet size (both inbound and outbound) | Magnitude, radius, covariance, correlation coefficient | ||
| Total | 23 | ||
| Botnet | Attack Type | Doorbell | Baby Monitor | Security Camera | Webcam |
|---|---|---|---|---|---|
| Benign | 14,954 | 52,369 | 29,668 | 5852 | |
| Bashlite | COMBO | 17,866 | 17,241 | 17,352 | 17,923 |
| junk | 8624 | 8638 | 8788 | 8248 | |
| Scan | 8960 | 8286 | 8329 | 8624 | |
| TCP | 27,574 | 27,886 | 26,770 | 29,217 | |
| UDP | 31,932 | 31,779 | 31,371 | 30,852 | |
| Mirai | Ack | 30,754 | 27,587 | 17,449 | 32,505 |
| Scan | 32,359 | 31,037 | 29,123 | 13,164 | |
| Syn | 36,788 | 35,525 | 18,653 | 36,507 | |
| UDP | 71,330 | 64,998 | 47,514 | 47,273 | |
| Plain UDP | 24,349 | 24,258 | 16,051 | 25,083 | |
| Total | 305,490 | 329,604 | 251,068 | 255,248 | |
| Models | Description | ||
|---|---|---|---|
| ML | Naïve Bayes (NB) | Gaussian NB |
|
| BernoulliNB and Multinomial NB |
| ||
| K-nearest neighbors (KNN) |
| ||
| Logistic regression (LR) |
| ||
| Decision tree (DT) |
| ||
| Random forest (RF) |
| ||
| DL | CNN |
| |
| RNN and LSTM |
| ||
| ML Models | Index | Doorbell | Baby Monitor | Security Camera | Webcam | ||||
|---|---|---|---|---|---|---|---|---|---|
| Benign | Attack | Benign | Attack | Benign | Attack | Benign | Attack | ||
| NB | Precision | 0.99 | 1 | 1 | 1 | 1 | 1 | 0.98 | 1 |
| Recall | 1 | 1 | 1 | 1 | 0.99 | 1 | 0.99 | 1 | |
| F1-score | 0.99 | 1 | 1 | 1 | 1 | 1 | 0.98 | 1 | |
| KNN | Precision | 0.99 | 1 | 0.99 | 1 | 0.98 | 1 | 0.96 | 1 |
| Recall | 0.99 | 1 | 0.97 | 1 | 0.97 | 1 | 0.96 | 1 | |
| F1-score | 0.99 | 1 | 0.98 | 1 | 0.98 | 1 | 0.96 | 1 | |
| LR | Precision | 0.03 | 0.94 | 0.17 | 0.85 | 0.21 | 0.92 | 0.79 | 0.98 |
| Recall | 0.22 | 0.62 | 0.46 | 0.59 | 0.55 | 0.73 | 0.01 | 1 | |
| F1-score | 0.05 | 0.75 | 0.25 | 0.7 | 0.31 | 0.81 | 0.01 | 0.99 | |
| DT | Precision | 1 | 1 | 1 | 1 | 1 | 1 | 1 | 1 |
| Recall | 1 | 1 | 1 | 1 | 1 | 1 | 1 | 1 | |
| F1-score | 1 | 1 | 1 | 1 | 1 | 1 | 1 | 1 | |
| RF | Precision | 1 | 1 | 1 | 1 | 1 | 1 | 1 | 1 |
| Recall | 1 | 1 | 1 | 1 | 1 | 1 | 1 | 1 | |
| F1-score | 1 | 1 | 1 | 1 | 1 | 1 | 1 | 1 | |
| Type of NB | Doorbell | Baby Monitor | Security Camera | Webcam |
|---|---|---|---|---|
| Gaussian NB | 0.95 | 0.84 | 0.88 | 0.98 |
| Bernoulli NB | 0.91 | 0.93 | 0.83 | 0.99 |
| Multinomial NB | 1 | 1 | 1 | 1 |
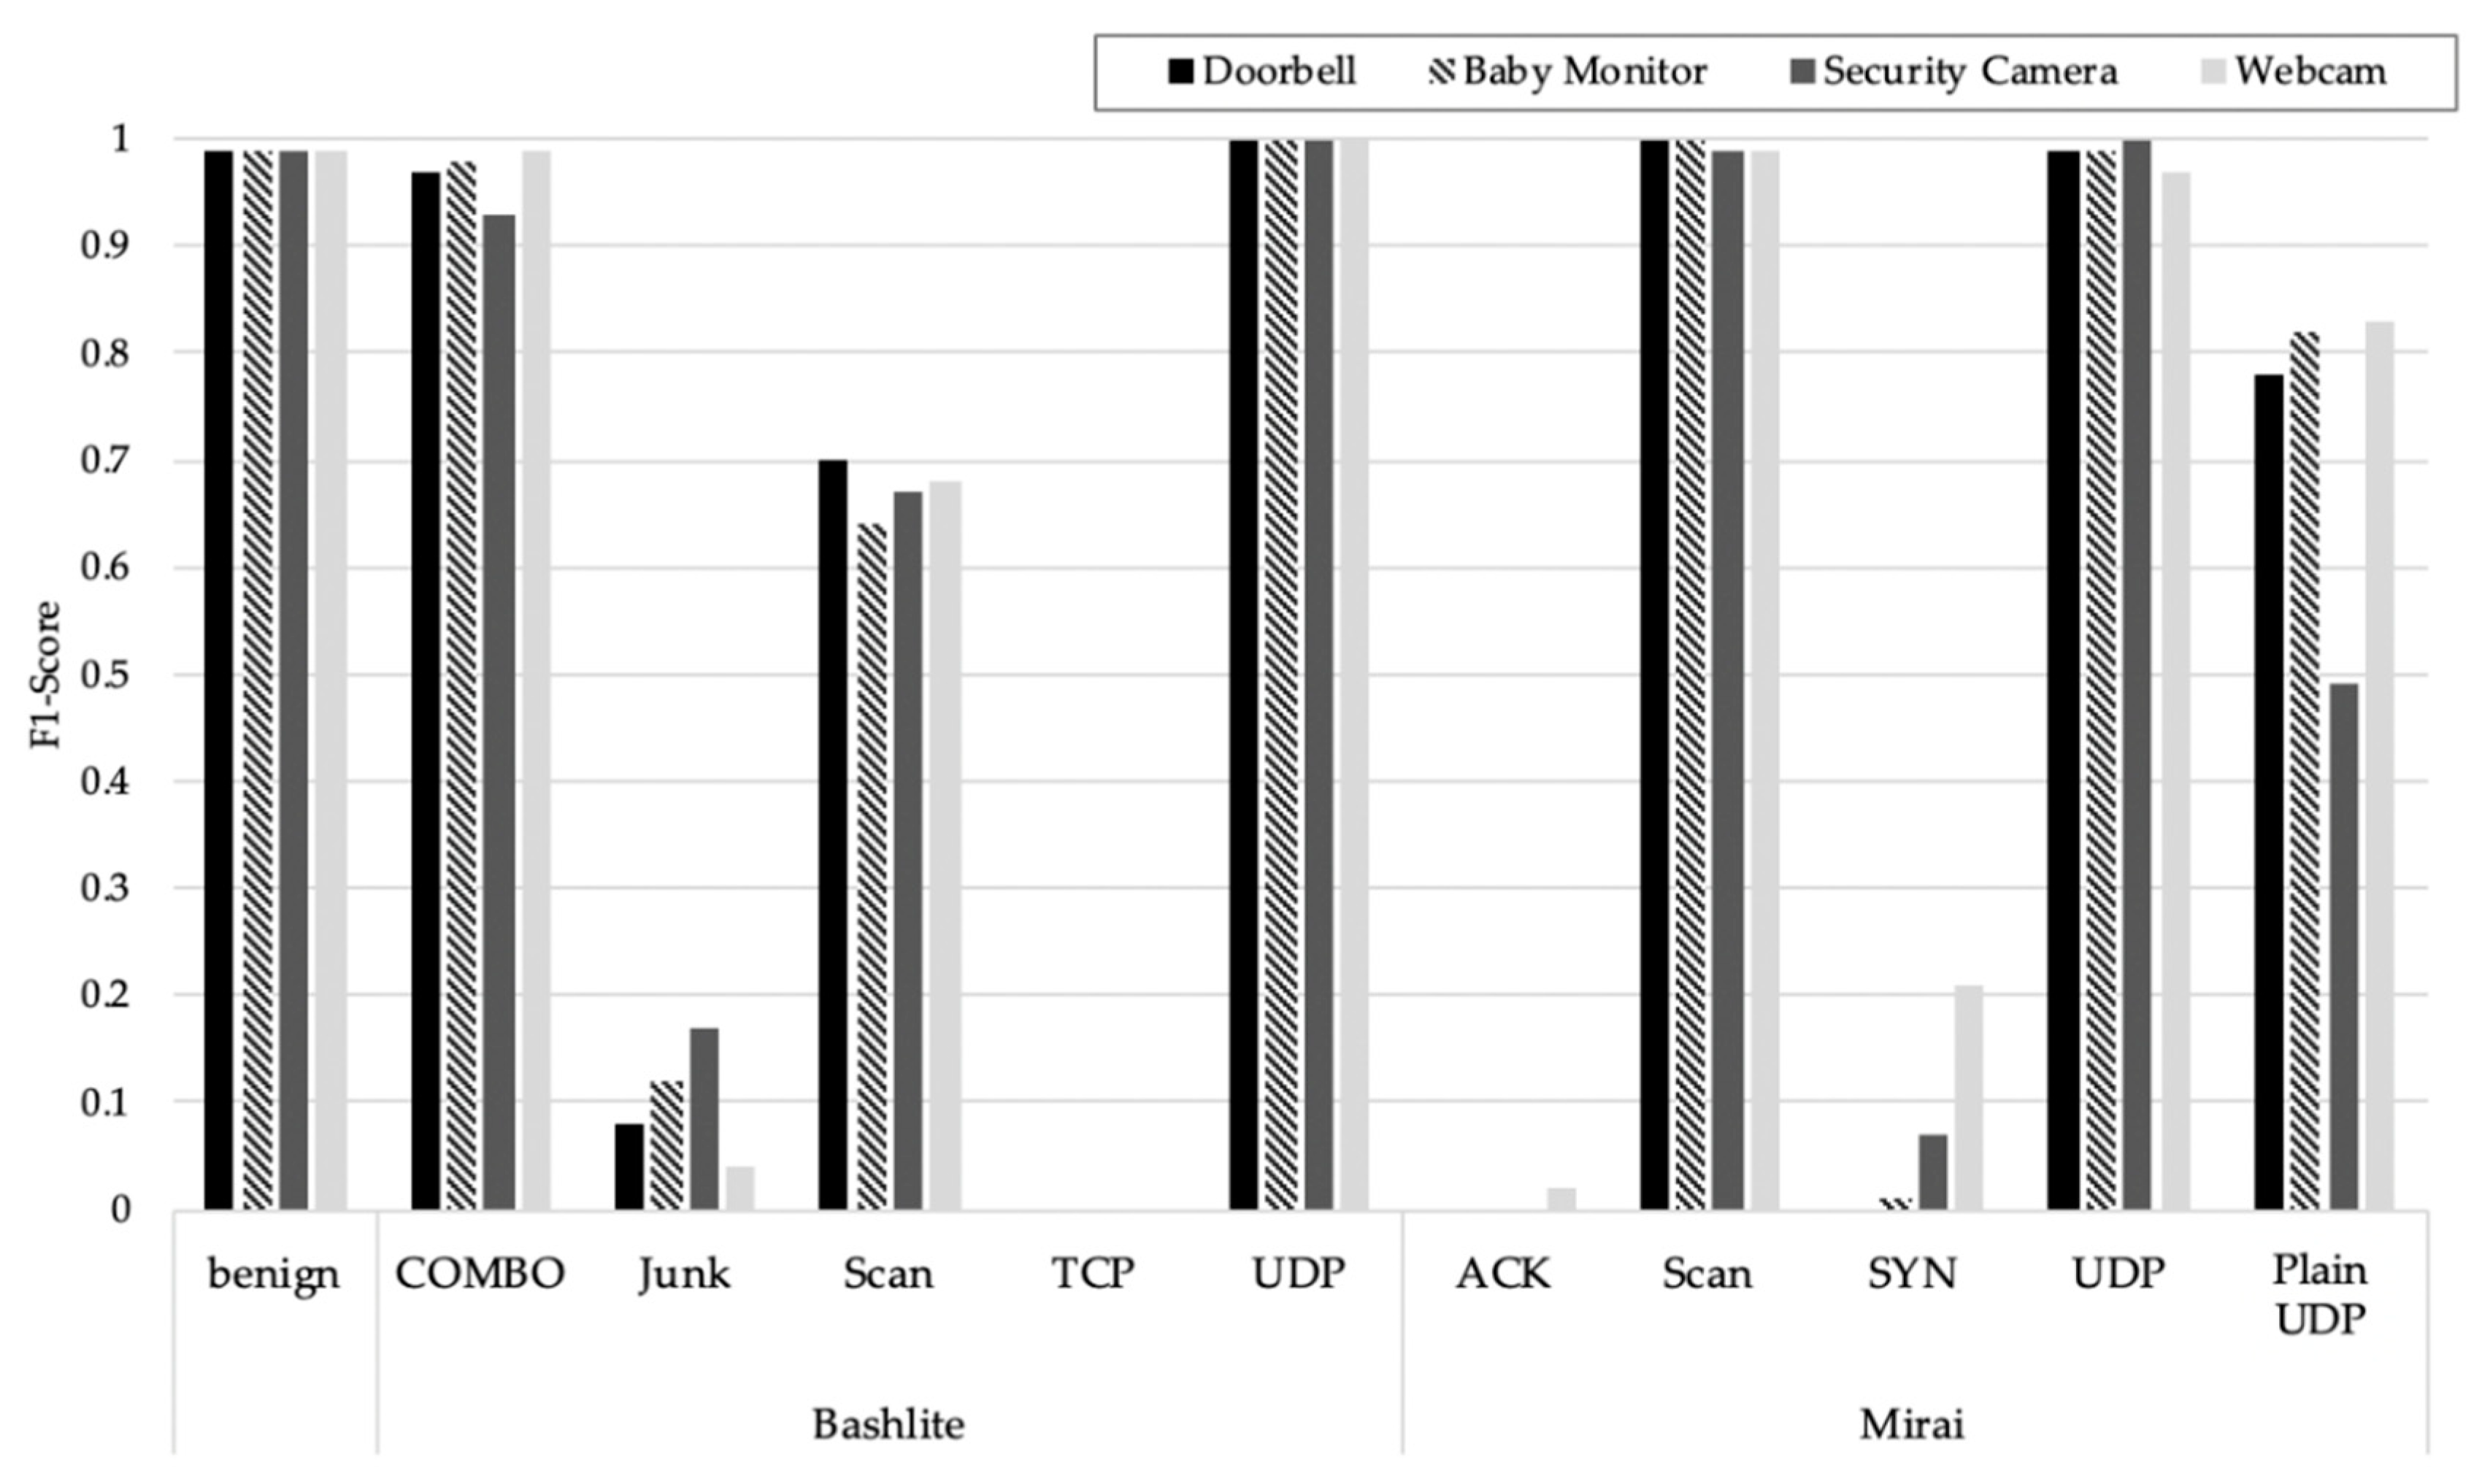
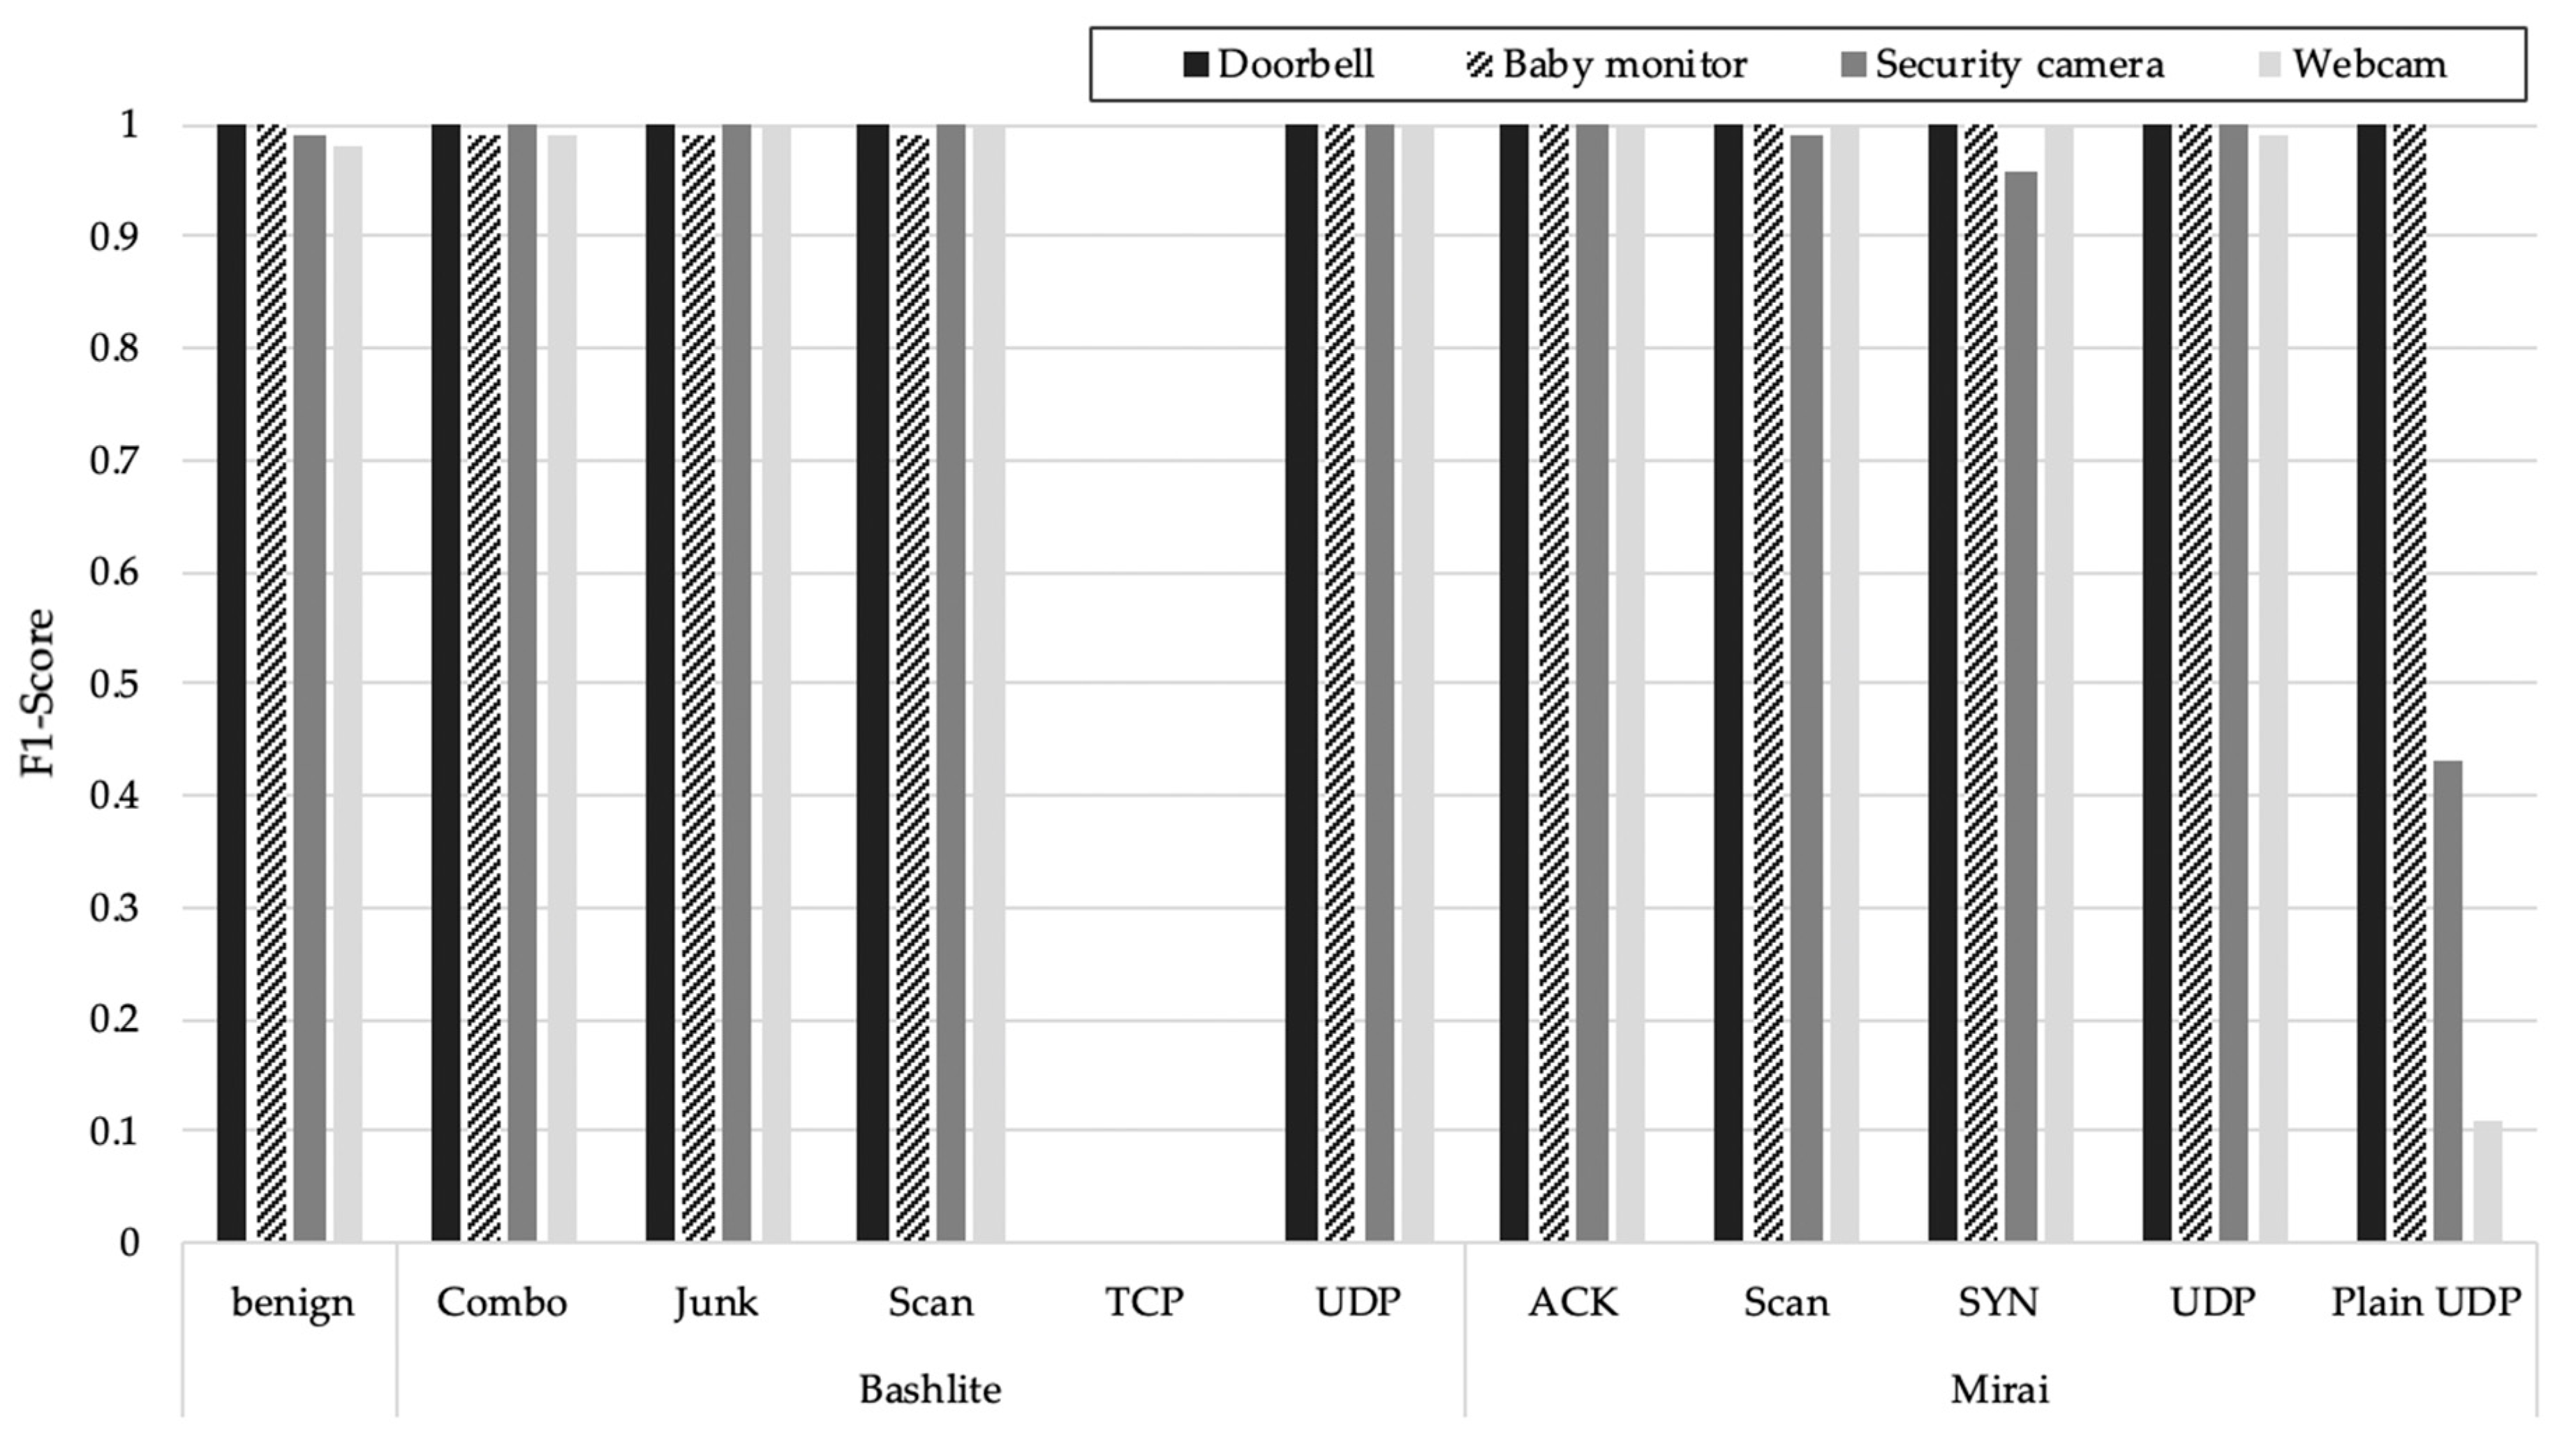
| Device | ML | Benign | Bashlite | Mirai | ||||||||
|---|---|---|---|---|---|---|---|---|---|---|---|---|
| Combo | Junk | Scan | TCP | UDP | ACK | Scan | SYN | UDP | Plain UDP | |||
| Doorbell | NB | 0.99 | 0.97 | 0.08 | 0.7 | 0 | 1 | 0 | 1 | 0 | 0.99 | 0.78 |
| KNN | 0.99 | 1 | 0.99 | 0.98 | 1 | 1 | 0.73 | 1 | 0.77 | 0.81 | 0.91 | |
| LR | 0.32 | 0 | 0 | 0.98 | 0 | 0 | 0 | 0 | 0 | 0 | 0 | |
| DT | 1 | 1 | 1 | 1 | 1 | 1 | 1 | 1 | 1 | 1 | 1 | |
| RF | 1 | 1 | 1 | 1 | 1 | 1 | 1 | 1 | 1 | 1 | 1 | |
| Baby Monitor | NB | 0.99 | 0.98 | 0.12 | 0.64 | 0 | 1 | 0 | 1 | 0.01 | 0.99 | 0.82 |
| KNN | 0.98 | 1 | 1 | 0.97 | 1 | 1 | 0.75 | 1 | 0.77 | 0.79 | 0.91 | |
| LR | 0.36 | 0 | 0 | 0.63 | 0 | 0 | 0 | 0 | 0 | 0 | 0 | |
| DT | 1 | 1 | 1 | 1 | 0.97 | 1 | 1 | 1 | 1 | 1 | 1 | |
| RF | 1 | 1 | 1 | 1 | 0.98 | 0.99 | 1 | 1 | 1 | 1 | 1 | |
| Security Camera | NB | 0.99 | 0.93 | 0.17 | 0.67 | 0 | 1 | 0 | 0.99 | 0.07 | 1 | 0.49 |
| KNN | 0.98 | 1 | 1 | 0.98 | 1 | 1 | 0.79 | 0.99 | 0.71 | 0.92 | 0.84 | |
| LR | 0.82 | 0 | 0 | 0.64 | 0 | 0 | 0 | 0 | 0 | 0 | 0 | |
| DT | 1 | 1 | 1 | 1 | 1 | 1 | 1 | 1 | 1 | 1 | 1 | |
| RF | 1 | 1 | 1 | 1 | 1 | 1 | 1 | 1 | 1 | 1 | 1 | |
| Webcam | NB | 0.99 | 0.99 | 0.04 | 0.68 | 0 | 1 | 0.02 | 0.99 | 0.21 | 0.97 | 0.83 |
| KNN | 0.96 | 1 | 1 | 0.98 | 1 | 1 | 0.72 | 1 | 0.76 | 0.69 | 0.89 | |
| LR | 0.95 | 0 | 0 | 0.64 | 0 | 0 | 0 | 0 | 0 | 0 | 0 | |
| DT | 1 | 1 | 1 | 1 | 0.94 | 1 | 1 | 1 | 1 | 1 | 1 | |
| RF | 1 | 1 | 1 | 1 | 0.97 | 0.97 | 1 | 1 | 1 | 1 | 1 | |
| Botnet | Attack | Device | Benign | Bashlite | Mirai | ||||||||
|---|---|---|---|---|---|---|---|---|---|---|---|---|---|
| COMBO | Junk | Scan | TCP | UDP 1 | ACK | Scan | SYN | UDP 1 | Plain UDP 2 | ||||
| BASHLITE | Junk | Doorbell | 0 | 7872 | 717 | 10 | 1 | 0 | 2 | 0 | 13 | 9 | 0 |
| Baby Monitor | 6 | 7574 | 1005 | 11 | 1 | 0 | 2 | 1 | 31 | 7 | 0 | ||
| Security Camera | 6 | 7259 | 1490 | 8 | 1 | 0 | 0 | 0 | 16 | 8 | 0 | ||
| Webcam | 4 | 7824 | 353 | 10 | 0 | 0 | 2 | 0 | 49 | 5 | 1 | ||
| Scan | Doorbell | 122 | 0 | 0 | 6277 | 1 | 0 | 5 | 2508 | 0 | 35 | 12 | |
| Baby Monitor | 179 | 0 | 0 | 5333 | 0 | 0 | 12 | 2747 | 0 | 15 | 0 | ||
| Security Camera | 144 | 0 | 0 | 5587 | 2 | 0 | 5 | 2572 | 0 | 19 | 0 | ||
| Webcam | 44 | 0 | 0 | 5875 | 6 | 0 | 16 | 2675 | 0 | 7 | 1 | ||
| TCP | Doorbell | 7 | 0 | 0 | 5 | 1 | 27,538 | 6 | 0 | 0 | 10 | 7 | |
| Baby Monitor | 25 | 0 | 0 | 3 | 1 | 27,853 | 3 | 0 | 0 | 0 | 1 | ||
| Security Camera | 11 | 0 | 0 | 1 | 1 | 26,748 | 1 | 0 | 0 | 8 | 0 | ||
| Webcam | 17 | 0 | 0 | 7 | 0 | 29,187 | 1 | 0 | 0 | 0 | 5 | ||
| Mirai | ACK | Doorbell | 0 | 0 | 0 | 1 | 0 | 0 | 2 | 0 | 0 | 29,856 | 895 |
| Baby Monitor | 1 | 0 | 0 | 1 | 0 | 0 | 0 | 0 | 0 | 25,858 | 1727 | ||
| Security Camera | 0 | 0 | 0 | 0 | 0 | 4 | 4 | 0 | 0 | 17,441 | 0 | ||
| Webcam | 5 | 0 | 0 | 2 | 0 | 0 | 628 | 0 | 0 | 30,584 | 1286 | ||
| SYN | Doorbell | 0 | 25,415 | 0 | 4 | 0 | 1 | 0 | 11,198 | 170 | 0 | 0 | |
| Baby Monitor | 1 | 23,909 | 0 | 5 | 0 | 0 | 0 | 10,823 | 787 | 0 | 0 | ||
| Security Camera | 0 | 9066 | 23 | 14 | 0 | 4 | 0 | 8155 | 1391 | 0 | 0 | ||
| Webcam | 0 | 20,428 | 0 | 20 | 0 | 0 | 0 | 8413 | 7646 | 0 | 0 | ||
| Plain UDP 2 | Doorbell | 2 | 0 | 0 | 1 | 0 | 0 | 1 | 0 | 0 | 5344 | 19,001 | |
| Baby Monitor | 2 | 0 | 0 | 4 | 0 | 0 | 0 | 0 | 0 | 4354 | 19,898 | ||
| Security Camera | 0 | 0 | 0 | 1 | 0 | 0 | 0 | 0 | 0 | 8216 | 7834 | ||
| Webcam | 1 | 0 | 0 | 5 | 0 | 0 | 0 | 0 | 0 | 4250 | 20,827 | ||
| Botnet | Attack | Device | Benign | Bashlite | Mirai | ||||||||
|---|---|---|---|---|---|---|---|---|---|---|---|---|---|
| COMBO | Junk | Scan | TCP | UDP 1 | ACK | Scan | SYN | UDP 1 | Plain UDP 2 | ||||
| Mirai | ACK | Doorbell | 0 | 0 | 0 | 1 | 0 | 0 | 2 | 0 | 0 | 29,856 | 895 |
| Baby Monitor | 1 | 0 | 0 | 1 | 0 | 0 | 0 | 0 | 0 | 25,858 | 1727 | ||
| Security Camera | 0 | 0 | 0 | 0 | 0 | 4 | 4 | 0 | 0 | 17,441 | 0 | ||
| Webcam | 5 | 0 | 0 | 2 | 0 | 0 | 628 | 0 | 0 | 30,584 | 1286 | ||
| SYN | Doorbell | 0 | 25,415 | 0 | 4 | 0 | 1 | 0 | 11,198 | 170 | 0 | 0 | |
| Baby Monitor | 1 | 23,909 | 0 | 5 | 0 | 0 | 0 | 10,823 | 787 | 0 | 0 | ||
| Security Camera | 0 | 9066 | 23 | 14 | 0 | 4 | 0 | 8155 | 1391 | 0 | 0 | ||
| Webcam | 0 | 20,428 | 0 | 20 | 0 | 0 | 0 | 8413 | 7646 | 0 | 0 | ||
| UDP 1 | Doorbell | 0 | 0 | 0 | 0 | 0 | 4 | 2 | 0 | 0 | 70,420 | 904 | |
| Baby Monitor | 0 | 0 | 0 | 0 | 0 | 3 | 0 | 0 | 0 | 64,477 | 518 | ||
| Security Camera | 0 | 0 | 0 | 2 | 0 | 2 | 0 | 0 | 0 | 47,510 | 0 | ||
| Webcam | 0 | 0 | 0 | 5 | 0 | 3 | 630 | 0 | 0 | 45,624 | 1011 | ||
| Plain UDP 2 | Doorbell | 2 | 0 | 0 | 1 | 0 | 0 | 1 | 0 | 0 | 5344 | 19,001 | |
| Baby Monitor | 2 | 0 | 0 | 4 | 0 | 0 | 0 | 0 | 0 | 4354 | 19,898 | ||
| Security Camera | 0 | 0 | 0 | 1 | 0 | 0 | 0 | 0 | 0 | 8216 | 7834 | ||
| Webcam | 1 | 0 | 0 | 5 | 0 | 0 | 0 | 0 | 0 | 4250 | 20,827 | ||
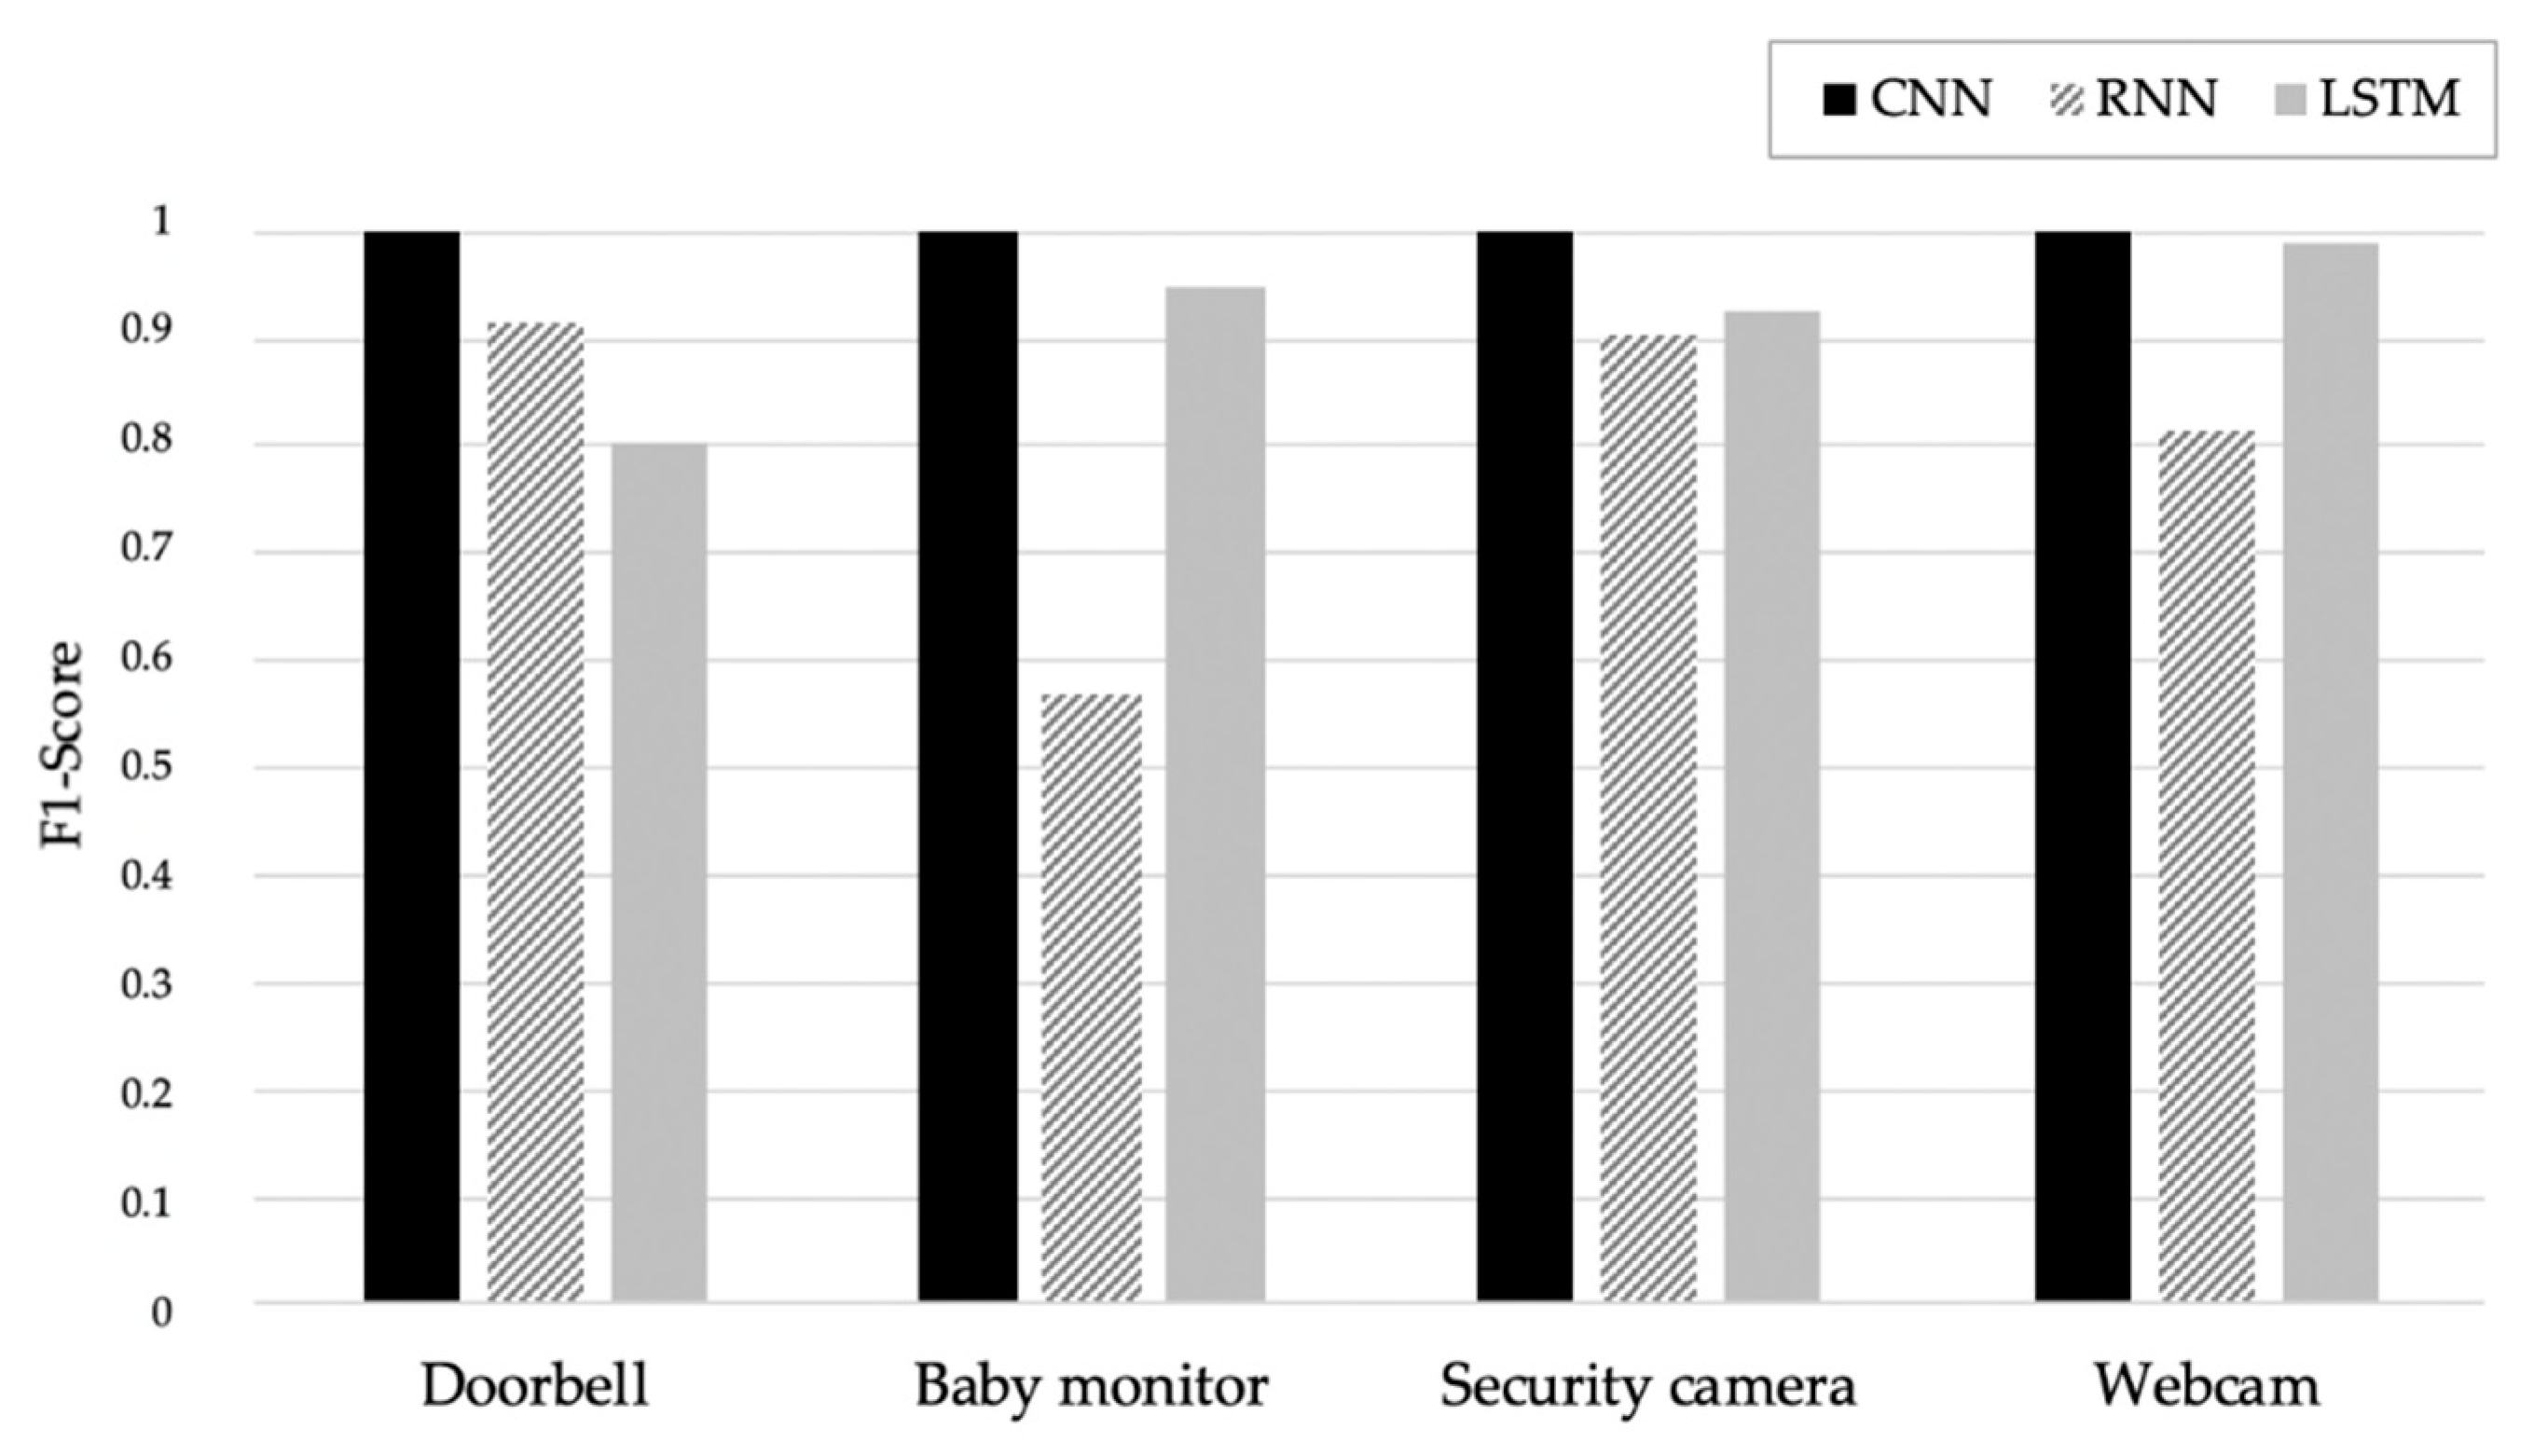
| DL Model | Doorbell | Baby Monitor | Security Camera | Webcam |
|---|---|---|---|---|
| CNN | 0.91 | 0.91 | 0.85 | 0.82 |
| RNN | 0.41 | 0.44 | 0.37 | 0.55 |
| LSTM | 0.62 | 0.54 | 0.25 | 0.43 |
| Device | Botnet | Attack | Benign | Bashlite | Mirai | ||||||||
|---|---|---|---|---|---|---|---|---|---|---|---|---|---|
| COMBO | Junk | Scan | TCP | UDP 1 | ACK | Scan | SYN | UDP 1 | Plain UDP 2 | ||||
| Doorbell | Benign | 12,218 | 83 | 17 | 2360 | 0 | 28 | 27 | 27 | 85 | 17 | 2 | |
| Bashlite | COMBO | 10 | 13,940 | 472 | 3134 | 1 | 1 | 0 | 6 | 0 | 341 | 10 | |
| Junk | 8 | 3093 | 1013 | 4541 | 0 | 1 | 0 | 1 | 2 | 49 | 12 | ||
| Scan | 57 | 679 | 62 | 7442 | 0 | 9 | 5 | 7 | 1 | 12 | 681 | ||
| TCP | 7 | 2 | 0 | 6 | 1 | 2 | 0 | 0 | 0 | 27,624 | 0 | ||
| UDP 1 | 4 | 0 | 1 | 13 | 0 | 5 | 1 | 4 | 0 | 31,734 | 0 | ||
| Mirai | ACK | 14 | 6 | 6 | 1328 | 0 | 7 | 19,344 | 83 | 2 | 9847 | 22 | |
| Scan | 0 | 3 | 0 | 8 | 0 | 2 | 29,403 | 404 | 0 | 2461 | 25 | ||
| SYN | 981 | 35 | 256 | 12,348 | 183 | 590 | 31 | 19,279 | 41 | 2271 | 757 | ||
| UDP1 | 0 | 1 | 0 | 8 | 2 | 5 | 5 | 9 | 0 | 71,249 | 21 | ||
| Plain UDP 2 | 0 | 1 | 0 | 2 | 49 | 1 | 4120 | 924 | 0 | 12,199 | 7299 | ||
| Baby Monitor | Benign | 50,872 | 33 | 0 | 5 | 1 | 19 | 898 | 56 | 502 | 106 | 42 | |
| Bashlite | COMBO | 225 | 9954 | 3 | 0 | 0 | 0 | 6 | 2 | 15 | 7301 | 0 | |
| Junk | 273 | 538 | 0 | 0 | 0 | 0 | 3 | 1 | 15 | 7724 | 0 | ||
| Scan | 8243 | 3 | 2 | 28 | 0 | 0 | 6 | 12 | 29 | 68 | 1 | ||
| TCP | 11 | 3 | 0 | 0 | 0 | 27,809 | 5 | 0 | 1 | 0 | 1 | ||
| UDP 1 | 20 | 0 | 0 | 0 | 0 | 31,676 | 5 | 1 | 2 | 3 | 0 | ||
| Mirai | ACK | 6 | 0 | 0 | 0 | 0 | 0 | 17,598 | 9507 | 342 | 0 | 4 | |
| Scan | 13 | 6 | 0 | 0 | 0 | 4 | 0 | 7284 | 23,878 | 1 | 9 | ||
| SYN | 5768 | 15,818 | 0 | 0 | 0 | 0 | 16 | 11 | 10,656 | 3159 | 4 | ||
| UDP 1 | 14 | 0 | 0 | 0 | 0 | 37 | 0 | 22,230 | 2 | 42,339 | 73 | ||
| Plain UDP 2 | 2 | 20 | 0 | 0 | 0 | 736 | 0 | 9926 | 6 | 1287 | 12,325 | ||
| Security Camera | Benign | 28,931 | 47 | 9 | 20 | 6 | 18 | 65 | 158 | 136 | 144 | 31 | |
| Bashlite | COMBO | 9062 | 8071 | 151 | 0 | 0 | 0 | 1 | 0 | 3 | 1 | 1 | |
| Junk | 4812 | 3264 | 572 | 0 | 2 | 1 | 14 | 1 | 1 | 47 | 4 | ||
| Scan | 8427 | 29 | 2 | 9 | 0 | 1 | 2 | 0 | 9 | 0 | 8 | ||
| TCP | 26,798 | 4 | 1 | 0 | 0 | 0 | 1 | 1 | 1 | 0 | 0 | ||
| UDP 1 | 31,424 | 1 | 1 | 0 | 0 | 0 | 0 | 0 | 0 | 2 | 0 | ||
| Mirai | ACK | 208 | 99 | 507 | 4 | 2 | 0 | 9461 | 3715 | 147 | 3206 | 192 | |
| Scan | 471 | 1 | 2 | 0 | 1 | 1 | 0 | 28,538 | 0 | 4 | 0 | ||
| SYN | 10,812 | 97 | 8 | 2202 | 127 | 58 | 48 | 1234 | 3763 | 4 | 226 | ||
| UDP 1 | 119 | 81 | 271 | 10 | 13 | 0 | 276 | 9900 | 679 | 34,867 | 1327 | ||
| Plain UDP 2 | 97 | 72 | 809 | 34 | 21 | 10 | 542 | 3191 | 709 | 9867 | 741 | ||
| Webcam | Benign | 3479 | 22 | 27 | 4 | 1 | 25 | 6 | 28 | 2 | 582 | 1723 | |
| Bashlite | COMBO | 11 | 16,002 | 790 | 304 | 0 | 1 | 1 | 5 | 57 | 1 | 680 | |
| Junk | 11 | 5398 | 1787 | 531 | 0 | 0 | 0 | 0 | 13 | 0 | 465 | ||
| Scan | 66 | 206 | 75 | 8065 | 0 | 15 | 3 | 9 | 32 | 1 | 99 | ||
| TCP | 7 | 7 | 1 | 4 | 0 | 29,462 | 1 | 1 | 0 | 0 | 2 | ||
| UDP 1 | 6 | 5 | 0 | 12 | 0 | 30,884 | 0 | 4 | 1 | 1 | 2 | ||
| Mirai | ACK | 3685 | 23,661 | 1 | 2283 | 0 | 1515 | 0 | 30 | 8 | 41 | 871 | |
| Scan | 35 | 5 | 1 | 20 | 0 | 54 | 0 | 12,714 | 1 | 183 | 139 | ||
| SYN | 18,951 | 839 | 2 | 9 | 0 | 339 | 0 | 4 | 12,813 | 3889 | 0 | ||
| UDP 1 | 13,632 | 2077 | 17 | 5 | 0 | 48 | 0 | 4 | 47 | 31,131 | 21 | ||
| Plain UDP 2 | 12,398 | 241 | 32 | 23 | 0 | 1 | 0 | 213 | 1 | 1119 | 11,218 | ||
| Device | Botnet | Attack | Bashlite | Mirai | |||||||||
|---|---|---|---|---|---|---|---|---|---|---|---|---|---|
| Benign | COMBO | Junk | Scan | TCP | UDP 1 | ACK | Scan | SYN | UDP 1 | Plain UDP 2 | |||
| Doorbell | Benign | 14,764 | 72 | 0 | 1 | 11 | 0 | 14 | 1 | 1 | 0 | 0 | |
| Bashlite | COMBO | 42 | 17,820 | 0 | 47 | 3 | 0 | 1 | 0 | 2 | 0 | 0 | |
| Junk | 25 | 8613 | 0 | 74 | 0 | 0 | 3 | 1 | 4 | 0 | 0 | ||
| Scan | 169 | 8 | 0 | 8733 | 4 | 0 | 16 | 1 | 22 | 2 | 0 | ||
| TCP | 14 | 1 | 0 | 1 | 0 | 0 | 27,624 | 1 | 0 | 0 | 1 | ||
| UDP1 | 19 | 7 | 0 | 0 | 2 | 0 | 31,732 | 0 | 1 | 1 | 0 | ||
| Mirai | ACK | 13 | 1 | 1 | 0 | 1 | 0 | 20,323 | 3 | 0 | 10,317 | 0 | |
| Scan | 11 | 20 | 0 | 0 | 994 | 0 | 1445 | 29,818 | 1 | 17 | 0 | ||
| SYN | 7 | 7 | 2 | 77 | 38 | 0 | 13 | 735 | 35,893 | 0 | 0 | ||
| UDP1 | 20 | 3 | 0 | 3 | 2 | 0 | 145 | 11 | 1 | 71,114 | 1 | ||
| Plain UDP2 | 4 | 4 | 0 | 0 | 3 | 0 | 8326 | 6062 | 35 | 2517 | 7644 | ||
| Baby Monitor | Benign | 52,339 | 4 | 0 | 34 | 0 | 9 | 13 | 0 | 163 | 7 | 3 | |
| Bashlite | COMBO | 14 | 9845 | 0 | 34 | 0 | 0 | 0 | 0 | 7553 | 0 | 0 | |
| Junk | 7 | 533 | 0 | 21 | 0 | 0 | 0 | 0 | 7943 | 1 | 0 | ||
| Scan | 40 | 3 | 0 | 149 | 0 | 1 | 0 | 0 | 8164 | 1 | 0 | ||
| TCP | 13 | 0 | 0 | 12 | 0 | 27,746 | 0 | 0 | 3 | 0 | 0 | ||
| UDP1 | 9 | 1 | 0 | 7 | 0 | 31,711 | 0 | 0 | 7 | 0 | 0 | ||
| Mirai | ACK | 0 | 0 | 0 | 0 | 0 | 9171 | 18,066 | 88 | 5 | 5 | 2 | |
| Scan | 2 | 0 | 0 | 0 | 0 | 31,031 | 8 | 3 | 23 | 19 | 0 | ||
| SYN | 3 | 0 | 0 | 1 | 0 | 1673 | ,211 | 6 | 26,536 | 5 | 4 | ||
| UDP1 | 5 | 0 | 0 | 0 | 0 | 93 | 20 | 0 | 2 | 64,990 | 0 | ||
| Plain UDP2 | 0 | 0 | 0 | 0 | 0 | 1 | 58 | 1 | 218 | 869 | 23,095 | ||
| Security Camera | Benign | 29,554 | 0 | 0 | 0 | 0 | 0 | 0 | 0 | 0 | 0 | 0 | |
| Bashlite | COMBO | 3576 | 9470 | 4213 | 0 | 0 | 0 | 0 | 0 | 0 | 0 | 0 | |
| Junk | 3276 | 663 | 4780 | 1 | 0 | 0 | 0 | 0 | 0 | 0 | 0 | ||
| Scan | 8518 | 0 | 1 | 0 | 0 | 0 | 0 | 0 | 0 | 0 | 0 | ||
| TCP | 26,816 | 0 | 0 | 0 | 0 | 0 | 0 | 0 | 0 | 0 | 0 | ||
| UDP1 | 31,397 | 1 | 0 | 0 | 0 | 0 | 0 | 0 | 0 | 0 | 0 | ||
| Mirai | ACK | 17,399 | 0 | 0 | 0 | 0 | 0 | 0 | 0 | 0 | 0 | 0 | |
| Scan | 29,129 | 0 | 0 | 0 | 0 | 0 | 0 | 0 | 0 | 0 | 0 | ||
| SYN | 18,555 | 0 | 0 | 0 | 0 | 0 | 0 | 0 | 0 | 0 | 0 | ||
| UDP1 | 20,421 | 0 | 0 | 0 | 0 | 0 | 0 | 0 | 221 | 26,941 | 0 | ||
| Plain UDP2 | 8253 | 0 | 0 | 13 | 0 | 0 | 0 | 0 | 36 | 7290 | 544 | ||
| Webcam | Benign | 5553 | 38 | 0 | 1 | 0 | 0 | 84 | 0 | 153 | 2 | 27 | |
| Bashlite | COMBO | 56 | 17,756 | 0 | 0 | 0 | 0 | 1 | 0 | 6 | 0 | 0 | |
| Junk | 30 | 8189 | 0 | 1 | 0 | 0 | 2 | 0 | 2 | 0 | 0 | ||
| Scan | 182 | 12 | 0 | 8347 | 0 | 0 | 3 | 0 | 26 | 0 | 2 | ||
| TCP | 22 | 0 | 0 | 1 | 0 | 0 | 0 | 0 | 29,400 | 0 | 0 | ||
| UDP1 | 28 | 3 | 0 | 0 | 0 | 0 | 0 | 0 | 30,863 | 0 | 0 | ||
| Mirai | ACK | 29,748 | 2 | 0 | 6 | 0 | 0 | 2 | 0 | 2382 | 0 | 16 | |
| Scan | 41 | 5 | 0 | 11 | 0 | 0 | 0 | 0 | 40 | 0 | 13,005 | ||
| SYN | 4 | 9 | 0 | 13 | 0 | 0 | 0 | 0 | 36,718 | 0 | 0 | ||
| UDP | 95 | 4 | 0 | 15 | 0 | 569 | 0 | 0 | 42 | 0 | 46,400 | ||
| Plain UDP2 | 5251 | 4 | 0 | 5 | 0 | 1 | 27 | 0 | 24 | 0 | 20,019 | ||
| Device Type | Device Model Name |
|---|---|
| Doorbell | Danmini |
| Ennio | |
| Thermostat | Ecobee |
| Baby monitor | Philips B120N/10 |
| Security camera | Provision PT-737E |
| Provision PT-838 | |
| SimpleHome XCS7–1002-WHT | |
| SimpleHome XCS7-1003-WHT | |
| Webcam | Samsung SNH 1011 N |
| Botnet | Attack | Explanation |
|---|---|---|
| Bashlite | Scan | Scans the network for vulnerable devices |
| Junk | Sending spam data | |
| UDP | UDP flooding | |
| TCP | TCP flooding | |
| COMBO | Sends spam data and open connection of IP, port | |
| Mirai | Scan | Automatic scanning for vulnerable devices |
| Ack | ACK flooding | |
| Syn | SYN flooding | |
| UDP | UDP flooding | |
| Plain UDP | Less of an option of UDP flooding for higher packet per second |
© 2020 by the authors. Licensee MDPI, Basel, Switzerland. This article is an open access article distributed under the terms and conditions of the Creative Commons Attribution (CC BY) license (http://creativecommons.org/licenses/by/4.0/).
Share and Cite
Kim, J.; Shim, M.; Hong, S.; Shin, Y.; Choi, E. Intelligent Detection of IoT Botnets Using Machine Learning and Deep Learning. Appl. Sci. 2020, 10, 7009. https://doi.org/10.3390/app10197009
Kim J, Shim M, Hong S, Shin Y, Choi E. Intelligent Detection of IoT Botnets Using Machine Learning and Deep Learning. Applied Sciences. 2020; 10(19):7009. https://doi.org/10.3390/app10197009
Chicago/Turabian StyleKim, Jiyeon, Minsun Shim, Seungah Hong, Yulim Shin, and Eunjung Choi. 2020. "Intelligent Detection of IoT Botnets Using Machine Learning and Deep Learning" Applied Sciences 10, no. 19: 7009. https://doi.org/10.3390/app10197009