1. Introduction
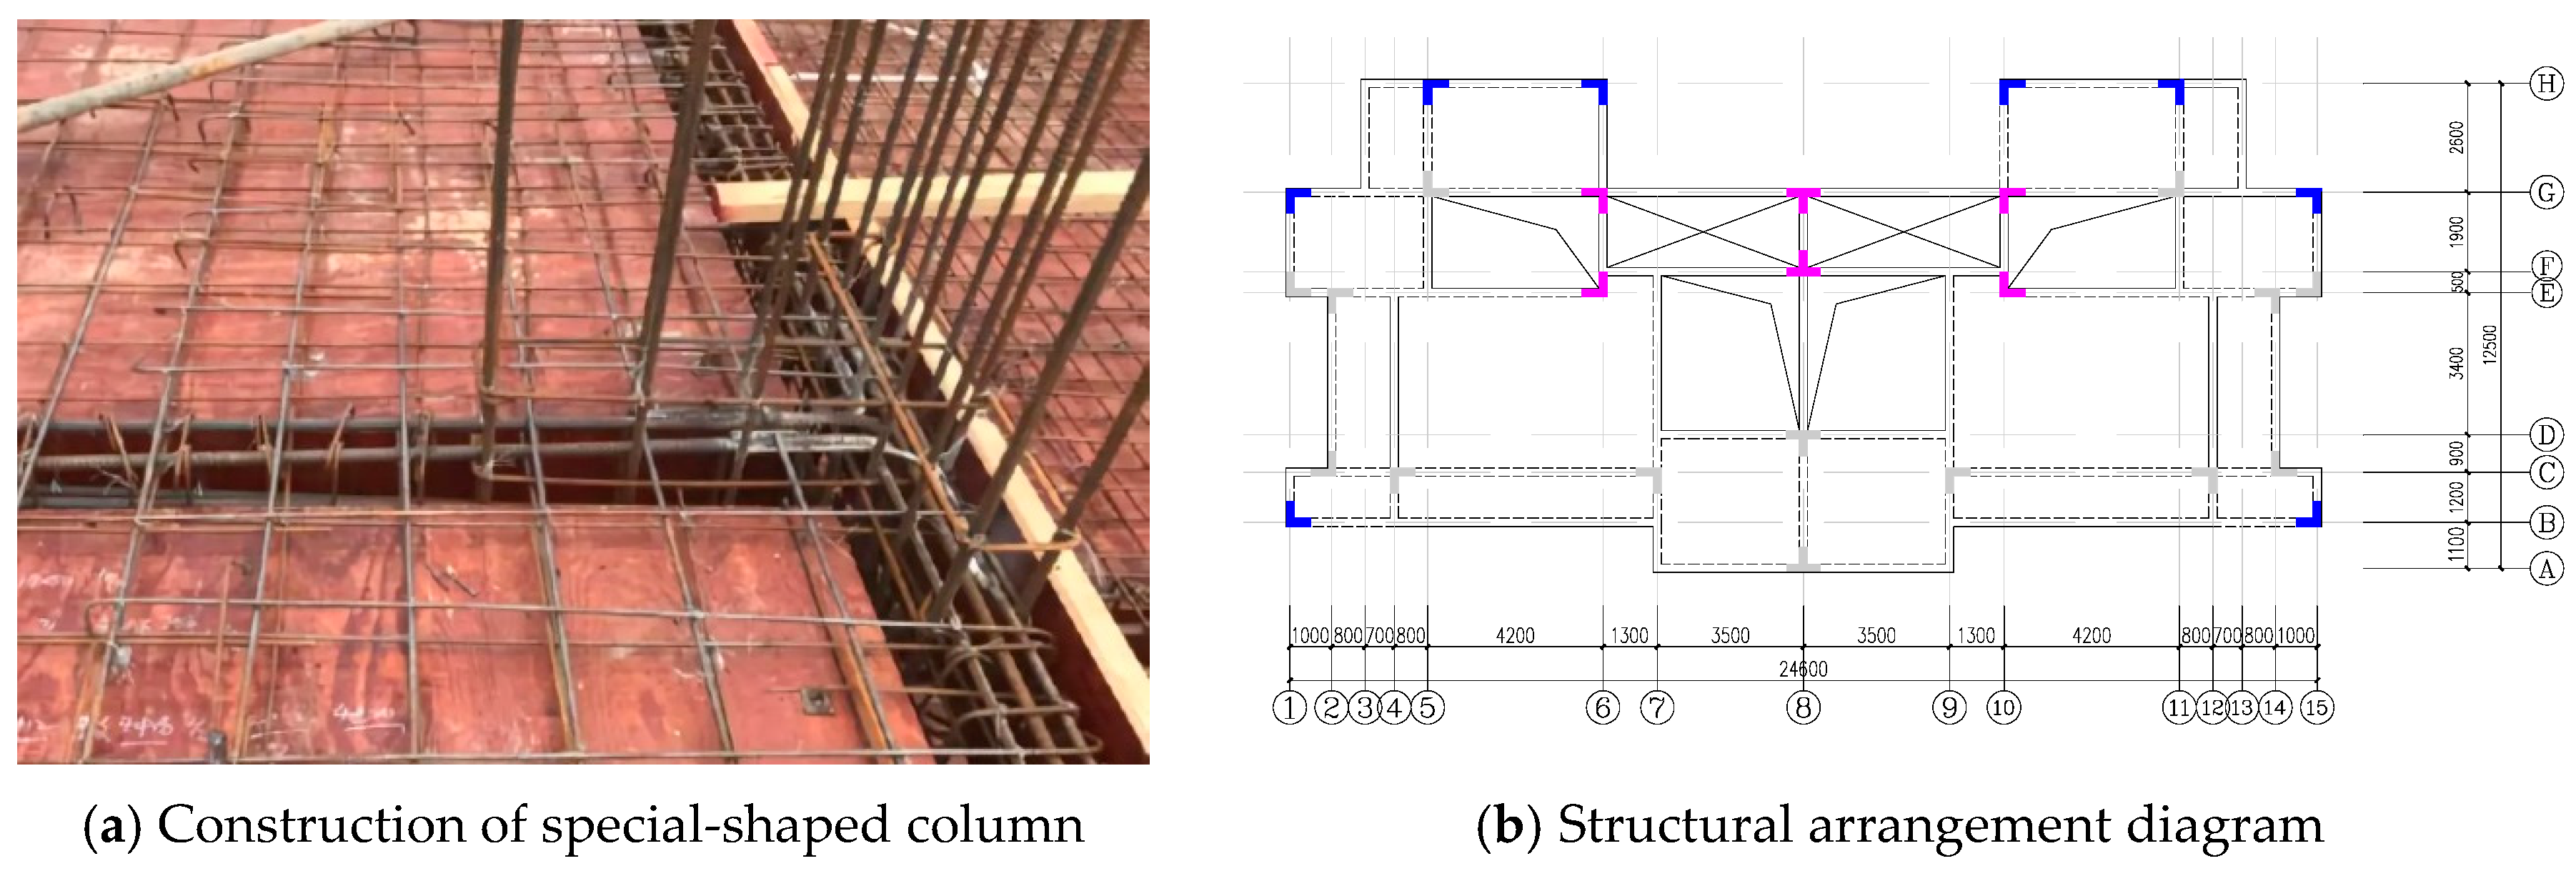
Compared with traditional rectangle columns, the special-shaped (L, T, +) columns have advantages of refraining from the wall, increasing the interior space, and improving the flexibility in the use of architectural space, due to the limb of the special-shaped column as thick as the wall. Therefore, it is favored deeply by buyers and architects [
1,
2].
Figure 1 shows practical engineering projects in which special-shaped columns have been employed.
In the past few decades, many experimental and analytical studies have been carried out to study the mechanical property of special-shaped columns [
3,
4,
5,
6,
7,
8,
9]. In addition, great efforts have been taken to reveal the seismic performance of RC special-shaped columns under axial force and bending load or bending and shear force. Based on the tests of 12 RC special-shaped columns, Cao et al. [
10] found that concealed columns can improve the bearing capacity significantly. Liu et al. [
11] carried out a shaking table test of a 9-story RC special-shaped frame model with the transfer story. The test showed that this structure can be used in the region of earthquake intensity. Cui et al. [
12] studied the effects of the horizontal loading directions (0°, 45°, 90°, and 135°) on the seismic performance of RC Z-shaped columns. Test results show that four types of failure modes can be observed including shear-bending failure, bending failure, shear failure, and shear-compression failure. Li B and Pham T. P [
13] carried out the investigation on 10 RC columns with L-shaped sections, which were subjected to simulated seismic loadings. All specimens exhibit a significant pinching and the longitudinal reinforcement yielded before the maximum shear force reached.
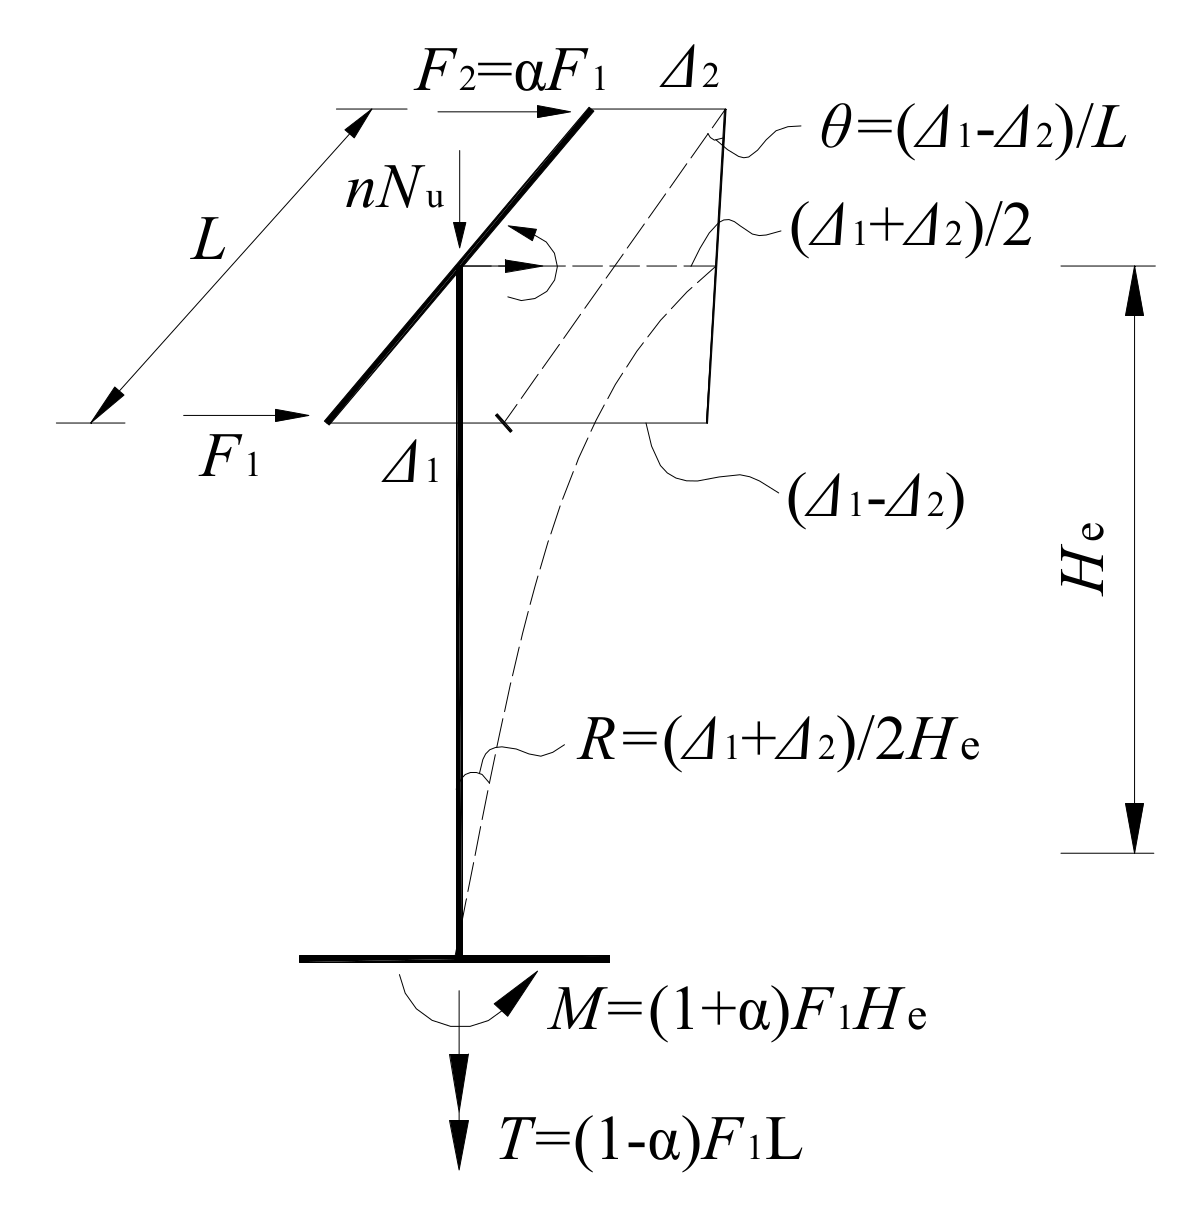
Cracks and damages observed from RC special-shaped columns after earthquake indicate that multi-directional earthquake motions and movement of joints could result in failure due to torsional oscillations. In addition, different from RC rectangular columns, shear center and mass center of RC special-shaped columns do not locate in the same position. Thus, the torsion effect exists due to the effect of the horizontal earthquake force. It is necessary to investigate the seismic performance of RC special-shaped columns subjected to the combined loading including axial compression, shear, moment, and torsion.
In previous research, it was shown that the ratio of the torsion moment to the bending moment at the bottom section (T/M) had a significant effect on seismic performance. Nie et al. [
14,
15] studied the seismic performance of concrete-filled circular/rectangular steel tube columns under combined torsion. They found that the bending capacity decreased with increasing of T/M ratio, while the torsional capacity increased. Other researchers, such as Otsuka et al. [
16], Hsu et al. [
17,
18], Tirasit and Kawashima [
19] also found the same interaction effect between torsion and flexure. Li Q and Belarbi A [
20,
21] conducted research on the 7 RC bridge columns under compression, bending, shear, and torsion. They pointed out that the location and length of the damage zone moved upward from the base of the column as the
T/M ratio increased, with the failure mode and deformation characteristics changed. Investigation showed that the form of structures can also affect its seismic performance. Belarbi et al. [
22] and Prakash et al. [
23] conduct experiments with a series of specimens under pure torsion, pure flexure, and combined torsions. These results indicated that there was a significant change in the failure mode and deformation characteristics not only due to
T/M ratio, but also to the construction and reinforcement. Wang et al. [
24] found that the decreasing of stirrup spacing can improve the torsional strength of columns, but it had little influence on the bending performances, which is in accordance with the finding by Deng et al. [
25]. Anumolu et al. [
26] developed a three-dimensional model of an HC-SCS column under combined torsion. Moreover, they also developed a simplified equation to predict the torsion strength. Mullapudi T R S [
27] put forward a three-dimensional model of RC members subjected to combined torsion. They used the model to assess the seismic performance, which also matched the experimental results well. Prakash [
28] proposed damage index models permitting decoupling these combined loadings including bending and torsion. The models could evaluate the interaction between flexural and torsional damage models according to the progression of damage. Through performance-based evaluation, Belarbi [
29] proposed a damage model for the square and circular column under bending, shear, axial compression, and torsion. Li [
21] conducted experimental and analytical studies on four square RC column under torsion combined with axial compression, flexure, and shear. Based on the observation of the experiment, a unified equivalent damage model considering the T/M ratio was proposed to couple the flexural and torsional actions.
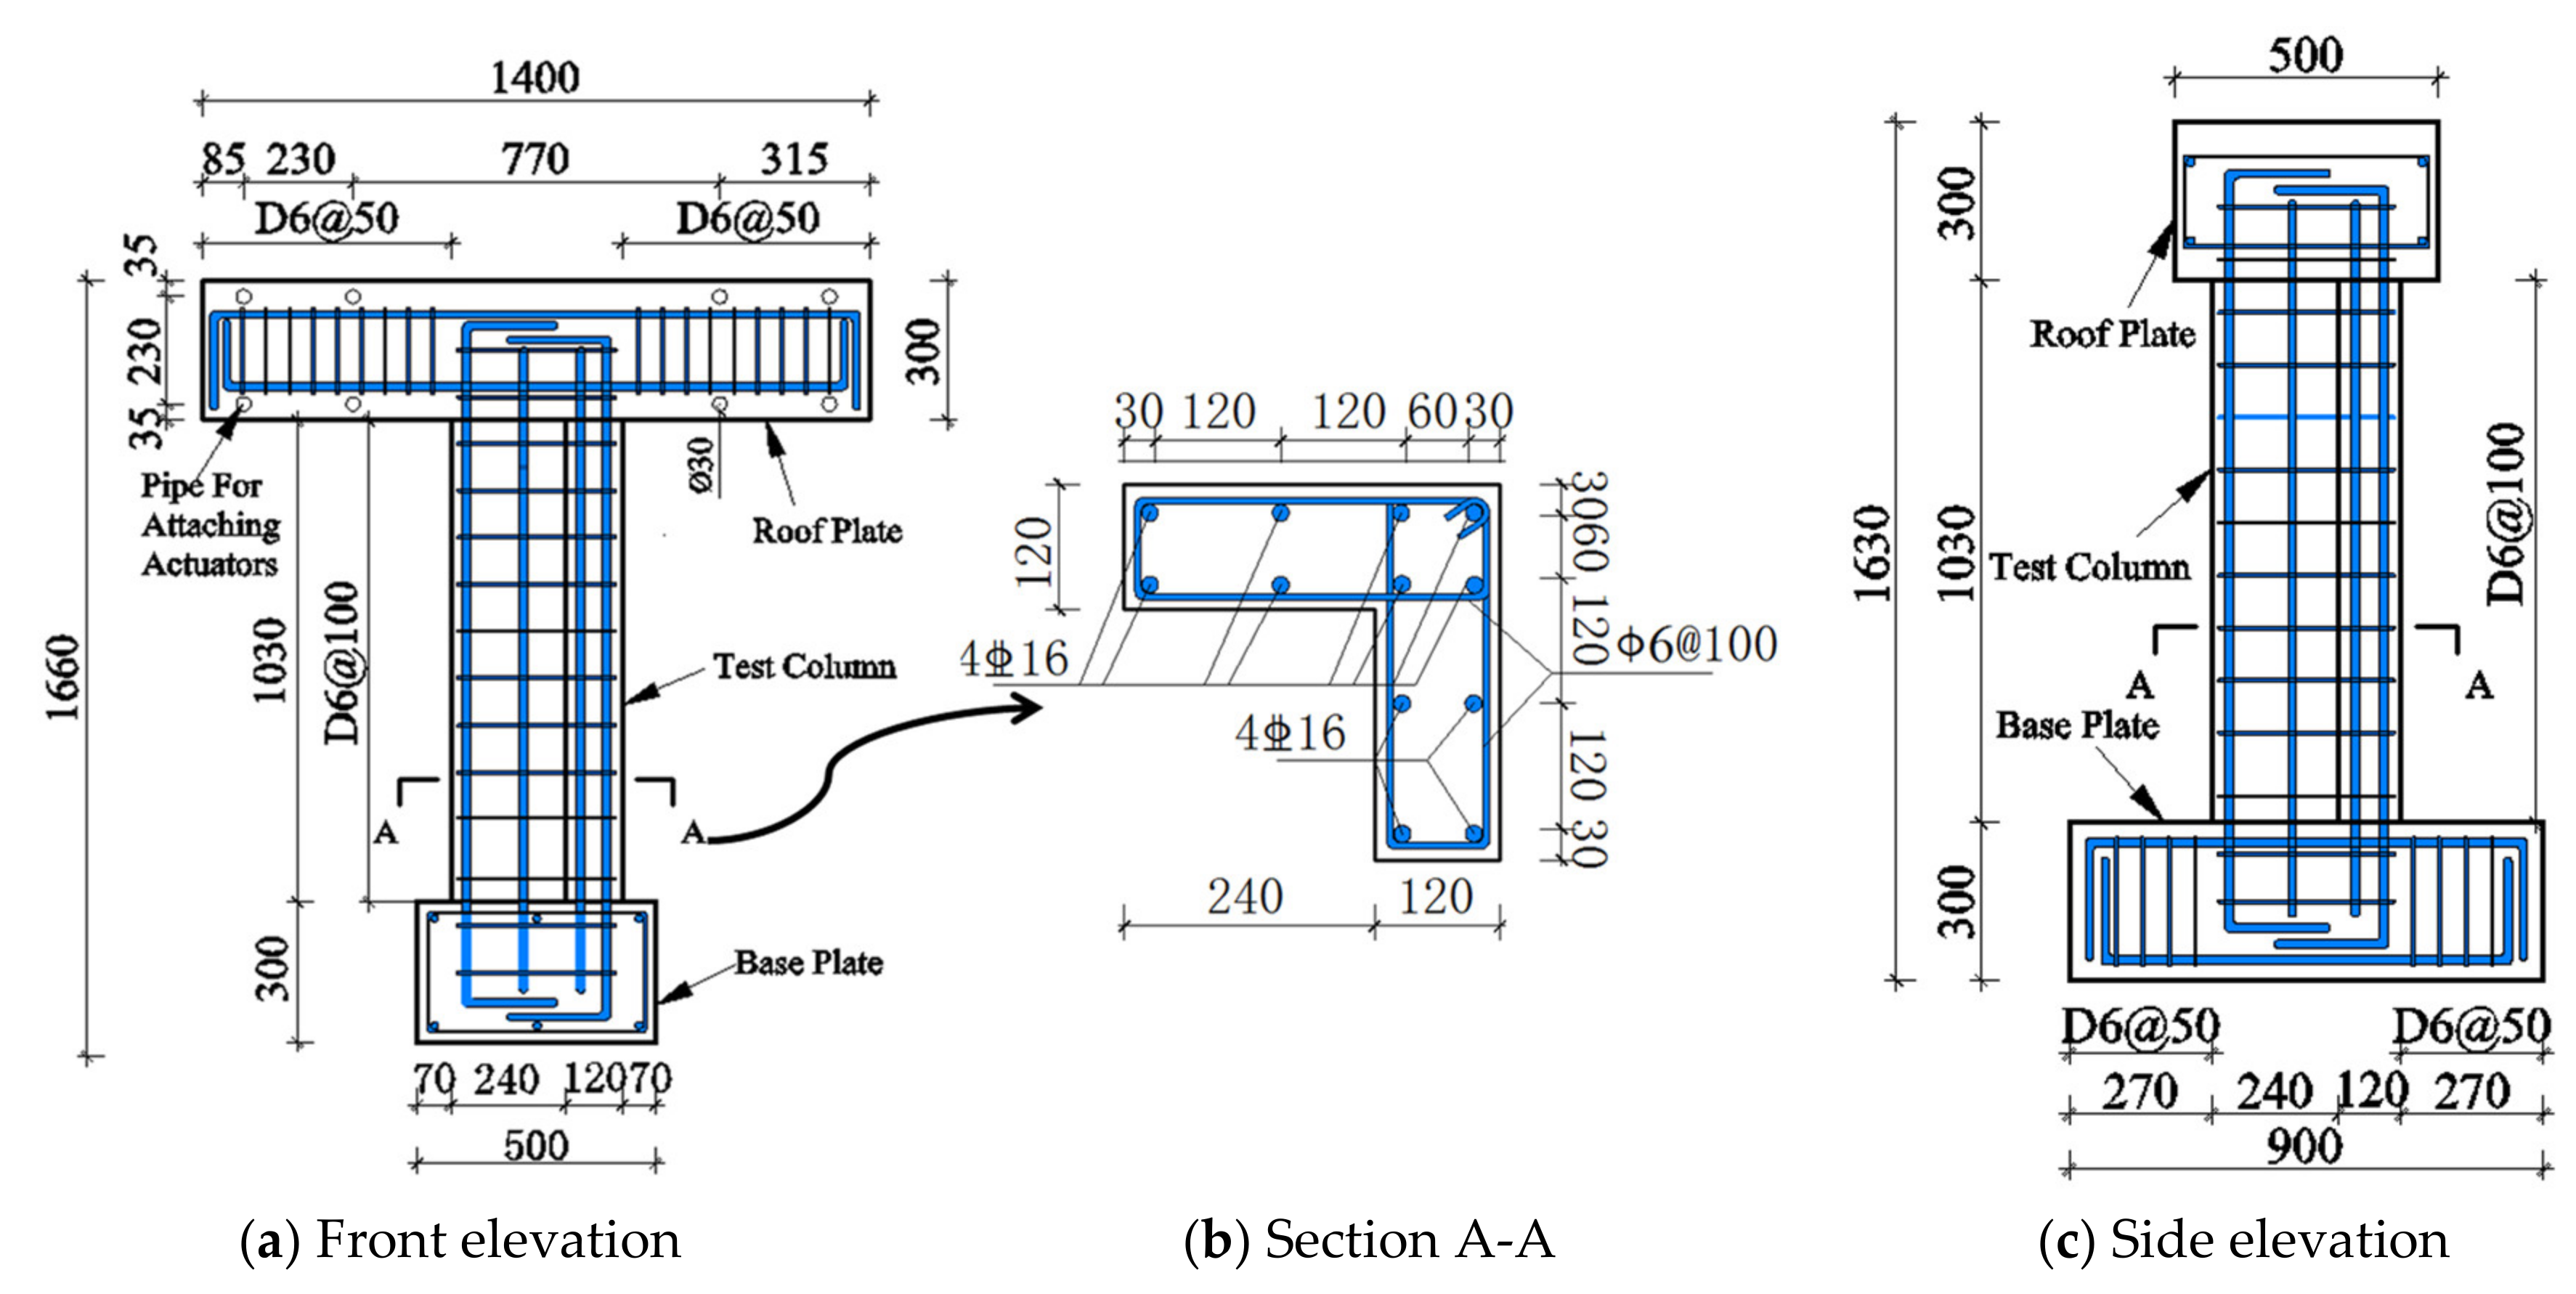
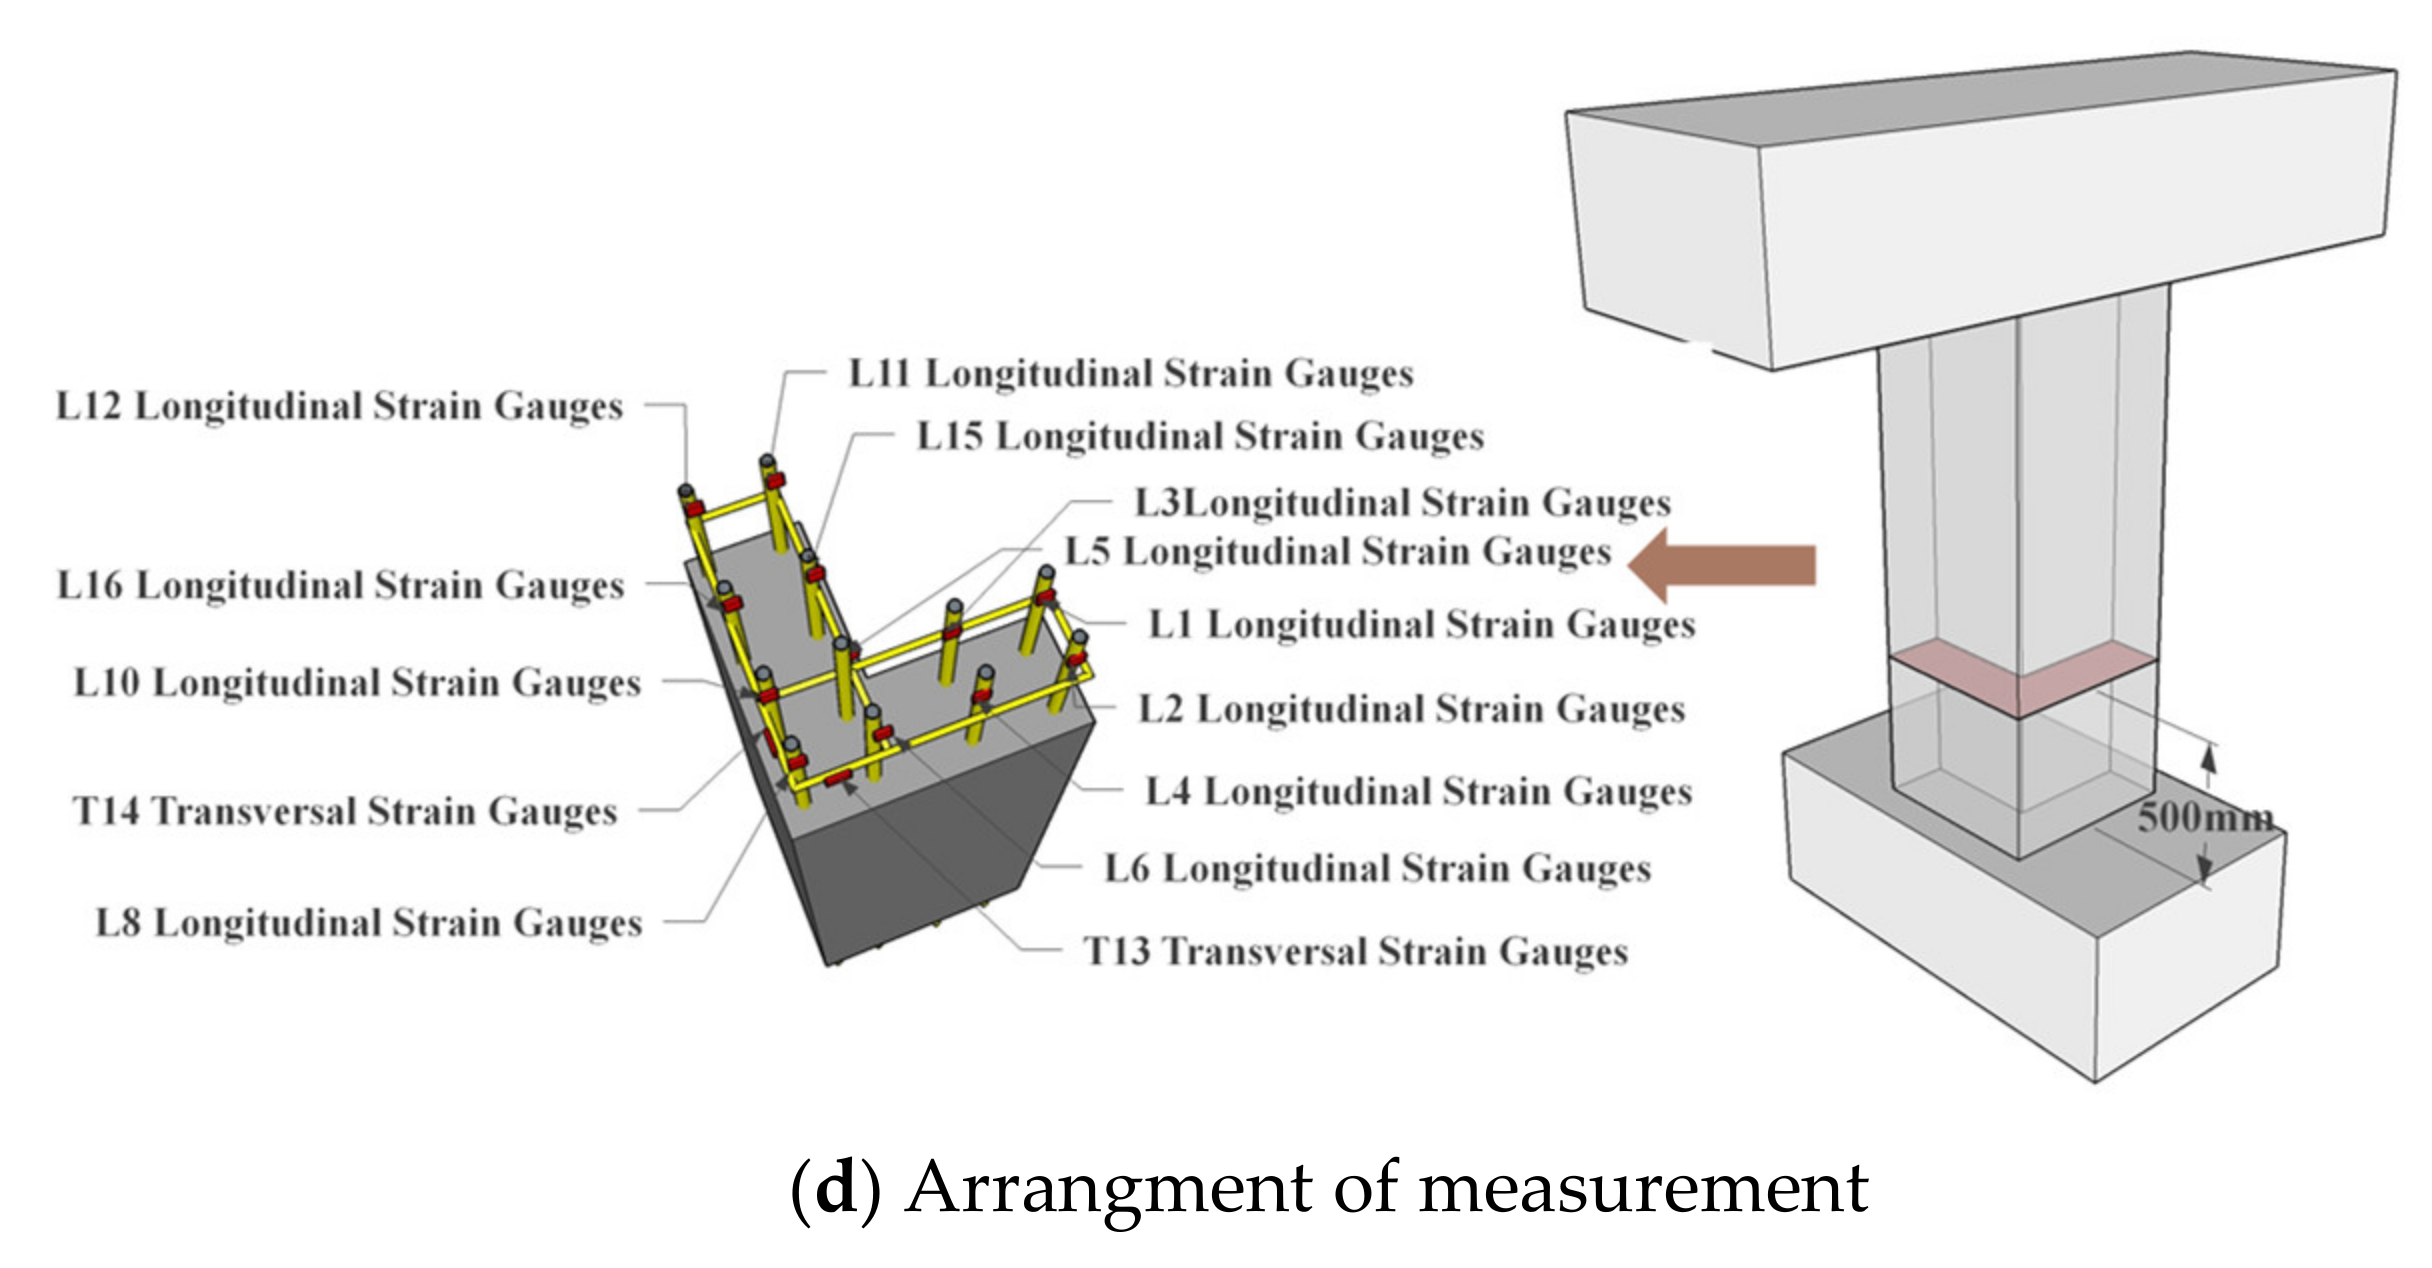
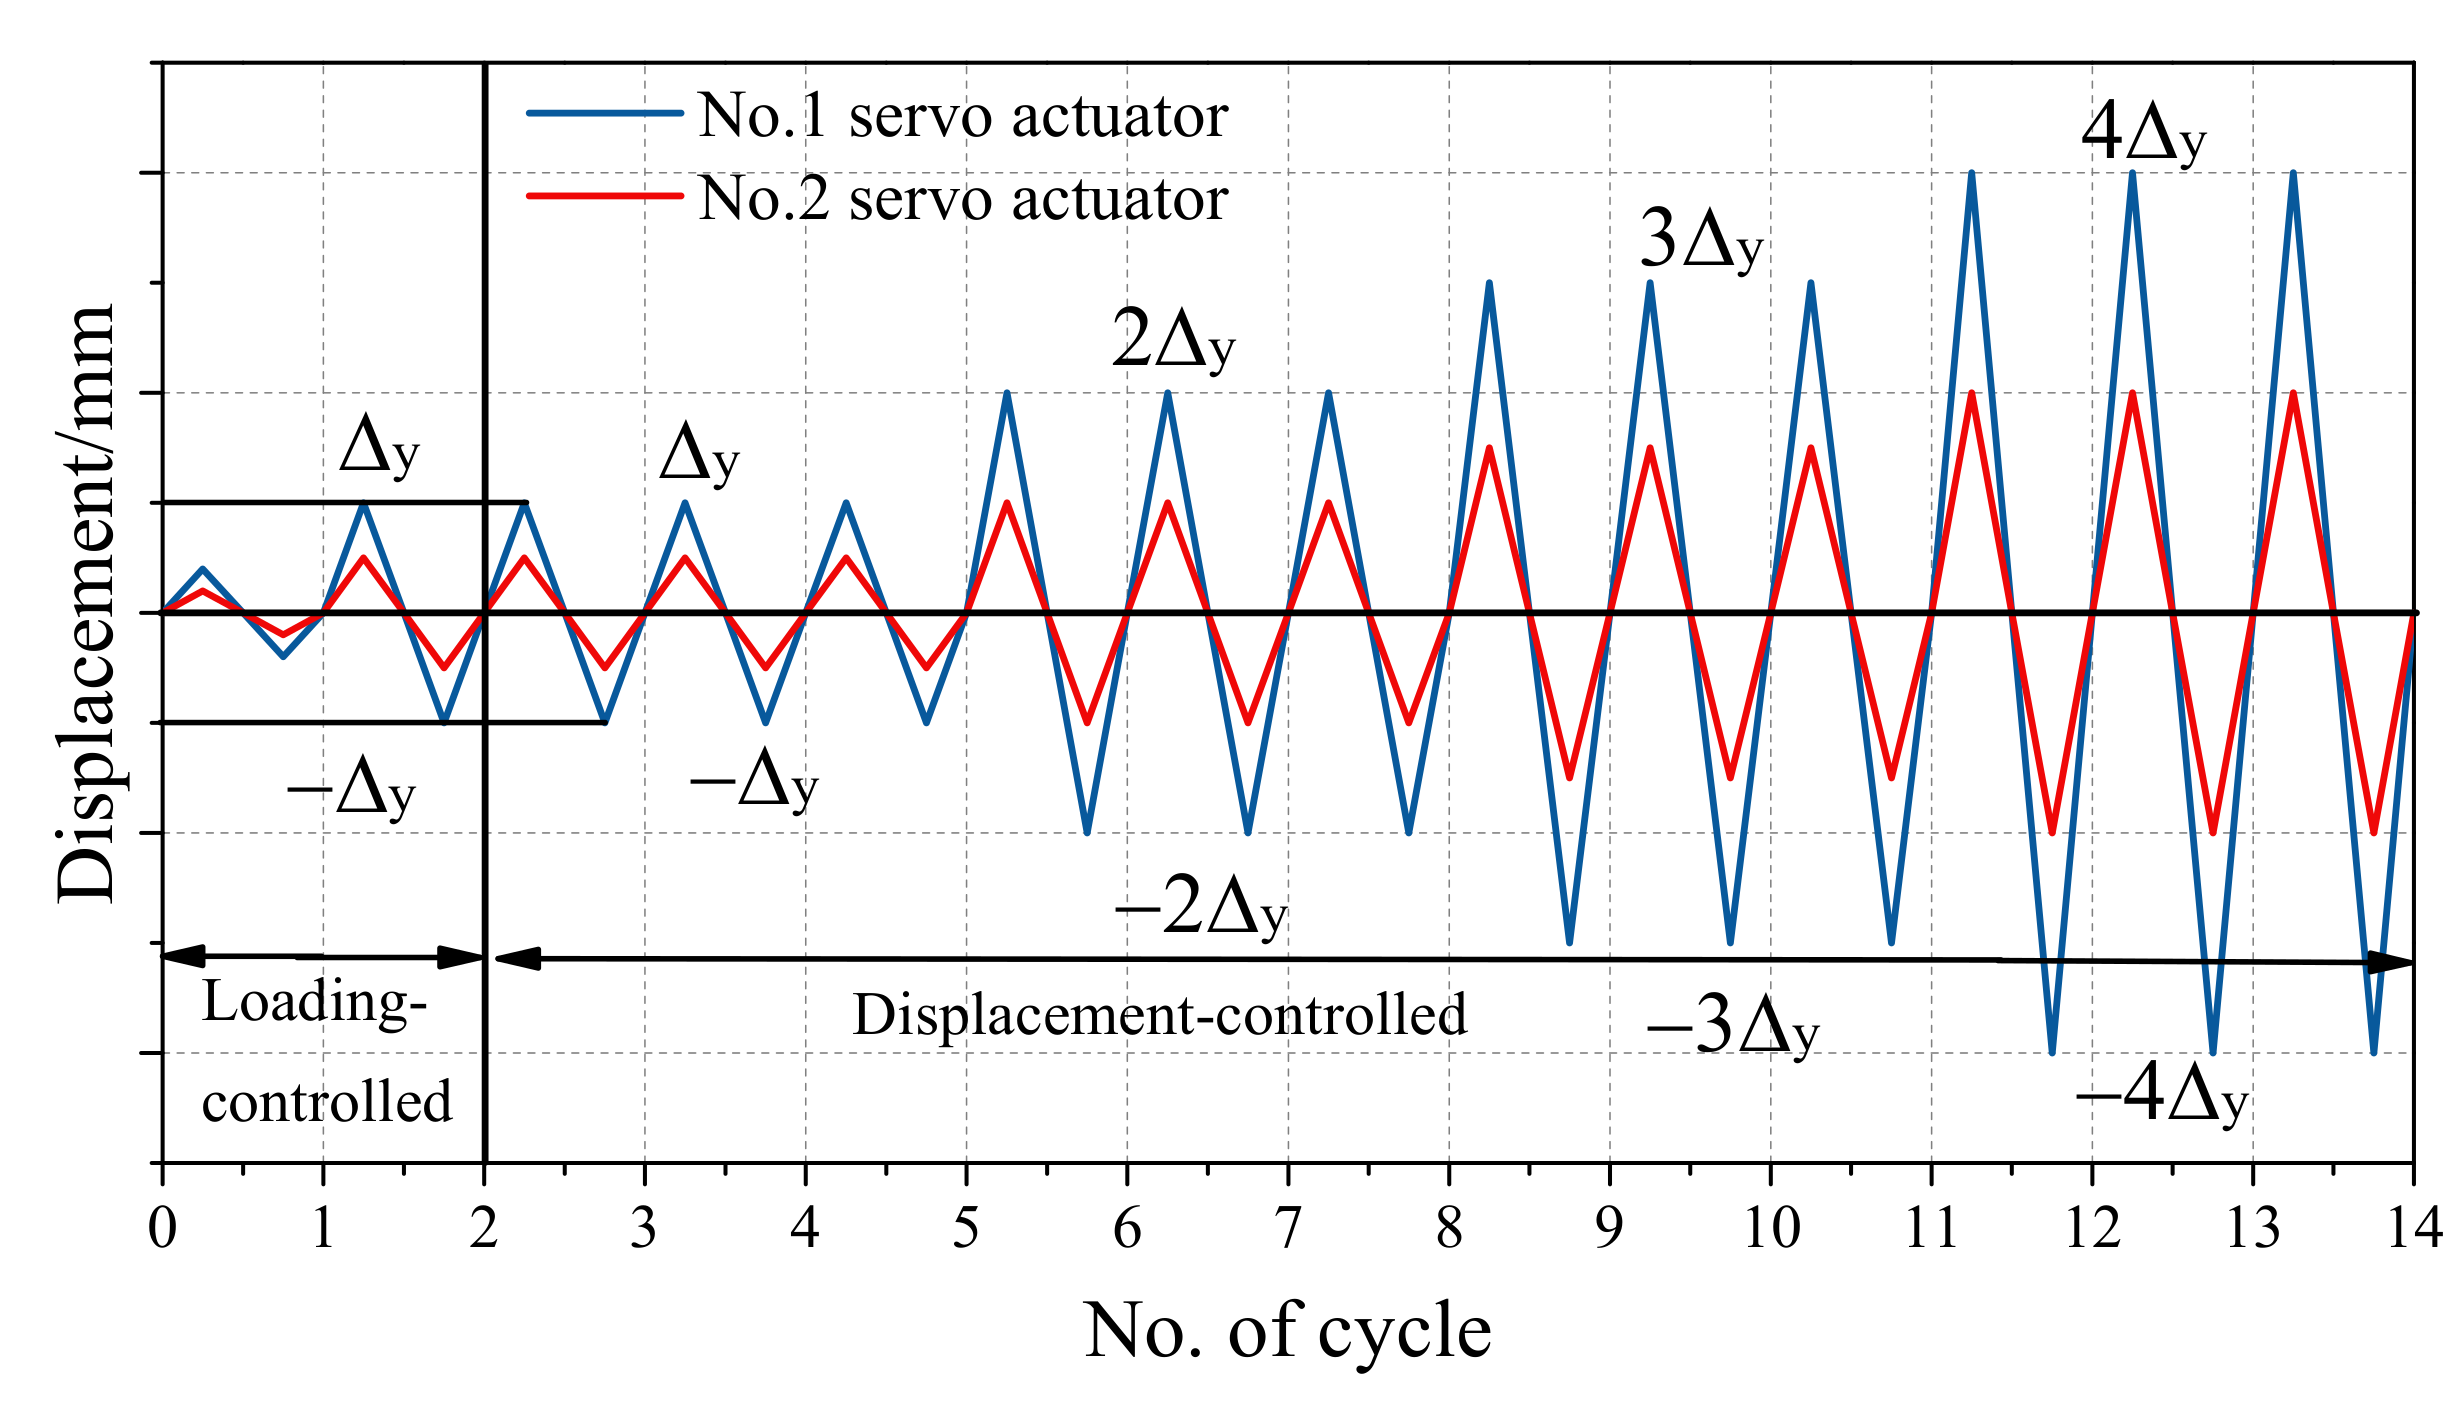
The previous literature showed that there were few studies on the seismic behavior of RC L-shaped columns (RCL) under combined loadings including compression, flexure, shear, and torsion. Besides, the knowledge of the interaction between flexural and torsional in the behavior of the RC L-shaped columns is also limited. To expand the application of RC special-shaped columns, six RC L-shaped columns with different T/M ratio and axial compression ratios (n = N/(fckA)) were designed to conduct the low cycle reversed loading test. The effects of combined torsion on a hysteretic torsional and a flexural response, failure modes, carrying capacity, ductility characteristics, strength and stiffness degradation, energy dissipation, and interlayer displacement angle will be discussed. Two decoupled flexural and torsional damage index models were proposed to predict the progression of damage for the L-shaped column under combined loadings.
4. Test Results Analysis
4.1. Hysteretic Behavior
The characteristic points (namely, the yielding load
Py and yielding displacement Δ
y, peak load
Pu and peak displacement Δ
u, ultimate load
Pf and ultimate displacement Δ
f ) of the specimens, which were defined on the skeleton curve, were listed in
Table 2. The yield load
Py corresponding to the yield displacement Δ
y was defined based on the criteria for equivalent elastic-plastic energy absorption. The peak displacement Δ
u referring to the peak load
Pu was the maximum lateral load. The failure load
Pf was defined as the post-peak displacement corresponding to 85% of the peak strength.
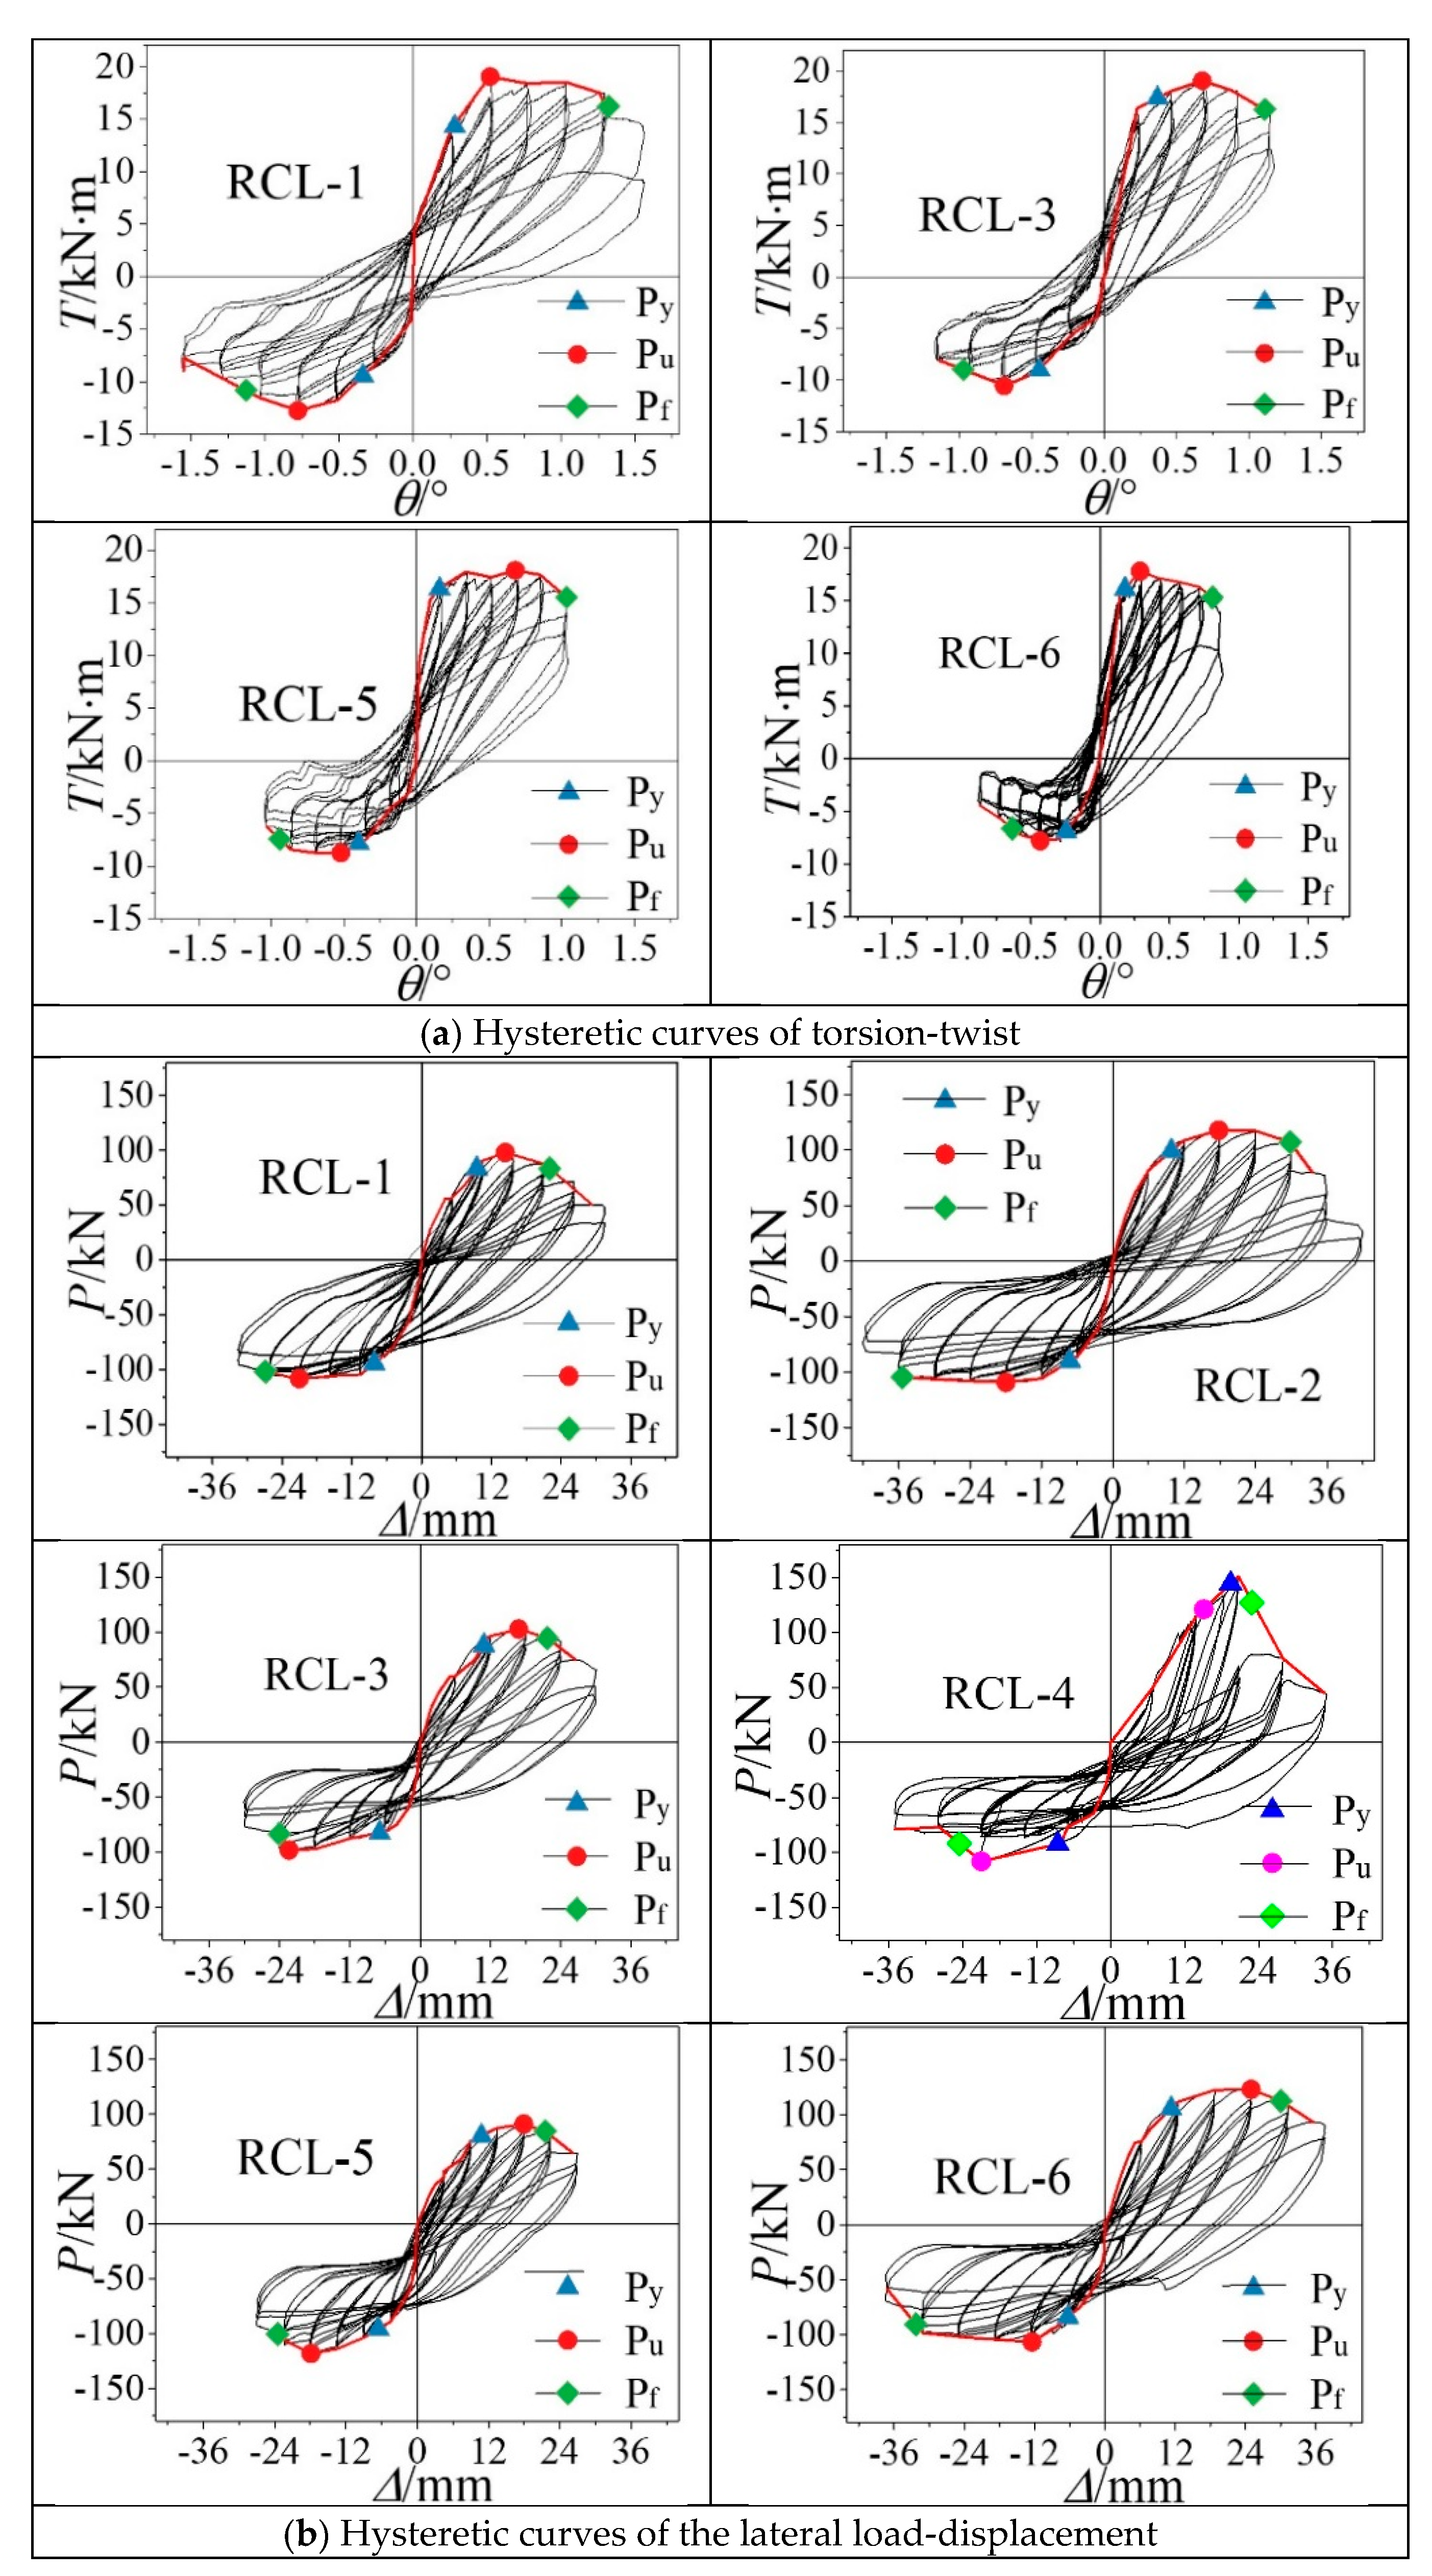
The hysteretic responses of torsion-twist and load-displacement for the specimens are shown in
Figure 7a,b, respectively. The following observations could be summarized:
(1) Both the two hysteretic curves of the torsion-twist and the load-displacement exhibited an “S” shape. Due to the asymmetry of section, the asymmetry of the hysteresis curves were observed. Before cracking, the specimen exhibited elastic behavior and the hysteresis curve was narrow with little residual deformation after unloading. After cracking, a drop of secant stiffness was observed and the envelope area increased. After the peak load, the slope of secant stiffness dropped rapidly.
(2) Comparing with RCL-1 (T/M = 0.36), RCL-5 (T/M = 0.28), and RCL-6 (T/M = 0.17), it was noted that T/M ratio had a significant effect on the hysteretic behavior. For the relationship of torsion-twist, the slope of unloading stiffness and the degree of pinching increased with the increase of T/M ratio. This was attributed to the increase of T/M ratio that change the failure mode from the bending failure to torsion-shear failure. Therefore, the stiffness dropped rapidly and the pinching in the loops was relatively high. The plastic deformation of concrete also increases the ultimate rotation angle and hysteretic curve area. For hysteretic curves of lateral load-displacement, with the increase of T/M ratio, ultimate bearing capacity and ductility decrease. In addition, the hysteretic loops of the RCL-2 (T/M = 0) was plumper than these specimens under combined loading including torsion. It is indicated that the torsion had an adverse effect on seismic performance.
(3) Axial compression ratio was another important effect on hysteretic behavior. In particular, with the decrease of the axial compression ratio, the twist increased and the flexural capacity reduced while the bending energy consumption and ductility increase slightly.
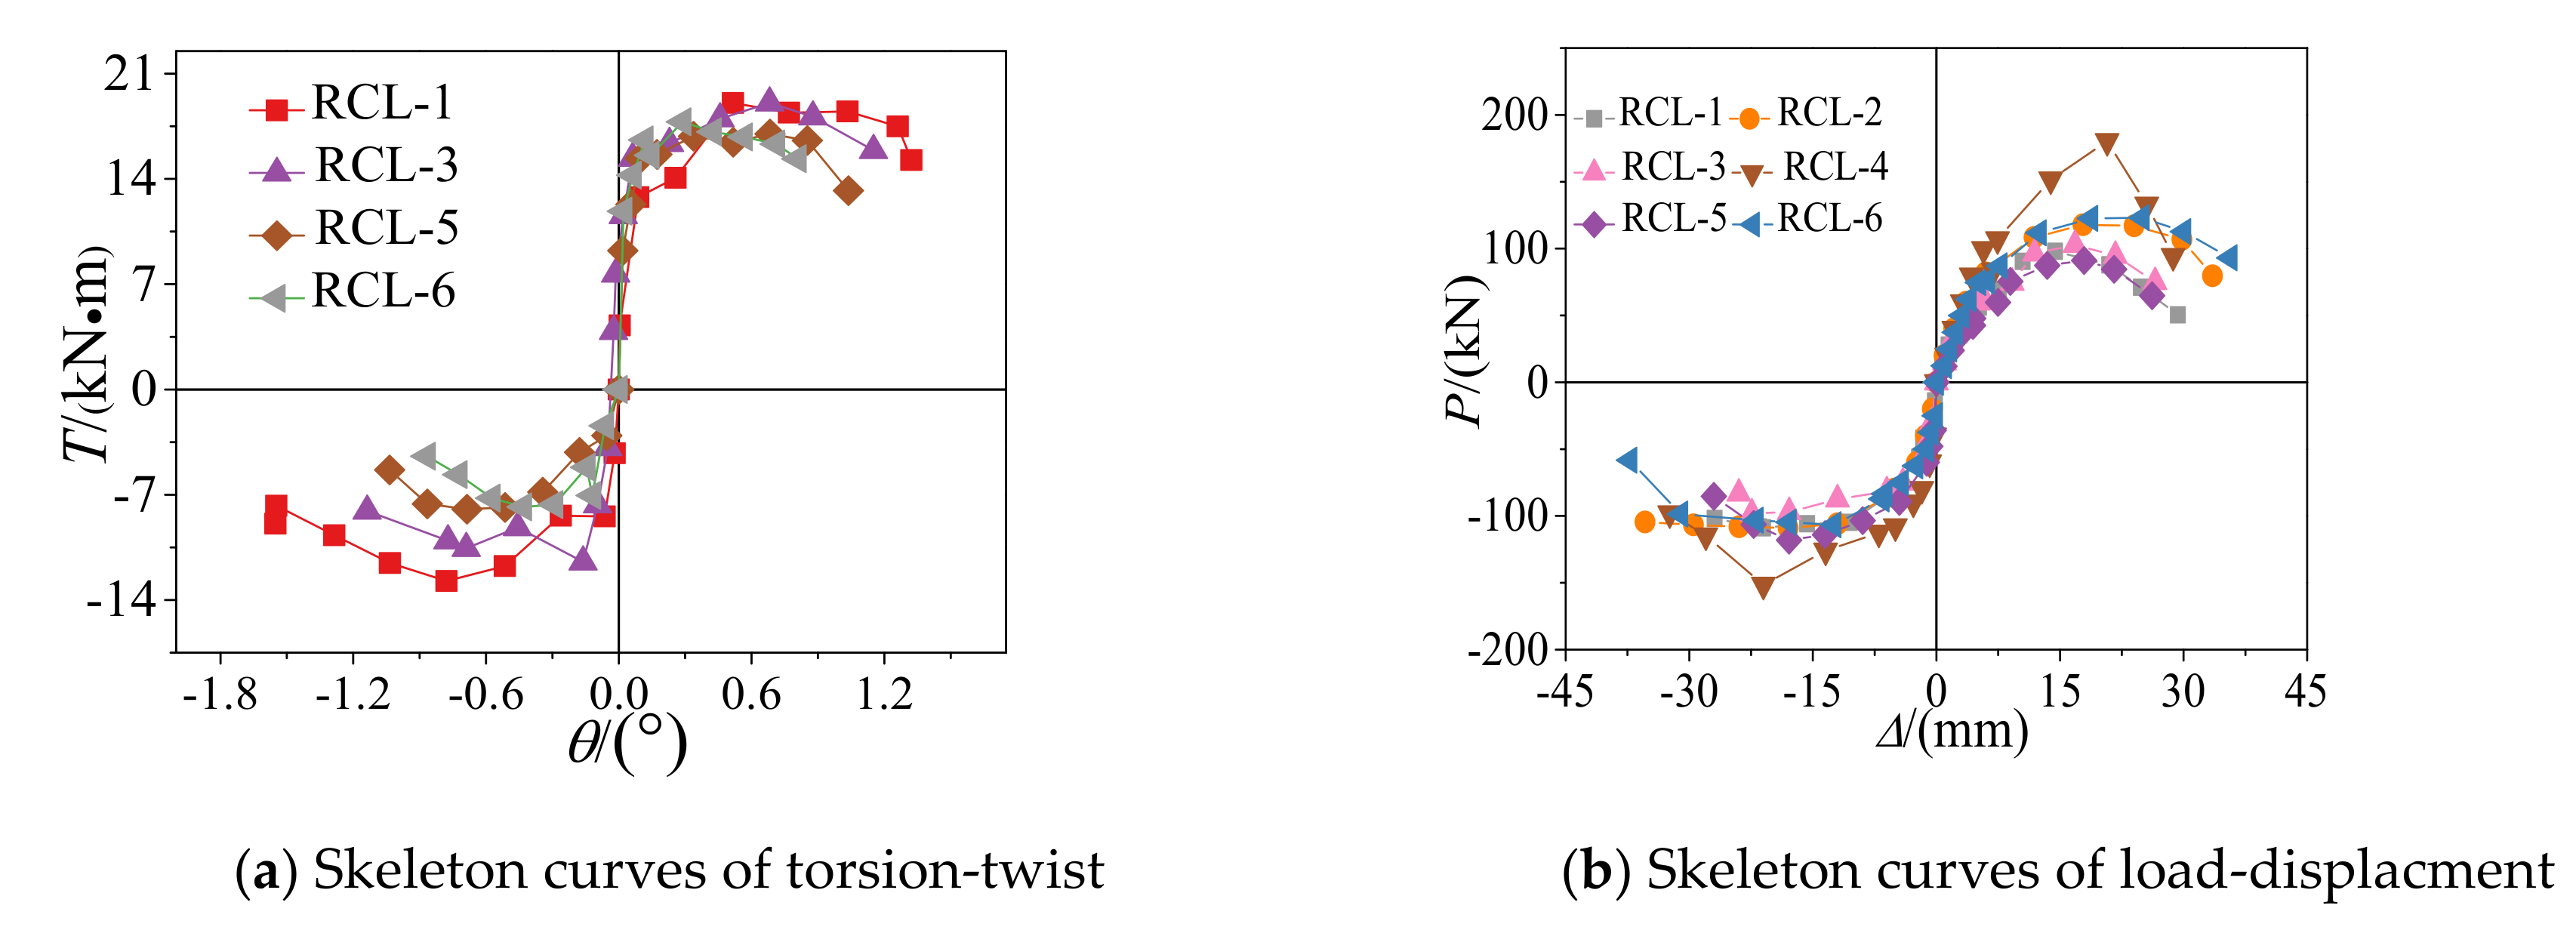
4.2. Skeleton Curves and Characteristic Points
The skeleton curves of the torsion-twist and load-displacement for these specimens are depicted in
Figure 8. The characteristic points (namely, the yielding lateral load
Py and yielding displacement Δ
y, the yielding torsion
Ty and yielding twist angle
θy, peak later load
Pm and peak displacement Δ
m, peak torsion
Tm and peak twist angle
θy, ultimate lateral load
Pu and ultimate displacement Δ
u, ultimate torsion
Tu and ultimate twist angle
θu) of the specimens, which were defined on the skeleton curve, are listed in
Table 2. In the following part, all the comparsion of the characteristic value from
Table 2 referred to the average value.
(1) The skeleton curves were similar in shape. All the skeleton curves consisted of linear elastic stage, elastic-plastic stage, and descending stage.
(2) It is noted that the specimen with bending failure exhibited a high bearing capacity and ductility. Besides, with the increase of T/M ratio, the skeleton curve dropped gently in the descending stage.
(3) For RCL-1 (T/M = 0.36), RCL-5 (T/M = 0.28) and RCL-6 (T/M = 0.17), with a decline in the T/M ratio, the yield torsion of RCL-5 and RCL-6 decreased by 4.5% and 9.1%, respectively, compared to the RCL-1, while the peak torsion decreased by 27.4% and 24.1%. It is indicated that with the increasing T/M ratio the torsion capacity increased significantly.
(4) Comparing to the specimen RCL-3(n = 0.19), a reduction of 22.3% in ultimate torsion was observed for the specimen RCL-5 (n = 0.23). It was indicated that torsion capacity increased with the decline of the axial compression ratio.
4.3. Deformation Capacity
Ductility factor (
μ) is defined as the ratio of ultimate displacement to yield displacement (i.e.,
μΔ = Δ
u/Δ
y,
μθ =
θu/
θy). Inter-story drift ratio
γ is the ratio of lateral displacement to specimen length (i.e.
γcr = Δ
cr/
H,
γu = Δ
u/
H). The values of
μ and
γ were listed in
Table 2.
(1) With the increase of the T/M ratio the twist ductility coefficient increased, while the trend is the opposite with the increase of the axial compression ratio. Specifically, With the increasing T/M ratio (0.17, 0.28, 0.36), the average twist ductility for the specimen RCL-5 and RCL-6 increased by 10.5% and 17.8%, respectively, compared to the specimen RCL-1 with T/M ratio of 0.17. While, the reduction of 32.1% in the twist ductility coefficient for the RCL-3 (n = 0.19) was observed compared to the RCL-5 (n = 0.23).
(2) For the displacement ductility, it decreases with the increase of T/M ratio. It was attributed to the high T/M ratio result in low plastic zone height. The specimens with T/M ratio of 0.36 and 0.17, respectively, attained 73.4% and 71.1% of the displacement ductility factor for the specimen with T/M ratio of 0.
(3) The limit of elastic story drift ratio and elastoplastic story drift ratio for the CFST frame structure in design code GB50936-2014 (2014) were 0.18% and 2.00%. The average value of the elastic story drift ratio for all specimens is 0.36% and the average value of the ultimate story drift ratio is 2.81%. It is indicated that the RC L-shaped column met the requirement of the standard in regions of high seismic intensity.
4.4. Energy Dissipation
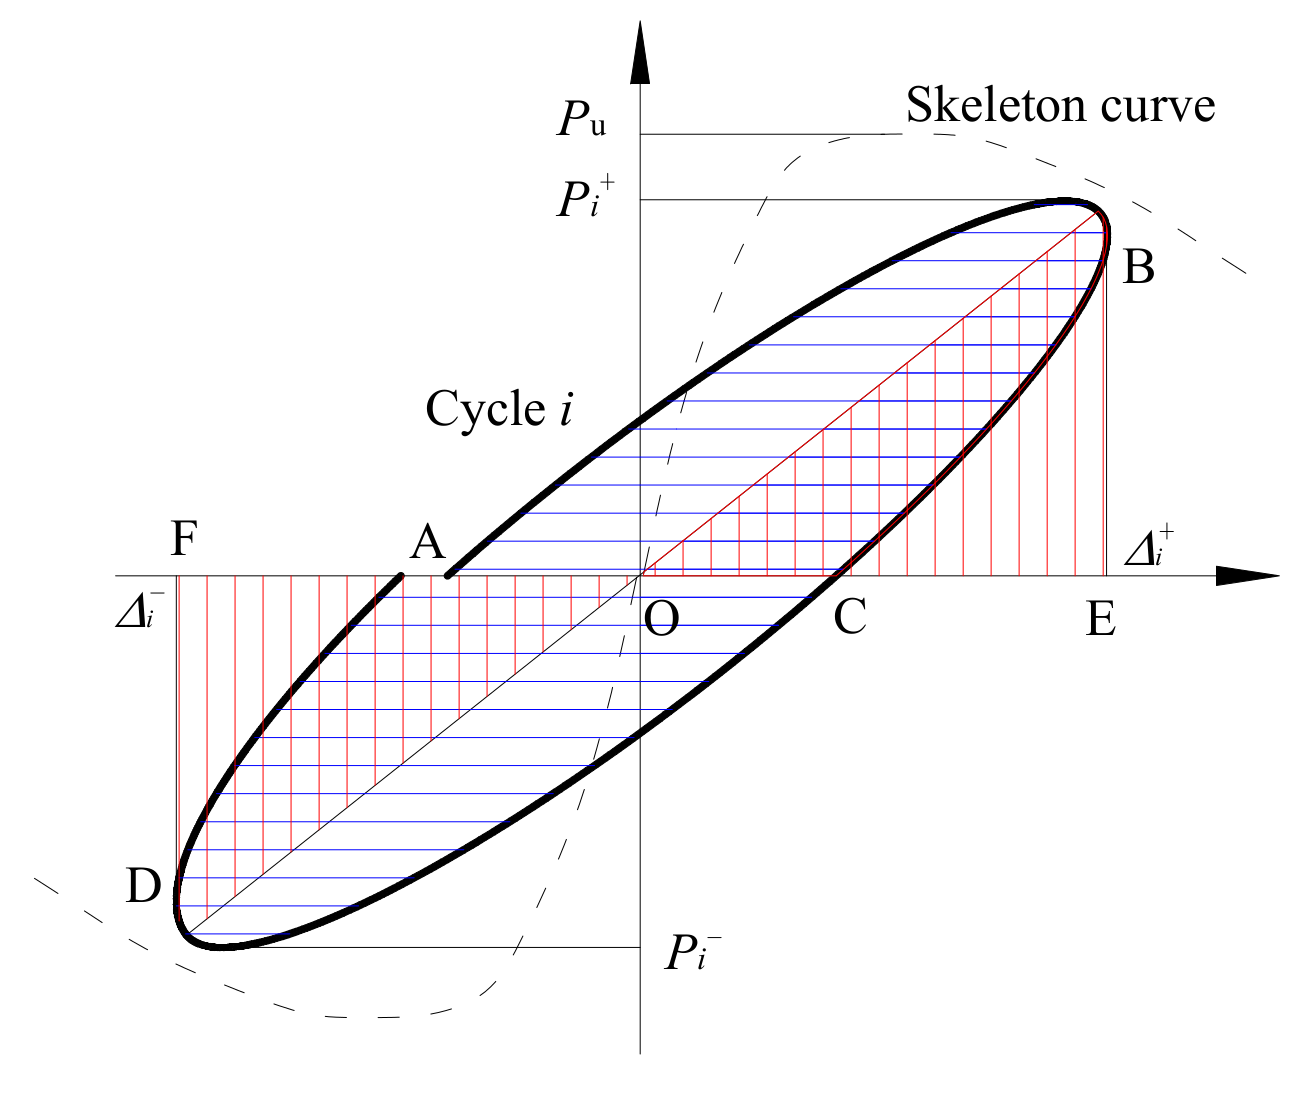
In the seismic analysis, the equivalent damping coefficient (
he) and energy dissipation was used to evaluate the energy dissipation capacity. The equivalent viscous damping coefficient could be calculated as Equation (4).
where
S(ABC+CDA) = the area enclosed by a complete load cycle;
S(ΔOBE+ΔODF) = idealized energy dissipation assuming elastoplastic behavior, as shown in
Figure 9. The equivalent viscous damping coefficients for all the specimens were listed in
Table 3 and
Figure 10. Energy dissipation were calculated based on hysteresis curves of the specimens and the result is illustrated in
Figure 11.
(1) From
Figure 10, it is observed that the axial compression increased the bending energy dissipation significantly. At the final loading stage, the bending energy dissipation capacity of specimen RCL-4 (
n = 0.28) is about 11% higher than that of specimen RCL-2 (
n = 0.23), while the bending energy dissipation capacity of specimen RCL-5 (
n = 0.23) is around 14.5% higher than that of specimen RCL-3 (
n = 0.19). For the torsion energy dissipation capacity, with the axial compression ratio increased the torsion energy dissipation capacity declined. In the failure stage, the specimen RCL-3 (
n = 0.19) resulted in a 6.1% higher energy dissipation as compared to the specimen RCL-5 (
n = 0.23).
(2) With the increase of displacement, the torsion energy-dissipated capacity keeps increasing although there is a slight fluctuation. This is attributed to the initial energy-dissipation capacity offered by outer concrete, which deactivated after the cracks appeared. The energy-dissipation capacity was offered by reinforcement skeleton and core concrete, resulting in the energy-dissipation capacity continues to grow after a slight fluctuation. The bending energy consumption increased slowly at the early stage and increased rapidly at the final stage, which is due to the increase of plastic displacement and the decreases of stiffness.
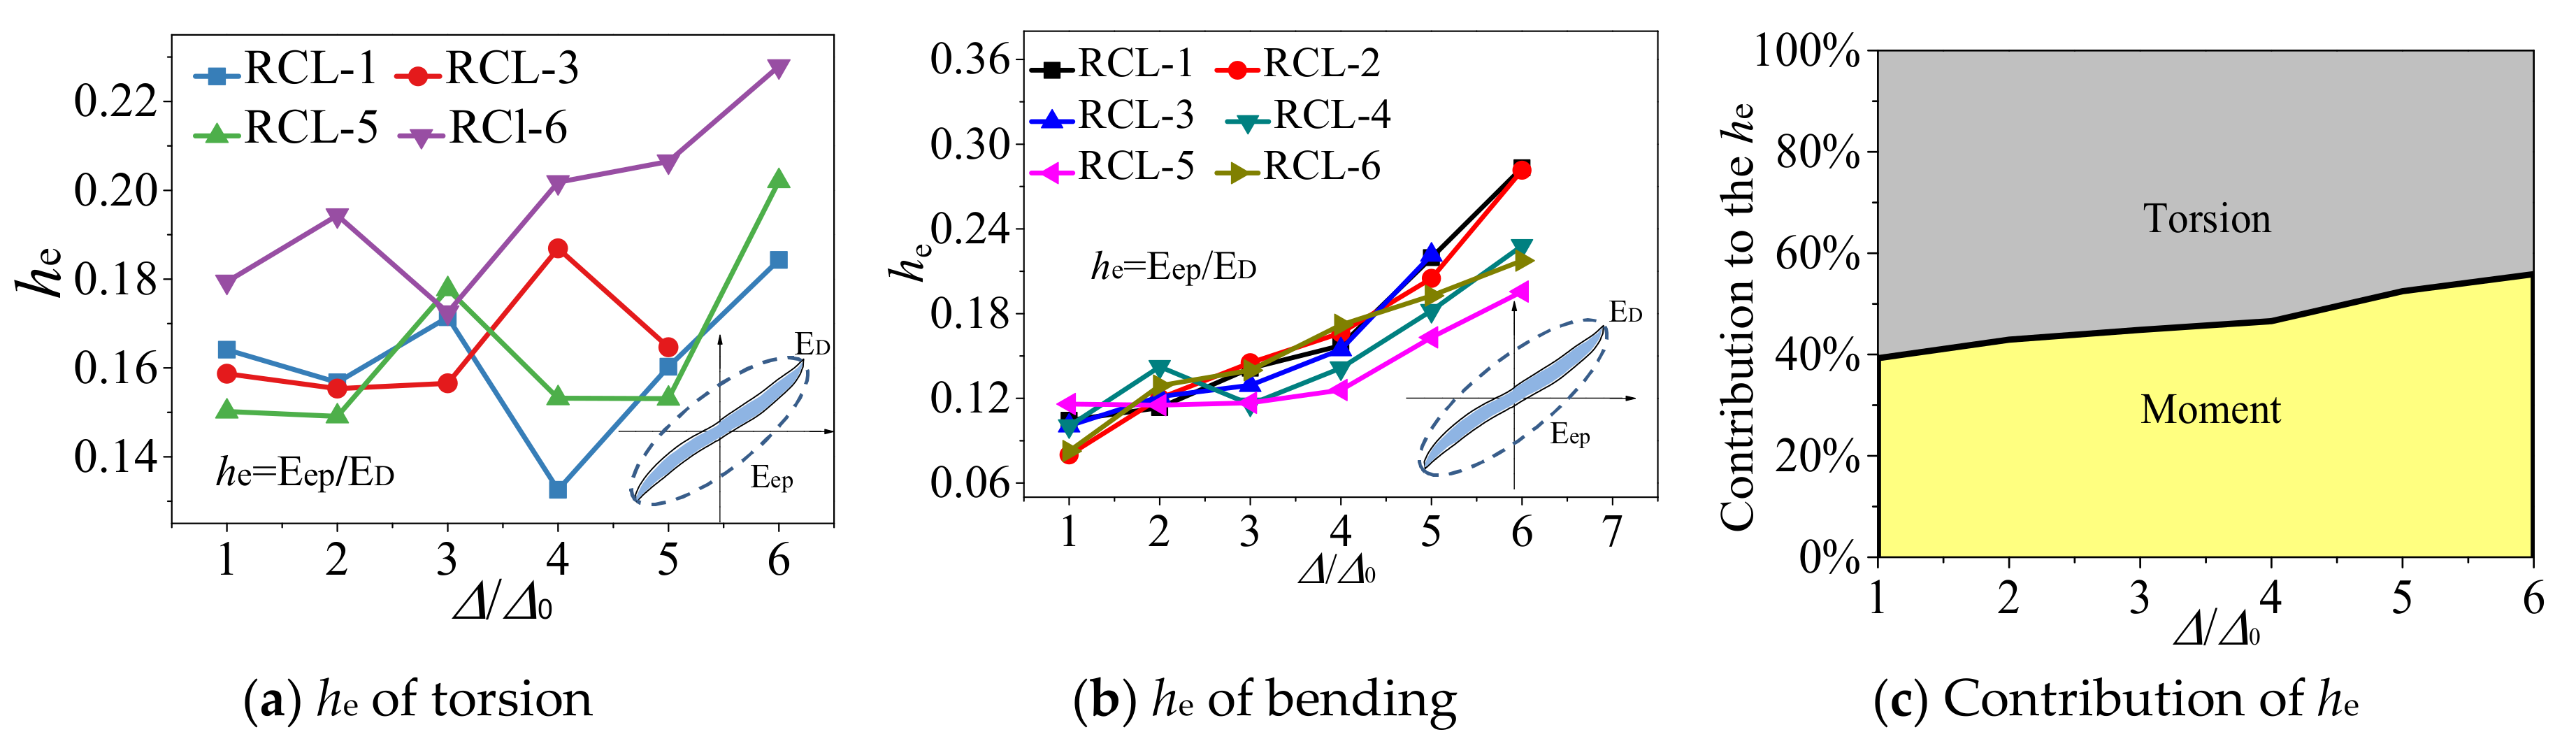
(3) The proportion of torsion energy dissipation was larger than bending energy dissipation until 5Δy. When the RC L-shaped column failed, the bending equivalent damping coefficient was about 0.08~0.28 and the torsion equivalent damping coefficient was about 0.13~0.23.
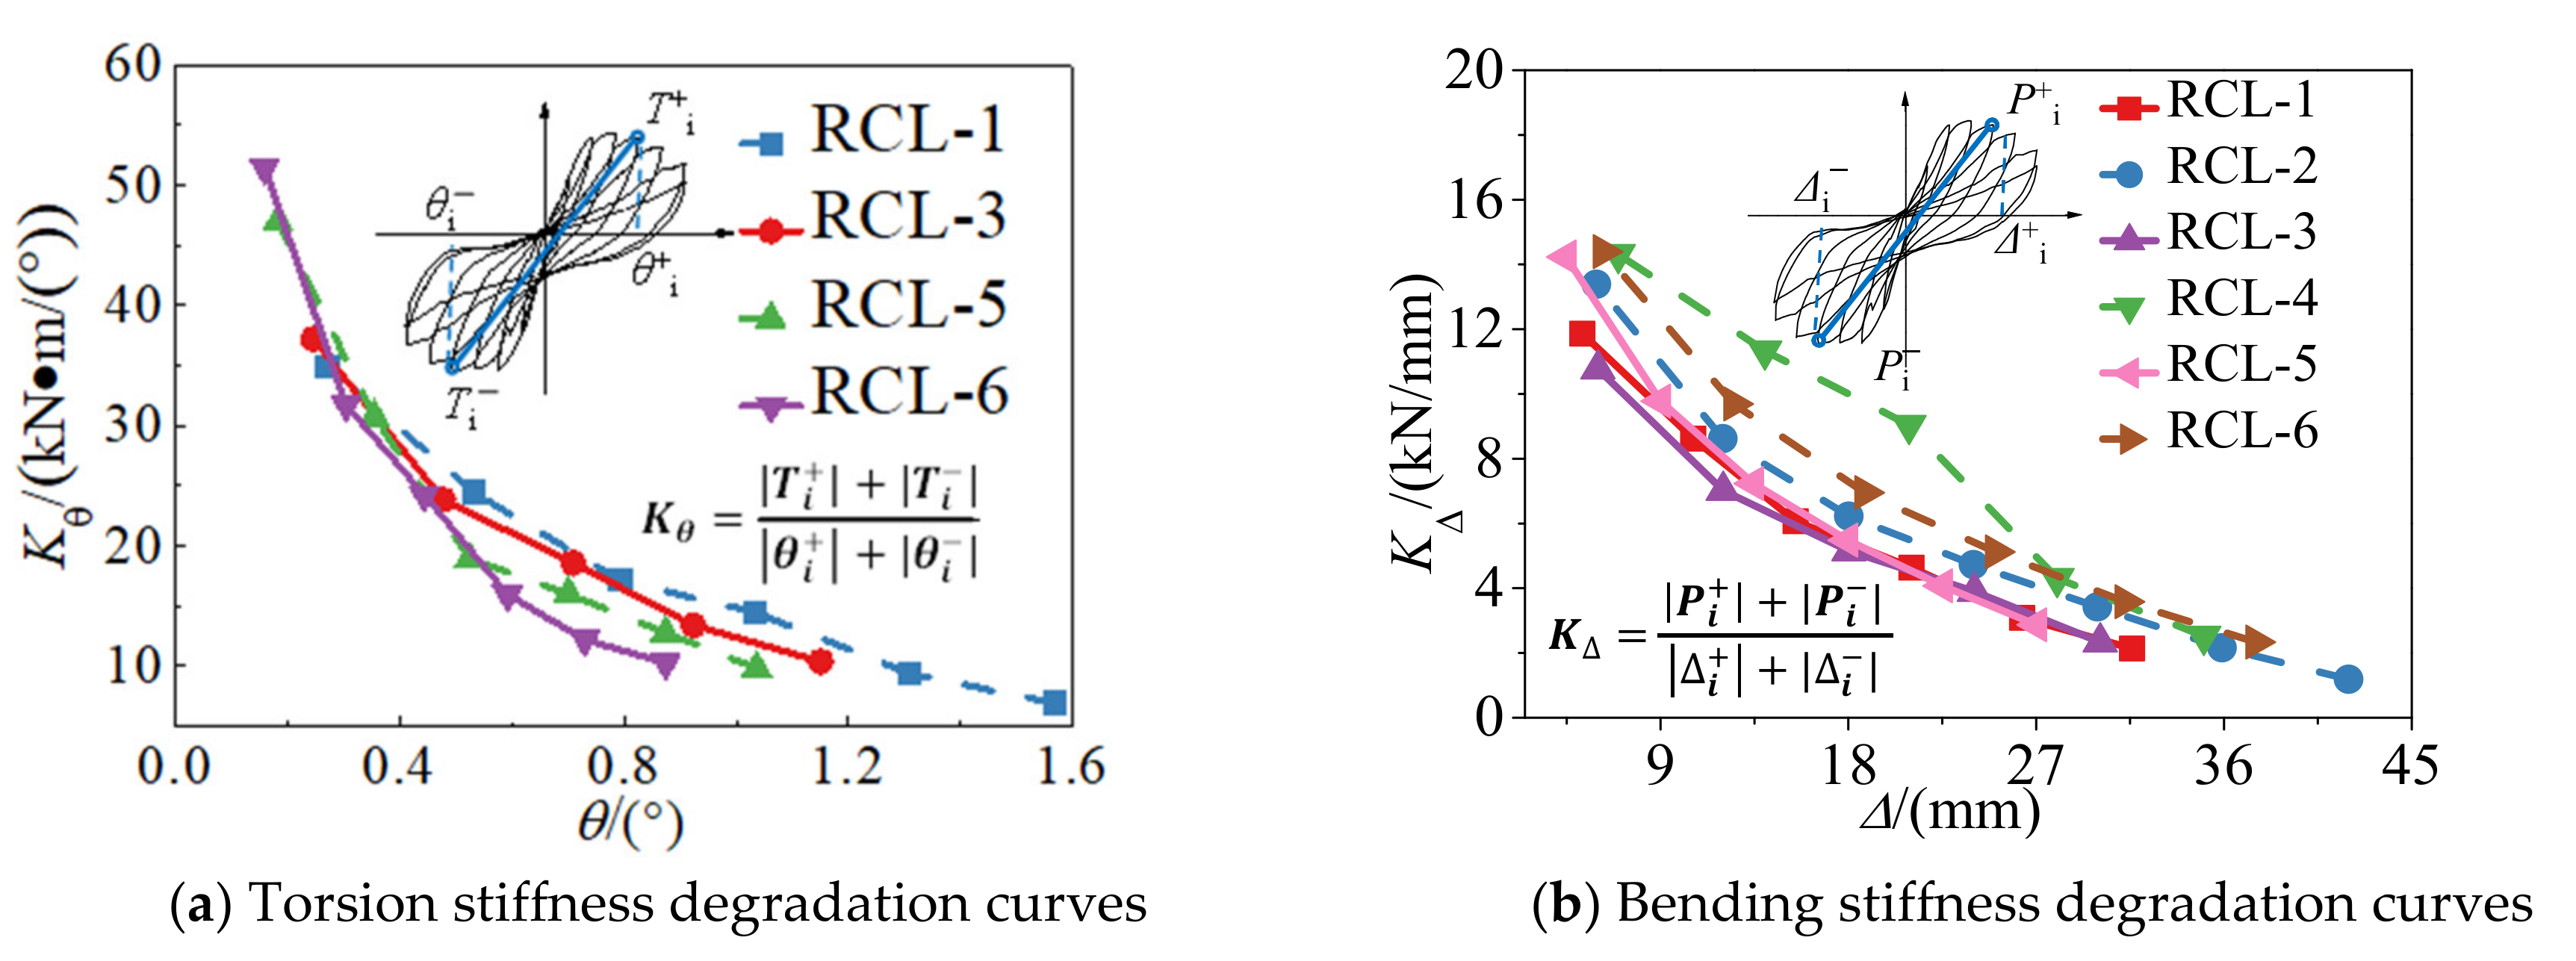
4.5. Stiffness and Strength Degradation
Secant stiffness (
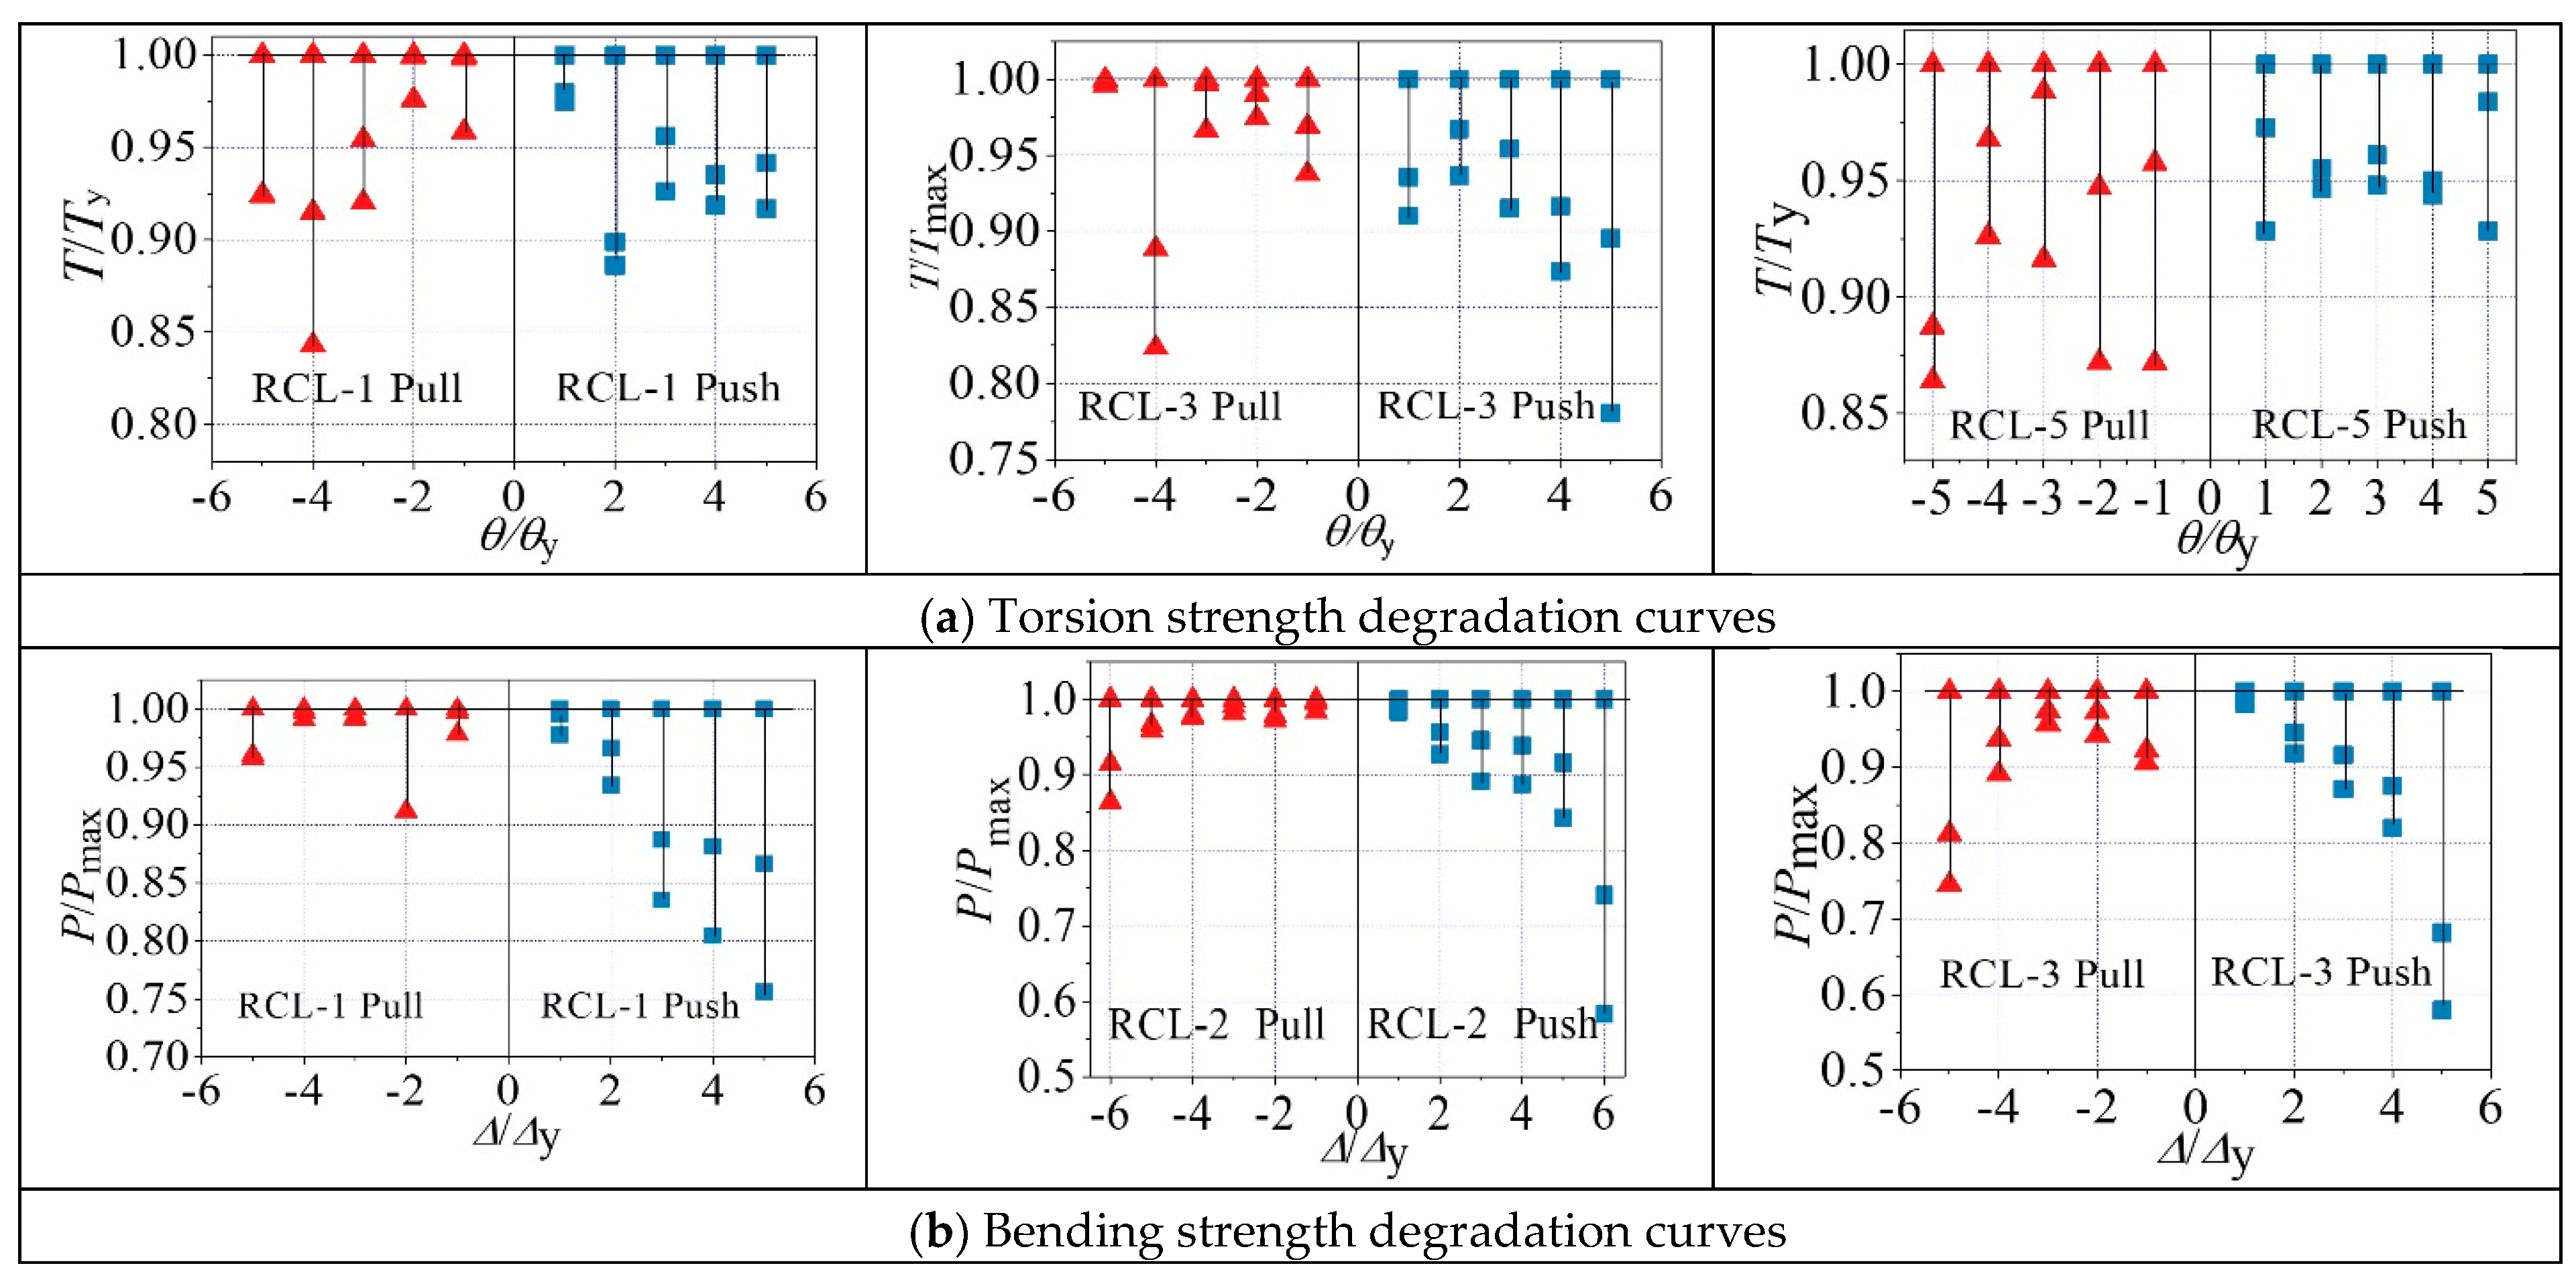
K) was used to evaluate the stiffness degradation under different displacement and twist levels, while strength degradation coefficient (λ) was used to evaluate the degree in different cycles under the same displacement and twist level. To better observe the trend of stiffness degeneration, the torsion stiffness and bending stiffness degradation curves are shown in
Figure 12. The degradation curves of the torsion strength and bending strength are shown in
Figure 13.
(1) Due to the formation of new cracks and yielding of reinforcements, the initial torsion stiffness degradation rate was high. Specifically, the torsion stiffness degraded by 50% when the displacement reached 3Δy. After that, the rate of torsion stiffness degradation slowed down. Comparing with the RCL-1, RCL-5, and RCL-6, the initial stiffness and stiffness degradation decreased with the increase of T/M ratio. Due to the existence of torsion, the diagonal cracks extended to the whole specimen, which led to smaller torsion stiffness.
(2) The degradation of bending stiffness was more stable than torsion stiffness. The higher n ratio, the larger the bending stiffness, while the higher the T/M ratio, the less the bending stiffness.
(3) As shown in
Figure 13, with the increase of axial compression ratio, the torsion strength degeneration coefficient increased due to the high compression, which could prevent the development of cracks.
5. Proposed Modified Damage Index Mode
Combined loadings including torsion with axial compression, bending, and shear are commonly observed during the earthquake. Especially, the effect of combined loadings is significant to the special-shaped column frame. The adverse effect resulted in complex flexural-shear failure. Based on the finding of experiment, the torsion could reduce the length of plastic hinge and change the failure mode. In addition, the experiment showed that with the increase of torsion a reduction of flexural strength was observed. Therefore, it is necessary to quantify the damage degree of the RC special-shaped column under combined loadings resulting from the seismic load.
In this study, the damage index of flexure and torsion were obtained directly from the experimental hysteresis data. The Kumar damage model [
30] was modified to predict the damage process of the special-shaped column under the combined loading including torsion. The model was decoupled to distinguish the influence of bending and torsion from the bending-shear-torsion loading state.
5.1. Flexural Damage Index Using the Kumar Approach
The Kumar model is the most widely used damage index for the RC column to quantify the damage as follows in Equation (5) [
31,
32,
33].
where Δ
i = maximum displacement in the
ith half-cycle; Δ
max = maximum displacement experienced so far;
Ei = hysteretic energy dissipated in the
ith half-cycle;
β = damage parametric constant. C = damage parametric constant, which could be calculated by the equation proposed by Wang [
34].
.
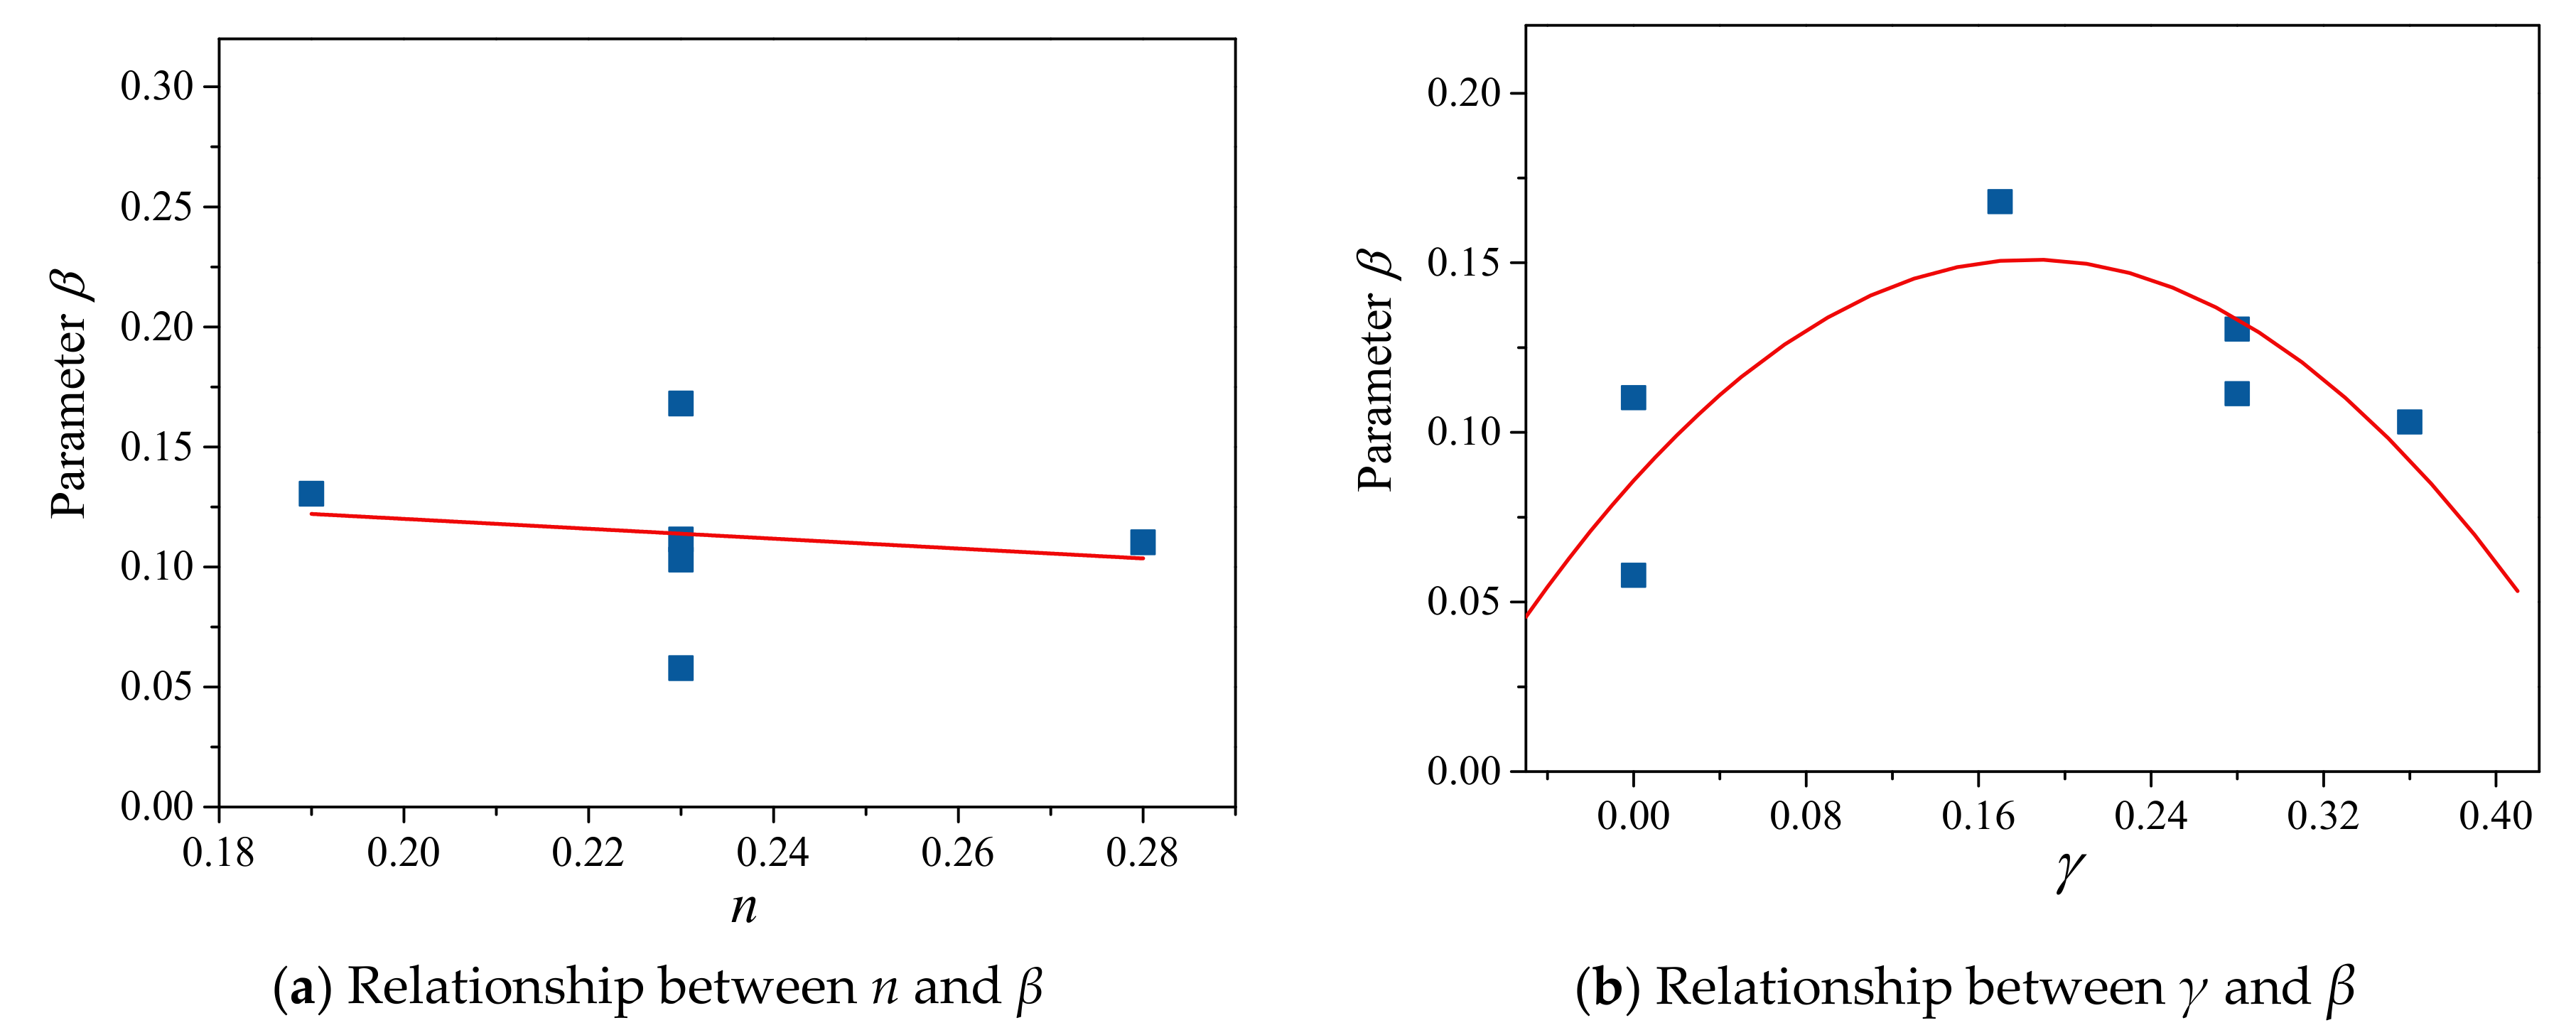
In this study, the Kumar approach was modified by the experimental result to quantify the flexural damage under the combined loading. The flexural damage index parameters
β could be obtained through the multiple nonlinear regression analysis as shown in
Figure 14 and the expression of the damage index parameters
β was shown in the Equation (6)
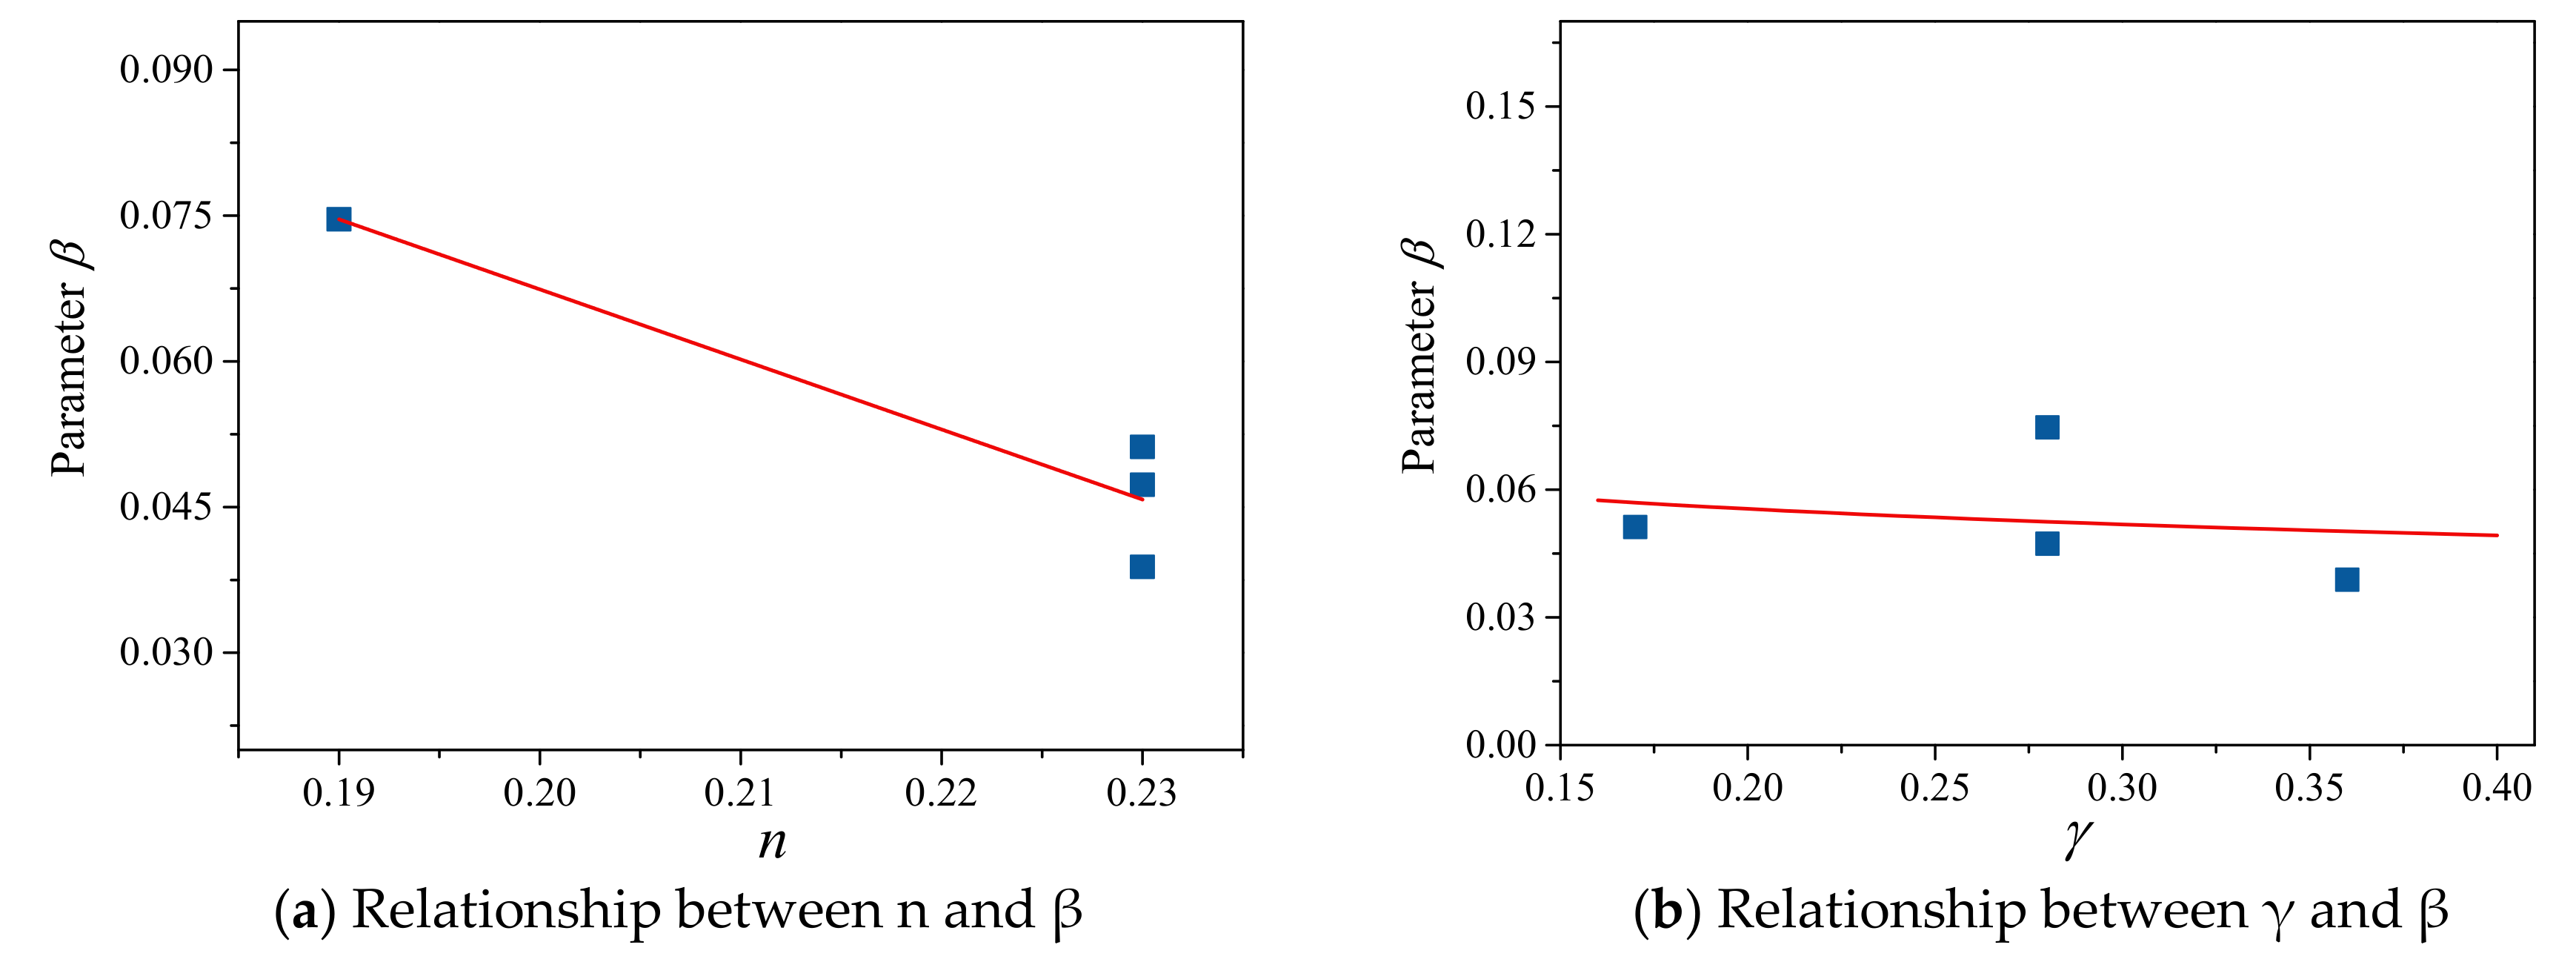
5.2. Torsional Damage Index Using the Kumar Approach
The Kumar model was also modified and extended to predict the progression of the torsion damage state under the combined loading. The following equation (6) was proposed for the torsional damage parameter
β through the nonlinear regression analysis. The process of nonlinear regression is shown in
Figure 15.
5.3. Unified Equivalent Damage Index
During the loading process, the torsion and flexure act together on the column. Hence, the torsional and flexural damage indices should be combined to evaluate the damage process. Accounting for the approach proposed by the Li [
21], the weight coefficient of T/M ratio was applied in calculating the Unified Equivalent Damage Index. The Unified Equivalent Damage Index (UEDI) was calculated by Equation (8)
where
m is weight ratio of bending moment;
t is weight ratio of torsion moment; FDI is the decoupled flexural damage index under combined loading; TDI is the decoupled torsional damage index under combined loading.
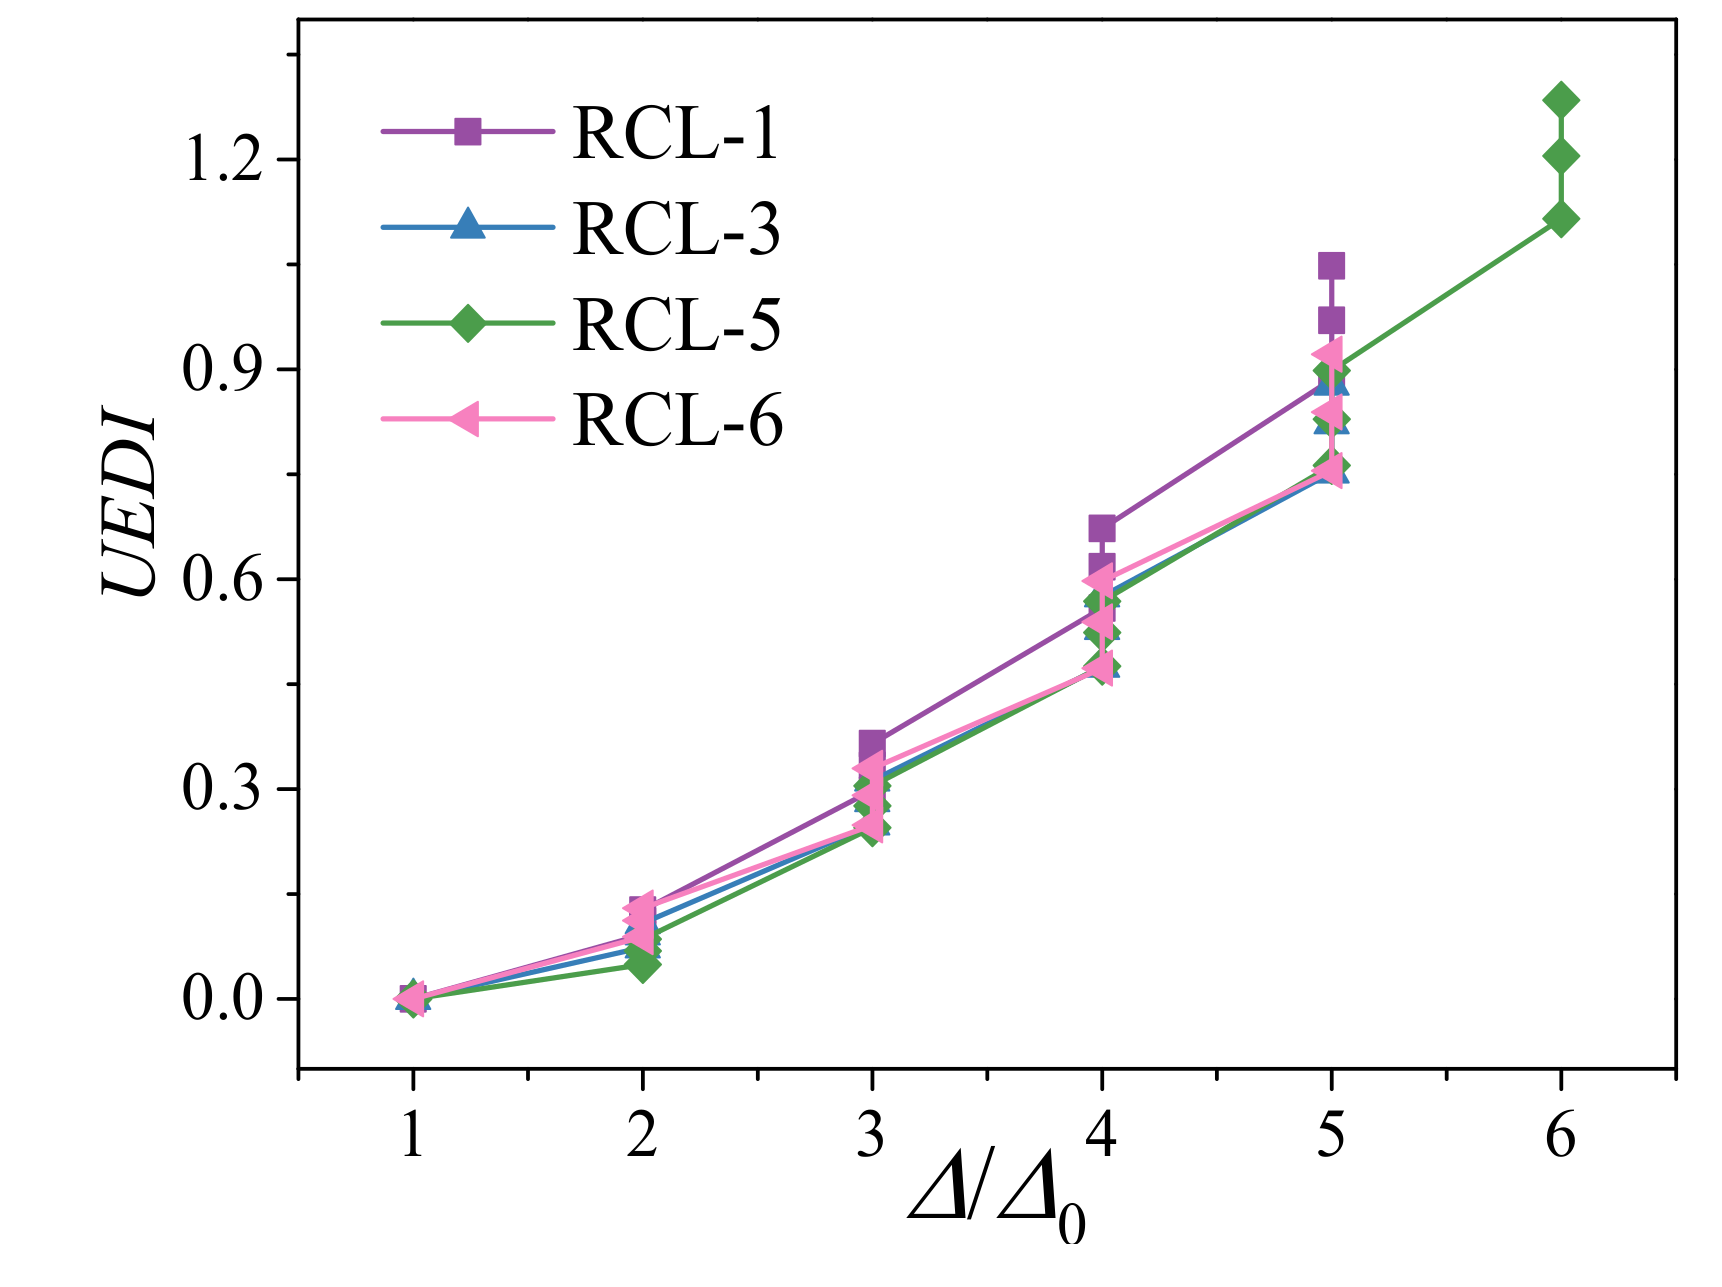
The Unified Equivalent Damage Index increased with the ductility level up to the failure as shown in
Figure 16. As depicted in figure, the increasing T/M ratio raised the value of the UEDI for the specimens under combined loadings.
5.4. Influence of Torsion on Damage Index
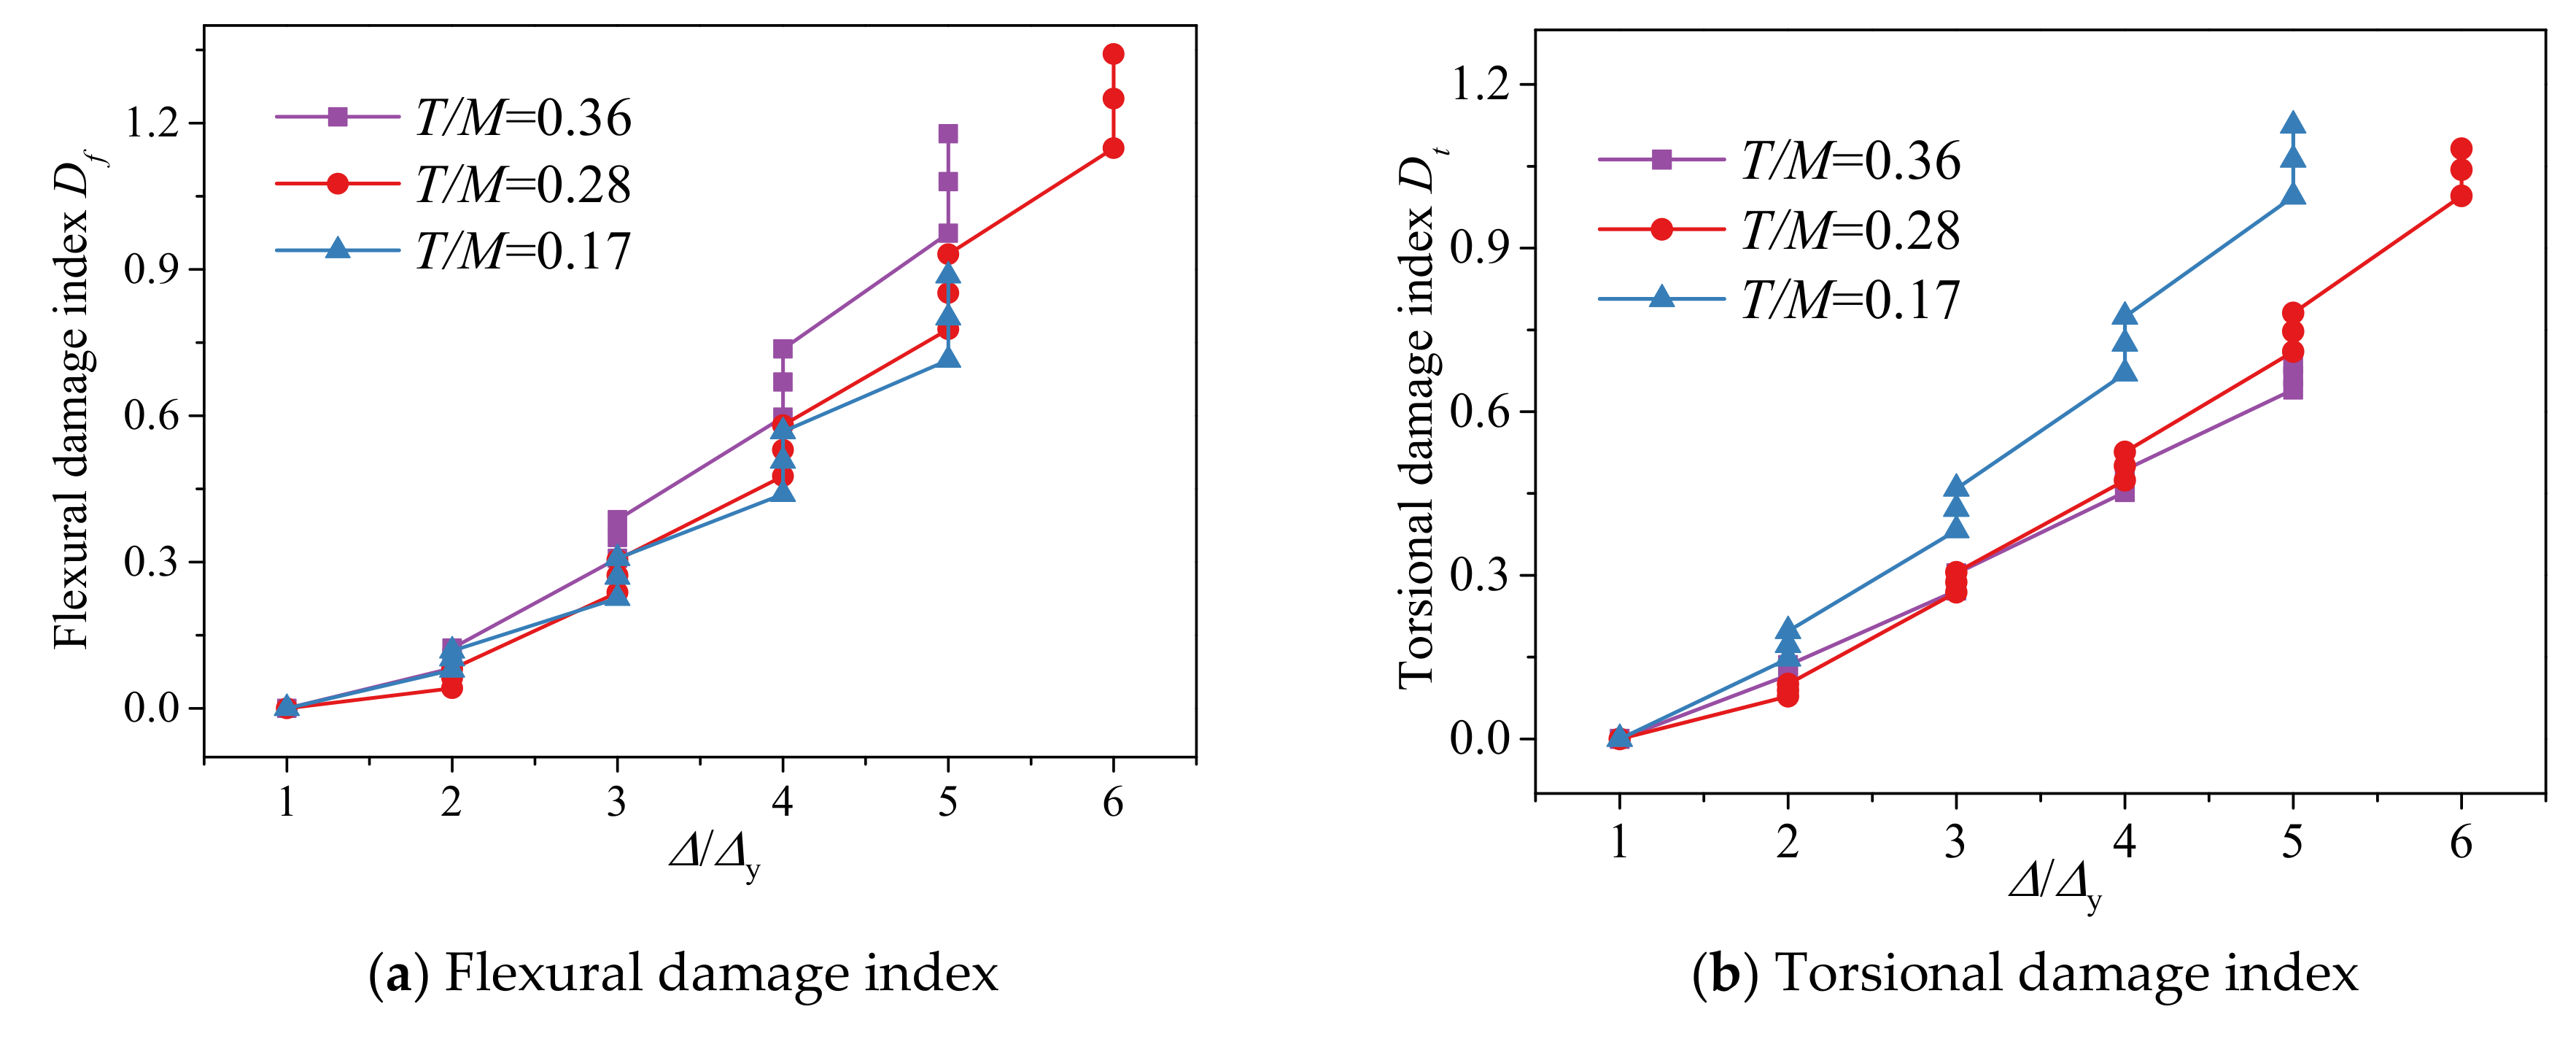
The two types of damage index were calculated to the failure state according to the two proposed damage model. The influence of
T/M ratio on the progression of damage state predicted by the proposed model is clearly shown in
Figure 17. It was observed that the damage index was rising with the increase of the ductility level and the damage value was a little higher than one when reached the failure state. Besides, in the same ductility level the damage index value increase with increasing loading cycles, which is in accord with the progression of damage.
The flexural damage curve obtained a steeper slope compared to the specimen with the lower T/M ratio. It may be attributed to the smaller length of plastic hinge result from the effect of the torsion. Therefore, the displacement ductility dropped with the increasing T/M ratio. The torsion damage index value decline when the T/M ratio increase. As the increase of the T/M ratio led to the change of failure mode from the flexural failure to the torsional failure, the torsional rotation ductility improved.
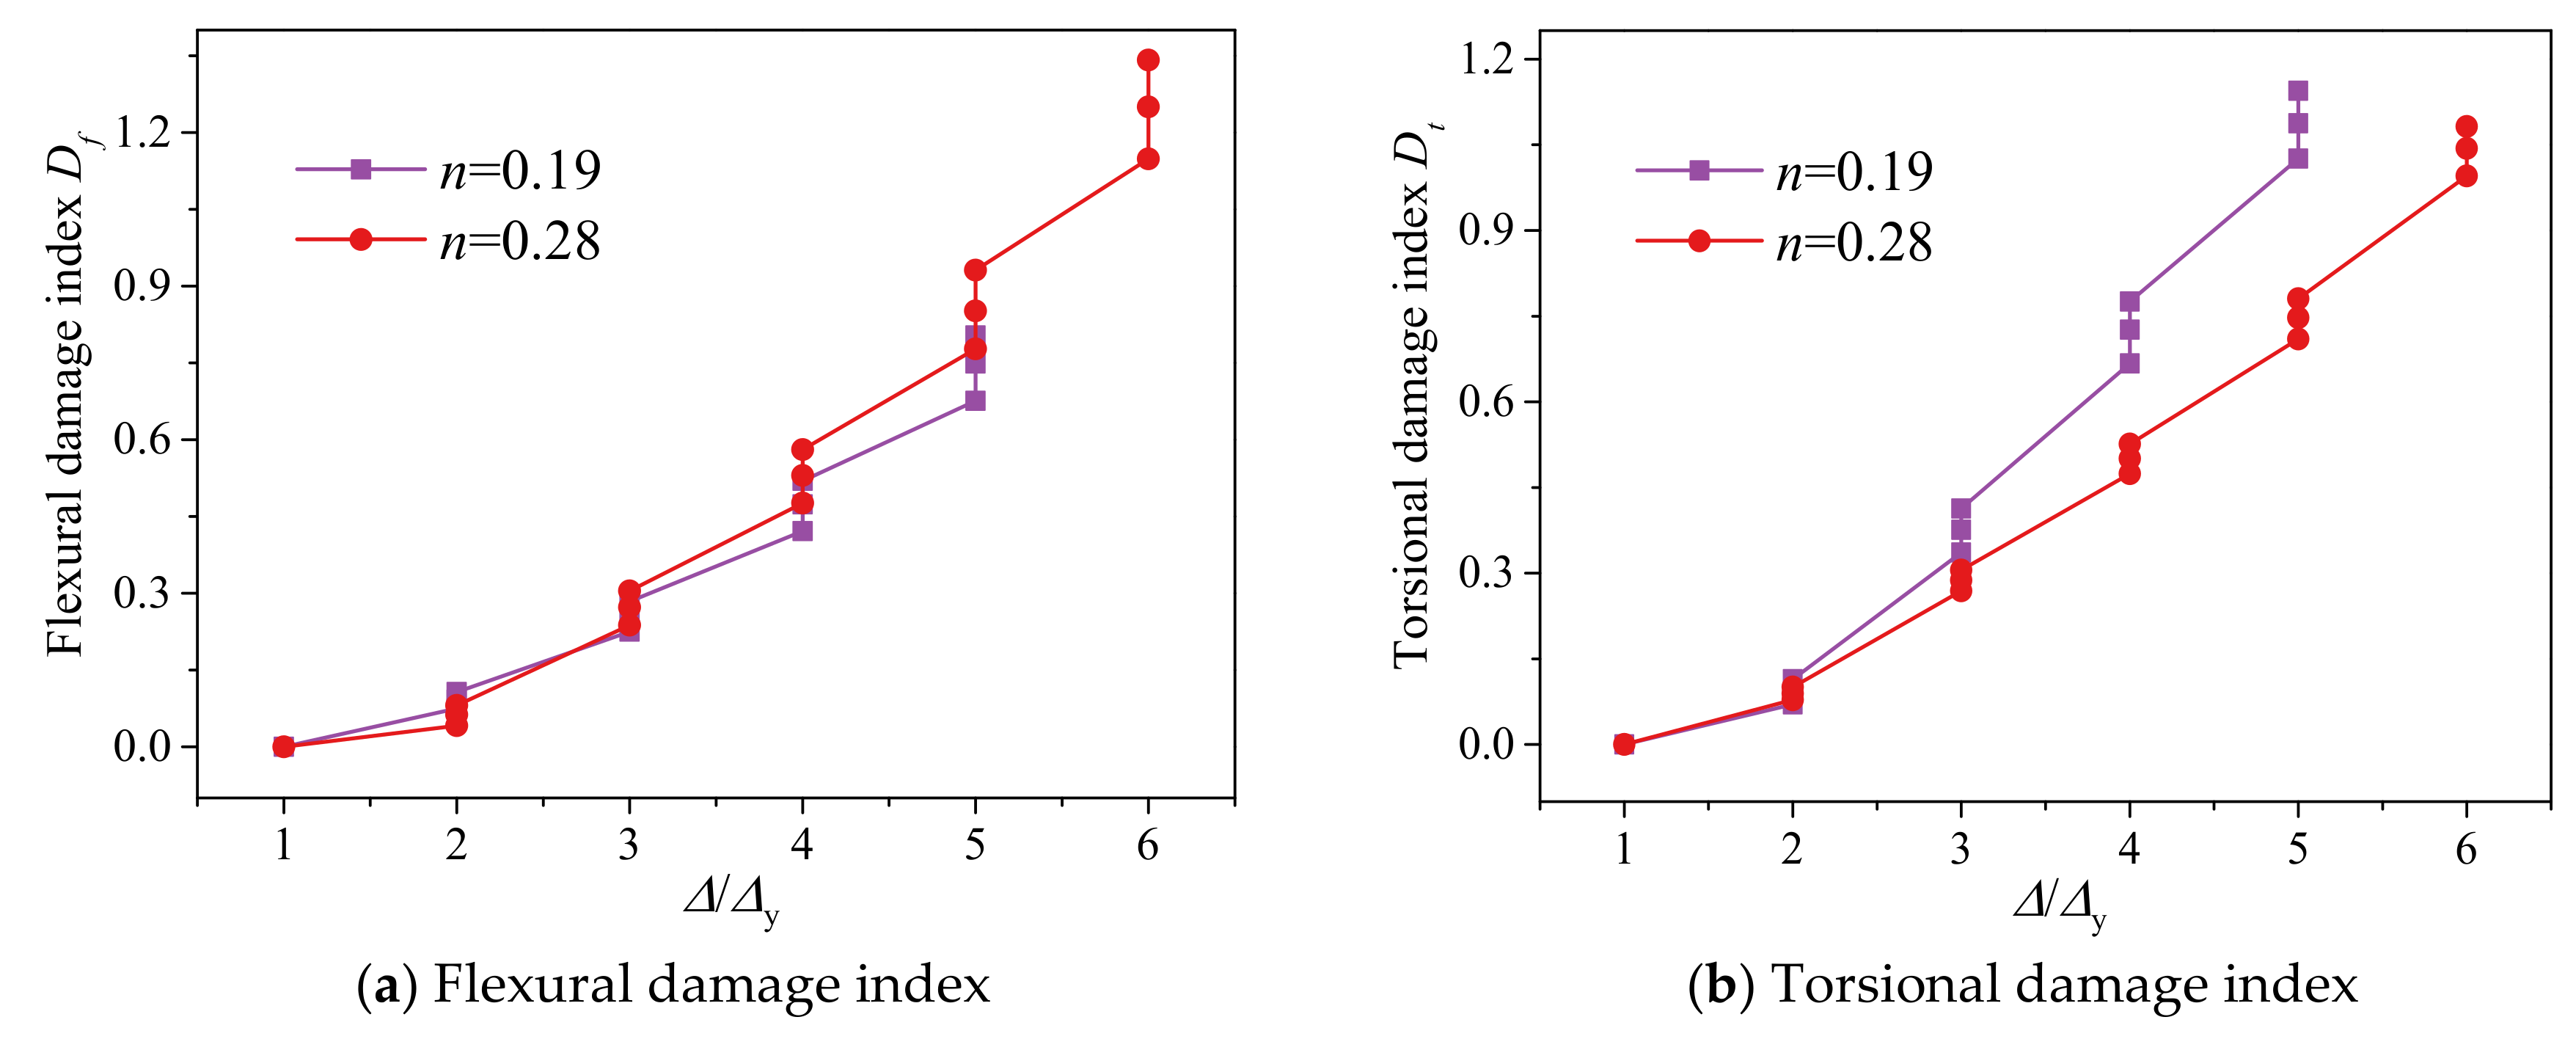
5.5. Influence of Axial Compression Ratio on Damage Index
The influence of axial compression ratio on the progression of damage state predicted by the proposed model is clearly shown in
Figure 18. The flexural damage curve with the greater axial compression ratio obtained a higher damage index compare to the lower axial compressive ratio. This may attribute to the better ductility due to the lower axial compression ratio. In the same ductility level, the better ductility resulted in a lower damage index. For the torsional damage model, the lower axial compression ratio obtained a steeper slope of the damage curve. Since the stronger confinement was caused by the higher compression, the cracking of concrete delayed which improved the torsional rotation ductility. It is indicated that the progression of torsional damage is quietened by high compression.
6. Conclusions
This paper presents the results of tests on reinforced concrete L-shaped columns under combined constant axial loading and cyclic flexure-shear-torsion loading. The effects of ratio of torsion-moment (T/M) and axial compression ratios (n) on bearing capacity, ductility, inter-story drift ratio, energy dissipation, stiffness degradation, and strength degradation were discussed. These experimental results and comparisons were summarized as follows:
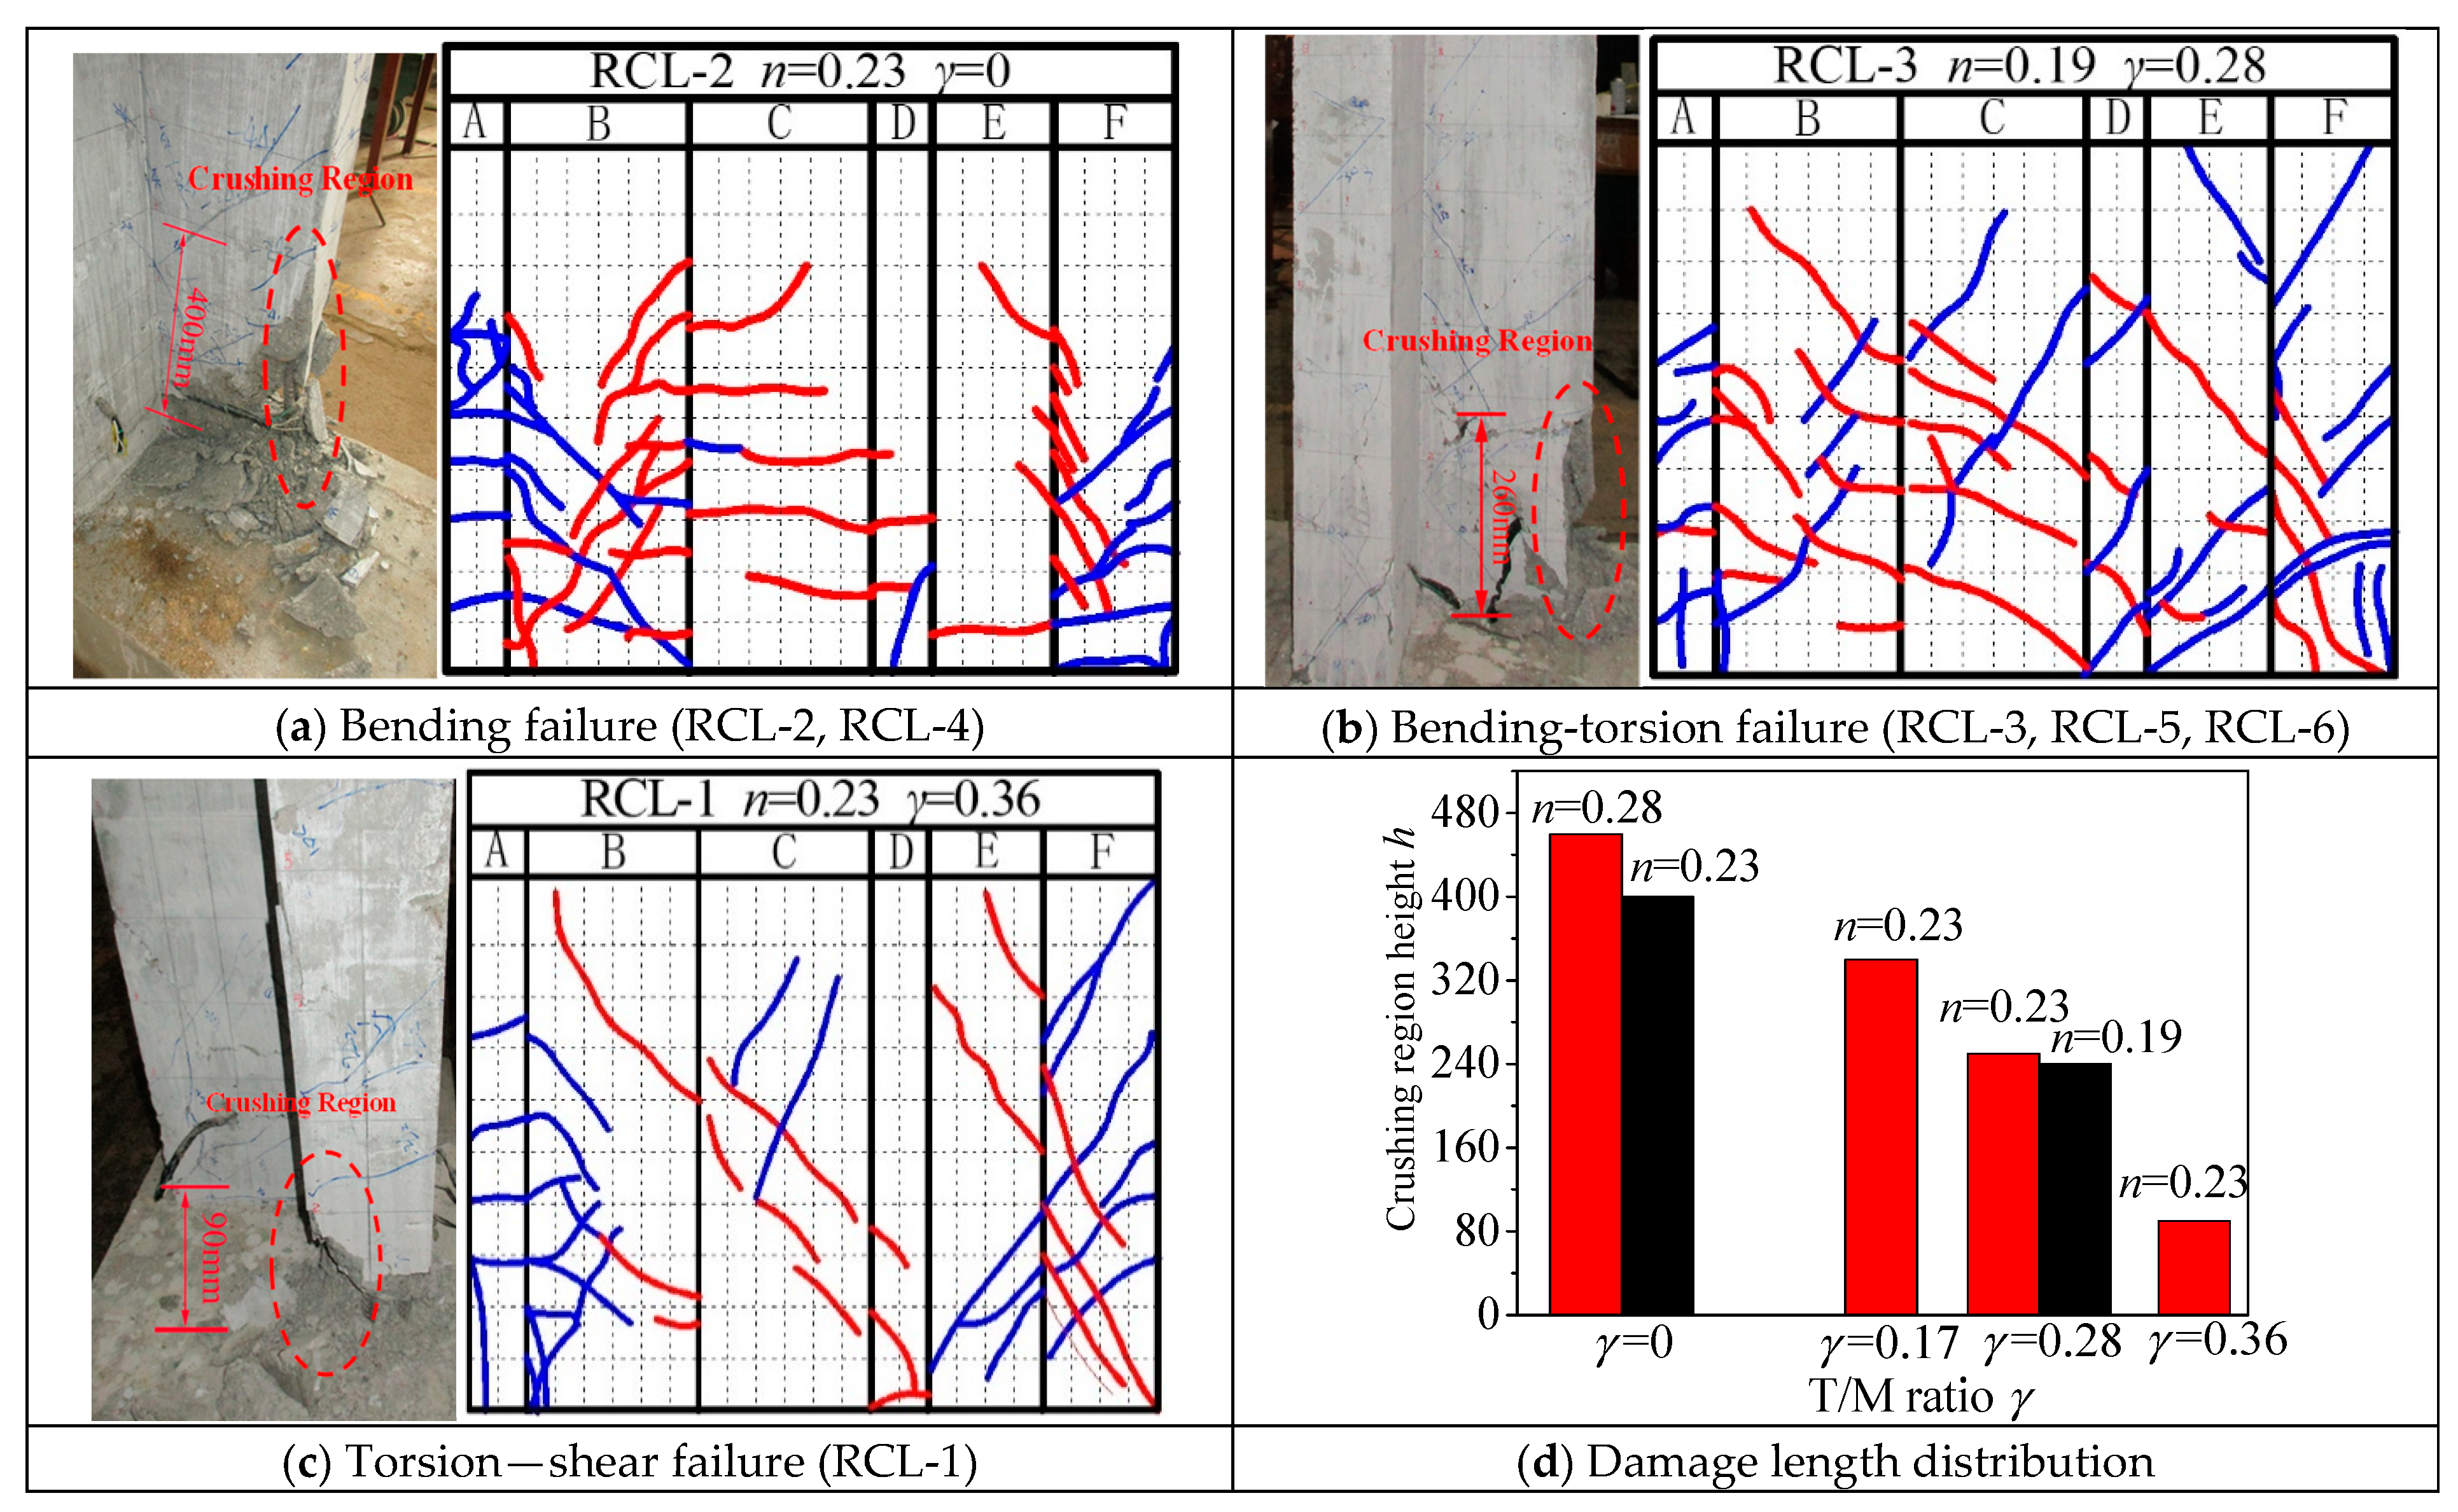
(1) With the variation of the T/M ratios, the failure modes of reinforced concrete L-shaped columns included bending failure, flexure-torsion failure, and torsion-shear failure. With the increase of T/M ratio, the cracks propagated upward and the height of concrete crushed area decreased. The cracks were mainly concentrated on the column limb parallel to loading direction.
(2) All the hysteretic loops exhibited pinched “S” shape. Under the same T/M ratio, the hysteretic loops of the load-displacement were plumper than the hysteretic loops of torsion-twist. With the increasing of T/M ratio, the hysteretic loops had a more obvious pinching phenomenon.
(3) With the increase in T/M ratio, the torsion bearing capacity and torsion ductility factor increase significantly, while the bending bearing capacity and displacement ductility factor decreased. With the increasing axial compression ratio, the reductions of torsion and bending bearing capacity were observed.
(4) The total energy dissipation in early stage was mainly caused by torsion while in the failure stage was governed by flexure. The bending and torsion equivalent damping coefficient for the failure point was about 0.2~0.28 and 0.16~0.23, respectively. The rate of stiffness degradation for bending as lower than that of torsion while the rate of strength degradation is opposite. The average value of the story drift ratio is over 2.81% indicating a favorable anti-collapse performance for the L-shaped RC column.
(5) Two modified damage index models were proposed to clearly predict the progression of damage for the special-shaped column under combined loading. Decreasing T/M ratio helped to prevent the flexural damage of specimen and a low T/M ratio lead to the critical torsional damage of the specimen. An increase in axial compression ratio resulted in more confinement for the cracking, thus reducing the torsional damage. While, with the axial compression ratio increase, the flexural damage index value increase.


