Article

Assessing Significant Factors Affecting Risky Riding Behaviors of Motorcyclists

by
Wins Cott Goh
1,
Lee Vien Leong
1,* and
Richard Jun Xian Cheah
2
1
School of Civil Engineering, Engineering Campus, Universiti Sains Malaysia, Nibong Tebal 14300, Malaysia
2
Lumbini Traffic Management PLT, 1 Cangkat Dumbar, Bukit Dumbar, Jelutong 11600, Malaysia
*
Author to whom correspondence should be addressed.
Appl. Sci. 2020, 10(18), 6608; https://doi.org/10.3390/app10186608
Submission received: 22 July 2020 / Revised: 7 September 2020 / Accepted: 15 September 2020 / Published: 22 September 2020
(This article belongs to the Section Civil Engineering)

Abstract

:
This study was conducted in Malaysia, where motorcycle traffic accidents represent a high percentage of fatality among overall traffic accidents. Studies have shown that risk perception and positive outcome of risky riding behavior have a significant impact on a rider’s decision making. Therefore, this study is targeted at further understanding of Malaysian motorcyclists within the locality of their home country. A questionnaire survey was conducted to gather motorcycle rider’s information, together with their perception of the three factors mentioned above. A reliability test of the findings was analyzed using Cronbach’s Alpha, while a PCA analysis was conducted to determine the linear combinations that have maximum variance. Subsequently, a statistical model was constructed based on the latent variables’ relations, the relation between the latent variables and observed variables, and also the hypothesis model. The model confirms that the positive affect of the risky behavior has a significant positive relationship with motorcyclists’ risk behavior (estimate coefficient = 1.016). Findings in the model also show that older motorcyclists are less likely to take part in risky riding behavior while riding on the road, with an estimate coefficient of −0.037 and a negative relationship with positive affect (estimate coefficient = −0.032).

Graphical Abstract

1. Introduction

Traffic accidents are commonly perceived to be an important public health issue, as they are within the top eight leading causes of death worldwide [1]. Malaysia, like most other South East Asian countries, has a very high volume of motorcycles on the road, and consequently suffers from a high rate of motorcyclist fatality. Motorcyclists are the category of road user that has the highest priority, from a road safety perspective [2]. Unfortunately, studies show that the traffic fatality of motorcyclists are still very high in Malaysia, even though efforts have been taken to decrease the probability of accident occurrence [3]. Meanwhile, in most developed countries, road accidents involving motorcycles remain a recurring problem that has yet to be resolved.
A study conducted by Radin Umar et al. [4] found that driving a passenger car is 17 times safer than riding a motorcycle. This is mainly a result of the high number of vehicles on the road, which contributes to the high rate of accidents that involve motorcyclists. In Malaysia, motorcycles are one of the common modes of transportation that are frequently involved in road fatalities. More than 50% of road accidents involve motorcyclists [5]. The traffic safety of motorcyclists is currently an important and necessary concern for a large part of the community. Motorcyclists’ riding behavior is strongly affected by the riding characteristics, external environment, and vehicle interactions [6]. Thus, it is imperative to examine the factors surrounding motorcyclists’ riding behaviors. In a previous study conducted in Denpasar, the risky behaviors of motorcyclists were measured with reference to positive affect and risk perception by establishing the relationship among the three variables [7]. In the past, dual-process models have been implemented in order to assess risky health behavior such as smoking and consumption of alcohol [8], but this dual-process model has rarely been used in traffic-related studies.
The motorcycle is one of the highest-selling modes of transportation among road users in Malaysia. However, the majority of road accident fatalities include motorcyclists. Malaysia has the highest road fatality risk (per 100,000 population) among the ASEAN countries, and more than 50% of road accident fatalities involve motorcyclists [5]. According to a study by Zahid Sultan et al. [9], the most influential factor contributing to motorcycle crashes in Malaysia is the human behavior factor. Most previous studies have focused on traffic violations and motorcyclist characteristics, while the perspective of motorcyclists and their personal preferences with respect to risky riding behaviors have seldom been discussed.
To reduce the number of accidents involving motorcycles, an understanding of the local conditions in every region is crucial, due to differences in riding/driving culture (e.g., lane splitting), resulting in a reciprocal reaction to every incident occurring on public roads. Therefore, this study places emphasis on Malaysian motorcyclists’ general perception of self-reported performed risky behavior. Therefore, a better or full comprehension of motorcyclists’ risky behavior, positive affect, and their risk perception with respect to riding behavior is needed to provide a pathway for improvement in road safety. The objectives of this study are to determine the relationship between positive affect and risk perception of motorcyclists with respect to risky riding behavior, as well as the significance of the impact of each observed variable of risk perception and positive affect towards the behavior. A questionnaire survey was conducted to collect the data of the motorcyclists. Subsequently, the collected data was then analyzed by using Principal Component Analysis (PCA), with a further interpretation and prediction by developing a model using Structural Equation Modeling (SEM). In addition to the factors mentioned, age and experience are often factors that dictate a rider’s behavior and decision making on the road. A study conducted by McCartt et al. [10] also concluded that crash rates were more strongly related to age than to years of licensure. Therefore, it is crucial to include the age factor in the SEM model in order to understand the relationship or influence of risk perception and positive affect on the risky riding behavior of motorcyclists in Malaysia.

2. Study Methodology

In this section, the methodology employed for the study on motorcyclists’ risky behavior and their risk perception will be discussed. A hypothesis was created based on the preliminary study of the motorcyclists’ characteristics. The hypothesis was then tested. A simple questionnaire was constructed in order to collect the data. The questions were grouped into three sections to determine how frequently motorcyclists performed particular behaviors, how risky they thought the particular behaviors were, and how much they liked to do them. The basic demographic information and personal characteristics of the respondents were collected, such as age, gender, riding experience, type of motorcycles owned, and what distances they normally traveled per trip. Factor analysis was then used to analyze the data collected. A model was developed to assess the relationship among the variables based on SEM.
Figure 1 shows the flow of steps taken in this study. The factors of motorcyclists’ risky riding behavior were determined before the questionnaire survey was designed and conducted. Data collection was performed using face-to-face and online methods. The data collected were then analyzed using three methods, namely preliminary analysis, PCA, and causal relationship analysis via SEM.
A questionnaire survey is an important instrument for obtaining a variety of information on the properties of any particular aspect, behavior, beliefs, and reasons for action [11]. There are lots of studies that have discussed motorcyclists’ safety via questionnaires with the aim of determining the mental properties of motorcyclists that lead to risky riding behavior and road fatalities [12]. This survey targeted respondents that currently held a B (license for motorcycles exceeding 500 cc), B1 (license for motorcycles not exceeding 500 cc), or B2 (license for motorcycles not exceeding 250 cc) riding license. The questionnaire was a survey tool that assessed the motorcyclists on the frequency with which they engaged in specific risky behaviors while riding, as well as their perceptions and preferences with respect to that behavior. Additional questions were added to collect necessary information about the respondents, such as age, gender, riding experience, type of motorcycle, and how far they typically traveled per trip. Based on the literature review, a total of 21 questions were created for this questionnaire. The survey was divided into two segments, with the first segment being conducted to single out the risky behavior most frequently engaged in, together with elements of positive/negative outcome, including factors that induce and hinder that specific behavior.
For the second segment, a 5-point scale system was used for respondents to answer the questions in each section. This first section required respondents to rate the questions in terms of how frequently they engage in these 21 behaviors, ranging from 1 (Never) to 5 (Always). Meanwhile, in Section 2, the respondents were asked about how risky they thought each of these 21 behaviors was (1—Not Risky at All; 5—Extremely Risky). In Section 3, respondents were asked to rate the questions as to how much they enjoyed engaging in these 21 behaviors (1—Extremely Dislike; 5—Like it Very Much). In summary, all the questions were represented by a variable code to, as shown in Table 1.

3. Data Collection

For simplicity, each behavior measure is represented by a different variable code, such as X, Y, and Z, for easy categorization in the following sections. A total of 398 respondents from different states in Malaysia, such as Pulau Pinang, Johor, Kedah, Kelantan, Melaka, Negeri Sembilan, Pahang, Perak, Selangor, Sarawak, Terengganu, and Wilayah Persekutuan, participated in this survey between February and April 2019. All participants were informed about the purpose of the survey before asking for their permission and willingness to participate in the study. The samples were segregated into two different surveys, amounting to 194 samples collected in the initial survey and 204 samples in the second survey. The self-reporting method was chosen, as it is convenient for the respondents to answer with such a variety of risky behaviors [13].
The data collected were first analyzed by creating a simple direct percentage chart to give a simple insight into the results by showing the motorcyclists’ answers based on percentage. In this study, the self-reported risk perception, positive affect, and risky behavior were considered as the latent variables.
The reliability test was conducted by determining the Cronbach’s Alpha value prior to any other analysis in the study. To obtain the significance of each item’s factor loading, the results were then analyzed using PCA with the construction of causal modeling showing a simplified version of the complex relationship among the variables of the data. Lastly, a model was created via SEM to present the relationship between the latent variables in a straightforward manner.
Overall, three major analyses, namely, Reliability Test, PCA and SEM, were conducted in order to understand the relationship among the variables. The reliability test was conducted using Cronbach’s Alpha at first to test the reliability of the study. PCA was then used to determine the significance of the observed variables. Subsequently, SEM was constructed to determine the relationship among the variables.

4. Results and Discussion

The survey was divided into two segments, where the first survey was conducted to single out the risky behavior that was most frequently engage in, together with elements of positive/negative outcome, including factors that induce and hinder the specific behavior. On the other hand, a second survey was geared towards building an SEM model to find a causal relationship between the three latent variables, namely risky behavior, risk perception, and positive affect. A simple and direct preliminary study analysis was conducted to determine the perception and preference of the motorcyclists towards risky riding behavior, as well as the frequency with which a particular behavior was performed. Subsequently, PCA and reliability tests were conducted in order to know the significance of each observed variable and also the reliability of the survey itself. The significant factors were sorted out based on the factor loading of the observed items, and also the percentage of variance explained by them.
Moreover, statistical path modeling was carried out to present and identify the estimates and the causal relationship among the three latent variables. An estimate of values was obtained from the SEM model, where the relationships among the observed variables and latent variables were identified.

4.1. Descriptive Statistics

Findings from the preliminary survey of 194 participants showed that males represented 75% of the sample, while females represented 25% of the sample. The initial survey data also revealed that 117 of the participants were students aged between 16 and 18 years old, while the remaining 77 participants represented riders who were working adults with ages ranging from 19 to 59 years old. The data show that most of the participants did not have more than three years of riding experience, which is in accordance with the age majority of the data sample. However, in Malaysia, the years of experience may not be in line with the number years for which a rider has possessed a license, because it is commonly known that underage teenagers have access to motorcycles even before obtaining an official license from the authorities.
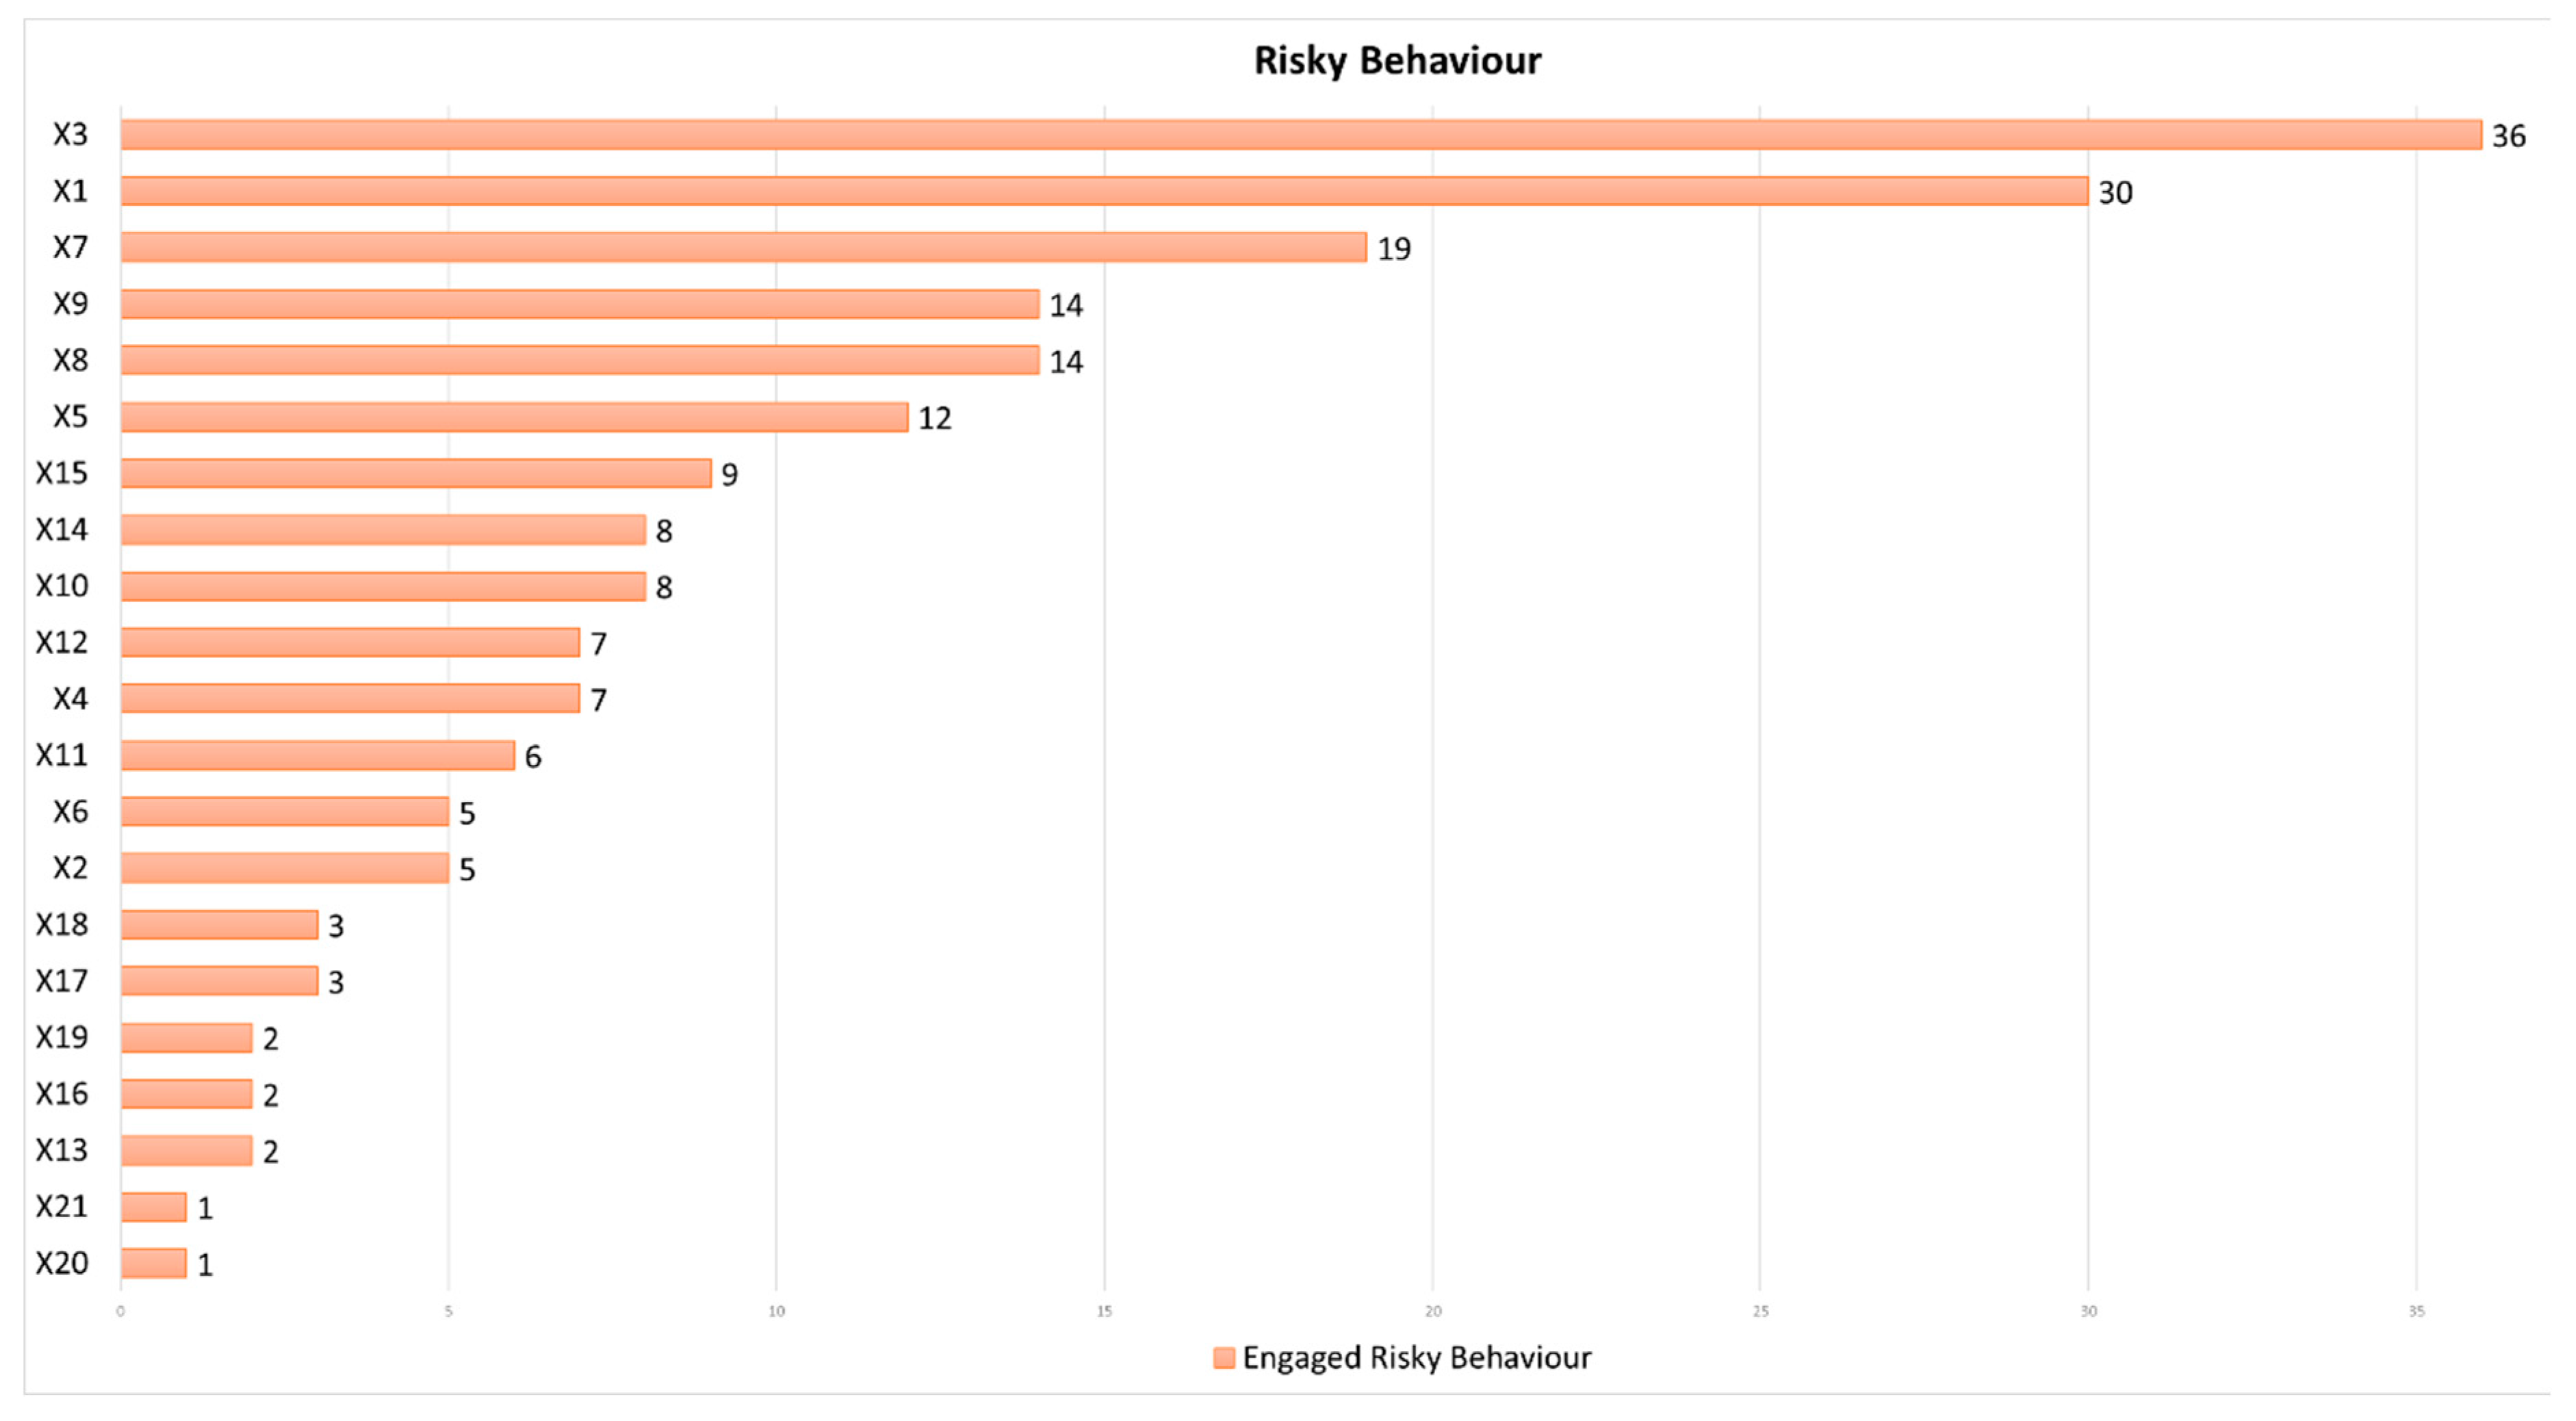
In line with what is commonly seen in Malaysia, the most popular motorcycle engine displacement was within the range of 100–250 cc, which was used by 62% of the participants, followed by motorcycles with engines of less than 100 cc, accounting for 32% of the participants. Of the 194 participants, the most frequently committed risky behavior was exceeding the speed limit, with 36 participants, followed by frequently changing lanes to overtake vehicles, with 30 participants, as illustrated in Figure 2.
From the perspective of the participants, the positive outcome from performing the risky behavior was mainly time-saving, accounting for 54.11% of the participants. Subsequently, having a smoother ride and maintaining speed came in as the second most popular, at 19.48% of the participants. At the other end of the spectrum, compromising the safety of riders topped the chart on the perspective of negative outcome, at 19.75%, closely followed by being issued traffic summons at 18.18%. The results show that the civic-mindedness of riders in Malaysia is respectably high, because 15.05% of the riders did mind if their riding behavior offended other road users. As anticipated, most of the participants chose their parents as the primary source of positive influence decreasing their commitment to risky behaviors, amounting to 33.78% of the participants. At the other end of the scale, the main participants’ negative influence was generated by other road users, at 50.96%, closely followed by friends, at 46.63%. As for factors that induce risky behavior, road conditions (crowded, chaotic) were the main reason inducing participants to engage in risky behavior, which was chosen by 13.37% of the participants. Tiredness and mood were the second and third factors inducing risky behaviors, and were recorded at 12.5% and 11.05%, respectively. It is a bit of a mixed bag in terms of factors hindering risky behavior. Without a clear indication of what are the main factors that hinder risky behaviors are, the findings still show that law enforcement/police is still the top factor, with a percentage of 20.33%. The element with the second most votes was seeing news reports of traffic accidents, which amounted to 15.66%.
The results reveal that 125 participants did not frequently perform round trips, whereas 50 participants regularly performed a single round trip. In terms of trip purposes, 45.19% of the participants stated that traveling to classes was their main travel purpose, followed by leisure at 25.19%. A total of 162 participants performed short-distance trips, while 28 participants performed medium-distance trips, with only the remaining 4 performing long-distance trips daily.
For the second survey, the data shows that all respondents were aged between 17 and 63 years old. In total, 71.1% of respondents were male, and 28.9% were female. Most of the respondents were from the age group of 21–25 years old. For females, 83.1% of female respondents were from this age group, whereas 73.1% of male respondents were within the age group of 21 to 25 years old. The mean and standard deviation of the age of the respondents was 23.54 years old and 4.02 years old, respectively. Additionally, the mean riding experience (i.e., the number of years for which the rider had possessed a motorcycle license) of the respondents was 6.20 years. The majority of the respondents had 5 or 6 years of riding experience, representing 20% and 15% of total respondents, respectively. Most of the respondents were using motorcycles with 100 cc–250 cc engines (68%). Motorcycles with engines less than 100 cc and 250 cc–500 cc represented 26% and 12% of total respondents, respectively. The results show that only 0.005% of respondents rode motorcycles with engine displacements of 750 cc–1000 cc.
The findings reveal that (X11) and (X13) showed low engagement for participants in the first survey. In contrast, the second survey showed a high number of engagements for both (X11) and (X13). However, both the surveys revealed that the participants did not commonly engage in the behaviors (X16) to (X21). Due to this finding, the behaviors (X16) to (X21) were excluded from the subsequent analysis. From Figure 3a, it can be seen that most of the motorcyclists perceived that riding without switching on the headlights during daytime (Y15) was the least risky behavior among the behaviors listed. The majority of motorcyclists thought that drinking alcohol before riding a motorcycle (Y6) was extremely risky behavior that could cause severe traffic accidents. As shown in Figure 3b, most of the motorcyclists favored the risky behavior of frequently changing lane to overtake the vehicles in front (Z1). This behavior is common in Malaysia, and this is most probably due to the high volume of vehicles on the road and the lack of motorcycle lanes in Malaysia. On the other hand, most of the motorcyclists detest the behavior of drinking alcohol before riding motorcycles (Z6). The mean of self-reported risky riding behavior is shown in Figure 3c. From Figure 3c, it can be seen that taking alcohol before riding (X6) was considered to be the least favorable riding behavior among the motorcyclist. The results also reveal that most of the motorcyclists frequently rode during peak hours (X9).
Table 2 tabulates the mean and standard deviation of each of the 15 self-reported observed variables that were answered by the respondents. The mean value indicates the average rating of each of the observed variables, whereas the standard deviation of each of the observed variables shows how much each observed variable differed from the mean value with respect to the latent variables. Table 2 also provides a brief comparison between each of the studied factors. It can be observed that the most favorable risky behavior (Z1) was the second most frequently engaged-in risky behavior (X1), while also having the fourth lowest mean value in terms of risk perception (Y1). In terms of the most frequently engaged-in risky behavior, (X9) was the most frequently engaged-in risky behavior, with the second-lowest mean value in risk perception shown in (Y9). The findings also indicate that riding during peak hour was the second most preferred risky behavior, as shown in (Z9). At the other end of the spectrum, the least favorable (Z6) and and least frequently engaged-in behavior (X6) was taking alcohol before riding. This behavior had the highest mean value of risk perception, as indicated in (Y6). A contributing factor to this trend could be faith and religion, which forbid riders from consuming alcohol. As the majority of Malaysians are of Muslim faith, mostly determined by race, the forbidding of alcohol during daily life is a value that has been nurtured since childhood. In summary, these findings reveal that riders most frequently perform the two behaviors (X1) and (X9) due to their high mean values of positive affect, together with their low mean values of risk perception. These findings support the results indicating a higher engagement rate, as tabulated in X1 and Z1.

4.2. Reliability Test

In statistics and psychometrics, reliability is commonly used as a measure to determine the overall consistency. Reliability is the consistency of the results when the experiment is replicated under the same conditions. A reliability test was conducted in this study to ensure that the reliability of the study was good enough. Study results must be reliable, otherwise the research questions will not meet the aims of the study, which in turn will fail to be generalizable, making the findings useless. Generally, the coefficients of reliability would be in the range of 0 to 1, where “0” means too many errors, and “1” indicates no error. This value indicates the amount of error in the study results [14]. Cronbach’s Alpha was used to conduct the reliability analysis in this study. In assessing a unidirectional latent construct, Cronbach’s Alpha plays a role as a measurement scale of reliability, quantifying the goodness of items or variables [15]. Alpha values higher than 0.8 indicate that the items in a study or test are high in internal consistency [16]. A Cronbach’s Alpha coefficient of 0.7 is generally considered to be the minimum acceptable value.
Table 3 shows that the values of Cronbach’s Alpha obtained for the three latent variables—risky behavior, risk perception, and positive affect—were 0.833, 0.945, and 0.889, respectively. These values indicate that the three variables have a level of internal consistency, which shows that the study is reliable.

4.3. Principal Component Analysis (PCA)

To differentiate between the correlated and uncorrelated linear combinations of the covariates and avoid multicollinearity, Principal Component Analysis (PCA) was chosen to analyze the significance of the self-reported perception and preference towards the particular questions in this study. PCA is usually used to verify that the linear combinations have maximum variance. At the same time, the results obtained from the PCA are generally discussed and presented in terms of factor scores and loadings. The factor scores or component scores are the transformed variable values correlated with a particular data point. Meanwhile, loadings indicate the weight by which every standardized original variable should be multiplied in order to obtain the component scores [17]. In this study, PCA was performed under the condition by which the Eigenvalue was more than 1. Several factors in an analysis of a particular variable can be usefully determined by Eigenvalue [18]. Other than that, reliability values higher than 0.7, 20% or higher variance explained, and rotation was implemented in the PCA to obtain factor loading, as these are also important conditions that need to be met in order to carry out PCA [19]. Factor analysis is a technique that is used to reduce a large number of variables to a smaller number of factors. This technique extracts the maximum common variance from all variables and assigns them a common score. As an index of all variables, this score can be used for further analysis.
Additionally, items that have factor loadings lower than 0.5 were considered to be insignificant. Results from the initial analysis indicate the insignificant items to be X2, X6, X7, X13, Y10, Y13, Z5, and Z15. Moreover, 15 of the observed variables were categorized into a group comprising variables where the variance explained was less than 20%. Observations that explained less than 20% of variance were also considered to be insignificant. These 15 observed variables were X5, X9, X10, X11, X12, X15, Y9, Y15, Z1, Z2, Z3, Z4, Z8, Z9, and Z10. Table 4 shows a summary of the factor loadings of the variables, percentage of variance, and the Cronbach’s Alpha of each latent variable. The results obtained indicate that motorcyclists in Malaysia are significantly connected with the risky behaviors, namely “Frequently changing lanes to overtake (X1)”, “Exceeding speed limit even feeling unsafe (X3)”, “Riding fast on curve (X4)”, “Racing with other vehicles (X8)” and “Using phone while riding (X14)”, with factor loadings of 0.580, 0.653, 0.669, 0.651 and 0.556, respectively. This is compatible with a previous study that stated that the manner or behavior of motorcyclists is one of the issues that lead to vehicle crashes [20].
Motorcyclists are also associated with their perceptions on risky riding behaviors, consisting of variables Y1, Y2, Y3, Y4, Y5, Y6, Y7, Y8, Y11, Y12, and Y14, with loading factors of 0.577, 0.790, 0.829, 0.864, 0.869, 0.900, 0.744, 0.884, 0.738, 0.832 and 0.832, respectively. This shows that the risk perception of motorcyclists in Malaysia significantly affects their riding behavior. Specifically, risk perception affects one’s risky behavior and whether one takes protective action to ensure safety [21]. The question “How risky do you think taking alcohol before riding is (Y6)” had the highest factor loading among the risk perception statements. Moreover, motorcyclists are also related to their preferences with respect to riding behavior, such as “Taking alcohol before riding (Z6)”, “Run a red light (Z7)”, “Overtaking/turning without using signal lights (Z11)”, “Riding without wearing crash helmet (Z12)”, “Crossing a stop-junction without fully stopping (Z13)” and “Using phone while riding (Z14)”. The factor loadings were 0.574, 0.509, 0.698, 0.781 and 0.693, respectively. The sensation-seeking behavior of motorcyclists negatively affects riding behavior [22]. These results are consistent with previous studies that have also stated that emotions are closely related to risky riding behavior [7,23,24].

4.4. Structural Equation Modeling (SEM)

Model estimation and causal relationship analysis were conducted with the collected data. Subsequently, a statistical model was constructed based on the latent variables’ relations, the relations between the latent variables and the observed variables, and the hypothesis model. 
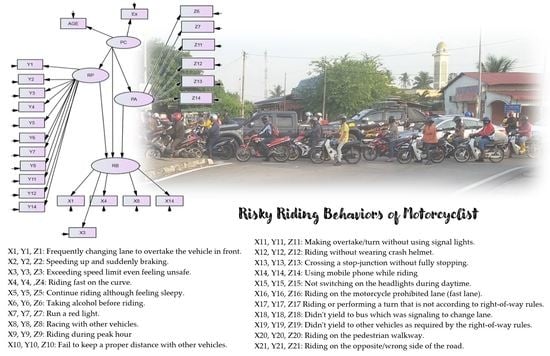
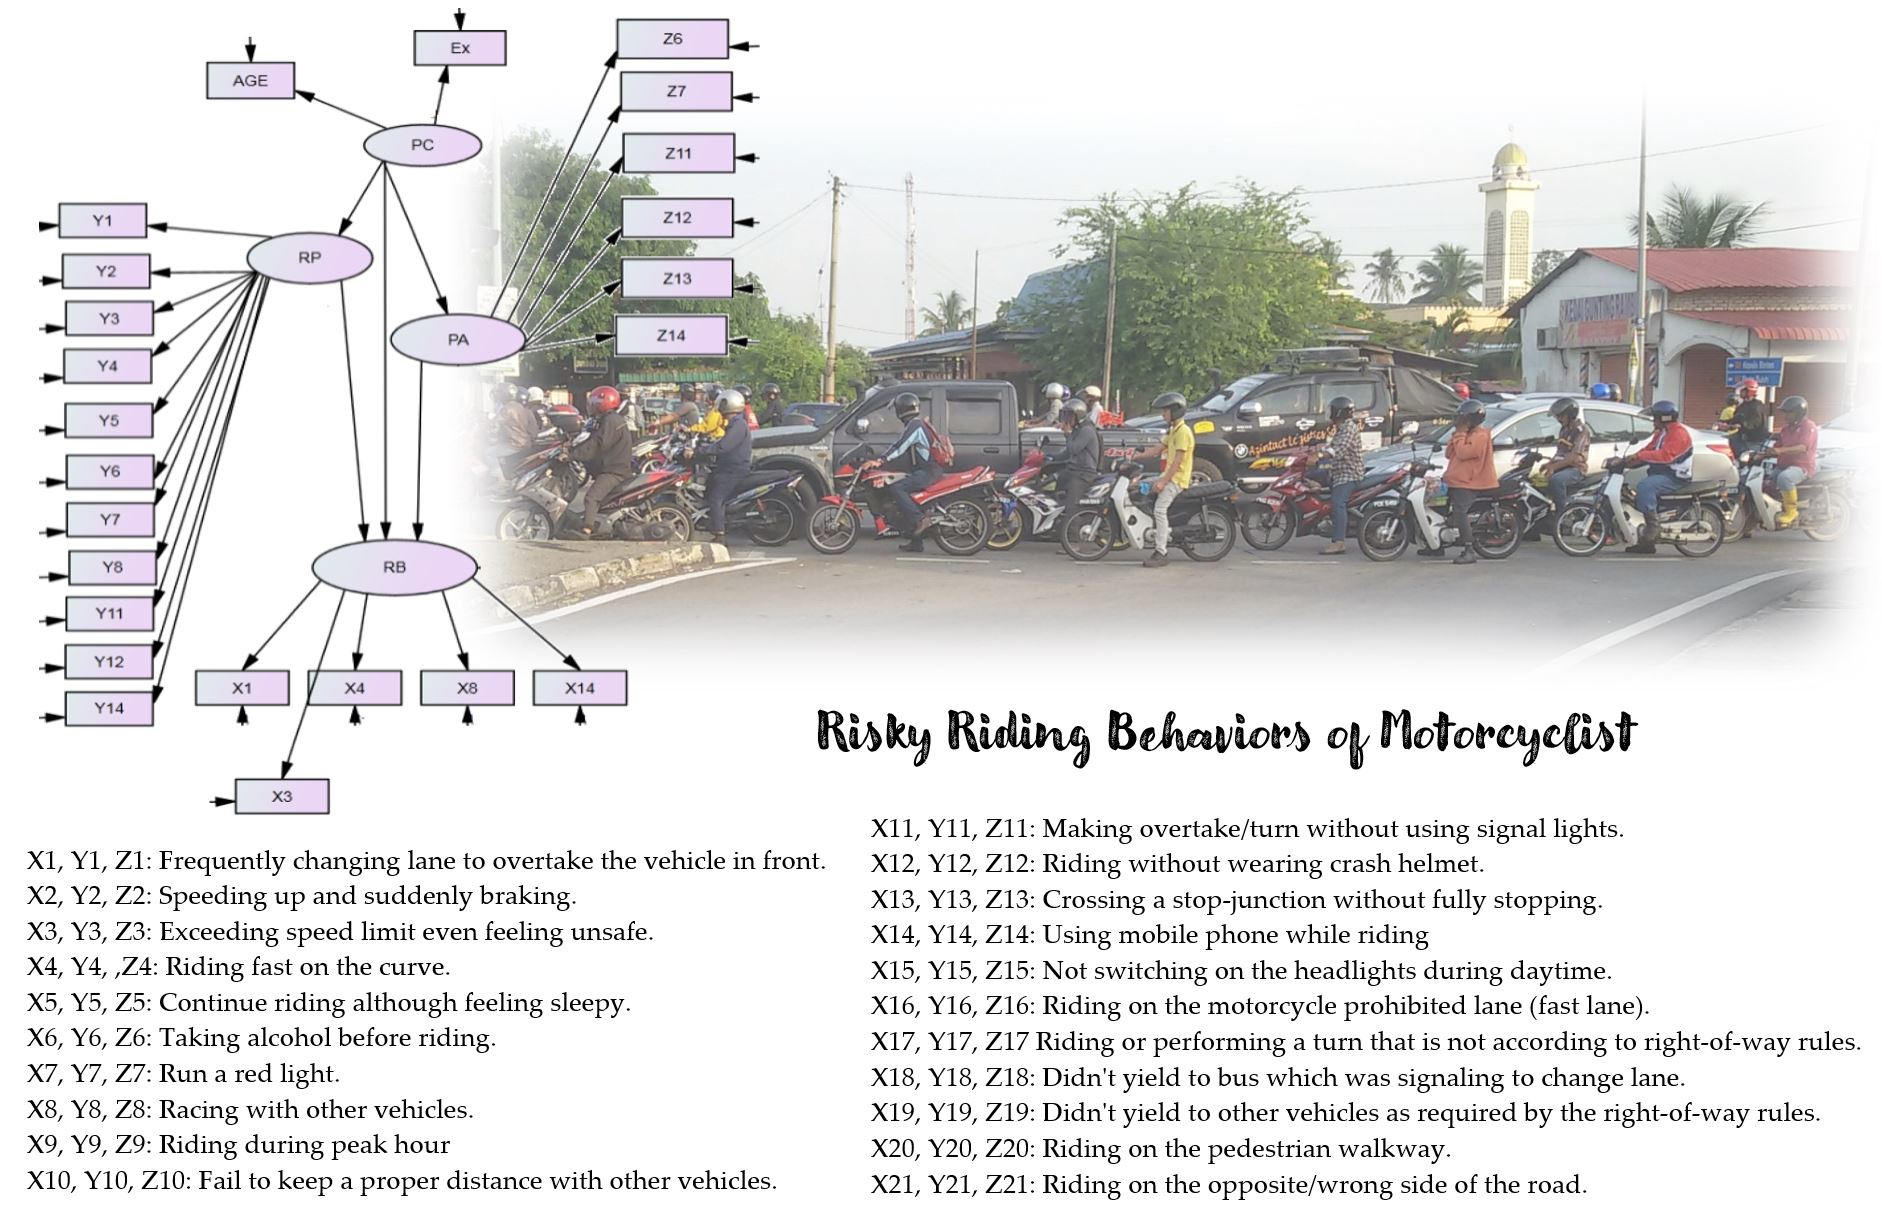
Figure 4 shows the entire relationship among the latent variables and the observed variables in this study, which consist of risk perception (RP), positive affect (PA), risky behavior (RB), and personal characteristics (PC) such as age (AGE) and riding experience (EX).
Hence, a hypothesis model was initially used to investigate the relationship among the latent measures shown in Figure 4 as follows:
Hypothesis 1 (H1).
Risk perception has a negative influence on risky behavior.
Hypothesis 2 (H2).
Positive affect has a positive influence on risky behavior.
Hypothesis 3 (H3).
Positive affect is expected to have a greater influence on risky riding behavior than risk perception.
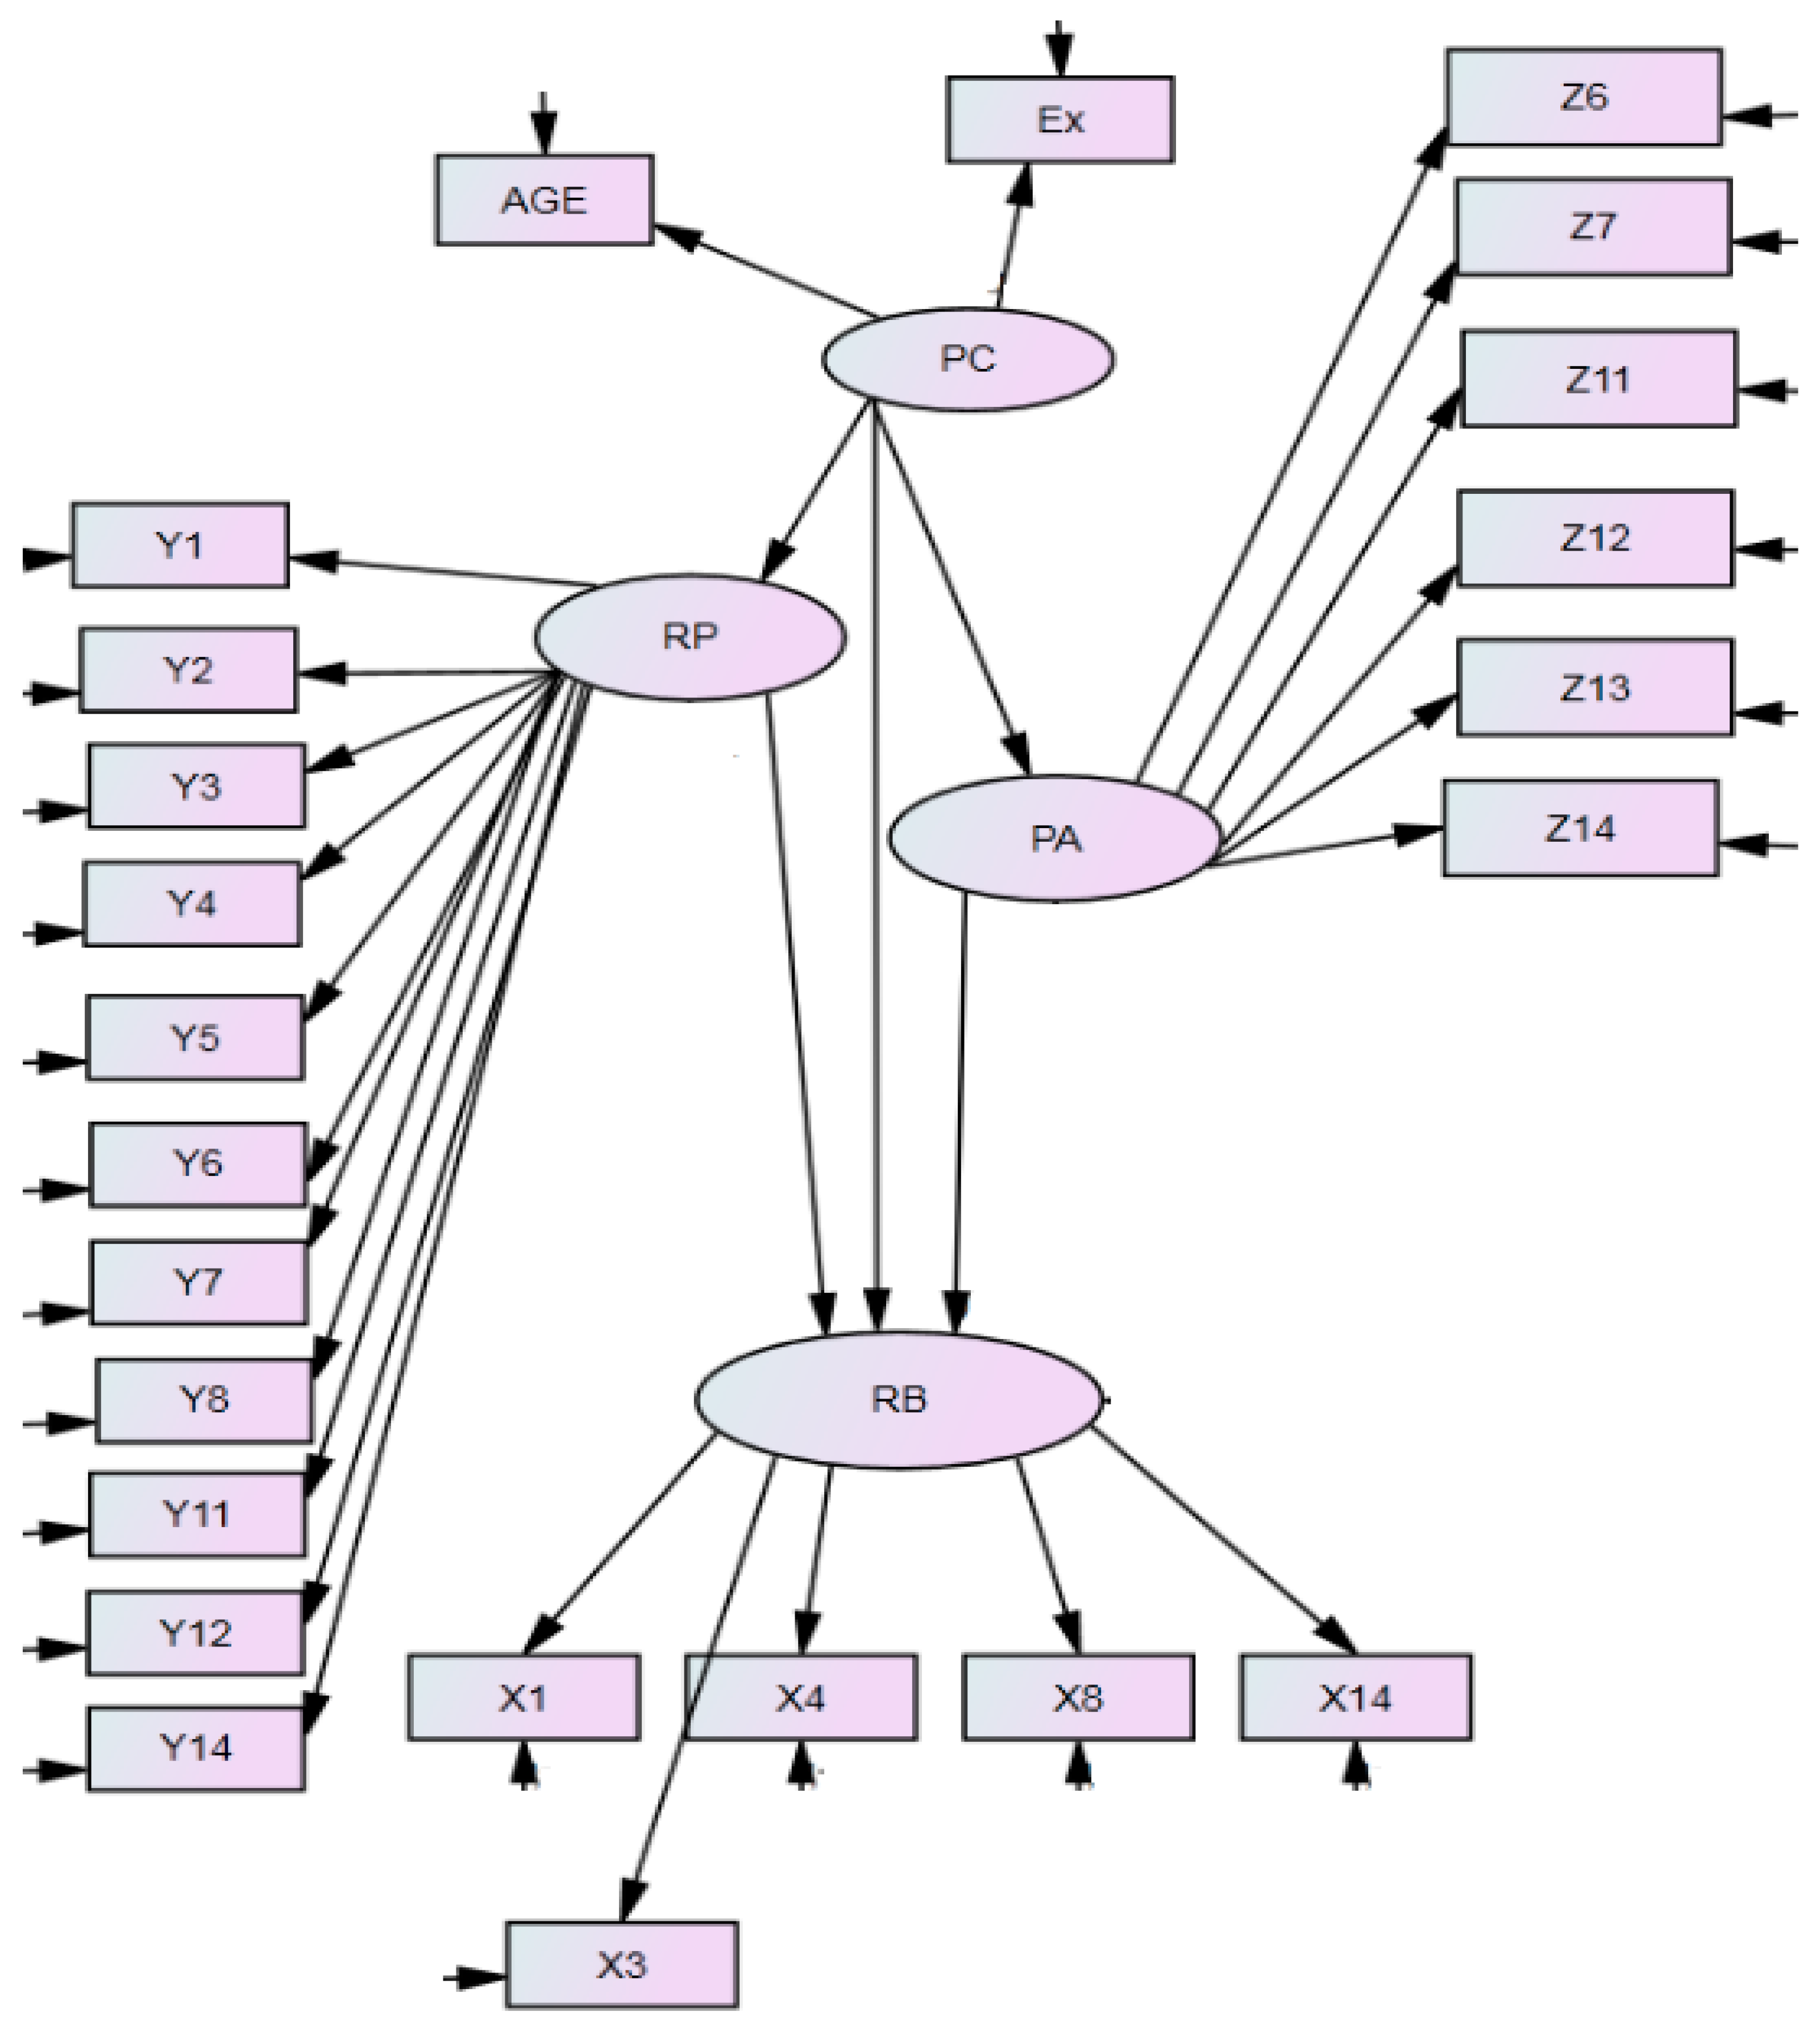
To present the model estimation and causal relationship analysis, a statistical model was constructed based on the latent variables’ relations, the relations between the latent variables and the observed variables, and the hypothesis model. The statistical software IBM SPSS AMOS (Statistical Package for the Social Sciences—AMOS) was used to test the hypotheses based on the complex variable relationships, and to construct a model to present the causal relationships among the variables. The relationships among the measures included three components, as the risk perception and positive affect of motorcyclists are the measures of factors for their risky behavior. In accordance with the completed Principal Component Analysis (PCA), reliability test, and the hypothesis models, the relationships among the three components—risk perception (RP), positive affect (PA) and risky behavior (RB)—and personal characteristics (PC)—which include (AGE) and riding experience (EX)—can be drawn as shown in Figure 5.
The results obtained from SEM indicate an influential path model from two latent variables—motorcyclists’ perception and positive affect—to the other latent variable, risky behavior. The latent variable of risk perception is determined by 11 observed variables. These included Y1 (Frequently changing lane to overtake the vehicle in front.), Y2 (Speeding up and suddenly braking), Y3 (Exceeding speed limit even feeling unsafe), Y4 (Riding fast on the curve), Y5 (Continue riding although feeling sleepy), Y6 (Taking alcohol before riding), Y7 (Run a red light), Y8 (Racing with other vehicles), Y11 (Overtaking/turning without using signal lights), Y12 (Riding without wearing crash helmet), and Y14 (Using mobile phone while riding). Moreover, six observed variables were also determined on latent variable positive affect. The six observed variables consist of Z6 (Taking alcohol before riding), Z7 (Run a red light), Z11 (Overtaking/turning without using signal lights), Z12 (Riding without wearing crash helmet), Z13 (Crossing a stop-junction without fully stopping) and Z14 (Using mobile phone while riding).
The validity criteria from studies conducted by Schermelleh-Engel and Moosbrugger [25] and Lai [26] were used in this study to obtain the goodness of fit of the constructed model. Consequently, indicators such as Normed Fit Index (NFI) and Comparative Fit Index (CFI) values were lower than the cut-off point. However, values such as χ2/df (chi-squared/degree of freedom), Root Mean Square Error of Approximation (RMSEA) and Parsimony-adjusted NFI (PNFI) were statistically acceptable. Table 5 shows the details of the goodness of fit of the constructed model.
Table 6 shows the standardized estimate coefficient of the path analysis model, which indicates the relationship of the observed variables with the latent variables. The model constructed is based on the age, which consists of younger (under 23 years old) and older (more than or equal to 23 years old) communities of motorcyclists. Moreover, the model is constructed based on a variety of respondents’ characteristics, such as male and female motorcyclists, different riding experiences, etc. However, the model results were not significant. This is most probably due to the insufficient sample size for each of the age groups and genders. Thus, if there were to be further studies upon this, the sample size is expected to have an effect on the modeling, mainly with respect to age group and gender.
This study also took the age and riding experience of motorcyclists into consideration for the path analysis. Based on Table 6, it can be seen that the age of the motorcyclists had a negative relationship with risky behavior (estimate = −0.037). This indicates that young motorcyclists more frequently perform risky riding behavior while riding on the road. The findings also show that riding experience has a positive relationship with motorcyclists’ risk perception, with an estimate score of 0.012. This indicates that motorcyclists who have possessed their motorcycle license for longer periods of time are more likely to perceive the behavior as risky and less likely to perform those risky riding behaviors.
Positive affect (estimate = 1.016) was found to have a more significant influence than risk perception on risky behavior. This shows that intuitive processes are a major factor for motorcyclists in Malaysia, rather than rational processes, when they are riding on the road. In a previous study, it was concluded that positive emotions and pleasure in riding (positive affect) strongly affected the risk behavior of riders [19]. Therefore, this study suggests that the positive affect should be thoroughly addressed in a future study with the expectation of figuring out some suggestions for minimizing motorcyclists’ risky riding behavior. These behaviors include taking alcohol before riding, running red lights, overtaking/turning without using signal lights, riding without wearing a crash helmet, crossing stop-junctions without fully stopping, and using phones while riding. The strongest measure of positive affect was crossing a stop-junction without fully stopping, with an estimate value of 0.719. Surprisingly, less than 10% of motorcyclists thought that this was not risky at all. In fact, 5% of motorcyclists enjoy it very much, and around 10% of motorcyclists often or always do it.
Additionally, the relationship path between risk perception and risky behavior was found to be weakly positive (estimated value = 0.036). This risk perception construct consists of 11 components, namely “frequently changing lane to overtake the vehicle in front”, “speeding up and suddenly braking”, “exceeding speed limit even feeling unsafe”, “riding fast on the curve”, “continue riding although feeling sleepy”, “taking alcohol before riding”, “run a red light”, “racing with other vehicles”, “overtaking/turning without using signal lights”, and “riding without wearing crash helmet and using phone while riding”. In a nutshell, these 11 risk perception measures were weakly directly related to riding behavior of motorcyclists. The highest positively influencing measure on risky riding behavior was “Taking Alcohol Before Riding (Y6)”, with a loading factor of 1.112. This is statistically known to be the riskiest riding behavior. Not only that, more than 60% of motorcyclists thought that it was extremely risky, and most of the motorcyclists (around 95% of them) never or rarely done it while riding on the road.
Findings show that positive affect was one of the primary influences of the risky behavior intention of the motorcyclists [5]. This finding indicates that positive affect has a significant influence on a rider’s tendency to engage in risky behavior on the road [27]. This shows that motorcyclists in Malaysia are more inclined to take part in a given dangerous behavior when riding on the roads as a result of positive outcomes resulting from engaging in the risky behavior. In the previous study by Zamani-Alavijeh et al. [24], it was also found that positive affect or personal preference was significantly associated with the intentions to against the traffic rules.
For the most significant measure for risky behavior, “frequently changing lane to overtake the vehicle in front”, with an estimate coefficient value of 0.456, can be described as positively enjoyed and slightly positive perceived by motorcyclists. More than 90% of motorcyclists do this while riding on the road, while less than 5% of motorcyclists perceived it to be extremely risky, and less than 30% of motorcyclists extremely disliked it. Motorcyclists may experience serious injury or have minor crashes with other vehicles on the road as a result of the unstable and unpredictable movement of the vehicle, which increases the probability of accidents. This also indicates that frequently changing lanes to overtake the vehicle in front of the motorcyclist can be attributed to both rational and intuitive processes of motorcyclists’ decision making while riding.
Anonymous surveys that have in-depth and detailed information can be conducted by using a self-reporting technique [14]. Anonymous self-reported surveys provide participants with the opportunity to relate their past involvement in events that were against the traffic rules and regulations. Therefore, in this study, the use of self-reported perceptions, behavior, and positive affect of the motorcyclists while riding on the road is applicable.
Based on the results obtained, increasing awareness of traffic rules and traffic safety could improve the practice of road safety, and this could be provided in schools and universities, households, and workplaces. This mainly involves the civilized values of society [28]. Educational awareness initiatives could reduce the engagement of motorcyclists’ personal riding behavior, such as frequently changing lane to overtake the vehicle in front (estimate value = 0.456), exceeding speed limit even feeling unsafe (estimate value = 0.434), and riding fast on curve (estimate value = 0.406).
Enforcement of traffic rules and regulations is suggested to complement the educational initiatives in order to effectively reduce the number of traffic violations [27]. Thus, this could effectively counter the significant risky riding behavior of the motorcyclists, such as racing with other vehicles (estimate value = 0.347) and using phones while riding (estimate value = 0.297).
Concurrently, findings from this study also show that age and experience are of little significance for any of the three latent variables—risk perception, risky affect, and risky behavior. This finding may be distorted by the age of the majority of the sample, with most respondents being between the ages of 21 and 25. Therefore, in a future study, a higher percentage of riders with higher age and experience should be included to obtain more consistent findings.

5. Conclusions

The relationships among the three latent variables, namely risk perception, positive affect, and risky behavior, were studied. This study found that the latent variables risk perceptions and positive affect had an impact on risky riding behavior. Comparing the three latent variables, risk perception had a weak positive influence on risky riding behavior. It was expected that risk perception would have a negative relation with risky behavior, but based on the results obtained from SEM, the estimated value obtained was positive. This is probably due to the limited sample size, which could have led to inaccuracy in the results.
On the other hand, this study showed there is a significant relationship between risky behavior and positive affect resulting from risky behavior in the region of Malaysia, in particular. Therefore, this study reveals that engagement of Malaysian riders in risky behaviors is mostly affected by the positive emotions resulting from the positive outcomes of the behavior. An example from the results depicting this scenario is that motorcyclists consistently cross stop junctions without fully stopping, although this is risky. This finding provides a possible direction for policymakers to pursue in order to reduce the number of accidents involving motorcyclists by addressing the high degree of positive affect experienced by Malaysian riders.
However, from the findings obtained, risk perception shows a low positive relationship with the risky riding behavior (estimate coefficient = 0.036), which does not really fit the initial expectation. This may be due to the unsatisfactory number of samples collected, which could lead to inaccuracy in the findings.
In fact, not all of the observed variables were considered significant after undergoing PCA. Observed variables that obtained factor loadings lower than 0.5 and also explained less than 20% of the variance of the items were considered to be insignificant.
Nevertheless, a model of estimations and a causal relationship analysis were conducted by constructing a statistical model. SEM was used for the analysis. Based on the model, the relationships among the latent variables risk perception, positive affect, and risky riding behavior were clearly shown. The age and riding experience (i.e., the number of years for which motorcyclists had possessed a riding license) of the motorcyclists were addressed in the model.
Based on the results obtained, the age of the motorcyclists significantly affected their risky behavior, with an estimate coefficient of −0.037. This shows that elderly motorcyclists seldom perform risky riding behavior while riding on the road. Additionally, riding experience had a positive relationship with motorcyclists’ risk perception (estimate coefficient = 0.012) and a negative relationship with positive affect (estimate coefficient = −0.032). This shows that motorcyclists that have only recently obtained their motorcycle license tend to think that the behaviors in question have lower risk and are more likely to engage in a the particular risky riding behavior.
The following suggestions and recommendations are put forward to improve the further study of related research on risky riding behavior with respect to motorcyclists’ personal preferences and risk perception:
  • Larger sample size is required to ensure the accuracy of the results obtained. The greater the amount of data obtained, the more accurate the analysis process will be.
  • The gender of the respondents should be controlled so that both genders of respondents have a balanced number.
  • As the results indicate that risk perception has a low positive relationship with risky riding behavior (estimate coefficient = 0.036), which was not expected, this study could be further improved through the collection of an increased number of samples, which should provide a more consistent finding.
  • Further investigations to improve the findings can be done by developing an SEM model which includes the riders’ perspectives of positive or negative outcomes along with the factors that induce or hinder this.

Author Contributions

Conceptualization, W.C.G. and L.V.L.; methodology, L.V.L.; software, R.J.X.C.; validation, L.V.L., W.C.G. and R.J.X.C.; formal analysis, R.J.X.C.; investigation, R.J.X.C.; resources, L.V.L.; data curation, R.J.X.C.; writing—original draft preparation, W.C.G.; writing—review and editing, LV.L.; visualization, W.C.G.; supervision, LV.L.; project administration, L.V.L. All authors have read and agreed to the published version of the manuscript.

Funding

This research received no external funding.

Acknowledgments

The authors wish to express their sincere gratitude to the School of Civil Engineering, Universiti Sains Malaysia, for the support.

Conflicts of Interest

The authors declare no conflict of interest.

References

  1. Loo, P.Y.; Hung, W.T.; Lo, H.K.; Wong, S.C. Road safety strategies: A comparative framework and case studies. Transp. Rev. 2005, 25, 613–639. [Google Scholar] [CrossRef]
  2. Elliott, M.A. Predicting motorcyclists’ intentions to speed: Effects of selected cognition from the theory of planned behaviour, self-identity and social identity. Accid. Anal. Prev. 2010, 42, 718–725. [Google Scholar] [CrossRef] [PubMed]
  3. Karim, M.R.; Abdullah, S.; Marjan, J. Road safety audit—Issues and challenges from the Malaysian experience. J. East. Asia Soc. Transp. Stud. 2003, 5, 2526–2537. [Google Scholar]
  4. Radin, U.R.S.; Mackay, G.M.; Hills, B.L. Preliminary analysis of motorcycle accidents: Short-term impacts of the running headlights campaign and regulation in Malaysia. J. Traffic Med. 1995, 23, 17–28. [Google Scholar]
  5. Abdul Manan, M.M.; Varhely, A. Motorcycle fatalities in Malaysia. IATSS Res. 2012, 36, 30–39. [Google Scholar] [CrossRef] [Green Version]
  6. Hung-Jung, C.; Yuh-Ting, W. Modeling and simulation of motorcycle traffic flow. In Proceedings of the IEEE International Conference on Systems, Man and Cybernetics, The Hague, Netherlands, 10–13 October 2004; pp. 6262–6267. [Google Scholar]
  7. Wedegama, D. Analysing self-reported risky behaviours of motorcyclists in Bali using Structural Equation Modelling. J. East. Asia Soc. Transp. Stud. 2015, 11, 2015–2027. [Google Scholar]
  8. Moss, A.C.; Albery, I.P. A dual-process model of the alcohol-behavior link for social drinking. Psychol. Bull. 2009, 135, 516–530. [Google Scholar] [CrossRef] [PubMed]
  9. Sultan, Z.; Ngadiman, N.I.; Kadir, F.D.A.; Roslan, N.F.; Moeinaddini, M. Factor analysis of motorcycle crashes in Malaysia. J. Malays. Inst. Plan. 2016, 14, 135–146. [Google Scholar] [CrossRef] [Green Version]
  10. McCartt, A.T.; Mayhew, D.R.; Braitman, K.A.; Ferguson, S.A.; Simpson, H.M. Effects of age and experience on young driver crashes. Traffic Inj. Prev. 2009, 10, 209–219. [Google Scholar] [CrossRef]
  11. Bulmer, M. Questionnaires, Sage Benchmarks in Social Science Research Methods; Sage Publications: London, UK, 2004; p. 354. [Google Scholar]
  12. Scott-Parker, B.; Watson, B.; King, M.J. Understanding the psychosocial factors influencing the risky behaviour of young drivers. Transp. Res. Part F Traffic Psychol. Behav. 2009, 12, 470–482. [Google Scholar] [CrossRef] [Green Version]
  13. Nancy, R.; Pivik, K. Age and gender differences in risky driving: The roles of positive affect and risk perception. Accid. Anal. Prev. 2011, 43, 923–993. [Google Scholar]
  14. Carlson, N.R. Psychology: The Science of Behavior; Pearson: Toronto, ON, Canada, 2009. [Google Scholar]
  15. Hassan, H.M.; Abdel-Aty, M.A. Exploring the safety implications of young drivers’ behavior, attitudes and perceptions. Accid. Anal. Prev. 2013, 50, 361–370. [Google Scholar] [CrossRef] [PubMed]
  16. Loo, L.Y.L.; Corcoran, J.; Mateo-Babiano, D.; Zahnow, R. Transport mode choice in South East Asia: Investigating the relationship between transport users’s perception and travel behaviour in Johor Bahru, Malaysia. J. Transp. Geogr. 2015, 46, 99–111. [Google Scholar] [CrossRef]
  17. Shaw, P.J.A. Multivariate Statistics for the Environmental Sciences; Hodder Education: London, UK, 2003. [Google Scholar]
  18. Fyhri, A.; Backer-Grøndahl, A. Personality and risk perception in transport. Accid. Anal. Prev. 2012, 49, 470–475. [Google Scholar] [CrossRef] [PubMed]
  19. Hooper, D.; Coughlan, J.; Mullen, M. Structural equation modelling: Guidelines for determining model fit. Electron. J. Bus. Res. Methods 2008, 6, 53–60. [Google Scholar]
  20. Steg and Brussel, Accidents, aberrant behaviours, and speeding of young moped riders. Transp. Res. Part F 2009, 12, 503–511. [CrossRef]
  21. Brewer, N.T.; Weinstein, N.D.; Cuite, C.L.; Herrington, J.E. Risk perceptions and their relation to risk behavior. Ann. Behav. Med. 2004, 27, 125–130. [Google Scholar] [CrossRef]
  22. Ulleberg, P.; Rundmo, T. Personality, attitudes and risk perception as predictors of risky driving behaviour among young drivers. Saf. Sci. 2003, 41, 427–443. [Google Scholar] [CrossRef]
  23. Romero, D.L.; De Barros, D.M.; Belizario, G.O.; Serafim, A.D.P. Personality traits and risky behavior among motorcyclists: An exploratory study. PLoS ONE 2019, 14, e0225949. [Google Scholar] [CrossRef]
  24. Zamani-Alavijeh, F.; Niknami, S.; Bazargan, M.; Mohammadi, F.; Montazeri, A.; Ahmadi, F.; Ghofranipour, F. Accident-related risk behaviors associated with motivations for motorcycle use in Iran: A Country with very high traffic deaths. Traffic Inj. Prev. 2009, 10, 237–242. [Google Scholar] [CrossRef]
  25. Schermelleh-Engel, K.; Moosbrugger, H. Evaluating the fit of structural equation models: Tests of significance and descriptive goodnessof-fit measures. Methods Psychol. Res. Online 2003, 8, 23–74. [Google Scholar]
  26. Lai, S.F. The accident risk measuring model for urban arterials. In Proceedings of the 3rd International Conference on Road Safety and Simulation, Indianapolis, IN, USA, 14–16 September 2011. [Google Scholar]
  27. Wedagama, D.M.P. Local motorcyclists’ intentions towards traffic violations and speeding. J. East. Asia Soc. Transp. Stud. 2017, 12, 1871–1883. [Google Scholar]
  28. Chakrabarty, N.; Gupta, K.; Bhatnagar, A. A survey on awareness of traffic safety among drivers in Delhi, India. Stand. Int. J. Trans. Ind. Financ. Bus. Manag. 2013, 1, 106–111. [Google Scholar] [CrossRef]
Figure 1. Flowchart of study methodology.
Applsci 10 06608 g001
Figure 2. Self-report of most frequently engaged-in risky behavior.
Applsci 10 06608 g002
Figure 3. Self-report results (mean value) (a) risk perception; (b) positive affect; (c) risky behavior.
Applsci 10 06608 g003
Figure 4. Relationship model of the study.
Applsci 10 06608 g004
Figure 5. Relationship of latent variables components in Structural Equation Modeling (SEM).
Applsci 10 06608 g005
Table 1. Behavior measures and variable codes.
No.Behavior MeasuresVariable Code
Risky BehaviorRisk PerceptionPositive Affect
1Frequently changing lane to overtake the vehicle in front.X1Y1Z1
2Speeding up and suddenly braking.X2Y2Z2
3Exceeding speed limit even when feeling unsafe.X3Y3Z3
4Riding fast on the curve.X4Y4Z4
5Continue riding although feeling sleepy.X5Y5Z5
6Taking alcohol before riding.X6Y6Z6
7Run a red light.X7Y7Z7
8Racing with other vehicles.X8Y8Z8
9Riding during peak hour.X9Y9Z9
10Fail to keep a proper distance with other vehicles.X10Y10Z10
11Overtaking/turning without using signal lights.X11Y11Z11
12Riding without wearing crash helmet.X12Y12Z12
13Crossing a stop-junction without fully stopping.X13Y13Z13
14Using mobile phone while riding.X14Y14Z14
15Not switching on the headlights during daytime.X15Y15Z15
16Riding on the motorcycle prohibited lane (fast lane).X16Y16Z16
17Riding or performing a turn that is not according to right-of-way rules in order to save time.X17Y17Z17
18Not yielding to busses that are signaling to change lane.X18Y18Y18
19Not yielding to other vehicles as required by the right-of-way rules.X19Y19Y19
20Riding on the pedestrian walkway.X20Y20Z20
21Riding on the opposite/wrong side of the road.X21Y21Z21
Table 2. Mean and standard deviation (S.D.) of each observed variable.
Risky BehaviorRisk PerceptionPositive Affect
MeanS.D.MeanS.D.MeanS.D.
Frequently changing lane to overtake the vehicle in front.2.9411.2143.6181.1362.6421.238
Speeding up and suddenly braking.2.1420.9283.9361.1661.9411.035
Exceeding speed limit even feeling unsafe.2.0741.1313.8731.2412.0691.134
Riding fast on the curve.1.9950.974.0591.2022.0691.181
Continue riding although feeling sleepy.2.0491.1224.0191.2671.7060.826
Taking alcohol before riding.1.2110.5874.2011.3141.3480.75
Run a red light.2.0201.0963.8971.2531.9211.024
Racing with other vehicles.1.5000.8744.0541.2451.7351.036
Riding during peak hour.3.2161.2453.0151.1292.2651.14
Fail to keep a proper distance with other vehicles.2.2061.0163.6031.1512.010.915
Overtaking/turning without using signal lights.1.8870.9683.7751.2071.8140.965
Riding without wearing crash helmet.1.6080.9334.1231.2361.731.046
Crossing a stop-junction without fully stopping.2.1911.1093.6321.1562.1381.128
Using mobile phone while riding.1.5490.8724.0881.2331.7211.029
Not switching on the headlights during daytime.1.9311.3452.9361.3682.2401.230
Table 3. Reliability test (Cronbach’s Alpha) of the self-reported variables.
Latent VariablesCronbach’s Alpha
Risky Behaviors (X)0.833
Risk Perception (Y)0.945
Positive Affect (Z)0.889
Table 4. Variables and reliability analysis of latent and observed variables.
Latent VariableObserved VariableVariable CodeLoading FactorVariance ExplainedCronbach’s Alpha
Risk PerceptionFrequently changing lane to overtake the vehicle in front.Y10.57760.13%0.945
Speeding up and suddenly braking.Y2
Exceeding speed limit even feeling unsafe.Y30.79
Riding fast on the curve.Y4
Continue riding although feeling sleepy.Y50.829
Taking alcohol before riding.Y6
Run a red light.Y70.864
Racing with other vehicles.Y8
Overtaking/turning without using signal lights.Y110.869
Riding without wearing crash helmet.Y12
Using mobile phone while riding.Y140.900
Positive AffectTaking alcohol before riding.Z60.57441.40%0.889
Run a red light.Z70.509
Overtaking/turning without using signal lights.Z110.698
Riding without wearing crash helmet.Z120.781
Crossing a stop-junction without fully stopping.Z130.693
Using mobile phone while riding.Z140.654
Risky BehaviorFrequently changing lane to overtake the vehicle in front.X10.58031.49%0.833
Exceeding speed limit even feeling unsafe.X30.653
Riding fast on the curve.X40.669
Racing with other vehicles.X80.651
Using mobile phone while riding.X140.556
Table 5. Goodness-of-fit measures of the developed model.
Measures of FitDeveloped ModelAcceptable Fit Values
Model Chi-squaredχ2941.2-
Degrees of Freedomdf229-
Probability Valuep-value0<0.05
Model Chi-squared/Degrees of Freedomχ2/df4.11<5
Root Mean Square Error of ApproximationRMSEA0.074<0.08
Normed Fit IndexNFI0.5950 < NFI < 1, closer to 1 is better
Comparative Fit IndexCFI0.6460 < CFI < 1, closer to 1 is better
Goodness of Fit IndexGFI0.9260.90 ≤ GFI ≤ 0.95
Adjusted Goodness of Fit IndexAGFI0.8520.85 ≤ GFI ≤ 0.90
Parsimony-adjusted NFIPNFI0.590>0.5
Table 6. Standardized coefficient weight of the developed model.
PathEstimatep-Values
Risky Behavior ← Age−0.0370.754
Risk Perception ← Riding Experience0.0120.871
Positive Affect ← Riding Experience−0.0320.709
Risky Behavior ← Risk perception0.0350.767
Risky Behavior ← Positive Affect1.016***
Y1 ← Risk perception0.728***
Y2 ← Risk perception0.893***
Y3 ← Risk perception1.009***
Y4 ← Risk perception1.000***
Y5 ← Risk perception1.062***
Y6 ← Risk perception1.111***
Y7 ← Risk perception0.978***
Y8 ← Risk perception1.023***
Y11 ← Risk perception0.921***
Y12 ← Risk perception0.984***
Y14 ← Risk perception0.990***
Z6 ← Positive Affect0.347***
Z7 ← Positive Affect0.581***
Z11 ← Positive Affect0.629***
Z12 ← Positive Affect0.620***
Z13 ← Positive Affect0.715***
Z14 ← Positive Affect0.625***
X1 ← Risky Behavior0.456***
X3 ← Risky Behavior0.434***
X4 ← Risky Behavior0.406***
X8 ← Risky Behavior0.347***
X14 ← Risky Behavior0.297***
*** p-values < 0.01.

