Article

Research on Strength Prediction Model of Sand-like Material Based on Nuclear Magnetic Resonance and Fractal Theory

School of Resources and Safety Engineering, Central South University, Changsha 410083, China
*
Author to whom correspondence should be addressed.
Appl. Sci. 2020, 10(18), 6601; https://doi.org/10.3390/app10186601
Submission received: 14 August 2020 / Revised: 12 September 2020 / Accepted: 18 September 2020 / Published: 21 September 2020
(This article belongs to the Special Issue Advances in Design, Repair and Materials of Structural Concrete)

Abstract

:
Micro-pore structure has a decisive effect on the physical and mechanical properties of porous materials. To further improve the composition of rock-like materials, the internal relationship between microscopic characteristics (porosity, pore size distribution) and macroscopic mechanical properties of materials needs to be studied. This study selects portland cement, quartz sand, silica fume, and water-reducing agent as raw materials to simulate sandstone. Based on the Nuclear magnetic resonance (NMR) theory and fractal theory, the study explores the internal relationship between pore structure and mechanical properties of sandstone-like materials, building a compressive strength prediction model by adopting the proportion of macropores and the dimension of macropore pore size as dependent variables. Test results show that internal pores of the material are mainly macropores, and micropores account for the least. The aperture fractal dimension, the correlation coefficient of mesopores and macropores are quite different from those of micropores. Fractal characteristics of mesopores and macropores are obvious. The macropore pore volume ratio has a good linear correlation with fractal dimension and strength, and it has a higher correlation coefficient with pore volume ratio, pore fractal dimension and other variable factors. The compressive strength increases with the growth of pore size fractal dimension, but decreases with the growth of macropore pore volume ratio. The strength prediction model has a high correlation coefficient, credibility and prediction accuracy, and the predicted strength is basically close to the measured strength.

1. Introduction

In the face of a large number of geotechnical engineering problems at present, it has become the main means to carry out rock-like test research of simulated field raw rocks by selecting raw materials with wide sources, safety and environmental protection and low cost. Field testing has important theoretical guidance and engineering significance for engineering design and construction. Rock-like material is a kind of rock similar material wrapping up aggregate [1], which is formed by complex chemical reactions of cementitious material, aggregate, admixture and water. Mechanical properties of the material mainly depend on the compactness of the specimen and the internal pore microstructure. Many studies have proved that there is a strong relationship between pore structure and strength in natural and artificial porous materials, and the existence of pores has a great influence on physical properties of rocks [2,3,4]. Research into the effect of pore microscopic characteristics on mechanical properties can help us to improve our understanding of materials. Therefore, it is necessary to analyze and study the relationship between pore structure and mechanical properties of rock-like materials.
In recent years, the research on micro-pore structure detection of porous materials has been developing rapidly. At present, the methods of micro-pore detection in rocks include mercury injection test (MICP), scanning electron microscope (SEM), nuclear magnetic resonance (NMR), etc. Among them, MICP can characterize the spatial structure of rock pores and determine the pore size distribution of different pores, and SEM is mainly used for high-resolution two-dimensional imaging of rock specimens and characterization of microscopic pore morphology. Many scholars have carried out experimental research in related directions combined with detection methods. Mukhamet-dinova [5] confirmed the existence of two main types of pores in complex carbonate reservoir rock samples by MICP, NMR and SEM. Zhou [6] and Yang [7] quantitatively characterized the distribution of micro-pore structure in tight sandstone from multiple angles of SEM, high-pressure mercury injection and other detection methods. Marszałeks [8] studied the internal microstructure of cement mortar building materials by means of SEM, MICP and other methods of microscopic pore measurement. Nuclear magnetic resonance (NMR) testing is non-destructive testing technology which has gained rapid development in recent years, and has been widely used in the characterization of rock pore microstructure. Many scholars have taken NMR as the main research method and carried out experimental studies on the microstructure and mechanical properties of rock materials. Zhang [9] and Deng [10] discussed the micro-pore structure evolution of sandstone under freeze-thaw cycles by NMR analysis. Liu [11] and Jiang [12] carried out the cyclic freeze-thaw test and cyclic dynamic impact test on granite and sandstone, studying the microporosity changes of different rocks under cyclic impact by NMR. Li [13,14,15,16] carried out laboratory freeze–thaw cycle tests on sandstone materials at different cycle numbers and studied the pore structure evolution and fractal characteristics of pores with different radius under freeze–thaw cycles were studied by NMR and imaging analysis. Yu [17] used NMR to study the changes of porosity and pore size distribution of sandstone samples under the coupling of the freeze-thaw cycle and acidic solution. Sun [18] combined NMR and electron micrography to analyze the internal relationship between the micro-pore changes and macro mechanical properties of slope rocks under rainfall conditions.
With the deepening of research, many scholars have found that macroscopic mechanical properties of materials not only depend on porosity but also the pore distribution of different internal radii [19,20,21]. Jin [22] analyzed the correlations among pore volume, pore size distribution and material bearing strength, and established the prediction model of compressive strength of hardened mortar. Gao [23] combined multiple linear regression with grey correlation analysis, and studied the influence of pore size distribution and porosity on the compressive strength of materials in mortar. Bu [24] obtained the pore volume and pore size distribution of concrete specimens with different proportions by mercury pressing experiment, then established the statistical model of microscopic characteristics (porosity and pore size distribution) and compressive strength. At present, experimental studies on the microstructure (porosity, pore size distribution) and macroscopic mechanical properties of porous materials are mainly analyzed by mercury intrusion test, while the mercury intrusion test not only causes damage to the internal pore structure but also can not reflect 100% of the pore space distribution information adequately. Compared with the traditional mercury intrusion test, the NMR test can quickly and non-destructively obtain 100% pore spatial distribution information inside the material. Therefore, the study of rock-like rocks based on the NMR test will be helpful to grasp the internal relationship between pore structure distribution and mechanical properties.
With the development of fractal theory, it has been widely used in the field of porous materials pore structure complexity and irregular characterization [25,26,27]. Hu [28] studied and analyzed the relationship among the pore structure, fractal dimension and strength of the stone silt tailings backfill. Qing [29] analyzed the relationship among pore fractal dimension, compressive strength and permeability of wollastonite concrete by mercury pressing test and electron microscope scanning test. Zhang [30] carried out the mercury pressing test and X-ray diffraction test on compacted concrete materials and discussed the microstructure and fractal characteristics. Zhang [31] studied the influence of electric breakdown energy on the microstructure, and the fractal dimensions of coal block was studied by means of NMR. Hazraa [32] discussed the relationships between pore structure, fractal dimension and material thermal maturity of India shale by systematic analysis.
Based on NMR and fractal theory, this study deeply studies and analyzes the internal relationship between microscopic pore structure characteristics and macroscopic mechanical properties of sand-like materials by carrying out the proportion test of sandstone-like materials, and establishes a strength prediction model based on the porosity and pore size distribution of rock-like materials, thereby providing reference and innovation space for the subsequent research on rock-like materials related experiments.

2. Materials and Methodology

2.1. Raw Material Selection and Test Scheme

The selection of raw materials will also affect the accuracy of the test. Based on current research results of sandstone-like materials at domestic and abroad [33,34], portland cement(P·O42.5) was selected as the cementing material in the experiment. For a better simulation of the dense structure of sandstone, the natural river sand with 0.5–1 mm particle size was chosen as aggregate. Its approximate spherical shape and smooth texture can make the cementitious material fully wrapped. Admixture is an indispensable component in the production of cementitious materials at present, which has a great influence on physical properties (bonding strength and bearing strength) of cementitious materials [35,36]. High purity silicon powder and naphthalene superplasticizer were selected as the admixture. Specific parameters of experimental raw materials are shown in Table 1 and Table 2.
Water-cement ratio, sand-cement ratio and admixture were used to carry out the experiment design and comparative tests, and pore structure characteristics of sandstone-like materials vary with these variables changes. The variation range of factors is shown in Table 3.

2.2. Materials Production and Testing

Specimens were produced and tested with following procedures.
(1) Raw materials weighing. According to the experimental scheme, the specimens were prepared by weighing ordinary portland cement, quartz sand, silica powder, water-reducing agent and tap water in turn.
(2) Mixing and filling. Mix prepared ingredients and fill it into the prepared cylindrical test mold with an inner wall diameter of 50 mm and a height of 100 mm according to Rock Test Rules for Water Conservancy and Hydropower Projects (SL/T 264-2020) [37].
(3) Vibrating. Put the filled test molds on the vibration table of the laboratory to vibrate the specimen until the end of the surface slurry.
(4) Demoulding, numbering and curing. The solidified specimen was demoulded and statically set for 48 h. Specimens were numbered and put into the standard test automatic curing box with temperature 22 °C and relative humidity 98% for 28 days.
(5) Experimental testing. The size and weight of cured sandstone-like specimens were measured separately to obtain the material density. HS-YS4A rock acoustic parameter tester was used to test the acoustic wave velocity of the specimen. The microscopic porosity and pore size distribution parameters of test materials were obtained by the AiniMR-150 rock NMR analysis system [17]. Uniaxial compression test was carried out on the SHA4206 microcomputer controlled electro-hydraulic servo tester with a loading rate of 1 KNs−1, The calculation formula of uniaxial compressive strength is as follows [37]:
σ = F A
In the formula, σ is the uniaxial compressive strength of sandstone-like material (MPa), F is the peak load (N), and A is the section area of the specimen (mm2).Intuitive procedures is shown in Figure 1 as follows.

2.3. Calculation of Fractal Dimensions Based on the Transformation of Pore Radius of NMR

According to basic principles of nuclear magnetic detection [15], the surface relaxation can be expressed as:
1 T 2 =   ρ 2 ( S V ) pore
Internal pores of the rock are often simplified as spherical pores in NMR testing, and Formula (1) can be expressed as:
1 T 2 = ρ 2 F s r c
In Equations (2) and (3), ( S V ) pore is the ratio of pore surface area to volume, Fs is the pore shape factor (for spherical pore, Fs = 3), rc is the pore radius. ρ 2 represents the surface relaxation strength of T2, which mainly depends on the mineral composition of the rock and properties of the pore surface. Based on literature [38] test results of rock surface relaxation strength with high silicate mineral content are selected, and the value of ρ2 is 0.0045, C is Fs × ρ2, namely, C = 0.0135. The value of C is also consistent with the value of C (0.01–0.015 μm/ms) of most sandstones in China [15]. Therefore, Formula (3) can be expressed as:
r c = CT 2 = 0.0135 T 2
According to Formula (4), the pore radius of rock is a one-to-one correspondence with the value of T2, and T2 distribution of measured pores represents the pore size distribution of rock. Many scholars have discussed and analyzed the classification of pore structure in rock and put forward various methods. Referring to research results of the classification of sandstone pore structure [9,39], this study divides internal pores of the material into three types: micropore (pore radius < 0.1 μm), mesopore (0.1 μm < pore radius < 1 μm), macroporous (pore radius > 1μm), the specific division is shown in Figure 2.
Furthermore, T2 spectral area is an important parameter reflecting the number of pores with different radius, it can quantitatively describe the distribution of pores in the total pores of different structural types within the rock. The ratio of pores with different radii can be expressed as follows:
P ( r ) =   S ( r ) S ( all )   =   r lower   limit r upper   limit f ( r ) dr r min r max f ( r ) dr .  
In Formula (5), f(r) is distribution curve of the saturated pore component, S ( r ) represents the surface area surrounded by different pore radius and f(r), and S ( all ) is the total area of the surface formed by pore radius and f(r) r max , r min is the maximum and minimum pore radius respectively. Calculation results of pore classification are shown in Table 4.
Research results of fractal theory [40,41,42,43,44] show that the internal pore structure of porous materials such as rock and concrete has obvious fractal characteristics, and the ratio of pore cumulative volume (pore radius < r) to pore volume (Sv) and T2 accords with the following expressions:
ln ( S v ) = ( 3 D ) [ ln ( T 2 c ) ln ( T max ) ]
Formula (6) shows that if the pore size distribution of the material conforms to the fractal geometric characteristics, there is a linear correlation between ln (Sv) and ln (Tmax). Accordingly, the fractal dimension of pore size distribution can be calculated by linear regression analysis, and results are shown in Table 5.

3. Analysis of Test Results

Based on the calculated results of pore classification and fractal dimension of pore size, the variation range of pore volume ratio and fractal dimensions of pore size of sandstone-like materials is calculated. Statistical results are shown in Table 6.
Table 6 shows that the pore distribution in sandstone-like materials is mainly macroporous. macropores occupy the biggest proportion of total porosity, account for 73.65 % of total porosity, then followed by mesoporous pore, account for 15.54 %, and microporous pore is the least, account for only 10.82% of the total porosity. Except for the fractal dimension of individual micropore is lower than 0.70, the correlation coefficient R2 of fractal dimension of other apertures are greater than 0.70, which indicates that calculation results of fractal dimension of aperture have high reliability in this study. Meanwhile, the fractal dimension and correlation coefficient of pore size increase with the growth of pore radius. The mean fractal dimension of mesopores and macropores are higher than 0.9436, and the mean value of correlation coefficient are higher than 0.9425, while mean values of fractal dimension and correlation coefficient of microporous pore are only 1.5406 and 0.7026. The data difference shows that the mesopore and macropore of sandstone-like materials have obvious fractal characteristics.
To verify the correlation between the ratio of different pore volume, the fractal dimension of pore size and the compressive strength of materials, the correlation coefficient between variable factors and strength are calculated, and the corresponding scatter plot are drawn and shown in Figure 3 and Figure 4. According to the correlation analysis of fractal dimension and strength of different pore sizes, correlation coefficients of fractal dimension and strength of micropore, mesopore and macropore are 0.95, 0.80 and 0.76, respectively. Combined with the scatter plot of fractal dimension and compressive strength of Figure 3, it can be found that the fractal dimension of micropore, mesopore and macropore are positively correlated with compressive strength, in which the fractal dimension of micropore has a high linear correlation with compressive strength, while the fractal dimension of the mesopore and macroporous aperture has low correlation coefficient with the strength, and the distribution of most scattered points is consistent with the trend of linear increase, but individual points deviate from the main trend line. To simplify the model calculation, the relationship between fractal dimension and compressive strength of mesopores and macropores is considered as a linear positive correlation.
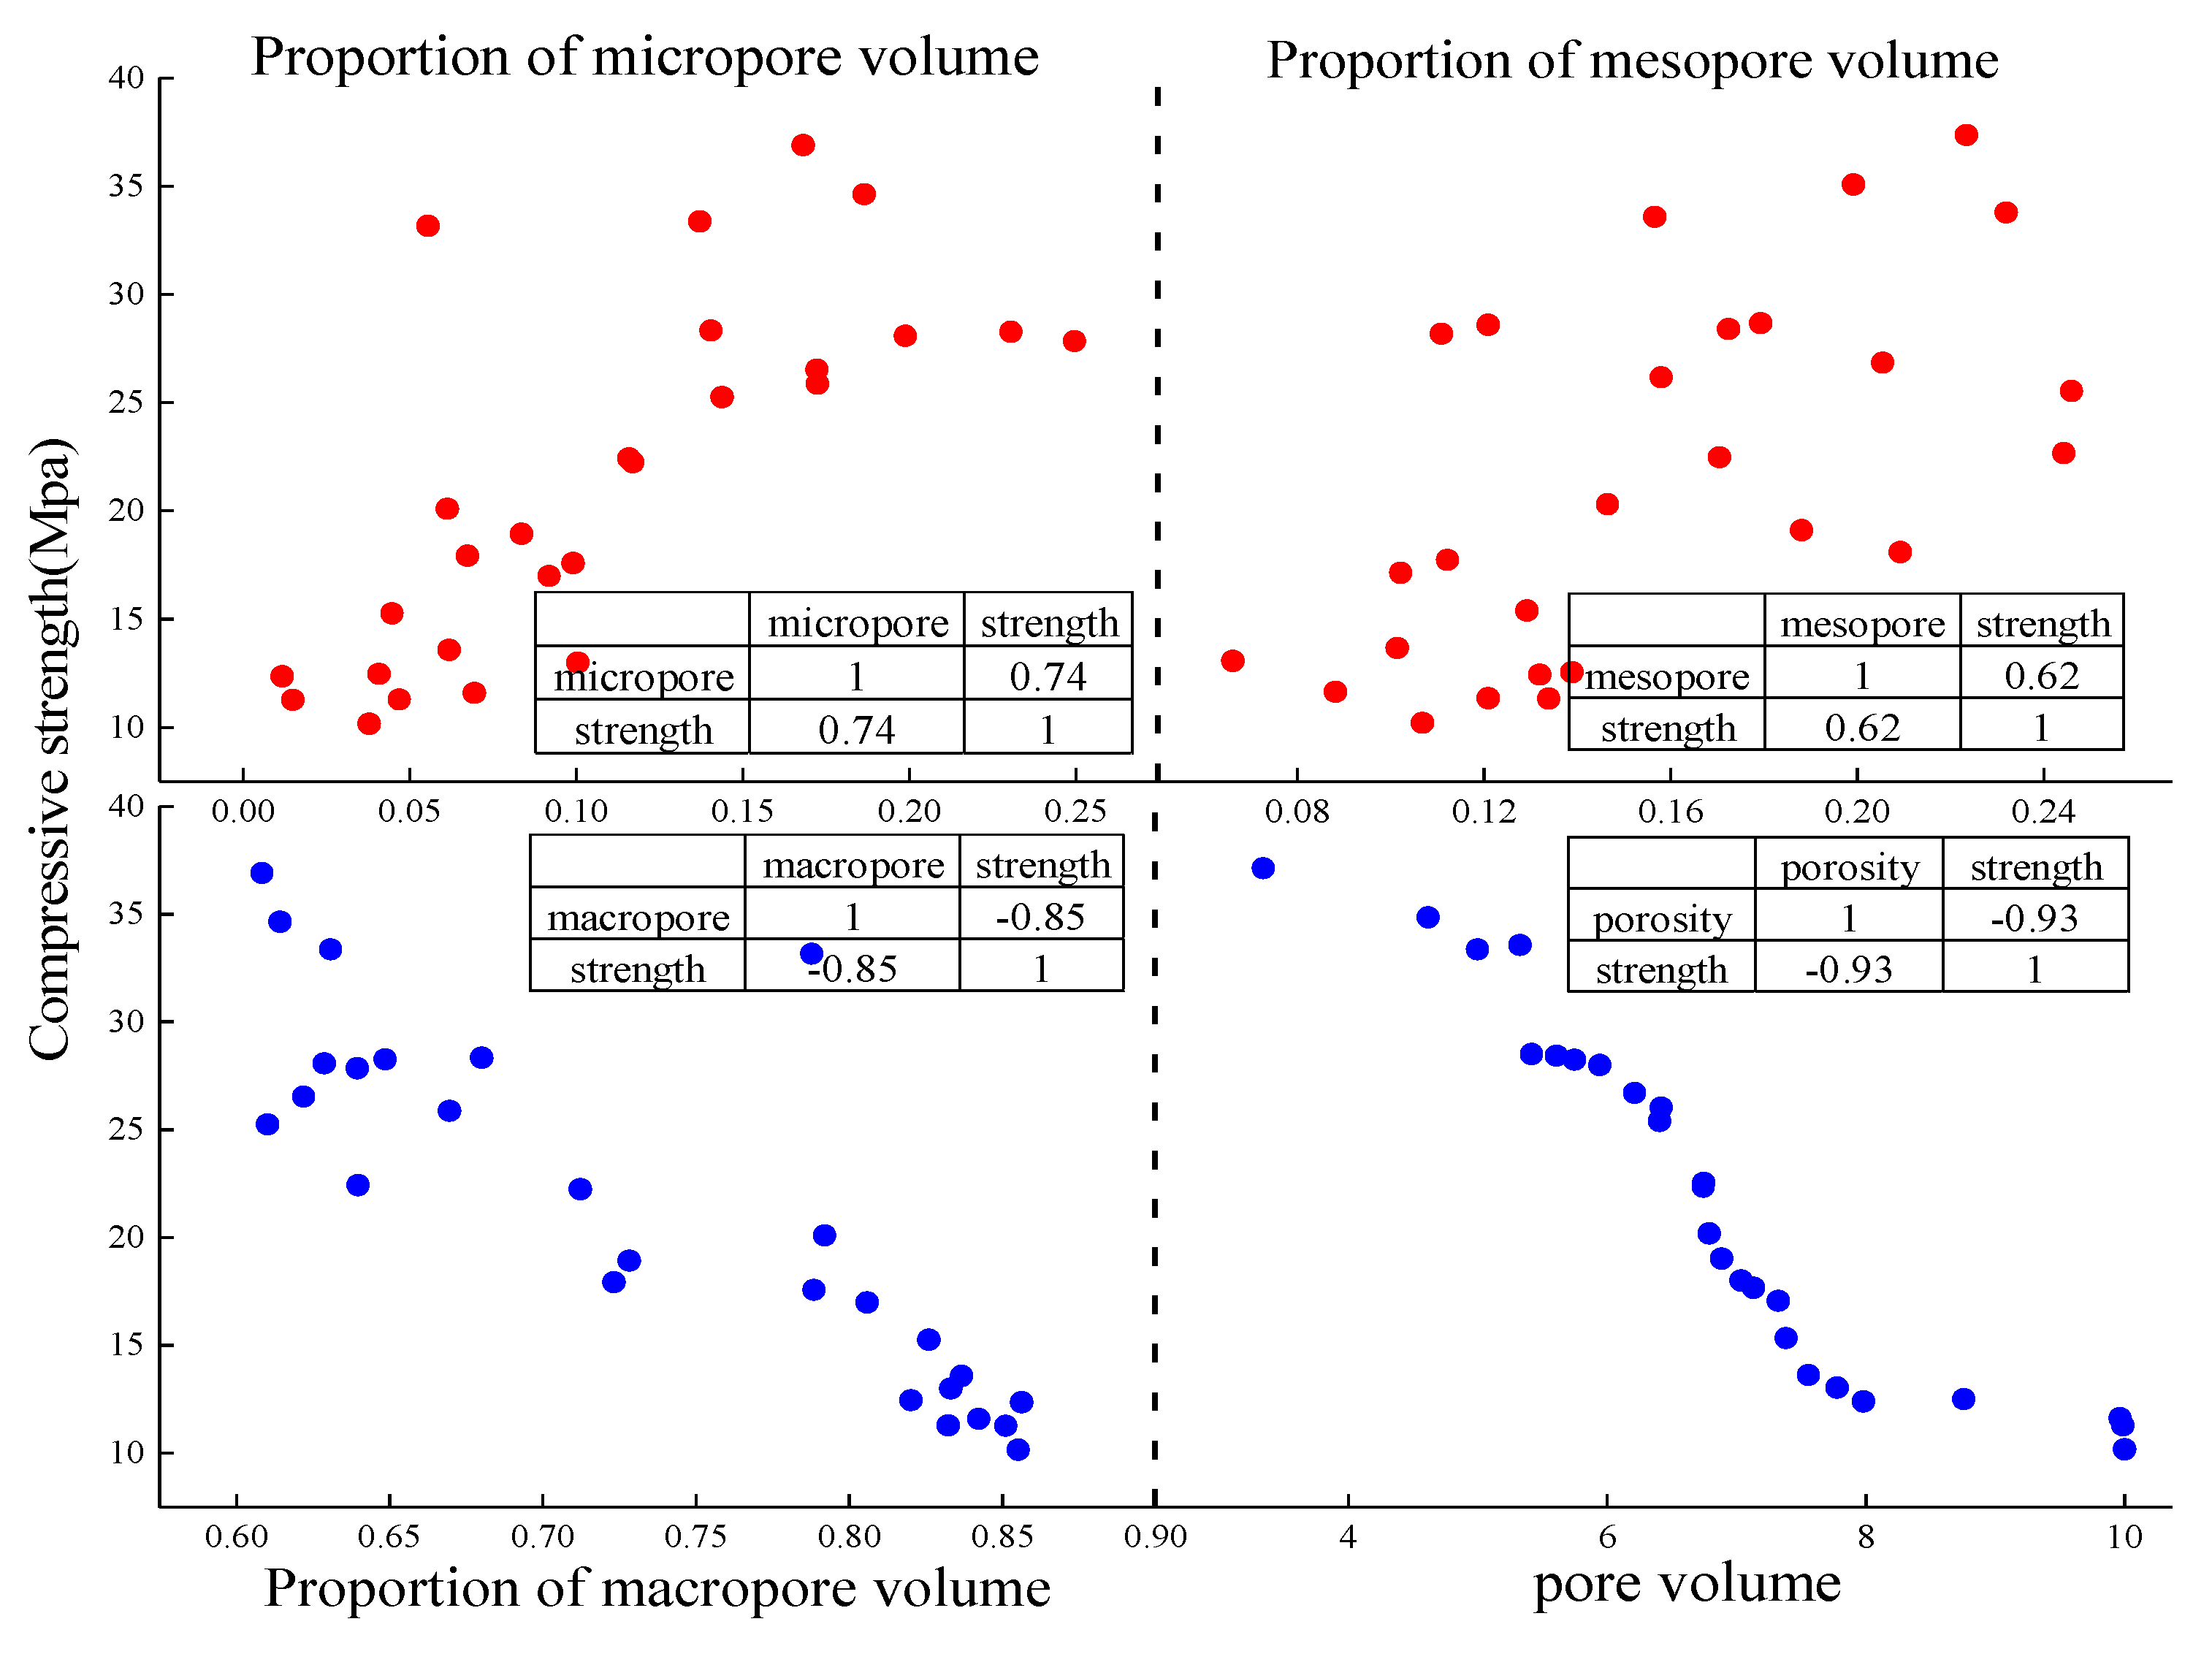
From Figure 4, it can be seen that the pore ratio of micropore and mesopore are also positively correlated with the strength, while both the proportion of macroporous in pore volume and porosity show different change rules. The correlation coefficient between the macroporous pore ratio and compressive strength is −0.85, and the correlation coefficient between porosity and strength is −0.93. By analyzing the comprehensive scatter diagram, the correlation between compressive strength and the proportion of macroporous pores and porosity are highly negative linear.

4. Strength Prediction Model

4.1. Selection of Representative Model Parameters

To ensure the high reliability of the rock-like material strength prediction model, model-dependent variables should include both pore size distribution and porosity parameters. However, there are many different characterization methods for material pore size distribution and porosity parameters. Therefore, the selection of representative factors has an important impact on the accuracy and operability of the model. Based on the correlation analysis of different pore volume ratio, pore fractal dimension and compressive strength in sandstone-like materials, the single factor linear regression analysis of each characterization parameter and strength is carried out, and then, the correlation analysis between dependent variables is carried out. The results are shown in Table 7.
Table 7 shows that the linear regression coefficient of pore volume ratio and compressive strength is greater than 0.8319, the correlation coefficient between pore fractal dimension and strength is more than 0.90, and the value of p is 0.0000 (<0.05). The data show that both of the pore volume ratio and fractal dimension have a good linear relationship with compressive strength. To avoid the prediction model being not conducive to practical operation due to complex expression, this study carries out the correlation test of different pore parameters and selects the representative parameters to establish a simple strength prediction model. Test results are shown in Table 8 and Table 9.
The correlation coefficient between macroporous pore ratio and other parameters of porosity is higher, especially with mesopore. Moreover, the correlation coefficient between pore volume ratio and strength of macropores is 0.9582 in single factor regression analysis. In the same way, the fractal dimension of macroporous aperture has a high correlation coefficient with that of micropore and mesopore, and the correlation coefficient with the fractal dimension of the mesopore is0.9555 particularly. Furthermore, the correlation coefficient between fractal dimension and compressive strength of macropores is also the highest. It has been proved in relevant literatures that pore size can affect the elastic behavior and strength of rock. Under the condition of keeping the porosity of the porous material unchanged, the change of pore position will lead to the change of sample strength [45,46]. At the same time, the failure and fracture of materials usually tend to develop along macropores [47]. Therefore, the proportion of macropores and the fractal dimension of macropores are selected as representative parameters to establish the prediction model.

4.2. Establishment of Strength Prediction Model

Through the analysis of the above independent variables, it can be certain that the expression of the strength prediction model of sandstone-like materials is a binary function with the percentage of macropores and fractal dimension of macropores as independent variables, that is:
M c = f ( D mac , V mac )
In Formula (7), M c is the compressive strength of the material, D mac is the fractal dimension of macropore aperture, and the V mac is the percentage of macropore.
To make the strength prediction model more reliable and operational, this study carried out the linear fitting for compressive strength, macroporous pore volume and fractal dimension of macroporous pore size respectively, to infer the concrete expression of strength model. From the Figure 5 and Figure 6 of linear fitting results, the correlation coefficient among compressive strength, macropore volume ratio and pore size fractal dimension of fitting curve are 0.8947 and 0.8854. That is to say, the independent variables have a good correlation with compressive strength. However, the variation trend of different independent variables and strength is different. The compressive strength increases with the growth of pore size fractal dimension, but decreases with the growth of pore volume.
Based on the fitting relationship between the above independent variables and compressive strength, it is assumed that the expression of the predicted strength model is expressed as follows:
M c = β 0 + β 1 D mac + β 2 V mac + β 3 D mac × V mac
The multivariate regression analysis of the hypothetical expression is carried out, and the results are shown in Table 10.
Table 10 shows that the correlation coefficient of the strength model regression equation reaches 0.943081, the p-value of the equation and the dependent variable are far less than the significant level 0.05, and the correlation coefficient of model expression is also greater than that of the single factor and the strength equation. The data show that regression results of the strength prediction model are significant, and the correlation coefficient of the model expression is better than that of the single factor expression. Therefore, Formula (8) is selected as the strength prediction model equation for sandstone-like materials. The complete expression is shown in Formula (9):
M c = 36148.5 + 12082.66 D mac + 40771.45 V mac 13621.8 D mac × V mac
The mean absolute percentage (MAPE) is adopted to evaluate the degree of closeness of the model prediction results to the real data, it can reflect the true situation of the predicted value error of the model. If MAPE is smaller, it means that the model fitting effect is better and the model prediction accuracy is higher. Kepniak [48,49] combined MAPE and multiple regression method statistical methods to analyze the dependence of concrete tensile strength, flexural strength and compressive strength, as well as the durability study of concrete with limestone powder instead of fine aggregate under the condition of chemical erosion. The calculation formula of MAPE is as follows:
MAPE = 1 n i = n T | Y i Y ip | Y i × 100
In Formula (10), T is total number of data samples, n is forecast periods number, Yi is the actual value of the variable in the period i, Yip is the prediction value of the variable in period i. By substituting the data in Table 4 and Table 5 into Formula (9) and Formula (10), it turns out that MAPE equals 4.9841%.In conclusion, the expression of sandstone -like material strength prediction model established in this paper has a high correlation coefficient and small MAPE. Therefore, Formula (9) can be used as the model expression for the next analysis.

4.3. Model Rationality Verification

To verify the rationality of the model, the compressive strength of non-test group specimens is predicted by using the established model. The results are shown in Table 11 and Figure 7.
From Table 11 and Figure 7, it can be seen that prediction results are basically close to actual indoor test results. Forecast results show that the strength prediction model has high reliability and can predict the compressive strength of sandstone-like materials.

5. Conclusions

In this study, raw materials were mixed to make sandstone-like specimens of different ratios. Based on the principle of fractal theory and NMR, the prediction model of compressive strength with the percentage of macroporous pore volume and fractal dimension of macropore as dependent variables is established. Conclusions drawn from this study are as follows.
(1) Internal pores of sandstone-like materials are mainly macropores, followed by mesopores, and the proportion of small pores is the smallest. The fractal dimension of pore size gradually increases with the growth of pore radius. Correlation coefficients of fractal dimension of mesopore and macropore are different from that of micropore, and pores of mesopore and macropore show obvious fractal characteristics.
(2) The proportion of different pores volume and the fractal dimension of pore size are both linearly related to the compressive strength of materials. The fractal dimension of macroporous pore size and the proportion of macroporous pores have a good correlation with their respective factors and compressive strength. Therefore, the percentage of macropore and the fractal dimension of macropore pore size are selected as representative parameters of the prediction model.
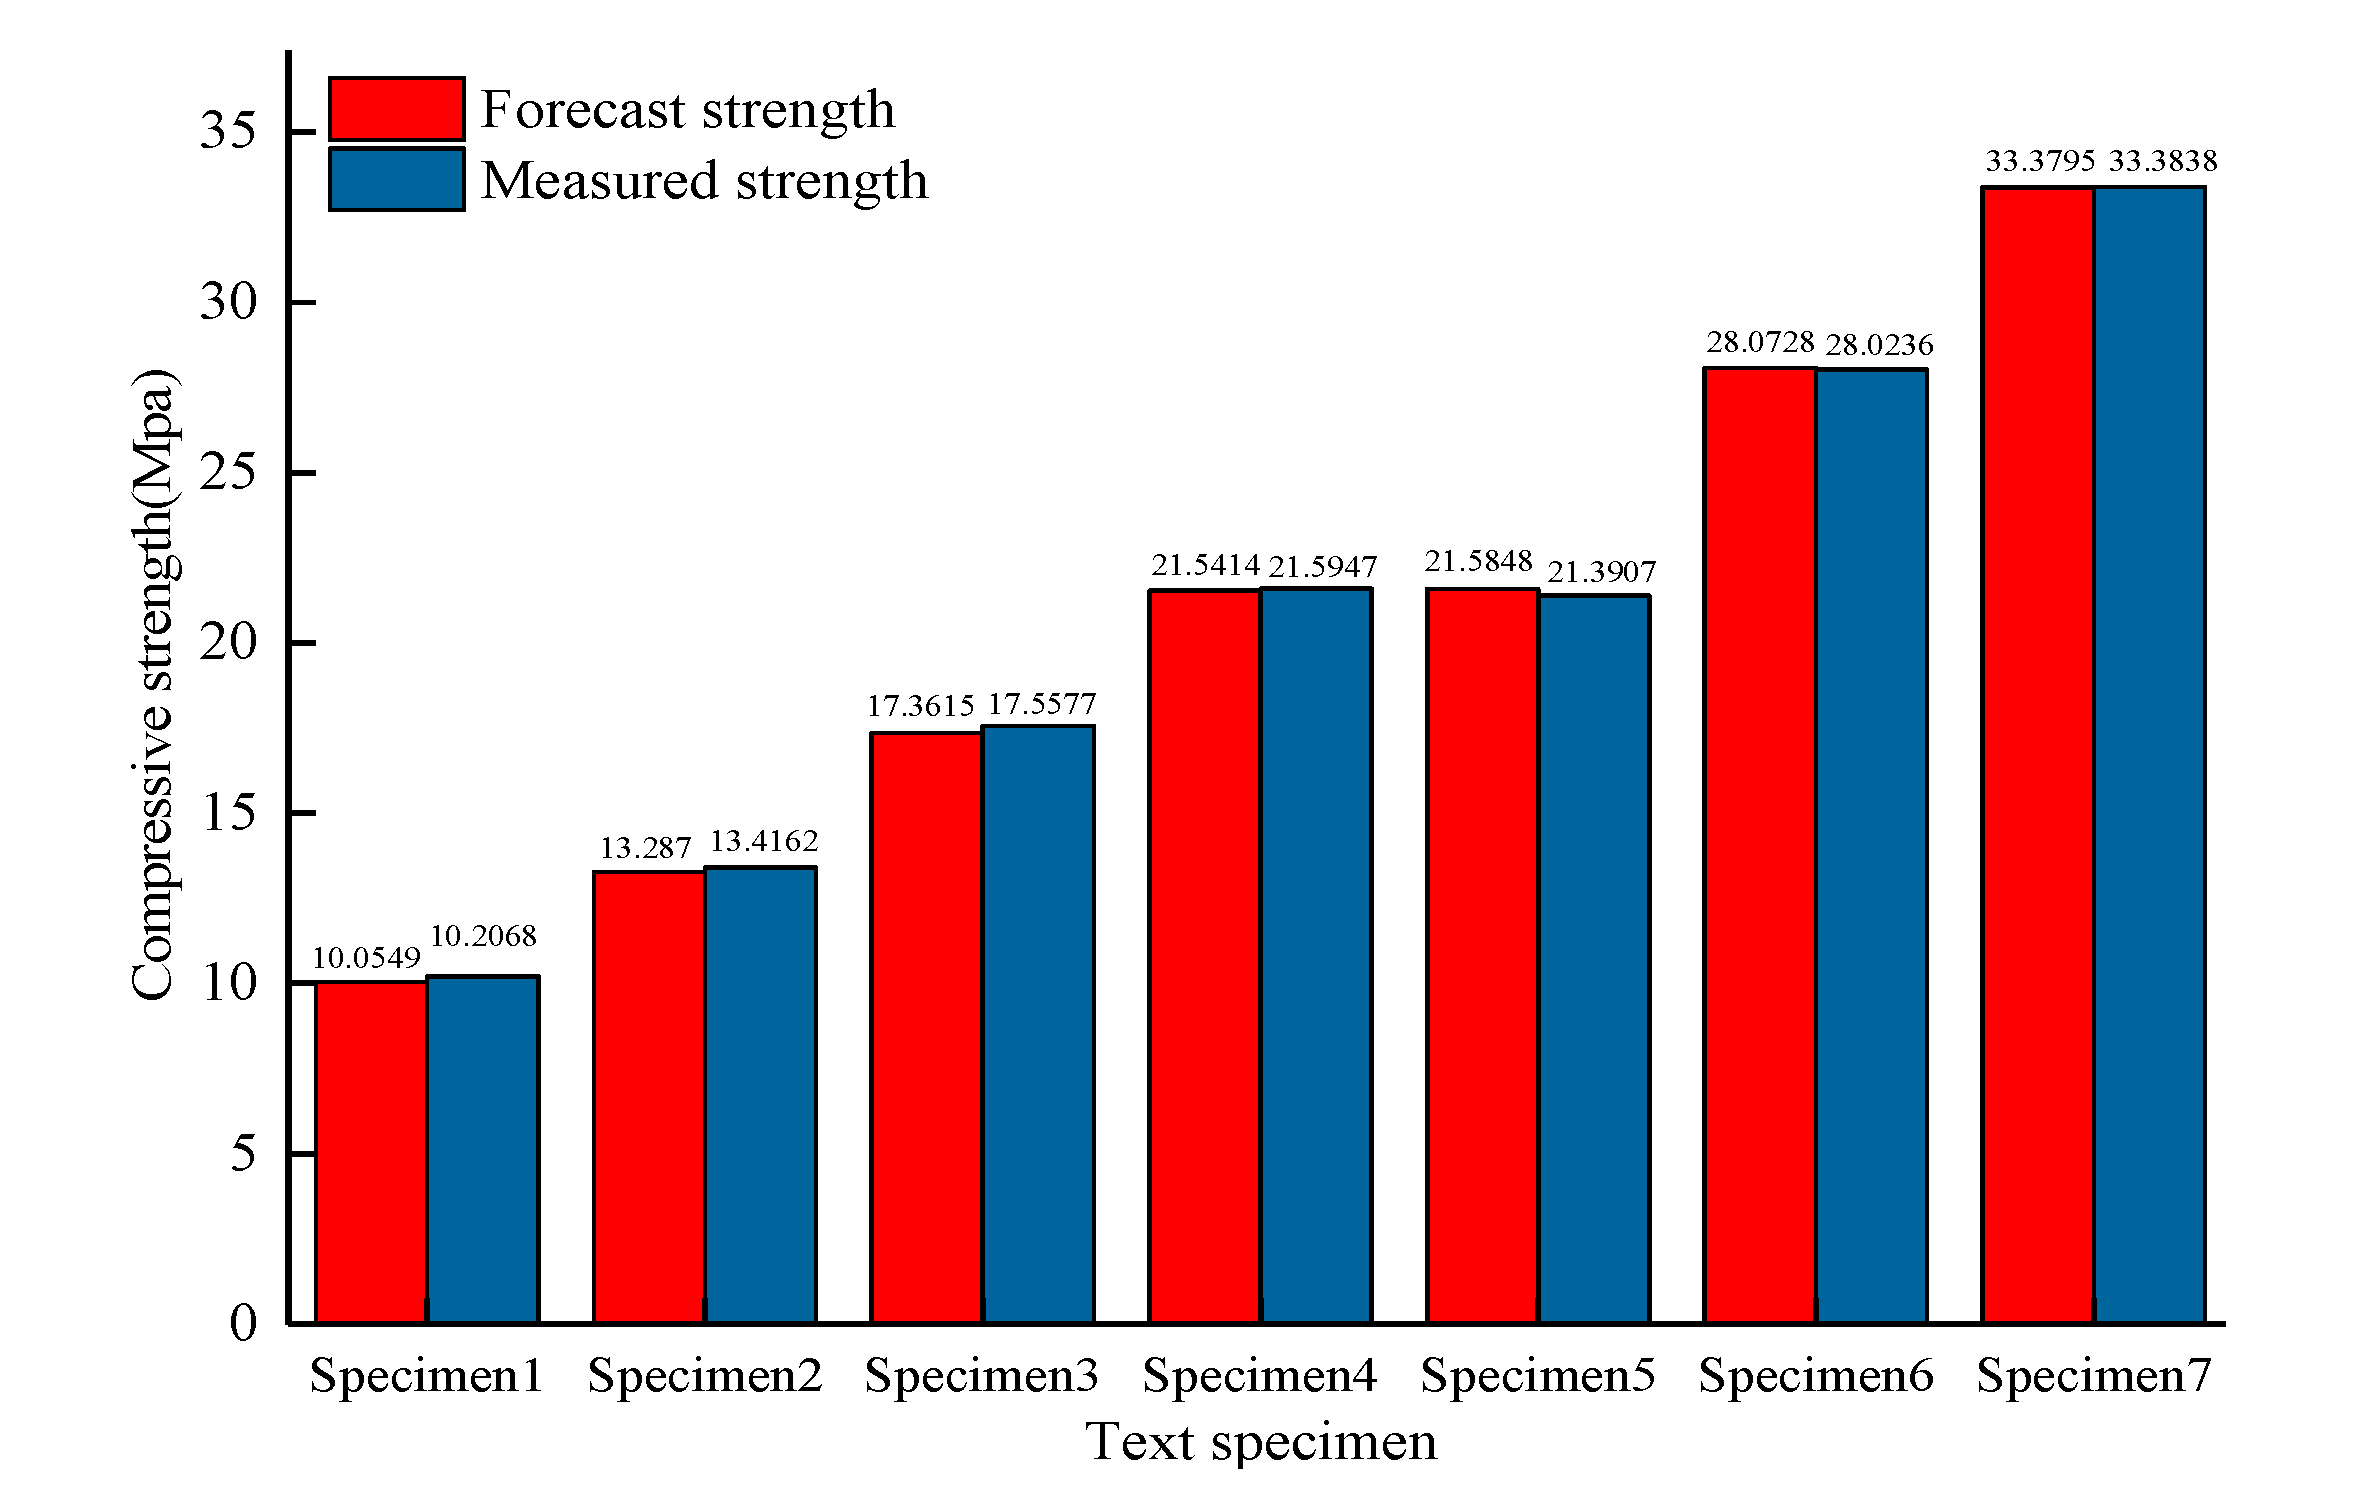
(3) The sandstone-like strength prediction model established in this study has high correlation coefficient and small MAPE. The compressive strength of non-test group specimens predicted by the strength model is close to the measured strength of the indoor test, the model has high reliability, and it could be used to predict the compressive strength of sandstone-like materials.
In this study, some limitations still exists. The slurry–aggregate transition interface has a great influence on the macroscopic mechanical properties of sandstone-like materials. Therefore, it should be taken into account as an important internal microstructure in the subsequent research on the internal relationship between the microscopic characteristics and the macroscopic mechanical properties of sandstone.

Author Contributions

Conceptualization, H.D., G.T. and S.Y.; formal analysis, H.D. and G.T.; funding acquisition, G.T.; investigation, Z.J., Z.Z. and Y.Z.; methodology, H.D., G.T. and S.Y.; project administration, H.D.; writing—review and editing, S.Y. All authors have read and agreed to the published version of the manuscript.

Funding

This work was financially supported by the National Natural Science Foundation of China under Grant number 51874352 and Graduate Research Innovation Project of Central South University under Project number 2019zzts985.

Conflicts of Interest

The authors declare no conflict of interest.

References

  1. Korb, J.-P. NMR and nuclear spin relaxation of cement and concrete materials. Curr. Opin. Colloid Interface Sci. 2009, 14, 192–202. [Google Scholar] [CrossRef]
  2. Kate, J.; Gokhale, C. A simple method to estimate complete pore size distribution of rocks. Eng. Geol. 2006, 84, 48–69. [Google Scholar] [CrossRef]
  3. Fakhimi, A.; Gharahbagh, E.A. Discrete element analysis of the effect of pore size and pore distribution on the mechanical behavior of rock. Int. J. Rock Mech. Min. Sci. 2011, 48, 77–85. [Google Scholar] [CrossRef]
  4. Griffiths, L.; Heap, M.J.; Xu, T.; Chen, C.-F.; Baud, P. The influence of pore geometry and orientation on the strength and stiffness of porous rock. J. Struct. Geol. 2017, 96, 149–160. [Google Scholar] [CrossRef]
  5. Mukhametdinova, A.; Kazak, A.V.; Karamov, T.; Bogdanovich, N.; Serkin, M.; Melekhin, S.; Cheremisin, A. Reservoir Properties of Low-Permeable Carbonate Rocks: Experimental Features. Energies 2020, 13, 2233. [Google Scholar] [CrossRef]
  6. Zhou, T.; Wu, C.; Shi, Z.; Wang, J.; Zhu, W.; Yuan, B.; Yang, D. Multi-Scale Quantitative Characterization of Pore Distribution Networks in Tight Sandstone by integrating FE-SEM, HPMI, and NMR with the Constrained Least Squares Algorithm. Energies 2019, 12, 3514. [Google Scholar] [CrossRef] [Green Version]
  7. Yang, S.; Wang, Y.; Zhang, S.; Wang, Y.; Zhang, Y.; Zhao, Y. Controls on Reservoirs Quality of the Upper Jurassic Mengyin Formation Sandstones in Dongying Depression, Bohai Bay Basin, Eastern China. Energies 2020, 13, 646. [Google Scholar] [CrossRef] [Green Version]
  8. Marszałek, M.; Dudek, K.; Gaweł, A. Cement Render and Mortar and Their Damages Due to Salt Crystallization in the Holy Trinity Church, Dominicans Monastery in Cracow, Poland. Minerals 2020, 10, 641. [Google Scholar] [CrossRef]
  9. Zhang, J.; Deng, H.; Deng, J.; Gao, R. Fractal Analysis of Pore Structure Development of Sandstone: A Nuclear Magnetic Resonance Investigation. IEEE Access 2019, 7, 47282–47293. [Google Scholar] [CrossRef]
  10. Deng, H.; Yu, S.; Deng, J. Damage Characteristics of Sandstone Subjected to Coupled Effect of Freezing-Thawing Cycles and Acid Environment. Adv. Civ. Eng. 2018, 2018, 1–10. [Google Scholar] [CrossRef] [Green Version]
  11. Liu, C.; Deng, H.; Wang, Y.; Lin, Y.; Zhao, H. Time-Varying Characteristics of Granite Microstructures after Cyclic Dynamic Disturbance Using Nuclear Magnetic Resonance. Crystysts 2017, 7, 306. [Google Scholar] [CrossRef] [Green Version]
  12. Jiang, Z.; Deng, H.; Liu, T.; Tian, G.; Tang, L. Study on Microstructural Evolution of Marble Under Cyclic Dynamic Impact Based on NMR. IEEE Access 2019, 7, 138043–138055. [Google Scholar] [CrossRef]
  13. Li, J.; Liu, H.; Ai, K.; Zhu, L. An NMR-Based Experimental Study on the Pore Structure of the Hydration Process of Mine Filling Slurry. Adv. Civ. Eng. 2018, 2018, 1–12. [Google Scholar] [CrossRef] [Green Version]
  14. Li, J.; Zhou, K.; Liu, W.; Zhang, Y. Analysis of the effect of freeze–thaw cycles on the degradation of mechanical parameters and slope stability. Bull. Int. Assoc. Eng. Geol. 2017, 77, 573–580. [Google Scholar] [CrossRef]
  15. Li, J.; Kaunda, R.B.; Zhou, K. Experimental investigations on the effects of ambient freeze-thaw cycling on dynamic properties and rock pore structure deterioration of sandstone. Cold Reg. Sci. Technol. 2018, 154, 133–141. [Google Scholar] [CrossRef]
  16. Li, J.; Zhou, K.-P.; Liu, W.-J.; Deng, H.-W. NMR research on deterioration characteristics of microscopic structure of sandstones in freeze–thaw cycles. Trans. Nonferrous Met. Soc. China 2016, 26, 2997–3003. [Google Scholar] [CrossRef]
  17. Yu, S.; Deng, H.; Tian, G.; Deng, J. Microscopic Characteristic Analysis on Sandstone under Coupling Effect of Freeze–Thaw and Acidic Treatment: From Nuclear Magnetic Resonance Perspective. Appl. Sci. 2020, 10, 5699. [Google Scholar] [CrossRef]
  18. Sun, Q.-C.; Wei, C.; Sha, X.-M.; Zhou, B.-H.; Zhang, G.-D.; Xu, Z.-H.; Cao, L. Study on the Influence of Water–Rock Interaction on the Stability of Schist Slope. Sustainability 2020, 12, 7141. [Google Scholar] [CrossRef]
  19. Effect of Age and Water-Cement Ratio on Size and Dispersion of Pores in Ordinary Portland Cement Paste. ACI Mater. J. 2010, 107. [CrossRef]
  20. Chen, X.; Wu, S.; Zhou, J. Influence of porosity on compressive and tensile strength of cement mortar. Constr. Build. Mater. 2013, 40, 869–874. [Google Scholar] [CrossRef]
  21. Zhao, H.; Xiao, Q.; Huang, D.; Zhang, S. Influence of Pore Structure on Compressive Strength of Cement Mortar. Sci. World J. 2014, 2014, 1–12. [Google Scholar] [CrossRef] [PubMed] [Green Version]
  22. Jin, S.; Zhang, J.; Han, S. Fractal analysis of relation between strength and pore structure of hardened mortar. Constr. Build. Mater. 2017, 135, 1–7. [Google Scholar] [CrossRef]
  23. Gao, H.; Zhang, X.; Zhang, Y. Effect of the entrained air void on strength and interfacial transition zone of air-entrained mortar. J. Wuhan Univ. Technol. Sci. Ed. 2015, 30, 1020–1028. [Google Scholar] [CrossRef]
  24. Bu, J.; Tian, Z. Relationship between pore structure and compressive strength of concrete: Experiments and statistical modeling. Sadhana 2016, 41, 337–344. [Google Scholar] [CrossRef] [Green Version]
  25. Zheng, S.; Yao, Y.; Liu, D.; Cai, Y.; Liu, Y. Characterizations of full-scale pore size distribution, porosity and permeability of coals: A novel methodology by nuclear magnetic resonance and fractal analysis theory. Int. J. Coal Geol. 2018, 196, 148–158. [Google Scholar] [CrossRef]
  26. Wang, H.; Liu, Y.; Song, Y.; Zhao, Y.; Zhao, J.; Wang, D. Fractal analysis and its impact factors on pore structure of artificial cores based on the images obtained using magnetic resonance imaging. J. Appl. Geophys. 2012, 86, 70–81. [Google Scholar] [CrossRef]
  27. Liu, Y.; Jeng, D.-S. Pore Structure of Grain-Size Fractal Granular Material. Materials 2019, 12, 2053. [Google Scholar] [CrossRef] [Green Version]
  28. Hu, J.H.; Ren, Q.F.; Yang, D.J.; Shang, J.L.; Ding, X.T.; Luo, Z.Q. Cross-scale characteristics of backfill material using NMR and fractal theory. Trans. Nonferrous Met. Soc. China 2020, 30, 1347–1363. [Google Scholar] [CrossRef]
  29. Lü, Q.; Qiu, Q.; Zheng, J.; Wang, J.; Zeng, Q. Fractal dimension of concrete incorporating silica fume and its correlations to pore structure, strength and permeability. Constr. Build. Mater. 2019, 228, 116986. [Google Scholar] [CrossRef]
  30. Zhang, L.; Zhou, J. Fractal characteristics of pore structure of hardened cement paste prepared by pressurized compact molding. Constr. Build. Mater. 2020, 259, 119856. [Google Scholar] [CrossRef]
  31. Zhang, X.; Lin, B.; Li, Y.; Zhu, C.; Li, Q. Analysis of fractal dimension of coal subjected to electrical breakdown based on nuclear magnetic resonance. J. Nat. Gas Sci. Eng. 2020, 79, 103345. [Google Scholar] [CrossRef]
  32. Hazra, B.; Wood, D.A.; Kumar, S.; Saha, S.; Dutta, S.; Kumari, P.; Singh, A.K. Fractal disposition, porosity characterization and relationships to thermal maturity for the Lower Permian Raniganj basin shales, India. J. Nat. Gas Sci. Eng. 2018, 59, 452–465. [Google Scholar] [CrossRef]
  33. Li, X.; Lu, Y.; Weng, Y. Research on damage model of single jointed rock masses under coupling action of freeze-thaw and loading. Chin. J. Rock Mech. Eng. 2013, 32, 2307–2315. [Google Scholar]
  34. Lu, Y.; Li, X.; Wu, X. Fracture coalescence mechanism of single flaw rock specimen due to freeze-thaw under triaxial compression. Rock Soil Mech. 2014, 35, 1579–1584. [Google Scholar]
  35. Li, L.G.; Kwan, A.K. Effects of superplasticizer type on packing density, water film thickness and flowability of cementitious paste. Constr. Build. Mater. 2015, 86, 113–119. [Google Scholar] [CrossRef]
  36. Siddique, R. Utilization of silica fume in concrete: Review of hardened properties. Resour. Conserv. Recycl. 2011, 55, 923–932. [Google Scholar] [CrossRef]
  37. Ministry of Water Resources, PRC. SL/T 264-2020 Rock Test Rules for Water Conservancy and Hydropower Projects; China Standard Press: Beijing, China, 2020.
  38. Zhang, P.; Lu, S.; Li, J.; Xue, H.; Li, W.; Zhang, P. Characterization of shale pore system: A case study of Paleogene Xin’gouzui Formation in the Jianghan basin, China. Mar. Pet. Geol. 2017, 79, 321–334. [Google Scholar] [CrossRef]
  39. Yan, J.P.; Wen, D.N.; Li, Z.Z.; Geng, B.; Cai, J.-G.; Liang, Q.; Yan, Y. The quantitative evaluation method of low permeable sandstone pore structure based on nuclear magnetic resonance (NMR) logging. Chin. J. Geophys. 2016, 59, 1543–1552. [Google Scholar]
  40. Porteneuve, C.; Korb, J.-P.; Petit, M.; Zanni, H. Structure–texture correlation in ultra-high-performance concrete. Cem. Concr. Res. 2002, 32, 97–101. [Google Scholar] [CrossRef]
  41. Jia, F.; Shen, P.; Li, K. Study on the fractal characteristics of sandstone pore structure and its application. Fault-Block Oil Gas Field 1995, 2, 16–21. [Google Scholar]
  42. Xia, Y.; Cai, J.; Wei, W.; Hu, X.; Wang, X.; Ge, X. A new method for calculating fractal dimensions of porous media based on pore size distribution. Fractals 2018, 26, 1850006. [Google Scholar] [CrossRef]
  43. Zhao, Y.; Zhu, G.; Dong, Y.; Danesh, N.N.; Chen, Z.; Zhang, T. Comparison of low-field NMR and microfocus X-ray computed tomography in fractal characterization of pores in artificial cores. Fuel 2017, 210, 217–226. [Google Scholar] [CrossRef]
  44. Peng, R.; Yang, Y.; Ju, Y.; Mao, L.; Yang, Y. Computation of fractal dimension of rock pores based on gray CT images. Chin. Sci. Bull. 2011, 56, 3346–3357. [Google Scholar] [CrossRef] [Green Version]
  45. Erfourth, B.; Wright, C.; Hudyma, N.; MacLaughlin, M. 3-D numerical models of macroporous rock: Investigation the inflfluence of void characteristics on elastic modulus. In Proceedings of the Golden Rocks-41st US Rock Mechanics Association Symposium, Golden, CO, USA, 17–21 June 2006. [Google Scholar]
  46. Xue, X. Study on relations between porosity and damage in fractured rock mass. Géoméch. Eng. 2015, 9, 15–24. [Google Scholar] [CrossRef]
  47. Ju, Y.; Yang, Y.; Peng, R.; Mao, L. Effects of Pore Structures on Static Mechanical Properties of Sandstone. J. Geotech. Geoenviron. Eng. 2013, 139, 1745–1755. [Google Scholar] [CrossRef]
  48. Kępniak, M.; Woyciechowski, P. The Statistical Analysis of Relation between Compressive and Tensile/Flexural Strength of High Performance Concrete. Arch. Civ. Eng. 2016, 62, 95–108. [Google Scholar] [CrossRef] [Green Version]
  49. Kępniak, M.; Woyciechowski, P.; Łukowski, P.; Kuziak, J.; Kobyłka, R. The Durability of Concrete Modified by Waste Limestone Powder in the Chemically Aggressive Environment. Materials 2019, 12, 1693. [Google Scholar] [CrossRef] [Green Version]
Figure 1. Intuitive presentation of experimental steps.
Applsci 10 06601 g001
Figure 2. Dividing the pore size of sandstone materials.
Applsci 10 06601 g002
Figure 3. Law of pore size fractal dimension and compressive strength.
Applsci 10 06601 g003
Figure 4. Relationship between the proportion of porosity and compressive strength.
Applsci 10 06601 g004
Figure 5. Fitting relationship between fractal dimension of macropores and compressive strength.
Applsci 10 06601 g005
Figure 6. Fitting relationship between the propotion of macropores and compressive strength.
Applsci 10 06601 g006
Figure 7. Regression analysis results of measured strength and predicted strength of materials.
Applsci 10 06601 g007
Table 1. Chemical composition of portland cement.
Chemical Composition3Ca·SiO22Ca·SiO23CaO·Al2O34CaO·Al2O3·Fe2O3
Content52.820.711.58.8
Table 2. Parameters of rock-like material.
MaterialTraitsMain IngredientsParticle SizeDensity (g/cm3)
Quartz sandYellow and white particlesquartz > 95%0.5–1.0 mm1.49
Silica fumeWhite powderSiO2 > 99%1 μm2.2–2.6
Naphthalene water reducerBrown yellow powderβ-Naphthal-enesulfonate sodium formaldehyde condensate
Table 3. Test control factor variation range.
Variable FactorFactor Change Range
Water-cement ratio0.300.330.35
Sand to Cement Ratio0.701.01.30
Admixture0.070.100.13
Table 4. Statistics of pore volume and compressive strength of sample.
Water-Cement RatioSand to Cement RatioAdmixturePorosityPercentage of MicroporePercentage of MesoporePercentage of MacroporeUniaxial Compressive Strength/MPa
0.300.70 0.07 5.7470 0.1988 0.1725 0.6287 28.0725
0.10 5.3261 0.1371 0.2320 0.6309 33.3596
0.13 6.4188 0.1724 0.1580 0.6696 25.8754
1.00 0.07 7.9812 0.0117 0.1320 0.8563 12.3486
0.10 4.6157 0.1865 0.1992 0.6143 34.6290
0.13 3.3437 0.1682 0.2234 0.6085 36.8885
1.30 0.07 5.9445 0.2496 0.1109 0.6395 27.8376
0.10 5.6107 0.2305 0.1209 0.6486 28.2588
0.13 4.9982 0.0555 0.1566 0.7879 33.1568
0.33 0.70 0.07 8.7581 0.0409 0.1389 0.8202 12.4586
0.10 6.4043 0.1438 0.2460 0.6103 25.2527
0.13 5.4177 0.1404 0.1794 0.6802 28.3275
1.00 0.07 7.1317 0.0991 0.1122 0.7886 17.5747
0.10 9.9657 0.0695 0.0882 0.8423 11.5799
0.13 6.7898 0.0614 0.1465 0.7921 20.0908
1.30 0.07 7.7785 0.1005 0.0662 0.8332 12.9857
0.10 7.3258 0.0919 0.1022 0.8059 16.9800
0.13 6.7425 0.1170 0.1705 0.7124 22.2345
0.35 0.70 0.07 7.3831 0.0447 0.1292 0.8261 15.2602
0.10 9.9875 0.0149 0.1339 0.8512 11.2586
0.13 6.8863 0.0836 0.1881 0.7283 18.9264
1.00 0.07 7.5579 0.0619 0.1014 0.8367 13.5750
0.10 6.7476 0.1158 0.2443 0.6399 22.4181
0.13 10.0031 0.0379 0.1069 0.8552 10.1587
1.30 0.07 9.9854 0.0469 0.1209 0.8323 11.2789
0.10 7.0357 0.0674 0.2093 0.7233 17.9190
0.13 6.2118 0.1723 0.2055 0.6221 26.5328
Table 5. Sample size fractal dimension statistics.
Water to Cement RatioSand to Cement RatioAdmixtureMicroporeMesoporeMacropore
KD1R2KD2R2KD3R2
0.300.70 0.07 1.3603 1.6397 0.7008 0.0374 2.9626 0.9089 0.0049 2.9951 0.8891
0.10 1.2262 1.7738 0.8967 0.0248 2.9752 0.9655 0.0024 2.9976 0.9489
0.13 1.3339 1.6661 0.6973 0.0409 2.9591 0.9757 0.0039 2.9961 0.9526
1.00 0.07 1.6660 1.3340 0.7096 0.0859 2.9141 0.9715 0.0093 2.9907 0.9431
0.10 1.2959 1.7041 0.7198 0.0234 2.9766 0.9221 0.0016 2.9984 0.9504
0.13 1.1945 1.8055 0.6975 0.0209 2.9791 0.9645 0.0010 2.9990 0.9321
1.30 0.07 1.3719 1.6281 0.6820 0.0376 2.9624 0.9602 0.0032 2.9968 0.9727
0.10 1.3374 1.6626 0.6990 0.0355 2.9645 0.9767 0.0031 2.9969 0.9601
0.13 1.2001 1.7999 0.6885 0.0248 2.9752 0.9055 0.0025 2.9975 0.9537
0.330.70 0.07 1.6908 1.3092 0.7173 0.0767 2.9233 0.9756 0.0091 2.9909 0.9394
0.10 1.4543 1.5457 0.6748 0.0412 2.9588 0.9113 0.0041 2.9959 0.9956
0.13 1.3176 1.6824 0.7429 0.0312 2.9688 0.9468 0.0027 2.9973 0.9406
1.00 0.07 1.4942 1.5058 0.7077 0.0563 2.9437 0.9264 0.0056 2.9944 0.9833
0.10 1.6958 1.3042 0.7200 0.0859 2.9141 0.9710 0.0113 2.9887 0.9386
0.13 1.4858 1.5142 0.6770 0.0465 2.9535 0.9470 0.0048 2.9952 0.9341
1.30 0.07 1.5595 1.4405 0.6692 0.0663 2.9337 0.9268 0.0080 2.9920 0.9511
0.10 1.5377 1.4623 0.6627 0.0604 2.9396 0.9446 0.0062 2.9938 0.9436
0.13 1.3476 1.6524 0.7023 0.0448 2.9552 0.9844 0.0046 2.9954 0.9665
0.350.70 0.07 1.5298 1.4702 0.6870 0.0615 2.9385 0.8483 0.0065 2.9935 0.9020
0.10 1.6693 1.3307 0.7101 0.1075 2.8925 0.9672 0.0218 2.9782 0.9390
0.13 1.4951 1.5049 0.6732 0.0487 2.9513 0.8948 0.0049 2.9951 0.9466
1.00 0.07 1.5949 1.4051 0.7051 0.0634 2.9366 0.8891 0.0074 2.9926 0.9080
0.10 1.3264 1.6736 0.6765 0.0446 2.9554 0.8908 0.0044 2.9956 0.9249
0.13 1.6818 1.3182 0.7147 0.1789 2.8211 0.9828 0.0238 2.9762 0.9145
1.30 0.07 1.6910 1.3090 0.7184 0.0911 2.9089 0.9804 0.0133 2.9867 0.9046
0.10 1.4805 1.5195 0.6640 0.0490 2.9510 0.9597 0.0053 2.9947 0.9556
0.13 1.3653 1.6347 0.6649 0.0382 2.9618 0.9507 0.0038 2.9962 0.9919
Note: K—the slope of linear fitting curve, D—fractal dimension of aperture, R2—linear regression correlation coefficient.
Table 6. Statistics of different pore fractal dimension ranges.
Pore ClassificationMicropore
(r < 0.1μm)
Mesopore
(0.1 μm < r < 1μm)
Mecropore
(1 μm < r < 100 μm)
Percentage of porosity0.0117–0.24960.0662–0.24600.6085–0.8563
Average percentage of porosity0.10820.15540.7365
Fractal dimension of pore radius1.3042–1.80552.8211–2.97912.9762–2.9990
Average of fractal dimension of pore radius1.54062.94362.9934
Fractal dimension calculation correlation coefficient0.6627–0.89670.8483–0.98440.8891–0.9956
Average of calculation correlation0.70290.94250.9438
Table 7. Summarizes the single-factor linear regression results of pore structure parameters and compressive strength.
Parameter TypePore Structure Parameter TypeR2Fp Value
Percentage of porosityPorosity0.8731171.96480.0000
Percentage of micro-pore0.8319113.8068
Percentage of meso-pore0.9212292.2251
Percentage of macro-pore0.9582572.6658
Fractal dimension of pore radiusFractal dimension of micropore0.9010227.5951
Fractal dimension of mesopore0.9292315.0203
Fractal dimension of macropore0.9360292.2676
Table 8. Analysis of pore volume parameters.
Pore ParameterPorosityPercentage of MicroporePercentage of MesoporePercentage of Macropore
Porosity1−0.4766 (**)−0.5709 (**)0.4856 (**)
Percentage of micropore−0.4766 (**)10.7819 (**)0.7341 (**)
Percentage of mesopore−0.5709 (**)0.7819 (**)1−0.8196 (**)
Percentage of macropore0.4856 (**)0.7341 (**)−0.8196 (**)1
Note: (**) indicates that the correlation test is significant at a significance level of 0.01.
Table 9. Analysis of pore size fractal dimension.
Fractal Dimension ParameterFractal Dimension of MicroporeFractal Dimension of MesoporeFractal Dimension of Macropore
Fractal dimension of micropore10.8126 (**)0.7777 (**)
Fractal dimension of mesopore0.8126 (**)10.9555 (**)
Fractal dimension of macropore0.7777 (**)0.9555 (**)1
Note: (**) indicates that the correlation test is significant at a significance level of 0.01.
Table 10. Calculation results of multiple linear regression of independent variables.
Regression CoefficientsIndependent VariableCalculated Valuetp
β0Constant term−36148.5−4.637840.000115
β1Dmac12082.664.6462160.000112
β2Vmac40771.454.4649330.000177
β3Dmac × Vmac−13621.8−4.471060.000174
Equation ExpressionR2 = 0.940344p = 6.34957 × 10⁻¹¹
Table 11. Statistics of the strength prediction results of non-test group sandstone specimens.
Specimen Numbering1234567
Vmac2.97872.99162.99432.99462.99502.99682.9987
Dmac0.85830.85140.83720.69830.69560.69090.6950
Measured strength10.206813.416217.557721.594721.390728.023633.3838
Forecast strength10.054913.28717.361521.541421.584828.072833.3795
error1.48%0.96%1.11%0.24%0.90%0.17%0.01%

