1. Introduction
Energy harvesting aims to capture small amounts of energy from the environment and convert it into electricity for immediate use or storage. This energy can be harvested from different sources, for example, mechanical, thermal, or radiant energies, where vibrations can be used to generate energy by piezoelectric devices [
1]. Energy harvesting can be used in every application that applies forces onto a material. However, the most significant drawback of piezoelectric devices is the low energy that they generate. This paper is not intended to justify the economic profitability of the devices employed in this paper but it considers the analysis of different piezoelectric devices for energy harvesting as a paradigm to be covered in the development of this type of technology. Nowadays, there is scientific interest to generate energy from microelectromechanical systems [
2,
3,
4], considering the amplitude of a seismic mass, the magnitude and the frequency of excitation, and the mechanical damping coefficient to find the conditions for maximum power transfer to a load. Other research works, for example, Rocha et al. [
5], have studied an energy harvesting system inside a shoe to convert the pressure of a footprint into energy, and Marioli et al. [
6] have employed an electromagnetic transducer to convert vibrations into electrical energy.
Uchino [
7] demonstrated the essential guidelines for successful construction of an energy harvesting system, and there have been many commercial piezoelectric platforms that have employed this technology. Elhalwagy et al. [
8] presented a study and comparison of different commercial energy harvesting floors for interior spaces in buildings. Studies by [
9,
10] were based on finite elements analysis and modeling on piezoelectric platforms for energy harvesting. The research works by [
11,
12,
13] considered an analysis of energy extracted using a piezoelectric floor. Bowen et al. [
14] analyzed the fabrication and evaluation of an energy harvesting floor using unimorph lead zirconate titanate (PZT) piezoelectric cantilevers to convert kinetic energy from footsteps.
This work studies the performances of different transducers on a prototype piezoelectric platform, and their possible applications for energy harvesting. A prototype is proposed for the generation of energy from the footsteps of people on a platform. The novelty of this work is the analysis and comparison of different piezoelectric platforms based on macro fiber composites and PZT transducers. Furthermore, the distribution of tread forces on the platform are studied by measuring the output of each of the piezoelectric transducers. Finally, a comparison considering commercial energy harvesting floors and this prototype is performed.
The manuscript is organized as follows:
Section 2 describes a case study where the energy harvesting floor is detailed from theoretical and practical points of view; in
Section 3, the results are analyzed and presented; in
Section 4, a comparative analysis with some of the commercial piezoelectric platforms on the market is presented; and finally, in
Section 5, we present the main findings of the research work.
2. Case Study: Energy Harvesting Floor
2.1. Theoretical Analysis
The external energy to charge the battery or capacitor is given by Equation (1),
where
is the external voltage, which charges the external capacitor; and
is the external capacity.
The load power is obtained by Equation (2),
where
is the resistance of the load, or the internal resistance of the battery;
t is the time; and
I is the current.
The theoretical analysis assumes that all the force is transmitted to the transducer and that only one transducer is used. A prototype was built to test it in a real case study to address the non-linearity of the system.
Piezoelectric devices are simple in terms of components, geometry, and conversion of mechanical energy to electricity [
15]. K. Uchino [
7] divided the energy harvesting process into the following three phases, showing the performance in each transformation of the energy:
Mechanical-mechanical energy transfer: This refers to the constructive aspects of the piezoelectric, for example, the maximum possible displacement without damaging it, supported stress, etc. Uchino showed that 87% of the mechanical energy could be transmitted from the source to the piezoelectric transducer.
Mechanical-electrical energy transduction: This is related to the electromechanical coupling factor between structure and transducers. Uchino showed that the energy conversion rate was between 2% and 9%, depending on the electromechanical coupling factor parameter.
Electrical-electrical energy transfer: It refers to the current conversion to transfer the energy to a load or battery. This has been divided into two phases as follows:
- -
Transducer to harvesting circuit: Previous research has demonstrated that the difference of impedance between the piezoelectric and the harvesting circuit has resulted in only 57% of the energy being conserved in this step.
- -
Harvesting circuit to rechargeable battery: The reduction of energy in this phase is motivated by the energy consumption of the circuit and the mismatch between the electrical impedance of the circuit output and the battery input impedance. The study showed that 81% of the energy could be transmitted in this phase.
The paper showed that the total current energy harvesting rate from the vibration source to the storing battery was about 3.6%.
2.2. Testing Piezoelectric Transducers
In this paper, we considered and studied different interdigitated piezoelectric models and a piezoelectric disk which was necessary to perform the tests in the same conditions to analyze the piezoelectric transducers. The experiments used an oscilloscope to measure the output voltage of the piezoelectric transducers when a weight of 3 kg (29.43 N) was applied to the transducer.
2.2.1. Macro Fiber Composite Transducers
Macro fiber composite (MFC) transducers were employed for fault detection and harvesting high frequency small vibrations [
16,
17,
18,
19]. MFCs consist of rectangular piezo ceramic rods sandwiched between layers of adhesive, electrodes, and polyimide film [
19,
20,
21,
22]. The electrodes are attached to the film in an interdigitated pattern [
23,
24,
25].
Table 1 shows the characteristics of the P1 and P2 piezoelectric transducers. The terms P1 and P2 refer to the type of movement as follows: When the P1 type is excited with electrical power it produces an elongation movement, and vice versa, and when the P2 type is excited it generates a contraction movement, and vice versa.
This transducer generated the lowest output voltage (250 mV) despite its larger size because it was designed to generate voltage with an elongation motion (P1). However, the force was applied directly to the transducer in the tests and did not produce enough elongation, therefore, it produced a reduced voltage.
This transducer was similar to MFC 1, however, the output voltage was better, mainly because of the larger size of MFC 1 was more inefficient for this specific application. The MFC 2 had a smaller area and the weight pressed more area, producing a better output.
The MFC 3 is a P2 type, i.e., the optimal direction of movement is a contractor movement. The output voltage is shown in
Table 2. Due to its reduced size, together with the P2 type, the output voltage generated was better than previous cases.
The output voltage, shown in
Table 2, is the highest of all the MFCs. The MFC 4 was the smallest of the MFC tested. The surface was pressed in its totality when the weight pressed the transducer. The MFC P2 type had a better performance than the MFC P1 type for this application.
2.2.2. Lead Zirconate Titanate Disk
The piezoelectric disk presented better performance regarding the tested MFC transducers. This is because the structure of the piezo-material polarity is highly distributed along the vertical axis, making the PZT polarity structure close to having two dipoles, being the more effective applied force. The small size enabled a greater number of transducers on the platform. The tests performed on all the transducers highlight the importance of selecting the right piezoelectric type, which is analyzed in
Section 3.
2.3. Prototype Mechanical Design
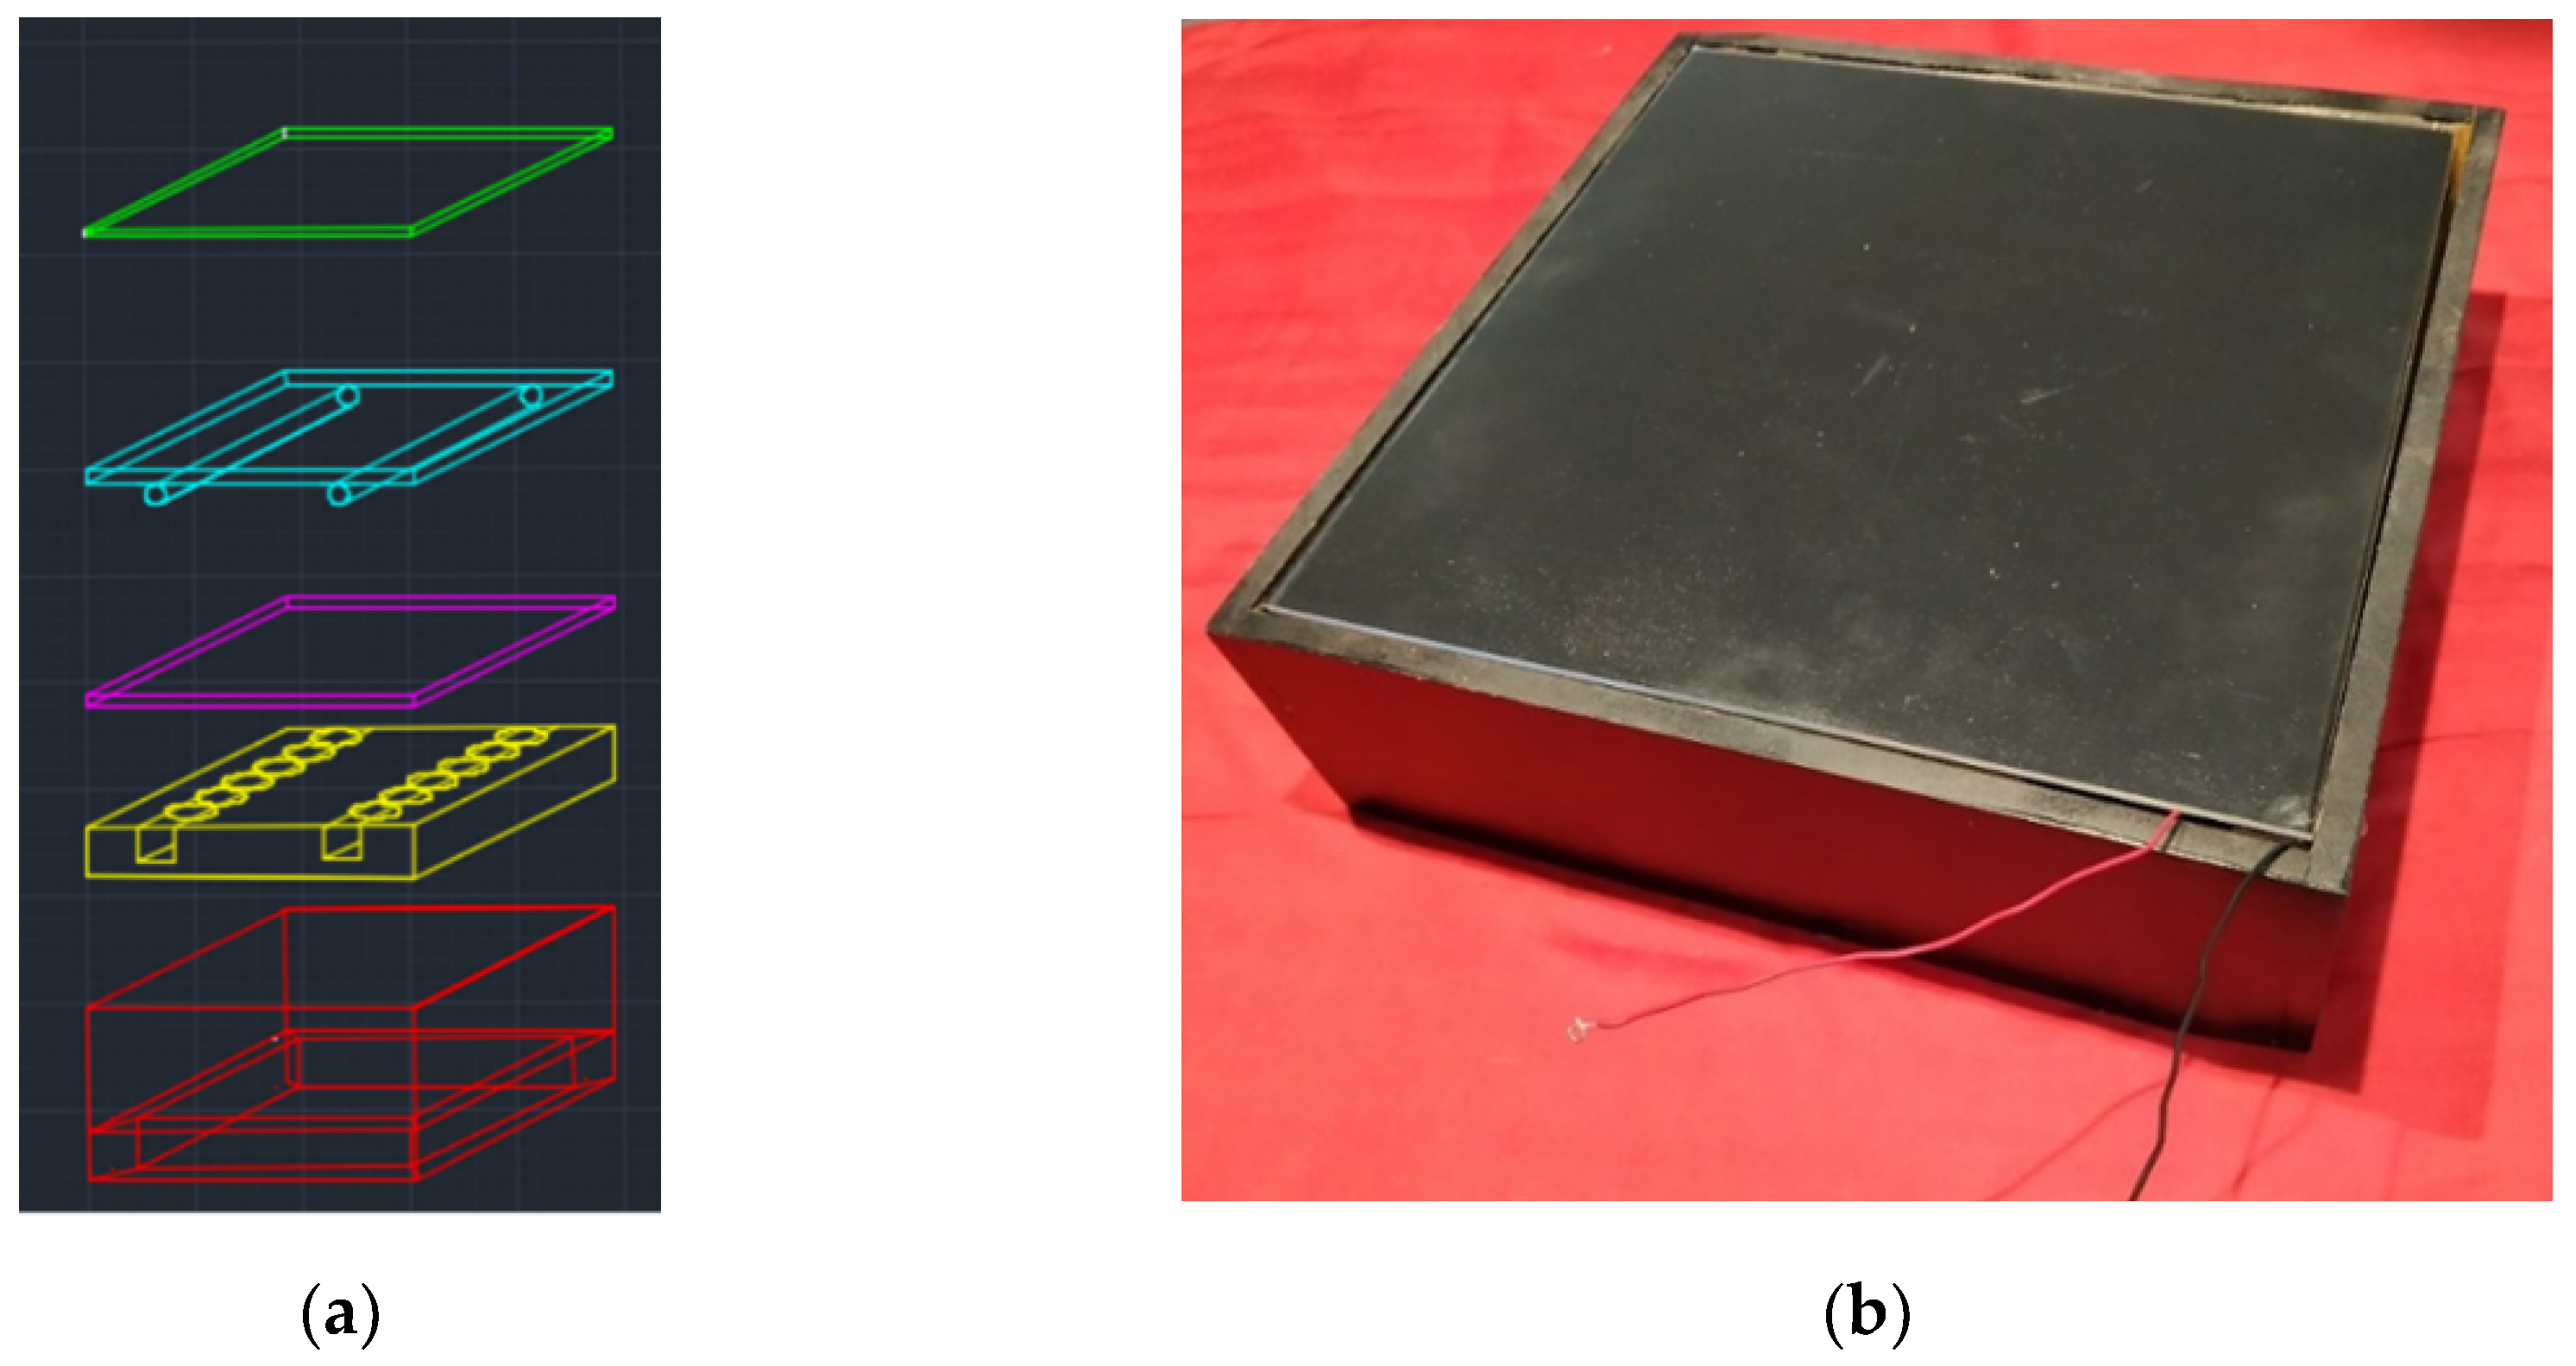
The design of the platform follows a layered approach.
Figure 1a shows the computer aided design (CAD) design, and
Figure 1b the prototype platform.
The platform was designed to maximize the mechanical stress in the piezoelectric transducers and to optimize the electrical energy generation. The design was optimized to make the force applied not exceed the limits that the piezoelectric devices could support.
In this work, the platform presented was developed to avoid a lateral displacement when stepped on it, which could be uncomfortable for pedestrians. This could lead pedestrians to not step onto the piezoelectric platform. Furthermore, more piezoelectric transducers were added to the array to reduce the magnitude of vertical displacement without losing the amount of energy generated.
The first layer is a methacrylate crystal of 30 × 30 cm. This outer layer needs to be durable and aesthetic because it bears the steps of the users. The second layer is made with timber, with two bars attached for the purpose of distributing the force of a step to all the piezoelectric transducers. The third layer is for shock absorption with a protective sheet of polystyrene or rubber. It is placed to protect the transducers from any overcharged weight that could critically flex the platform and could damage the piezoelectric transducers. The piezoelectric are placed in a specific distribution of two lines of ten piezoelectric disks in the vertical axis. The piezoelectric transducers are over a hollow, or cavity, which allows flexile movement. The number of piezoelectric transducers could be extended by distributing them along all the surface, with a maximum capacity of one hundred piezoelectric. This would increase the energy harvested. The electronic circuits are hidden below the platform in a protective case.
This design allows one to connect more platforms to each other in parallel, and an individual battery can be charged on each platform, or the charging of a single battery with a basic circuit with reverse current protection.
2.4. Energy Harvesting Circuit
An electronic circuit was designed to collect and store the energy generated by the piezoelectric platform. An impedance matching interface is necessary to supply the maximum power to a load. The full bridge rectifier increased the efficiency of the energy conservation above 85%, see [
15,
26]. Wu et al. [
27] improved the synchronized switch harvesting on an inductor (SSHI) interface for piezoelectric energy harvesting. A circuit based on a full bridge was built in this prototype. A resistive load with the same value as the rectifier output impedance was placed at the output to obtain the highest power transfer.
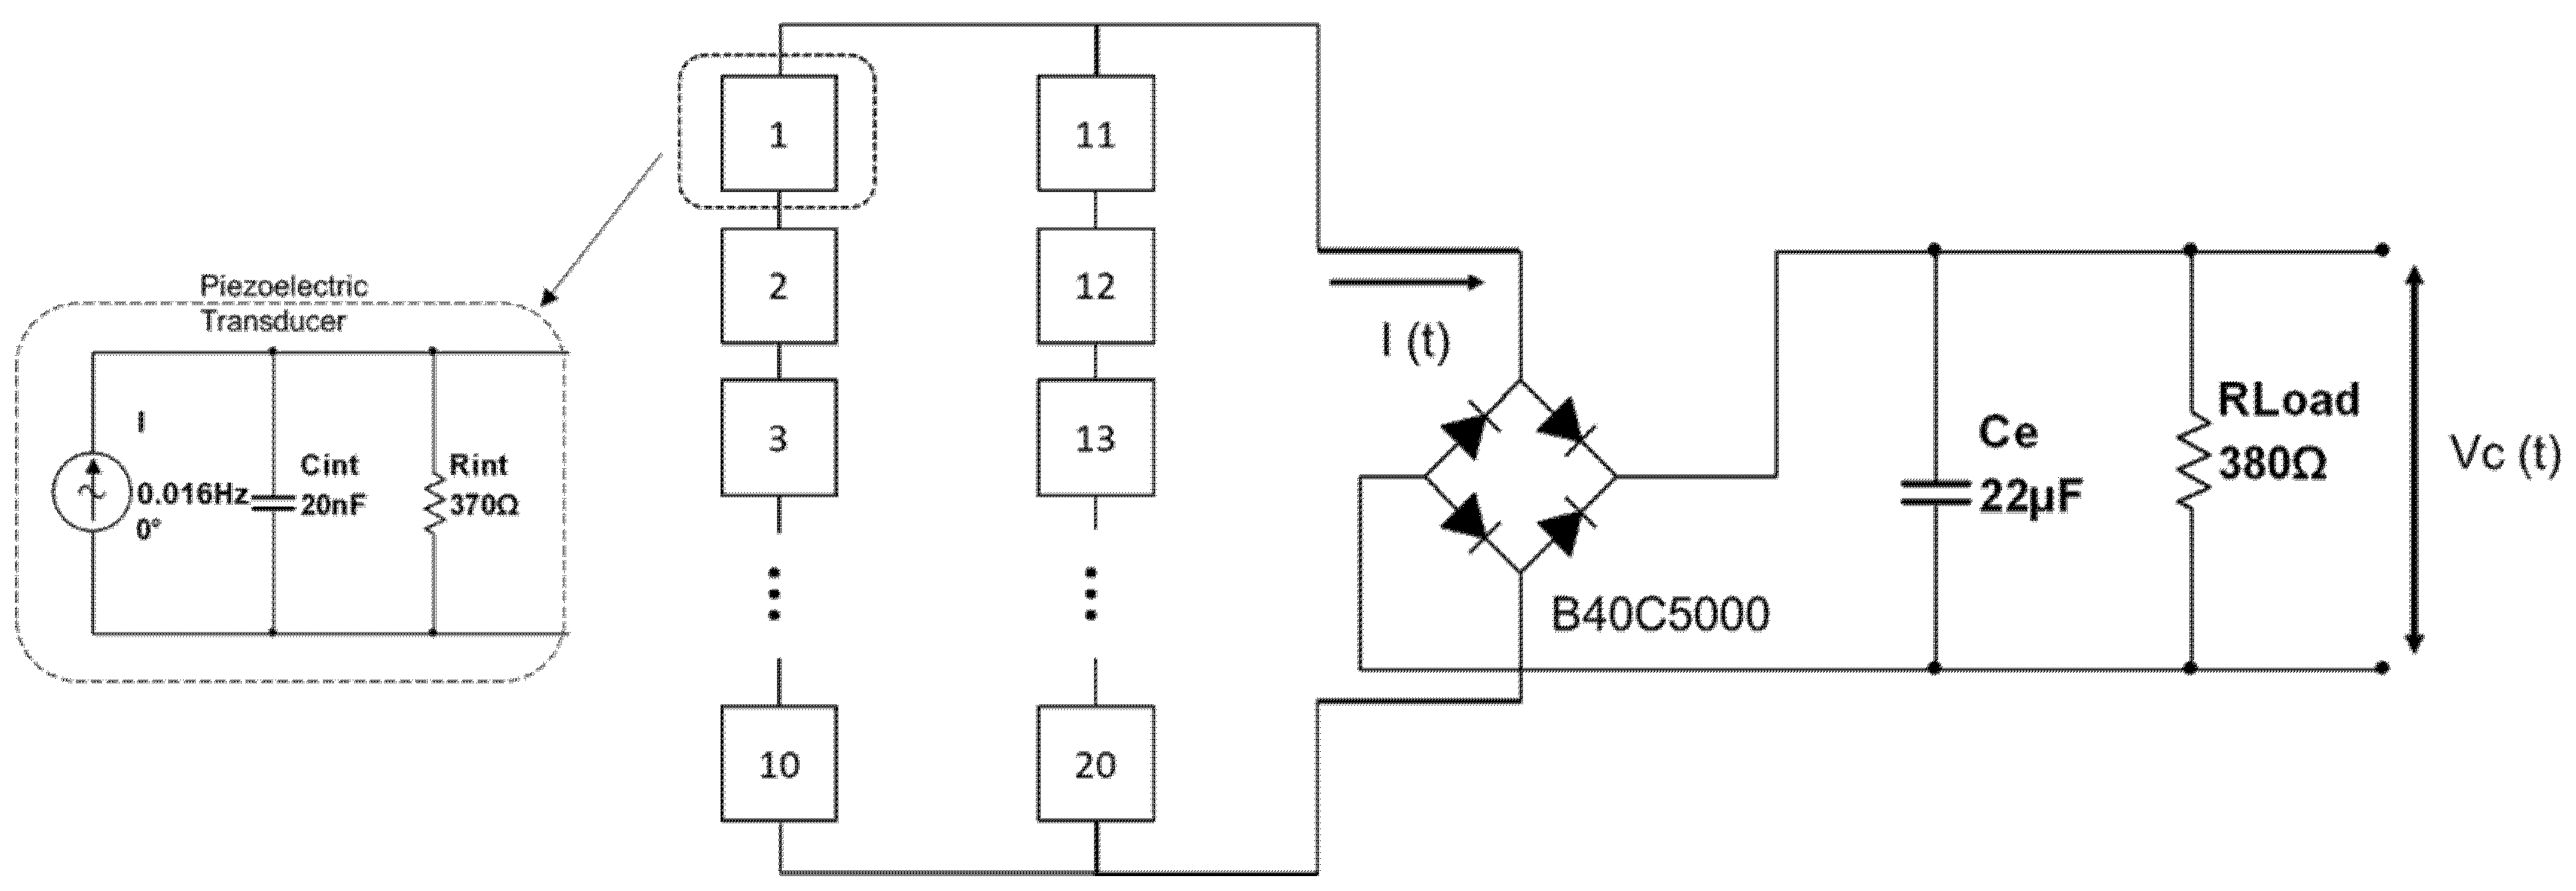
According to the manufacturer of the PZT disk, it has an internal capacitance of 20 nF and an internal resistance of 370 Ω. Simulation Program with Integrated Circuits Emphasis (SPICE) was used to determine the value of the output impedance for frequencies from 0.01 to 2 Hz.
Table 2 shows that the impedance varies slightly for this range.
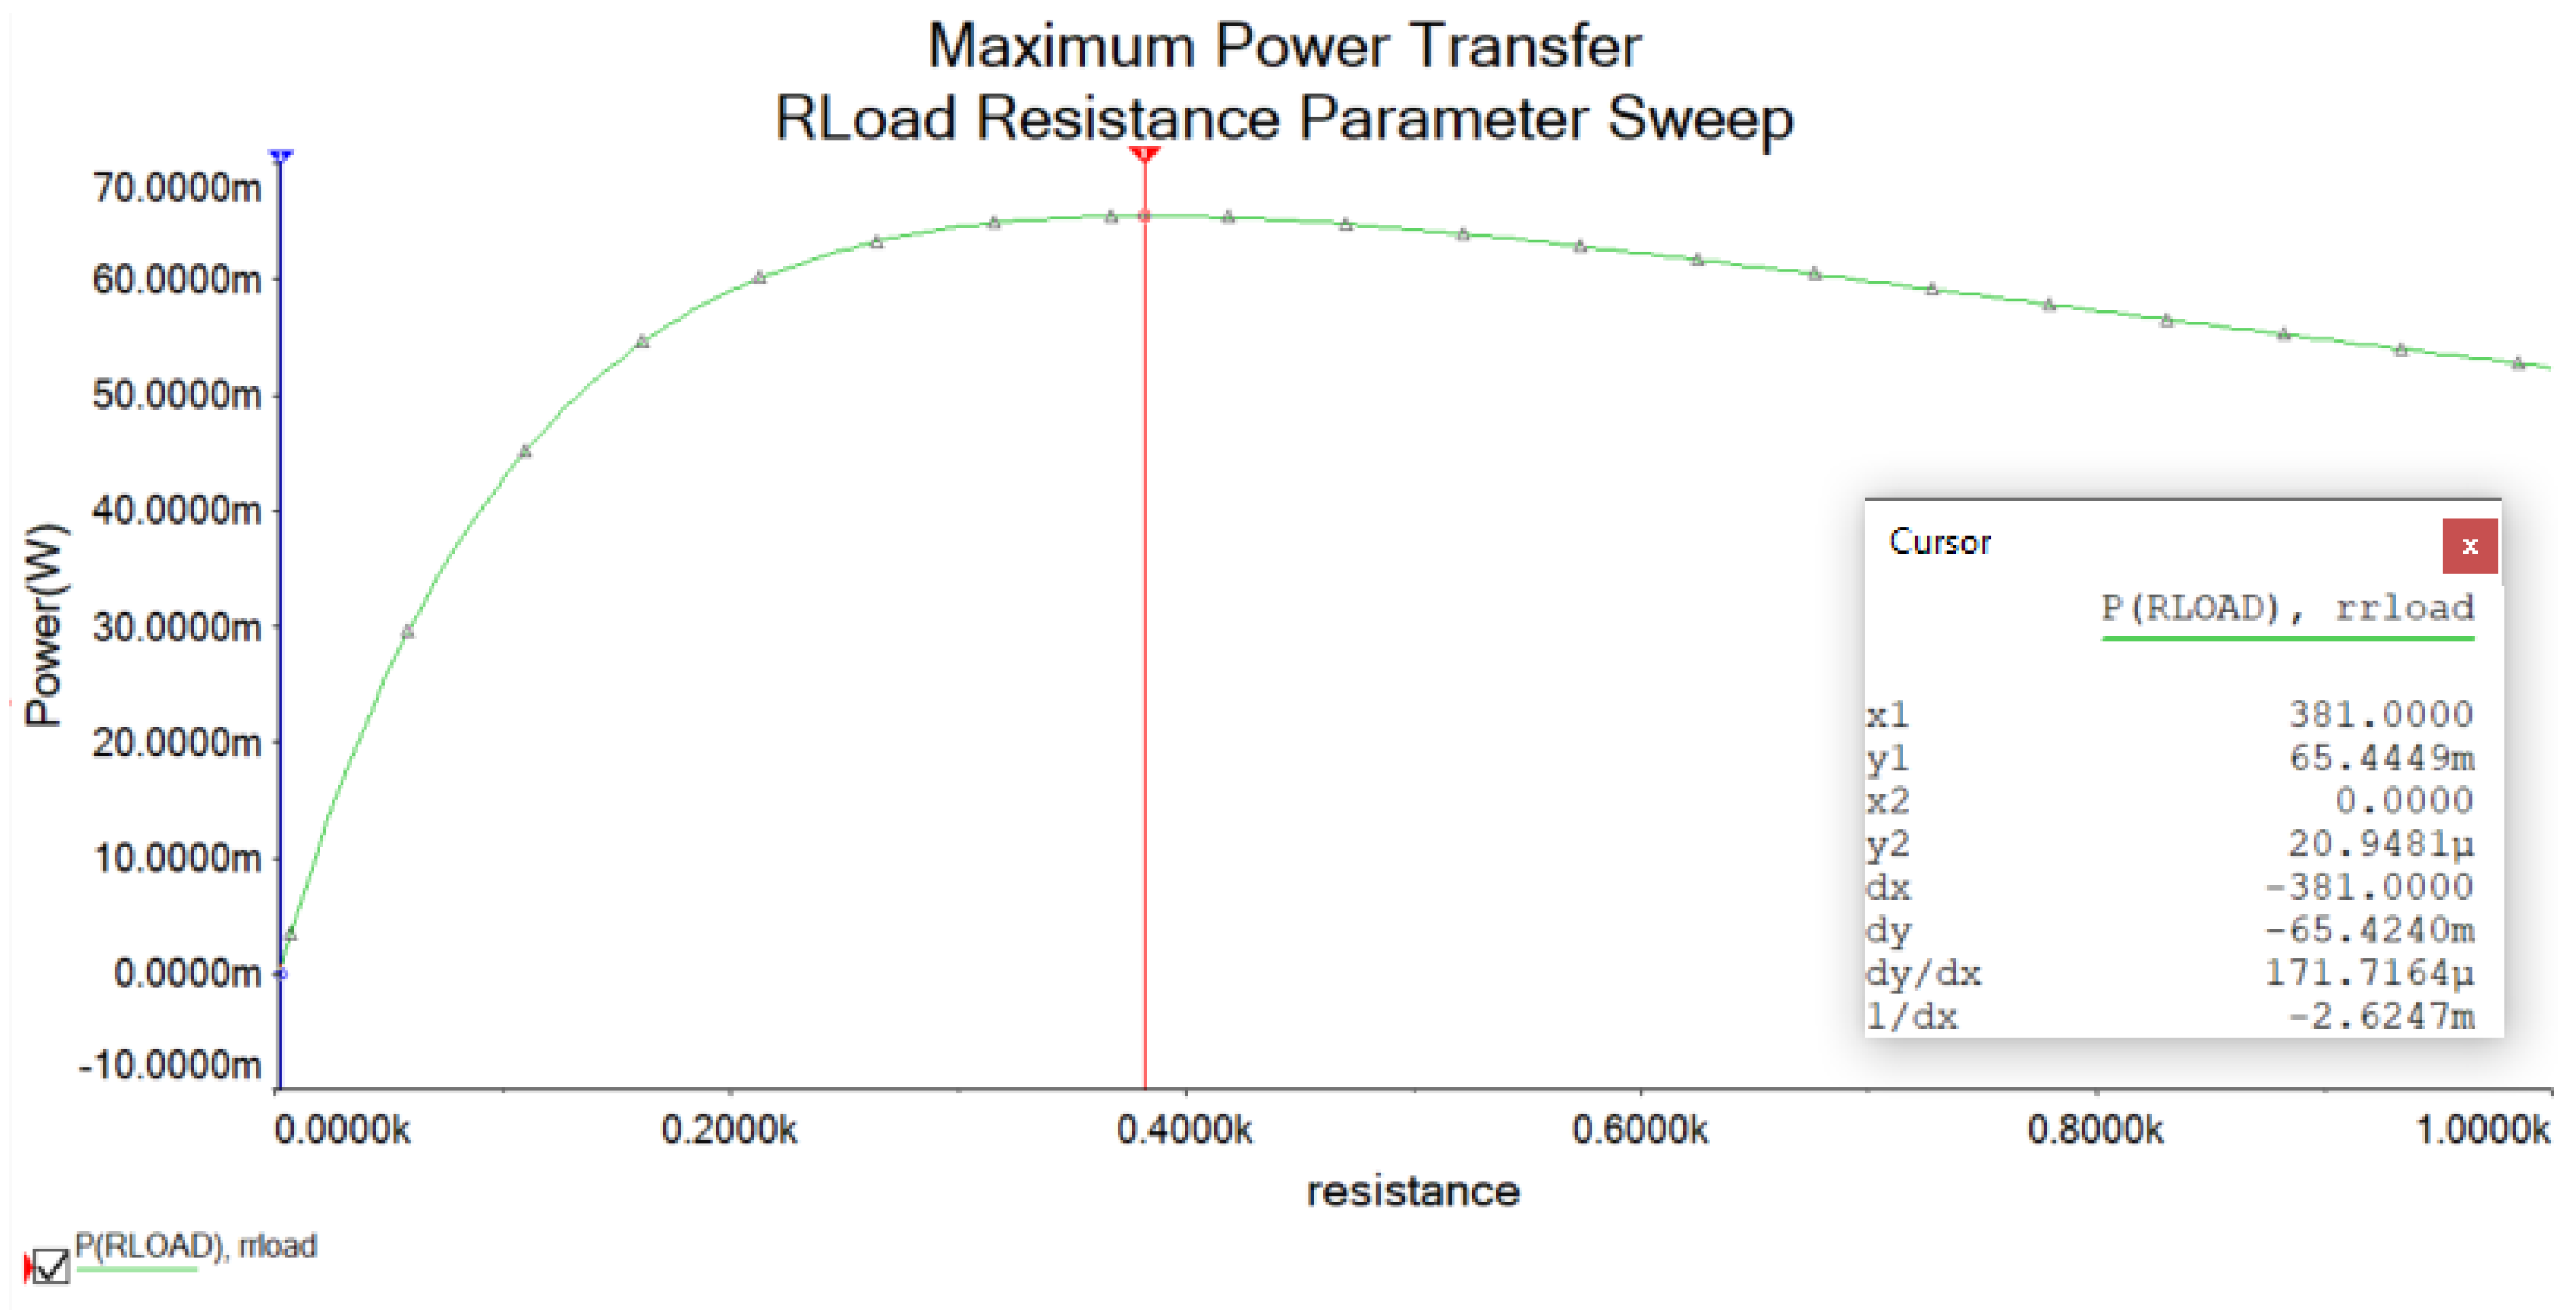
The load resistance that consumes the maximum power has the same value as the output impedance of the circuit. A parameter sweep analysis was carried out with the SPICE software to check the resistance value of the load that produced the maximum power transfer.
Figure 2 shows the power in the load resistance for resistance values from 1 Ω to 1000 Ω, where the maximum energy transfer corresponds to 381 Ω.
An inline diode bridge B40C5000-3300, with a forward voltage drop of 1.1 V, was used in the platform (
Figure 3). An external capacitor with a capacitance of 22 µF was chosen according to [
28]. This capacitor had sufficient capacitance to act as a filter at the rectifier output and to store the charge before supplying a load.
3. Results
Experiments were performed by people with different weights and stepping patterns on the platform in various positions. The energy stored in the capacitor was measured. It was necessary that all transducers produce positive and negative voltages at the same time, and therefore the currents were adding from one to another. The bars of the platform tended to distribute the force equally to the transducer, and the energy produced by the transducers was accumulated.
3.1. Comparison of Different Piezoelectric Transducers on the Platform
An analysis was conducted of the transducers described in
Section 3 on the same prototype platform. The piezoelectric transducers were placed in the grooves to be pressed by the rods. Since each side of the platform measured 30 cm, the number of transducers that could fit on each of the two rails varied depending on the size of the piezoelectric. In the case of the largest piezoelectric, 8.5 cm long, a total of six piezoelectric were placed (three on each side).
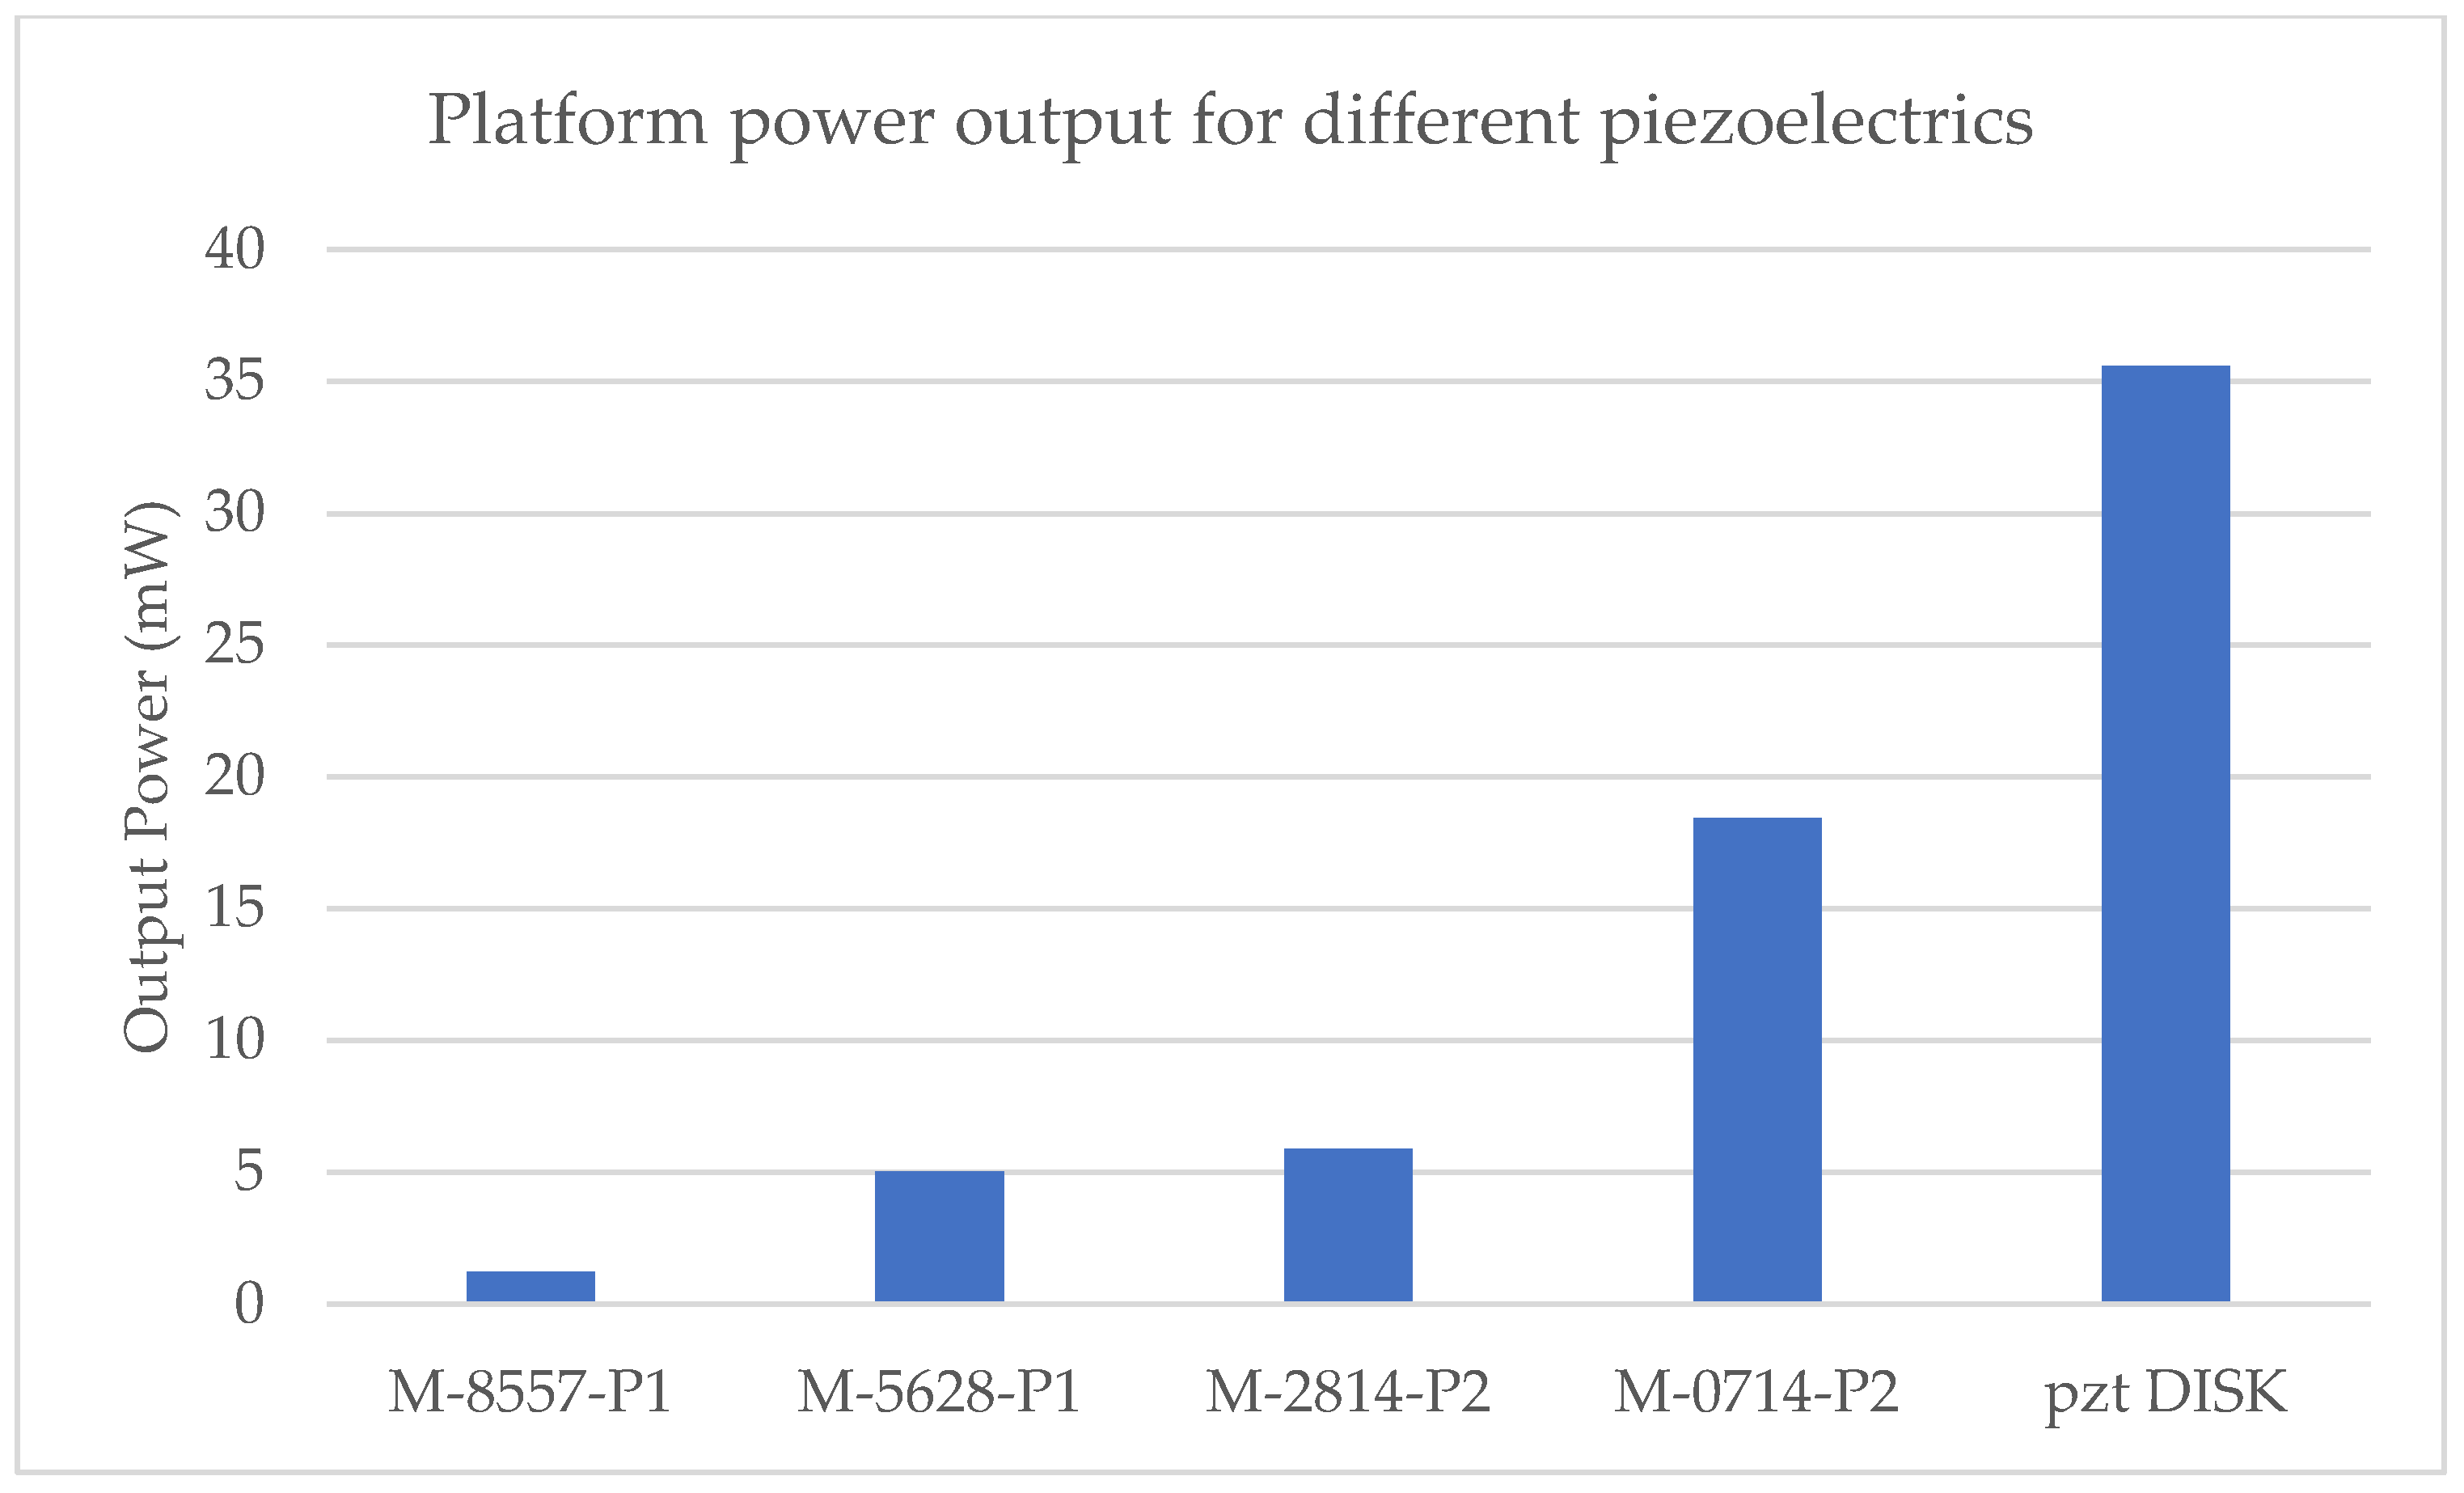
Table 3 shows the voltage, current, and power outputs for the footsteps of a 70 kg person for the piezoelectric transducers.
Figure 4 shows the power output for each transducer arrangement. The largest piezoelectric, M-8557-P1, generates the least power, mainly because the pressure is not transmitted uniformly throughout the entire piezoelectric because of its size. Another disadvantage is the smaller number of transducers that fit in the grooves in the platform. However, the MFC 0714 P2 piezoelectric, with a size that is close to the perimeter of the pressure rod, generates a higher voltage. In this case, the force applied by the rod to deform the entire piezoelectric is better distributed as compared with larger transducers, generating a higher voltage. In addition, its smaller size leads to more transducers distributed on the platform.
The piezoelectric PZT disk generates a greater amount of energy with even a smaller number of transducers than any of the MFCs. The configuration of the platform based on piezoelectric PZT disks generated 93% more power than MFC 0714-P2.
3.2. Linearity Study and Distribution of Forces on the Platform
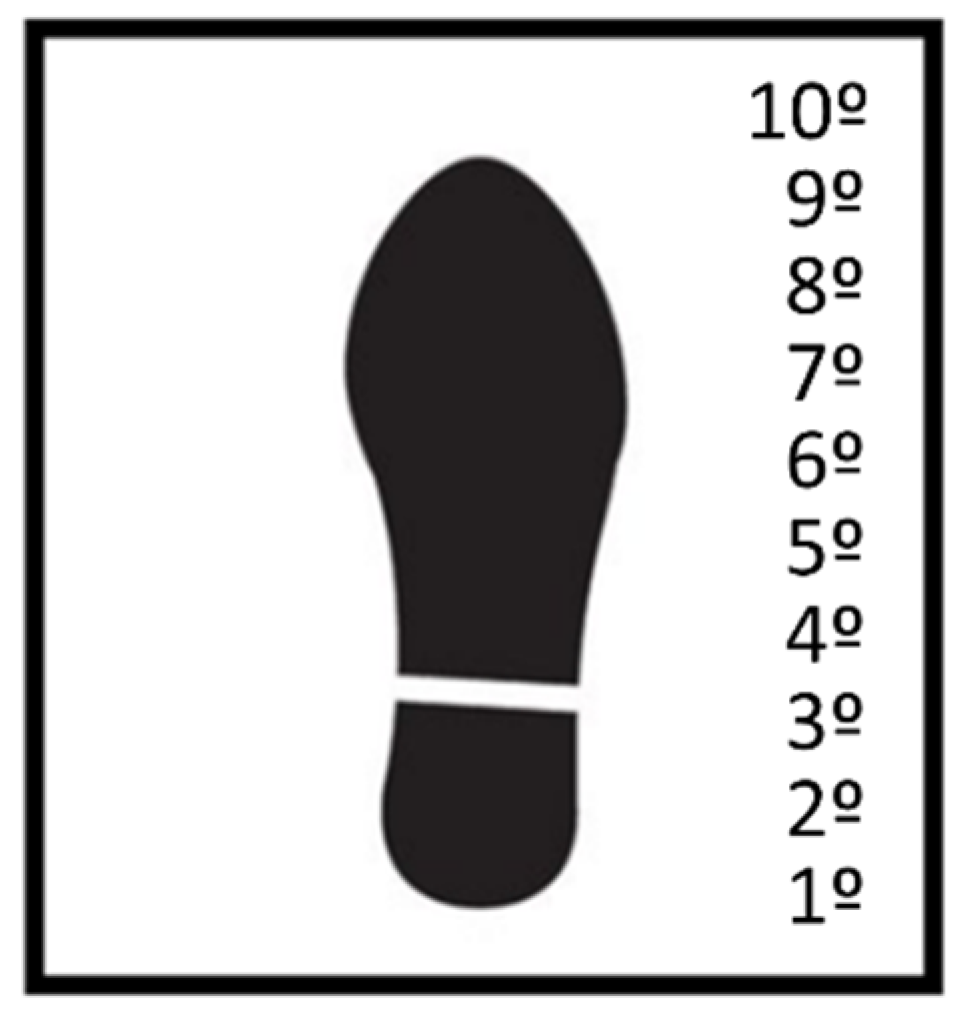
Ten piezoelectric transducers, in a row on the platform, were employed to study the distribution of tread forces on the platform. The first piezoelectric corresponds to the heel area of the foot. The fifth piezoelectric corresponds to the arch of the foot. The seventh piezoelectric correspond to the metatarsal area and, finally, the tenth piezoelectric correspond to the tips of the toes (
Figure 5).
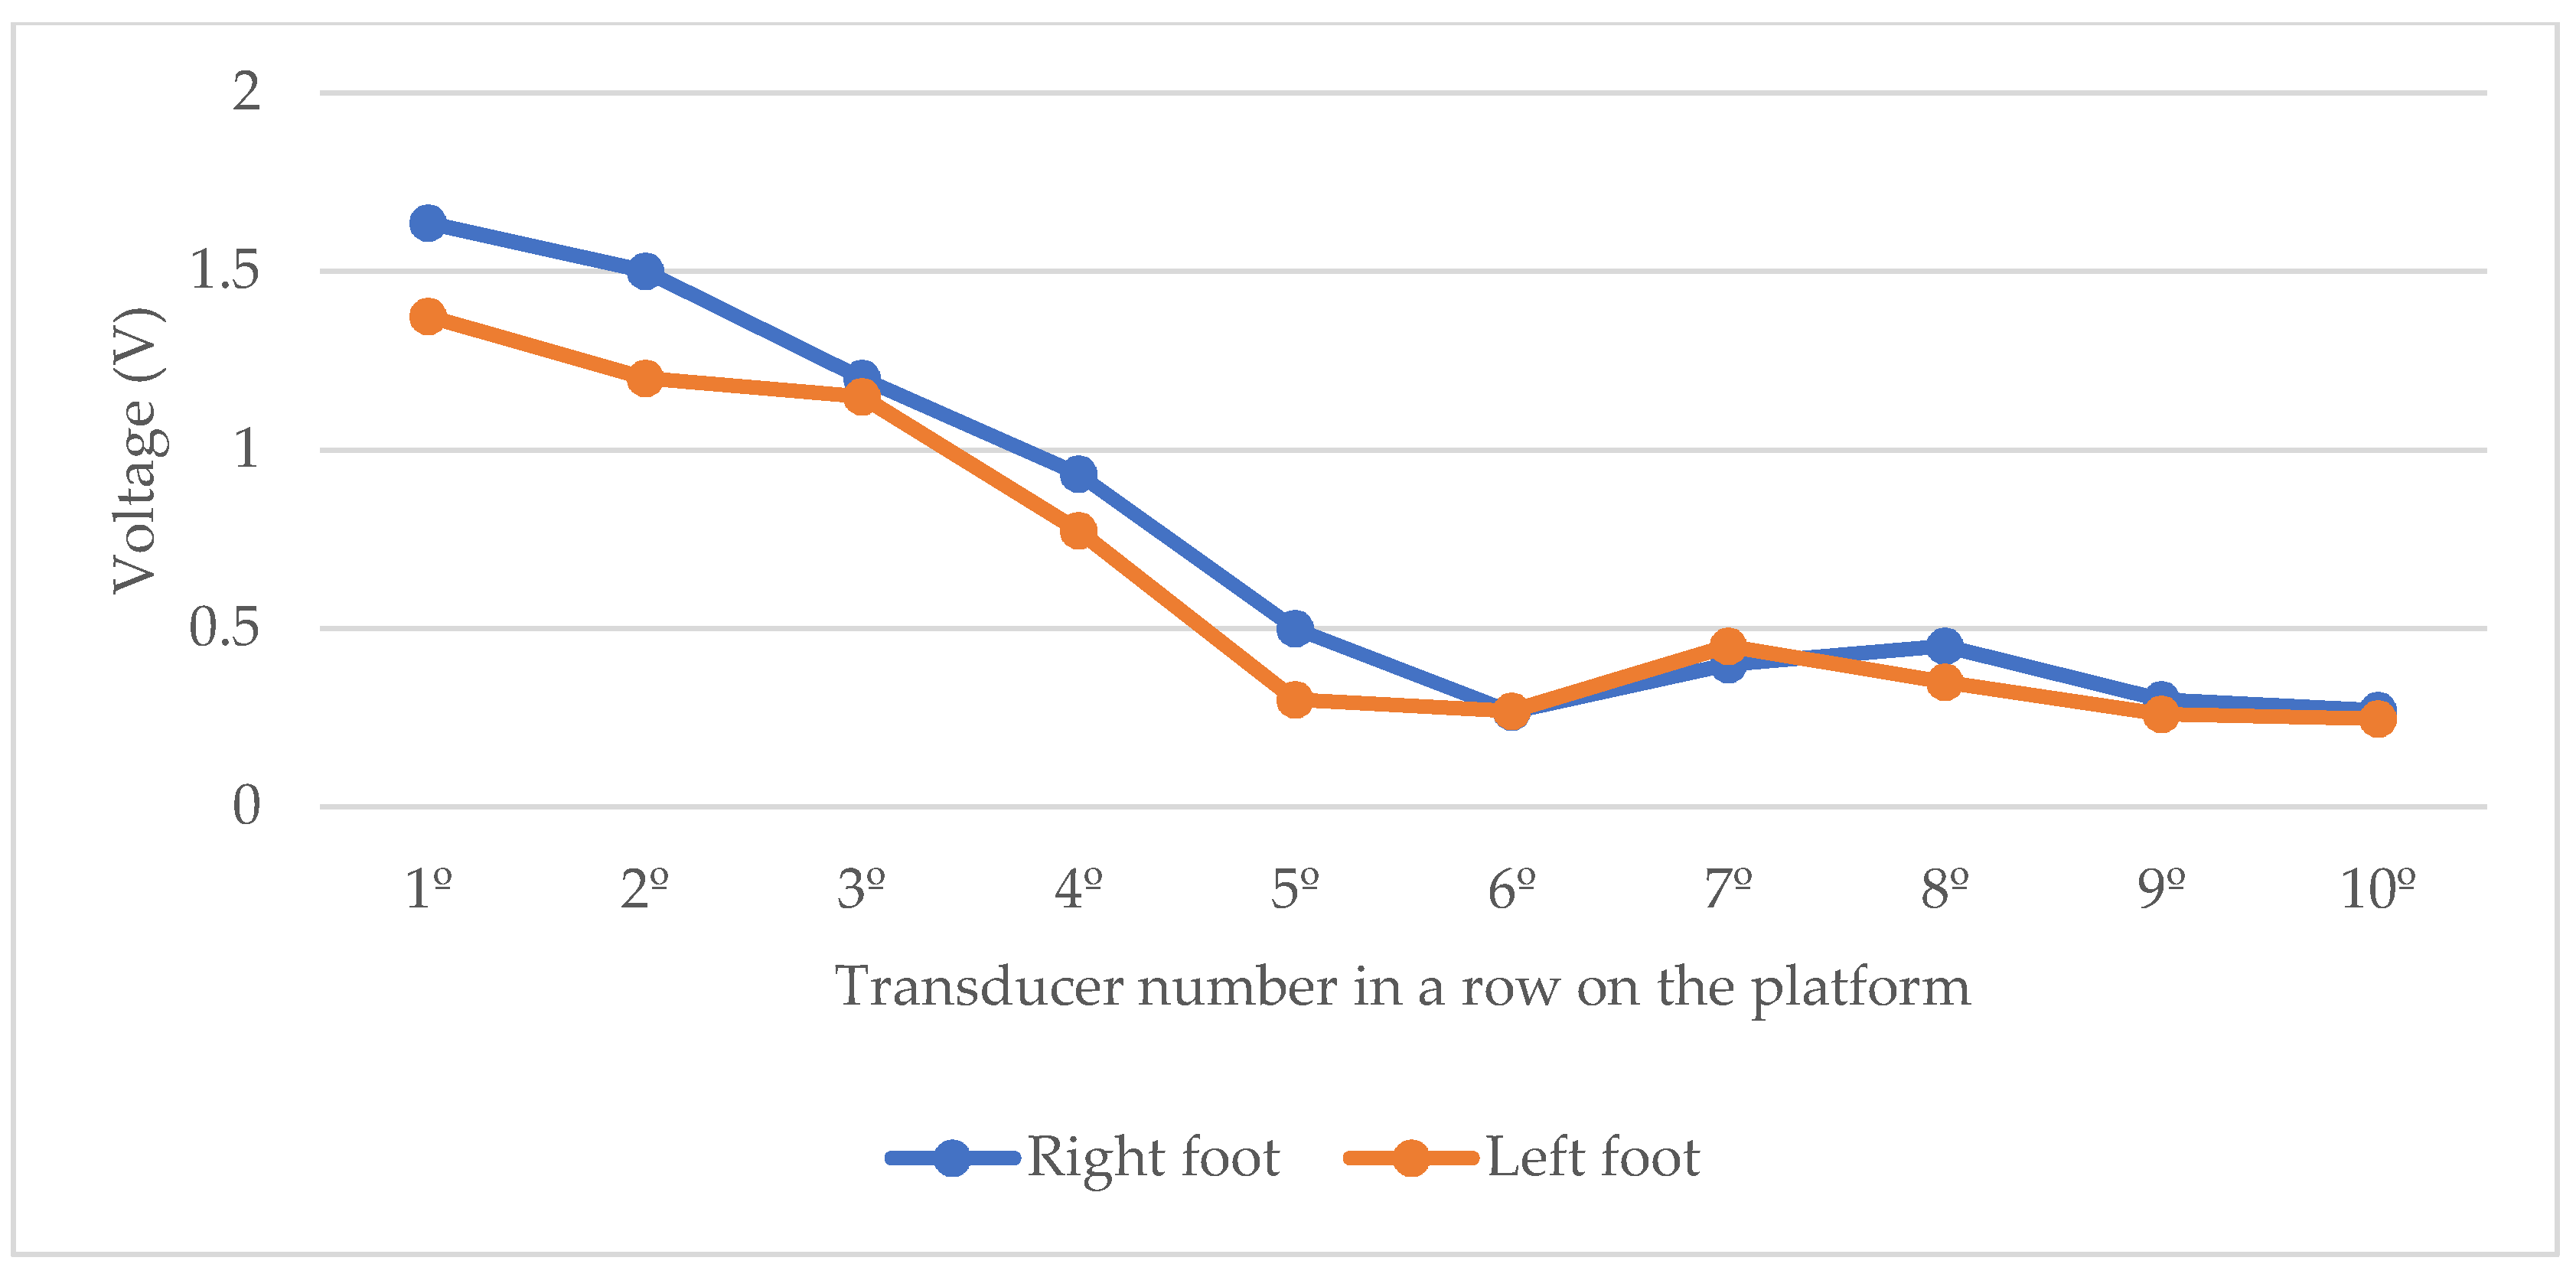
The difference in the voltage of each piezoelectric terminal was directly measured. An 80 kg person took five steps with each foot. The voltage generated by each piezoelectric is shown in
Figure 6, and allows one to estimate the distribution of forces along the row of transducers.
Figure 6 shows that, in this arrangement, the heel of the foot is the area that exerts the greatest pressure on transducers 1º, 2º, and 3º, and, afterwards, the pressure is considerably reduced. The reduction of the output voltage is because this area coincides with the arch of the foot, or fascia; therefore, less pressure is exerted in this area. Then, there is a slight increase in the voltage of transducers 7º and 8º, corresponding to the metatarsal part, and this exerts a slightly higher pressure.
3.3. Energy Harvested by the Platform with Lead Zirconate Titanate (PZT) Disks Considering Different Conditions
The experiments were conducted considering different conditions to measure the energy harvested in real case studies. Three persons with different weights were employed for the platform experiments to check the influence of weight on the energy generation by the platform. The weights of each person were 85, 70, and 55 kg.
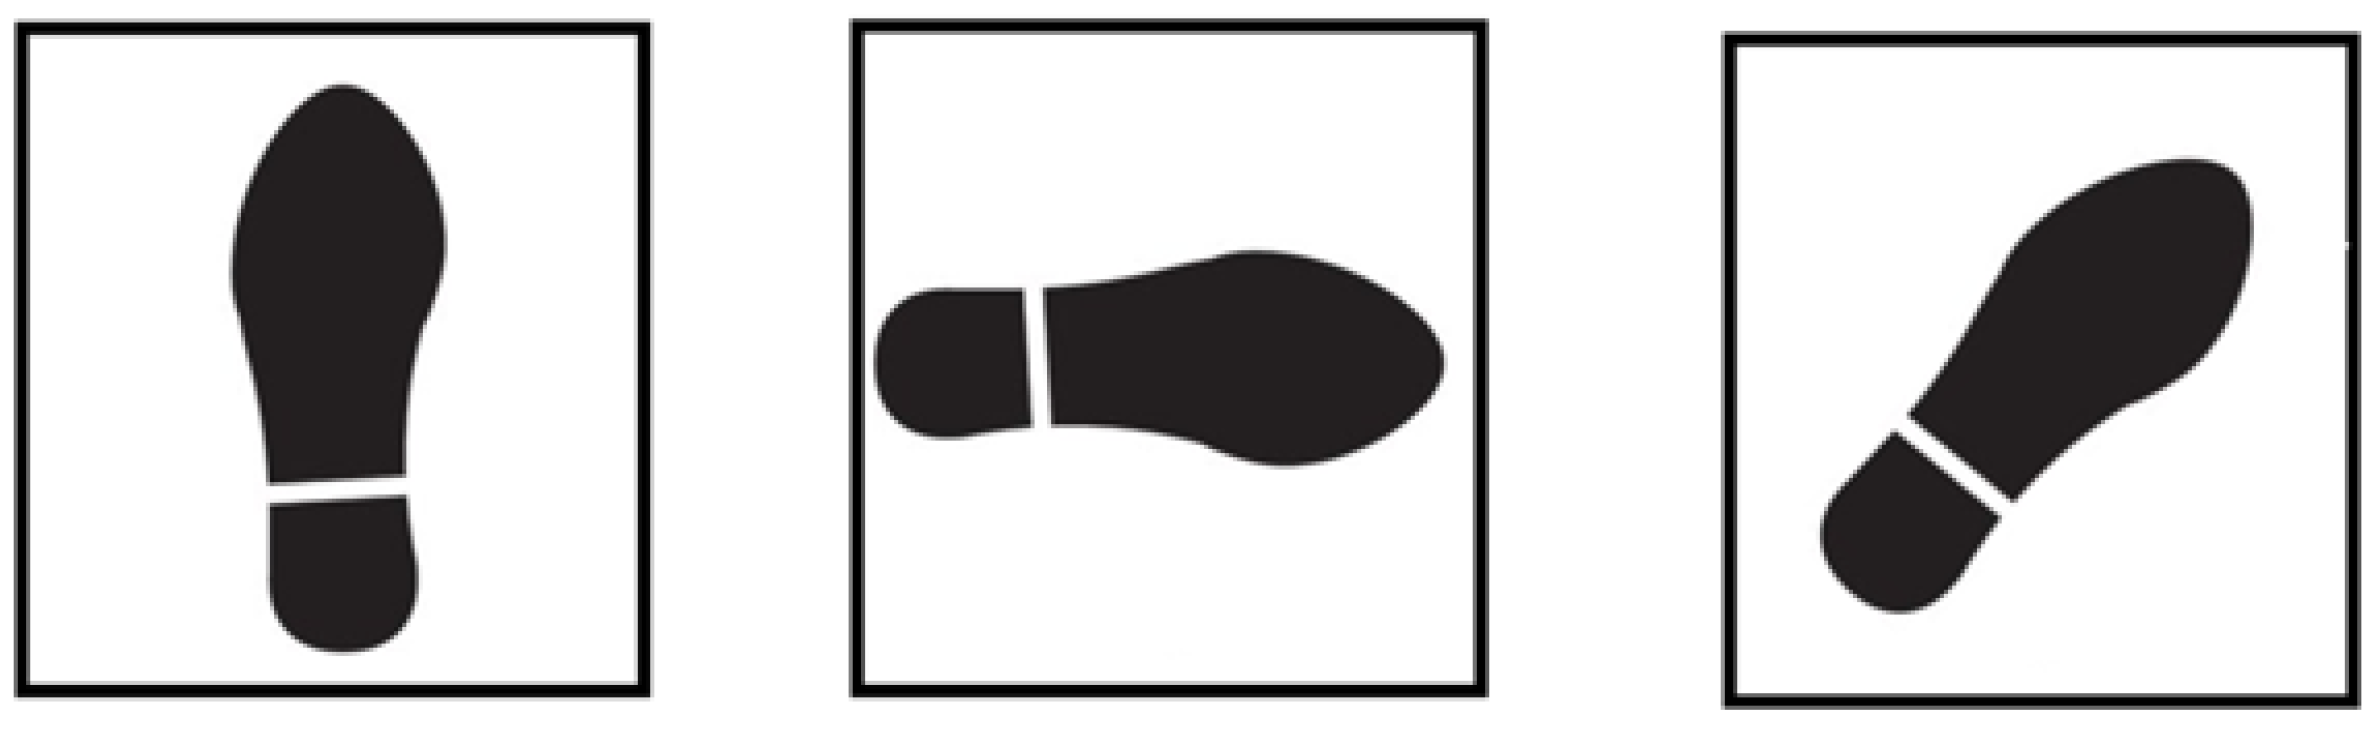
Moreover, the platform was stepped on in three different positions, see
Figure 7, to measure the effect of the footfall direction on power generation:
First Position: Standing with one foot on the vertical axis.
Second Position: Standing with one foot on the horizontal axis.
Third Position: Standing with one foot on the diagonal axis.
Each test consists of a person stepping on the platform in a specific position. Then, the voltage in the capacitor is measured. Once the voltage of the capacitor is known, the energy stored in the capacitor is obtained by Equation (1).
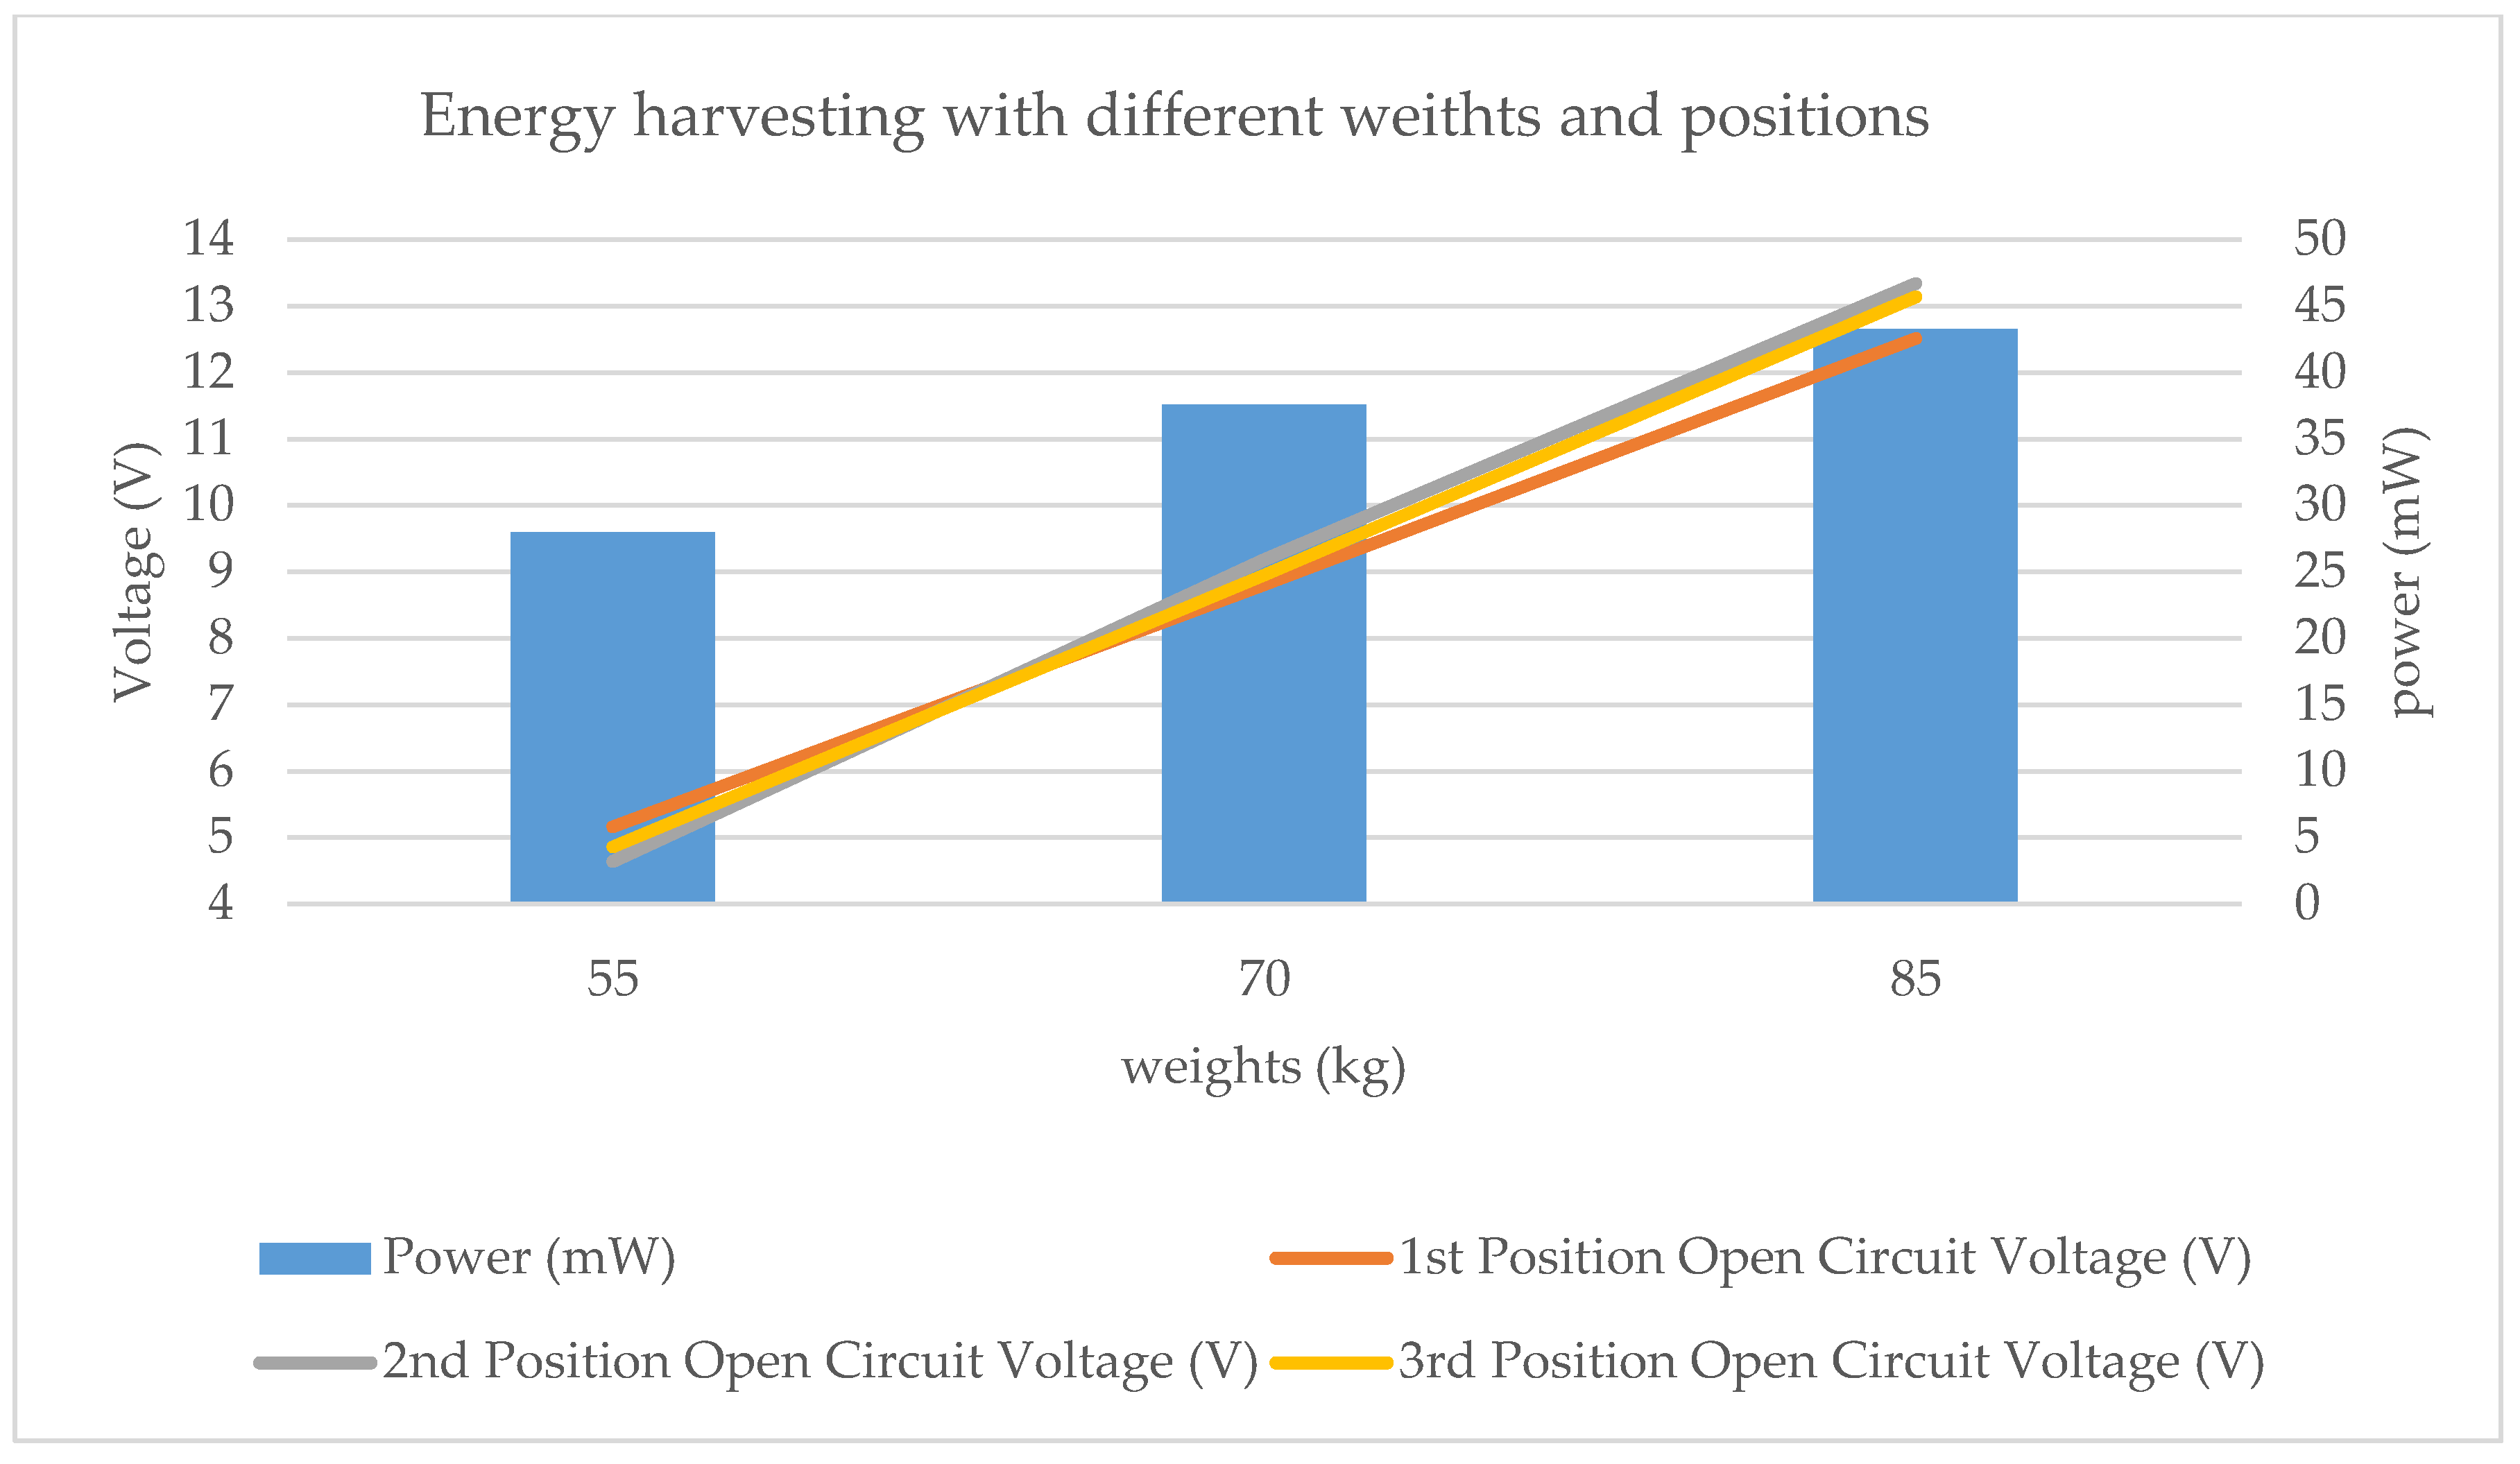
Table 4 shows the voltage generated by the platform by the footfall of persons with different weights and positions.
Table 4 shows that the step does not have a great effect on the output voltage of the platform. However, the voltage generated by the platform is directly related to the weight according to
Figure 8.
The power generated by the platform in each step at the output of the rectifier can be obtained by Equation (2) and is shown in
Table 5.
4. Prototype Piezoelectric Floor Analysis
A comparison of the different piezoelectric platforms in the market has been presented by Elhalwagy et al. [
8]. The firms, Waynergy Floor, Sustainable Energy Floor (SEF), and Pavegen Tiles have built their piezoelectric platforms for specific purposes and installed them in public places such as train stations, airports, shopping centers, offices, etc. These piezoelectric platforms have high power generation yields, i.e., reaching 10 W per step, with the cost of Waynergy Floor platforms 400€ per unit, Sustainable Energy Floor platforms around 800€, and Pavegen Tiles platforms around 1800€ [
8].
Although the performance of the prototype presented in this work is lower than those platforms, the price of the materials used for its construction does not exceed 30€, being a low-cost device, but the business study has not been considered yet.
In addition, the power generation per step is higher than other commercial piezoelectric platforms, for example, Sound Power, which generates, PZT ceramic, Parquet PVDF layers, Drum Harvesters Piezo buzzer Piezoelectric Ceramic, and Power Leap PZT [
8]. The power generated by the platforms, in this paper, for a person weighing 85 kg, reached 43.3 mW per step, which was more than some commercial platforms. This platform was analyzed to compare the different performances using different piezoelectric devices, and it has not been considered for any commercial use.
Table 6 shows the main commercial piezoelectric floors together with the platform presented in this paper. The low cost of this platform could be an option for certain applications where low energy consumption is required, for example, powering circuits, LED lighting, transmitting signals via Bluetooth, IoT, etc. We also observed that its good performance is comparable with other similar commercial solutions due to the choice of PZTs disks and their arrangement on the platform.
The electrical energy that a piezoelectric floor generates is lower as compared with other energy sources, but it could be enough for applications that require low consumption, for example, feeding circuits, smart homes, communications, and, IoT [
14,
30].
5. Conclusions and Future Works
The versatility of the piezoelectric effect has contributed to new uses of piezoelectricity in modern technologies, for example, energy harvesting. The piezoelectric effect is employed in this paper to convert mechanical energy present in the form of vibrations and movements into electrical energy. A piezoelectric floor is designed to transform the mechanical energy of the footfalls of people into electric energy. The main conclusions are:
The performance offered by different types of piezoelectric transducers and different sizes has been studied. The macro fiber composite piezoelectric that generated more voltage at the output in the experiments was the MFC M-0714-P2 type. However, the piezoelectric PZT generated 93% higher output power under the same conditions.
A study on the distribution of forces along the footfall has been carried out for the arrangement of piezoelectric PZT. The voltage generated individually by each piezoelectric was analyzed to determine those areas where more pressure was exerted to optimize future piezoelectric platforms.
A study has been carried out of the power generated by the platform for people with different weights and for three different directions of their steps.
Finally, a basic business study has been conducted according to commercial platforms.
Author Contributions
Conceptualization, C.Q.G.M. and G.Z.A.; methodology, C.Q.G.M. and G.Z.A.; validation F.P.G.M.; formal analysis, C.Q.G.M. and F.P.G.M.; investigation, G.Z.A. and C.Q.G.M.; resources, F.P.G.M.; writing—original draft preparation, C.Q.G.M.; writing—review and editing, F.P.G.M. and C.Q.G.M.; funding acquisition, F.P.G.M. All authors have read and agreed to the published version of the manuscript.
Funding
The work reported herewith has been financially by the Dirección General de Universidades, Investigación e Innovación of Castilla-La Mancha, under Research Grant ProSeaWind project (Ref.: SBPLY/19/180501/000102).
Acknowledgments
The authors like to thank Alfredo Peinado (Birmingham University, UK) for his detailed revision of the context.
Conflicts of Interest
The authors declare no conflict of interest.
References
- Harb, A. Energy harvesting: State-of-the-art. Renew. Energy 2011, 36, 2641–2654. [Google Scholar] [CrossRef]
- Stephen, N.G. On energy harvesting from ambient vibration. J. Sound Vib. 2006, 293, 409–425. [Google Scholar] [CrossRef] [Green Version]
- Marquez, F.G. An Approach to Remote Condition Monitoring Systems Management; IET International Conference on Railway Condition Monitoring: Birmingham, UK, 2006. [Google Scholar]
- Arcos Jiménez, A.; Gómez Muñoz, C.Q.; García Márquez, F.P. Machine learning for wind turbine blades maintenance management. Energies 2018, 11, 13. [Google Scholar] [CrossRef] [Green Version]
- Rocha, J.G.; Goncalves, L.M.; Rocha, P.; Silva, M.P.; Lanceros-Mendez, S. Energy harvesting from piezoelectric materials fully integrated in footwear. IEEE Trans. Ind. Electron. 2009, 57, 813–819. [Google Scholar] [CrossRef]
- Marioli, D.; Sardini, E.; Serpelloni, M. Electromagnetic generators employing planar inductors for autonomous sensor applications. Procedia Chem. 2009, 1, 469–472. [Google Scholar] [CrossRef] [Green Version]
- Uchino, K. Piezoelectric energy harvesting systems—Essentials to successful developments. Energy Technol. 2018, 6, 829–848. [Google Scholar] [CrossRef]
- Elhalwagy, A.M.; Ghoneem, M.Y.M.; Elhadidi, M. Feasibility study for using piezoelectric energy harvesting floor in buildings’ interior spaces. Energy Procedia 2017, 115, 114–126. [Google Scholar] [CrossRef]
- Seralathan, S.; Rao, A.S.; Babavali, S.B.; Lokesh, S.M.; Hariram, V. Design and structural analysis of different piezoelectric tile materials subjected to varied loading conditions. Mater. Today Proc. 2020. [Google Scholar] [CrossRef]
- Wang, H.; Sun, C. Finite element analysis on a square canister piezoelectric energy harvester in asphalt pavement. World J. Eng. Technol. 2016, 4, 361. [Google Scholar] [CrossRef] [Green Version]
- Cascetta, F.; Schiavo, A.L.; Minardo, A.; Musto, M.; Rotondo, G.; Calcagni, A. Analysis of the energy extracted by a harvester based on a piezoelectric tile. Curr. Appl. Phys. 2018, 18, 905–911. [Google Scholar] [CrossRef]
- Song, H.-C.; Kang, C.-Y.; Yoon, S.-J.; Jeong, D.-Y. Analysis of stress distribution in flexible piezoelectric energy harvester. J. Ceram. Soc. Jpn. 2009, 117, 1074–1077. [Google Scholar] [CrossRef] [Green Version]
- Okayasu, M.; Watanabe, K. Precise analysis of compressive strain effects on electric power generation properties of a lead zirconate titanate piezoelectric ceramic. J. Adv. Ceram. 2016, 5, 35–39. [Google Scholar] [CrossRef] [Green Version]
- Panthongsy, P.; Isarakorn, D.; Janphuang, P.; Hamamoto, K. Fabrication and evaluation of energy harvesting floor using piezoelectric frequency up-converting mechanism. Sens. Actuators A Phys. 2018, 279, 321–330. [Google Scholar] [CrossRef]
- Bizon, N.; Tabatabaei, N.M.; Blaabjerg, F.; Kurt, E. Energy Harvesting and Energy Efficiency; Springer: Berlin/Heidelberg, Germany, 2017. [Google Scholar]
- Muñoz, C.Q.G.; Marquez, F.P.G.; Lev, B.; Arcos, A. New pipe notch detection and location method for short distances employing ultrasonic guided waves. Acta Acust. United Acust. 2017, 103, 772–781. [Google Scholar] [CrossRef] [Green Version]
- Gómez Muñoz, C.Q.; García Marquez, F.P.; Hernandez Crespo, B.; Makaya, K. Structural health monitoring for delamination detection and location in wind turbine blades employing guided waves. Wind Energy 2019, 22, 698–711. [Google Scholar] [CrossRef] [Green Version]
- Gómez Muñoz, C.Q.; Arcos Jiménez, A.; García Márquez, F.P.; Kogia, M.; Cheng, L.; Mohimi, A.; Papaelias, M. Cracks and welds detection approach in solar receiver tubes employing electromagnetic acoustic transducers. Struct. Health Monit. 2018, 17, 1046–1055. [Google Scholar] [CrossRef]
- García Marquez, F.P.; Gómez Muñoz, C.Q. A new approach for fault detection, location and diagnosis by ultrasonic testing. Energies 2020, 13, 1192. [Google Scholar] [CrossRef] [Green Version]
- Jiménez, A.A.; Zhang, L.; Muñoz, C.Q.G.; Márquez, F.P.G. Maintenance management based on machine learning and nonlinear features in wind turbines. Renew. Energy 2020, 146, 316–328. [Google Scholar] [CrossRef]
- Gomez, C.Q.; Garcia, F.P.; Arcos, A.; Cheng, L.; Kogia, M.; Papelias, M. Calculus of the defect severity with emats by analysing the attenuation curves of the guided waves. Smart Struct. Syst. 2017, 19, 195–202. [Google Scholar] [CrossRef]
- Gómez, C.; García, F.; Arcos, A.; Cheng, L.; Kogia, M.; Mohimi, A.; Papaelias, M. A heuristic method for detecting and locating faults employing electromagnetic acoustic transducers. Eksploat. Niezawodn. 2017, 19, 493–500. [Google Scholar] [CrossRef]
- Anton, S.R.; Sodano, H.A. A review of power harvesting using piezoelectric materials (2003–2006). Smart Mater. Struct. 2007, 16, R1. [Google Scholar] [CrossRef]
- Jiménez, A.A.; Márquez, F.P.G.; Moraleda, V.B.; Muñoz, C.Q.G. Linear and nonlinear features and machine learning for wind turbine blade ice detection and diagnosis. Renew. Energy 2019, 132, 1034–1048. [Google Scholar] [CrossRef] [Green Version]
- Muñoz, C.Q.G.; Jiménez, A.A.; Márquez, F.P.G. Wavelet transforms and pattern recognition on ultrasonic guides waves for frozen surface state diagnosis. Renew. Energy 2018, 116, 42–54. [Google Scholar] [CrossRef]
- Ramadass, Y.K.; Chandrakasan, A.P. An efficient piezoelectric energy harvesting interface circuit using a bias-flip rectifier and shared inductor. IEEE J. Solid-State Circuits 2009, 45, 189–204. [Google Scholar] [CrossRef] [Green Version]
- Wu, L.; Do, X.-D.; Lee, S.-G.; Ha, D.S. A self-powered and optimal sshi circuit integrated with an active rectifier for piezoelectric energy harvesting. IEEE Trans. Circuits Syst. Regul. Pap. 2016, 64, 537–549. [Google Scholar] [CrossRef]
- Lee, J.; Choi, B. A study on the piezoelectric energy conversion system using motor vibration. Int. J. Precis. Eng. Manuf. 2012, 13, 573–579. [Google Scholar] [CrossRef]
- Shu, Y.-C. Performance evaluation of vibration-based piezoelectric energy scavengers. In Energy Harvesting Technologies; Springer: Boston, MA, USA, 2009; pp. 79–105. [Google Scholar]
- Kim, K.-B.; Cho, J.Y.; Jabbar, H.; Ahn, J.H.; Do Hong, S.; Woo, S.B.; Sung, T.H. Optimized composite piezoelectric energy harvesting floor tile for smart home energy management. Energy Convers. Manag. 2018, 171, 31–37. [Google Scholar] [CrossRef]
© 2020 by the authors. Licensee MDPI, Basel, Switzerland. This article is an open access article distributed under the terms and conditions of the Creative Commons Attribution (CC BY) license (http://creativecommons.org/licenses/by/4.0/).


