Article

Driver Attention Area Extraction Method Based on Deep Network Feature Visualization

School of Mechanical Engineering, Xi’an University of Science and Technology, Xi’an 710054, China
*
Author to whom correspondence should be addressed.
Appl. Sci. 2020, 10(16), 5474; https://doi.org/10.3390/app10165474
Submission received: 11 July 2020 / Revised: 29 July 2020 / Accepted: 6 August 2020 / Published: 7 August 2020
(This article belongs to the Special Issue Intelligent Transportation Systems: Beyond Intelligent Vehicles)

Abstract

:

Featured Application

The method proposed in our paper is mainly applied to intelligent driving, driving training and other fields. Our method greatly solves the problems of complex information processing and massive consumption of computing resources in the field of intelligent driving. We can find the area that drivers are most interested in among many items of complicated information. The application of our method can reduce the cost of driverless driving, thereby promoting the early realization of unmanned driving. The method can also be applied to the field of driving training, for example, a novice driver can use our method to judge whether the driver’s attention area is correct and ensure driving safety.

Abstract

The current intelligent driving technology based on image data is being widely used. However, the analysis of traffic accidents occurred in intelligent driving vehicles shows that there is an explanatory difference between the intelligent driving system based on image data and the driver’s understanding of the target information in the image. In addition, driving behavior is the driver’s response based on the analysis of road information, which is not available in the current intelligent driving system. In order to solve this problem, our paper proposes a driver attention area extraction method based on deep network feature visualization. In our method, we construct a Driver Behavior Information Network (DBIN) to map the relation between image information and driving behavior. Then we use the Deep Network Feature Visualization method (DNFV) to determine the driver’s attention area. The experimental results show that our method can extract effective road information from a real traffic scene picture and obtain the driver’s attention area. Our method can provide a useful theoretical basis and related technology of visual perception for future intelligent driving systems, driving training and assisted driving systems.

1. Introduction

Traffic driving scene is an extremely complex scene, which is characterized by three-dimensional diversification and rapid change of information. In the current field of intelligent driving, the target detection algorithm based on YOLO [1,2] and the target detection algorithm based on SSD [3] both detect all targets, which not only increase the calculation cost due to processing a lot of useless information, but also cannot extract the effective information from the outside and make corresponding driving behaviors like a real driver. Human visual selective attention mechanism is an important neural mechanism for a visual system to extract key scene information and filter redundant information. The combination of human visual selective attention mechanisms and intelligent driving technology can greatly reduce the cost of intelligent driving and promote the popularization of intelligent driving technology. Furthermore, it can also promote the interpretive approach of artificial intelligence in the field of intelligent driving, which is helpful to develop safer and more intelligent driverless vehicles. Therefore, the extraction methods of driver’s attention area in traffic driving scenes have gradually become the research hotspot of intelligent driving vehicles, and many experts and scholars have carried out extensive research on the subject.
Yun S.K. et al. [4] obtained a series of physiological parameters such as electroencephalogram (EEG), electrooculogram (EOG) and electrocardiogram (ECG) through the driver wearing various types of medical monitoring equipment, which were used to detect the driver’s attention. By analyzing those detected physiological parameters, it can be concluded that the ECG will change significantly when the driver is accelerating, braking and steering. When the driver is tired, their heart rate will decrease significantly. Obviously, when the driver is tired or distracted, their physical parameters will change significantly. Bibhukalyan Prasad Nayak et al. [5] concluded the following from their experiment: when the driver is in a state of severe fatigue and the concentration is significantly reduced, the high-frequency ECG component will drop sharply. Qun Wu et al. [6] used principal component analysis method based on kernel function to analyze ECG signals, and separated fatigue state from normal state, thus detecting driver’s distraction. Li-Wei Ko [7] developed a single-channel wireless EEG solution for mobile phone platform, which can detect driver’s fatigue state in real time. Moreover, Degui Xiao et al. [8] suggested that it is the driver’s distraction during driving that is the main cause of traffic accidents, so they proposed an algorithm to detect whether a driver is distracted. The algorithm can track the driver’s gaze direction and detects moving objects on the road through motion compensation.
Most of the above methods focus on the detection of whether the driver’s attention is focused, and there is no discussion about the driver’s attention area. Meng-Che Chuang et al. [9] used the driver’s gaze direction as an indicator of the driver’s attention, and defined a feature descriptor for SVM gaze classifier training, which takes eight common gaze directions as the output. Francisco Vicente et al. [10] proposed a low-cost vision-based driver sight detection and tracking system, which can track the driver’s facial features, and can use the tracked landmarks and three-dimensional face model to calculate the head position and gaze direction. Sumit Jha and Carlos Busso [11] constructed a regression models to estimate the driver’s line of sight based on the head position and direction from the data in the natural driving record to determine the driver’s area of interest. Tawari et al. [12] recorded the eye movement data of the driver using head-mounted cameras and google glasses. Then they used eye tracking technology to detect the target of interest to the driver, and finally determined whether the target was located in the center of the driver’s attention. However, the above methods all require complicated instruments and equipment, so that experiments cannot be carried out on real roads. Moreover, they ignore the complex traffic scenes and have certain limitations.
In recent years, there have been few studies on the driver attention area based on real traffic scenes. Lex Fridman et al. [13] focus on a driver’s head, detecting facial landmarks to predict driver attention area. Nian Liu et al. [14] put forward a novel computational framework, which uses a multiresolution convolutional neural network (Mr-CNN) to predict eye gaze. Zhao, S. et al. [15] proposed a driver visual attention network (DVAN), which can extract the key information affecting the driver’s operation by predicting the driver’s attention points. The above method provides a new idea for the driver’s attention area extraction but there is no certainty about the adherence of predictions to the true gaze during the driving task. Andrea Palazzi et al. [16] published the data set of DR(eye)VE, which is a traffic scene video database for predicting the attention position of drivers. The DR (eye)VE data set contains 74 traffic driving videos, each of which lasts 5 min, and records the eye movement data of eight drivers during real driving. The data set is not only composed of more than 500,000 images, but also records the driver’s gaze information and its geographic location information, driving speed and driving route information; this information is not recorded in other data sets. In the follow-up work, they used the ready-made Convolutional Neural Network (CNN) algorithm to train on their database to predict the location of the driver’s attention area in the driving scene [17,18]. Tawari and Kang [19] further improved the prediction results of driver’s attention area on DR(eye)VE data set based on Bayesian theory. However, for the study of predicting driver’s attention area in the driving scenes, each video only includes the eye movement data of a single driver, which not only makes the eye movement experimental data too limited, but also is easily affected by individual differences, resulting in some important traffic scene information being ignored.
In our paper, we propose a driver attention area extraction method based on deep network feature visualization. This method mainly includes the Driving Behavior Information Network (DBIN) and the Deep Network Feature Visualization Method (DNFV). Firstly, we use the DBIN and DBNet data set [20] to construct the relationship between driver’s horizon information and driving behavior. Then, we use the DNFV to obtain the driver’s attention area. Finally, we analyzed the predicted results based on the real traffic scene and driving behavior.

2. Driver Attention Area Extraction Method

To solve the problems that the current intelligent driving field cannot effectively locate and identify the driver’s attention area during the target information extraction process, and the fact that the information processing process is complicated and expensive, we propose a driver attention area extraction method based on deep network feature visualization. This method mainly includes the Driving Behavior Information Network (DBIN) and the Deep Network Feature Visualization Method (DNFV). Among them, the role of DBIN is to determines the correspondence between driver’s horizon information and driving behavior, and the role of DNFV is to determine the driver’s attention area. Figure 1 shows the overall structure.

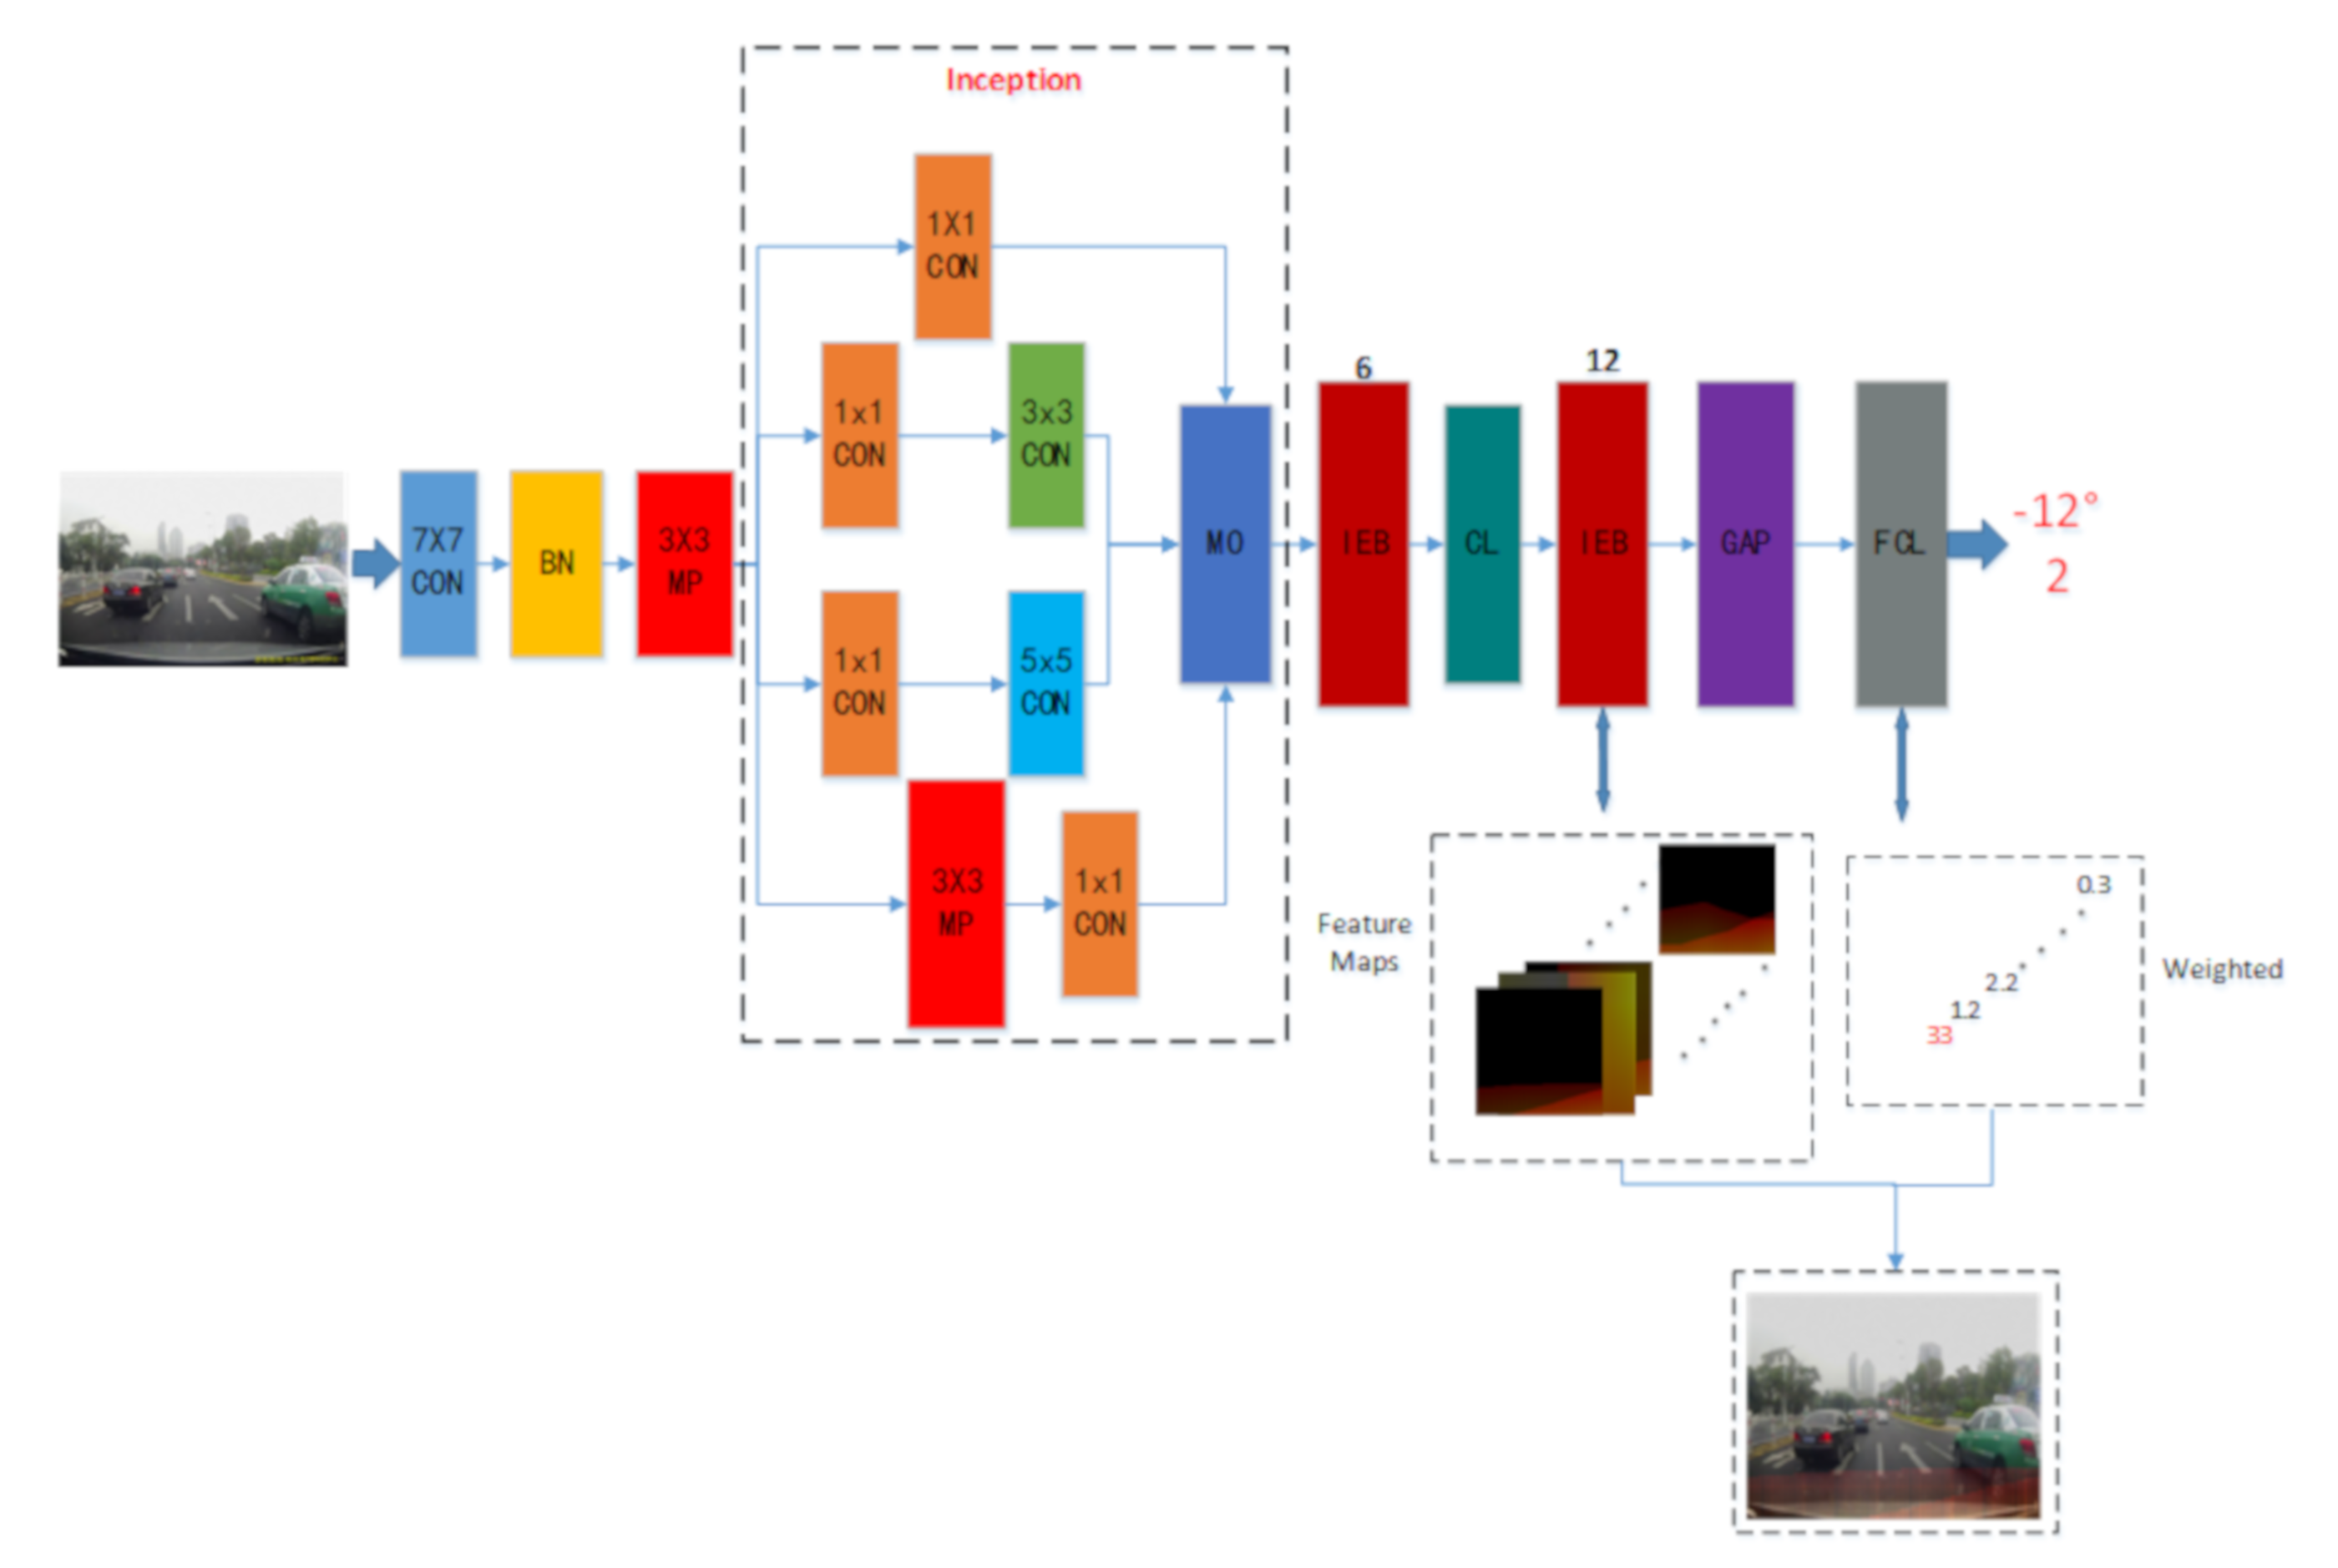
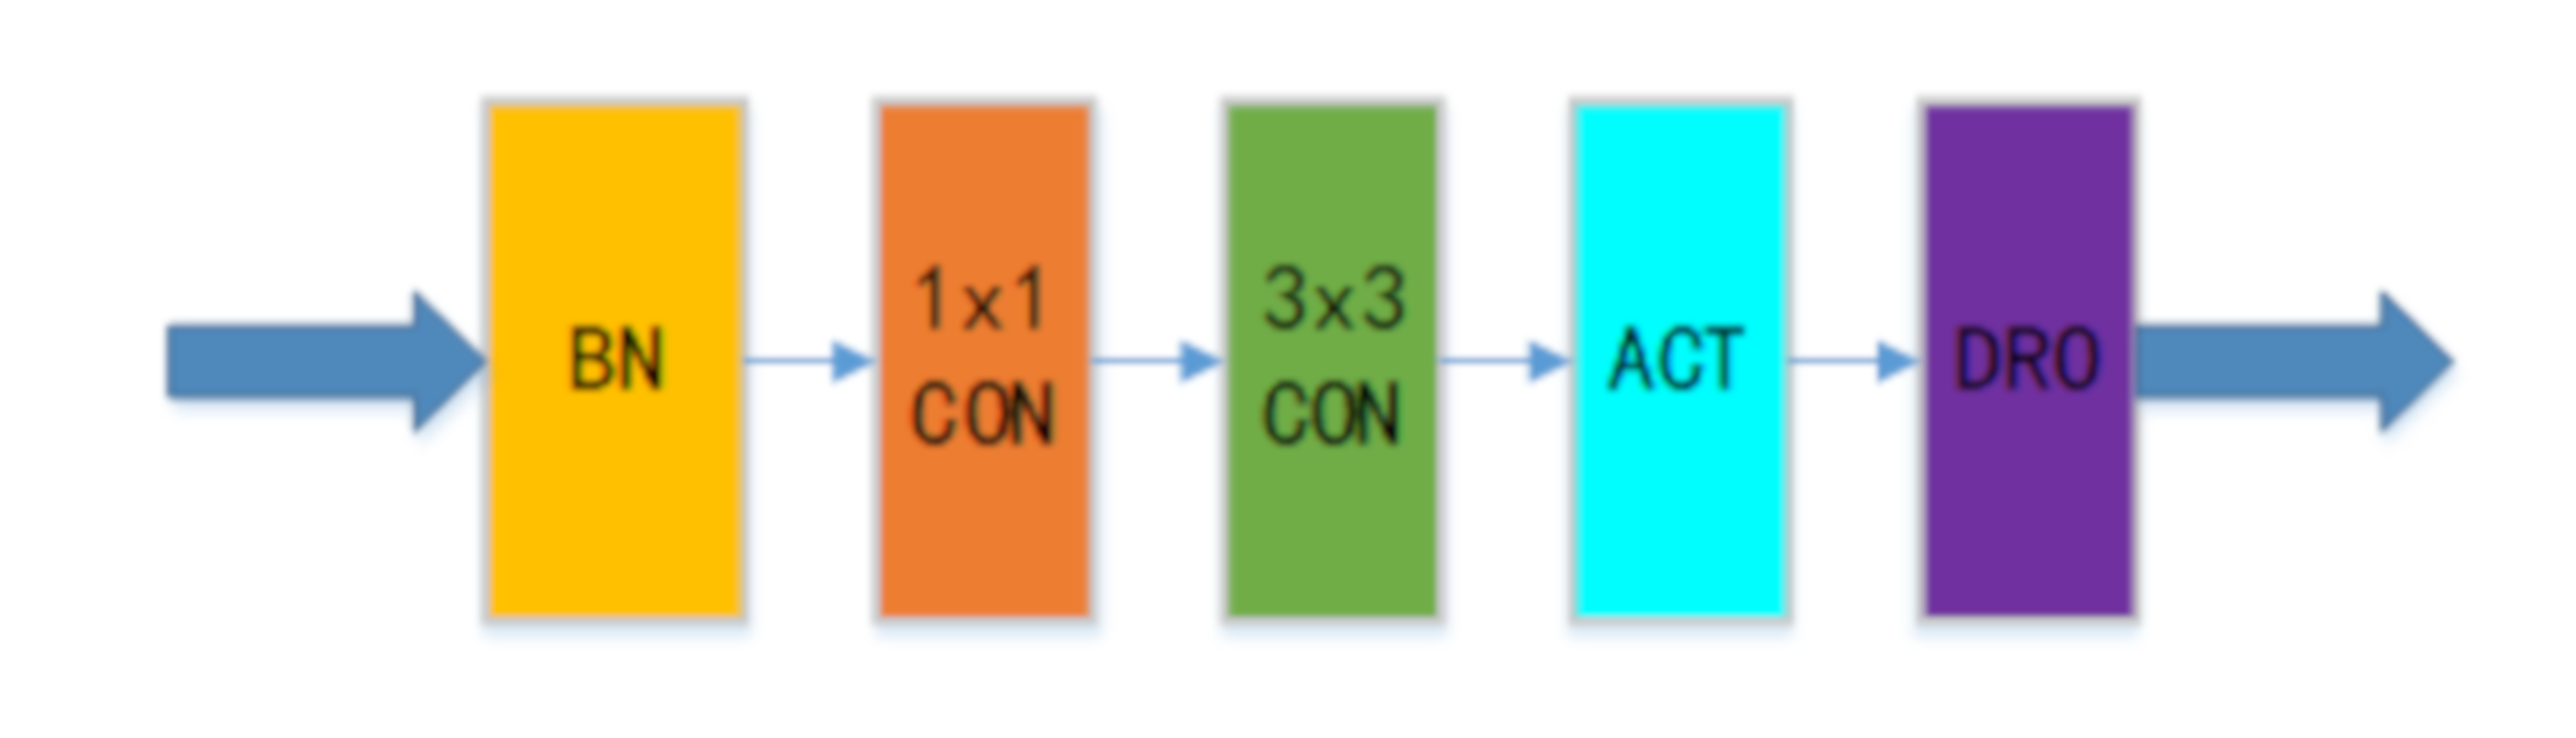
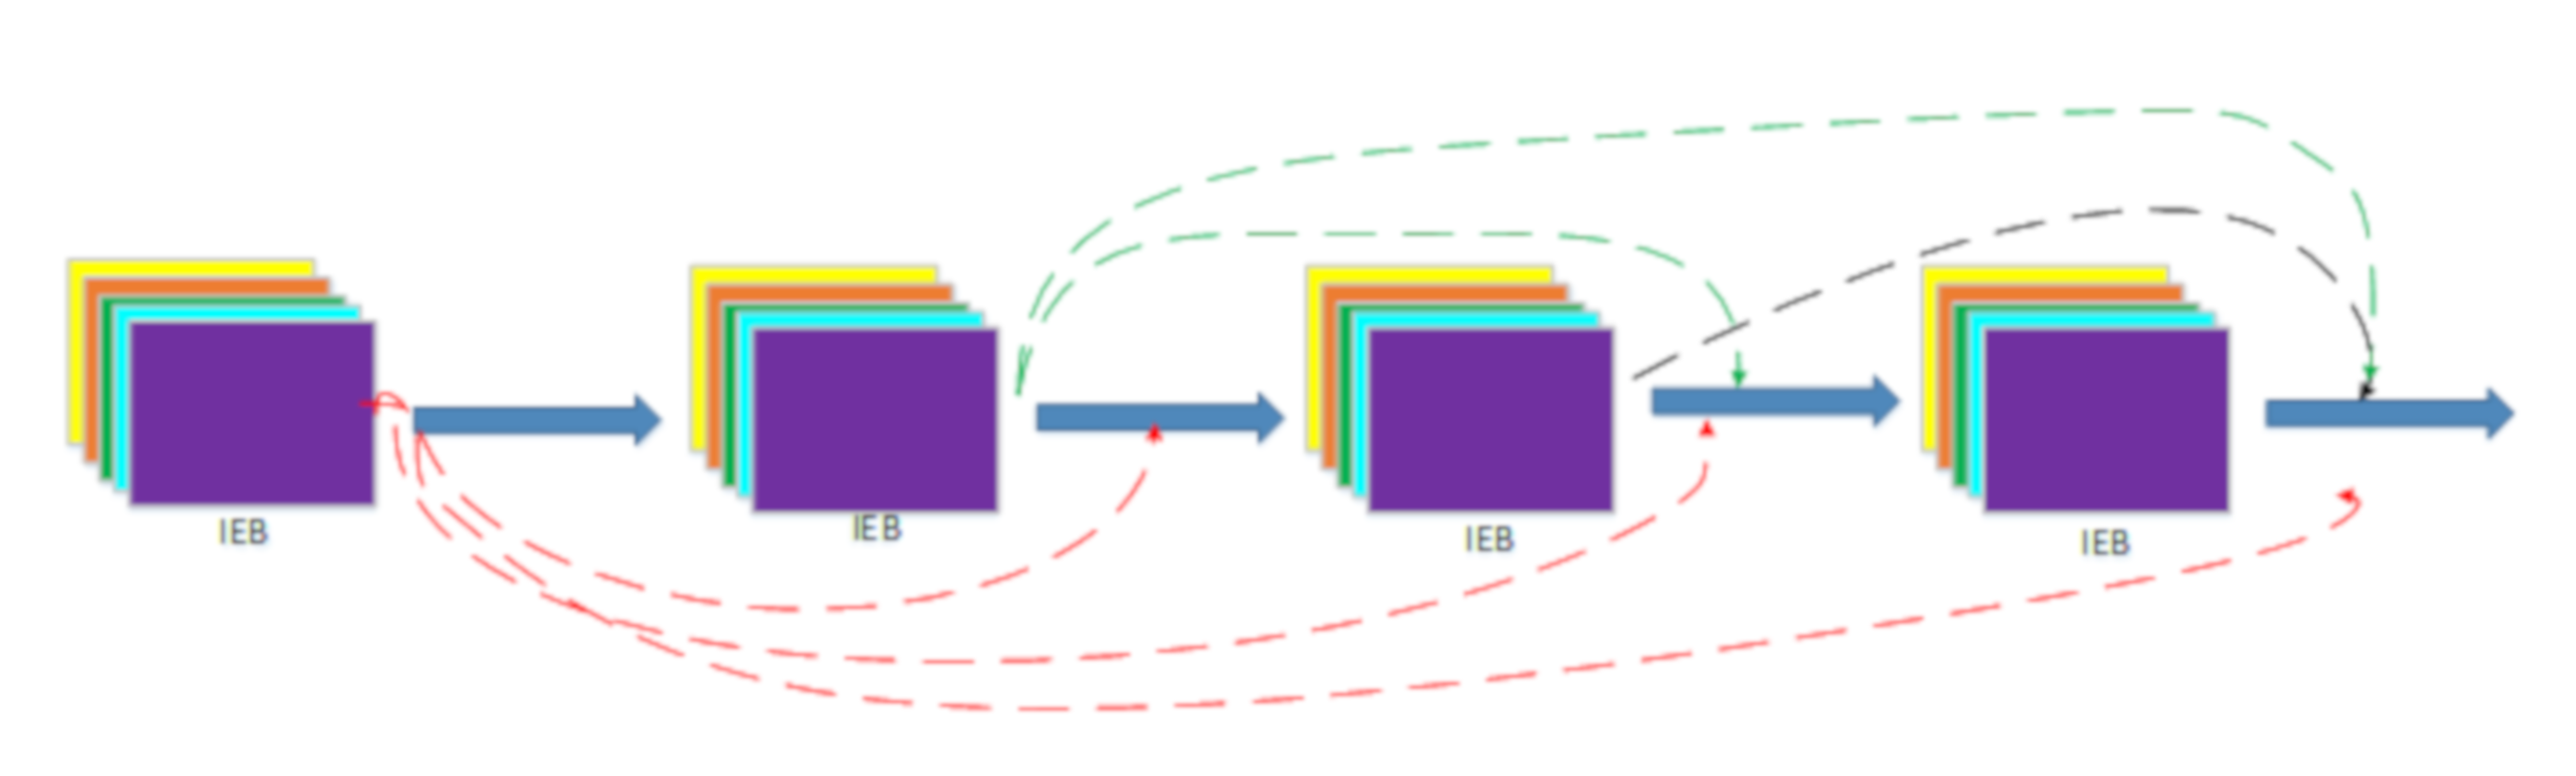
2.1. Driving Behavior Information Network (DBIN)

Our paper proposes a Driving Behavior Information Network (DBIN) and uses DBIN to train the DBNet data set, taking the driver’s horizon information (video frames captured by the driving recorder) as input, and driving behavior (steering wheel angle and speed) for output. In this way, the one-to-one correspondence between the driver’s horizon information and driving behavior is determined.
The driver’s horizon information first passes through a 7 × 7 Convolutional Layer (CON), a BatchNorm layer (BN), and a 3 × 3 Maximum Pooling Layer (MP). The output of the MP will enter an inception block [21] which contains four parallel lines. The first three lines use CON with window sizes of 1 × 1, 3 × 3, and 5 × 5, respectively, to extract different spatial scale information, which makes the extracted information more complete and reduce the model parameters. The two middle lines will use 1 × 1 CON to reduce the number of input channels, thereby reducing the complexity of the mode. The fourth line uses a 3 × 3 MP and 1 × 1 CON connection to change the number of channels. Appropriate padding is selected for all four lines to keep the height and width of input and output consistent. Finally, the output of each line is combined on the channel dimension to obtain the output layer (MO).
The output of MO will first pass through six Information Extraction Blocks (IEB) and one Conversion Layer (CL), then through twelve IEBs, and finally through the MP and the full connection layer (FCL) to obtain the final output. The conversion layer (CL) consists of two neural network layers, which is a BN followed by a 1 × 1 CON. Accordingly, this procedure controls the number of output channels and prevents the number of channels from being too large. As shown in Figure 2. An IEB module includes five neural network layers, as shown in Figure 2, where ACT and DRO, respectively, represent the Activation Layer and the Dropout Layer. We have adopted a dense connection mode between each IEB, connecting any layer with all subsequent layers, so that the information is retained to the greatest extent without losing the key information concerning the driver’s attention. The dense connection mode is shown in Figure 3.
The l t layer receives the feature maps of all previous layers, and its mathematical feature map is expressed as Formula (1), where [ x 0 , x 1 , …, x t 1 ] represents the feature mapping from l 0 to l t 1 layer,   x t is the output of l t , H t represents connecting the information of the previous layer in the channel dimension. The final Information Extraction Blocks (IEB) will go through Global Average Pooling (GAP) and FCL to get the final output.
x t = H t x 0 , x 1 , x t 1

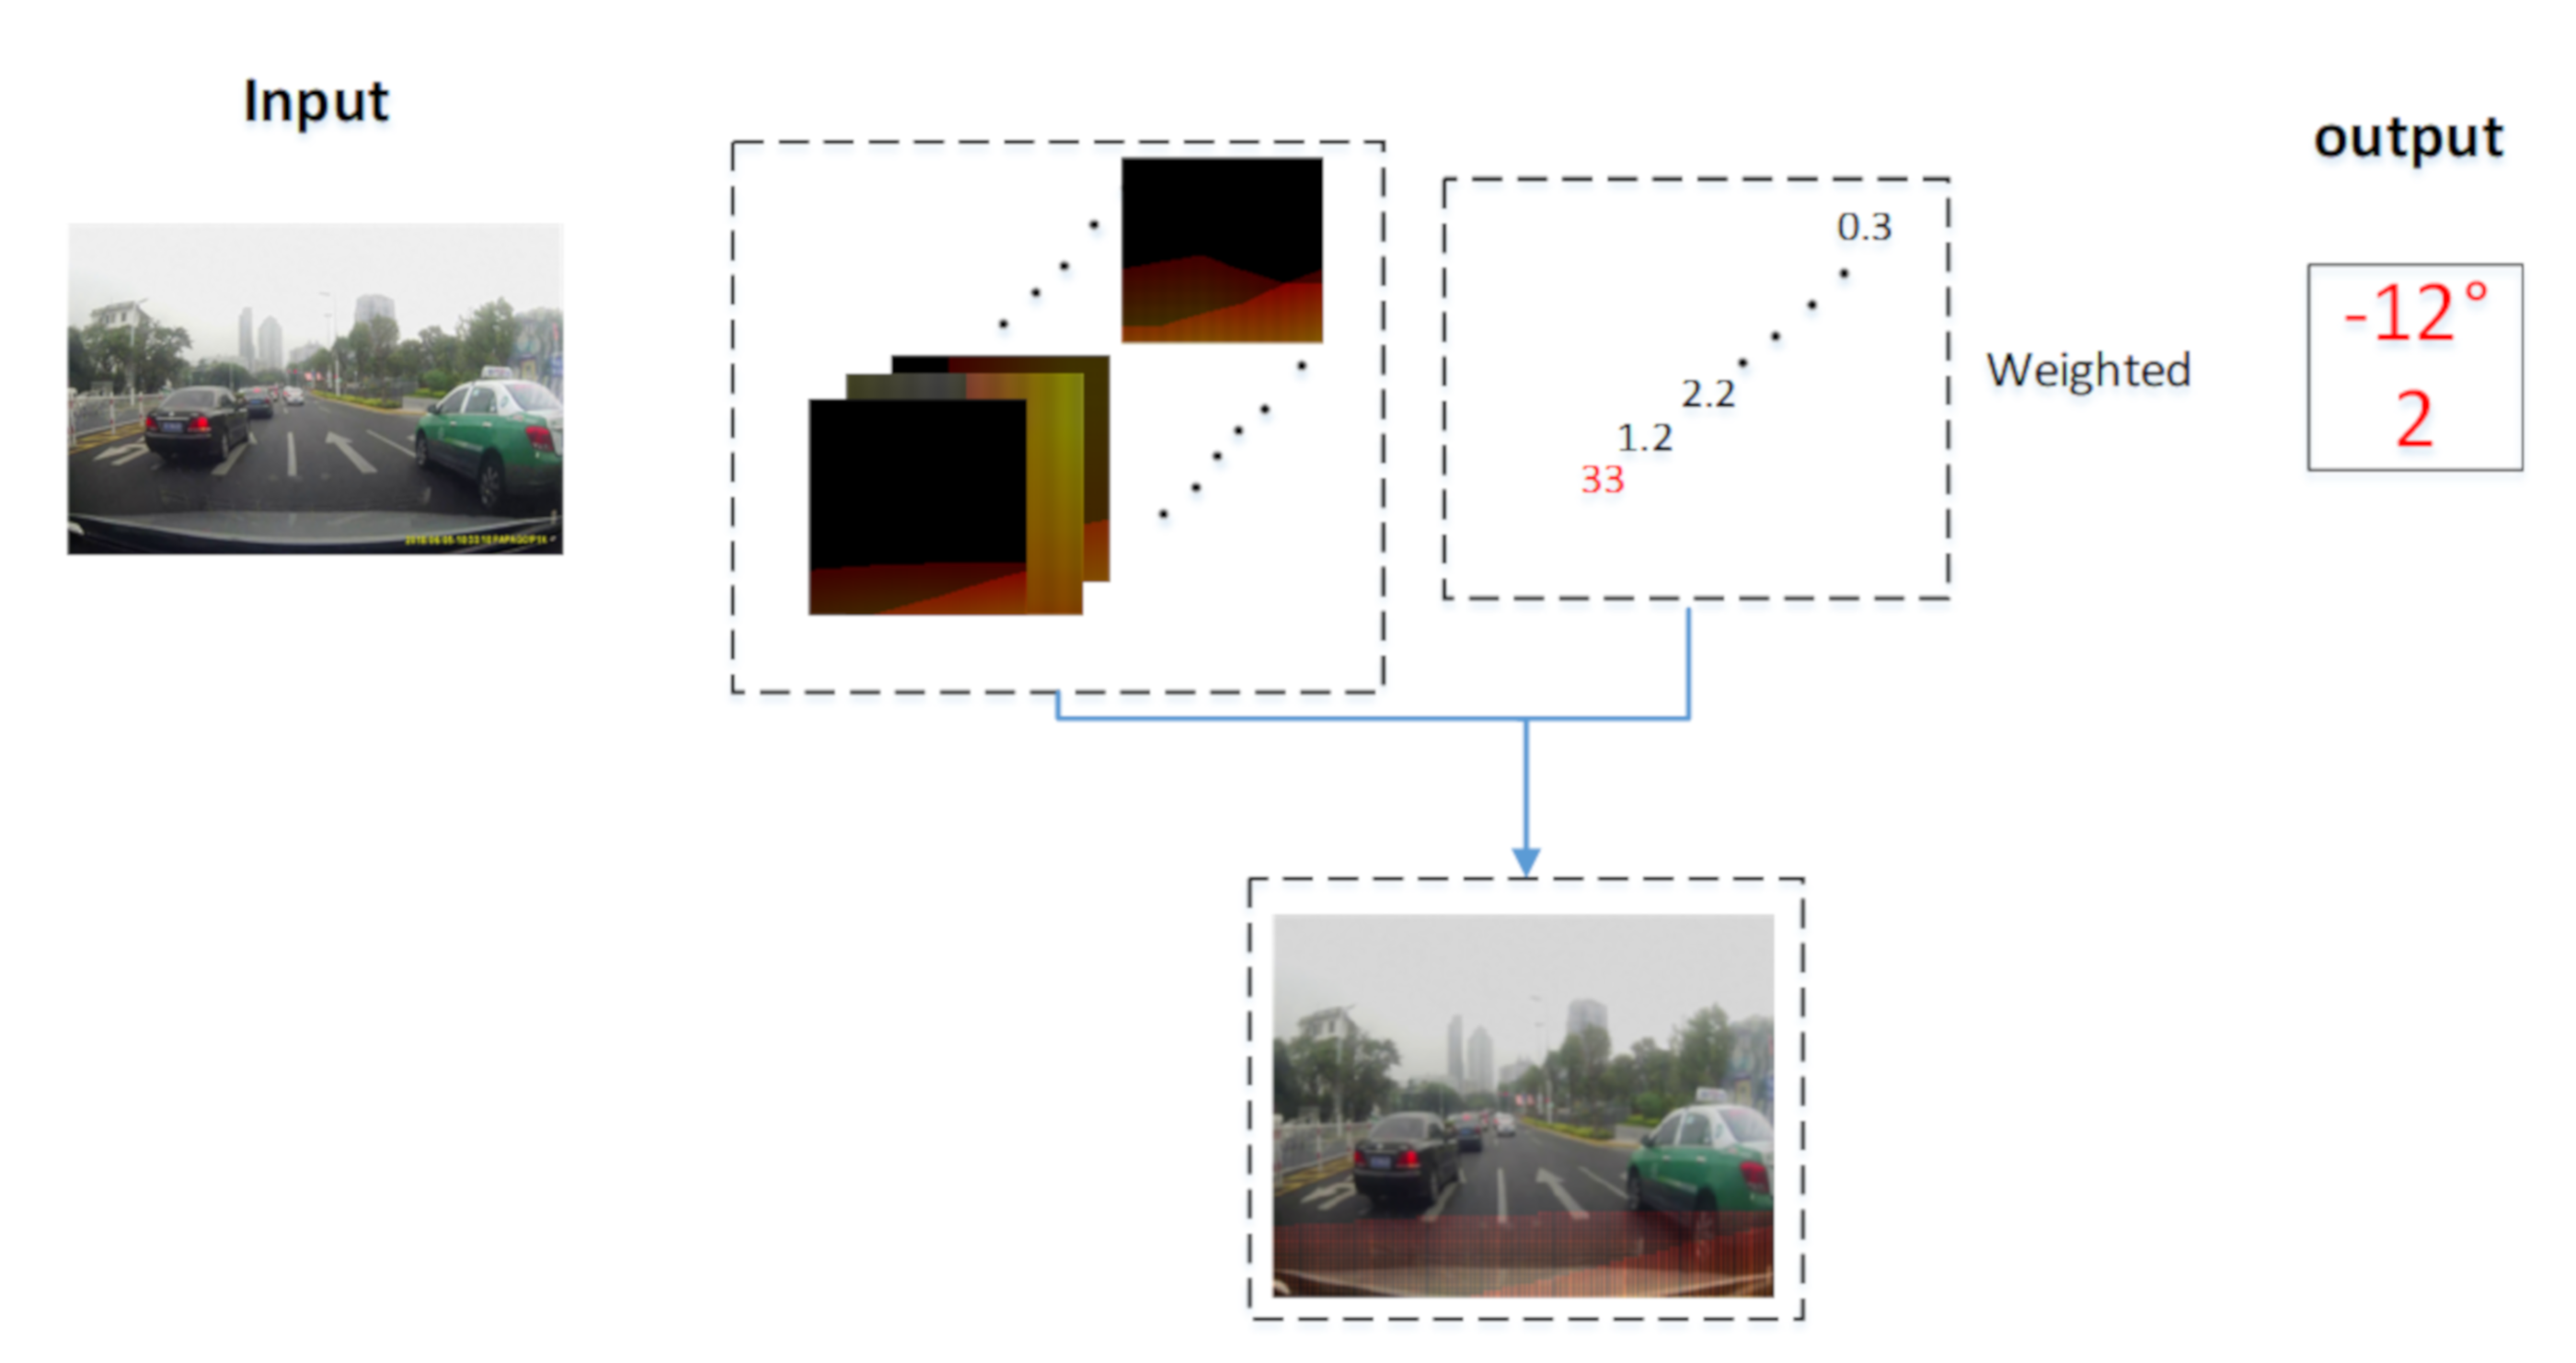
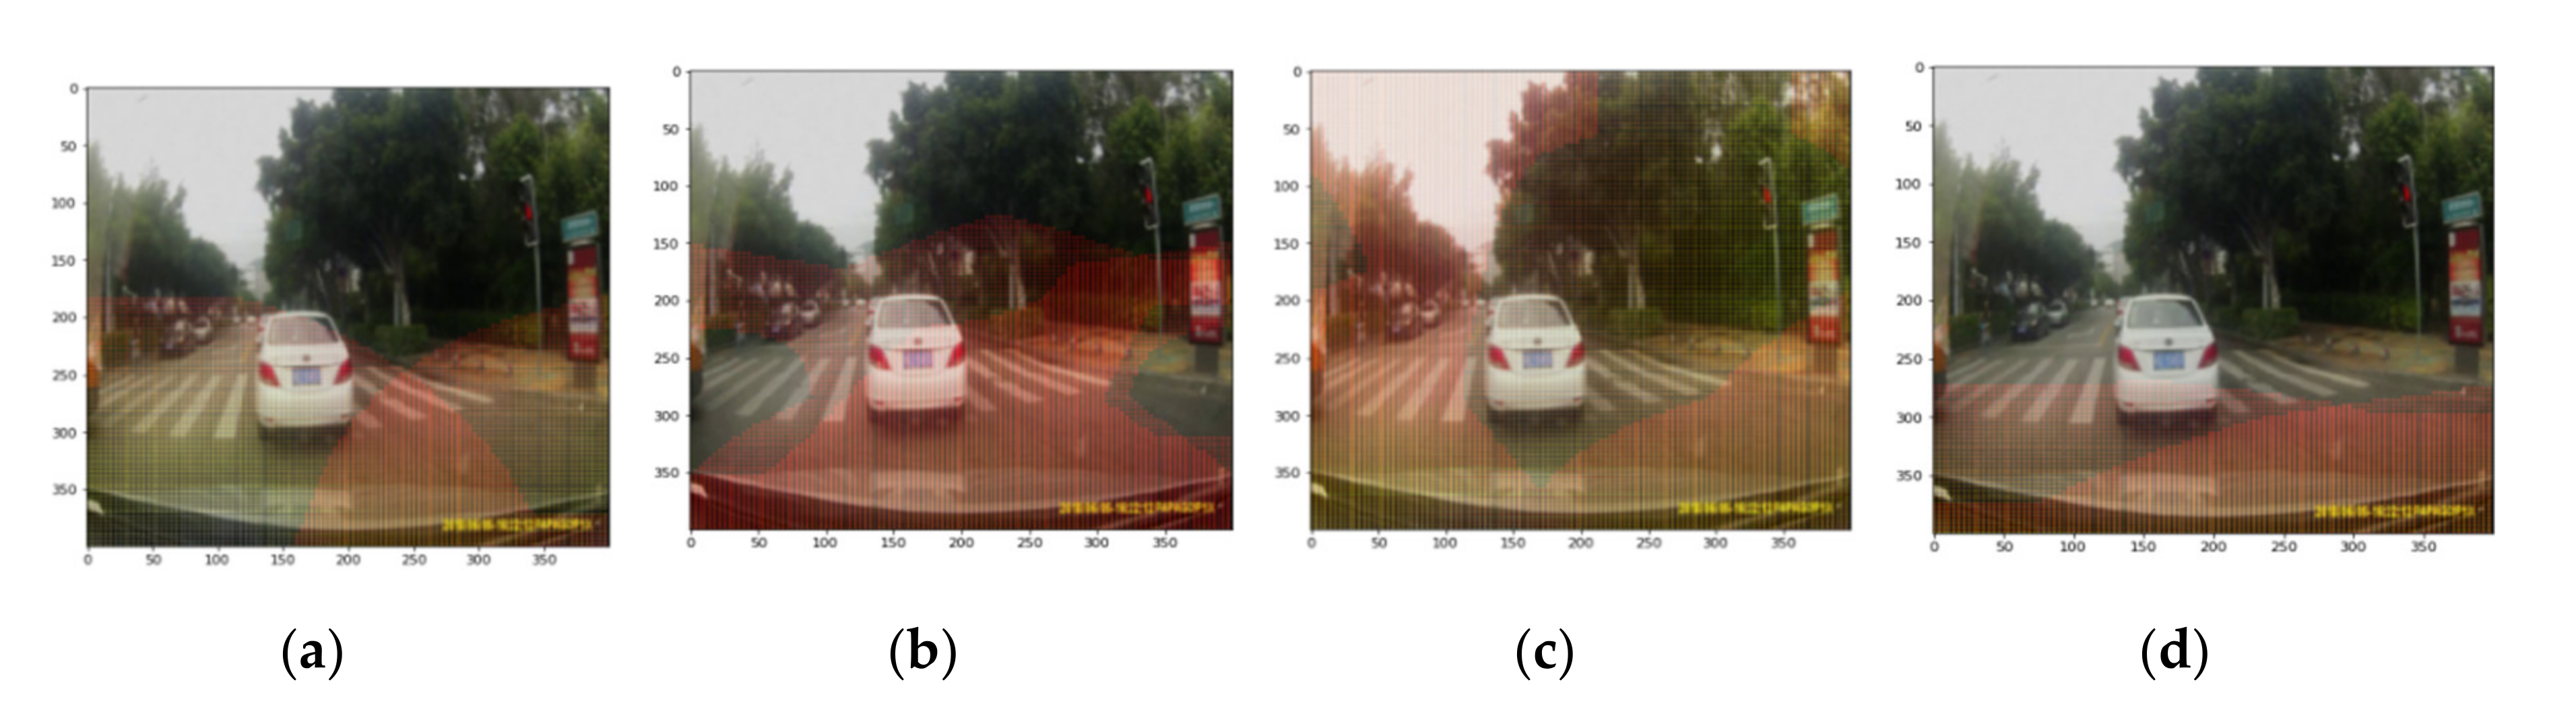
2.2. The Deep Network Feature Visualization Method (DNFV)

After using DBIN to accurately construct the one-to-one correspondence between driver’s horizon information and driving behavior, we use the Deep Network Feature Visualization Method (DNFV) to determine the driver’s attention area. After passing the IEB, we map all the feature maps generated by the convolution through GAP, and send the mapping results to the FCL. According to the weight matrix W of the FCL, the final output driving behavior is determined. After DBIN training is completed and high accuracy is obtained, we project the W of the output layer into the convolution feature map, weight the feature map with W, and then superimpose it with the original image frame to display the driver’s attention area. The mathematical feature mapping of this process is expressed as Formula (2).
I o u t t = I t W × F P
The I o u t t represents the output image superimposed with the feature map at time t.   I t represents the input image at time t. [W] are the weight matrix of the last output layer, and [ F P ] represents the feature map of the last IEB output.
As shown in Figure 4, when the model started training, the W matrix had just been initialized. At this time, the model listened to the W matrix, and may choose the No. 12/15/19 feature map as the basis for determining the output. The output driving behavior may be described, however, the predicted loss is very large at this time, so the W matrix is constantly updated in the subsequent back propagation, and the No. 10/20/50 feature map is gradually used as the basis for judgment. As the value of loss decreases and the accuracy increases, the model will choose a more suitable feature map as the judgment basis, and the driver’s attention area will become more and more accurate.

3. Experiment

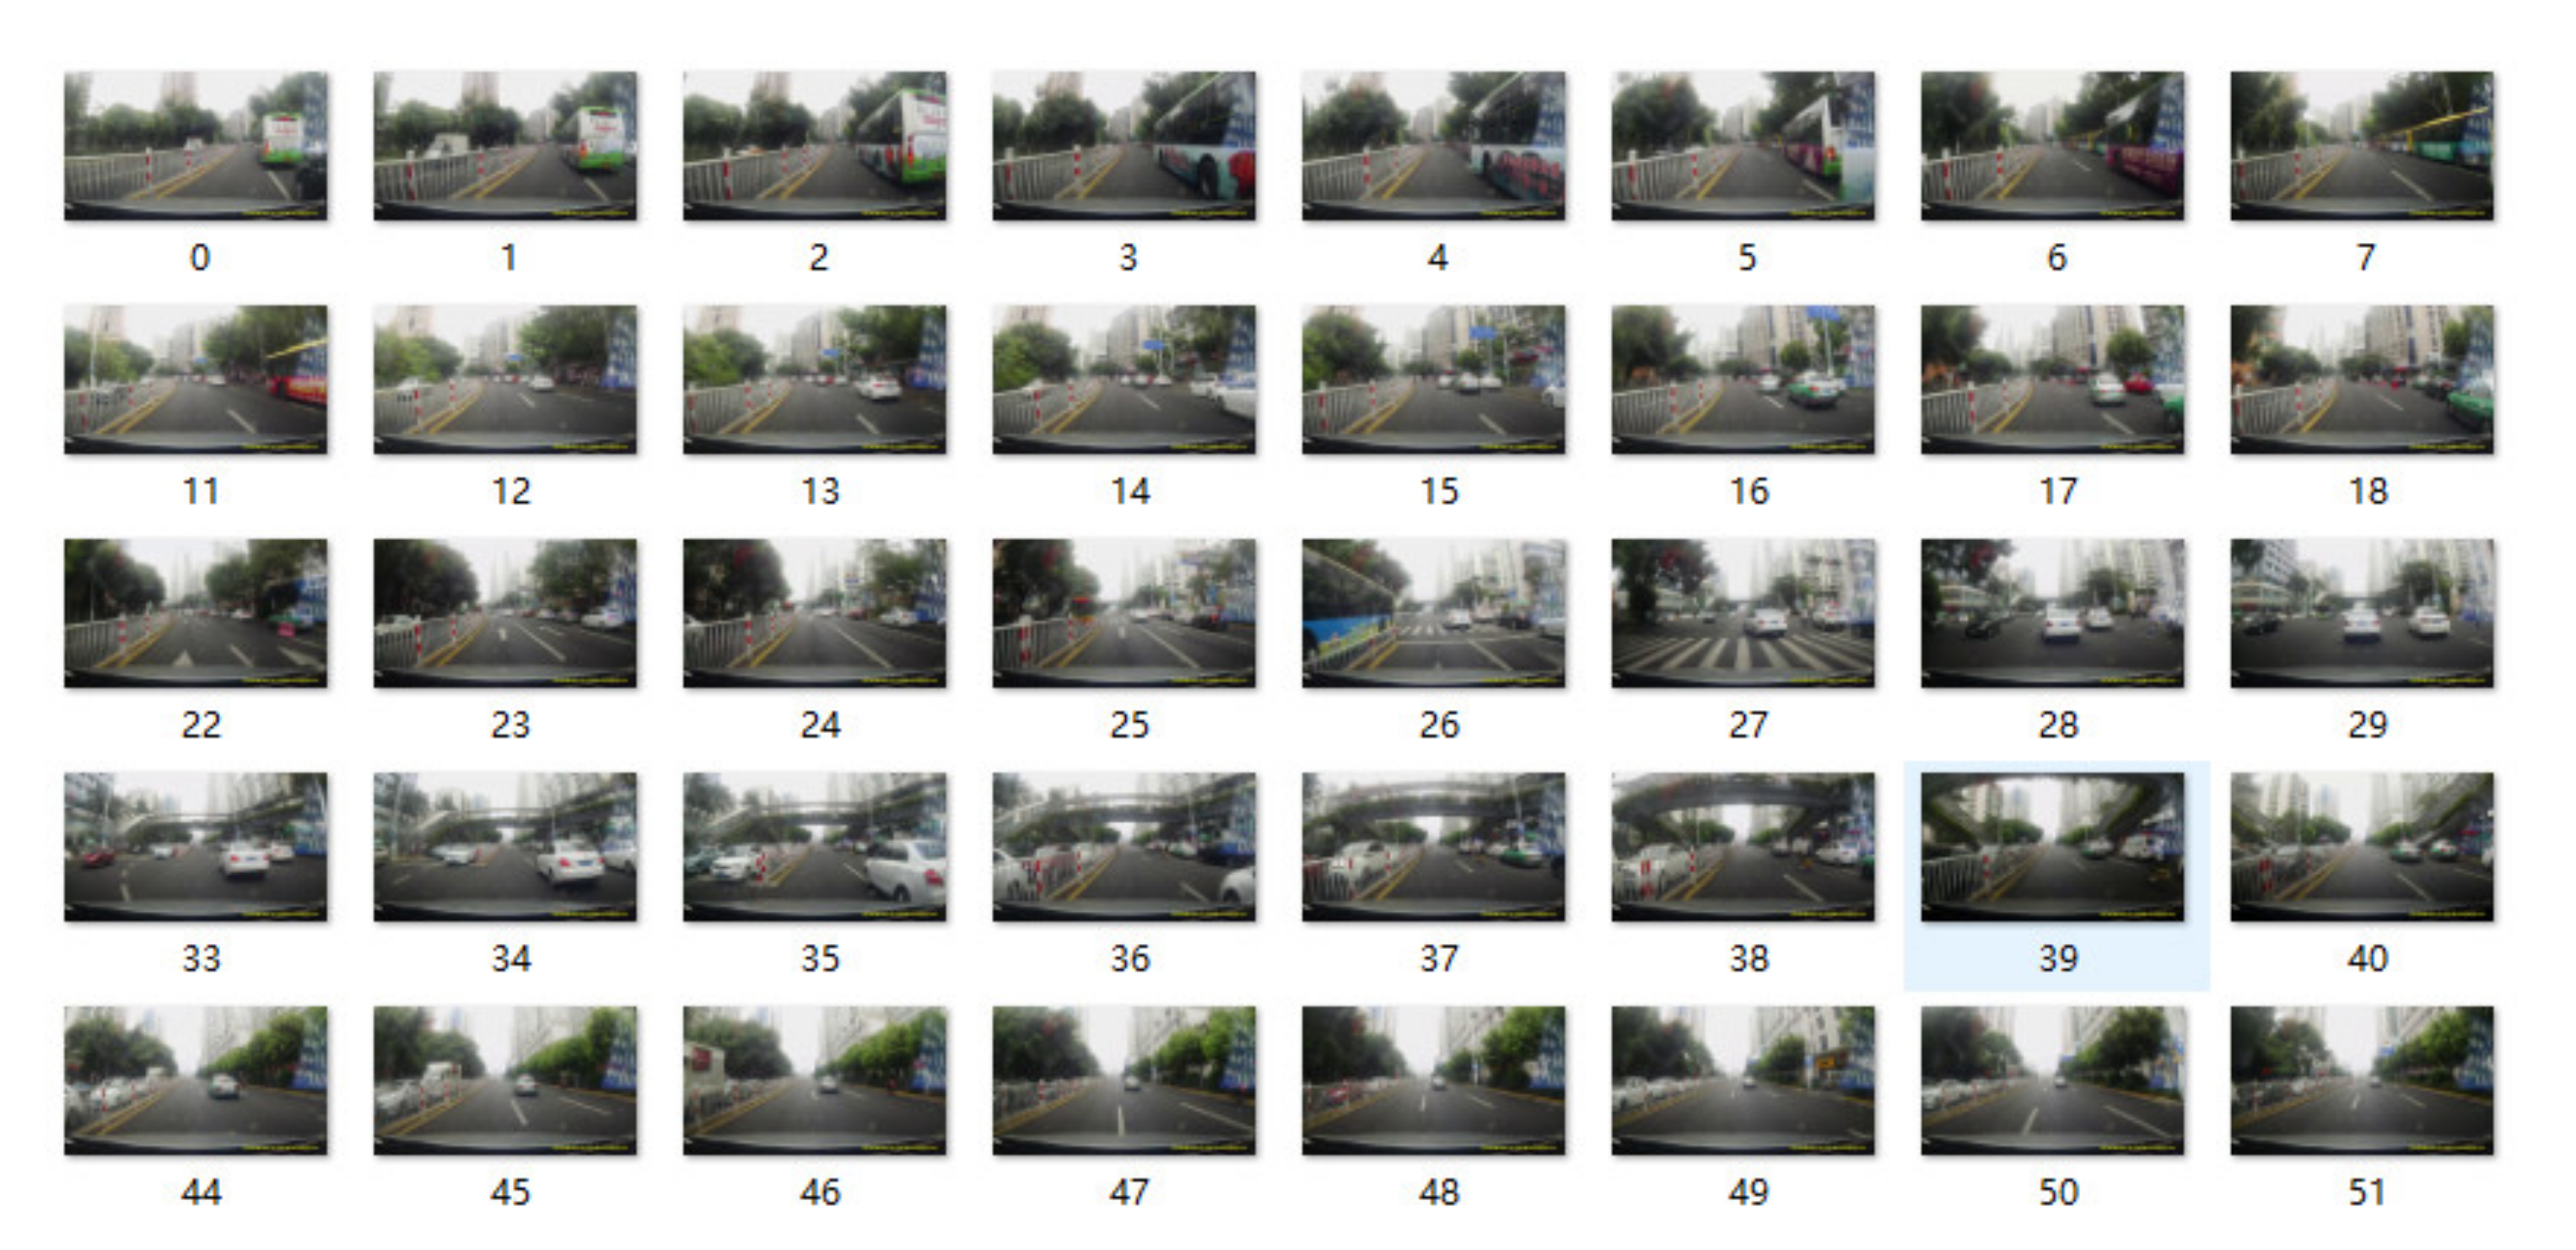
3.1. Dataset Description

DBNet (DB is the abbreviation of driving behavior) data set was jointly released by SCSC Lab of Xiamen University and MVIG Lab of Shanghai Jiaotong University, and is specifically designed to study strategy learning for driving behavior. DBNet records video, lidar point cloud, and the actual driving behavior of the corresponding senior driver (over 10 years of driving experience). It also solves the problem of an end-to-end method proposed by Nvidia researchers [22] in 2015 without data sets. The data scale of DBNet is about 10 times that of KITTI [23,24]. DBNet not only can provide training data for learning the driving model of senior drivers, but also evaluate the difference between the driving behavior predicted by the model and the real driving behavior of senior drivers. In our paper, we select a part of the training set of DBNet to remake the training set, validation set and test set used in our research, and remove the point cloud data, so that training set: validation set: test set = 6:1:1. The part of the data set is shown in Figure 5.

3.2. Experimental Details

The input of Driving Behavior Information Network (DBIN) is the video frame of DBNet. We change the original size to make the input size 224 × 224 × 3. Epoch is set to 100. The labels of training data are driving behaviors (speed and steering wheel angle), in which the steering wheel angle indicates turning right and turning left with positive and negative values. The loss function is the Mean Square Error (MSE), which can evaluate the degree of data change. The smaller the MSE value, the better the accuracy of the experimental data described by the prediction model. The MSE mathematical expression is shown in Equation (3), where k represents the dimension of the data, y t represents the label of the training data (driving behavior), and y p represents the predicted value of the driving behavior information network (DBIN).
M S E = 1 k k ( y t y p ) 2
In order to prevent the value of the loss function from being too large and increase the effect of data fitting, we conduct some processing on the driving behavior data in DBNet. The mathematical expression of the processing process is shown in Equation (4), where v and Ang represent the actual collected speed and steering wheel angle, and V r and A n g r represent the processed speed and steering wheel angle. The hardware configuration of the experimental environment is NVIDIA GTX1080 video card and 16 GB of memory; the programming environment is Tensorflow.
V r = v 20 v
A n g r = A n g × π 180

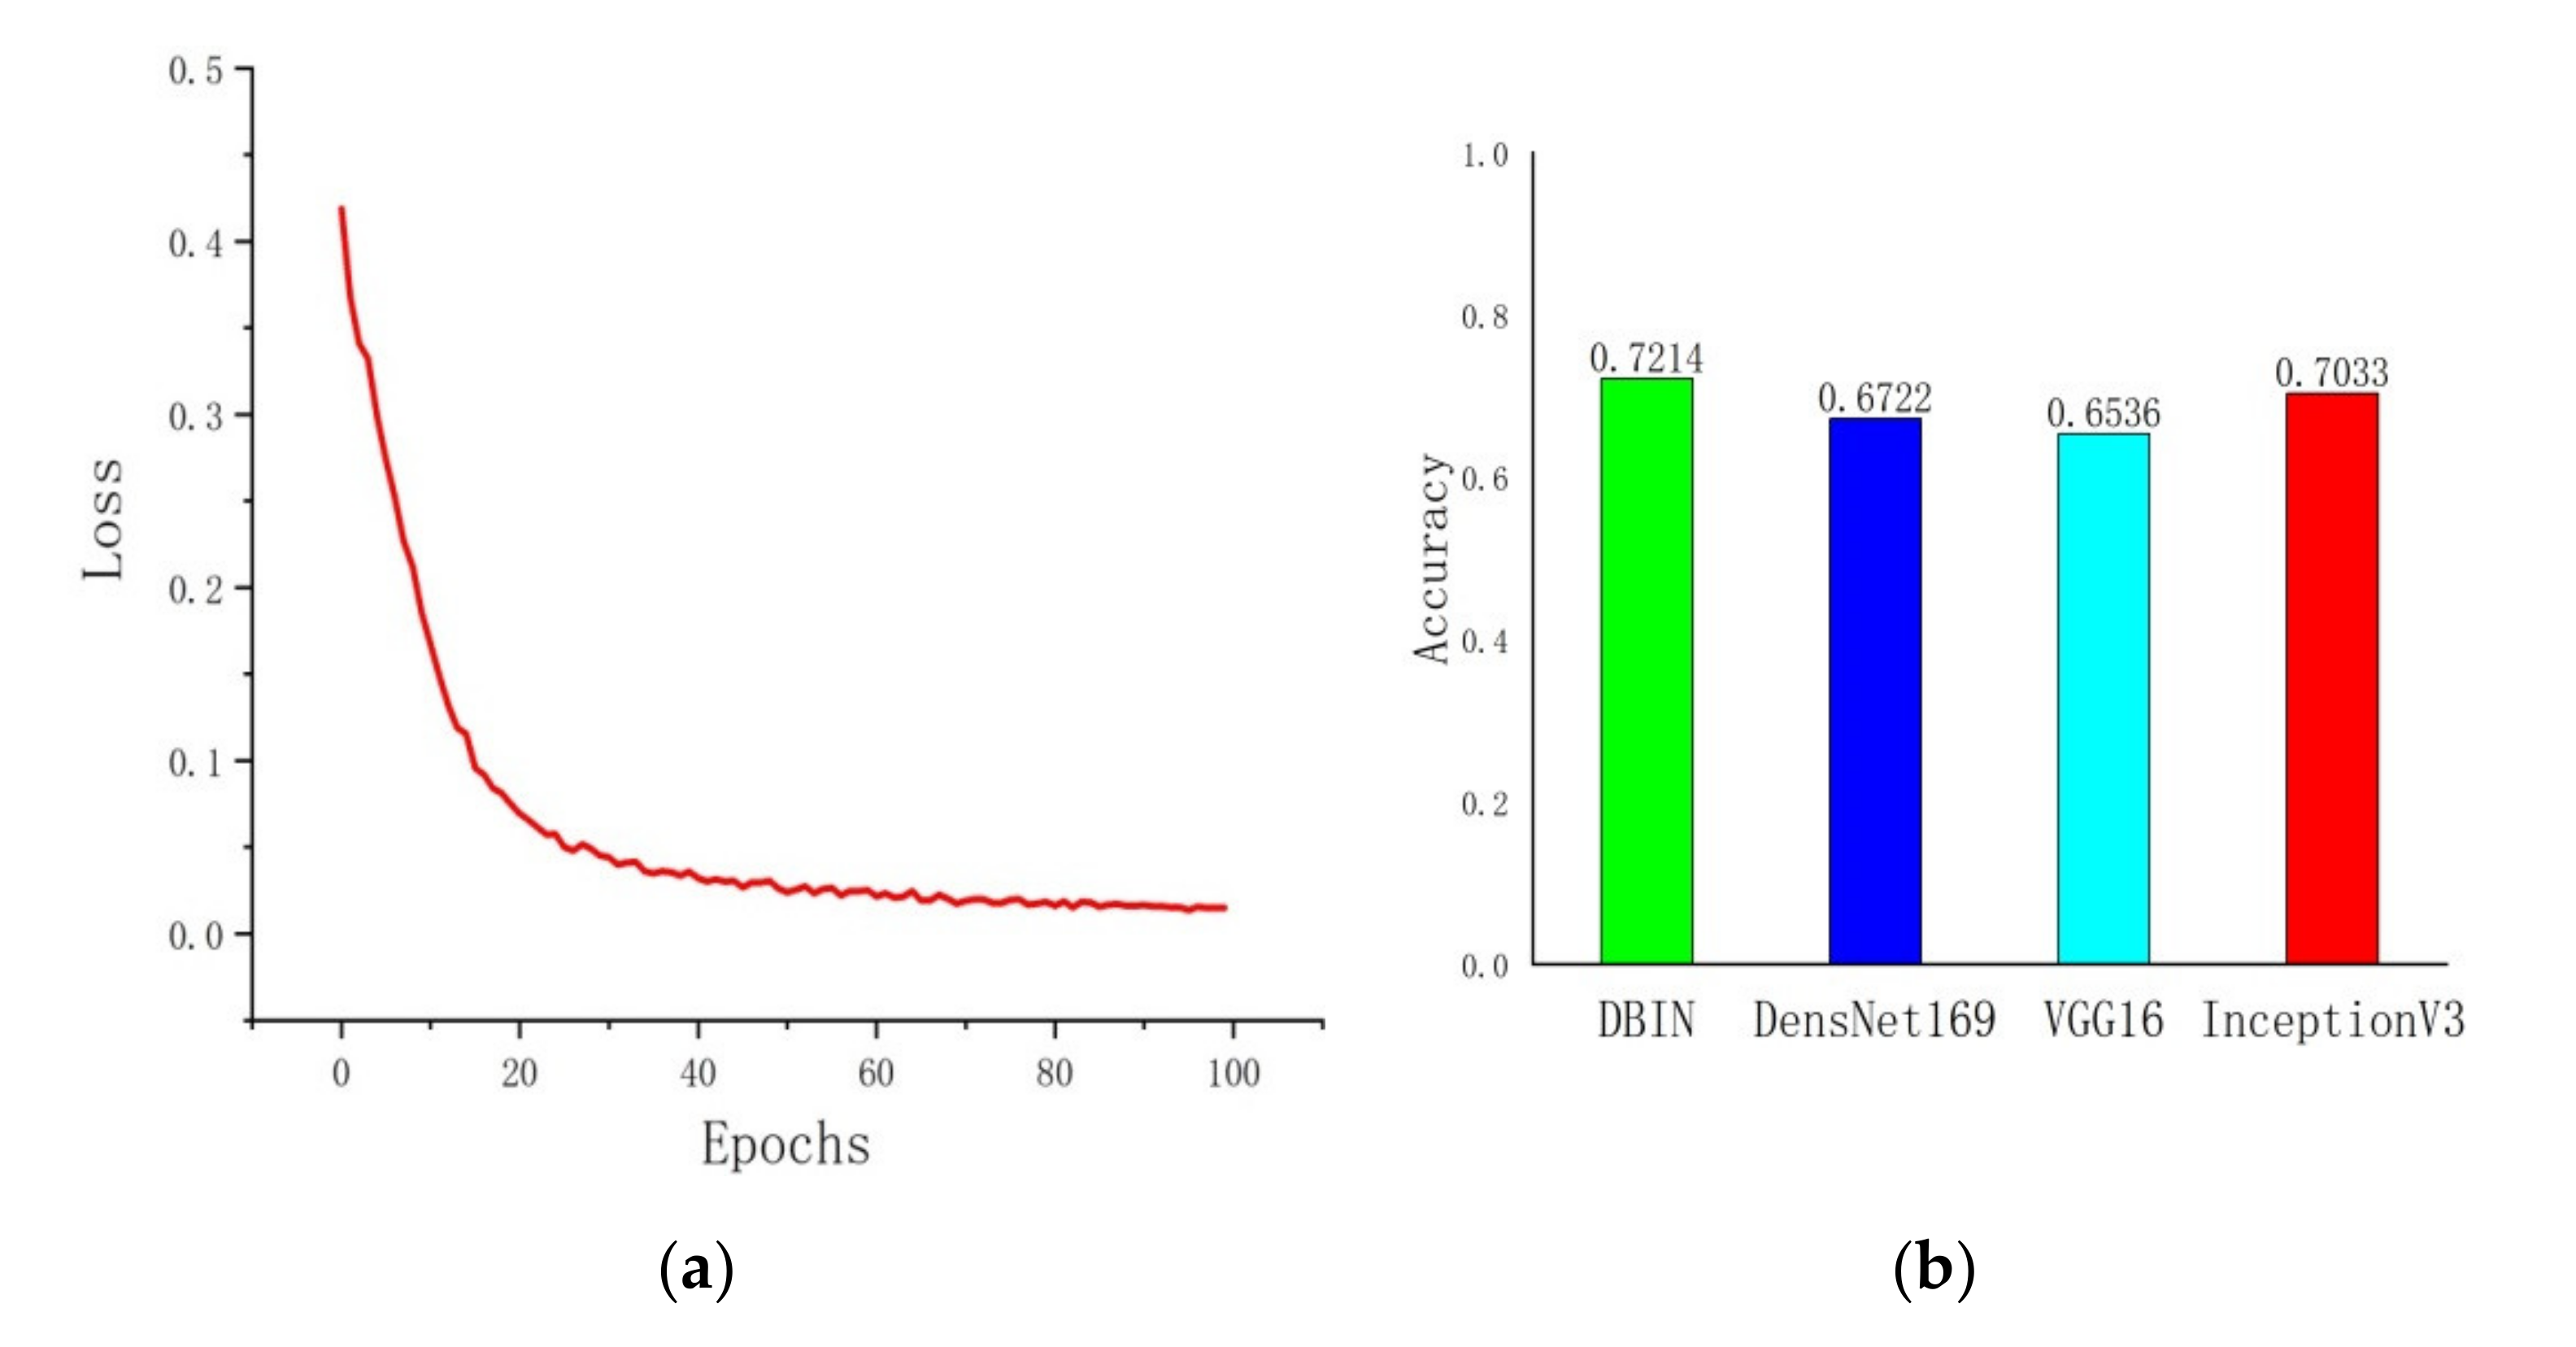
3.3. Experimental Results and Analysis
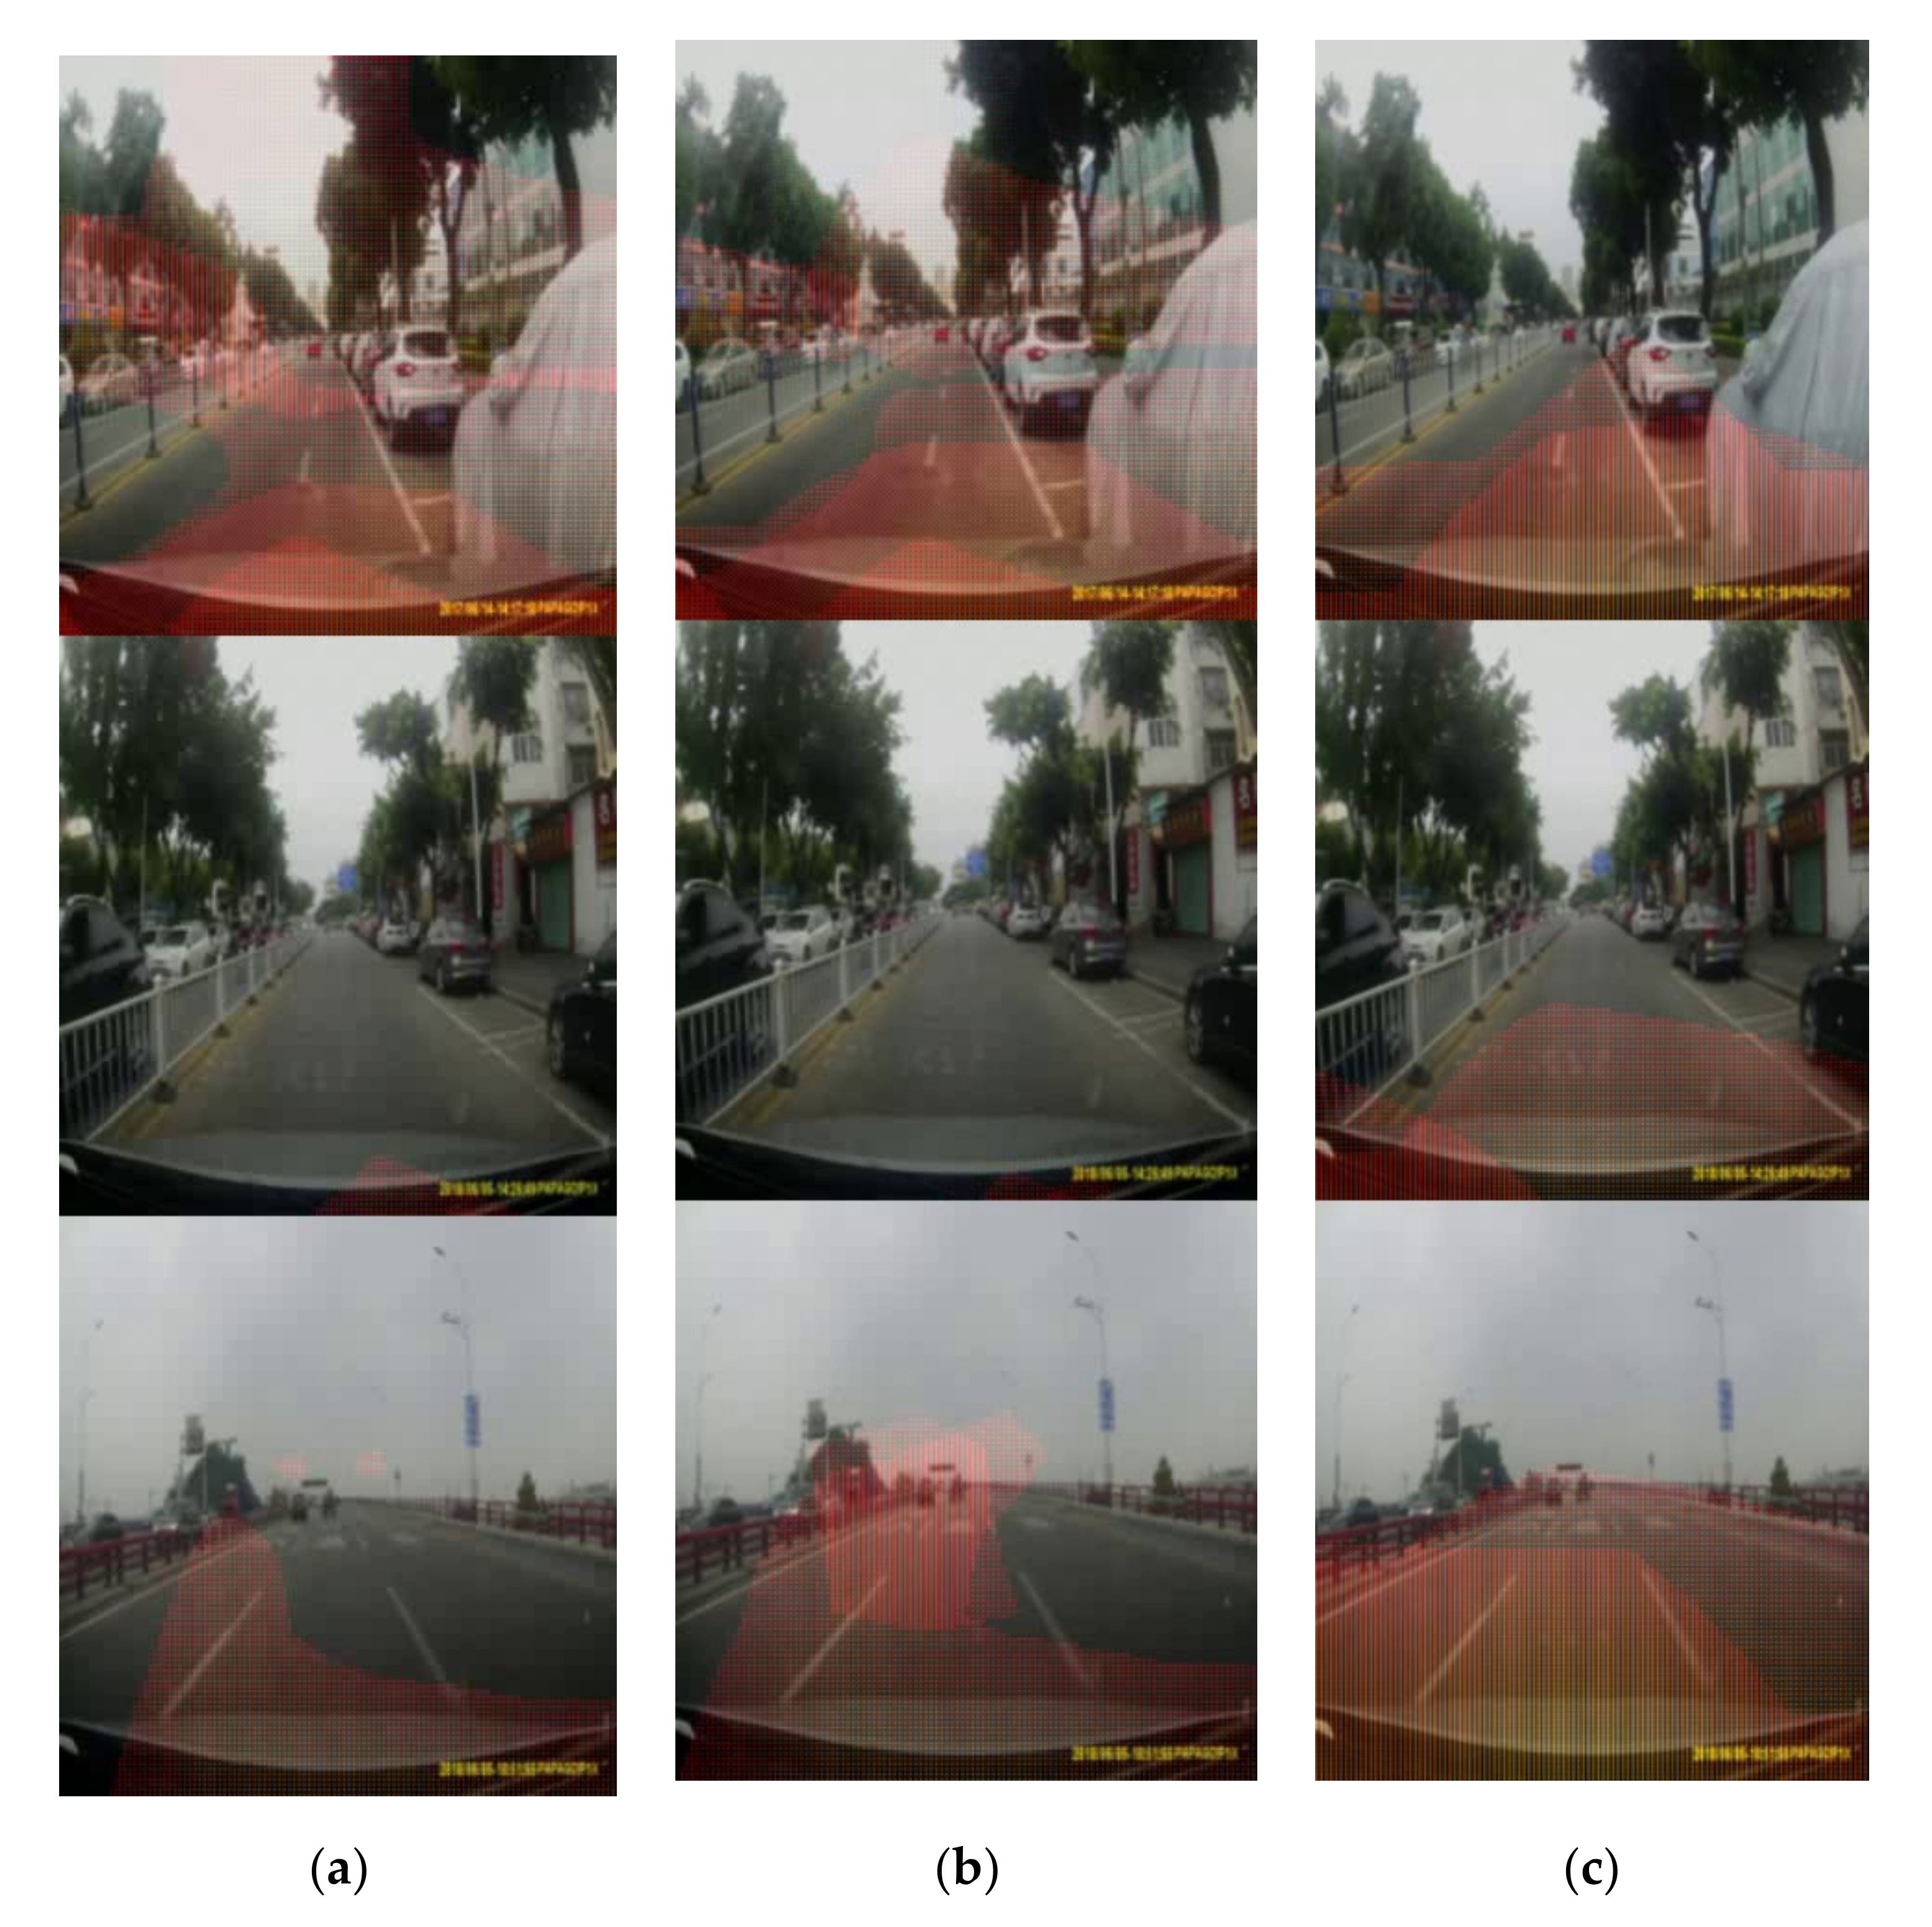
We constructed the Driving Behavior Information Network (DBIN), which is used to establish the one-to-one correspondence between driver horizon information and driving behavior. The change of loss function during training is shown in Figure 6a. The accuracies are measured within 6° or 5 km/h biases. In addition, the results of the accuracy of the test set and classical convolutional networks, such as DensNet169 [25], incidence v3 [26] and VGG16 [27] are compared. The results are shown in Figure 6b.
It can be seen from Figure 6a that as the training progresses, the value of the loss function continues to decrease and eventually stabilizes when iterating over 100 epochs. Moreover, we can clearly see from Figure 6b that DBIN has higher accuracy than several other models, and obtains good results.
In Figure 7, the red area represents the driver’s main attention area and it can be seen that the current traffic scene depicts our car following the white vehicle through the zebra crossing. At this moment, the driver will pay more attention to the distance from the vehicle and observe whether there is a pedestrian on the zebra crossing. After analysis, we can see that the driver’s main attention area obtained by our method accords with the driver’s selective attention mechanism. Because the accuracy of DBIN is higher, the display effect in Figure 7d is the best, and the determined driver’s main attention area is also the most accurate.
Figure 8 shows the comparison graph of DBIN experimental results at different training stages. Among them, Figure 8a–c represent the early, middle and last three stages of training, respectively. It can be clearly seen from the figure that the driver’s main attention area is incomplete and inaccurate in the early stage of training. Some images show that the attention area is only a tiny part of the front windshield, and some show the full screen as the attention area, which is obviously abnormal. However, with the training, the driver’s attention area gradually changes and eventually becomes accurate and complete.
In Figure 8, there are three traffic scenarios from top to bottom. The first and second traffic scenarios are similar in that our car passes on the road where the vehicle stops on the right side, but the difference is that our car in the first scenario is closer to the parked vehicle on the right side. For the first traffic scene, the driver’s speed is 4 km/h, and the steering wheel turns 30° to the left. Obviously, the driver is slowly moving the vehicle to the left to prevent the collision with the vehicle on the right. Therefore, the driver’s main attention area will be in the right front of the vehicle. While in the second traffic scene, our car is far away from the vehicle on the right and the front view is wide. At a speed of 20 km/h, the driver turns the steering wheel 5° to the left, and it is obvious that the driver is crossing the street at a low speed. Therefore, the driver puts the main attention area in front of the car. The third traffic scene is that our car passes through the bridge, which is dangerous to some extent. In this scene, there are no vehicles around, and the driver has a wide field of vision. At the moment, the speed of the car is 57 km/h, and the steering wheel turns 7° to the left. It can be seen that the driver is crossing the bridge at normal speed. Therefore, the driver will only focus on the lane ahead and the distance from the vehicle ahead.

4. Validation

In order to better validate that our method is also effective in different traffic scenarios, we show that our method extracts the driver’s attention area information in various traffic scenarios in Figure 9. In Figure 9a, the vehicle speed is 8 km/h, and the steering wheel does not turn left and right. It can be clearly seen from Figure 9a that our car is driving forward on the road, and a white car is coming from the left at the intersection of the road in front. If the driver does not handle it properly, it is very easy to cause a traffic accident. Therefore, the driver’s main attention area will be placed on the upcoming white vehicle. At the same time, the driver will reduce the speed to prevent traffic accidents. The behavior in Figure 9b is that the vehicle speed is 28 km/h, and the steering wheel turns 5° to the left. Although there are parked vehicles on the right side of the road, it is more important that our car is slowly approaching to the left, which is very close to the white vehicle in the adjacent reverse lane and thus, to the white vehicle and the fence on the left. Figure 9c shows that the vehicle speed is 34 km/h, and the steering wheel turns 5° to the right. It can be clearly seen from Figure 9c that our car turns right and will cross the crosswalk, but there is also a white vehicle in front to the right. In order to avoid traffic accidents, the driver’s main attention area will be on the crosswalk and the white vehicles.
Compared with the above three traffic scenes, the traffic scenes in Figure 9d–f are relatively simple with fewer vehicles, but they are often encountered in real life. The behavior shown in Figure 9d is that the vehicle speed is 0 km/h, and the steering wheel does not turn left and right. It can be clearly seen from Figure 9d that our car is parked waiting for pedestrians to pass the crosswalk. Therefore, the driver will put the main attention area on the crosswalk to prevent traffic accidents with pedestrians. The behavior in Figure 9e is that the vehicle speed is 28 km/h, and the steering wheel turns 10° to the left. It can be clearly seen from Figure 9e that our car turns to the left, and the surrounding view is wide. There is only a black car parked in front of the left. At this time, the driver will put the main attention area on the left, observe the distance from the left road and the distance from the black car to avoid traffic accidents. In addition, in Figure 9f the vehicle speed is 25 km/h, and the steering wheel turns 20° to the left. It can be clearly seen that there is a white car driving in the same direction directly in front of our car, and a bus starting to move in the front right. This is a very common traffic scene in daily life. At this time, the driver will keep the distance of the vehicle ahead and approach slowly to the left. In order to avoid the occurrence of traffic accidents, the driver’s main attention area will be in the area between their own vehicle and the vehicle ahead to maintain a safe distance.

5. Conclusions

At present, there is a problem that the driver’s attention area cannot be determined in the field of intelligent driving. To solve this problem, our paper proposes Driver Attention Area Extraction Method Based on Deep Network Feature Visualization. In our paper, we first determine the correspondence between driver’s horizon information and driving behavior by building a Driving Behavior Information Network (DBIN), and then use the Deep Network Feature Visualization Method (DNFV) to determine the driver’s attention area. In the experimental part, we first use the DBNet data set for training, and conduct a comparative analysis with a variety of classic convolutional neural networks. Finally, we combine the current driving behavior and traffic scenarios to analyze our experimental results; the experimental results show that our method can accurately determine the driver’s attention area no matter if it is in a complex or simple traffic scene. Our research can provide a useful theoretical basis and related technical means of visual perception for future intelligent driving vehicles, driving training and assisted driving systems.

Author Contributions

Conceptualization, G.H.; Data curation, S.Z.; Formal analysis, G.H. and S.L.; Funding acquisition, S.Z.; Investigation, P.W.; Methodology, G.H. and S.L.; Project administration, S.Z.; Resources, P.W.; Supervision, S.Z.; Visualization, G.H.; Writing—original draft, G.H.; Writing—review and editing, G.H. and S.Z. All authors have read and agreed to the published version of the manuscript.

Funding

This research was funded by Shaanxi Provincial Key Research and Development Program (Project No. S2020-YF-ZDCXL-ZDLGY-0295) and Shaanxi Provincial Education Department serves Local Scientific Research Plan in 2019 (Project No. 19JC028) and Shaanxi Provincial Key Research and Shaanxi province special project of technological innovation guidance (fund) (Program No. 2019QYPY-055) and the Shaanxi Province key Research and Development Program (Project No. 2019ZDLGY03-09-02) and Key Research and development plan of Shaanxi Province (Project No. S2020-YF-ZDCXL-ZDLGY-0226) and Development Program (Project No. 2018ZDCXL-G-13-9).

Acknowledgments

Here we would like to express our gratitude to the provider of DBNet dataset.

Conflicts of Interest

The authors declare no conflict of interest.

References

  1. Putra, M.H.; Yussof, Z.M.; Lim, K.C.; Salim, S.I. Convolutional neural network for person and car detection using YOLO framework. J. Telecommun. Electron. Comput. Eng. 2018, 10, 67–71. [Google Scholar]
  2. Zhongbao, Z.; Hongyuan, W.; Ji, Z.; Yang, W. A vehicle real-time detection algorithm based on YOLOv2 framework. In Real-Time Image and Video Processing 2018; International Society for Optics and Photonics: Bellinghamm, WA, USA, 2018; Volume 10670. [Google Scholar]
  3. Liu, W.; Anguelov, D.; Erhan, D.; Szegedy, C.; Reed, S.; Fu, C.; Berg, A.C. SSD: Single shot multibox detector. In Proceedings of the European Conference on Computer Vision, Amsterdam, The Netherlands, 8–16 October 2016; pp. 21–37. [Google Scholar]
  4. Yun, S.K.; Haet, B.L.; Jung, S.K.; Myung, K.; Kwang, S.P. ECG, EOG detection from helmet based system. In Proceedings of the International Special Topic Conference on Information Technology Applications in Biomedicine, Tokyo, Japan, 8–11 November 2007; pp. 191–193. [Google Scholar]
  5. Nayak, B.P.; Kar, S.; Routray, A.; Akhaya, K.P. A biomedical approach to retrieve information on driver’s fatigue by integrating EEG, ECG and blood biomarkers during simulated driving session. In Proceedings of the International Conference on Intelligent Human Computer Interaction, IEEE, Kharagpur, India, 27–29 December 2012; pp. 1–6. [Google Scholar]
  6. Wu, Q.; Zhao, Y.; Bi, X. Driving fatigue classified analysis based on ECG signal. In Proceedings of the Computational Intelligence and Design (ISCID) Fifth International Symposium, Hangzhou, China, 28–29 October 2012; pp. 544–547. [Google Scholar]
  7. Li, W.K.; Wei, K.L.; Wei, G.L.; Chun, H.C.; Shao, W.L.; Yi, C.L.; Tien, Y.H.; Hsuan, W.; Chin, T.L. Single channel wireless EEG device for real-time fatigue level detection. In Proceedings of the 2015 International Joint Conference on Neural Networks (IJCNN), Killarney, Ireland, 12–17 July 2015; pp. 1–5. [Google Scholar]
  8. Xiao, D.; Feng, C. Detection of drivers visual attention using smartphone. Int. Conf. Natural Comput. IEEE 2016, 10, 630–635. [Google Scholar]
  9. Chuang, M.C.; Bala, R.; Bernal, E.A.; Peter, P. Estimating gaze direction of vehicle drivers using a smartphone camera. IEEE Conf. Comput. Vis. Pattern Recognit. Workshops 2014, 30, 165–170. [Google Scholar]
  10. Francisco, V.; Zehua, H.; Xuehan, X.; Fernando, D.T.; Wende, Z.; Dan, L.G.; Motors, C.; Herzliya, I. Driver gaze tracking and eyes off the road detection system. IEEE Trans. Intell. Transp. Syst. 2015, 16, 2014–2027. [Google Scholar]
  11. Jha, S.; Busso, C. Analyzing the relationship between head pose and gaze to model drivervisual attention. IEEE Int. Conf. Intell. Transp. Syst. 2016. [Google Scholar] [CrossRef]
  12. Ashish, T.; Andreas, M.; Sujitha, M.; Thomas, B.M.; Mohan, M.T. Attention estimation by simultaneous analysis of viewer and view. In Proceedings of the IEEE International Conference on Intelligent Transportation Systems, Qingdao, China, 8–11 October 2014; pp. 1381–1387. [Google Scholar]
  13. Lex, F.; Philipp, L.; Joonbum, L.; Bryan, R. Driver gaze regionestimation without use of eye movement. arXiv 2016, arXiv:1507.04760. Available online: https://arxiv.org/abs/1507.04760 (accessed on 1 March 2016).
  14. Nian, L.; Junwei, H.; Dingwen, Z.; Shifeng, W.; Tianming, L. Predicting eye fixations using convolutional neural networks. In Proceedings of the IEEE Conference on Computer Vision and Pattern Recognition (CVPR), Boston, MA, USA, 7–12 June 2015; IEEE: Boston, MA, USA, 2015. [Google Scholar]
  15. Zhao, S.; Han, G.; Zhao, Q.; Wei, P. Prediction of driver’s attention points based on attention model. Appl. Sci. 2020, 10, 1083. [Google Scholar] [CrossRef] [Green Version]
  16. Alletto, S.; Palazzi, A.; Solera, F.; Calderara, S.; Cucchuara, R. Dr (eye) ve: A dataset for attention-based tasks with applications to autonomous and assisted driving. In Proceedings of the IEEE Conference on Computer Vision and Pattern Recognition Workshops, Las Vegas, NV, USA, 26 June–1 July 2016; pp. 54–60. [Google Scholar]
  17. Alletto, S.; Palazzi, A.; Solera, F.; Calderara, S.; Cucchuara, R. Learning where to attend like a human driver. In Proceedings of the IEEE Intelligent Vehicles Symposium, Redondo Beach, CA, USA, 11–14 June 2017; pp. 920–925. [Google Scholar]
  18. Palazzi, A.; Abati, D.; Calderara, S. Predicting the driver’s focus of attention: The DR (eye) VE project. IEEE Intell. Veh. Symp. 2019, 41, 1720–1733. [Google Scholar] [CrossRef] [PubMed] [Green Version]
  19. Tawari, A.; Kang, B. A computational framework for driver’s visual attention using a fully convolutional architecture. In Proceedings of the IEEE Intelligent Vehicles Symposium, Redondo Beach, CA, USA, 11–14 June 2018; pp. 887–894. [Google Scholar]
  20. Chen, Y.P.; Wang, J.K.; Li, J.T.; Lu, C.W.; Luo, Z.P.; Xue, X.; Cheng, W. LiDAR-Video driving dataset: Learning driving policies effectively. IEEE Conf. Comput. Vis. Pattern Recognit. 2018. [Google Scholar] [CrossRef]
  21. Christian, S.; Wei, L.; Yangqing, J.; Pierre, S.; Scott, R.; Dragomir, A.; Dumitru, E.; Vincent, V.; Andrew, R.C. Going deeper with convolution. arXiv 2014, arXiv:1409.4842. Available online: https://arxiv.org/abs/1409.4842 (accessed on 7 September 2014).
  22. Mariusz, B.; Davide, D.T.; Daniel, D.; Bernhard, F.; Beat, F.; Prasoon, G.; Lawrence, D.J.; Mathew, M.; Urs, M.; Jiakai, Z.; et al. End to end learning for self-driving cars. arXiv 2016, arXiv:1604.07316. Available online: https://arxiv.org/abs/1604.07316 (accessed on 25 April 2016).
  23. Geiger, A.; Lenz, P.; Urtasun, R. Are we ready for autonomous driving? The KITTI vision benchmark suite. In Proceedings of the IEEE Conference on Computer Vision and Pattern Recognition, Providence, RI, USA, 16–21 June 2012. [Google Scholar]
  24. Geiger, A.; Lenz, P.; Stiller, C.; Urtasun, R. Vision meets robotics: The kitti dataset. Int. J. Robot. Res. 2013, 32, 1231–1237. [Google Scholar] [CrossRef] [Green Version]
  25. Gao, H.; Zhuang, L.; Laurens, V.D.M.; Kilian, Q.; Weinberger. Densely connected counvolutional networks. arXiv 2016, arXiv:1608.06993. Available online: https://arxiv.org/abs/1608.06993 (accessed on 28 January 2018).
  26. Christian, S.; Vincent, V.; Sergey, I.; Jonathon, S.; Zbigniew, W. Rethinking the inception architecture for computer vision. arXiv 2015, arXiv:1512.00567. Available online: https://arxiv.org/abs/1512.00567 (accessed on 11 December 2015).
  27. Karen, S.; Andrew, Z. Very deep convolution networks for large_scale image recognition. arXiv 2015, arXiv:1409.1556. Available online: https://arxiv.org/pdf/1409.1556.pdf (accessed on 10 April 2015).
Figure 1. The overall structure of driver attention area extraction method.
Applsci 10 05474 g001
Figure 2. The structure diagram of IEB.
Applsci 10 05474 g002
Figure 3. The demonstration diagram of dense connection mode.
Applsci 10 05474 g003
Figure 4. Deep network feature visualization (DNFV) schematic diagram.
Applsci 10 05474 g004
Figure 5. The part of data set display diagram.
Applsci 10 05474 g005
Figure 6. The Experimental results. (a) Description of the change of loss function during training; (b) Description of the comparison of accuracy.
Applsci 10 05474 g006
Figure 7. The comparison graph of different network test results. (ad), respectively, represent the experimental results of DensNet169, VGG16, InceptionV3 and Driver Behavior Information Network (DBIN).
Applsci 10 05474 g007
Figure 8. The comparison graph of DBIN experimental results at different training stages. (ac) represent the first, middle and last three stages of training, respectively.
Applsci 10 05474 g008
Figure 9. The display diagram of various scenes. (af) shows six different situations, respectively.
Applsci 10 05474 g009

