1. Introduction
The fuel system of a hydrogen-powered car consists of several subassemblies. One of the possible concepts of using hydrogen as an energy medium for its drive mechanism is the application of hydrogen fuel cells. These are supplied with hydrogen from high-pressure tanks, the design of which has changed over the last decades. The output of the hydrogen fuel cell is electrical energy, which is stored in small batteries for the purpose of powering the engine management system (they ensure its commissioning if the reaction in the fuel cell is not yet active), and the rest of the energy is used for a car drive itself. Today’s hydrogen cars, with a good approximation, can be considered electric cars, with a different source of electricity—it is obtained directly on board a car. The advantage of such a solution is the ability to quickly pump hydrogen into the tanks and thus continue driving with a slight time delay (normal pumping of hydrogen takes as long as pumping diesel or gasoline—usually several minutes). The negative consequence of this solution is the need to have hydrogen on board the car, which brings increased requirements for the level of the minimum risk. It is also necessary to take into account the fact that even classic cars with fossil fuels are flammable and have specific risk values. The same goes for electric cars—batteries stored within the floor of the car pose a safety risk. Each of these cars is characterized by different risk values due to their different properties. The disadvantage of hydrogen is its wide range of explosiveness in the event of possible leakage from pressure tanks or from the distribution system. For this reason, it is necessary to define the effects of a possible explosion on the surrounding environment and to determine a safe zone around the reservoir. Several authors have addressed these areas. Shen et al. [
1] performed a real explosion of a pressurized hydrogen reservoir with a pressure of 35 MPa, analyzing the intensity of the pressure wave, thermal radiation and flying fragments to determine the safe zone. Zhang et al. [
2] analyzed the temperature, pressure and velocity effects of a hydrogen explosion in enclosed spaces using a numerical simulation. Lidor et al. [
3] analyzed the explosion limits of the H
2-O
2 system. They proposed a unique concept for explaining the branching behavior, based on thermodynamic stability analysis. Li et al. [
4] analyzed the mechanism of explosion of a mixture of methane and air in a closed vessel. Similarly, Wang et al. [
5] performed a numerical simulation of a methane explosion in a building and an analysis of the effects on the structure.
2. Analysis of the Risks of Possible Hydrogen Leakage in a Car’s Fuel System
Properties that characterize hydrogen as a fuel or energy carrier require that technical and operational measures be applied that minimize the risks of failure or accident to an acceptable level. The basic risks in the operation of hydrogen drives include:
The risk of burning, ignition and explosion;
The risk of the pressure exceeding;
The risk associated with a low operating temperature;
The risk due to hydrogen embrittlement;
The risk of hydrogen exposure to the human body [
5].
The risk of burning, ignition and explosion represents the dominant risk of the hydrogen system, which will be addressed in the content of the article. Hydrogen is highly likely to leak due to its physical and chemical properties. Leakage is directly related to the formation of a flammable mixture and can lead to ignition and explosion. It is also conditioned by the fact that hydrogen burns with a colorless flame, which is practically invisible to the naked eye and emits UV radiation. Not to be overlooked is the fact that the rate of flame propagation is an order of magnitude higher than in the case of fossil fuels [
6].
The risk of excess pressure is based on the principle of operation of hydrogen technology. This is due to the storage of large amounts of hydrogen under high pressure and therefore it is necessary to take into account the increased load on all components of the high-pressure part of hydrogen technology. The existence of this type of risk and its increase is also determined by the typical phenomenon of this technology, i.e., hydrogen embrittlement [
6].
The risk associated with a low operating temperature is due to a change in the properties of the materials in the hydrogen system. The hazard arises during the cooling of hydrogen to the temperature of liquid hydrogen (−253 °C). As a result, during the cooling of the materials, substantial changes in the strength properties of the structural nodes of the hydrogen system occur, which could result in, e.g., material failure.
The risk due to hydrogen embrittlement is due to the specific interaction of hydrogen and the material used. The materials of tanks, pressure vessels or other equipment may lose their strength properties under the long-term action of hydrogen. Among the factors that affect it can be included, e.g., the type of material, the concentration of hydrogen, its operating pressure, temperature, the type of stress of the fuel system components, the diameter of the grains as part of the microstructure of the materials and the history of its heat treatment, as well as the moisture contained in hydrogen [
6].
The risk of exposure of hydrogen to the human body is not life-threatening, however, this risk must also be taken into account. Direct contact with gaseous or liquid hydrogen can lead to local desensitization and to freeze burns of some parts of the human body. The burning of hydrogen, which creates a high temperature and a specific flame, also poses a health risk. Hydrogen is not characterized by direct toxic effects. However, it can cause suffocation, especially in closed spaces (such as in a car cabin) [
7,
8].
Defined risks also affect the so-called civil security. Disruptions of hydrogen technology, as part of the drive chain of a mobile vehicle, can result in a high number of people affected. Due to their main operating characteristic, which is mobility, cars can move with virtually no space restrictions. As a result of this operational feature, there is a risk mainly due to their movement in densely populated areas. The resulting biggest risk with these technologies is the leakage of hydrogen into the environment, which can mean an immediate explosion resulting in a fire. Based on the definition of individual types of risks of hydrogen systems, it can be stated that the strategically most significant risk is the possibility of hydrogen leakage out of the working environment, which creates the conditions for a hazardous state in which only minimal energy is needed to initiate an explosion [
9,
10].
4. Explosion Simulation
By means of numerical calculations of the course of the hydrogen explosion and consequently also the possible destruction of the car, or endangering the life of either direct actors or third parties, a model will be created by which it is possible, with a certain approximation, to quantify and qualify the thermodynamic processes and their parameters around the epicenter of the explosion. These are force, pressure, torque and noise effects that act on an obstacle in the space of the hydrogen fuel system as well as its converter. This makes it possible to obtain relevant information for the design of the space so that the risk of destruction and, as a result, material and human damage can be minimized to an acceptable level.
To quantify the consequences of destruction as a result of a possible hydrogen explosion, a stoichiometric mixture of hydrogen and air with a total volume of 1 m
3 was applied in the numerical calculation. The stoichiometric mixture guarantees perfect fuel combustion without excess air, while reaching the maximum value of the pressure and temperature. For this reason, the article deals only with this ideal ratio of hydrogen and air. The created model takes into account the ideal spherical shape of the mixture with a radius.
where
r is the radius of the mixture of gases with an ideal spherical shape (m), and
V is the volume of the stoichiometric mixture of hydrogen and air (m
3).
In the 3D model of the created geometry, a mixture of hydrogen and air in the shape of a sphere is located 1 m above the center of the coordinate system (above floor level). According to the statics of combustion, 0.296 m
3 of H
2 and 0.704 m
3 of air are required to form a 1 m
3 stoichiometric mixture. If a complete combustion of hydrogen according to stoichiometry is assumed, the temperature of the mixture will increase based on the calorimetric equation.
where:
- -
ΔT is the increase in temperature of the mixture during the combustion of hydrogen (K), and Q is the amount of heat released during the combustion of 0.296 m3 of hydrogen (Q = 3.167 MJ) (J);
- -
ρi is the density of the i-th component of the gas mixture after combustion (kg∙m−3);
- -
Vi is the partial volume of the i-th component of the gas mixture after combustion (m3);
- -
cvi is the heat capacity at a constant volume of the i-th component of the gas mixture after combustion (J∙kg−1∙K−1).
With perfect hydrogen combustion, it is possible to assume the formation of a mixture of nitrogen and water vapor, which increases the temperature of the gas mixture by 2107 K, which at the original temperature of 293 K represents a final temperature of 2400 K. increasing the pressure of the mixture according to the relation.
where:
- -
p2 is the absolute pressure in the volume of the mixture after the combustion of hydrogen (Pa);
- -
T1 is the temperature at the beginning of combustion (293.15 K) (K);
- -
T2 is the temperature after hydrogen combustion (K), and p1 is the atmospheric pressure (Pa).
The explosion simulation begins with the initialization conditions of the calculated pressure and temperature.
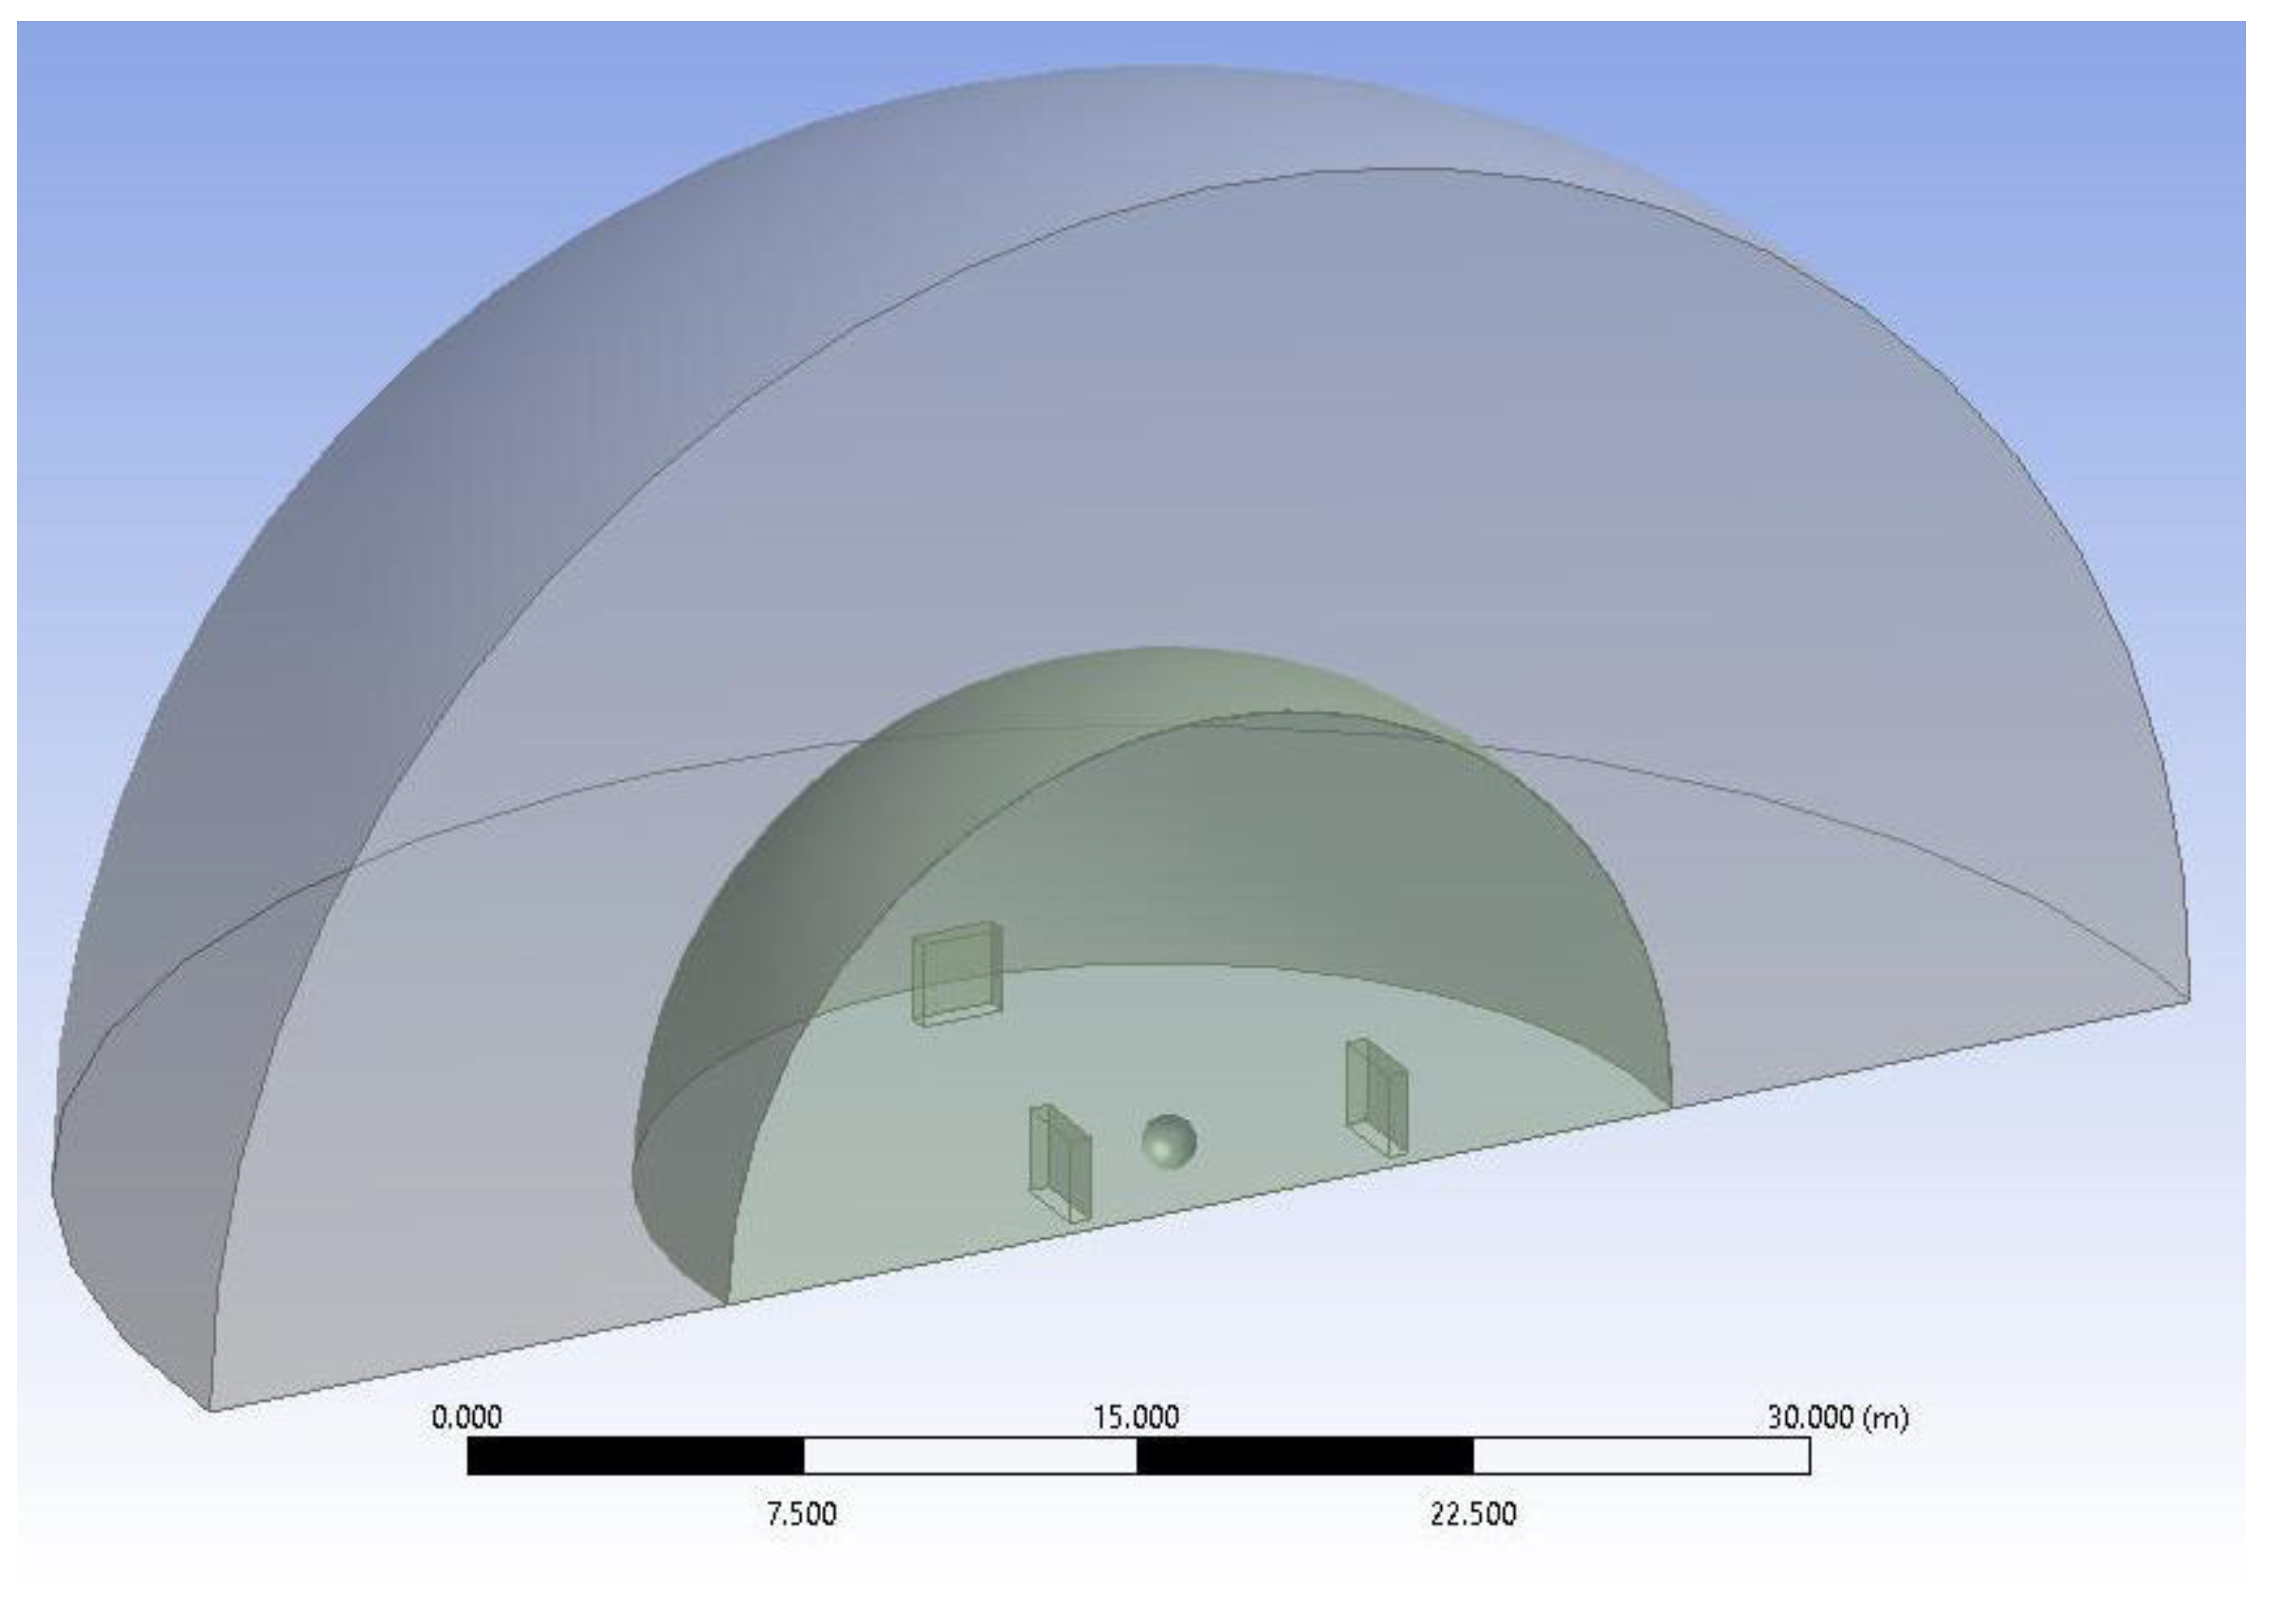
The aim of the simulation is to quantify the impact of the explosion on the environment. Stationary obstacles with a width of 2 m, a height of 2 m and a thickness of 0.5 m were applied to evaluate the force and moment effect. Obstacles are located 2.5, 5 and 10 m from the epicenter of the explosion so that the normal of the front surface passes through the center of the explosion. The calculation does not take into account the deformation of obstacles, which defines the degree of approach to the actual state. Obstacles are located near a vertical wall 1.5 m from the epicenter of the explosion (
Figure 2), 0.5 m from the side walls of obstacles 2.5 and 5 m away.
To determine the propagation of pressure waves, an area of the environment was created as a hemispherical space with a radius of 25 m, with two domains inside:
A sphere representing a mixture of hydrogen and air with a radius of 0.623 m;
A determined space bounded by a hemispherical surface with a radius of 12 m, in which the net will be compacted to obtain more accurate numerical calculation results.
After creating the geometry, it is necessary to discretize the domains to a final number of elements, thus creating a computational network. The generated network is created from 2 mil. of tetrahedron elements—
Figure 3.
In the simulation, a compressible fluid is considered, the flow of which is solved using a turbulent k-omega model. The calculation is realized as time-dependent with a total time of 40 ms and a time step of 0.05 ms. The number of iterations per time step was set to 15, with a residue accuracy of 5 × 10⁻⁵. The domains contain one boundary condition for the fluid outlet at a radius of 25 m with a relative pressure of 0 Pa.
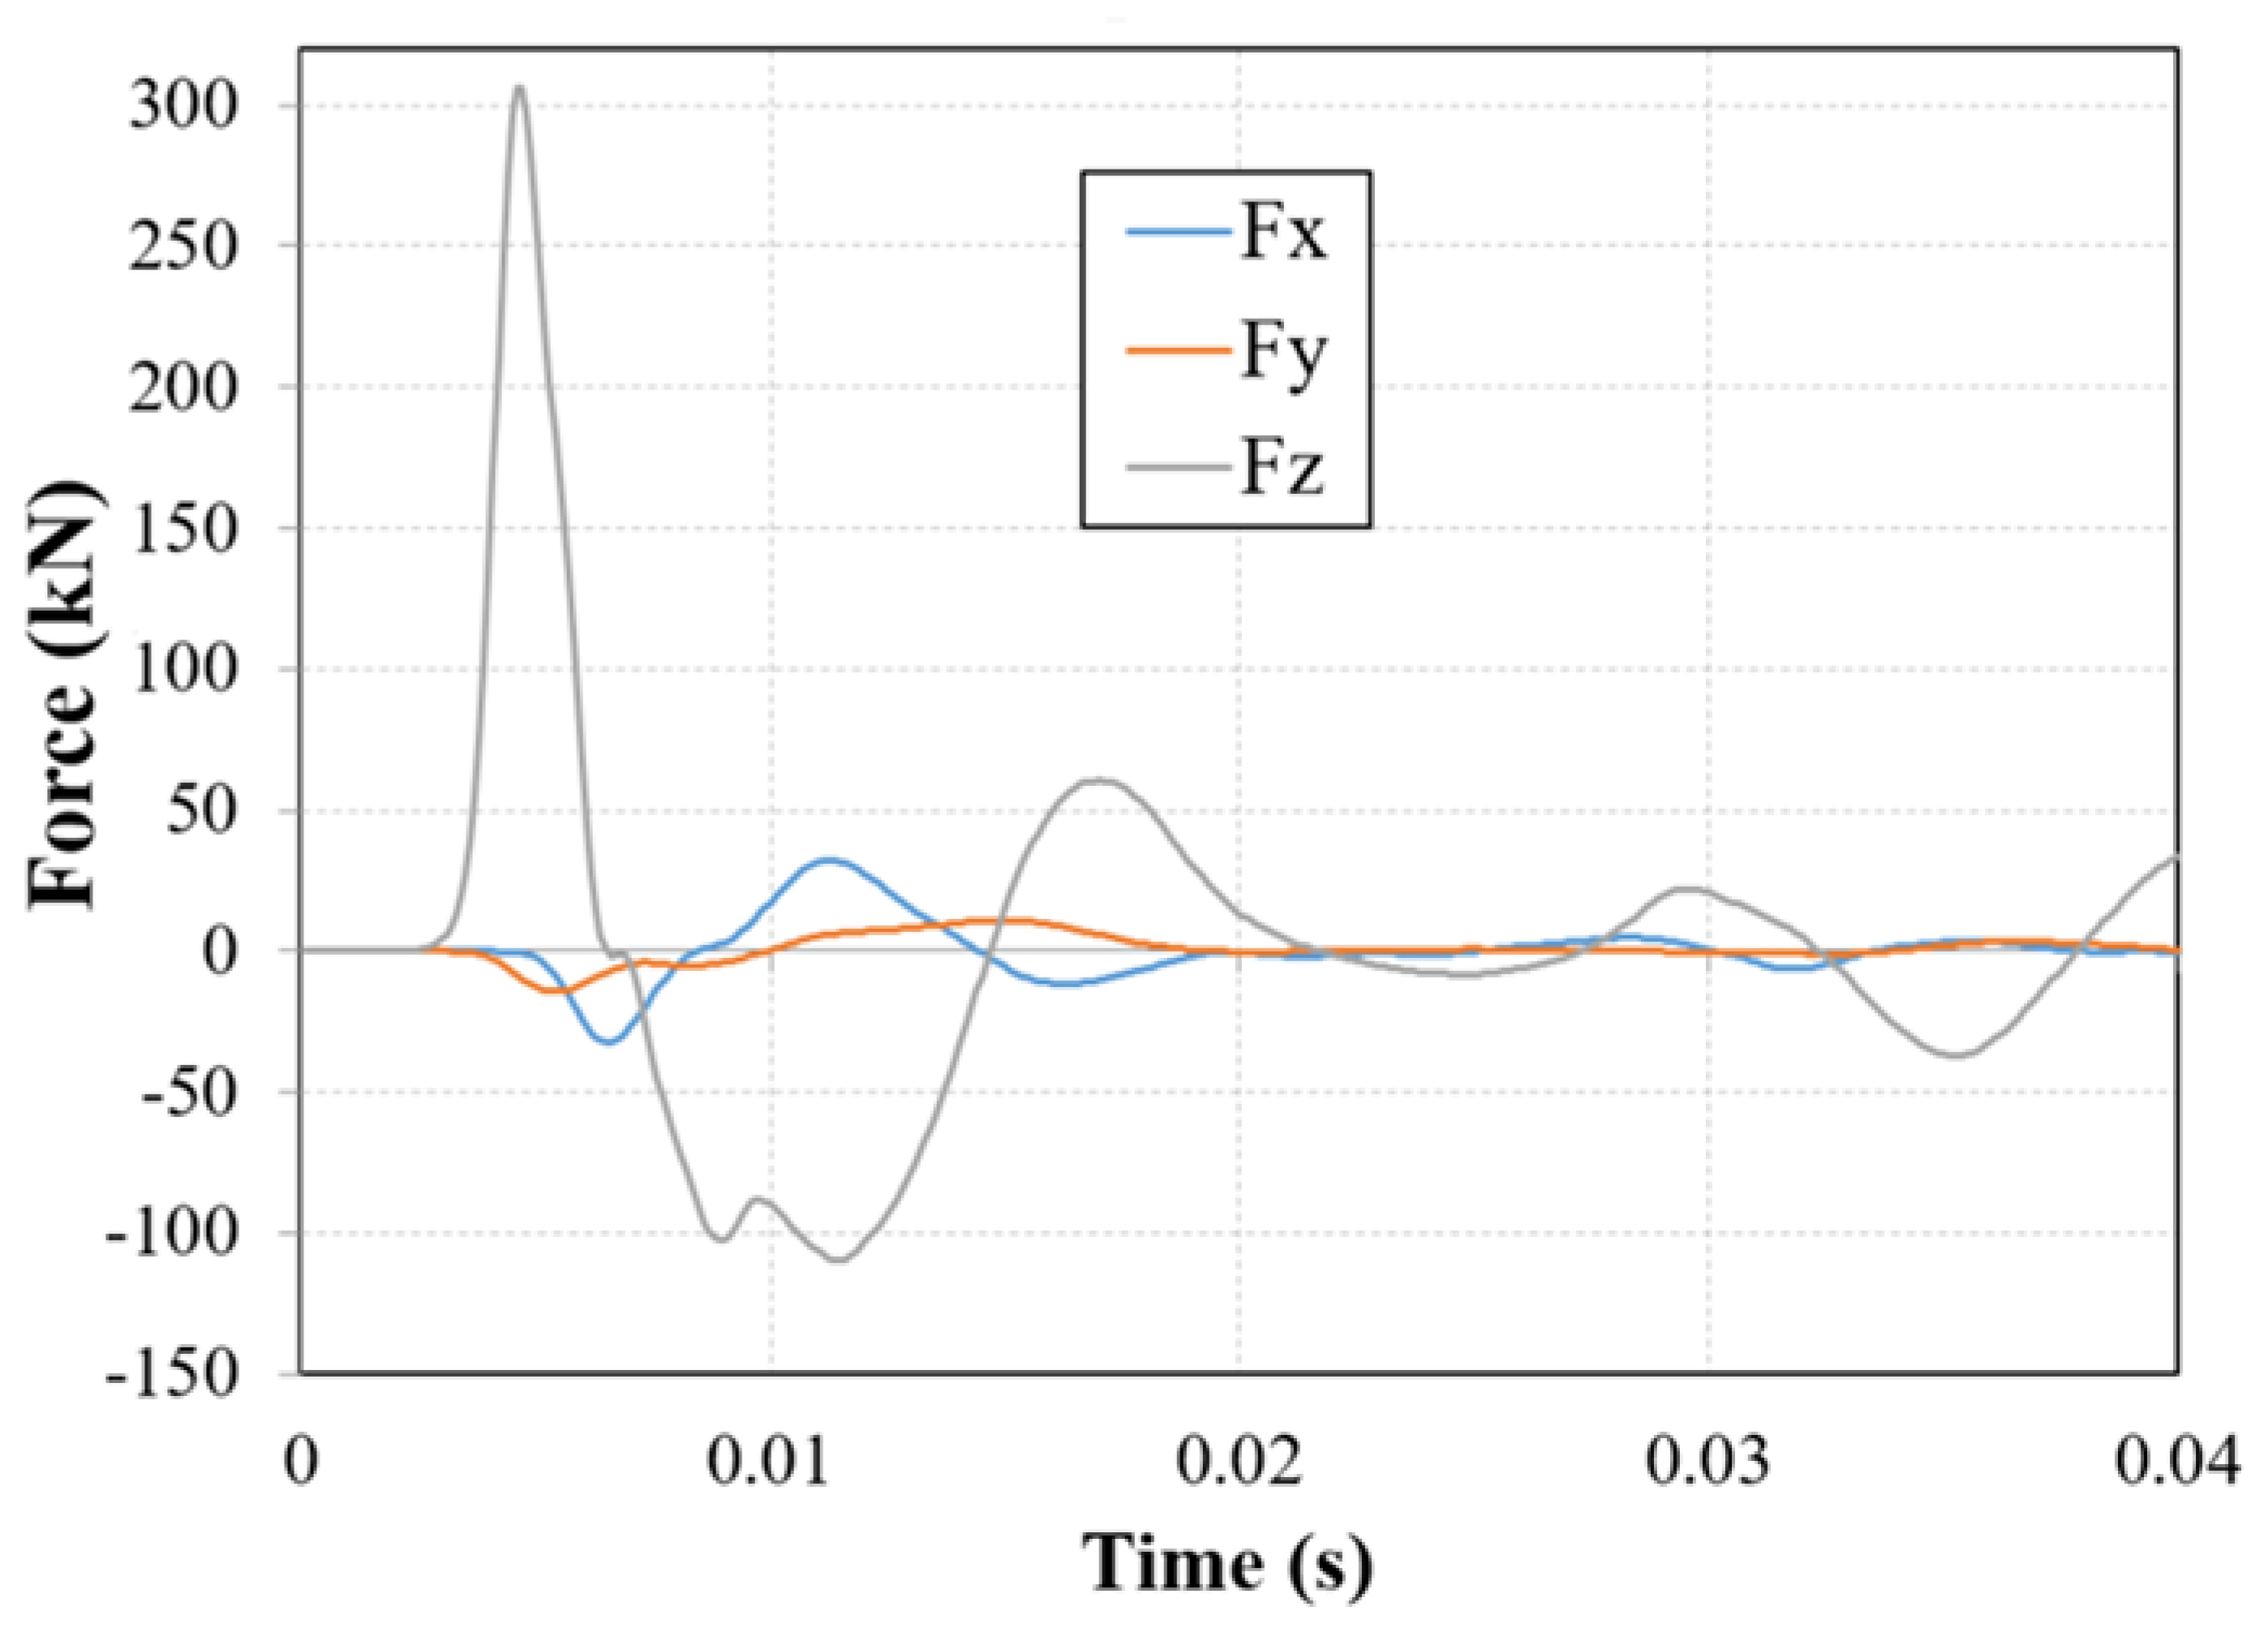
The calculated components of the force acting on the individual obstacles are shown in
Figure 4,
Figure 5 and
Figure 6, where:
- -
Fx is the component of the compressive force in the direction of the “x” axis in kN;
- -
Fy is the component of the compressive force in the direction of the “y” axis in kN;
- -
Fz is the component of the compressive force in the direction of the “z” axis in kN.
In order to evaluate the effects of an explosion, it is necessary to analyze mainly the first amplitude of the applied force, which acquires the highest values. The maximum values of the applied force are reached in components whose direction is identical with the direction of the normal of the front surface. The results of the numerical calculation of the propagation of the pressure wave near the solid wall 1.5 m from the center of the explosion were compared with the calculation of the propagation of the wave into free space. An increase in the maximum force component during the first amplitude is noticeable at an obstacle 5 m away from the explosion and acquires 28%. This increase is due to the interference of the fundamental source propagating wave with the wave reflected from the vertical wall.
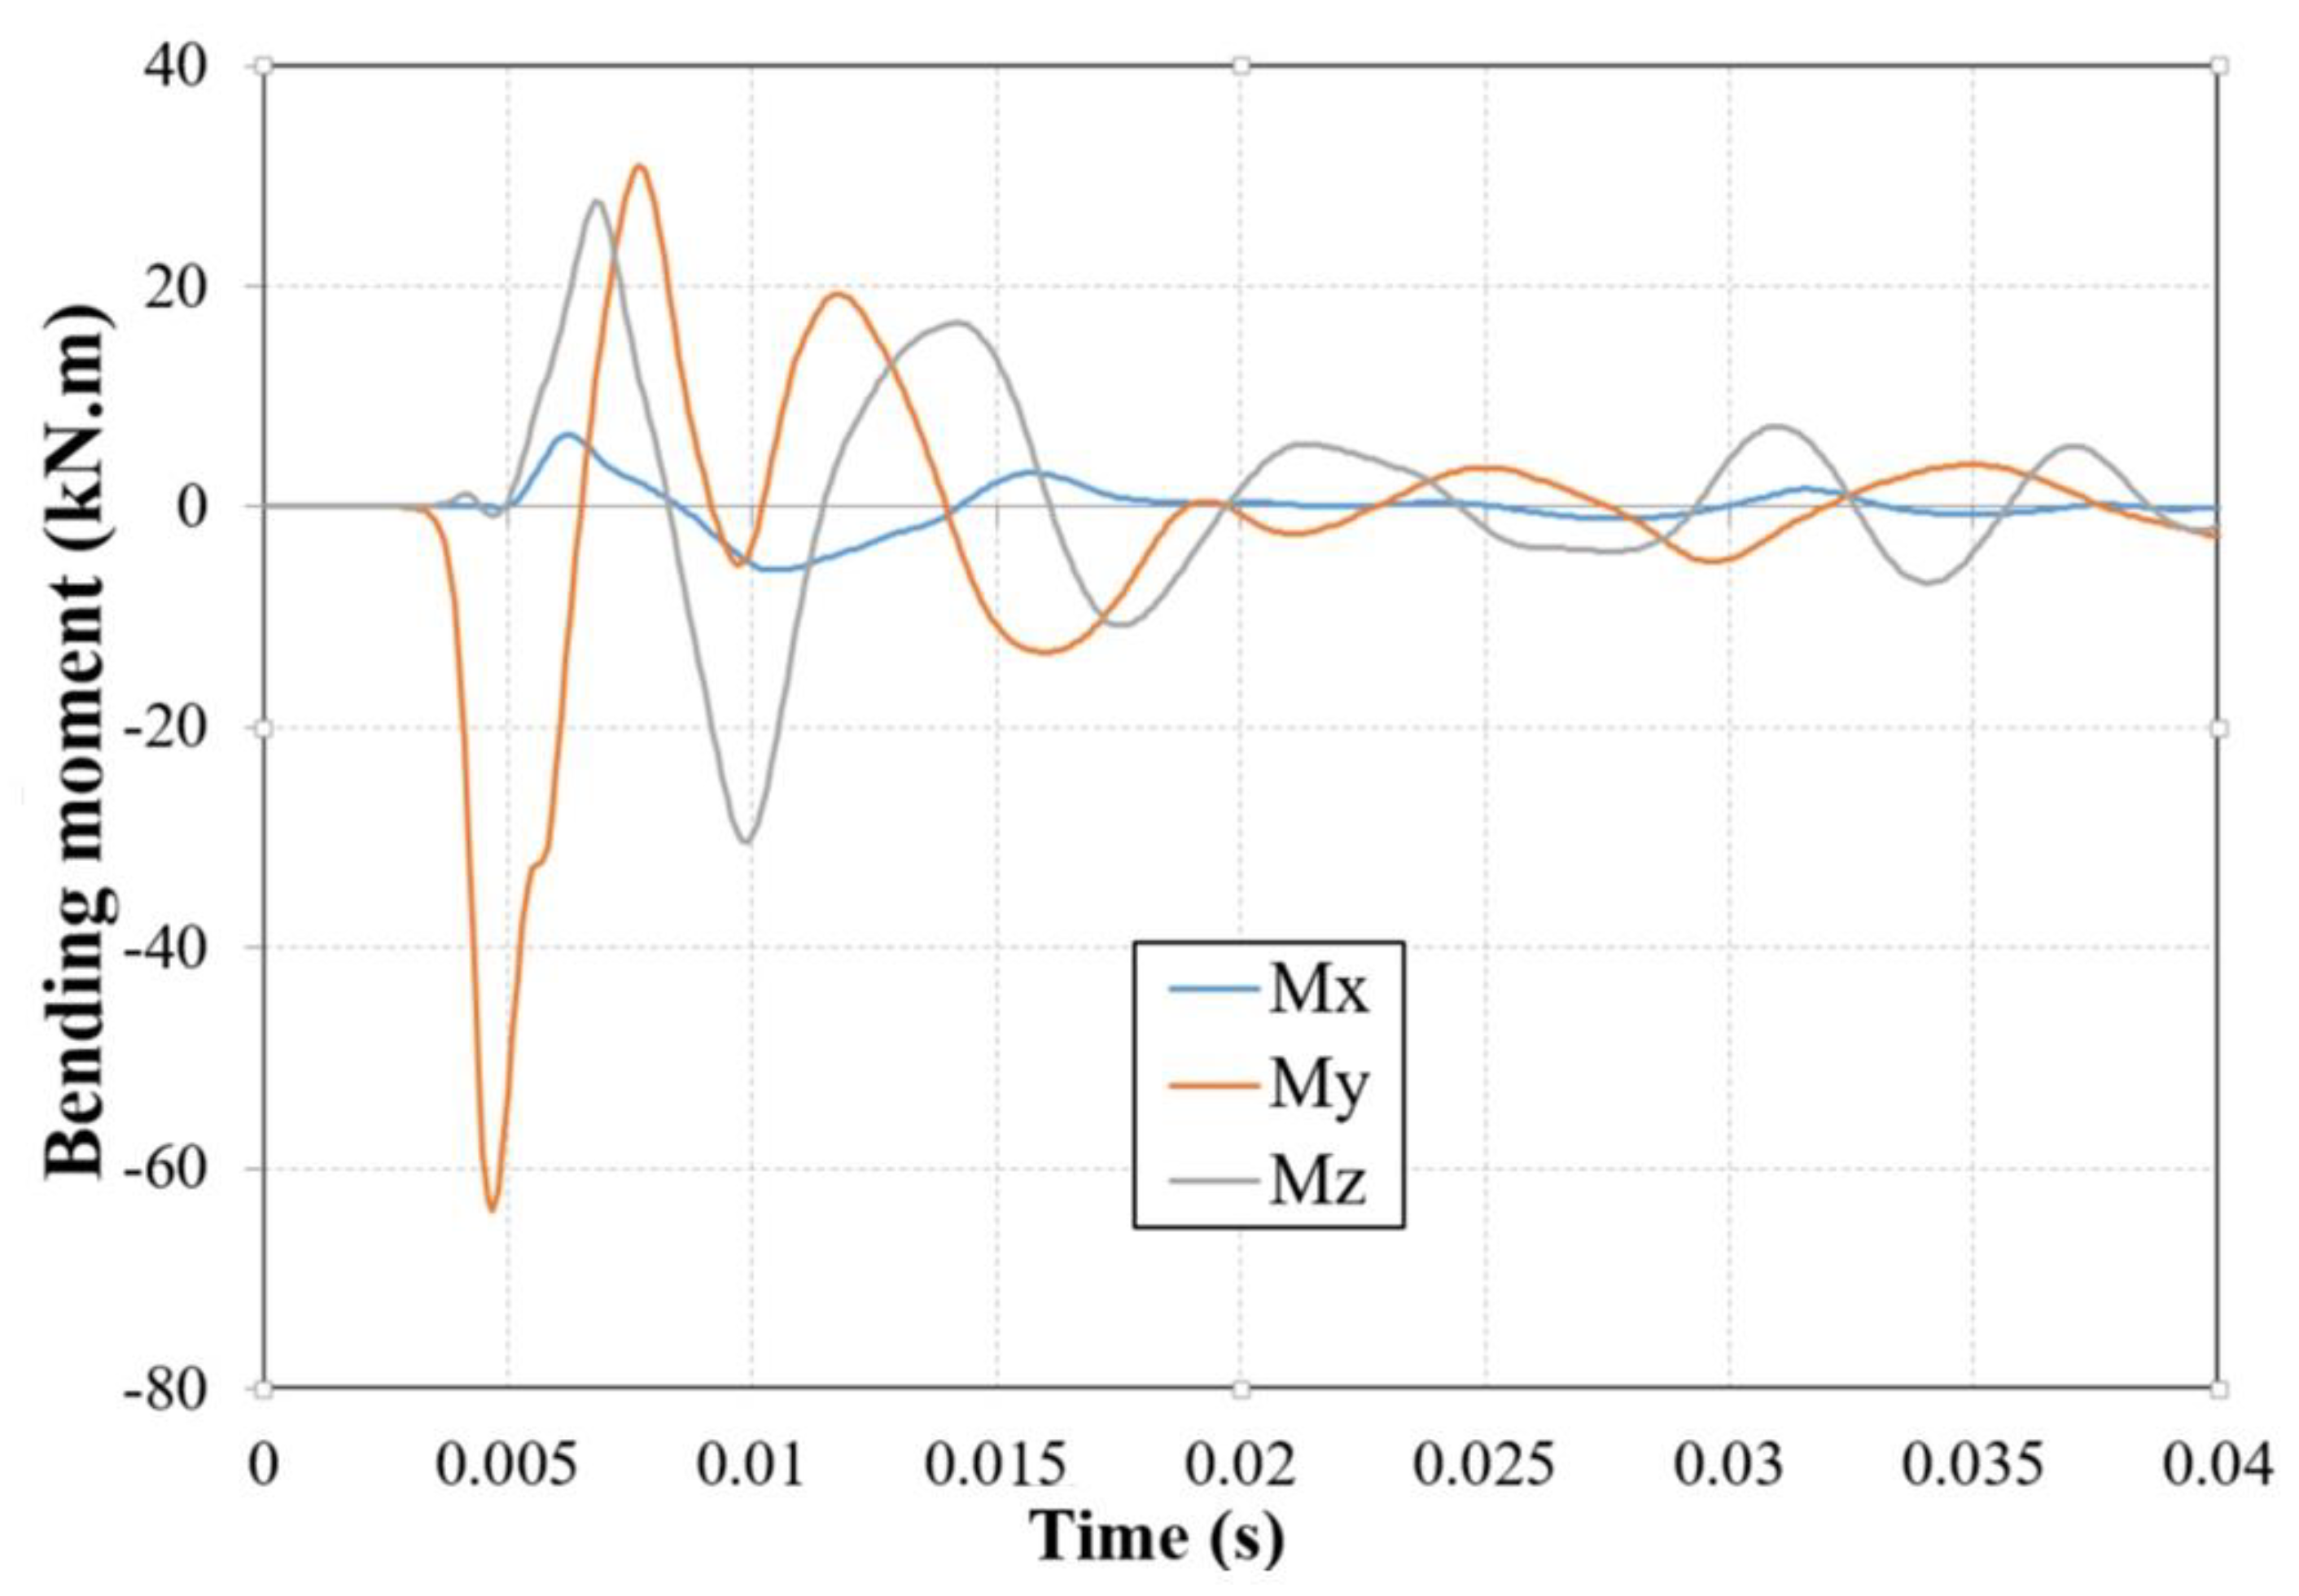
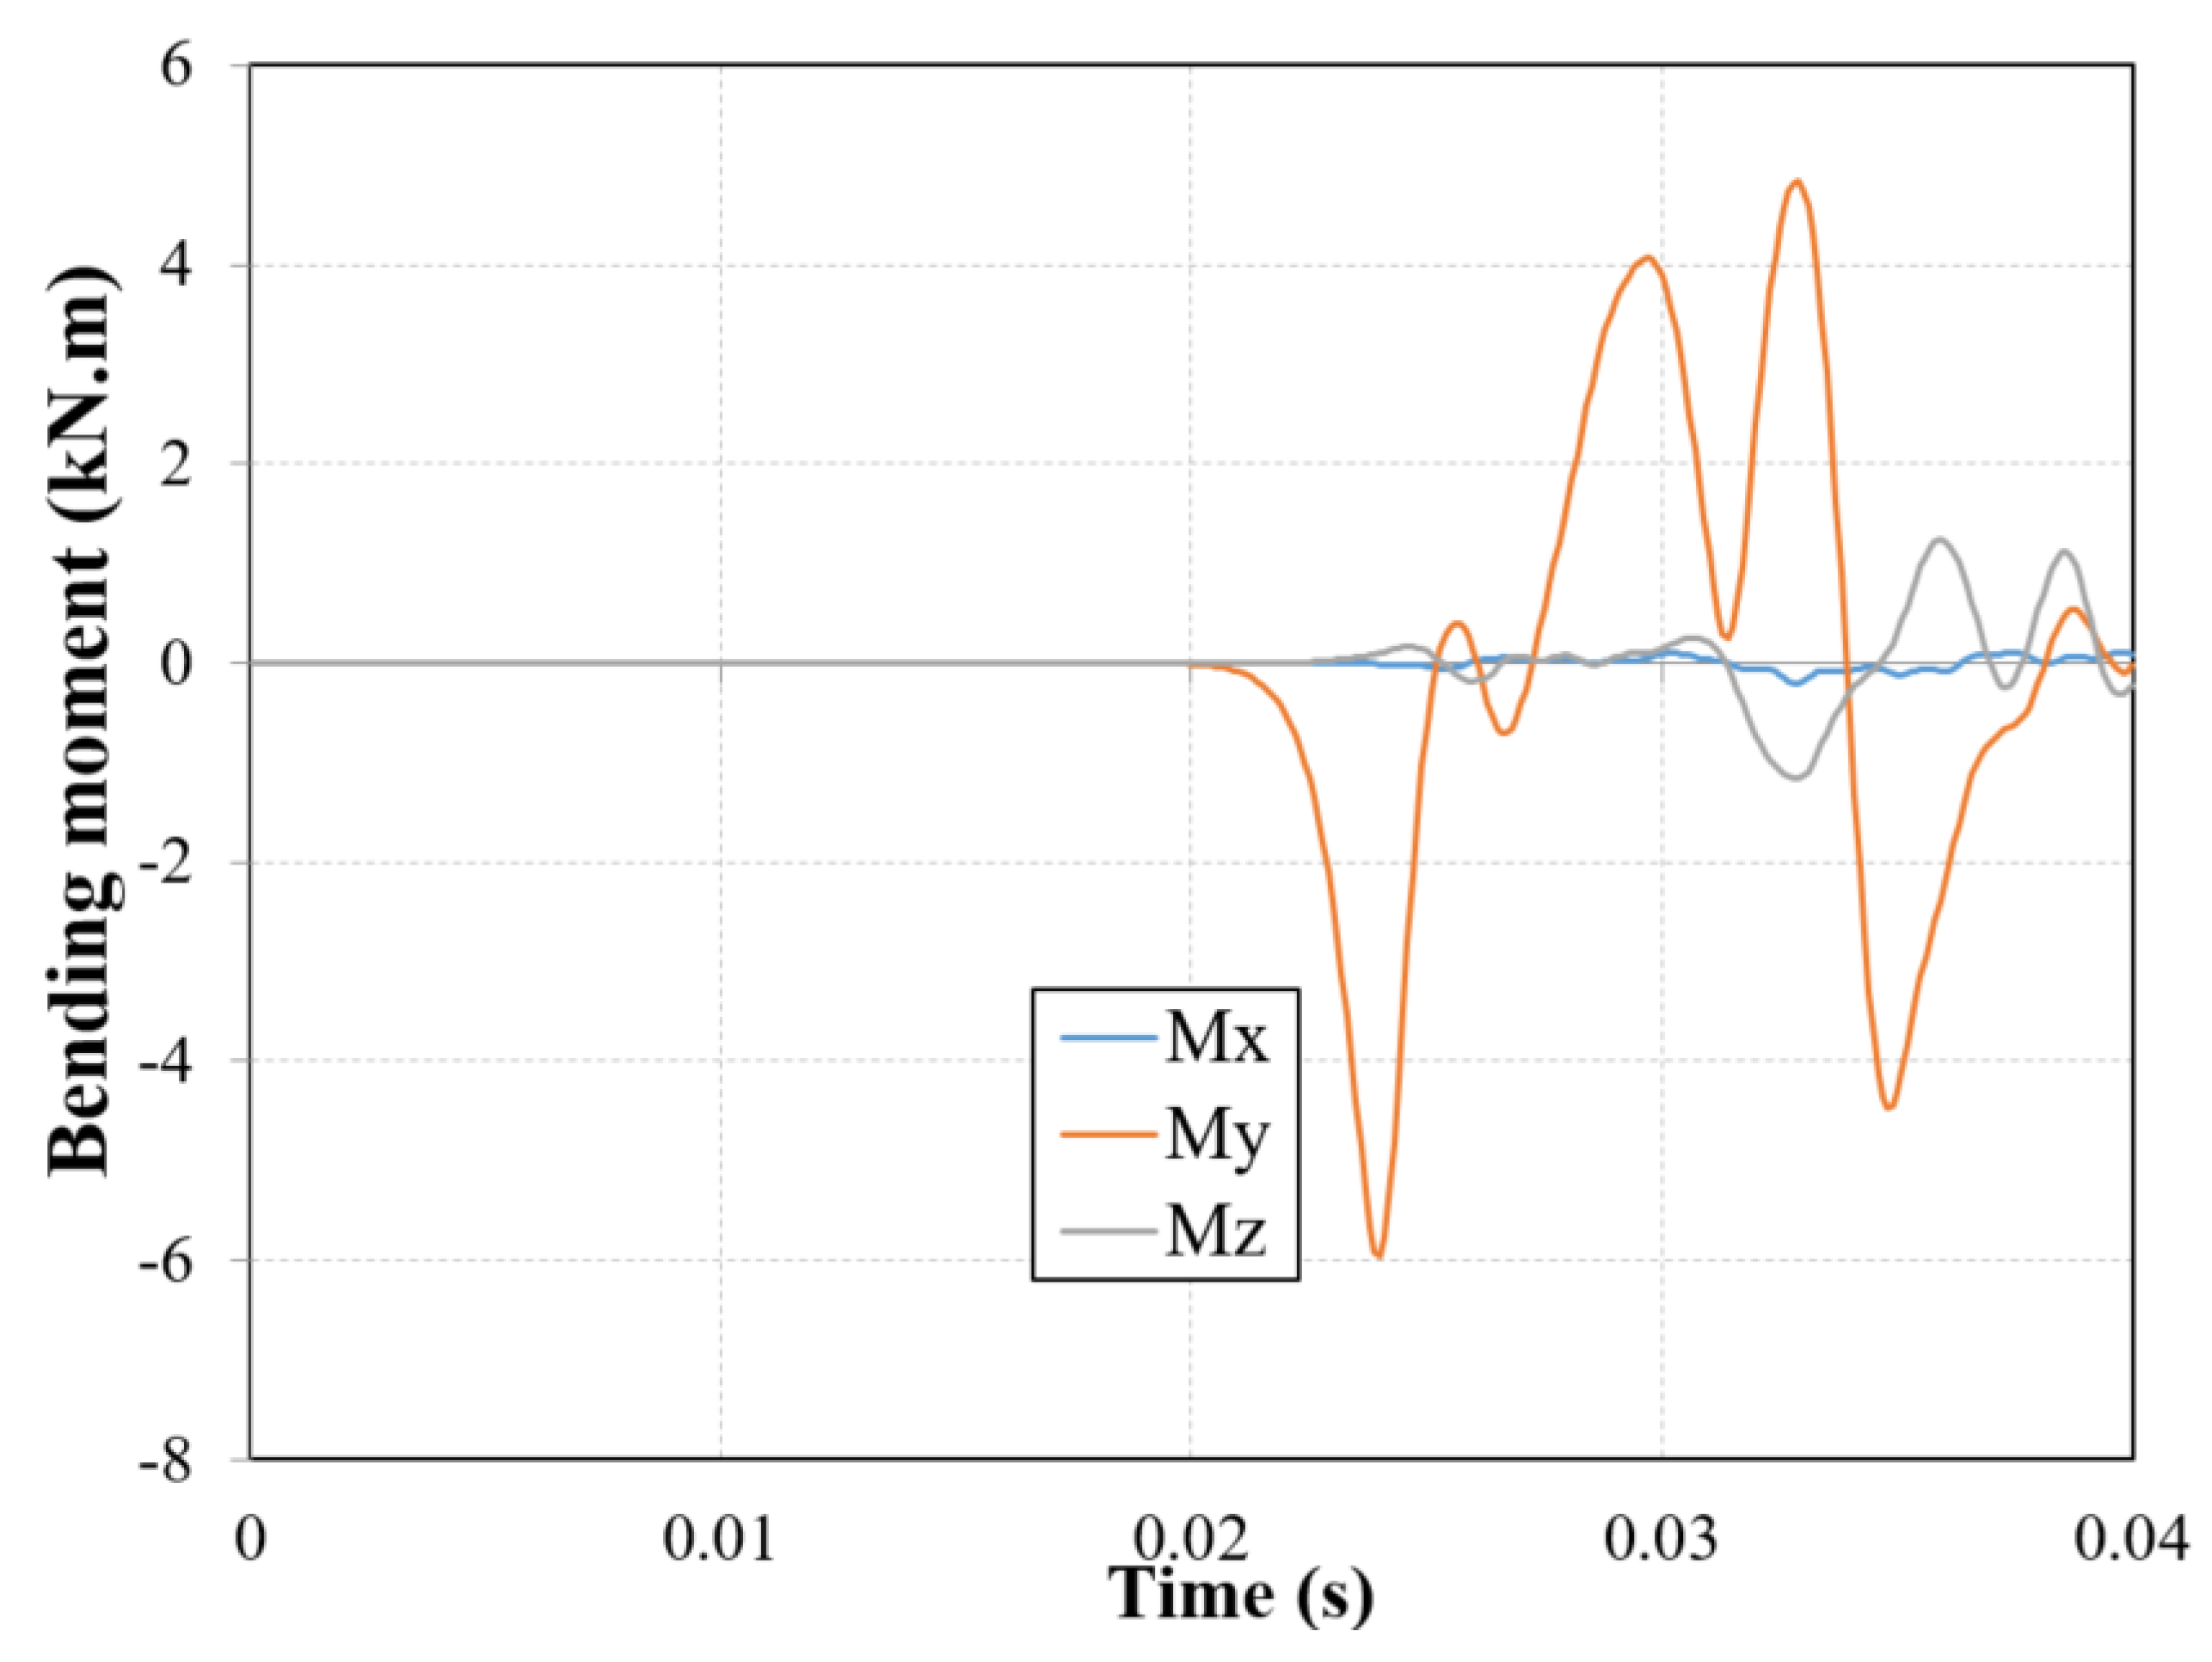
An illustration of the course of bending moments acting on obstacles during an explosion is shown in
Figure 7,
Figure 8,
Figure 9 and
Figure 10. Similar to the evaluation of compressive forces, due to the interference of shock waves, the maximum bending moment at an obstacle 5 m away is increased by 31.6% compared with the case where a vertical wall was not included in the simulation.
It is clear from the results of the numerical calculation that the obstacle during the hydrogen explosion is acted upon by complex components of the force and moment effect, which can cause considerable devastating effects.
Figure 11 shows the course of the average static pressure on the front surfaces of the obstacles as a function of time.
Figure 12,
Figure 13 and
Figure 14 show an isobaric area with a pressure of 2 kPa at different explosion times.
It is possible to define the effects of an explosion on the human body by analyzing pressure profiles. They are described in more detail in
Section 4 of this article.
The pressure wave from the explosion reaches an obstacle 2.5 m away in 2.4 ms. The maximum pressure value is reached in 4.6 ms.
It is possible to monitor the propagation of primary as well as reflected pressure waves on the shown isobaric surfaces. From the analyzed obstacles, they acquired the maximum values of the first amplitude of the investigated quantities on the obstacle 2.5 m away. With increasing distance from the center of the explosion, there was a significant decrease in the maximum amplitude of the applied pressure, force and torque.
6. Conclusions
The results obtained by simulating the origin and course of the explosion clearly point to serious consequences in the event of a hydrogen leak from the car tank and a subsequent explosion. Storing hydrogen at high pressure in a tank poses a significant risk. Relevant information obtained by means of explosion simulation creates the preconditions for designers of hydrogen-powered cars for applications of their location in the body space as well as the choice of the technologies used, e.g., the type of material used, the choice of the parameters of the part in the engine compartment of the body, the dimensioning of the connected parts, the choice of the materials of valves and pipes for hydrogen transport, the shape and choice of material for tanks.
When comparing conventional fossil fuel/petrol and diesel/hydrogen car propulsion, it should be noted that fossil fuel power units are also characterized by significant fire risks. Fossil fuels, in the case of their leakage from the fuel system, can, e.g., in the event of an accident, cause intense fires with the occurrence of a large amount of harmful emissions, which can cause, e.g., suffocation—in the case of the entrapment of a person in the vehicle. It can also be stated that the use of fossil fuels in the event of fire causes serious injuries due to the longer duration of the fire, i.e., prolonged exposure of the human body to high temperatures than in a fire which may result from the use of hydrogen propulsion. In the event of a hydrogen-powered car fire, it is possible to consider the danger of an explosion. The temperatures that arise during the explosion are high, but due to the high rate of hydrogen burning, there is no long-term effect of heat on the human body. Combustion of fossil fuels and the consequent occurrence of harmful CO2 and NOX emissions are currently also significant environmental risks, especially in urban areas. Although their effect is not immediate, it is a significant problem in the long run. Hydrogen cars are practically emission-free during their operation—they generate only water vapor and clean water. The energy needed to produce pure hydrogen may or may not be emission-free—it depends on the technology used and the way electricity is produced.
In the case of the use of electric cars, one of the most significant risks is the material used to construct the battery, e.g., lithium. If the battery is damaged, a fire can be expected due to its physical and chemical properties for a short time [
6]. They are also characterized by the property of latent burning, or where the fire reappears repeatedly after a certain time, and while previously there was the impression that the fire is no longer active, several cases of accidents describe the impossibility of quickly eliminating an electric vehicle fire. The fire is so intense and so hot that fire-fighting and rescue services focus mainly on securing the environment unless the fire “burns out”. The battery was, for example, ignited even after 24 h when the wreck of the electric car itself was transported to the scrap yard. In this case, a fire poses an unacceptable risk [
6].
It is clear that each type of drive is characterized by different characteristics and risk values. The design of hydrogen drives must be based on multicriteria decision making. It can be assumed that the decisive parameter will be the minimization of all types of risks.


