Article

Quantitative Analysis of Movements in Children with Attention-Deficit Hyperactivity Disorder Using a Smart Watch at School

1
Departments of Pediatrics, Kaohsiung Medical University Hospital, Kaohsiung Medical University, Kaohsiung City 80708, Taiwan
2
Department of Pediatrics, School of Medicine, College of Medicine, Kaohsiung Medical University, Kaohsiung City 80708, Taiwan
3
Department of Information Engineering, I-Shou University, Kaohsiung City 84001, Taiwan
4
Department of Computer and Communication, National Pingtung University, Pingtung City 90003, Taiwan
5
Department of Electrical Engineering, I-Shou University, Kaohsiung City 84001, Taiwan
*
Authors to whom correspondence should be addressed.
Appl. Sci. 2020, 10(12), 4116; https://doi.org/10.3390/app10124116
Submission received: 16 May 2020 / Revised: 10 June 2020 / Accepted: 12 June 2020 / Published: 15 June 2020

Abstract

:
Attention-deficit hyperactivity disorder (ADHD) is primarily diagnosed using set criteria and checklists. However, authors have indicated that such criteria and checklists are subjective. In this study, data from the gyroscope and accelerometer in a smart watch were used to analyze the movements of children with ADHD. This study cohort comprised 15 children with ADHD and 15 age- and sex-matched control participants. The children with ADHD and controls wore the watches on their non-writing hands simultaneously in class. The recordings of one patient and one control were tracked for 2 h daily for three consecutive days with desk and seated class activities. We compared the measurements of variance and the zero-crossing rate (ZCR) of the gyroscope and accelerometer between the children with ADHD and controls. All average variance and ZCR values of the three axes (x, y, and z) in the gyroscope and accelerometer were higher in children with ADHD than in the controls. Significant differences in average variance values on the y-axis (p < 0.001) and ZCR values on all three axes (x, p = 0.005; y, p = 0.003; and z, p = 0.004) of the gyroscope were observed. Similarly, significant differences in the average variance values on the three axes (x, p = 0.001; y, p < 0.001; and z, p < 0.001) and ZCR values on the z-axis (p = 0.006) of the accelerometer were observed. The proposed method is a promising tool to objectively analyze the movements of children with ADHD at school.

1. Introduction

Attention-deficit hyperactivity disorder (ADHD) is one of the most common childhood psychiatric disorders and affects 3%–10% of children [1,2,3]. Currently, ADHD diagnoses are mostly dependent on criteria based on the Diagnostic and Statistical Manual of Mental Disorders, Fifth Edition (DSM-V). In addition to these criteria, some physicians use checklists to diagnose ADHD. However, many authors have indicated that the criteria and checklists used to diagnose ADHD are subjective, and objectively diagnosing ADHD is thus difficult [4]. For example, López-Villalobos et al. found that using the ADHD Rating Scale IV led to overdiagnosis compared with using clinical interviews and that the diagnosis varied by procedure [5]. Although some behavioral and neuroscientific measures such as Conners’ Continuous Performance Test (CPT) have been used to diagnose ADHD, correlations between CPT parameters and parent and teacher ratings of inattentive and hyperactive impulsive behavior have been reported to be weak in some studies [6,7], which limits the clinical reliability of the CPT. In recent years, sensor technology has advanced to the extent that a wearable device as small as a watch can record data for long periods. These devices have been used to study many diseases, such as osteoarthritis, cerebral palsy, Parkinson disease, and stroke [8,9,10,11]. In patients with ADHD, a computer-based infrared motion-tracking system and actigraphy have been used to differentiate children with ADHD from healthy controls [12]. However, the infrared motion-tracking system can only be used together with the CPT [13]. Through actigraphy analysis, movement counts from actigraphs in patients with ADHD must be converted into kilocalories (kcal) [14]. The calculation method is thus indirect. Other actigraphy studies have only classified performance between patients with ADHD and controls or presented an increased mean activity in children with ADHD, but they have lacked a detailed movement analysis of children with ADHD [15,16,17]. In the present study, we used a direct and convenient method to objectively detect detailed movements in children with ADHD.
Studies have reported that increased activity compared with controls is characteristic in patients with ADHD [18,19]. Intensity of movement is a better metric for distinguishing children with ADHD from controls than the number of movements measured through actigraphy [19]. Furthermore, two studies have used an accelerometer as an objective tool for diagnosing ADHD [15,20]. The authors observed a small difference in the mean and variance in activity between ADHD and non-ADHD groups in language and math courses; however, in an art course, large differences in the mean and variance in activity between the two groups appeared [20]. In addition, two other studies have used a gyroscope with an accelerometer to distinguish patients with ADHD from controls during various activities during a visit to a psychiatric consultancy [21] and when performing nine motor tasks [22]. Both studies presented satisfactory performance in distinguishing between patients with ADHD and controls. However, these studies were task-oriented and did not measure natural/ambient movements. In the DSM IV Text Revision, ADHD is characterized by persistent inattention or hyperactivity–impulsivity on a more frequent or severe scale than expected at a particular level of development, and this adversely affects at least two areas of life (e.g., home and school) regarding social, academic, or occupational functioning. Based on clinical observation, compared with controls, children with ADHD presented hand actions with more variant speeds and higher frequency, such as movement back and forth along a spatial direction and rotation around a spatial direction back and forth, than did controls. The magnitude of the variation in motion can be quantified using a simple variance measure, and the speed of motion can be quantified using frequency domain analysis. These movements can be measured using the motion sensors (triaxial gyroscope and accelerometer) in a smart watch.

2. Materials and Methods

2.1. Participants

The study cohort comprised 15 children with ADHD (11 male and 4 female patients) and 15 age- and sex-matched control participants. All children were recorded after being examined by a pediatric neurologist or psychiatrist. None of the children were on medication at the time of testing. Children with a history of epilepsy, mental retardation, drug abuse, head injury, or psychotic disorders were excluded. ADHD was diagnosed according to the DSM-V criteria, and the Swanson, Nolan, and Pelham Teacher and Parent Rating Scale (SNAP-IV) was used to evaluate ADHD severity. SNAP-IV scores from teachers were not available for 2 of the 15 patients in the present study. ADHD is classified into three subtypes depending on the symptoms: inattentive, hyperactive–impulsive, and combined. Children with the inattentive subtype mainly have inattentive symptoms and few or no hyperactive symptoms, those with the hyperactive—impulsive subtype mainly have hyperactive or impulsive symptoms and few or no inattentive symptoms, and those with the combined subtype have both inattentive and hyperactive symptoms. In the ADHD group, 11 boys and 4 girls were enrolled. Among them, 12 were the combined type (11 boys, 1 girl), and three were the inattentive type (three girls). The mean age of the ADHD group was 6 years and 11 months ± 1 year and 0 months (ranging from 5 years and 2 months to 8 years and 7 months), and that of the control group was 6 years and 9 month ± 1 year and 1 month (ranging from 5 years and 4 months to 8 years and 6 months: Table 1). Written informed consent was obtained from a family member or legal guardian in each case. This study was approved by the Institutional Review Board of Kaohsiung Medical University Hospital [KMUIRB-SV(II)-20170015].

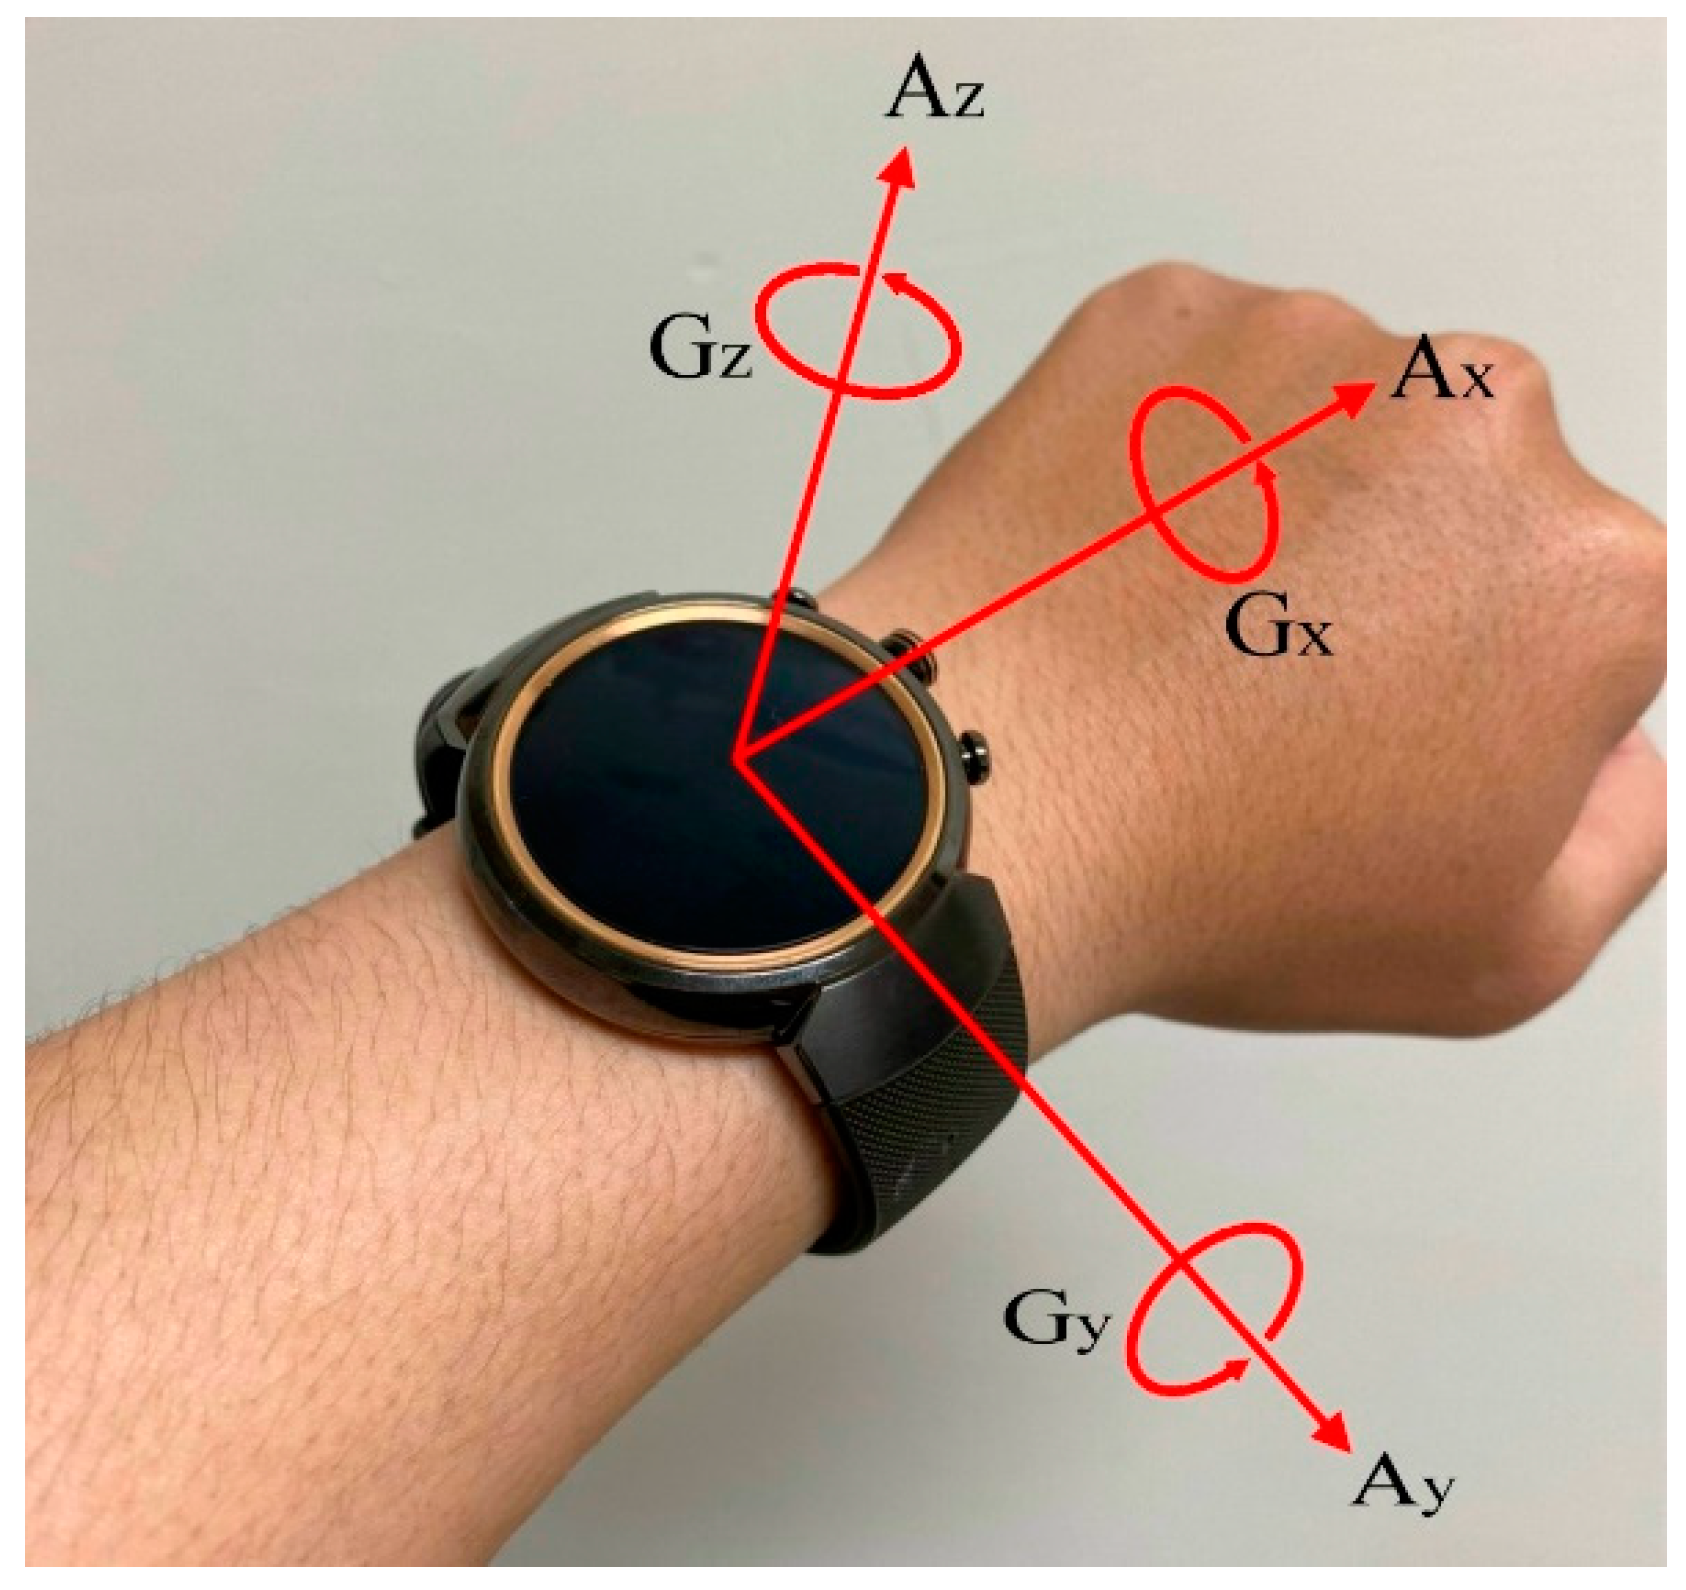
2.2. Gyroscope and Accelerometer Recordings

Recent advancements in technology have facilitated the installment of gyroscopes and accelerometers in wristwatches (ASUS ZenWatch 3, WI503Q, ASUSTeK Computer Inc., Taipei, Taiwan) for recording purposes. A smart watch (Figure 1) that measures six axes of movement (three for the gyroscope and three for the accelerator) was used. We used our own application program (app) written in Java for the recording. The app recorded five data points per second in the three axes of the gyroscope and accelerometer by using a low-pass filter of 2.5 Hz. The gyroscope was used to measure angular velocity—Gx, Gy, and Gz (Figure 1)—in degrees per second, and the detected value was displayed as 16-bit digits. The accelerometer measured acceleration in the axial direction—Ax, Ay, and Az (Figure 1)—in units of g, and the detected value was displayed as a 16-bit digit. Due to limitations of the skeletal structure of the human hand, different hand actions presented different movements and rotations in different spatial directions. Therefore, the gyroscope and accelerometer values along the x-, y-, and z-axes contain different information regarding rotation movements. Therefore, to compare and determine the most discriminative direction, the gyroscope and accelerometer values were quantified separately along the x-, y-, and z-axes.
Each data point included Gx, Gy, Gz, Ax, Ay, Az, and the time values. During preprocessing, to reduce some activities that may have affected our analytic results, such as going to the restroom, we manually removed some data points according to teachers’ recordings. The children with ADHD and the controls wore the watches on their non-dominant wrist simultaneously during class. The recording period was between 1:00 p.m. and 5:00 p.m., and the time point was the same for 3 consecutive days. One child with ADHD and one control underwent recordings for 2 h per day. Normally, these children took language or mathematics classes during recording. The classroom had 20–30 children and 2–3 teachers. The teacher in the class recorded participants’ activities during the study period.

2.3. Feature Extraction

The zero-crossing rate (ZCR) is a simple and effective method of frequency domain analysis. Three standard spatial axes—the x-, y-, and z- axes—are used to describe the three-dimensional action space, as in Figure 1. Moreover, variance and ZCR have been used to quantify the variation and frequency of movement acceleration of the hand along a spatial axis and its rotation rate around a spatial axis during a period of time, respectively [23,24]. In the present study, the variance and ZCR of the three axes (x, y, and z) were used to quantify the movements of children with ADHD at school and compare these with those of the controls.
Let S be the matrix of signal raw values measured by the accelerometer that was installed in a participant’s smart watch, which may be represented as follows:
S = [ s x s y s z ] = [ s x 1 , s x 2 , , s x N s y 1 , s y 2 , , s y N s z 1 , s z 2 , , s z N ]
where s x , s y , and s z are the signal raw value sequences corresponding to the x -, y -, and z -axes, respectively, and N is the number of samples. To characterize the local distribution in the time domain of each signal sequence, the variance and ZCR were calculated using the sliding window approach. The sliding window approach is a well-known signal processing technique in which windows signify successive equal intervals of time for dividing the signal sequence into a set of non-overlapping subsequences. The window size was determined experimentally and was crucial for detecting local variation regarding the signal sequence more sensitively.
A signal sequence s = [ s 1 , s 2 , , s N ] was divided into a set of K = N / W non-overlapping subsequences:
{ s 1 , s 2 , , s K } = { [ s 1 , s 2 , , s W ] , [ s W + 1 , s W + 2 , , s 2 W ] , , [ s ( K 1 ) W + 1 , s ( K 1 ) W + 2 , , s K W ] }
where s k = [ s ( k 1 ) W + 1 , s ( k 1 ) W + 2 , , s k W ] denoted the k t h subsequence of the signal sequence s . For each subsequence s k , the following five types of features were calculated:
  • Variance is the spread of the probability distribution of the signal subsequence. To estimate population variance, a sample variance was calculated using the following equation:
    f k v a r = 1 W 1 i = 1 W ( s ( k 1 ) W + i f k m e a n ) 2
  • ZCR is the rate of sign changes along the signal subsequence. It was calculated using the following equation:
    f k z c r = 0.5 × 1 W 1 i = 1 W 1 | s g n ( s ( k 1 ) W + i + 1 ) s g n ( s ( k 1 ) W + i ) |
    where s g n ( x ) is the sign function and is defined as follows:
    s g n ( x ) = { 1 , i f   x 0 , 1 , i f   x < 0 .
After these two features were calculated for all subsequences of the signal sequence s , the average values corresponding to each type of feature were calculated as follows:
f v a r ¯ = 1 K k = 1 K f k v a r ,   f z c r ¯ = 1 K k = 1 K f k z c r
Therefore, two features, f x v a r ¯ and f x z c r ¯ , were obtained from the signal sequence s x ; two features, f y v a r ¯ and f y z c r ¯ , were obtained from the signal sequence s y ; and two features, f z v a r ¯ and f z z c r ¯ , were obtained from the signal sequence s z . In total, 12 features were used to characterize the accelerometer and gyroscope recordings of each patient.

2.4. Feature Discriminability Analysis

To evaluate the discriminability of each feature in the ADHD and control groups, the well-known area under the receiver operating characteristic (ROC) curve (AUC) was applied [25]. The AUC was calculated as the entire two-dimensional area underneath the entire ROC curve. The ROC curve was plotted with pairs of values of 1-specificity and sensitivity corresponding to the classification results obtained using different threshold values of the considered feature. In this study, specificity was defined as the proportion of control participants who were correctly classified as controls, whereas sensitivity was defined as the proportion of children with ADHD who were correctly classified as being in the ADHD group. Here, 1-specificity and sensitivity were plotted on the x- and y-axes, respectively, and each ranged from 0 to 1. A higher sensitivity and lower 1-specificity indicated features with a better specified threshold for distinguishing the ADHD and control groups. The AUC provided an aggregate measure of the discriminability of a given feature across all possible thresholds. A higher AUC indicated that a feature could better differentiate the ADHD and control groups.

2.5. Statistical Analysis

All statistical analyses were conducted using SAS (v9.3; SAS Institute Inc., Cary, NC, USA). Data are presented as means ± standard deviation. Measurements between the ADHD and control groups were conducted using the two-sample t test. As six measures were obtained from the accelerometer and gyroscope and to avoid multiple comparisons of inflation with type I errors, we applied Bonferroni adjustment, and p < 0.05/6 = 0.008 was considered statistically significant.

3. Results

No significant difference regarding age distribution was observed between the two groups. The SNAP-IV scores of children with ADHD and the controls were 43.38 ± 14.03 (ranging from 15 to 65) and 6.67 ± 5.38 (ranging from 0 to 16) according to teachers and 44.73 ± 14.68 (ranging from 15 to 67) and 14.87 ± 10.29 (ranging from 2 to 39) according to parents, respectively. The SNAP-IV scores were significantly different between the children with ADHD and controls (Table 1).

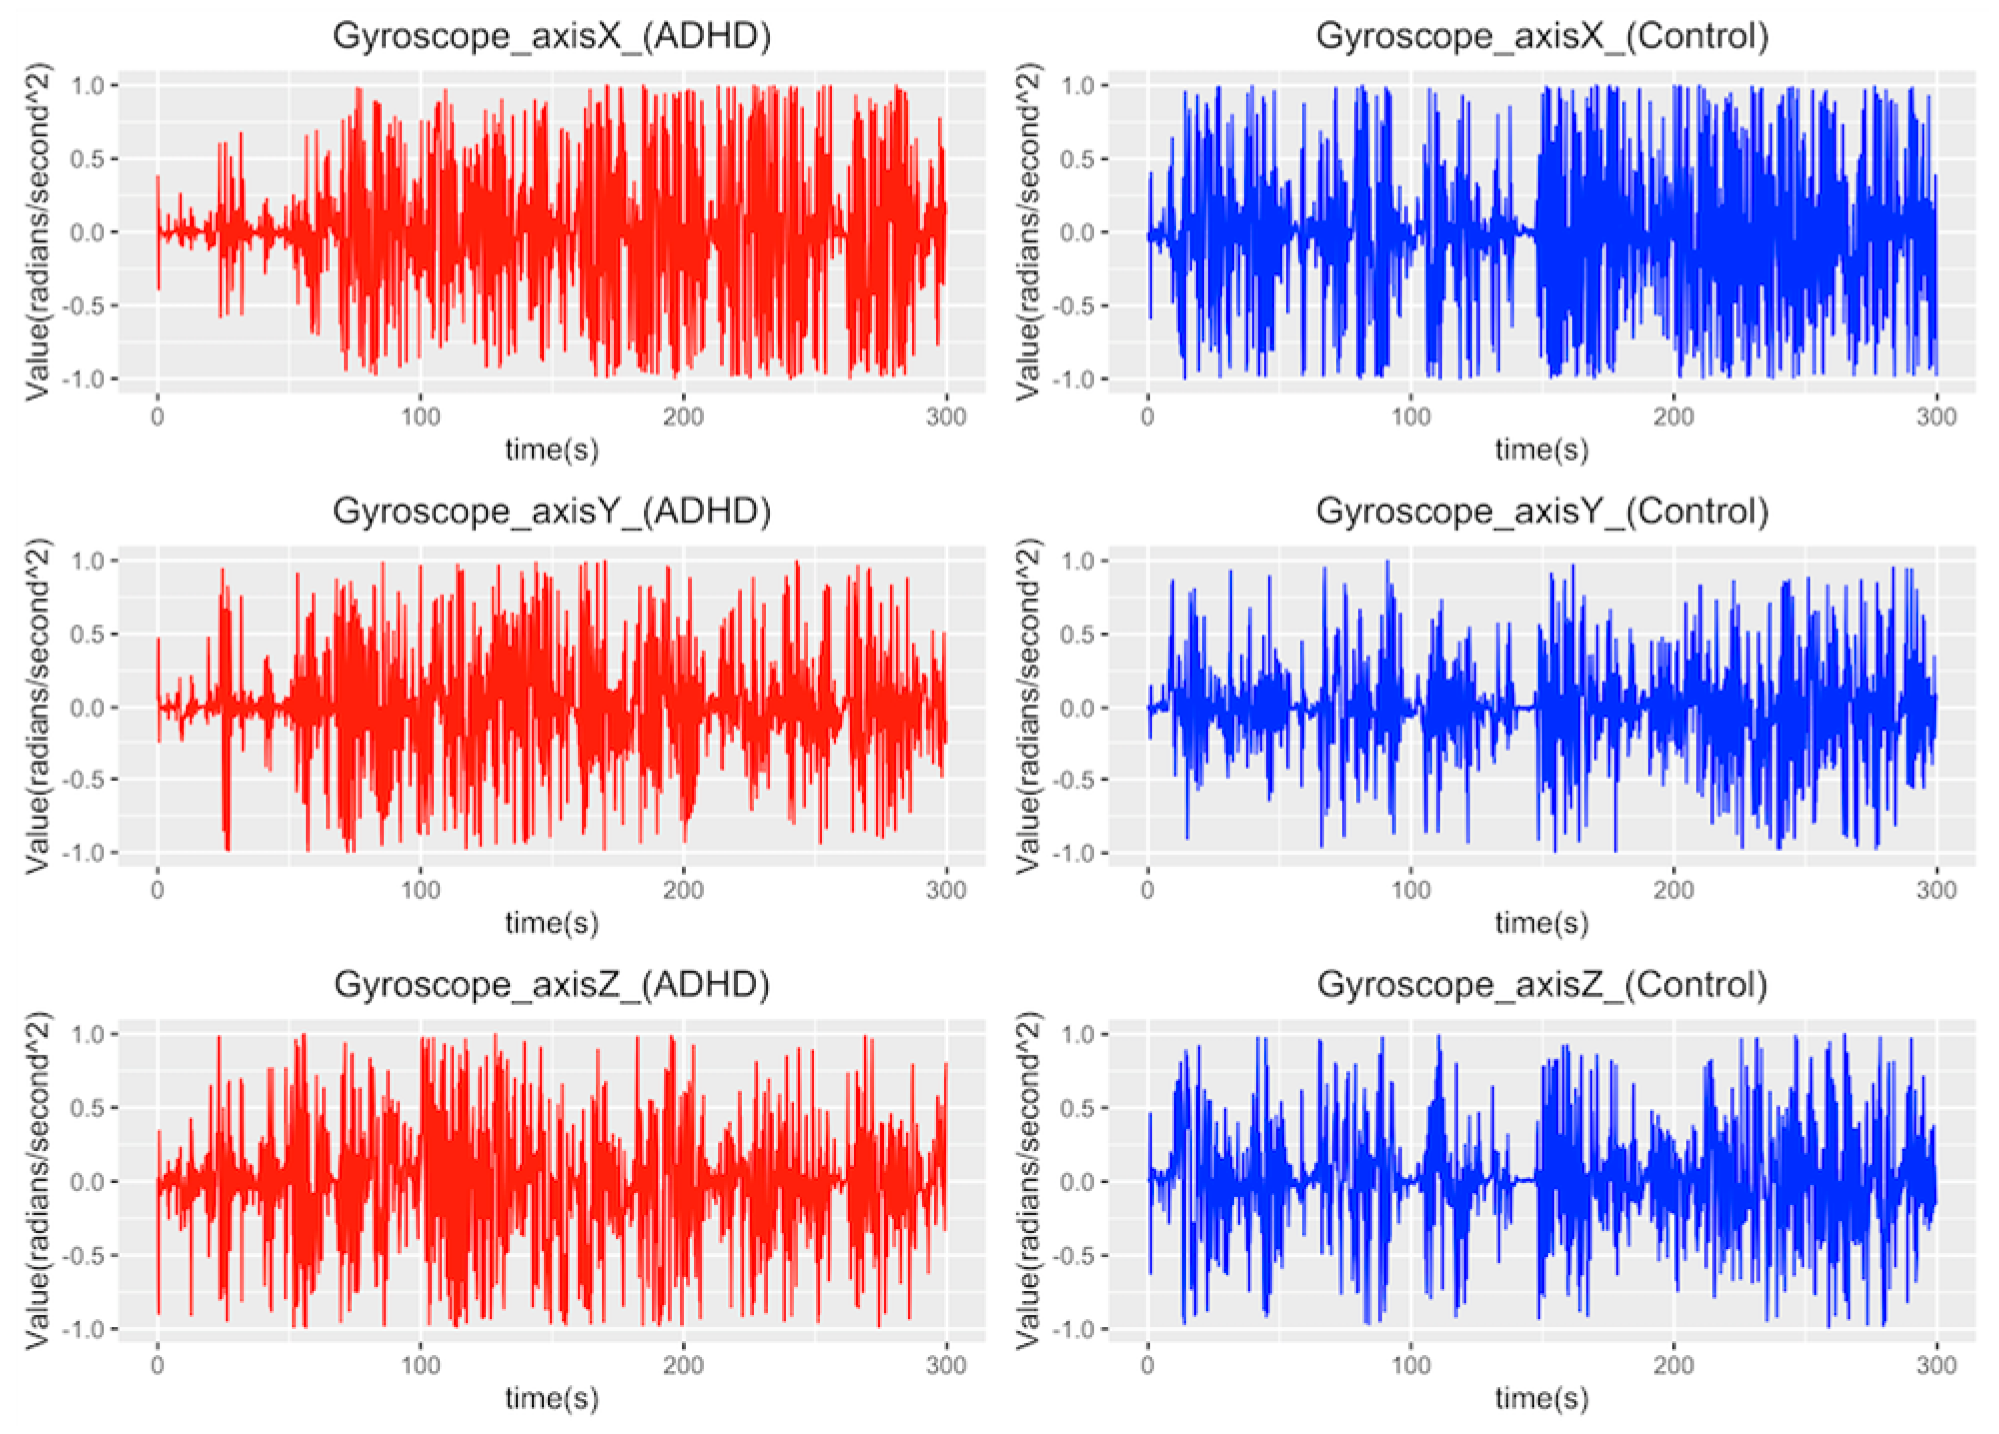
3.1. Comparison of Gyroscope Measurements between ADHD and Control Groups

In this study, we compared the measurements obtained using the gyroscope, namely variance and ZCR, between children with ADHD and controls. All average variance and ZCR values of the three axes (x, y, and z) were higher in patients with ADHD than in controls. Significant differences in average variance values were observed across the y-axis of the gyroscope (0.093 ± 0.029 vs. 0.075 ± 0.020, p = 0.001). Figure 2 illustrates the differences in variance of gyroscope measurements in a child with ADHD and the matched control. Similarly, significantly higher ZCR values were observed across the three axes of the gyroscope—x (0.421 ± 0.010 vs. 0.415 ± 0.011, p = 0.005), y (0.414 ± 0.014 vs. 0.404 ± 0.018, p = 0.003), and z (0.401 ± 0.016 vs. 0.389 ± 0.021, p = 0.004)—in children with ADHD than in controls (Table 2).

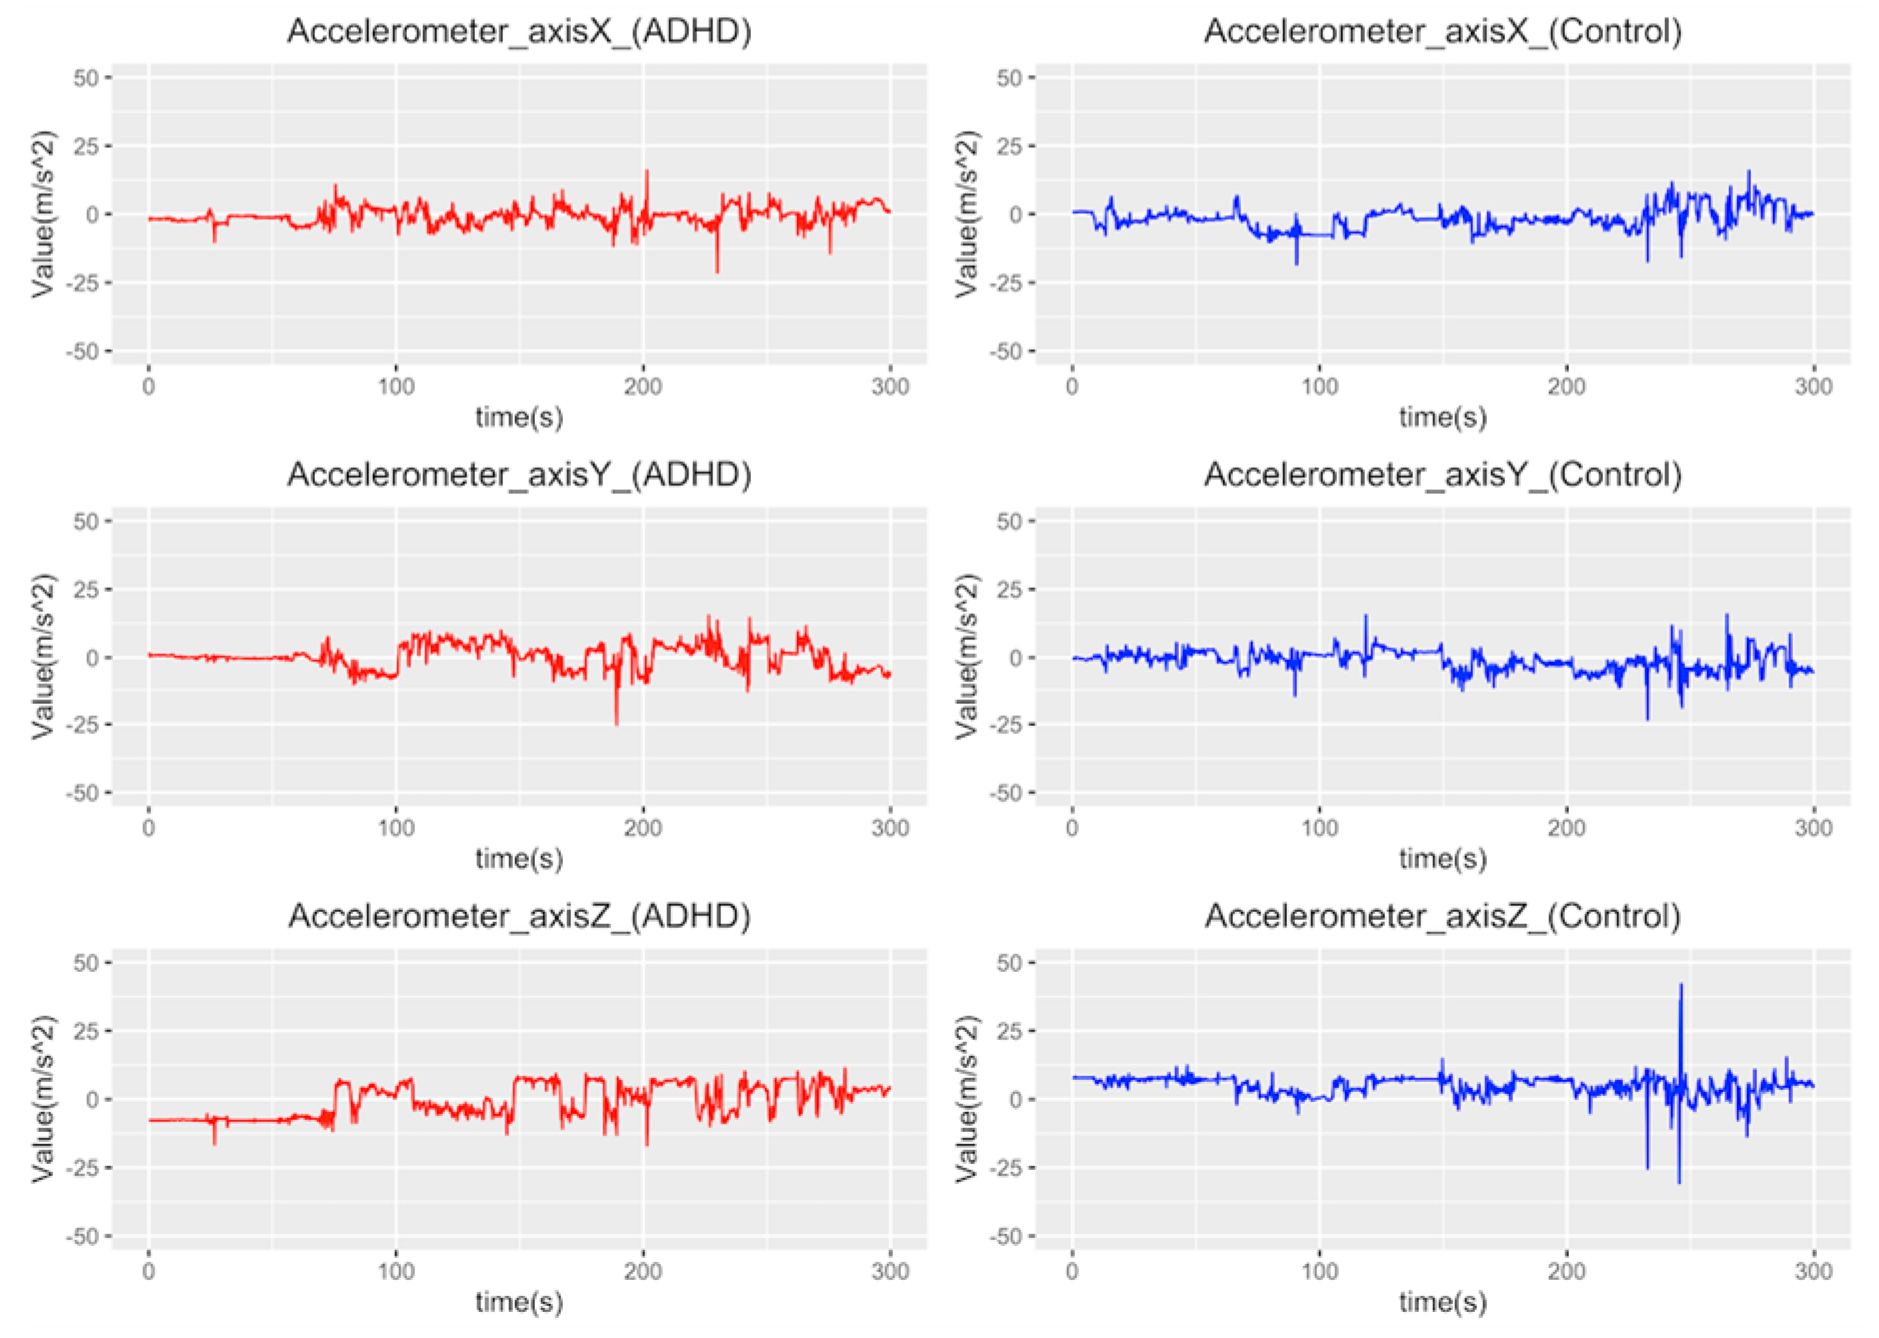
3.2. Comparison of Accelerometer Measurements between ADHD and Control Groups

In this study, we compared the measurements of variance and ZCR obtained using the accelerometer between children with ADHD and controls. All average variance values for the three axes were higher in children with ADHD than in the controls. Significant differences in the average variance values were observed across the three axes, namely x (4.849 ± 3.173 vs. 3.071 ± 1.566, p = 0.001), y (5.149 ± 3.061 vs. 3.209 ± 1.395, p < 0.001), and z (4.866 ± 2.440 vs. 3.096 ± 1.280, p < 0.001: Table 3). Figure 3 presents differences in the variance in the accelerometer measurements between a child with ADHD and the matched control.
Similarly, significantly higher ZCR values were noted across the z-axis of the accelerometer (0.067 ± 0.030 vs. 0.051 ± 0.024, p = 0.006) in children with ADHD than in the controls (Table 3).

3.3. Discriminating ADHD and Control Groups

In this study, the gyroscope and accelerometer measurements were tracked for 2 h per day for three consecutive days. The AUC was the highest when the y-axis of the variance in the accelerometer was used to classify children with ADHD and controls, and the AUC reached 0.82.

4. Discussion

This study used an objective method to compare measurements, namely variance and ZCR; the method entailed using a gyroscope and accelerometer to compare between children with ADHD and controls. A significantly higher variance value across the y-axis and ZCR values across all three axes of the gyroscope and significantly higher variance values across the three axes and ZCR values across the z-axis of the accelerometer were observed.
The ZCR is used to analyze the rate of zero-crossing in a given period. In the smart watch, it was used to detect the frequency of moving or rotating back and forth. The ZCR was greater when the hand moved or rotated back and forth faster. Due to the human skeletal structure, rotating the hand back and forth tends to be more frequent than moving the hand back and forth. Moreover, the gyroscope was used to measure the orientation and angular velocity. Therefore, the signal obtained using the gyroscope was more suitable for the ZCR analysis. The results of the present study revealed that the ZCR values across all three axes of the gyroscope were significantly higher in the ADHD group than in the control group. However, only the variance across the y-axis was significantly different between the children with ADHD and controls. The variance was used to analyze the variability in the signal. In the smart watch, variance was used to detect movement amplitude variability. Greater hand movements resulted in greater values. Therefore, the accelerometer signal was more suitable for the variance analysis. In contrast to the ZCR obtained using the gyroscope, in the present study, a significantly higher variance across the three axes was obtained using the accelerometer in the children with ADHD than in the controls. However, only the ZCR values across the z-axis significantly differed between the children with ADHD and controls. The amplitude of arm sweeping was mainly expressed by the Ay and Az signals because of the vertical and horizontal posture of the palm. Therefore, the Ay and Az analytic results were similar and different from the Ax results obtained in the accelerometer recordings, respectively.
The measurements in this study were acquired from children taking language or mathematics classes. Students’ activities were limited to those in their desks and chairs. Although we did not use video to record the movements of the children with ADHD because of the applicable human privacy policy, the most frequent movement in patients with ADHD as reported by Gawrilow et al. tends to be hand-tapping [26]. The hand-tapping increased the Gy value of the gyroscope and the Az value of the accelerometer more than did other parameters in our recordings (Figure 1). As presented in Table 2 and Table 3, Gy and Az were significantly different in variance and ZCR. An increase in Gy and Az corresponded to an increase in the bend/stretch (sweep) of the arm when the palm was in the horizontal position. Our study results showed detailed movements and are compatible with other studies of children with ADHD at school.
The optimal location of the motion sensor on the body is dependent on the nature of the motion being monitored. In patients with ADHD, O’Mahony et al. used two sensors to record the movement data of each individual—one attached to a belt worn at the waist and the other fixed by a velcro strap to the ankle of the dominant leg [21]. In other ADHD studies, actigraphy has been used on the non-dominant wrist to detect activity in patients with ADHD [14,16,17]. The children in the present study used their dominant hand for activities in class. To reduce the influence of class activities, such as writing, on our measurements, smart watches were worn by the children and controls on their non-dominant wrist. Although we were unsure whether the non-dominant wrist was the best position to affix the sensor, this was reasonable for children with ADHD who were sitting in class, and favorable discriminability was obtained between children with ADHD and controls in the present study. For non-seated class activities, additional motion sensors on different body segments may be valuable. In the future, we may use multiple sensors attached to different parts of the body to explore the most discriminative sensor location for different situations in patients with ADHD.
A limitation of this study was the small number of participants, although the classification performance between the children with ADHD and controls was good. The second limitation is that we only analyzed the features of children’s activities in the afternoon. We do not know the impact of particular times of day, such as the morning or afternoon, on children’s activities. Third, the sampling rate of 5 Hz set in this study was mainly in consideration of the limitations of our wristwatch and power consumption. In our future works, new devices that can be more suitably set at higher sampling rates will be considered and tested.

5. Conclusions

In the present study, a gyroscope and accelerometer were used to record the movements of children with ADHD and controls. All average variance and ZCR values of the three axes were higher in children with ADHD than in controls. These results indicate that children with ADHD had more variable and frequent movements than did the controls. The discriminability between the children with ADHD and controls was highest when the variance in the accelerometer across the y-axis was used. Our proposed method may be an objective and promising tool for analyzing movements and understanding more detailed movements in children with ADHD at school.

Author Contributions

Conceptualization, L.-C.L., R.-C.W. and R.-C.Y.; methodology, C.-S.O. and C.-T.C.; validation, C.-S.O.; investigation, C.-S.O. and R.-C.W.; writing—original draft preparation, L.-C.L.; writing—review and editing, L.-C.L., R.-C.W. and R.-C.Y. All authors have read and agreed to the published version of the manuscript.

Funding

This research received no external funding.

Acknowledgments

We thank the studied patients and their families. This study was supported partly the Kaohsiung Medical University Hospital (grant numbers KMUH106-6R47 and KMUH107-7R42), Kaohsiung Medical University Center for Smart Health Care Research Grant (KMU-TC108B05) and Ministry of Science and Technology, Taiwan (grant number MOST 106-2314-B-037 -080 -MY2, MOST 107-2221-E-214-028, MOST 108-2221-E-214-020, and MOST 108-2221-E-153-010).

Conflicts of Interest

The authors have no conflict of interest to disclose.

References

  1. Olfson, M.; Gameroff, M.J.; Marcus, S.C.; Jensen, P.S. National trends in the treatment of attention deficit hyperactivity disorder. Am. J. Psychiatry 2003, 160, 1071–1077. [Google Scholar] [CrossRef] [PubMed]
  2. Robison, L.M.; Sclar, D.A.; Skaer, T.L. Datapoints: Trends in adhd and stimulant use among adults: 1995–2002. Psychiatr. Serv. 2005, 56, 1497. [Google Scholar] [CrossRef] [PubMed]
  3. Toh, S. Datapoints: Trends in adhd and stimulant use among children, 1993–2003. Psychiatr. Serv. 2006, 57, 1091. [Google Scholar] [CrossRef] [PubMed]
  4. Gualtieri, C.T.; Johnson, L.G. Adhd: Is objective diagnosis possible? Psychiatry 2005, 2, 44–53. [Google Scholar] [PubMed]
  5. Lopez-Villalobos, J.A.; Andres-De Llano, J.; Lopez-Sanchez, M.V.; Rodriguez-Molinero, L.; Garrido-Redondo, M.; Sacristan-Martin, A.M.; Martinez-Rivera, M.T.; Alberola-Lopez, S. Criterion validity and clinical usefulness of attention deficit hyperactivity disorder rating scale iv in attention deficit hyperactivity disorder (adhd) as a function of method and age. Psicothema 2017, 29, 103–110. [Google Scholar] [PubMed]
  6. Edwards, M.C.; Gardner, E.S.; Chelonis, J.J.; Schulz, E.G.; Flake, R.A.; Diaz, P.F. Estimates of the validity and utility of the conners’ continuous performance test in the assessment of inattentive and/or hyperactive-impulsive behaviors in children. J. Abnorm. Child Psychol. 2007, 35, 393–404. [Google Scholar] [CrossRef]
  7. Halperin, J.M.; Sharma, V.; Greenblatt, E.; Schwartz, S.T. Assessment of the continuous performance test: Reliability and validity in a nonreferred sample. J. Psychol. Assess. 1991, 3, 603. [Google Scholar] [CrossRef]
  8. Stetter, B.J.; Krafft, F.C.; Ringhof, S.; Stein, T.; Sell, S. A machine learning and wearable sensor based approach to estimate external knee flexion and adduction moments during various locomotion tasks. Front. Bioeng. Biotechnol. 2020, 8, 9. [Google Scholar] [CrossRef]
  9. Rozin Kleiner, A.F.; Bellomo, A.; Pagnussat, A.S.; de Athayde Costa, E.S.A.; Sforza, C.; Cicuto Ferreira Rocha, N.A. Wearable sensors, cerebral palsy and gait assessment in everyday environments: Is it a reality?—A systematic review. Funct. Neurol. 2019, 34, 85–91. [Google Scholar]
  10. Channa, A.; Popescu, N.; Ciobanu, V. Wearable solutions for patients with parkinson’s disease and neurocognitive disorder: A systematic review. Sensors 2020, 20, 2713. [Google Scholar] [CrossRef]
  11. Compagnat, M.; Mandigout, S.; Batcho, C.S.; Vuillerme, N.; Salle, J.Y.; David, R.; Daviet, J.C. Validity of wearable actimeter computation of total energy expenditure during walking in post-stroke individuals. Ann. Phys. Rehabil. Med. 2020, 63, 209–215. [Google Scholar] [CrossRef] [PubMed]
  12. Garcia Murillo, L.; Cortese, S.; Anderson, D.; Di Martino, A.; Castellanos, F.X. Locomotor activity measures in the diagnosis of attention deficit hyperactivity disorder: Meta-analyses and new findings. J. Neurosci. Methods 2015, 252, 14–26. [Google Scholar] [CrossRef] [PubMed] [Green Version]
  13. Infante, M.A.; Moore, E.M.; Nguyen, T.T.; Fourligas, N.; Mattson, S.N.; Riley, E.P. Objective assessment of adhd core symptoms in children with heavy prenatal alcohol exposure. Physiol. Behav. 2015, 148, 45–50. [Google Scholar] [CrossRef] [PubMed] [Green Version]
  14. Gilbert, H.; Qin, L.; Li, D.; Zhang, X.; Johnstone, S.J. Aiding the diagnosis of ad/hd in childhood: Using actigraphy and a continuous performance test to objectively quantify symptoms. Res. Dev. Disabil. 2016, 59, 35–42. [Google Scholar] [CrossRef]
  15. Martin-Martinez, D.; Casaseca-de-la-Higuera, P.; Alberola-Lopez, S.; Andres-de-Llano, J.; Lopez-Villalobos, J.A.; Ardura-Fernandez, J.; Alberola-Lopez, C. Nonlinear analysis of actigraphic signals for the assessment of the attention-deficit/hyperactivity disorder (adhd). Med. Eng. Phys. 2012, 34, 1317–1329. [Google Scholar] [CrossRef]
  16. De Crescenzo, F.; Armando, M.; Mazzone, L.; Ciliberto, M.; Sciannamea, M.; Figueroa, C.; Janiri, L.; Quested, D.; Vicari, S. The use of actigraphy in the monitoring of methylphenidate versus placebo in adhd: A meta-analysis. Atten. Deficit Hyperact. Disord. 2014, 6, 49–58. [Google Scholar] [CrossRef]
  17. De Crescenzo, F.; Licchelli, S.; Ciabattini, M.; Menghini, D.; Armando, M.; Alfieri, P.; Mazzone, L.; Pontrelli, G.; Livadiotti, S.; Foti, F.; et al. The use of actigraphy in the monitoring of sleep and activity in adhd: A meta-analysis. Sleep Med. Rev. 2016, 26, 9–20. [Google Scholar] [CrossRef]
  18. Tseng, M.H.; Henderson, A.; Chow, S.M.; Yao, G. Relationship between motor proficiency, attention, impulse, and activity in children with adhd. Dev. Med. Child. Neurol. 2004, 46, 381–388. [Google Scholar] [CrossRef]
  19. Wood, A.C.; Asherson, P.; Rijsdijk, F.; Kuntsi, J. Is overactivity a core feature in adhd? Familial and receiver operating characteristic curve analysis of mechanically assessed activity level. J. Am. Acad. Child Adolesc. Psychiatry 2009, 48, 1023–1030. [Google Scholar] [CrossRef]
  20. Kam, H.J.; Lee, K.; Cho, S.M.; Shin, Y.M.; Park, R.W. High-resolution actigraphic analysis of adhd: A wide range of movement variability observation in three school courses—A pilot study. Healthc Inform. Res. 2011, 17, 29–37. [Google Scholar] [CrossRef] [Green Version]
  21. O’Mahony, N.; Florentino-Liano, B.; Carballo, J.J.; Baca-Garcia, E.; Rodriguez, A.A. Objective diagnosis of adhd using imus. Med. Eng. Phys. 2014, 36, 922–926. [Google Scholar] [CrossRef] [PubMed]
  22. Ricci, M.; Terribili, M.; Giannini, F.; Errico, V.; Pallotti, A.; Galasso, C.; Tomasello, L.; Sias, S.; Saggio, G. Wearable-based electronics to objectively support diagnosis of motor impairments in school-aged children. J. Biomech. 2018, 83, 243–252. [Google Scholar] [CrossRef] [PubMed]
  23. Shandhi, M.M.H.; Semiz, B.; Hersek, S.; Goller, N.; Ayazi, F.; Inan, O.T. Performance analysis of gyroscope and accelerometer sensors for seismocardiography-based wearable pre-ejection period estimation. IEEE J. Biomed. Health Inform. 2019, 23, 2365–2374. [Google Scholar] [CrossRef] [PubMed]
  24. Alberts, J.L.; Hirsch, J.R.; Koop, M.M.; Schindler, D.D.; Kana, D.E.; Linder, S.M.; Campbell, S.; Thota, A.K. Using accelerometer and gyroscopic measures to quantify postural stability. J. Athl. Train. 2015, 50, 578–588. [Google Scholar] [CrossRef] [Green Version]
  25. Kuhn, M.; Johnson, K. Applied Predictive Modeling; Springer: New York, NY, USA, 2013; ISBN 9781461468486. [Google Scholar]
  26. Gawrilow, C.; Kuhnhausen, J.; Schmid, J.; Stadler, G. Hyperactivity and motoric activity in adhd: Characterization, assessment, and intervention. Front. psychiatry 2014, 5, 171. [Google Scholar] [CrossRef] [Green Version]
Figure 1. Six-axis recordings of the gyroscope and accelerometer.
Applsci 10 04116 g001
Figure 2. An example of one patient’s and one control’s variance in the gyroscope measurements in the three axes. Data showed higher variance values of the gyroscope measurements in the x-, y-, and z-axes in a child with attention-deficit hyperactivity disorder (ADHD) than in the matched control.
Applsci 10 04116 g002
Figure 3. An example of one patient’s and one control’s variance in the accelerometer measurements in the three axes. Data indicate higher variance values of the accelerometer measurements in the x-, y-, and z-axes in the child with attention-deficit hyperactivity disorder (ADHD) than in the matched control.
Applsci 10 04116 g003
Table 1. Demographic data of the patients with attention-deficit hyperactivity disorder (ADHD) and controls.
ADHDControlp Value
Age6 years 11 months ± 1 year 0 months6 years 9 months ± 1 years 1 months0.2765
Sex (M/F)11/411/4NA
SNAP (teacher)43.38 ± 14.036.67 ± 5.38<0.0001
SNAP (parents)44.73 ± 14.6814.87 ± 10.29<0.0001
Table 2. Comparison of the gyroscope measurements between the attention-deficit hyperactivity disorder (ADHD) and control groups.
ADHDControlp Value
Variance Gx0.200 ± 0.0520.174 ± 0.0500.021
Gy0.093 ± 0.0290.075 ± 0.0200.001 *
Gz0.094 ± 0.0260.080 ± 0.0240.012
ZCRGx0.421 ± 0.0100.415 ± 0.0110.005 *
Gy0.414 ± 0.0140.404 ± 0.0180.003 *
Gz0.401 ± 0.0160.389 ± 0.0210.004 *
* p < 0.05/6 = 0.008.
Table 3. Comparison of the accelerometer measurements between the attention-deficit hyperactivity disorder (ADHD) and control groups.
ADHDControlp Value
VarianceAx4.849 ± 3.1733.071 ± 1.5660.001 *
Ay5.149 ± 3.0613.2093± 1.395<0.001 *
Az4.866 ± 2.4403.096 ± 1.280<0.001 *
ZCRAx0.078 ± 0.0150.068 ± 0.0240.019
Ay0.055 ± 0.0210.045 ± 0.0150.010
Az0.067 ± 0.0300.051 ± 0.0240.006 *
* p < 0.05/6 = 0.008.

