Micro-Raman Spectroscopy Investigation of Crystalline Phases in EAF Slag


 , , ,
, , ,
Abstract
:1. Introduction
2. Materials and Methods
2.1. Samples
2.2. SEM-EDX
2.3. XRD
2.4. Raman Spectroscopy
3. Results and Discussion
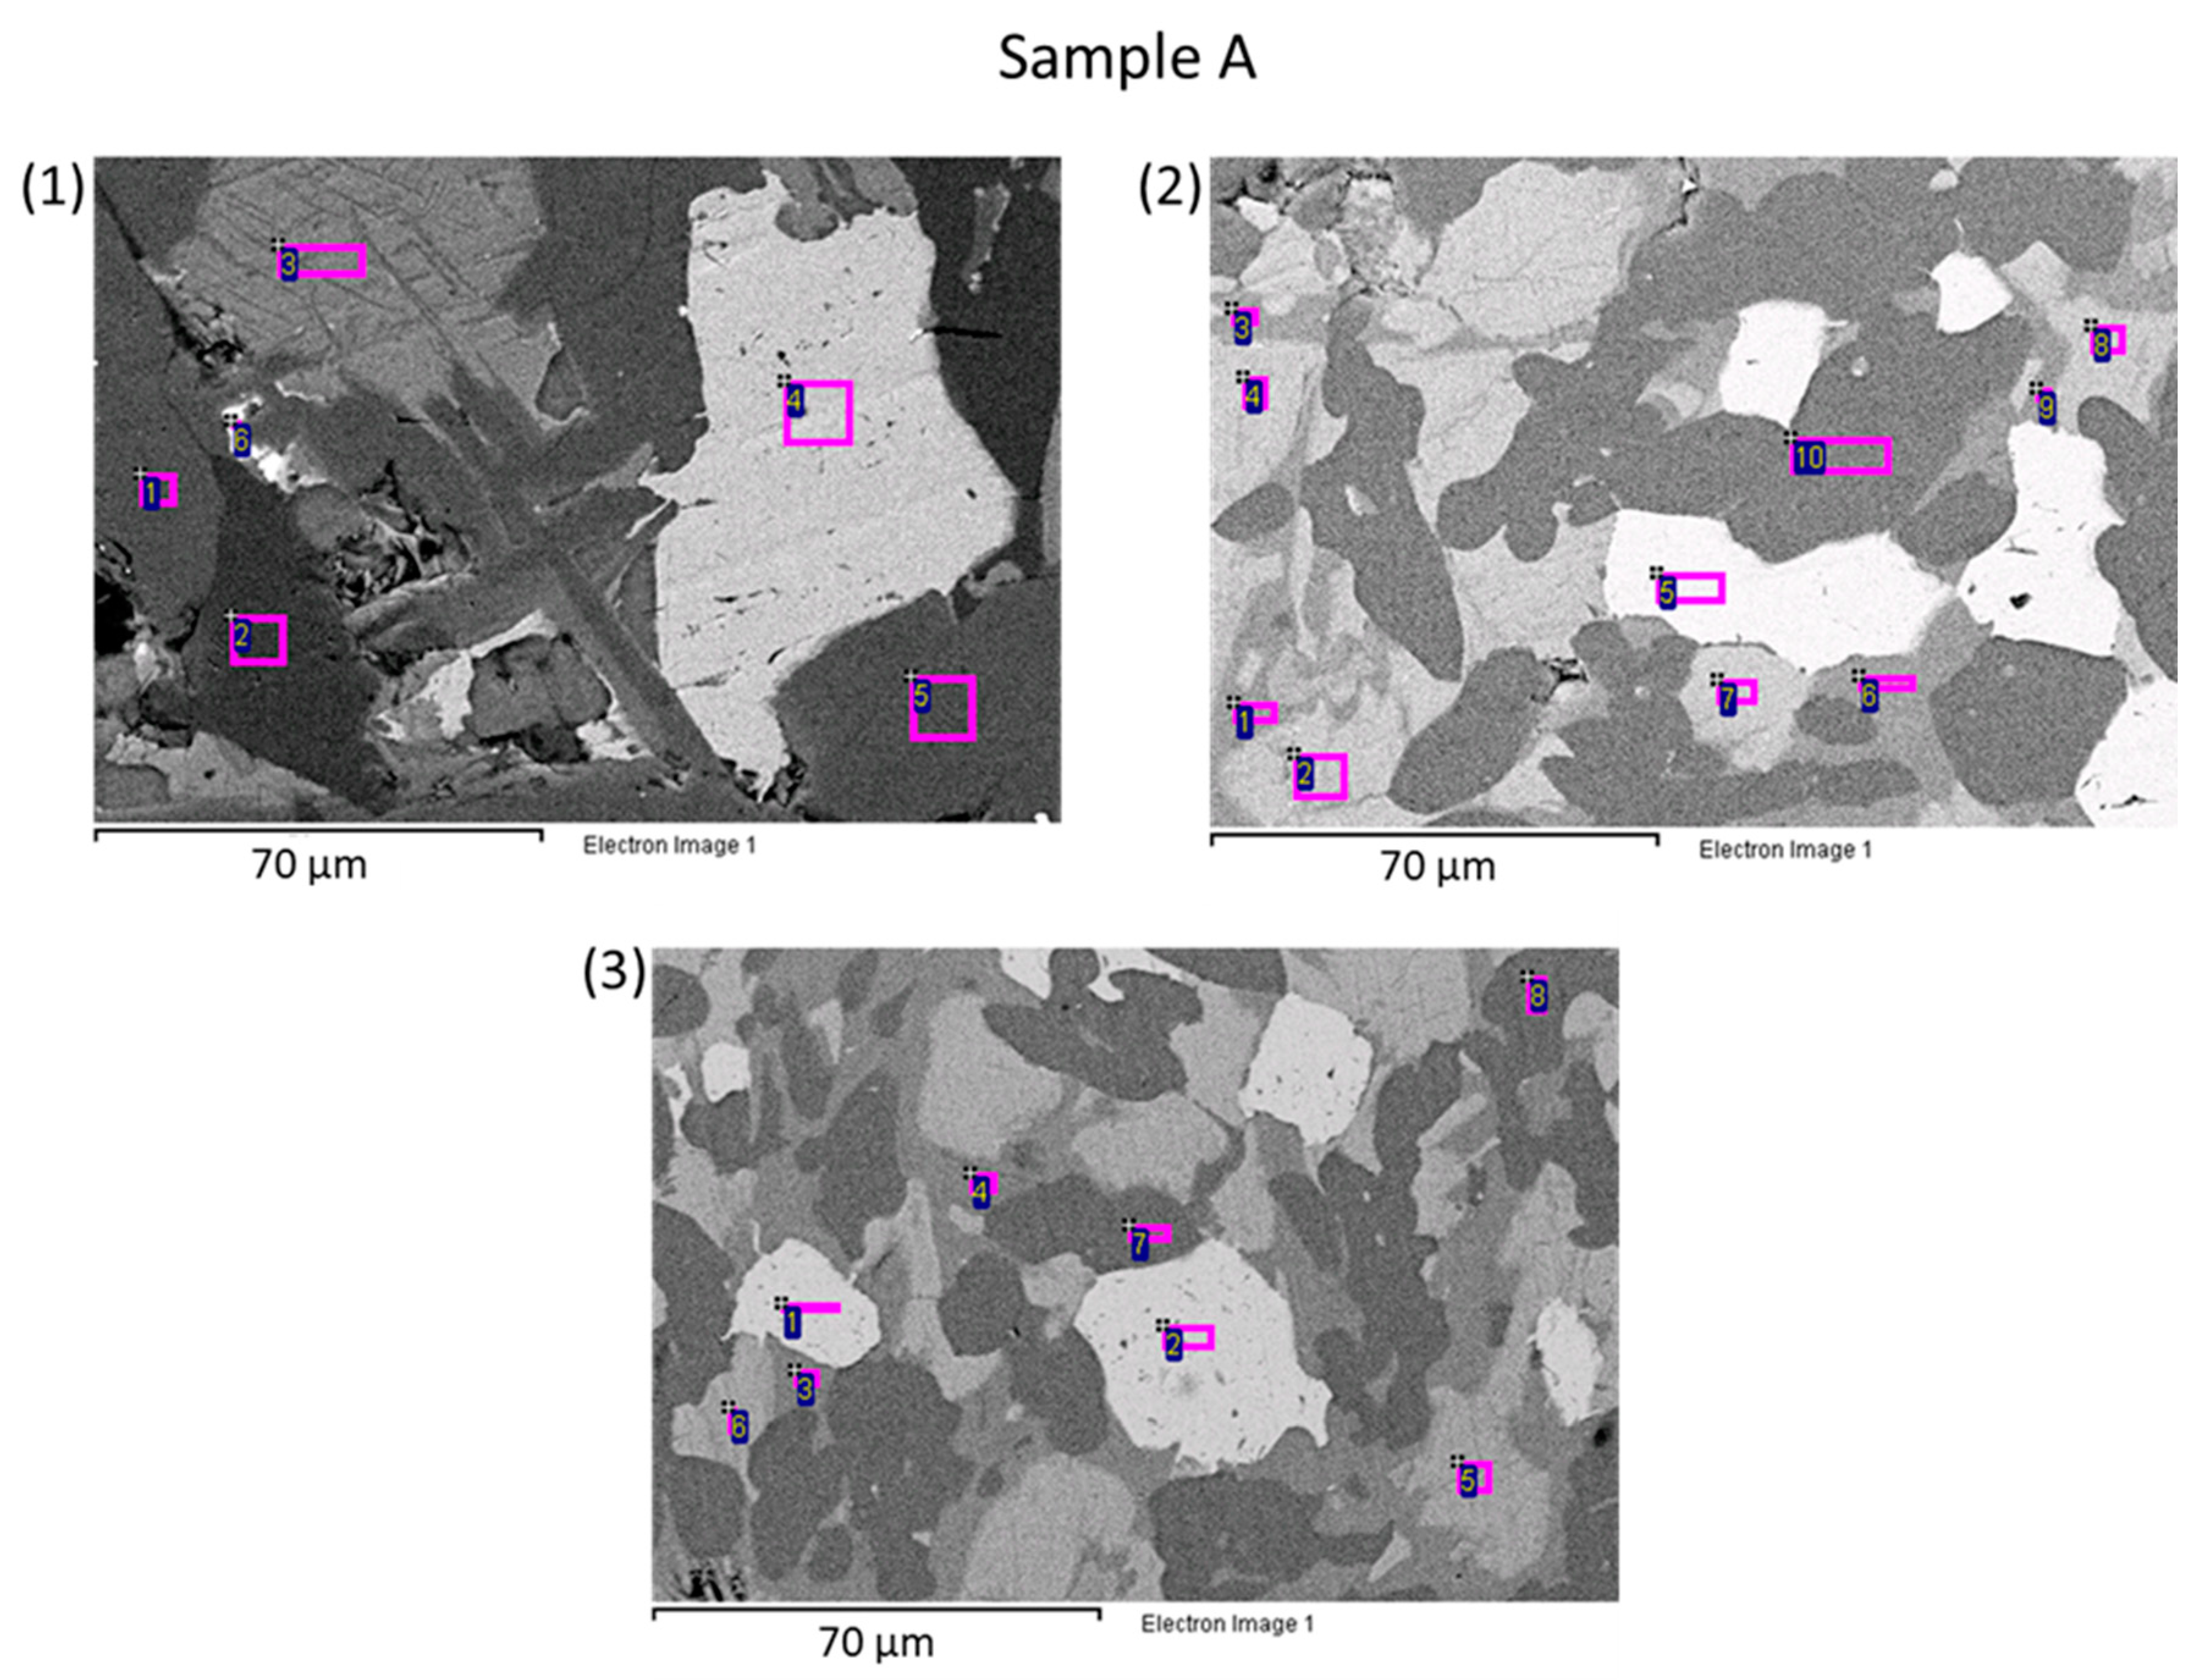
3.1. SEM-EDX
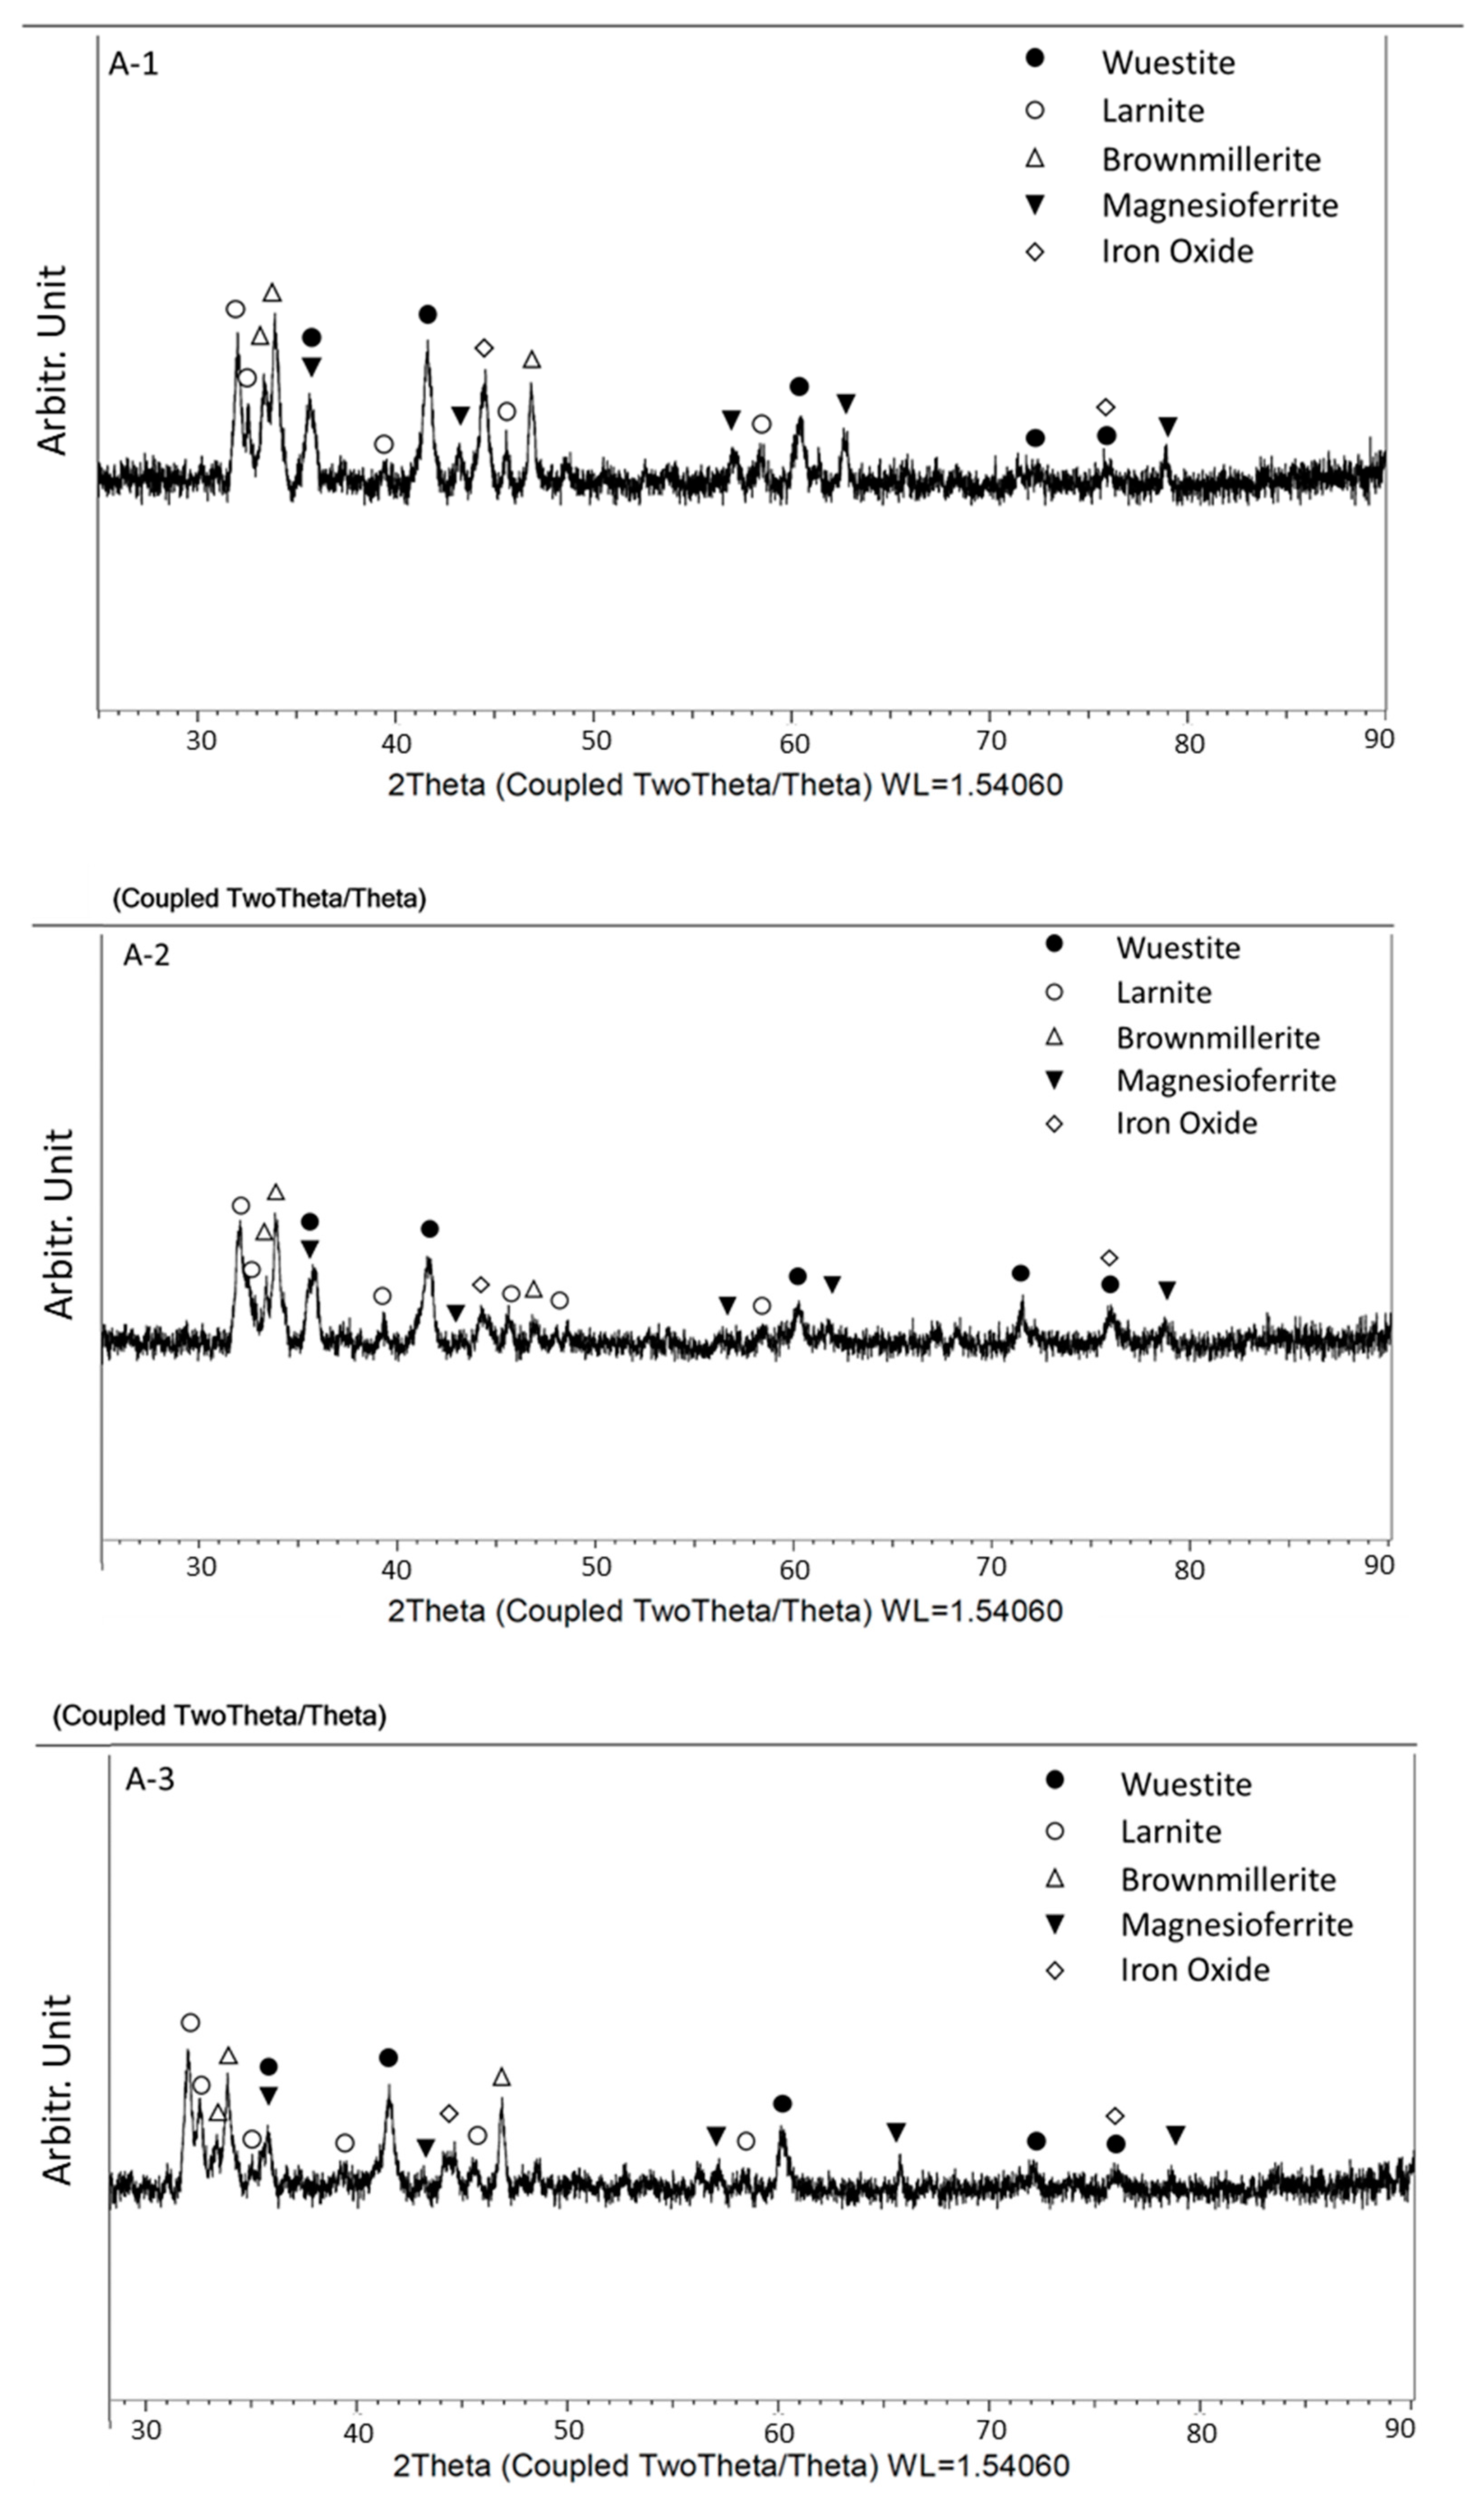
3.2. XRD
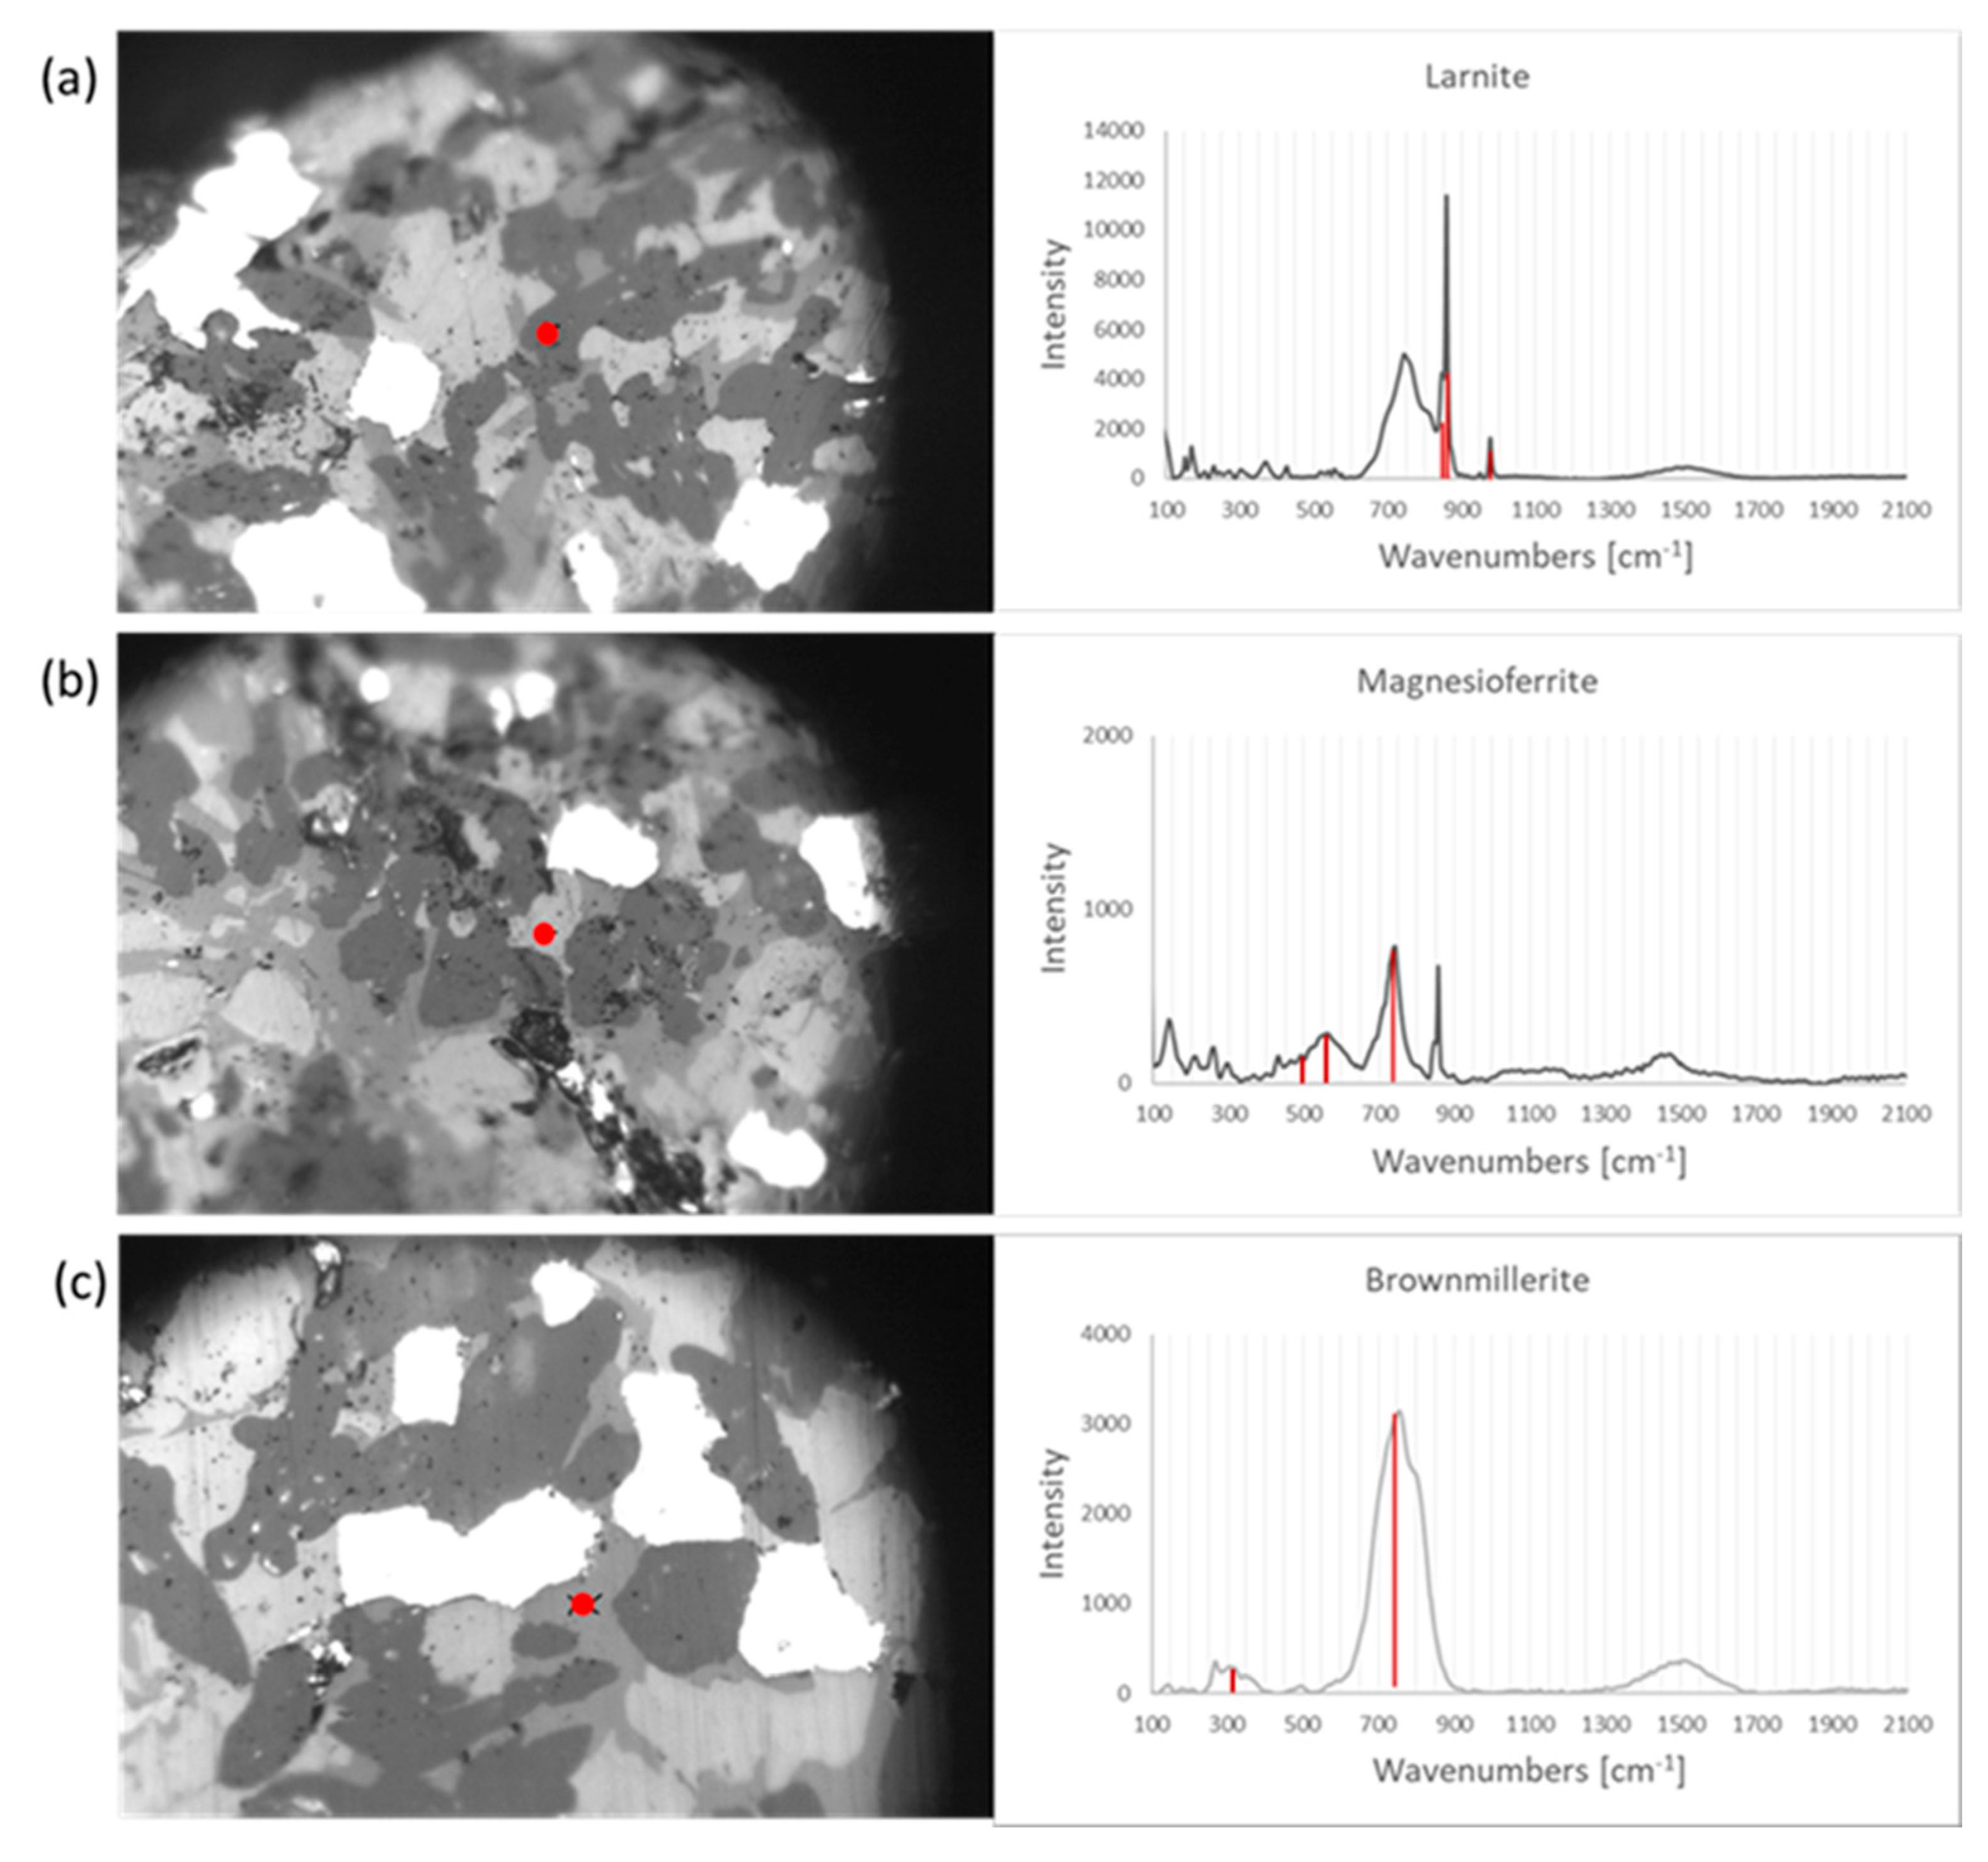
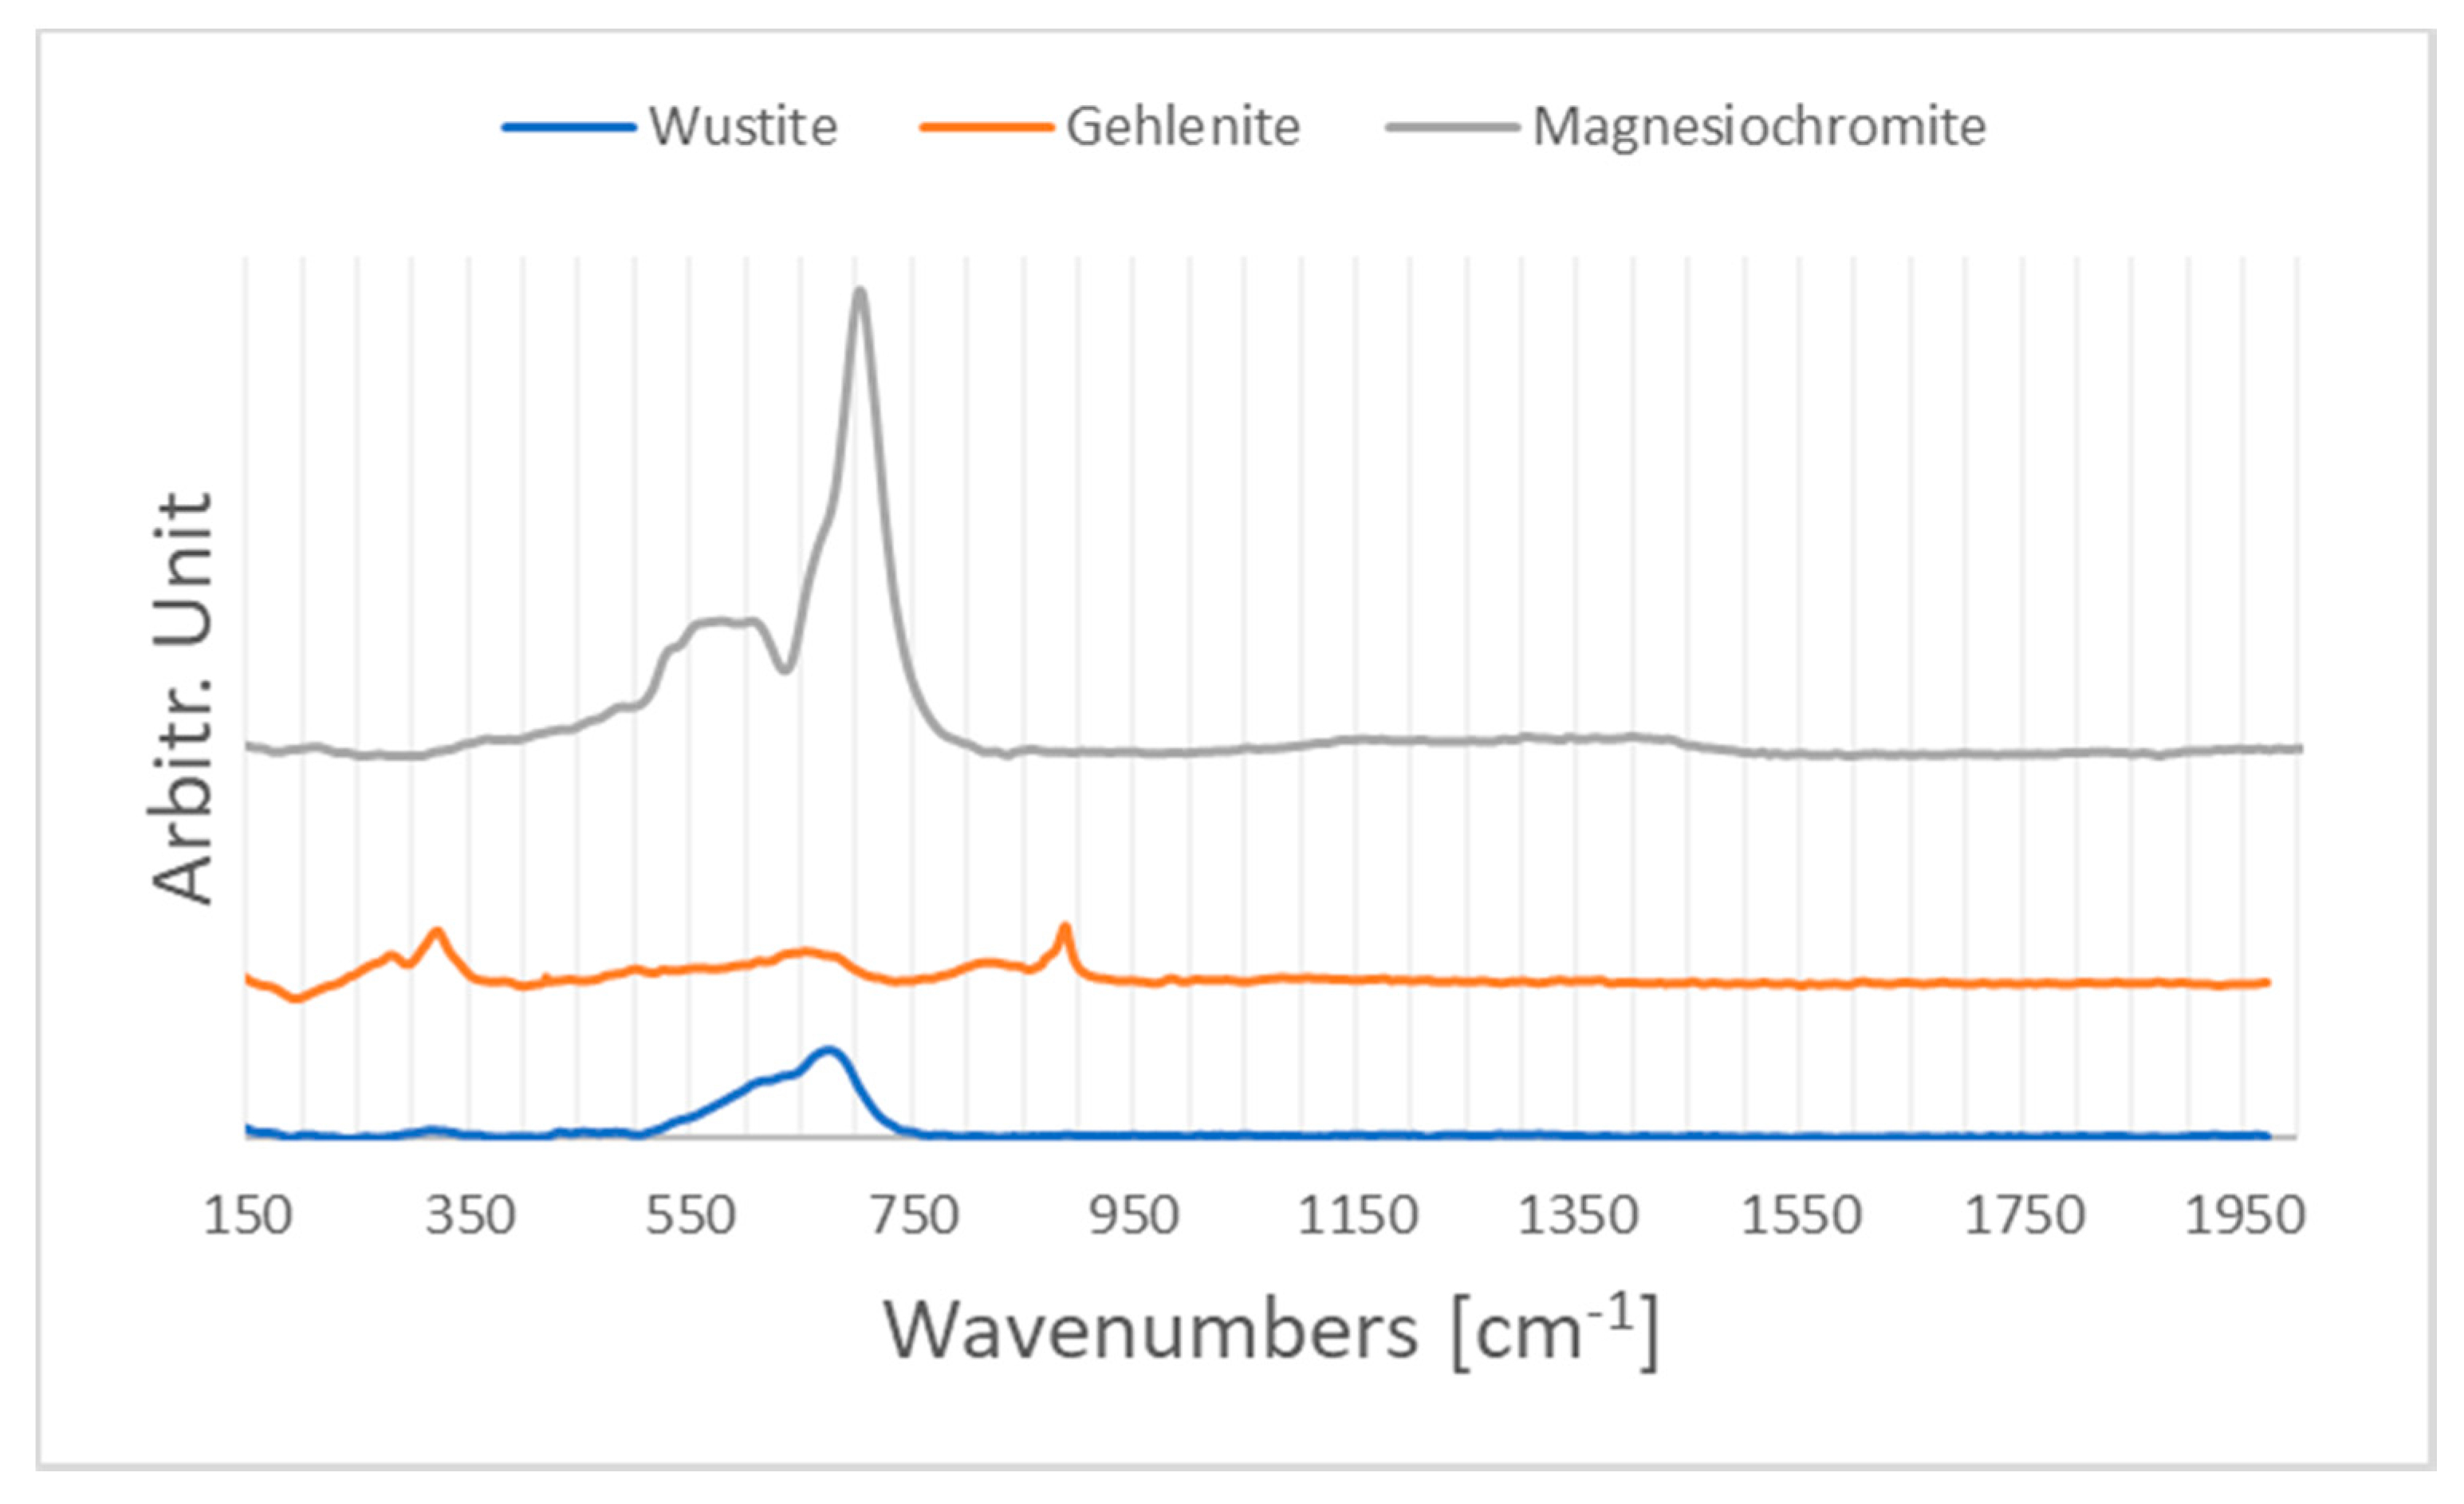
3.3. Raman Spectroscopy
4. Conclusions
Supplementary Materials
Author Contributions
Funding
Acknowledgments
Conflicts of Interest
References
- Worldsteel Association. World Steel in Figures 2018; Worldsteel Association: Brussel, Belgium, 2018. [Google Scholar]
- Yi, H.; Xu, G.; Cheng, H.; Wang, J.; Wan, Y.; Chen, H. An Overview of Utilization of Steel Slag. Procedia Environ. Sci. 2012, 16, 791–801. [Google Scholar] [CrossRef] [Green Version]
- Yildirim, I.Z.; Prezzi, M. Chemical, Mineralogical, and Morphological Properties of Steel Slag. Adv. Civ. Eng. 2011, 2011, 1–13. [Google Scholar] [CrossRef] [Green Version]
- Pellegrino, C.; Gaddo, V. Mechanical and durability characteristics of concrete containing EAF slag as aggregate. Cem. Concr. Compos. 2009, 31, 663–671. [Google Scholar] [CrossRef]
- Barocci, A.; Luzzari, G.; Facchin, M. Procedure operative per la produzione di inerte artificiale in luogo di scoria nera. Metall. Ital. 2014, 5, 37–41. [Google Scholar]
- Gelfi, M.; Cornacchia, G.; Conforti, S.; Roberti, R. Caratterizzazione di Scorie di Acciaieria e Studio del Rilascio di Cromo. In Proceedings of the Atti del 33° Convegno Nazionale AIM, Brescia, Italy, 10–12 November 2010. [Google Scholar]
- Navarro, C.; Díaz, M.; Villa-García, M.Á.; Díaz, M. Physico-Chemical Characterization of Steel Slag. Study of its Behavior under Simulated Environmental Conditions. Environ. Sci. Technol. 2010, 44, 5383–5388. [Google Scholar] [CrossRef] [PubMed]
- Gómez-Nubla, L.; Aramendia, J.; De Vallejuelo, S.F.-O.; Castro, K.; Madariaga, J.M. From Portable to SCA Raman devices to characterize harmful compounds contained in used black slag produced in Electric Arc Furnace of steel industry. J. Raman Spectrosc. 2013, 44, 1163–1171. [Google Scholar] [CrossRef]
- Raman, C.V.; Krishnan, K.S. A New Type of Secondary Radiation. Nature 1928, 121, 501–502. [Google Scholar] [CrossRef]
- Bumbrah, G.S.; Sharma, R.M. Raman spectroscopy – Basic principle, instrumentation and selected applications for the characterization of drugs of abuse. Egypt. J. Forensic Sci. 2016, 6, 209–215. [Google Scholar] [CrossRef] [Green Version]
- Barone, G.; Bersani, D.; Crupi, V.; Longo, F.; Longobardo, U.; Lottici, P.P.; Aliatis, I.; Majolino, D.; Mazzoleni, P.; Raneri, S.; et al. A portable versus micro-Raman equipment comparison for gemmological purposes: The case of sapphires and their imitations. J. Raman Spectrosc. 2014, 45, 1309–1317. [Google Scholar] [CrossRef]
- Fassina, P.; Brunella, F.; Lazzari, L.; Re, G.; Vergani, L.; Sciuccati, A. Fatigue Behavior Of Pipeline Steel Under Hydrogen Environment And Low Temperature. Procedia Eng. 2011, 10, 3345–3352. [Google Scholar] [CrossRef] [Green Version]
- Gelfi, M.; Cornacchia, G.; Roberti, R. Investigations on leaching behavior of EAF steel slags. In Proceedings of the Euroslag 2010, Madrid, Spain, 19–22 October 2010; pp. 1–12. [Google Scholar]
- Mombelli, A.D.; Mapelli, C.; Barella, S.; Gruttadauria, A.; Le Saoût, G.; García-Díaz, E. The efficiency of quartz addition on electric arc furnace (EAF) carbon steel slag stability. J. Hazard. Mater. 2014, 279, 586–596. [Google Scholar] [CrossRef] [PubMed]
- Liu, L.; Hu long, M.; Bai guang, C.; Lü wei, X.; Xu zhou, Y.; Deng yu, Q. Effect of cooling rate on the crystallization behavior of perovskite in high titanium-bearing blast furnace slag. Int. J. Miner. Metall. Mater. 2014, 21, 1052–1061. [Google Scholar] [CrossRef] [Green Version]
- Riboldi, A.; Cornacchia, G.; Gelfi, M.; Borgese, L.; Zacco, A.; Bontempi, E.; Boniardi, M.V.; Casaroli, A.; Depero, L.E. Grain Size Effect in Elution Test of Electric Arc Furnace Slag. Appl. Sci. 2020, 10, 477. [Google Scholar] [CrossRef] [Green Version]
- Proctor, D.M.; Fehling, K.A.; Shay, E.C.; Wittenborn, J.L.; Green, J.J.; Avent, C.; Bigham, R.D.; Connolly, M.; Lee, B.; Shepker, T.O.; et al. Physical and Chemical Characteristics of Blast Furnace, Basic Oxygen Furnace, and Electric Arc Furnace Steel Industry Slags. Environ. Sci. Technol. 2000, 34, 1576–1582. [Google Scholar] [CrossRef]
- Luxán, M.; Sotolongo, R.; Dorrego, F.; Herrero, E. Characteristics of the slags produced in the fusion of scrap steel by electric arc furnace. Cem. Concr. Res. 2000, 30, 517–519. [Google Scholar] [CrossRef]
- Sokol, E.V.; Seryotkin, Y.V.; Kokh, S.N.; Vapnik, Y.; Nigmatulina, E.N.; Goryainov, S.V.; Belogub, E.V.; Sharygin, V.V. Flamite, (Ca,Na,K)2(Si,P)O4, a new mineral from ultrahightemperature combustion metamorphic rocks, Hatrurim Basin, Negev Desert, Israel. Miner. Mag. 2015, 79, 583–596. [Google Scholar] [CrossRef]
- Remy, C.; Reynard, B.; Madon, M. Raman Spectroscopic Investigations of Dicalcium Silicate: Polymorphs and High-Temperature Phase Transformations. J. Am. Ceram. Soc. 2005, 80, 413–423. [Google Scholar] [CrossRef]
- RRUFF Database. Available online: https://rruff.info/ (accessed on 19 May 2020).
- Wei, G.; Wei, L.; Wang, N.; Chen, Y.; Tian, Y.; Yan, S.; Mei, L.; Jiao, J. Reversible control of the magnetization of spinel ferrites based electrodes by lithium-ion migration. Sci. Rep. 2017, 7, 12554. [Google Scholar] [CrossRef] [Green Version]
- D’Ippolito, V.; Andreozzi, G.B.; Bersani, D.; Lottici, P.P. Raman fingerprint of chromate, aluminate and ferrite spinels. J. Raman Spectrosc. 2015, 46, 1255–1264. [Google Scholar] [CrossRef]
- Wang, Z.; Lazor, P.; Saxena, S.; O’NeilliD, H. High pressure Raman spectroscopy of ferrite MgFe2O4. Mater. Res. Bull. 2002, 37, 1589–1602. [Google Scholar] [CrossRef]
- Phan, T.-L.; Tran, N.; Kim, D.H.; Tho, P.; Huy, B.T.; Dang, T.N.; Yang, D.-S.; Lee, B. Electronic structure and magnetic properties of Al-doped Ca2 Fe2 O5 brownmillerite compounds. J. Am. Ceram. Soc. 2017, 101, 2181–2189. [Google Scholar] [CrossRef]
- Lazic, B.; Krüger, H.; Kahlenberg, V.; Konzett, J.; Kaindl, R.; Krüger, B. Incommensurate structure of Ca2Al2O5 at high temperatures–structure investigation and Raman spectroscopy. Acta Crystallogr. Sect. B Struct. Sci. 2008, 64, 417–425. [Google Scholar] [CrossRef]
- Dhankhar, S.; Bhalerao, G.; Chandran, M.; Francis, B.; Tiwari, B.; Gupta, K.; Shukla, N.; Baskar, K.; Singh, S. Anomalous room temperature magnetoresistance in brownmillerite Ca2Fe2O5. RSC Adv. 2015, 5, 92549–92553. [Google Scholar] [CrossRef]
- Piovano, A.; Ceretti, M.; Johnson, M.R.; Agostini, G.; Paulus, W.; Lamberti, C. Anisotropy in the Raman scattering of a CaFeO2.5 single crystal and its link with oxygen ordering in Brownmillerite frameworks. J. Physics Condens. Matter 2015, 27, 225403. [Google Scholar] [CrossRef] [PubMed]
- Dhankhar, S.; Bhalerao, G.; Ganesamoorthy, S.; Baskar, K.; Singh, S. Growth and comparison of single crystals and polycrystalline brownmillerite Ca2Fe2O5. J. Cryst. Growth 2017, 468, 311–315. [Google Scholar] [CrossRef]
- Sharma, S.K.; Simons, B.; Yoder, H.S. Raman study of anorthite, calcium Tschermak’s pyroxene, and gehlenite in crystalline and glassy states. Am. Mineral. 1983, 68, 1113–1125. [Google Scholar]
- Burshtein, Z.; Shimony, Y.; Morganau, S.; Henderson, D.; Mu, R.; Silberman, E. Symmetry lowering due to site-occupation disorder in vibrational spectra of gehlenite, Ca2(AlSi)AlO7. J. Phys. Chem. Solids 1993, 54, 1043–1049. [Google Scholar] [CrossRef]
- Yong, W.; Botis, S.; Shieh, S.R.; Shi, W.; Withers, A. Pressure-induced phase transition study of magnesiochromite (MgCr2O4) by Raman spectroscopy and X-ray diffraction. Phys. Earth Planet. Inter. 2012, 196, 75–82. [Google Scholar] [CrossRef]
- Strobel, R.E.; Pratsinis, S. Direct synthesis of maghemite, magnetite and wustite nanoparticles by flame spray pyrolysis. Adv. Powder Technol. 2009, 20, 190–194. [Google Scholar] [CrossRef]
- Matson, D.W.; Sharma, S.K.; Philpotts, J.A. The structure of high-silica alkali-silicate glasses. A Raman spectroscopic investigation. J. Non-Cryst. Solids 1983, 58, 323–352. [Google Scholar] [CrossRef]
- Park, Y.; Min, D.J. A Structural Study on the Foaming Behavior of CaO-SiO2-MO (MO = MgO, FeO, or Al2O3) Ternary Slag System. Met. Mater. Trans. A 2017, 48, 3038–3046. [Google Scholar] [CrossRef]
- Handke, M.; Mozgawa, W. Vibrational spectroscopy of the amorphous silicates. Vib. Spectrosc. 1993, 5, 75–84. [Google Scholar] [CrossRef]


| Sample | Steel Type | Furnace Temperature [°C] | Slagging Procedure |
|---|---|---|---|
| A | Special Steel | n.d. | n.d. |
| B | Carbon steel 0.167% < C < 0.185% | 1550–1620 | on chute and cooled by water |
| C | Carbon steel | 1600 | on chute and cooled by water |
| D | Carbon steel C < 0.25% | 1600 | on chute and cooled by water after SiO2 treatment |
| E | Carbon steel: 0.05% < C < 0.8% | 1650 | on chute and cooled by water |
| Sample | Techniques | |||
|---|---|---|---|---|
| XRD | Raman Spectroscopy | SEM-EDXS | ||
| 2D XRD | Powder | |||
| A | ✓ | ✕ | ✓ | ✓ |
| B | ✕ | ✓ | ✓ | ✓ |
| C | ✕ | ✓ | ✓ | ✓ |
| D | ✕ | ✓ | ✓ | ✓ |
| E | ✕ | ✓ | ✓ | ✓ |
| Sample | Area | Position | Atomic% | Phase Identification | ||||||||||||
|---|---|---|---|---|---|---|---|---|---|---|---|---|---|---|---|---|
| O | Mg | Al | Si | Cl | Ca | Ti | V | Cr | Mn | Fe | Ba | W | ||||
| A | 1 | 1 | 51.4 | - | 12.6 | - | - | 25.0 | - | 0.9 | - | - | 10.1 | - | - | Brownmillerite |
| 2 | 52.6 | - | 0.4 | 16.0 | - | 30.3 | - | 0.3 | - | - | 0.4 | - | - | Larnite | ||
| 3 | 40.4 | 9.7 | - | - | - | 6.4 | - | - | 0.4 | 8.5 | 34.6 | - | - | Magnesioferrite | ||
| 4 | - | - | - | - | - | - | - | - | - | - | 100.0 | - | - | Iron | ||
| 5 | 50.6 | - | 13.0 | - | - | 24.4 | - | 1.0 | 1.2 | 0.4 | 9.4 | - | - | Brownmillerite | ||
| 6 | 41.2 | - | 1.4 | - | 4.6 | 12.4 | - | 10.2 | - | - | 5.3 | 22.0 | 3.0 | * | ||
| 2 | 1 | 50.8 | - | 8.5 | 3.6 | - | 25.4 | - | 0.6 | 5.5 | - | 5.6 | - | - | Brownmillerite | |
| 2 | 43.54 | 13.56 | - | - | - | 6.12 | - | - | 0.71 | 7.7 | 28.37 | - | - | Magnesioferrite | ||
| 3 | 50.7 | - | 11.4 | - | - | 24.2 | - | 0.6 | 6.3 | - | 6.8 | - | - | Brownmillerite | ||
| 4 | 42.0 | 12.1 | - | - | - | 4.56 | - | - | 0.58 | 8.84 | 31.95 | - | - | Magnesioferrite | ||
| 5 | - | - | - | - | - | 0.7 | - | - | - | - | 99.3 | - | - | Iron | ||
| 6 | 49.4 | - | 10.9 | 0.6 | - | 24.7 | 0.4 | 0.7 | 6.3 | - | 7.1 | - | - | Brownmillerite | ||
| 7 | 40.8 | 12.6 | - | - | - | 3.1 | - | - | - | 10.1 | 33.4 | - | - | Magnesioferrite | ||
| 8 | 40.5 | 14.7 | - | - | - | 2.5 | - | - | 0.4 | 10.4 | 31.4 | - | - | Magnesioferrite | ||
| 9 | 51.4 | - | 9.9 | - | - | 23.9 | 0.4 | 0.6 | 6.0 | 0.6 | 7.3 | - | - | Brownmillerite | ||
| 10 | 52.9 | - | - | 15.9 | - | 30.8 | - | - | - | - | 0.4 | - | - | Larnite | ||
| 3 | 1 | - | - | - | - | - | 0.87 | - | - | - | - | 99.1 | - | - | Iron | |
| 2 | - | - | - | 1.3 | - | - | - | - | - | - | 98.7 | - | - | Iron | ||
| 3 | 52.7 | - | 10.5 | - | - | 23.1 | 0.4 | 0.6 | 6.0 | - | 6.8 | - | - | Brownmillerite | ||
| 4 | 52.9 | - | 11.0 | - | - | 23.48 | - | 0.7 | 4.4 | - | 7.6 | - | - | Brownmillerite | ||
| 5 | 42.9 | 14.1 | - | - | - | 3.54 | - | - | 1.4 | 8.4 | 29.7 | - | - | Magnesioferrite | ||
| 6 | 47.1 | 11.1 | - | - | - | 8.57 | - | - | - | 6.5 | 26.8 | - | - | Magnesioferrite | ||
| 7 | 52.8 | - | - | 16.0 | - | 30.29 | - | 0.4 | - | - | 0.6 | - | - | Larnite | ||
| 8 | 54.2 | - | - | 15.6 | - | 30.21 | - | - | - | - | - | - | - | Larnite | ||
© 2020 by the authors. Licensee MDPI, Basel, Switzerland. This article is an open access article distributed under the terms and conditions of the Creative Commons Attribution (CC BY) license (http://creativecommons.org/licenses/by/4.0/).
Share and Cite
Riboldi, A.; Borgese, L.; Vassalini, I.; Cornacchia, G.; Gelfi, M.; Boniardi, M.V.; Casaroli, A.; Depero, L.E. Micro-Raman Spectroscopy Investigation of Crystalline Phases in EAF Slag. Appl. Sci. 2020, 10, 4115. https://doi.org/10.3390/app10124115
Riboldi A, Borgese L, Vassalini I, Cornacchia G, Gelfi M, Boniardi MV, Casaroli A, Depero LE. Micro-Raman Spectroscopy Investigation of Crystalline Phases in EAF Slag. Applied Sciences. 2020; 10(12):4115. https://doi.org/10.3390/app10124115
Chicago/Turabian StyleRiboldi, Alessandro, Laura Borgese, Irene Vassalini, Giovanna Cornacchia, Marcello Gelfi, Marco Virginio Boniardi, Andrea Casaroli, and Laura Eleonora Depero. 2020. "Micro-Raman Spectroscopy Investigation of Crystalline Phases in EAF Slag" Applied Sciences 10, no. 12: 4115. https://doi.org/10.3390/app10124115