1. Introduction
Inflation expectations refer to the general belief concerning the future level of prices in an economy. They are determined by factors such as monetary policy, economic growth, and supply and demand dynamics. Inflation expectations play a crucial role in shaping economic decisions as they affect the borrowing and lending decisions of households and businesses, and can affect the exchange rate and international trade. Central banks aim to maintain low and stable inflation expectations to promote economic stability and growth (
Weber et al. 2022).
Keynes gave much importance to the expectations, but concluded that the modeling of endogenous expectations revision was fraught with difficulties (
Begg 1982). The literature suggests that with Lucas’s critique, it is essential to study expectations meticulously for understanding the decisions of economic agents (
Dias et al. 2010). Individuals conduct their economic behavior based on subjective expectations. Expectations about future inflation differ across gender. Both male and female have expectations that are upwardly biased in the case of consumer inflation when compared to actual results, although females are more optimistic. This issue is known as the “gender expectancies gap” (
D’Acunto et al. 2021). There are numerous endogenous and exogenous factors. Among all these factors, expectations have occupied a great importance in recent studies to understand inflation.
The survey on inflation expectations seeks qualitative and quantitative responses, and aims to gain insight into households’ expectations of price changes and inflation rate over three months and one year ahead (
RBI 2022). There are three major advantages of the survey method: (a) The width of the survey method. It includes households, businesses, and market participants. (b) It is conducted over many years and allows comparative analysis of inflationary expectations for previous years. (c) The survey method is model-free. The survey method has been followed by many developed countries, such as the USA, UK, and Australia. A major and well-known survey of inflation expectations, the Livingston Survey, was started in 1946 and is the oldest survey of inflation expectations. Among others, two important surveys are the University of Michigan Survey of Consumers and the Survey of Professional Forecasters that began in 1968.
The credibility of a central bank’s monetary policy is crucial and if actual inflation and expected inflation are the same, then the economic agent’s behavior is in accordance with the monetary policy and the monetary authorities’ credibility is high. The credibility of the central bank is reflected by well-anchored inflation, which enhances the effectiveness of monetary policy in the short-run and provides ample space for monetary policy to be flexible (
Lee and Jungick 2013). The inflation expectations surveys are used by central banks as to evaluate the credibility of their inflation-anchoring policies. A smaller gap between inflation expectations and actual inflation suggests that the central bank convinced the economic agents and the financial markets of lower inflation.
The literature review suggests that there is a substantial heterogeneity in inflation beliefs across respondents (
Armantier et al. 2021). According to estimates, gender, age, and education also have a significant effect on inflation expectations through time (
Reid et al. 2021). We hypothesize that there are differences in the assessment of inflation by male and female; their attitudes are influenced by various events. In 2021, D’Acunto, Ulrike Malmendier, and Michael Weberl formally investigated the gender expectations gap. In this paper, we explore gender-wise differences in the perception of inflation in India using data from the Reserve Bank of India’s Households’ Inflation Expectations Survey (March 2007 to September 2022).
The aim of this research is to investigate the relationship between gender and inflation expectations with reference to India. There is limited research in the area of gender differences and inflation expectations, and this study aims to address this knowledge gap and provide new insights into the topic. The concept of gender differences in inflation expectations refers to the idea that there may be disparities between how men and women perceive and anticipate changes in the general level of prices in an economy. The present study aims to understand if there are any systematic differences in inflation expectations between genders and what factors may contribute to these differences. Research in this area has the potential to explain the heterogeneity of inflation expectations and inform policy decisions that affect different segments of the population (
Corduas 2022;
D’Acunto et al. 2021).
Our main contribution to the literature is that we can draw insights on gender-wise differences in perception about inflation by using unit-level data from the Reserve Bank of India’s Households’ Inflation Expectations Survey. To our knowledge, this is the first attempt to examine gender-wise differences concerning inflation in India.
There are four sections in this paper.
Section 2 gives a brief review of the literature.
Section 3 illustrates the survey and data.
Section 4 presents the results.
Section 5 provides a summary and discussion.
Section 6 offers conclusions.
2. A Brief Review of Literature
In addition to using financial market variables such as inflation-indexed bonds and inflation swaps, we can estimate inflation expectations since they are unobservable; households, firms, and professional forecasters approximate expectations through targeted surveys. It is possible to forecast inflation by using subjective surveys of households and firms, which serve as intermediate targets for monetary policy by enabling us to understand wage–price setting behavior (
Muduli et al. 2022).
Expectations of inflation influence consumers’ and firms’ consumption and investment decisions in the economy. Furthermore, timely and accurate information about inflation expectations is essential for monetary policy since inflation expectations indicate monetary policy’s credibility and effectiveness over longer and shorter periods. It is for this reason that policy-makers and academicians carefully study the survey dynamics for inflation expectations (
Angelico et al. 2022).
The formulation of survey questions aimed at gauging inflation expectations can present significant difficulties. Such surveys may vary in the terminology utilized, with some using phrases such as “change in the general level of prices” while others use the term “inflation”, and may not clearly specify which price-index respondents should consider while reporting their expectations. This lack of clarity can result in inconsistent survey responses and may prompt respondents to focus on prices in their personal consumption basket instead of the broader representative consumption basket. To address this issue, some surveys utilize screening questions to exclude individuals with limited knowledge about inflation; however, this approach raises the issue of selection bias. Furthermore, declining response rates and the requirement to obtain a representative sample through a combination of survey methods pose further challenges that may result in biased or distorted measures of inflation expectations (
Weber et al. 2022).
Though survey data might not provide the expected horizon of inflationary pressures, they may provide useful forward-looking information in the current environment of stable inflation. Even though survey data are not accurate at predicting inflation, the data can still be a useful indicator for monetary authorities. Nevertheless, there remains some uncertainty regarding the factors contributing to the inflation expectations, particularly those obtained from consumers (
Ranchhod 2003). Expectations about inflation differ across genders, and females have steadily higher expectations than males.
D’Acunto et al. (
2021) argued that differences in expectations are caused by different economic signals in their daily lives, and traditional gender roles have played a substantial part in determining this gender expectation gap.
Corduas (
2022) used dynamic modeling to identify the changes in response through time and to compare the behavior of females and males. The findings suggest that females are inclined to predict a greater inflation than males. Similarly,
Armantier et al. (
2021) examined the degree of heterogeneity regarding inflation expectations by using aggregate density forecasts and the distribution of individual inflation expectations. Their findings suggest that heterogeneity exists across different demographic groups (i.e., age, gender, etc.) regarding inflation expectations.
Venkatu and Bryan (
2001) admitted in their commentary that inflation expectations of females almost always have been greater than males.
In particular,
Dasgupta et al. (
2019) conducted a laboratory experiment and used summary statistics to examine competitive preferences among males and females. The findings suggest that females are less competitive and more risk adverse than males. It is imperative to note that some dimensions, e.g., gender and education, are important determinants of inflation expectations (
Abildgren and Kuchler 2021). An alternative explanation to comprehend gender differences in perception is provided by
Zhu et al. (
2021), who conducted a survey to understand gender differences about the risk perception of forecasting future stock prices, and found that greater risks tend to be perceived among females compared with males.
Buser et al. (
2020) examined the role of confidence in explaining differences in political and redistributive choices outside the laboratory. Moreover, the gender gap is only evident when the source of inequality is related to relative abilities. Men who are relatively confident (over) about their abilities, in comparison to women, specify lower redistribution levels across all sampled locations.
Breunig et al. (
2021) found that females have lower long-run expectation in all markets. A review of the literature suggests that women are significantly more regret averse than men, while men have significantly stronger self-attribution, illusion of control, and confidences biases. In contrast, behavioral biases are similar for both genders among individuals who possess a high level of financial literacy, suggesting that financial literacy alleviates gender differences (
Hsu et al. 2021).
Across many issues including the economy and markets, males incline to be more optimistic than females (
Jacobsen et al. 2014). High inflation expectations and the existence differences across gender in their expectations are strongly influenced by the heterogeneity in price signals they experience on daily basis. It is important to note that this influence is not extinguished by the level of education, income, and other individual characteristics (
D’Acunto et al. 2021). Several gender differences exist in men and women’s behavior and motivations. It has been observed that men normally use motivated reasoning to assess their performance compared to others; women do not routinely use motivated reasoning to assess their performance. Men and women have different motivations for reasoning, and this can lead to differences in the persistence of overconfidence (
Thaler 2021). In addition to examining psychological differences and financial literacy differences, the literature has also identified differences in investment, donation, and consumption behavior among men and women (
Bezalel et al. 2021). The relationship between gender and perception is another socioeconomic characteristic that has drawn researchers’ attention.
Studies have found that there is a strong connection between gender differences and biological, cognitive, behavioral, or social influencing factors. As a result of traditional gender roles, females are exposed to different price information than males, which explains why they have a wider expectations gap regarding inflation. Gender roles outline beliefs, not only about situations that can be characterized as “gendered”, such as beliefs about leadership abilities or STEM disciplines, but also without any reference to gender such as inflation expectations (
D’Acunto et al. 2021). It is necessary to conduct empirical analyses of adjusted gender-specific effects of expansionary monetary policy instruments in recent times to fully assess their economic impact (
Neyer and Stempel 2021).
Furthermore, various studies have found a strong correlation between inflation perception bias across gender. To identify the gender-wise inflation expectations gap, the following hypotheses were developed based on the findings of the previous studies (short horizon (in next 3 months) and long horizon (1 year ahead)):
H0 . The mean response of future prices of males is same as the mean response of females (i.e., μ1 = μ2).
vs.
H1 . The mean response of future prices of males is less than the mean response of females (i.e., μ1 < μ2).
3. Data and Methodology
3.1. Data
The Inflation Expectations Survey of Households (IESH) is a quarterly survey conducted by the Reserve Bank of India to gather information concerning public perceptions about future inflation developments. A total of 69 rounds have been conducted since 2005. Two additional surveys from 2014 were conducted in May and November to bring the bimonthly monetary policy into line. Following the confirmation of uniformity in the survey results, the results for these additional rounds have been published since November 2016. In March 2021, the Reserve Bank surveyed households’ inflation expectations in 19 cities (18 cities in previous rounds). The survey comprises the following features: (a) A wide geographical area is covered by selecting respondents accordingly. (b) It includes quota sampling to ensure gender, occupation, and age representation. (c) In addition to general prices, the survey also aims at information about households’ expectations on food products and nonfood products, household durables, housing, and services for the next quarter and for a year ahead. (d) The sample size of the survey is limited to urban areas only (
RBI 2022). This survey may provide directional information about the near-term inflationary pressures, which may reflect the consumer’s consumption pattern. Hence, the survey represents a household’s inflation sentiment. It is assumed that all estimates of inflation expectations are medians, unless otherwise specified. There are four blocks in the questionnaire: Block 1 and Block 2 record the demographic features of the respondents, e.g., age, gender, occupation, and city of residence.
To determine the direction of price change, Block 3 records the qualitative responses; the survey examines three questions: The first question assesses what inflation will look like in the future, and the survey formulates this as follows: Expectations of respondent on prices in next 3 months? The choices provided are: price increase more than current rate; price increase similar to current rate; price increase less than current rate; no change in prices; decline in prices. The second question addresses the expectations of respondent on prices in next one year: How do you expect consumer prices will develop in the next 12 months? The choices provided are: prices increase more than current rate; prices increase similar to the current rate; prices increase less than the current rate; no change in prices; decline in prices. Block 4 records quantitative responses; respondents are asked to provide their views concerning inflation rates, as shown in
Table 1: Respondents are asked to indicate their estimated inflation rates for the current time and at different time intervals (3 months and 1 year) in the future. The options provided in each row represent different inflation rate ranges, such as greater than (
<) 1%, 1–2%, 2–3%, and so on, up to 15–16% and above 16%. There is also an option for “No idea” if the individual is unsure of their estimate.
We used the RBI’s Inflation Expectations Household survey data from March 2011to September 2022. In this study, the frequency distributions of responses have been analyzed based on demographic groups. We utilized qualitative responses for the analysis and the data consists of 174,758 male respondents and 135,282 female respondents. We used balance statistics to summarize and quantify qualitative responses. In order to calculate it, the qualitative responses were categorized into a few groups; it is the standard practice to identify these categories (
Das et al. 2019). There are five categories of responses in the survey, each with a score from 1 to 5; the higher the number, the greater the increase in price. A discrete random variable indexed with time is used to represent consumer/household responses based on their qualitative perceptions. Inflation expectations do not appear to have changed significantly according to the quantitative forecasting results (
Danie and ter Steege 2020). There are certain limitations to the use of quantitative data. Qualitative data are valuable for addressing these shortcomings.
3.2. Methodology
We used an independent sample t test to compare the mean expectations on prices during a short horizon (next 3 months) and a long horizon (1 year ahead) for males and females in different categories of products (e.g., general products, food products, nonfood products, household durables, and housing).
In addition, we also used both the ordinary least square (OLS) regression and ordinal logistic regression (OLOGIT) models to test the difference in average inflation expectations across gender for the short horizon (next 3 months) and the long horizon (1 year ahead).
In order to analyze the association between dependent and independent variables, the qualitative data were categorized in the following way: the sample size is 310,041, with 56.37% of the sample being female (gender = 1) and 43.63% male (gender = 2), and it is divided into three age groups, namely, up to 25 years of age, up to 60 years, and above 60 years; and four categories of respondents—daily wage earners, “financial sector employees, working at home (homemaker and housewife), other (other category and other employees), retired persons, and self-employed.
The outcome variable is “average expectations” of the respondents regarding the future changes in price, which is a continuous variable. We further transformed the outcome variable from continuous to and ordered categorical one with three categories: (1) no change or decline in prices; (2) increase in price but lower than the current rate; and (3) increase in prices and the increase is greater than the current rate. The independent variables are “gender”, “age group”, and “type of respondent”.
The model equation for an ordinal logistic regression is:
where p_i is the probability of the ith observation falling into the highest category of the dependent variable; β_0 is the intercept term; and β_1, β_2, …, β_n are the coefficients of the independent variables (X_1, X_2, …, X_n).
In this case, the dependent variable is average expectations and the independent variables are gender, age group, and type of respondent.
Microsoft Excel, Statistical Program for Social Sciences (SPSS), and STATA were used in this study for data analysis.
4. Results
4.1. Independent Sample t Test
According to
Carlson and Parkin (
1975), we can draw reasonable results by applying a probability approach for quantifying qualitative survey data. However, simple balance statistics and regression approaches are also useful for drawing reasonable results (
Breitung and Schmeling 2013). Although qualitative inflation expectations surveys have many limitations, they are still useful indicators for inflation expectations trends. To understand the dynamics of household inflation expectations in the short horizon (next 3 months) and long horizon (1 year ahead), the independent sample
t test was used. The results of the independent sample
t test are presented in
Table 2 for the short horizon (next 3 months) inflation expectations;
Table 3 gives the results for the long horizon (1 year ahead) inflation expectations.
From the output of
Table 2, the mean responses of inflation expectations of males is less than the mean responses of inflation expectations of females (i.e., μ1 < μ2). The difference between the two means is statistically significant. For the general prices, the mean value for males is 4.04 and for females it is 4.17. In case of food products, the mean value for males is 3.97 and for females it is 4.10. The difference between the two means is statistically significant for all parameters.
Based on the hypothesis and the results of the independent sample t test, it can be concluded that the mean response of future prices for males is significantly different from the mean response of future prices for females, and specifically, the mean response of future prices for males is lower than the mean response of future prices for females. This conclusion is supported by the fact that the p-value in all cases is less than 0.05, indicating that there is less than a 5% chance that the observed difference between the means could have occurred by chance. Therefore, we reject the null hypothesis (H0) and accept the alternative hypothesis (H1).
The output shown in
Table 3 indicates that the
p-value (0.000) for our independent sample
t test is less than the standard significance level of 0.05 for both short and long horizons; thus, we can reject the null hypothesis. An independent sample
t test showed that the mean difference is statistically significant. Our sample data support the claim that the population means are different; hence, an inflation expectations gap exists in males and females.
The table shows that for all groups and both genders, the null hypothesis is rejected, which suggests that there is a significant difference in the means between the two groups. Specifically, the p-value for all groups and both genders is less than 0.05, which suggests that these differences are statistically significant. Therefore, we can infer that the mean response of future prices from males is less than the mean response from females for all the groups.
4.2. Ordinary Least Square (OLS) Regression and Ordinal Logistic Regression (OLOGIT) Models
The results of ordinary least square (OLS) regression, and ordinal logistic regression models are presented in
Table 4 for the short horizon (next 3 months) inflation expectations;
Table 5 gives the results for the long horizon (1 year ahead) inflation expectations.
The result shows that there is a significant association between the outcome variable “average expectations” and the independent variables “gender”, “age group”, and “type of respondent” in both the short and long horizon.
Based on the results of the ordered logistic regression analysis, it appears that the null hypothesis can be rejected, and the alternative hypothesis can be accepted. This suggests that there is significant difference in the average inflation expectations of males and females for both the short horizon and long horizon, with females having higher average inflation expectations than males. The coefficients and p-values in the analysis provide more detailed information about the strength and significance of this difference.
Compared to males, females are more likely to expect inflation in future. The likelihood of expecting inflation decreases with increasing age. Additionally, apart from daily wage earners, respondents who are involved in the financial sector or are housewives, self-employed, or pensioners, are less likely to expect future inflation.
Both methods (OLS and ordinal logistic regression models) resulted in a similar result, which shows the robustness of the relationship that we have tried to establish. In conclusion, the results suggest that, on average, females have higher inflation expectations than males.
5. Summary and Discussion
This section discusses and summarizes the differences in expectations regarding future price changes between two groups of respondents for food products, nonfood products, household durables, housing, and general prices.
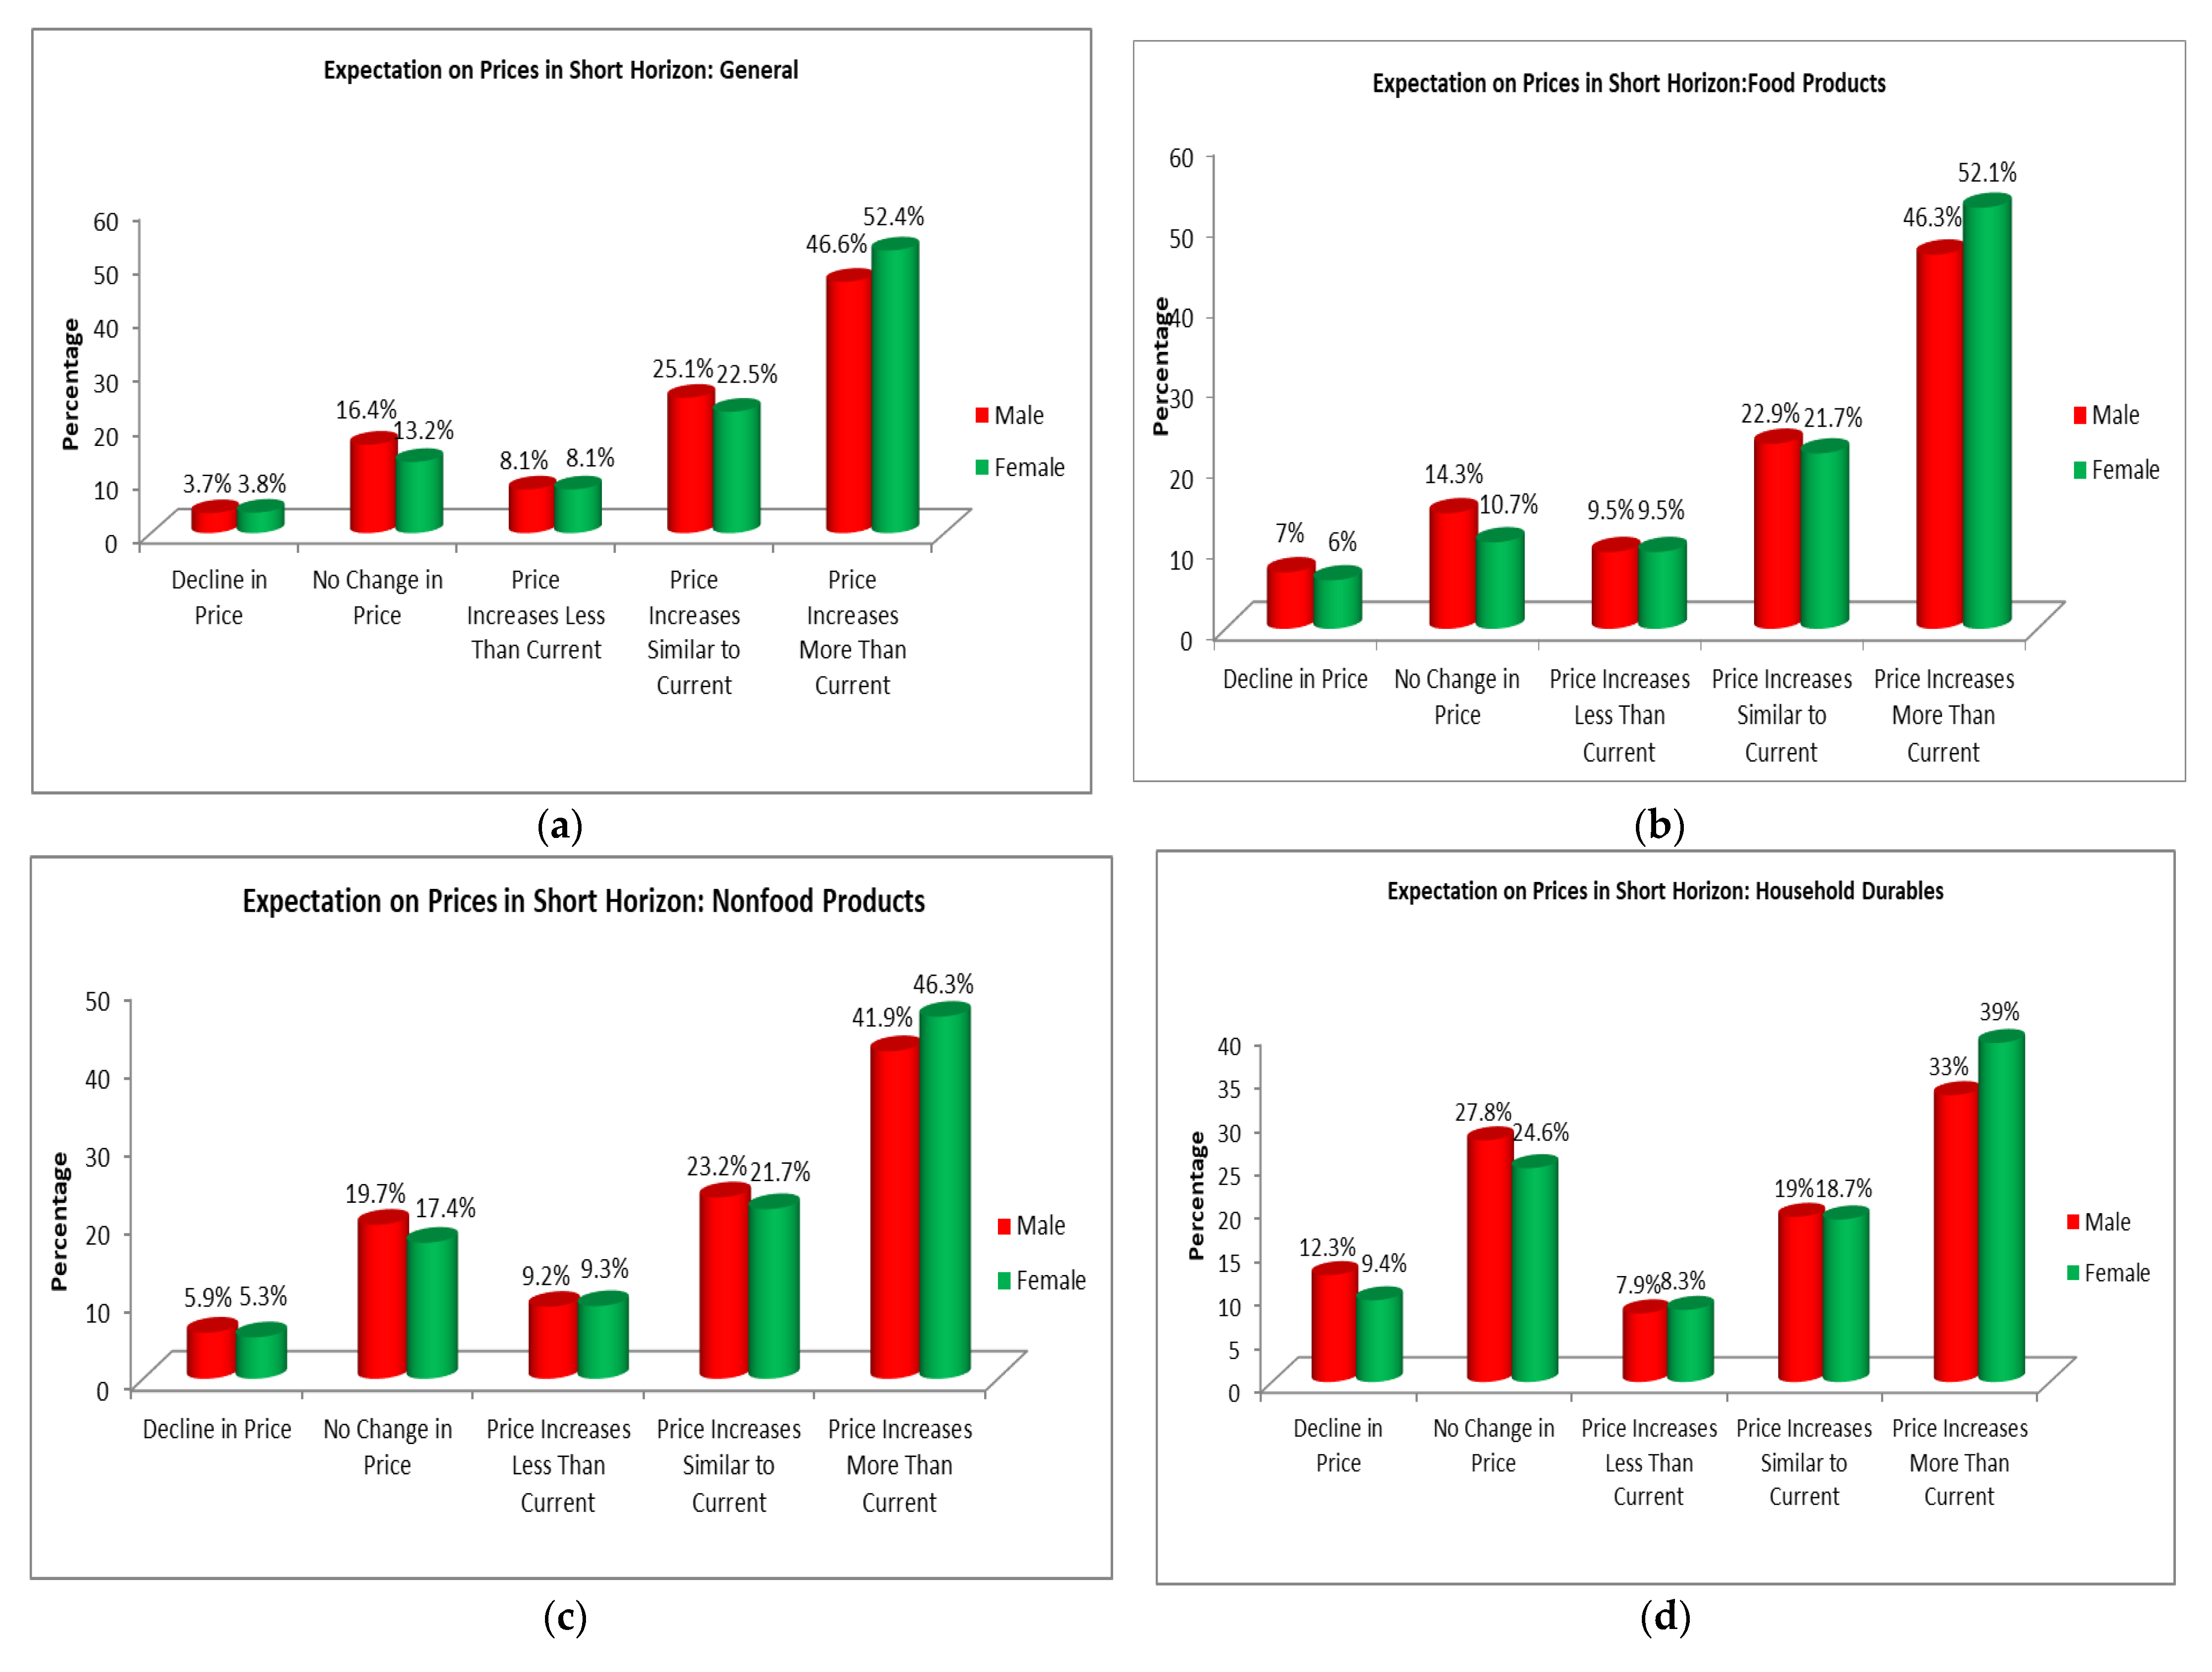
Figure 1 shows results for short horizon (next 3 months) inflation expectations and
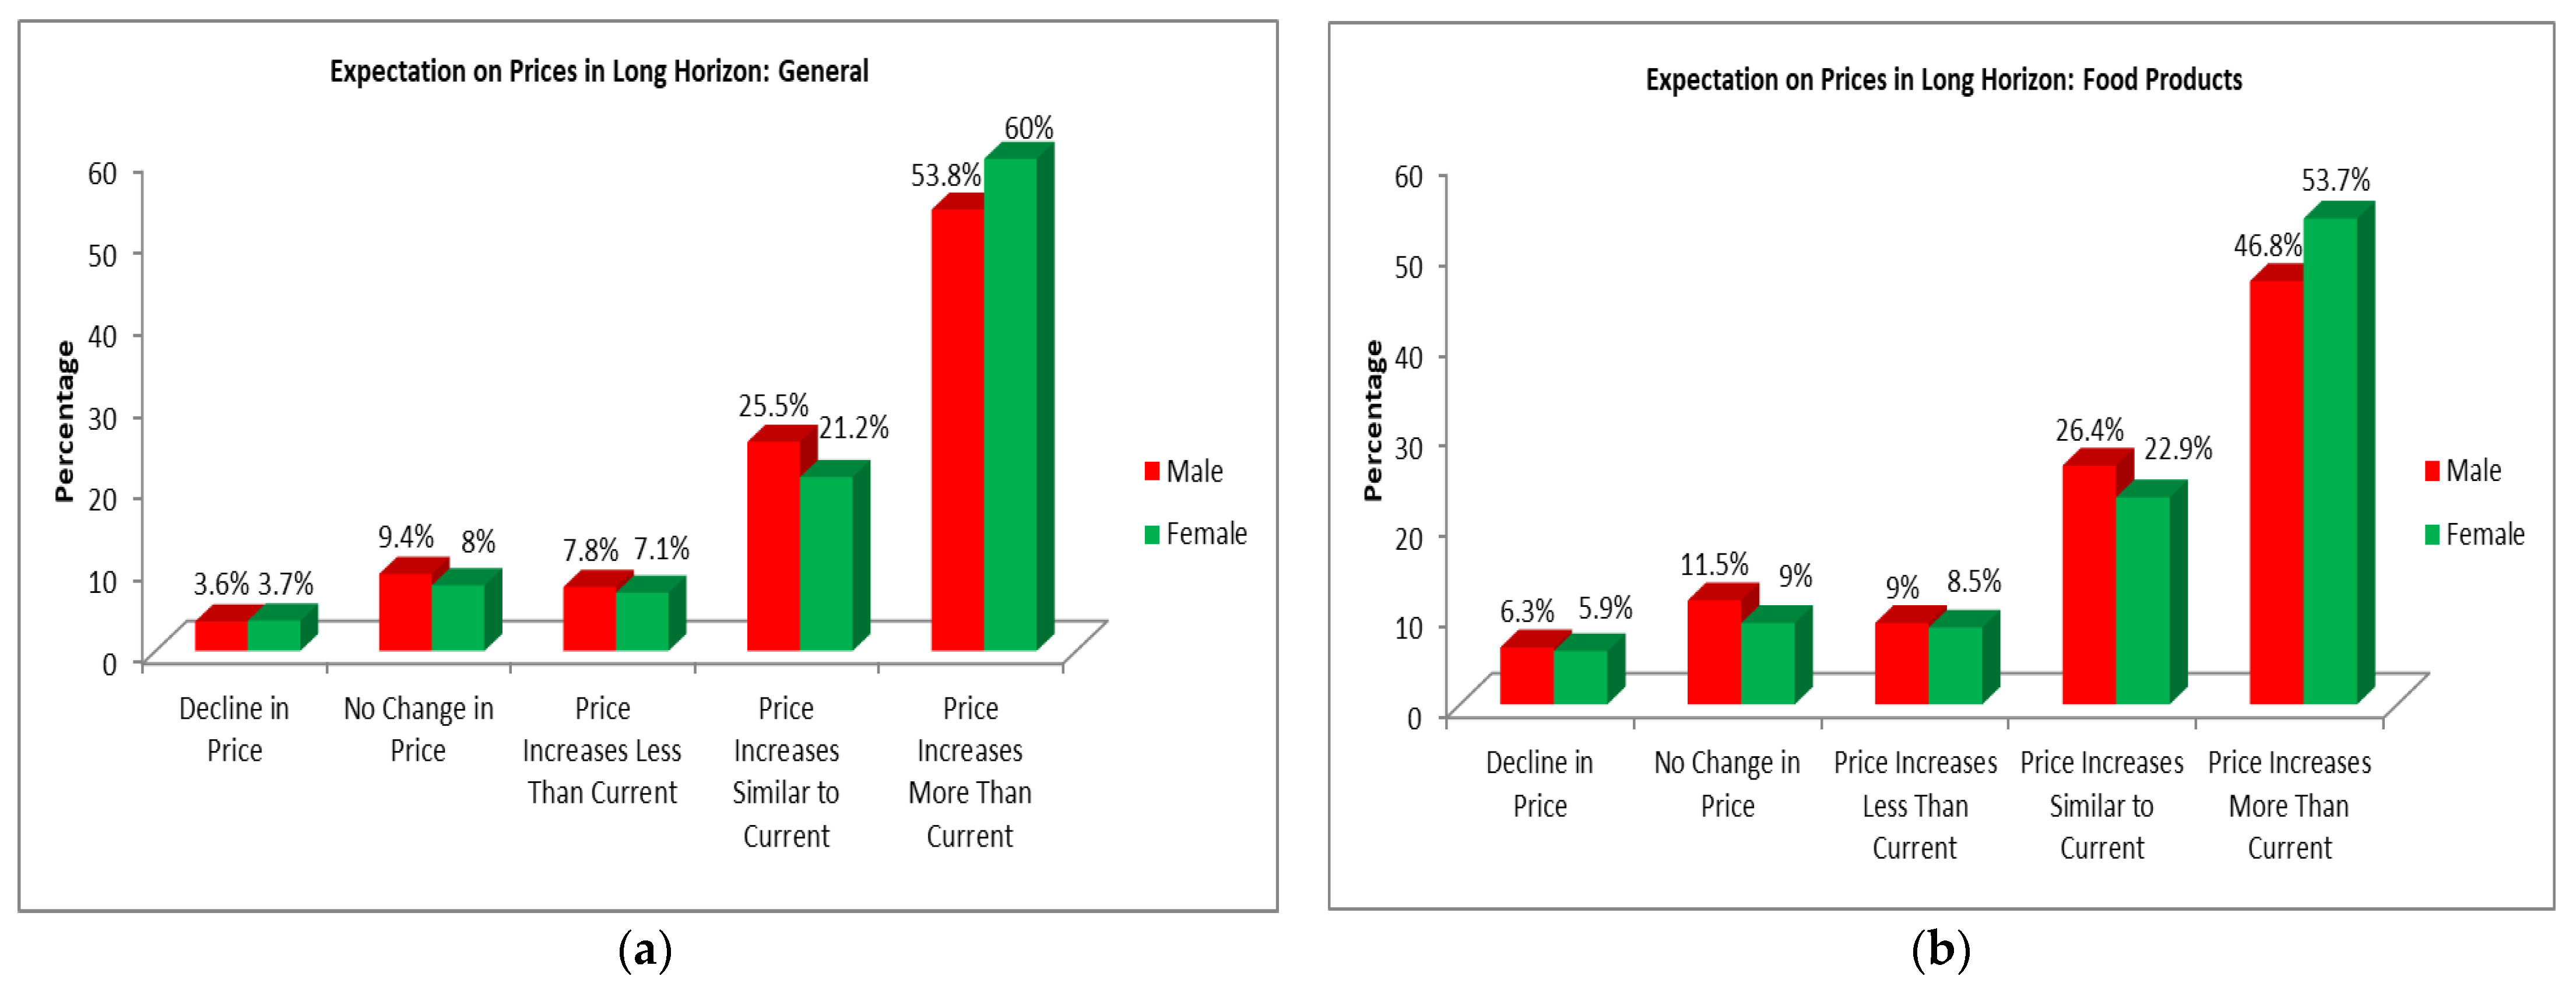
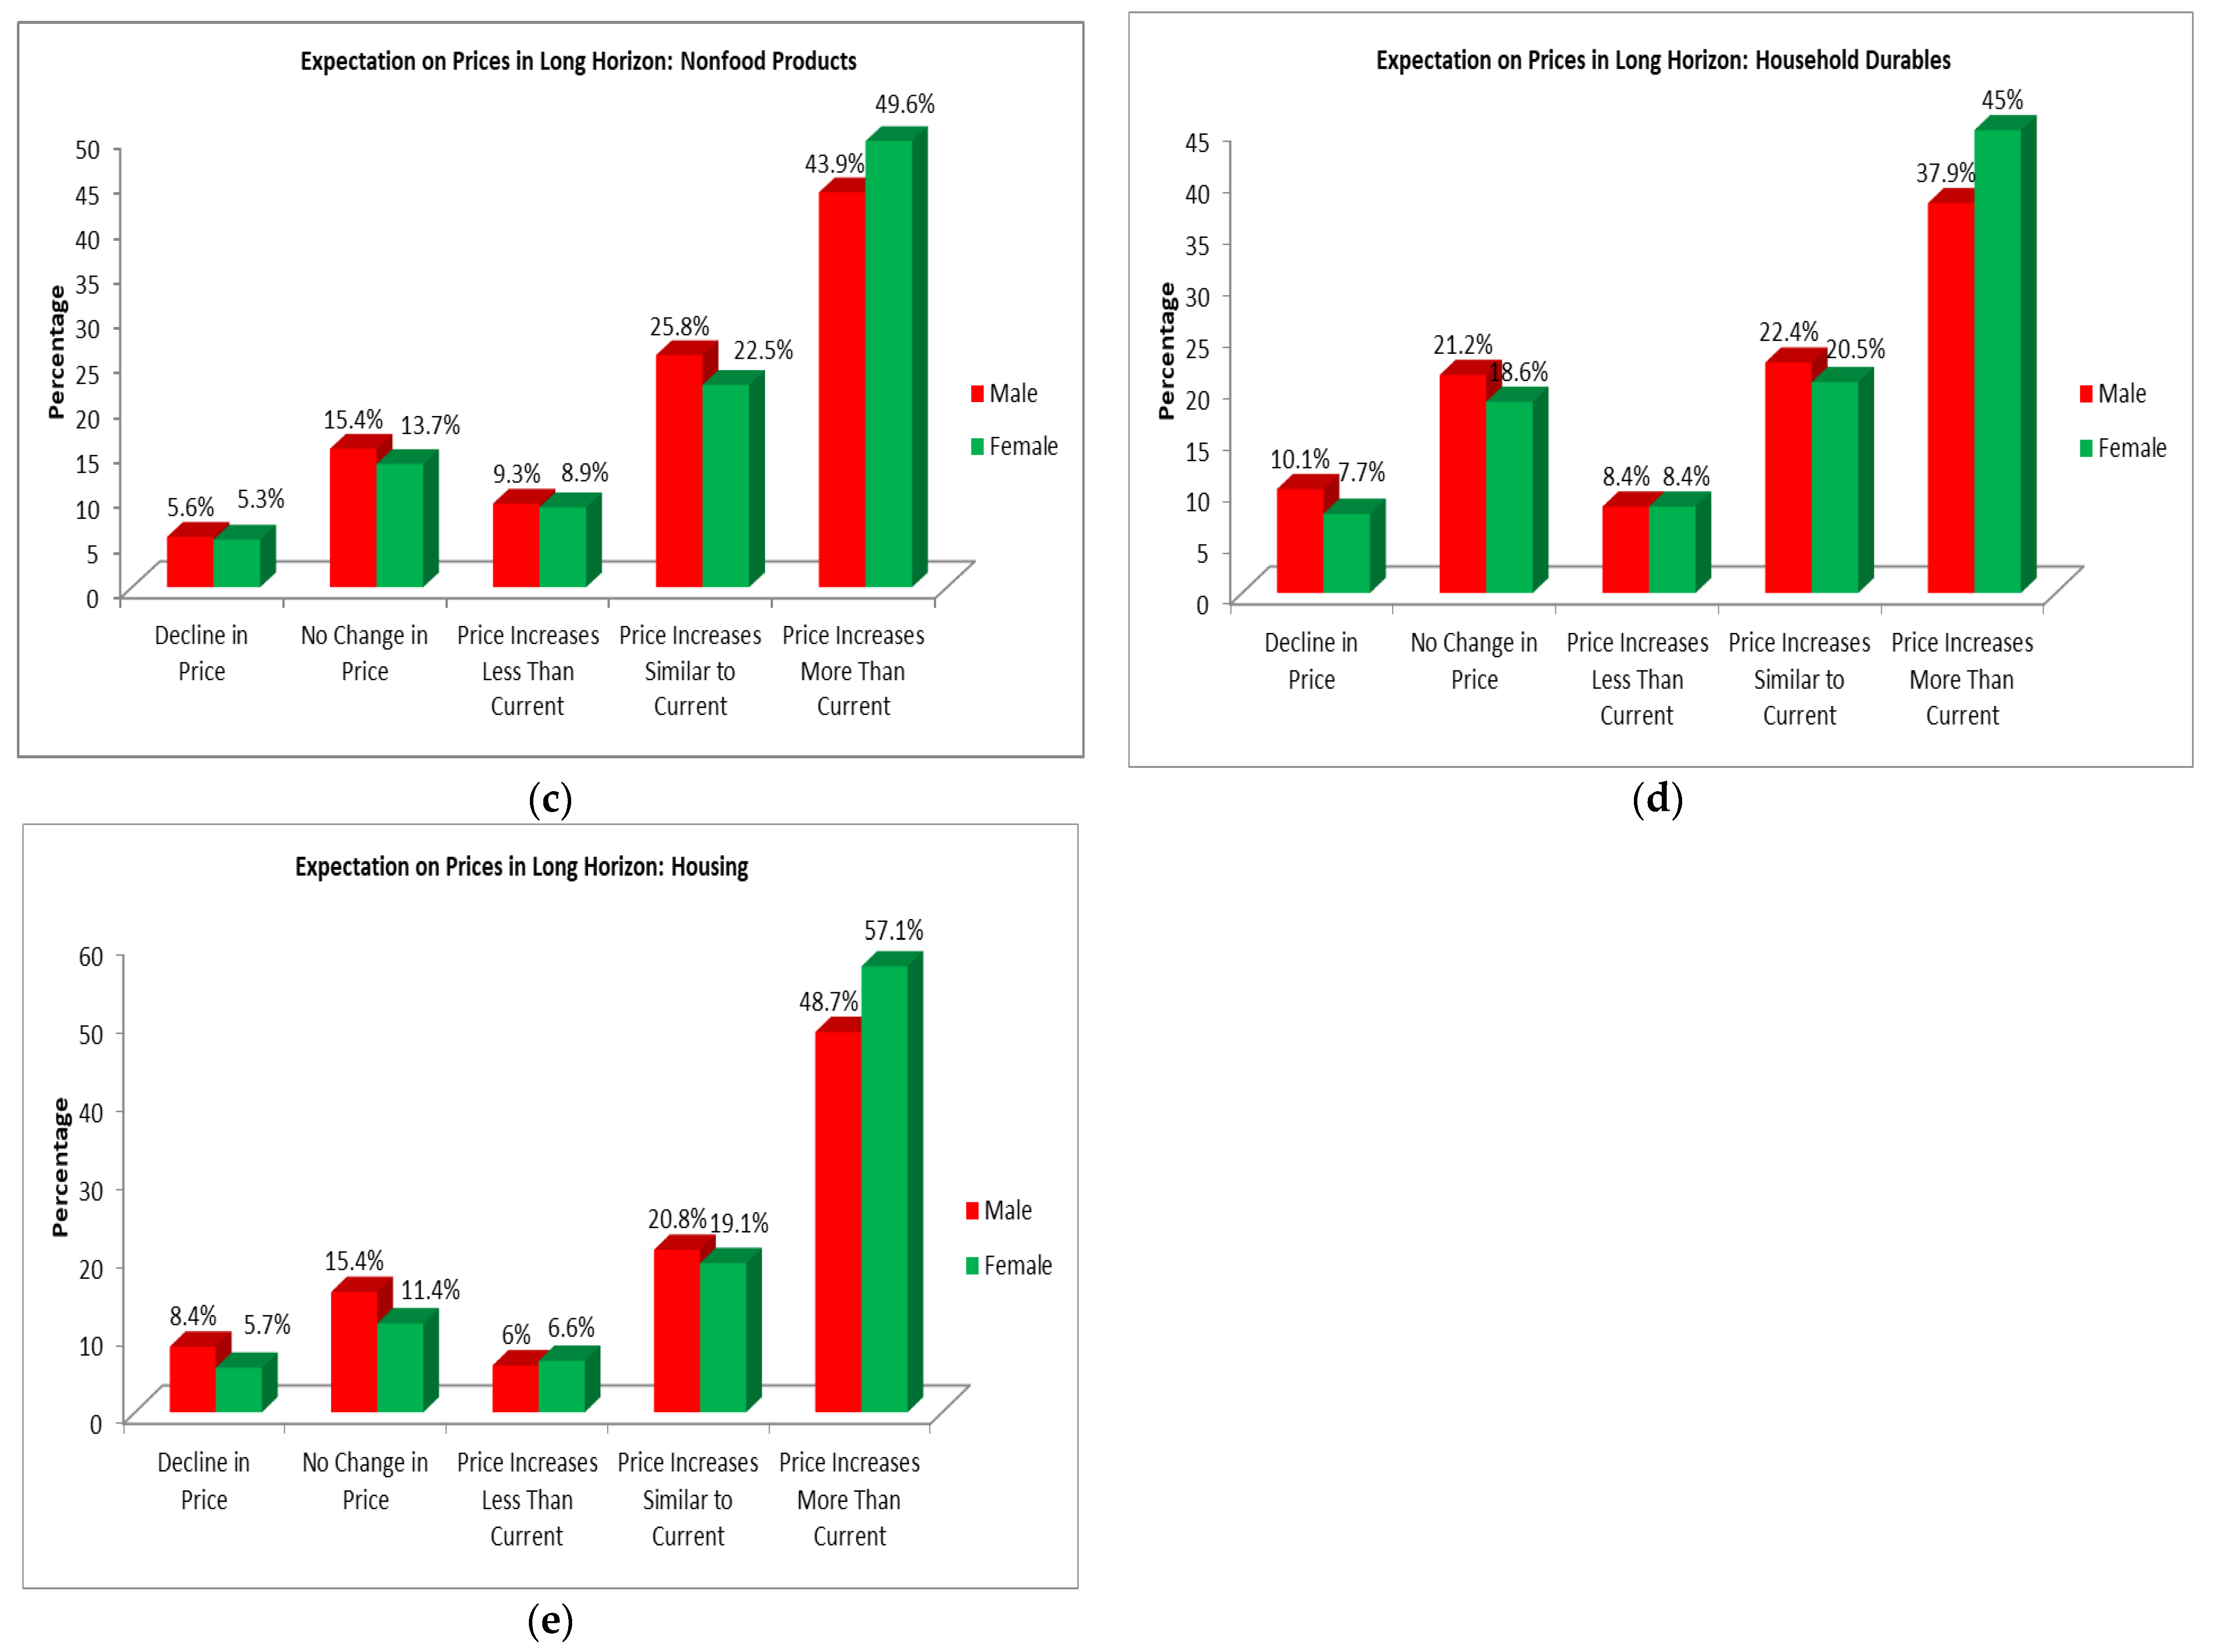
Figure 2 shows results for long horizon (1 year ahead) inflation expectations.
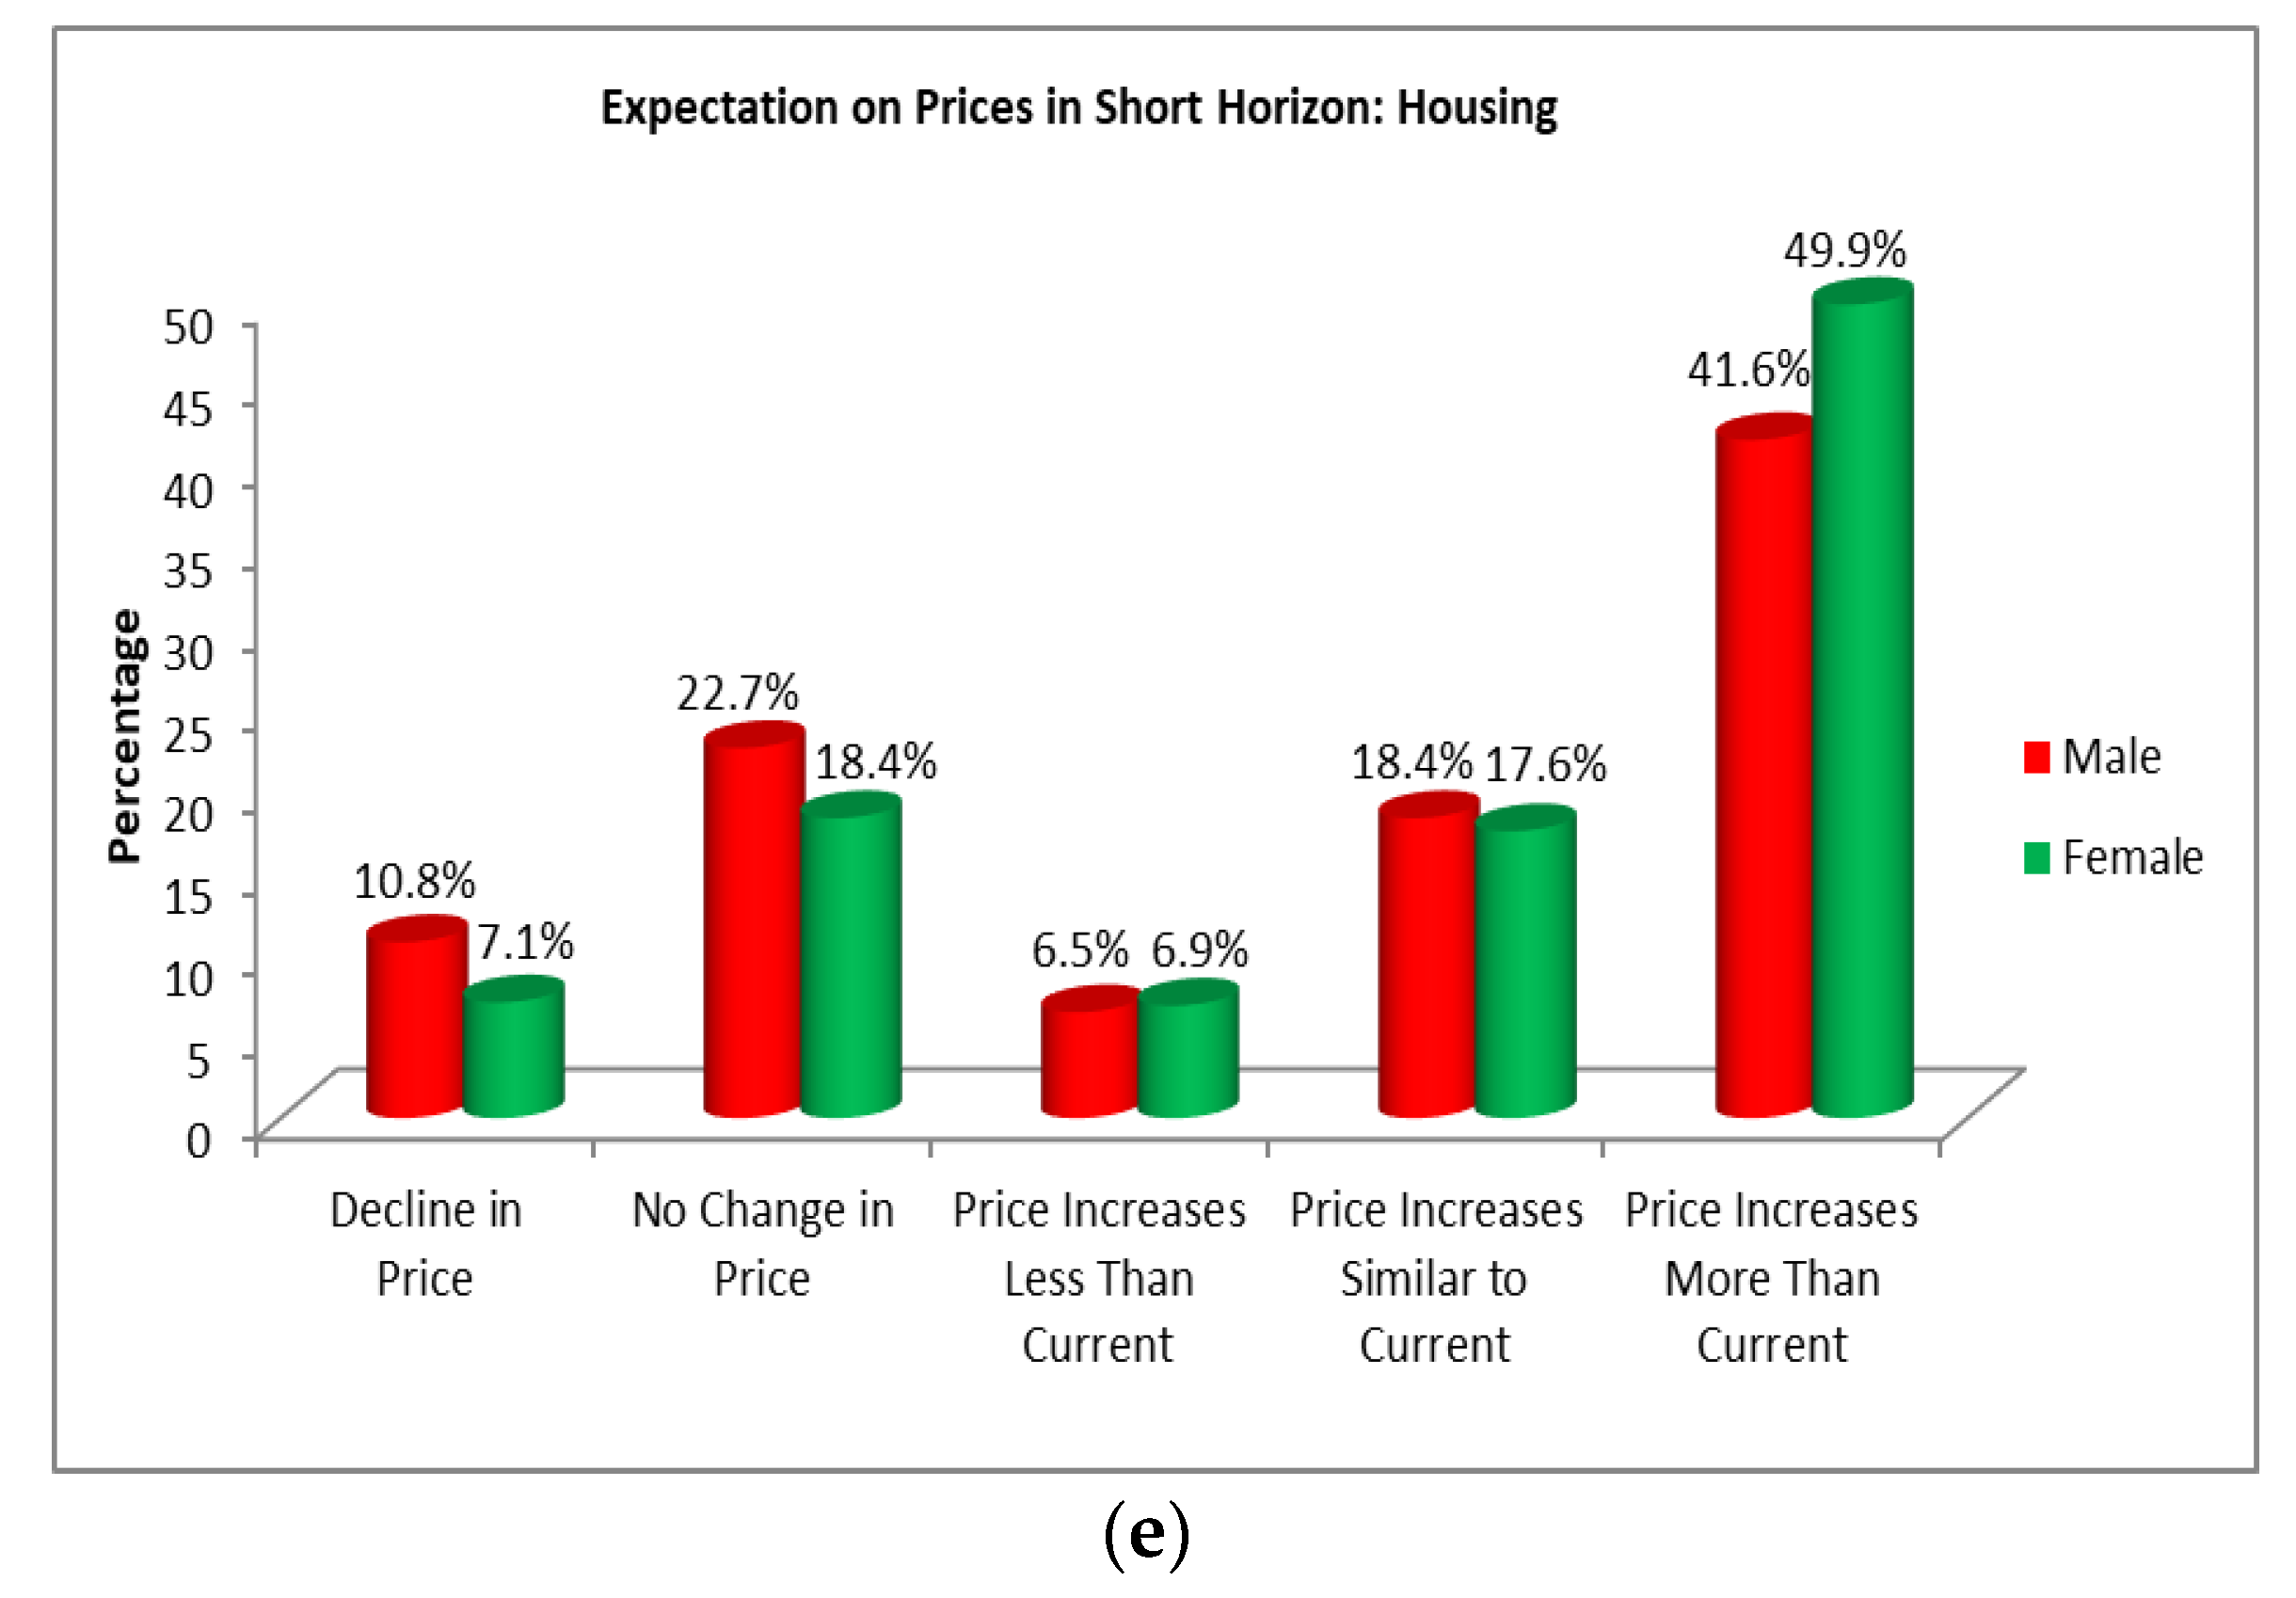
Figure 1, graph (a), shows that that 52.4% of female respondents and 46.6% of male respondents were expecting that general prices would increase more than the current rate in the short horizon (in next 3 months). Approximately 50% of respondents expected that general prices would increase more than the current rate in the short horizon (in next 3 months), and female respondents were more likely to perceive higher inflation than male respondents. The above graph (b) indicates that 52.1% female respondents and 46.3% male respondents predicted that food in the short horizon product prices would increase more than the current rate. Most respondents believed that food product prices would rise more than the current rate in the short horizon, and female respondents perceived higher inflation than male respondents. Concerning the nonfood products graph (c), 46.3% female respondents and 41.9% male respondents forecasted that prices in the short horizon would increase more than the current rate. In the case of the household durables graph (d), 39% of female respondents and 33% of male respondents believed that prices in short horizon would increase more than the current rate. Graph (e) suggests that 49.9% of female respondents and 41.6% male respondents believed that housing prices in the short horizon would increase more than the current rate.
Figure 1 reveals that the female respondents generally perceived higher inflation than the male respondents.
Figure 2 summarizes our independent sample
t test analysis for the long horizon (1 year ahead); graph (a) shows that 60% of female respondents and 53.8% of male respondents expected that general prices would increase more than the current rate during the long horizon. Around 53.7% of female respondents and 46.8% of male respondents believed that food prices would increase more than the current rate, as shown in graph (b). Graph (c) suggests that 49.6% of female respondents and 43.9% of male respondents forecasted that nonfood product prices in the long horizon would increase more than the current rate. Most respondents believed that food products and nonfood product prices in the long horizon would increase more than the current rate. For household durables, graph (d) shows that 45% of female respondents and 37.9% of male respondents predicted that prices in the long horizon would increase more than the current rate. In case of the housing graph (e), 57.1% of female respondents and 48.7% of male respondents thought that prices in long horizon would increase more than the current rate.
Generally, inflation expectations represent what consumers, businesses, and investors expect inflation to be in the future. A better understanding of how consumers form and estimate inflation expectations are essential for central bank authorities. However, it helps central bank authorities to understand the perception of consumers regarding inflation, which can be used as a tool to anchor inflation. Therefore, the credibility of the central banks is ultimately strengthened because of enhanced macroeconomic analysis (
Di Nino et al. 2022). There is a systematic difference in the level of inflation expectations between females and males. The independent sample
t test results shown in
Figure 1 and
Figure 2 reveal that the female respondents generally perceive higher inflation than the male respondents.
Bruine de Bruin et al. (
2011) finds that the differences between respondents’ perceptions of specific price changes were relatively large, conceivably due to the differences in remembered personal experiences. The gender differences in inflation expectations highlight the need for gender-specific policy awareness to address the issue. It is important to note that
Conrad et al. (
2022) suggests that socioeconomic characteristics, in addition to the source of information about monetary policy, play a vital role in inflation forecasting. Further,
Brouwer and de Haan (
2022) found that those who have information about ECB’s policy instruments have inflation expectations closer the ECB’s inflation target policy than those who are only aware of ECB’s policy objectives. These findings suggest that providing households with adequate amounts of information through effective communication could improve political legitimacy and might help central bank authorities to attain price stability. Another important aspect of awareness is that households with higher inflation literacy have estimated lower and accurate short-term and long-term inflation expectations (
Rumler and Valderrama 2019).
Agarwal et al. (
2022) suggested that providing adequate price information regarding quality of products has a smaller effect on inflation expectations.
The results obtained from independent sample
t test, ordinary least square (OLS) regression, and ordinal logistic regression (OLOGIT) models suggest that females have a habit of predicting higher inflation than males, which is consistent with the findings of previous studies. This could be due to variety of reasons for differences in the assessment of future price changes.
Yadav and Shankar (
2016) suggest that it might be due to conservative spending behavior of Indian households.
Hjalmarsson and Osterholm (
2020) suggest that consumers’ expectations are motivated by their personal experiences. The various studies have pointed out another relevant angle that it is in accordance with traditional gender roles because females are exposed to different pricing signals than males. Owing to these differential exposures, men and women have divergent expectations about future inflation. There could be a detrimental effect on females’ economic choices and long-term wealth because this gap could impair economic policies, induce stress, and adversely affect women’s wellbeing (
D’Acunto et al. 2021). Results of other studies also identified differences in assessment of future inflation with the help of different demographic characteristics.
6. Conclusions
In response to short- and long-horizon inflation expectations, it is found that females estimate higher inflation than males, which has significant impact on their spending habits and family expenditure planning. Thus, it leads to unnecessary short-term expenditure.
Jhaa and Sarangi (
2018) suggest that it is important to encourage females to participate in decision-making since it has a positive externality. Additionally, it is also essential to identify effective tools for stabilizing economic activity and reducing adverse effects of gender differences. A lack of knowledge about different financial instruments and practices is a common problem among females in both developing and developed countries. To acquire knowledge, a better understanding of the English language, information sources, and education is essential. It is also found that females with sufficient financial and economic responsibility in the household provide communication channels that appear to be more relevant in decision-making (
Rink et al. 2021).
Potrich et al. (
2018) suggest policy needs to address the issue of financial illiteracy among females and to introduce financial management and market finance concepts into all higher education levels, irrespective of the academic discipline; it is generally observed that even females with degrees show low financial literacy. Thus, there is a need for special educational programs to promote personal financial literacy for females in all developing countries. The existence of effective communication by the central bank regarding its policy tools has shown statistically significant effects on consumers’ inflation expectations (
Szyszko et al. 2022).
The notable implication of the study is that, in view of gender development, it is imperative to implement strategies aimed at mitigating financial illiteracy and closing the gender gap. Policy-makers should consider these findings and develop interventions aimed at increasing awareness through multiple information channels to prevent the detrimental effects of gender disparities on inflation expectations.
Additionally, future research could benefit from addressing limitations in the current study. One limitation is that the present study only explores the qualitative response of inflation expectations; thus, the findings cannot be used to gain insight into quantitative responses. Another limitation is that the study did not account for the influence of information channels and lifetime experience on gender-wise inflation expectations. Future studies should consider these factors as covariates when analyzing gender-wise inflation expectations, since it could help policy-makers to understand the role of gender in anchoring inflation.

 ,
, 


