

Dynamics of Soil Organic Carbon and CO2 Flux under Cover Crop and No-Till Management in Soybean Cropping Systems of the Mid-South (USA)

 , , ,
, , ,
Abstract
:1. Introduction
2. Materials and Methods
2.1. The Study Site and Design
2.2. Cover Crop Biomass and Decomposition Rate
2.3. Soil Sampling
2.4. CO2 Flux
2.5. Bacterial and Fungal Abundance
2.6. Environmental Conditions
3. Statistical Analysis
4. Results
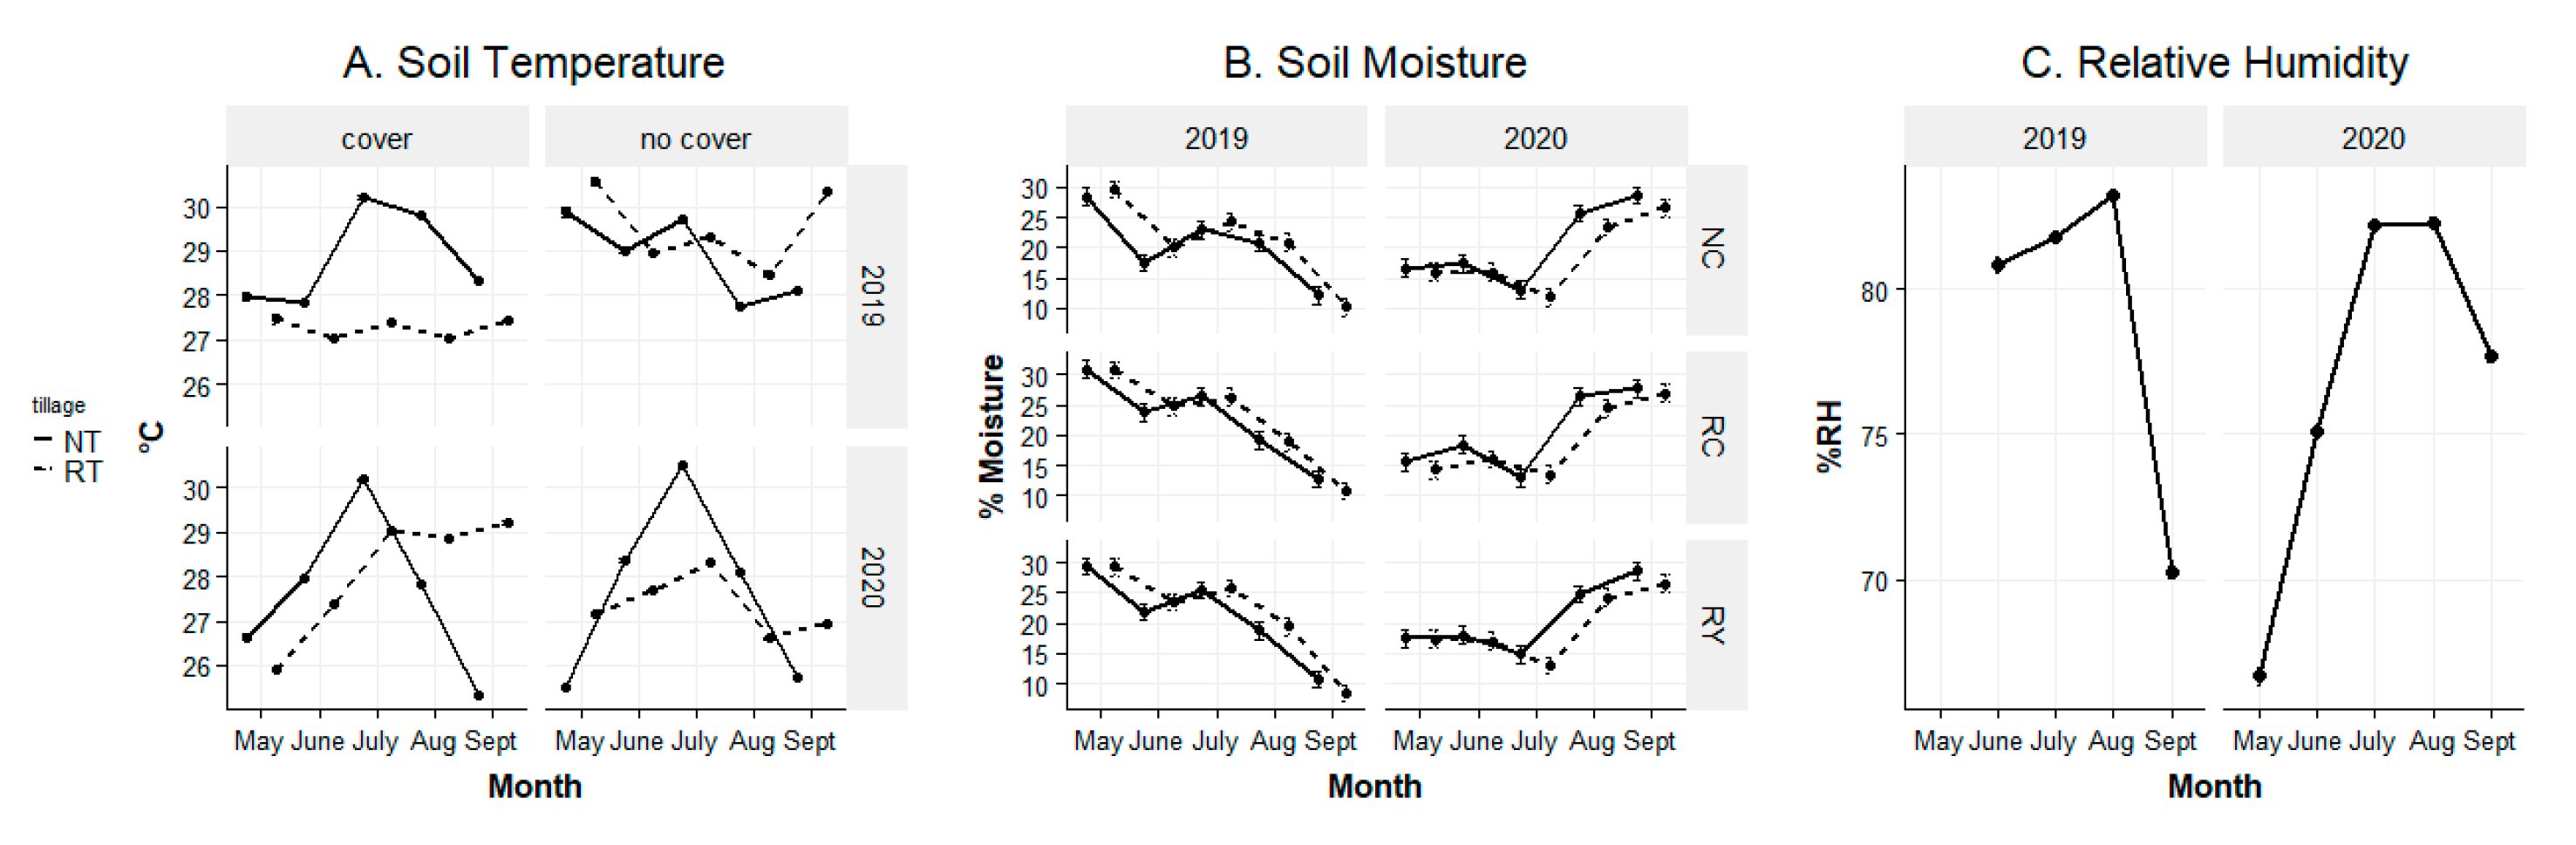
4.1. Environmental Conditions
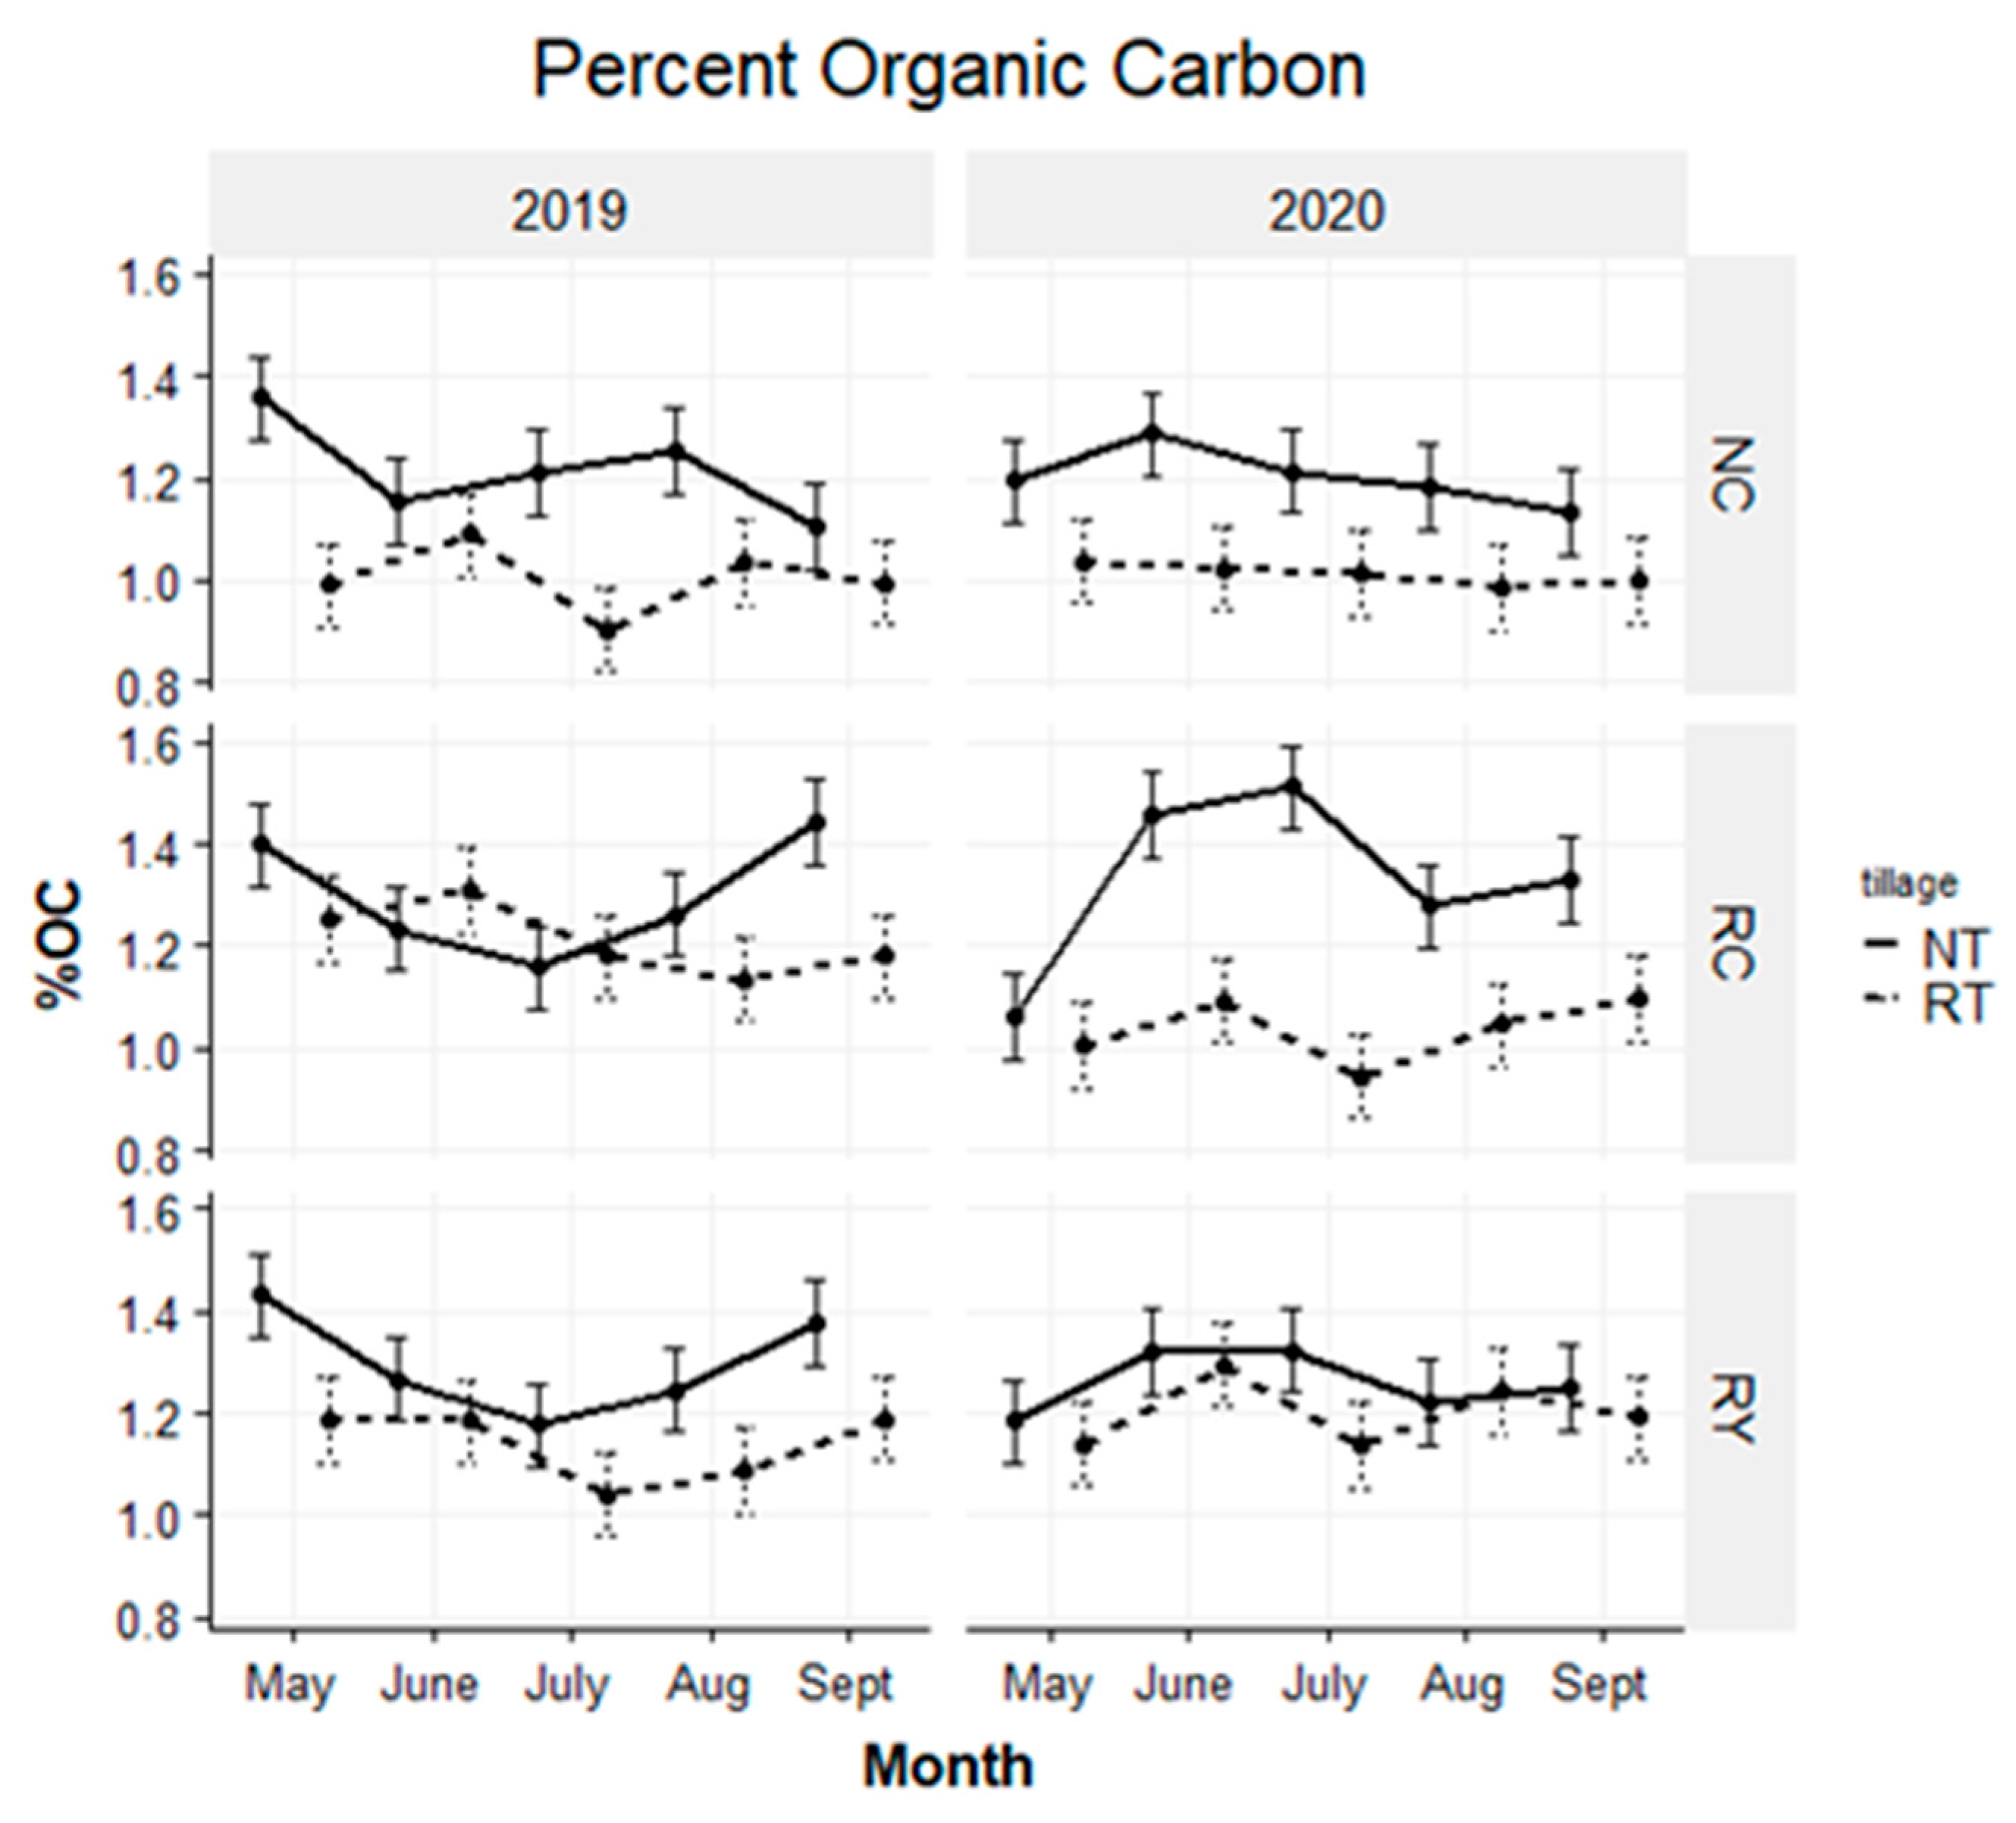
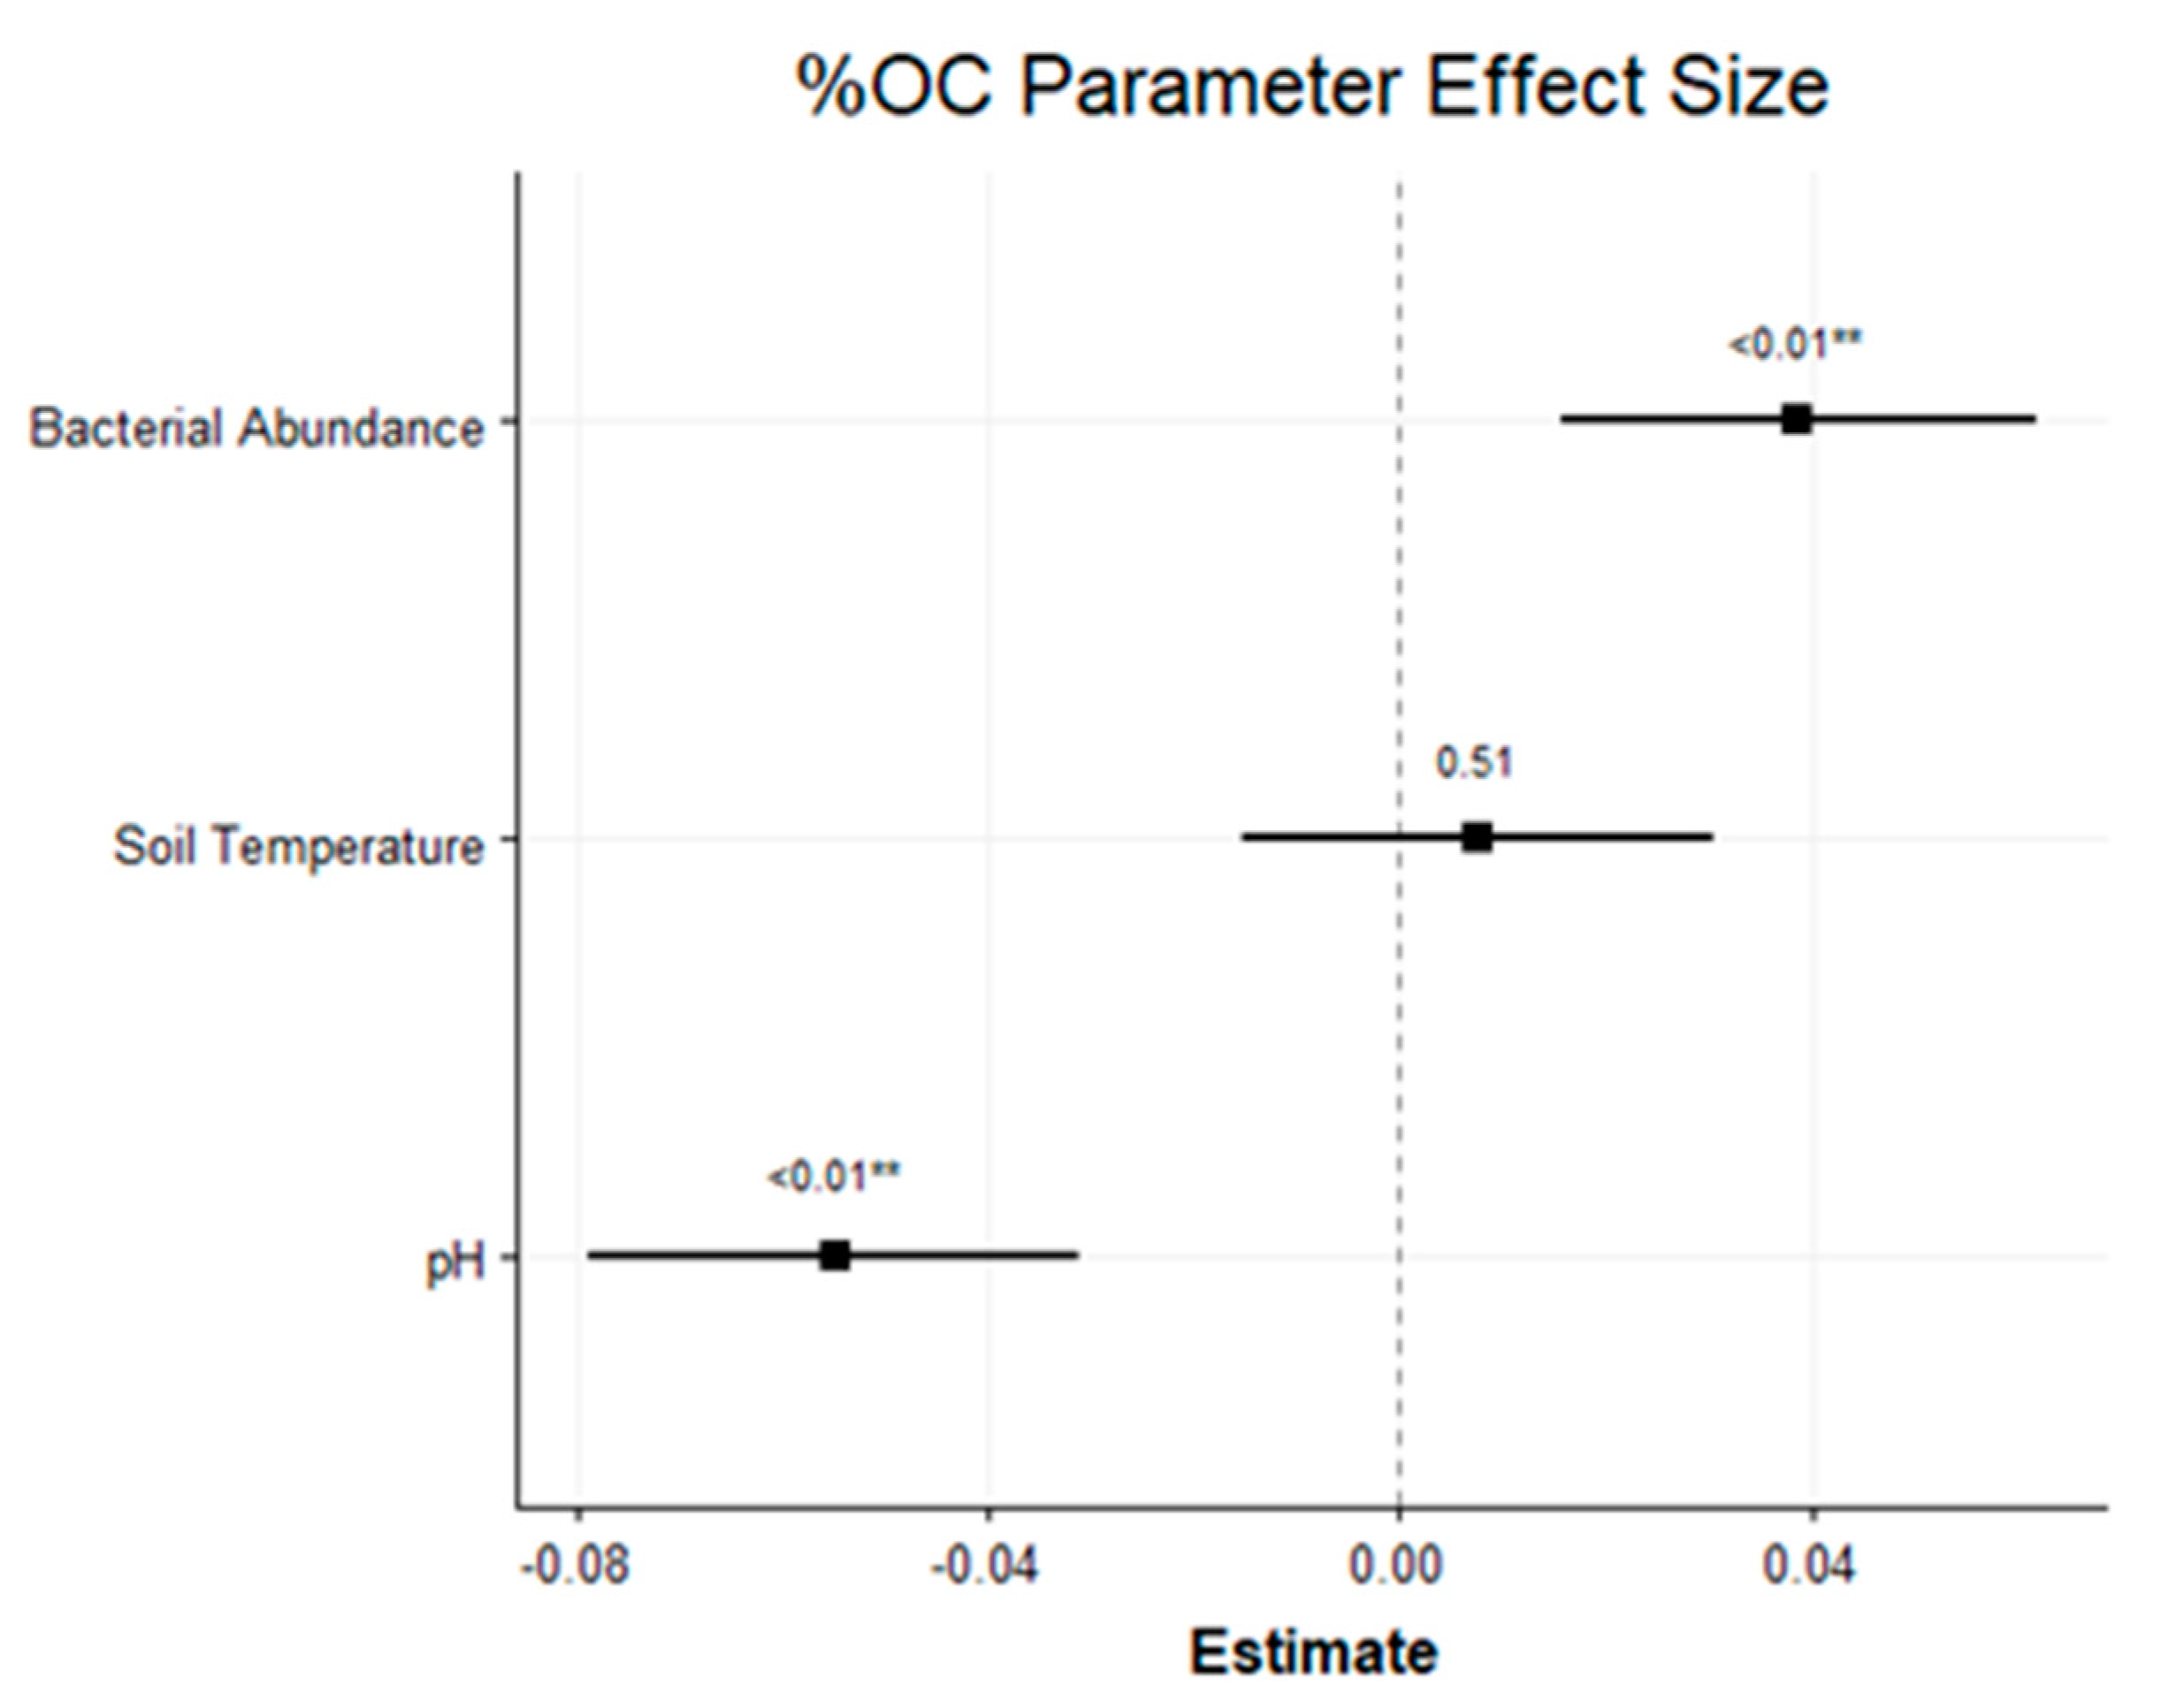
4.2. Soil Organic Carbon
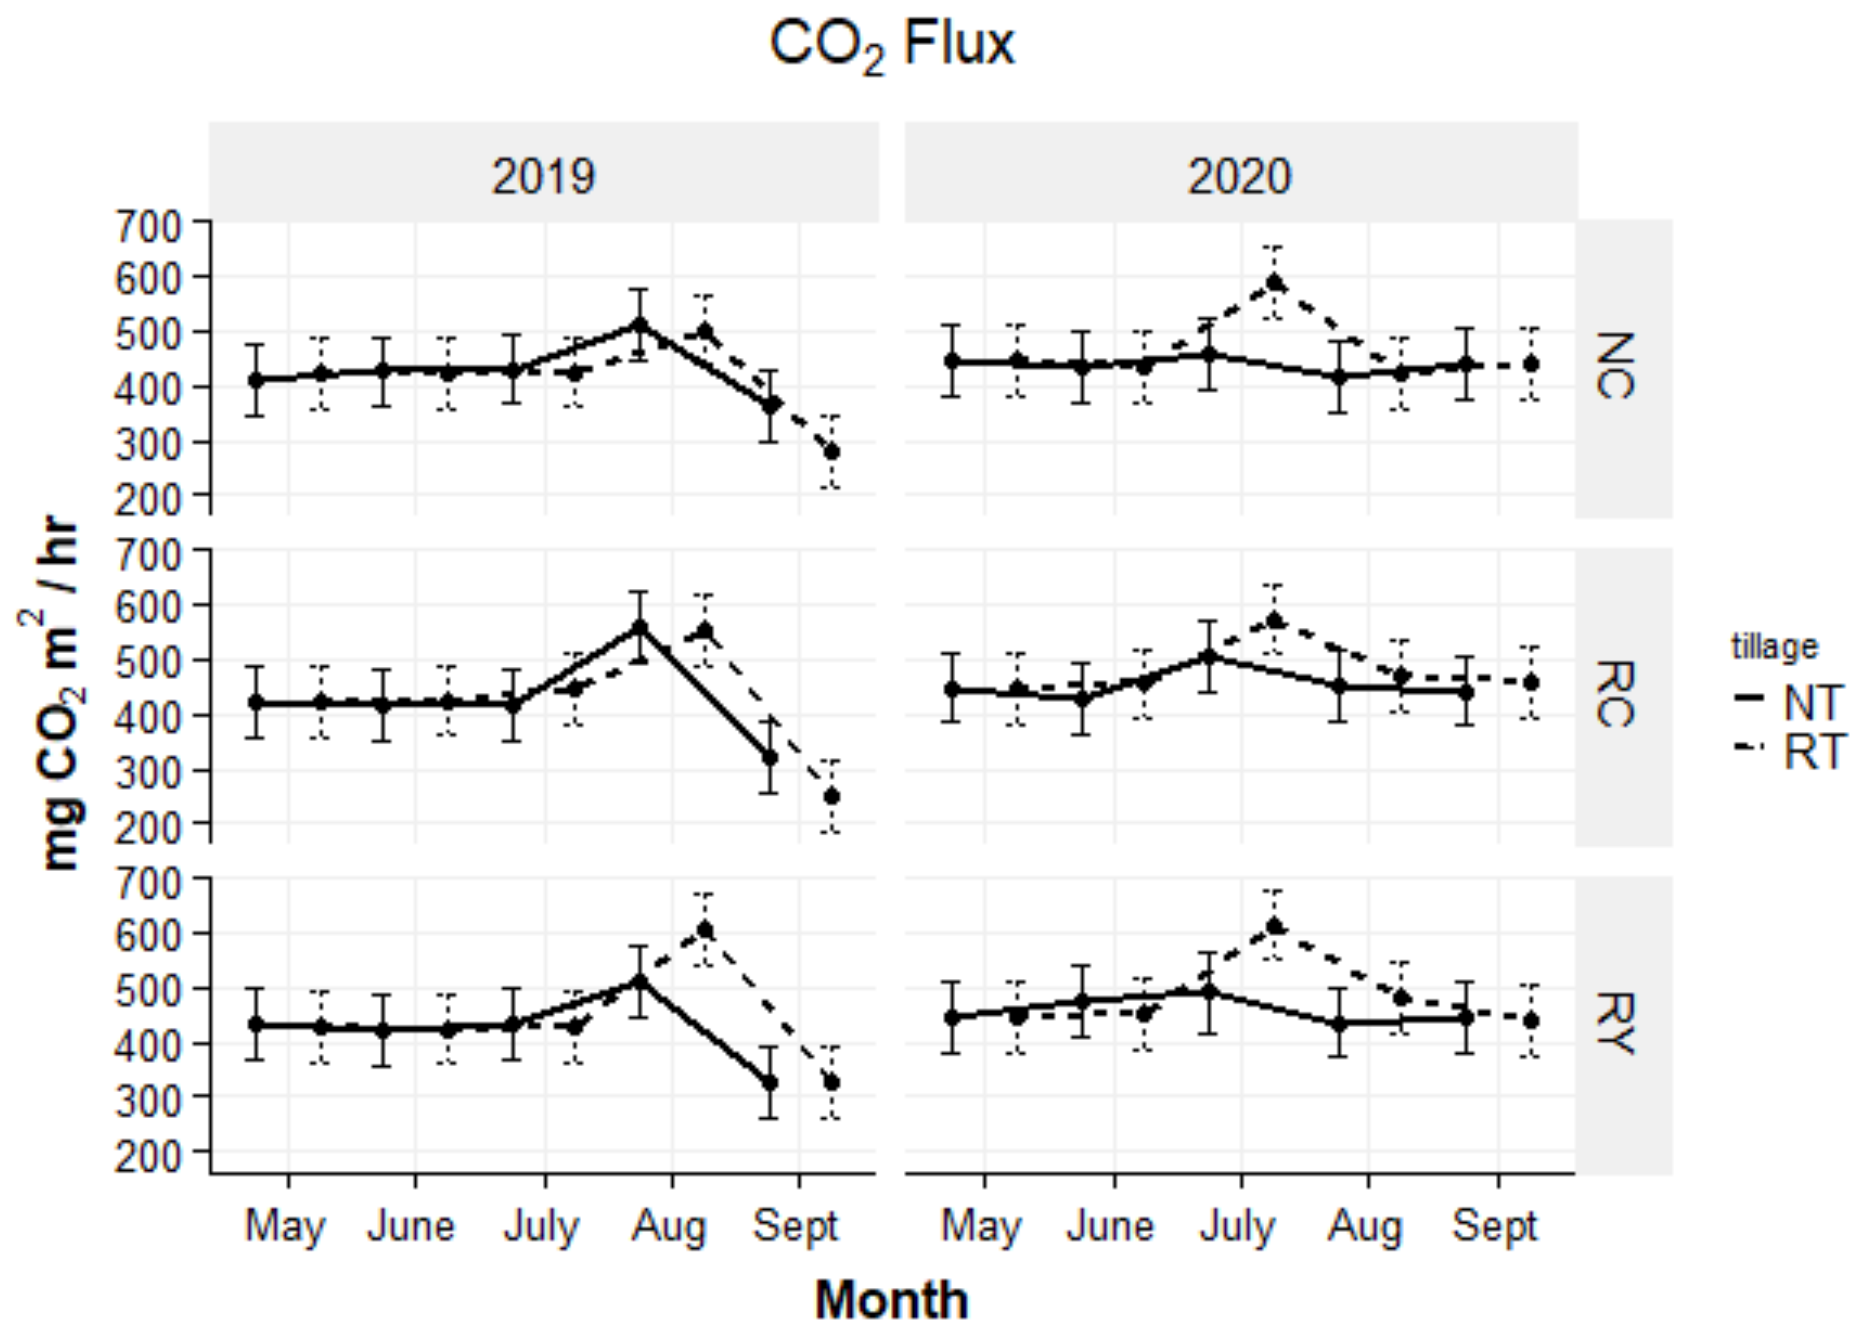
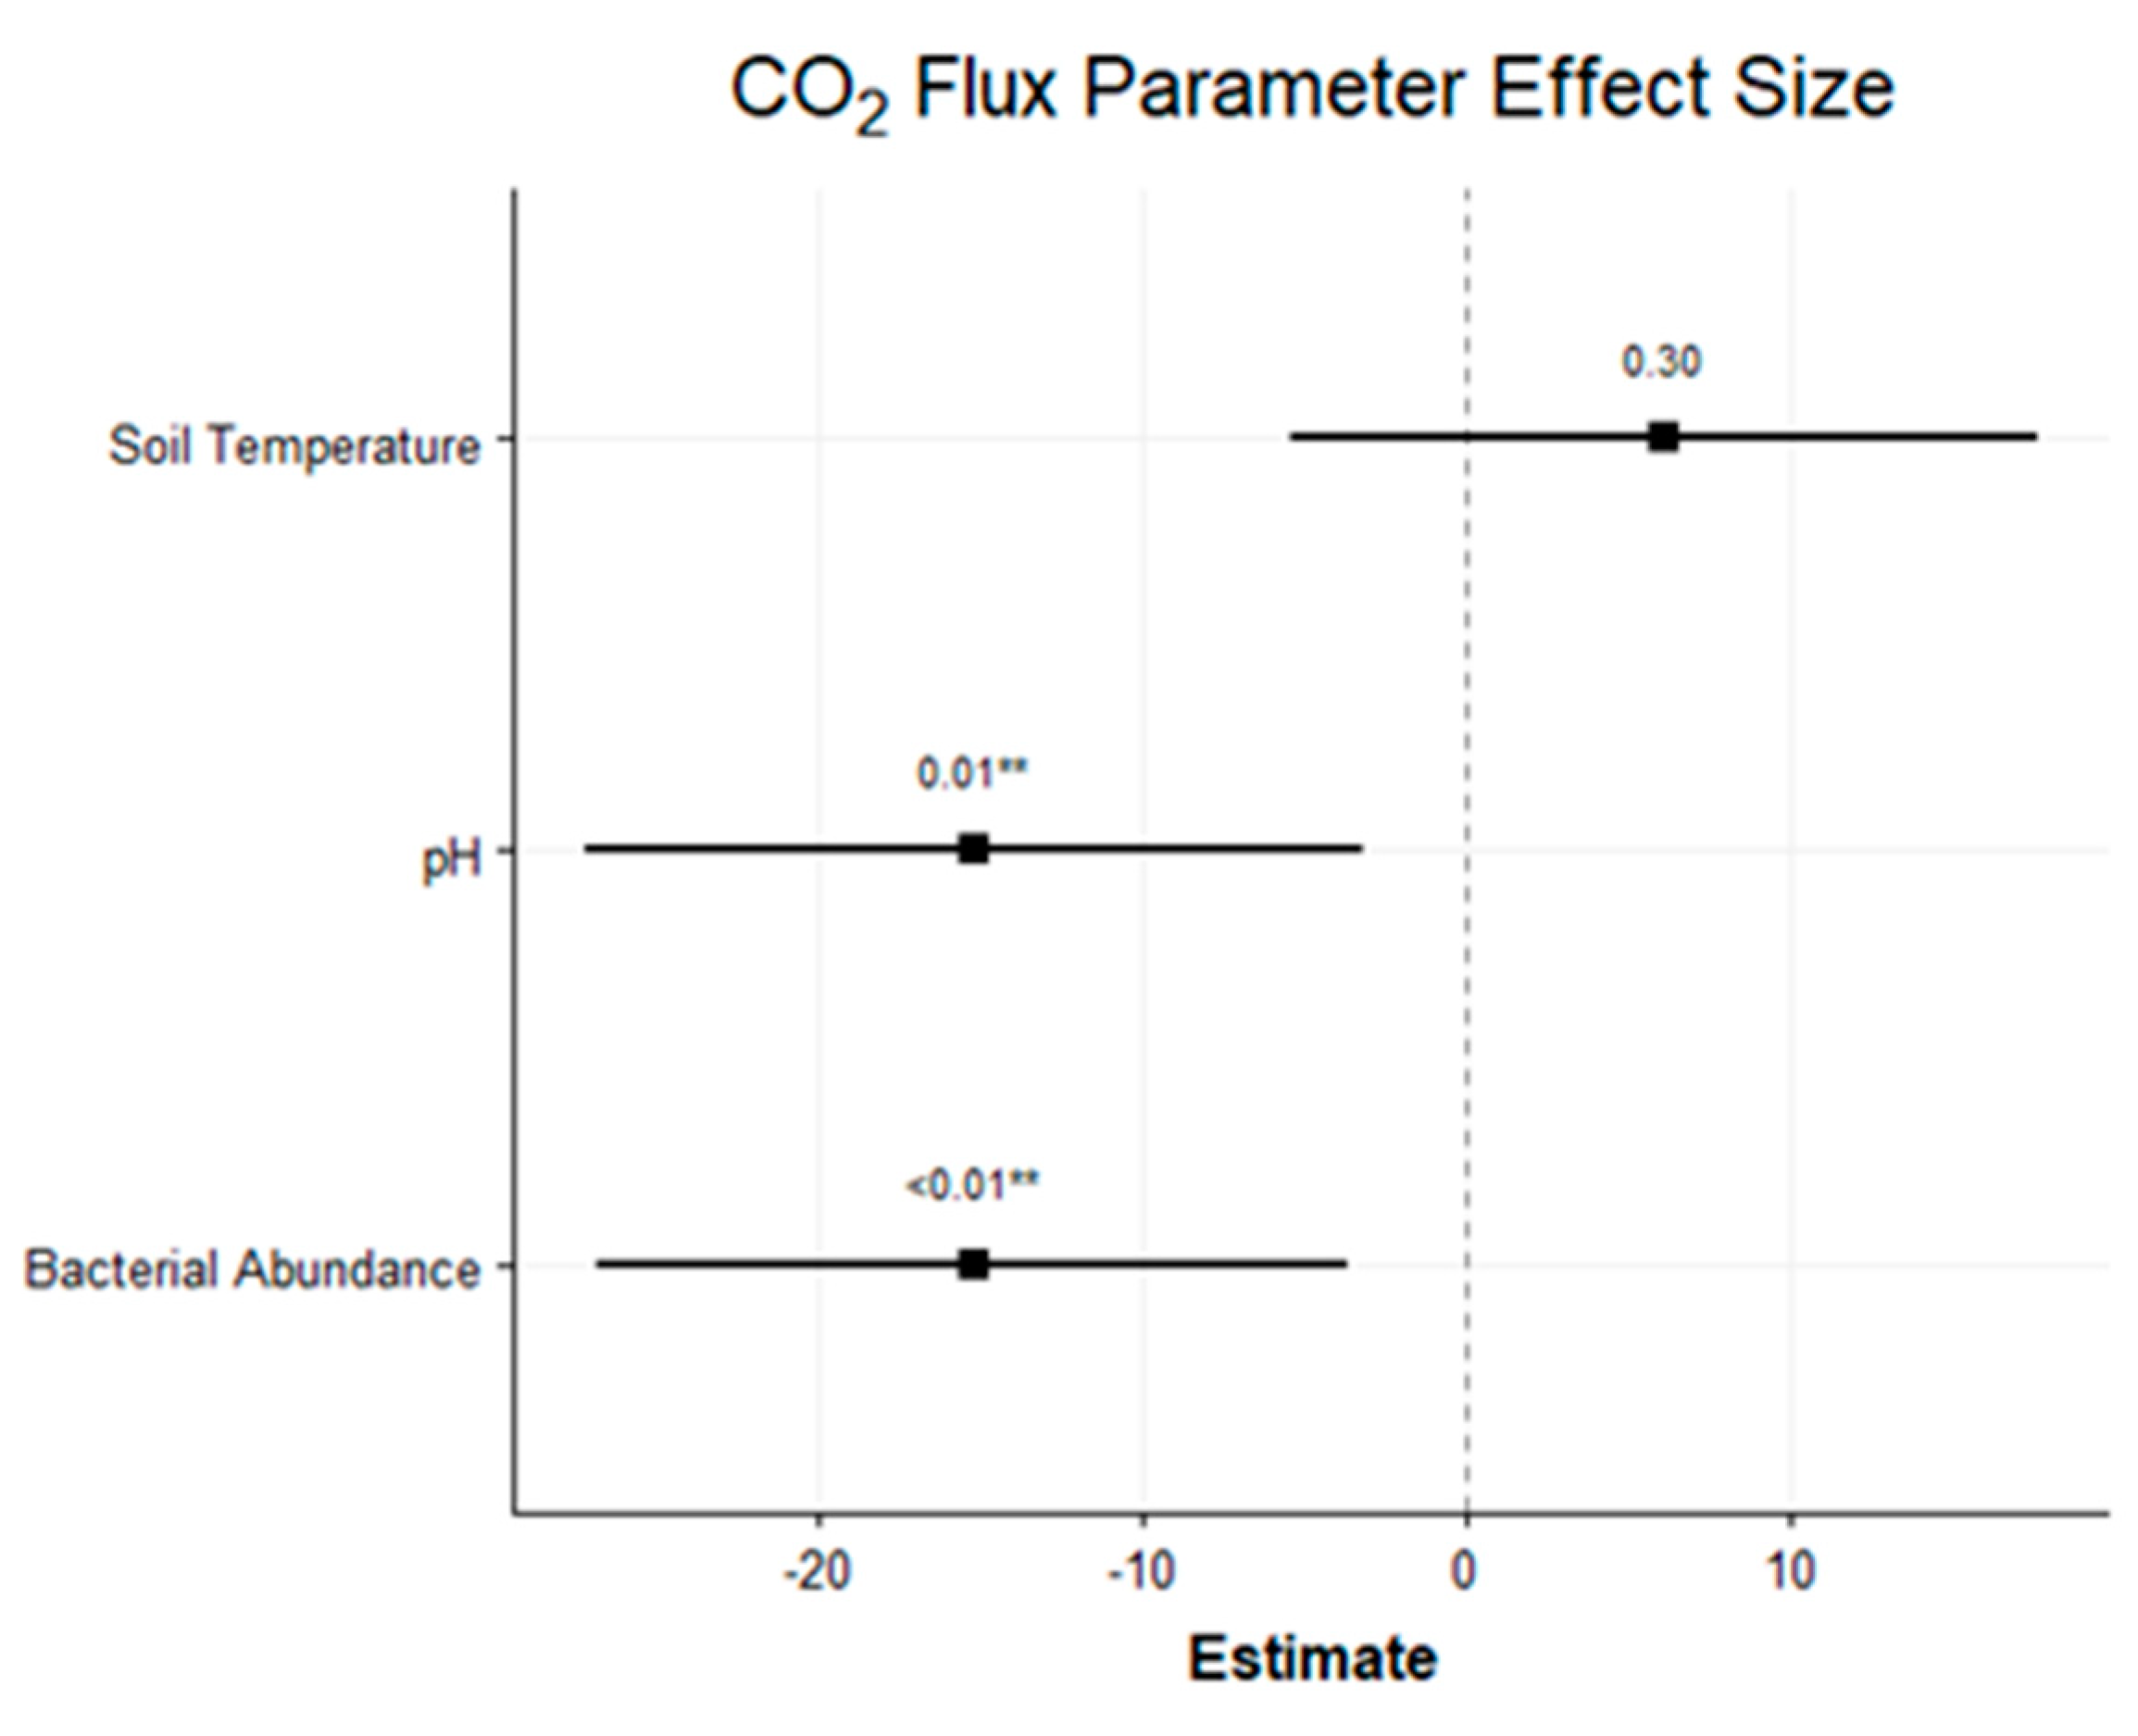
4.3. CO2 Flux
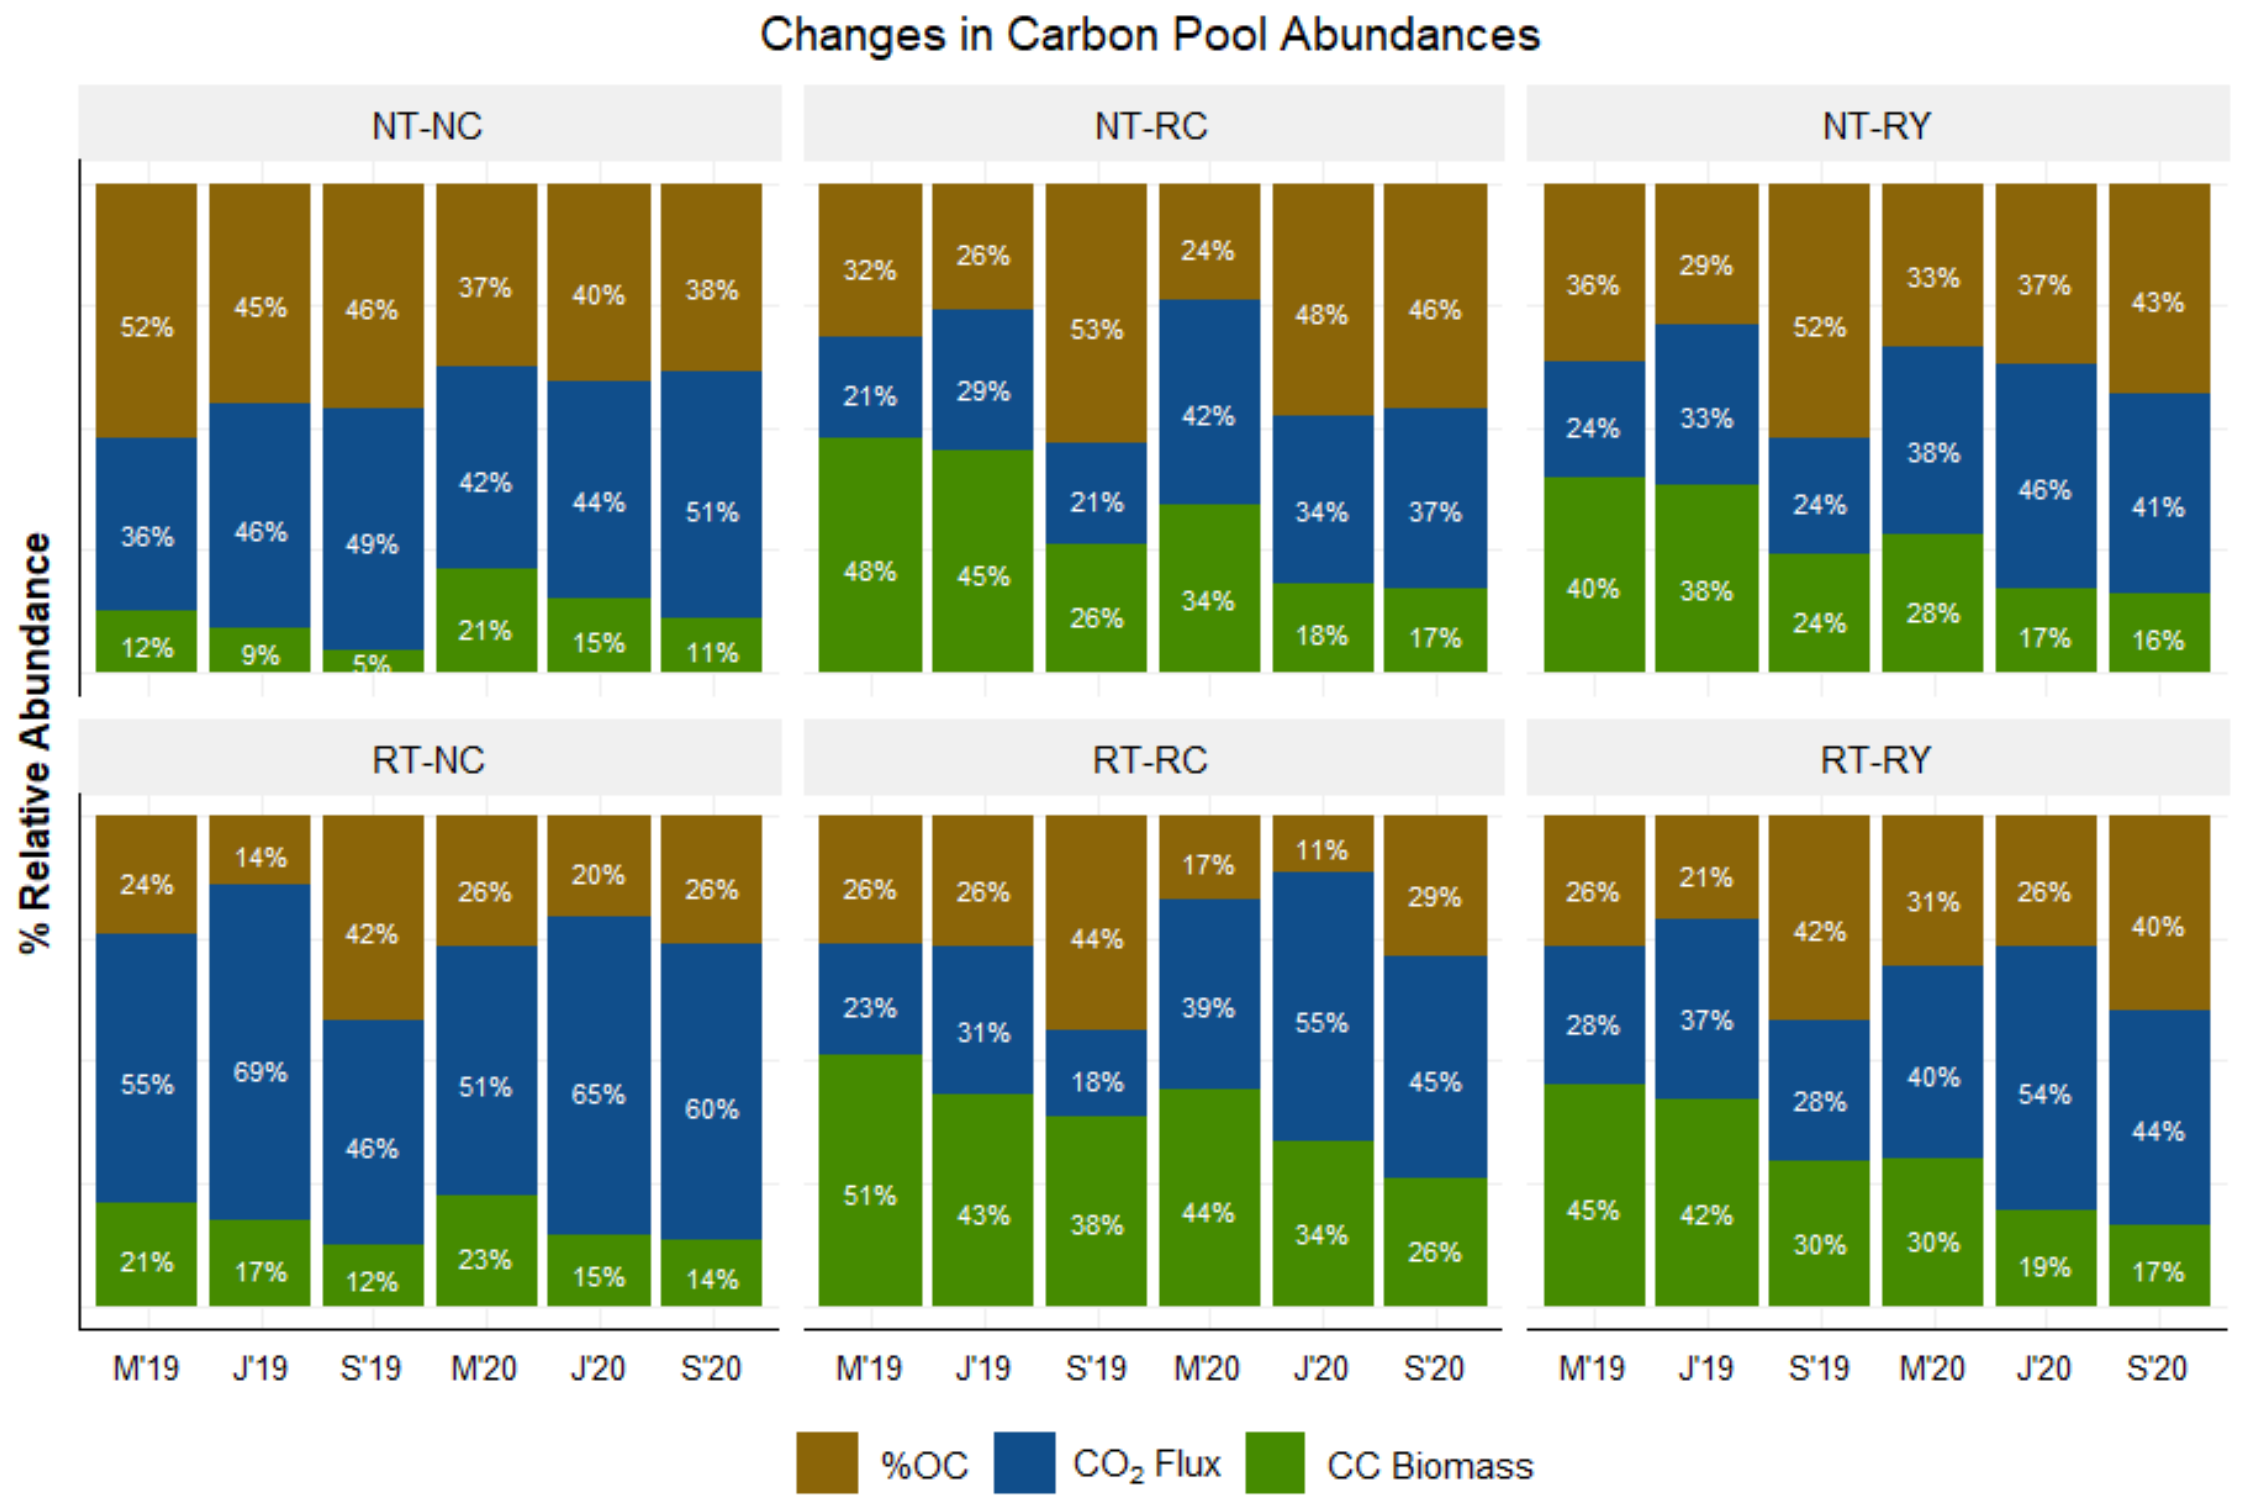
4.4. CC Biomass
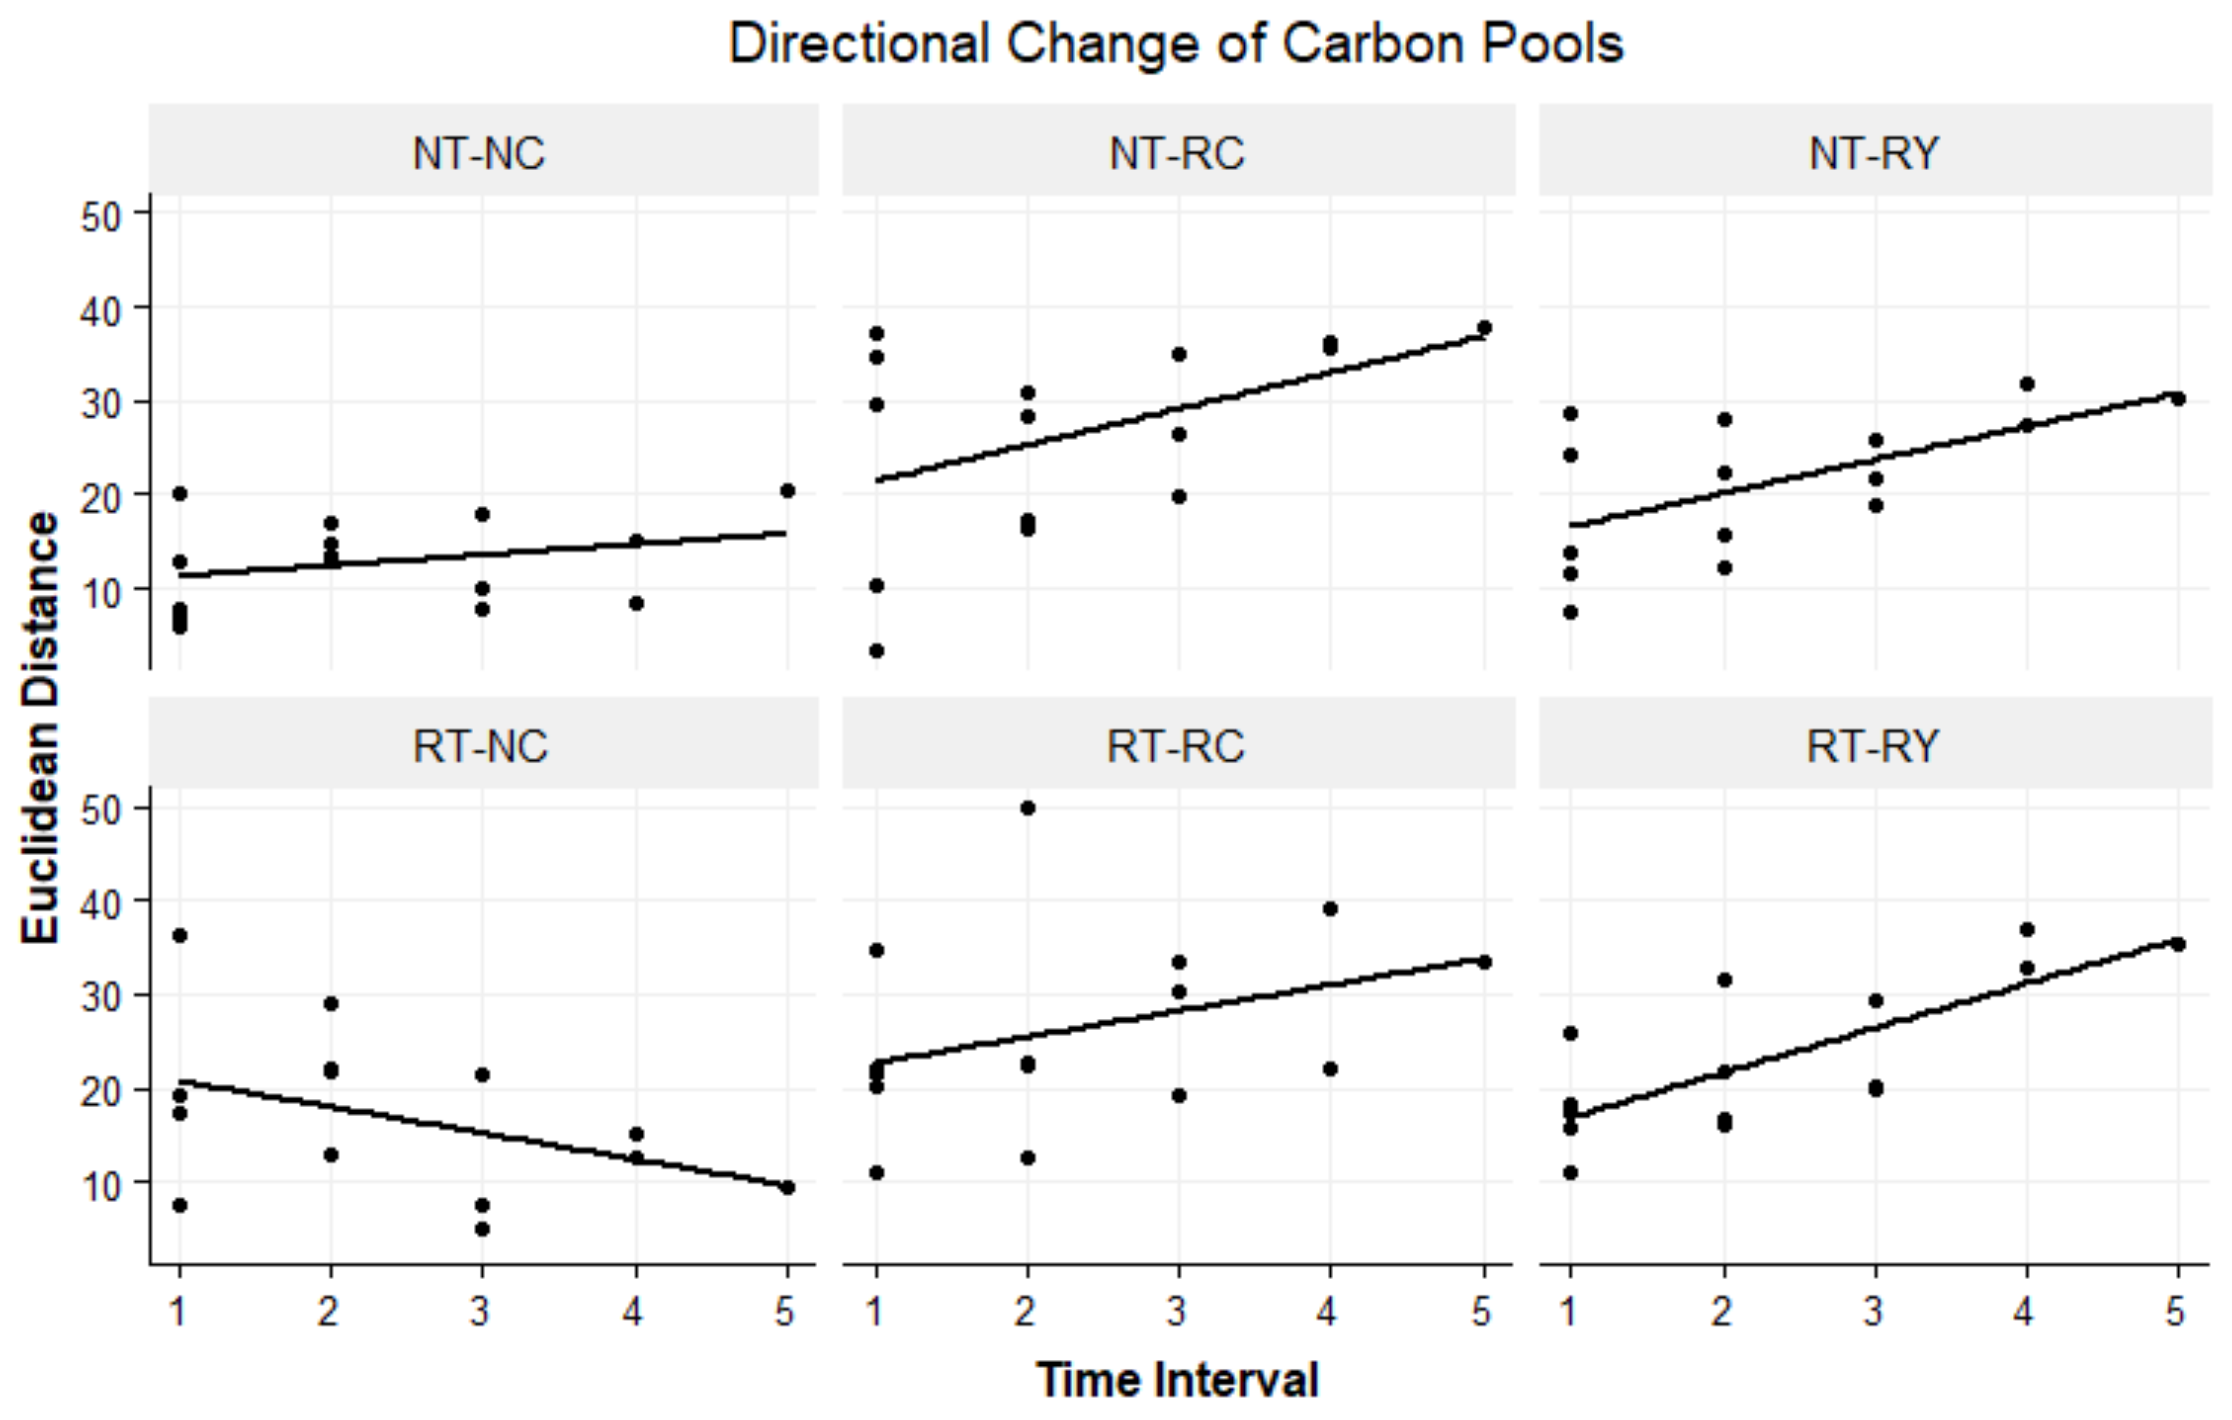
4.5. Directional Change of C Turnover
5. Discussion
5.1. Management Practice Effects on %OC and CO2 Flux
5.2. Directional Change of C Turnover
6. Conclusions
Supplementary Materials
Author Contributions
Funding
Data Availability Statement
Acknowledgments
Conflicts of Interest
References
- Intergovernmental Panel on Climate Change, Climate Change 2013—The Physical Science Basis; Cambridge University Press: Cambridge, UK, 2014; ISBN 9781107415324.
- Lal, R. Soil carbon sequestration impacts on global climate change and food security. Science 2004, 304, 1623–1627. [Google Scholar] [CrossRef] [PubMed]
- Fuss, S.; Lamb, W.F.; Callaghan, M.W.; Hilaire, J.; Creutzig, F.; Amann, T.; Beringer, T.; De Oliveira Garcia, W.; Hartmann, J.; Khanna, T.; et al. Negative emissions—Part 2: Costs, potentials and side effects. Environ. Res. Lett. 2018, 13, 063002. [Google Scholar] [CrossRef]
- Lal, R. Global Potential of Soil Carbon Sequestration to Mitigate the Greenhouse Effect. Crit. Rev. Plant Sci. 2003, 22, 151–184. [Google Scholar] [CrossRef]
- Sauerbeck, D.R. CO2 emissions and C sequestration by agriculture—Perspectives and limitations. Nutr. Cycl. Agroecosyst. 2001, 60, 253–266. [Google Scholar] [CrossRef]
- Amelung, W.; Bossio, D.; de Vries, W.; Kögel-Knabner, I.; Lehmann, J.; Amundson, R.; Bol, R.; Collins, C.; Lal, R.; Leifeld, J.; et al. Towards a global-scale soil climate mitigation strategy. Nat. Commun. 2020, 11, 5427. [Google Scholar] [CrossRef]
- Doetterl, S.; Stevens, A.; Six, J.; Merckx, R.; Van Oost, K.; Casanova Pinto, M.; Casanova-Katny, A.; Muñoz, C.; Boudin, M.; Zagal Venegas, E.; et al. Soil carbon storage controlled by interactions between geochemistry and climate. Nat. Geosci. 2015, 8, 780–783. [Google Scholar] [CrossRef]
- Chantigny, M.H. Dissolved and water-extractable organic matter in soils: A review on the influence of land use and management practices. Geoderma 2003, 113, 357–380. [Google Scholar] [CrossRef]
- Haynes, R.J. Labile Organic Matter Fractions as Central Components of the Quality of Agricultural Soils: An Overview. Adv. Agron. 2005, 85, 221–268. [Google Scholar]
- Gattinger, A.; Muller, A.; Haeni, M.; Skinner, C.; Fliessbach, A.; Buchmann, N.; Mäder, P.; Stolze, M.; Smith, P.; Scialabba, N.E.H.; et al. Enhanced top soil carbon stocks under organic farming. Proc. Natl. Acad. Sci. USA 2012, 109, 18226–18231. [Google Scholar] [CrossRef]
- Venter, Z.S.; Jacobs, K.; Hawkins, H.-J. The impact of crop rotation on soil microbial diversity: A meta-analysis. Pedobiologia 2016, 59, 215–223. [Google Scholar] [CrossRef]
- Acharya, B.S.; Dodla, S.; Gaston, L.A.; Darapuneni, M.; Wang, J.J.; Sepat, S.; Bohara, H. Winter cover crops effect on soil moisture and soybean growth and yield under different tillage systems. Soil Tillage Res. 2019, 195, 104430. [Google Scholar] [CrossRef]
- Dabney, S.M.; Delgado, J.A.; Reeves, D.W. Using winter cover crops to improve soil and water quality. Commun. Soil Sci. Plant Anal. 2001, 32, 1221–1250. [Google Scholar] [CrossRef]
- Feng, Y.; Motta, A.C.; Reeves, D.W.; Burmester, C.H.; van Santen, E.; Osborne, J.A. Soil microbial communities under conventional-till and no-till continuous cotton systems. Soil Biol. Biochem. 2003, 35, 1693–1703. [Google Scholar] [CrossRef]
- Zablotowicz, R.M.; Reddy, K.N.; Weaver, M.A.; Mengistu, A.; Krutz, L.J.; Gordon, R.E.; Bellaloui, N. Cover crops, tillage, and glyphosate effects on chemical and biological properties of a lower Mississippi delta soil and soybean yield. Environ. Res. J. 2010, 4, 227–251. [Google Scholar]
- Chu, M.; Jagadamma, S.; Walker, F.R.; Eash, N.S.; Buschermohle, M.J.; Duncan, L.A. Effect of Multispecies Cover Crop Mixture on Soil Properties and Crop Yield. Agric. Environ. Lett. 2017, 2, 170030. [Google Scholar] [CrossRef]
- Aldridge, C.A.; Baker, B.H.; Omer, A.R. Investigation of short-term effects of winter cover crops on compaction and total soil carbon in a long-term no-till agricultural system. J. Soil Water Conserv. 2019, 74, 77–84. [Google Scholar] [CrossRef]
- Basche, A.D.; Miguez, F.E.; Kaspar, T.C.; Castellano, M.J. Do cover crops increase or decrease nitrous oxide emissions? A meta-analysis. J. Soil Water Conserv. 2014, 69, 471–482. [Google Scholar] [CrossRef]
- Daryanto, S.; Fu, B.; Wang, L.; Jacinthe, P.A.; Zhao, W. Quantitative synthesis on the ecosystem services of cover crops. Earth-Science Rev. 2018, 185, 357–373. [Google Scholar] [CrossRef]
- Muhammad, I.; Sainju, U.M.; Zhao, F.; Khan, A.; Ghimire, R.; Fu, X.; Wang, J. Regulation of soil CO2 and NsO emissions by cover crops: A meta-analysis. Soil Tillage Res. 2019, 192, 103–112. [Google Scholar] [CrossRef]
- Hartley, I.P.; Hill, T.C.; Chadburn, S.E.; Hugelius, G. Temperature effects on carbon storage are controlled by soil stabilisation capacities. Nat. Commun. 2021, 12, 6713. [Google Scholar] [CrossRef]
- Rasmussen, C.; Heckman, K.; Wieder, W.R.; Keiluweit, M.; Lawrence, C.R.; Berhe, A.A.; Blankinship, J.C.; Crow, S.E.; Druhan, J.L.; Hicks Pries, C.E.; et al. Beyond clay: Towards an improved set of variables for predicting soil organic matter content. Biogeochemistry 2018, 137, 297–306. [Google Scholar] [CrossRef]
- Reisser, M.; Purves, R.S.; Schmidt, M.W.I.; Abiven, S. Pyrogenic carbon in soils: A literature-based inventory and a global estimation of its content in soil organic carbon and stocks. Front. Earth Sci. 2016, 4, 80. [Google Scholar] [CrossRef] [Green Version]
- CTIC, SARE, and ASTA (Conservation Technology Information Center, North Central Region Sustainable Agriculture Research and Education Program, and American Seed Trade Associa-tion). 2017. National Cover Crop Survey Annual Report 2016–2017. CTIC, SARE, and AS-TA. Available online: https://www.sare.org/publications/cover-crops/national-cover-crop-surveys/ (accessed on 27 June 2022).
- Anderson, M.J.; Crist, T.O.; Chase, J.M.; Vellend, M.; Inouye, B.D.; Freestone, A.L.; Sanders, N.J.; Cornell, H.V.; Comita, L.S.; Davies, K.F.; et al. Navigating the multiple meanings of β diversity: A roadmap for the practicing ecologist. Ecol. Lett. 2011, 14, 19–28. [Google Scholar] [CrossRef] [PubMed]
- Locke, M.A.; Zablotowicz, R.M.; Steinriede, R.W.; Testa, S.; Reddy, K.N. Conservation Management in Cotton Production: Long-Term Soil Biological, Chemical, and Physical Changes. Soil Sci. Soc. Am. J. 2013, 77, 974. [Google Scholar] [CrossRef]
- Tyler, H.L. Winter cover crops and no till management enhance enzyme activities in soybean field soils. Pedobiologia 2020, 81–82, 150666. [Google Scholar] [CrossRef]
- Tyler, H.L.; Guerrero, G.G.; Méndez, A. Single- versus Double-Species Cover Crop Effects on Soil Health and Yield in Mississippi Soybean Fields. Agronomy 2021, 11, 2334. [Google Scholar] [CrossRef]
- Poffenbarger, H.J.; Mirsky, S.B.; Weil, R.R.; Kramer, M.; Spargo, J.T.; Cavigelli, M.A. Legume proportion, poultry litter, and tillage effects on cover crop decomposition. Agron. J. 2015, 107, 2083–2096. [Google Scholar] [CrossRef]
- Wang, W.; Peng, S.; Wang, T.; Fang, J. Winter soil CO2 efflux and its contribution to annual soil respiration in different ecosystems of a forest-steppe ecotone, north China. Soil Biol. Biochem. 2010, 42, 451–458. [Google Scholar] [CrossRef]
- Yu, S.; Mo, Q.; Chen, Y.; Li, Y.; Li, Y.; Zou, B.; Xia, H.; Jun, W.; Li, Z.; Wang, F. Effects of seasonal precipitation change on soil respiration processes in a seasonally dry tropical forest. Ecol. Evol. 2020, 10, 467–479. [Google Scholar] [CrossRef]
- Petrakis, S.; Barba, J.; Bond-Lamberty, B.; Vargas, R. Using greenhouse gas fluxes to define soil functional types. Plant Soil 2018, 423, 285–294. [Google Scholar] [CrossRef]
- Adeli, A.; Brooks, J.P.; Read, J.J.; Feng, G.; Miles, D.; Shankle, M.W.; Barksdale, N.; Jenkins, J.N. Management Strategies on an Upland Soil for Improving Soil Properties. Commun. Soil Sci. Plant Anal. 2020, 51, 413–429. [Google Scholar] [CrossRef]
- Bräuer, S.L.; Adams, C.; Kranzler, K.; Murphy, D.; Xu, M.; Zuber, P.; Simon, H.M.; Baptista, A.M.; Tebo, B.M. Culturable Rhodobacter and Shewanella species are abundant in estuarine turbidity maxima of the Columbia River. Environ. Microbiol. 2011, 13, 589–603. [Google Scholar] [CrossRef] [PubMed]
- Einen, J.; Thorseth, I.H.; Øvreås, L. Enumeration of Archaea and Bacteria in seafloor basalt using real-time quantitative PCR and fluorescence microscopy. FEMS Microbiol. Lett. 2008, 282, 182–187. [Google Scholar] [CrossRef] [PubMed]
- Hunter, N.; Nadkarni, M.A.; Jacques, N.A.; Martin, F.E. Determination of bacterial load by real-time PCR using a broad-range (universal) probe and primers set. Microbiology 2002, 148, 257–266. [Google Scholar]
- Liu, C.M.; Kachur, S.; Dwan, M.G.; Abraham, A.G.; Aziz, M.; Hsueh, P.R.; Huang, Y.T.; Busch, J.D.; Lamit, L.J.; Gehring, C.A.; et al. FungiQuant: A broad-coverage fungal quantitative real-time PCR assay. BMC Microbiol. 2012, 12, 255. [Google Scholar] [CrossRef]
- Blanco-Canqui, H.; Shaver, T.M.; Lindquist, J.L.; Shapiro, C.A.; Elmore, R.W.; Francis, C.A.; Hergert, G.W. Cover Crops and Ecosystem Services: Insights from Studies in Temperate Soils. Agron. J. 2015, 107, 2449–2474. [Google Scholar] [CrossRef]
- R Core Team. R: A Language and Environment for Statistical Computing; R Foundation for Statistical Computing: Vienna, Austria, 2017. [Google Scholar]
- Chen, S.; Huang, Y.; Zou, J.; Shi, Y. Mean residence time of global topsoil organic carbon depends on temperature, precipitation and soil nitrogen. Glob. Planet. Chang. 2013, 100, 99–108. [Google Scholar] [CrossRef]
- Cotrufo, M.F.; Wallenstein, M.D.; Boot, C.M.; Denef, K.; Paul, E. The Microbial Efficiency-Matrix Stabilization (MEMS) framework integrates plant litter decomposition with soil organic matter stabilization: Do labile plant inputs form stable soil organic matter? Glob. Chang. Biol. 2013, 19, 988–995. [Google Scholar] [CrossRef]
- Kuhn, M. Building Predictive Models in R Using the caret Package. J. Stat. Softw. 2008, 28, 1–26. [Google Scholar] [CrossRef]
- Hallett, L.M.; Jones, S.K.; MacDonald, A.A.M.; Jones, M.B.; Flynn, D.F.B.; Ripplinger, J.; Slaughter, P.; Gries, C.; Collins, S.L. codyn: An r package of community dynamics metrics. Methods Ecol. Evol. 2016, 7, 1146–1151. [Google Scholar] [CrossRef]
- Oksanen, J.F.; Blanchet, G.; Friendly, M.; Kindt, R.; Legendre, P.; McGlinn, D.; Minchin, P.R.; O’Hara, R.B.; Simpson, G.L.; Solymos, P.; et al. Vegan: Community Ecology Package. R package version 2.6-2. Available online: https://CRAN.R-project.org/package=vegan (accessed on 12 June 2021).
- Firth, A.G. Evaluating soil health changes following cover crop and no-till integration into a soybean (Glycine max) cropping system in the Mississippi Alluvial Valley. Ph.D. Thesis, Mississippi State University, Stackwell, MS, USA, 2022. [Google Scholar]
- Sanchez, I.; Fultz, L.M.; Lofton, J.; Haggard, B.; Sanchez, I.; Fultz, L.M.; Lofton, J.; Haggard, B. Cover Crops Impacts on Louisiana Corn Production and Soil Properties. Agrosystems Geosci. Environ. 2019, 2, 1–8. [Google Scholar] [CrossRef]
- Lal, R. Soil health and carbon management. Food Energy Secur. 2016, 5, 212–222. [Google Scholar] [CrossRef]
- Andersson, S.; Nilsson, S.I. Influence of pH and temperature on microbial activity, substrate availability of soil-solution bacteria and leaching of dissolved organic carbon in a mor humus. Soil Biol. Biochem. 2001, 33, 1181–1191. [Google Scholar] [CrossRef]
- Kallenbach, C.M.; Grandy, A.S.; Frey, S.D.; Diefendorf, A.F. Microbial physiology and necromass regulate agricultural soil carbon accumulation. Soil Biol. Biochem. 2015, 91, 279–290. [Google Scholar] [CrossRef]
- Miltner, A.; Bombach, P.; Schmidt-Brücken, B.; Kästner, M. SOM genesis: Microbial biomass as a significant source. Biogeochemistry 2012, 111, 41–55. [Google Scholar] [CrossRef]
- Homann, P.S.; Kapchinske, J.S.; Boyce, A. Relations of mineral-soil C and N to climate and texture: Regional differences within the conterminous USA. Biogeochemistry 2007, 85, 303–316. [Google Scholar] [CrossRef]
- Romdhane, S.; Spor, A.; Busset, H.; Falchetto, L.; Martin, J.; Bizouard, F.; Bru, D.; Breuil, M.C.; Philippot, L.; Cordeau, S. Cover crop management practices rather than composition of cover crop mixtures affect bacterial communities in no-till agroecosystems. Front. Microbiol. 2019, 10, 1618. [Google Scholar] [CrossRef]
- Thapa, R.; Tully, K.L.; Reberg-Horton, C.; Cabrera, M.; Davis, B.W.; Fleisher, D.; Gaskin, J.; Hitchcock, R.; Poncet, A.; Schomberg, H.H.; et al. Cover crop residue decomposition in no-till cropping systems: Insights from multi-state on-farm litter bag studies. Agric. Ecosyst. Environ. 2022, 326, 107823. [Google Scholar] [CrossRef]
- García-Palacios, P.; Crowther, T.W.; Dacal, M.; Hartley, I.P.; Reinsch, S.; Rinnan, R.; Rousk, J.; van den Hoogen, J.; Ye, J.S.; Bradford, M.A. Evidence for large microbial-mediated losses of soil carbon under anthropogenic warming. Nat. Rev. Earth Environ. 2021, 2, 507–517. [Google Scholar] [CrossRef]
- Carvalhais, N.; Forkel, M.; Khomik, M.; Bellarby, J.; Jung, M.; Migliavacca, M.; Mu, M.; Saatchi, S.; Santoro, M.; Thurner, M.; et al. Global covariation of carbon turnover times with climate in terrestrial ecosystems. Nature 2014, 514, 213–217. [Google Scholar] [CrossRef] [PubMed]
- Solly, E.F.; Weber, V.; Zimmermann, S.; Walthert, L.; Hagedorn, F.; Schmidt, M.W.I. A Critical Evaluation of the Relationship Between the Effective Cation Exchange Capacity and Soil Organic Carbon Content in Swiss Forest Soils. Front. For. Glob. Chang. 2020, 3, 98. [Google Scholar] [CrossRef]
- Hama, J.R.; Kolpin, D.W.; Lefevre, G.H.; Hubbard, L.E.; Powers, M.M.; Strobel, B.W. Exposure and Transport of Alkaloids and Phytoestrogens from Soybeans to Agricultural Soils and Streams in the Midwestern United States. Environ. Sci. Technol. 2021, 55, 11029–11039. [Google Scholar] [CrossRef] [PubMed]
- Farrar, D.M.; Coleman, J.D. The correlation of surface area with other properties of ninteen british clay soils. J. Soil Sci. 1967, 18, 118–124. [Google Scholar] [CrossRef]


| Tillage | Cover | Mean | 2.5% CI | 97.5% CI | Sig Difference |
|---|---|---|---|---|---|
| NT | NC | 1.21 | 1.11 | 1.31 | A |
| RC | 1.31 | 1.21 | 1.41 | A | |
| RY | 1.28 | 1.18 | 1.38 | A | |
| RT | NC | 1.01 | 0.91 | 1.11 | B |
| RC | 1.12 | 1.02 | 1.22 | A | |
| RY | 1.17 | 1.07 | 1.27 | A |
| Tillage | Cover | b |
|---|---|---|
| NT | NC | 0.0229 |
| RC | 0.23 | |
| RY | 0.169 | |
| RT | NC | −0.16 |
| RC | 0.213 | |
| RY | 0.165 |
| Tillage | Cover | Mean | 2.5% CI | 97.5% CI | Sig Difference |
|---|---|---|---|---|---|
| NT | NC | 0.98 | 0.64 | 1.32 | ABab |
| RC | 1.29 | 0.95 | 1.63 | Bb | |
| RY | 1.14 | 0.80 | 1.48 | ABb | |
| RT | NC | 0.48 | 0.14 | 0.82 | aC |
| RC | 0.78 | 0.44 | 1.12 | AaC | |
| RY | 0.87 | 0.53 | 1.21 | AB |
Publisher’s Note: MDPI stays neutral with regard to jurisdictional claims in published maps and institutional affiliations. |
© 2022 by the authors. Licensee MDPI, Basel, Switzerland. This article is an open access article distributed under the terms and conditions of the Creative Commons Attribution (CC BY) license (https://creativecommons.org/licenses/by/4.0/).
Share and Cite
Firth, A.G.; Brooks, J.P.; Locke, M.A.; Morin, D.J.; Brown, A.; Baker, B.H. Dynamics of Soil Organic Carbon and CO2 Flux under Cover Crop and No-Till Management in Soybean Cropping Systems of the Mid-South (USA). Environments 2022, 9, 109. https://doi.org/10.3390/environments9090109
Firth AG, Brooks JP, Locke MA, Morin DJ, Brown A, Baker BH. Dynamics of Soil Organic Carbon and CO2 Flux under Cover Crop and No-Till Management in Soybean Cropping Systems of the Mid-South (USA). Environments. 2022; 9(9):109. https://doi.org/10.3390/environments9090109
Chicago/Turabian StyleFirth, Alexandra G., John P. Brooks, Martin A. Locke, Dana J. Morin, Ashli Brown, and Beth H. Baker. 2022. "Dynamics of Soil Organic Carbon and CO2 Flux under Cover Crop and No-Till Management in Soybean Cropping Systems of the Mid-South (USA)" Environments 9, no. 9: 109. https://doi.org/10.3390/environments9090109